Why Do People Continue Using Facebook: An Empirical Study ...
91
The University of Southern Mississippi The University of Southern Mississippi The Aquila Digital Community The Aquila Digital Community Dissertations Spring 5-2016 Why Do People Continue Using Facebook: An Empirical Study Why Do People Continue Using Facebook: An Empirical Study From the Perspectives of Technology Adoption and Social From the Perspectives of Technology Adoption and Social Contract Contract Chen-Wei Chang University of Southern Mississippi Follow this and additional works at: https://aquila.usm.edu/dissertations Part of the Communication Technology and New Media Commons, and the Social Media Commons Recommended Citation Recommended Citation Chang, Chen-Wei, "Why Do People Continue Using Facebook: An Empirical Study From the Perspectives of Technology Adoption and Social Contract" (2016). Dissertations. 332. https://aquila.usm.edu/dissertations/332 This Dissertation is brought to you for free and open access by The Aquila Digital Community. It has been accepted for inclusion in Dissertations by an authorized administrator of The Aquila Digital Community. For more information, please contact [email protected].
Transcript of Why Do People Continue Using Facebook: An Empirical Study ...

The University of Southern Mississippi The University of Southern Mississippi
The Aquila Digital Community The Aquila Digital Community
Dissertations
Spring 5-2016
Why Do People Continue Using Facebook: An Empirical Study Why Do People Continue Using Facebook: An Empirical Study
From the Perspectives of Technology Adoption and Social From the Perspectives of Technology Adoption and Social
Contract Contract
Chen-Wei Chang University of Southern Mississippi
Follow this and additional works at: https://aquila.usm.edu/dissertations
Part of the Communication Technology and New Media Commons, and the Social Media Commons
Recommended Citation Recommended Citation Chang, Chen-Wei, "Why Do People Continue Using Facebook: An Empirical Study From the Perspectives of Technology Adoption and Social Contract" (2016). Dissertations. 332. https://aquila.usm.edu/dissertations/332
This Dissertation is brought to you for free and open access by The Aquila Digital Community. It has been accepted for inclusion in Dissertations by an authorized administrator of The Aquila Digital Community. For more information, please contact [email protected].

The University of Southern Mississippi
WHY DO PEOPLE CONTINUE USING FACEBOOK: AN EMPIRICAL STUDY
FROM THE PERSPECTIVES OF TECHNOLOGY ADOPTION
AND SOCIAL CONTRACT
by
Chen-Wei Chang
Abstract of a Dissertation
Submitted to the Graduate School
of The University of Southern Mississippi
in Partial Fulfillment of the Requirements
for the Degree of Doctor of Philosophy
May 2016

ii
ABSTRACT
WHY DO PEOPLE CONTINUE USING FACEBOOK: AN EMPIRICAL STUDY
FROM THE PERSPECTIVES OF TECHNOLOGY ADOPTION
AND SOCIAL CONTRACT
by Chen-Wei Chang
May 2016
Online stalking, identity theft, and other privacy-related issues have become the
major reasons that impede users from continuously using their Facebook accounts. To
better understand how privacy risks, among other factors, have come into play, in terms
of affecting users’ intention to continue using social networking sites, the present study
applies three theories (i.e., the unified theory of acceptance and use of technology 2,
social contract theory, and technology continuance theory) to develop a new model for
Facebook use continuance. An online survey (N = 450) was performed by administrating
a random sampling method in January and February of 2014. Data analysis employing
structural equation modeling (SEM) shows that the examined predictors (i.e.,
performance expectancy, facilitating conditions, hedonic motivation, trust, perceived
risks, attitude, and satisfaction) are accountable for the intention to continue using
Facebook, with the entire model explaining 65% of the variance. Theoretical
ramifications for future research and practical implications for social media companies
and marketers are also discussed.

COPYRIGHT BY
CHEN-WEI CHANG
2016

WHY DO PEOPLE CONTINUE USING FACEBOOK: AN EMPIRICAL STUDY
FROM THE PERSPECTIVES OF TECHNOLOGY ADOPTION
AND SOCIAL CONTRACT
by
Chen-Wei Chang
A Dissertation
Submitted to the Graduate School
and the Department of Mass Communication and Journalism
at The University of Southern Mississippi
in Partial Fulfillment of the Requirements
for the Degree of Doctor of Philosophy
Approved:
________________________________________________
Dr. Fei Xue, Committee Chair
Associate Professor, Mass Communications and Journalism
________________________________________________
Dr. Christopher P. Campbell, Committee Member
Professor, Mass Communication and Journalism
________________________________________________
Dr. Jae-Hwa Shin, Committee Member
Professor, Mass Communication and Journalism
________________________________________________
Dr. Mary Lou Sheffer, Committee Member
Associate Professor, Mass Communication and Journalism
________________________________________________
Dr. David R. Davies, Committee Member
Professor, Mass Communication and Journalism
________________________________________________
Dr. Karen S. Coats
Dean of the Graduate School
May 2016

iii
ACKNOWLEDGMENTS
Writing and completing a dissertation are never an easy task. Thanks to my
committee members and professors, I was able to overcome the difficulties I encountered
during the process of writing, data analyses, and chapter organizations.
First and foremost I would like to thank Dr. Fei Xue, serving as my dissertation
chair and research mentor during my study at the University of Southern Mississippi. Dr.
Xue was always available and willing to answer my questions whenever I encountered
challenges or needed suggestions for my research. I would also like to give special thanks
to Dr. Christopher Campbell who was always very supportive of my dissertation. Each
time I had a conversation with Dr. Campbell, he asked if I needed additional technology
or software for the data analyses. Thanks Dr. Mary Lou Sheffer for providing suggestions
and critiques for my survey and research design. Without Dr. Sheffer’s help, I would not
have been able to recognize the misplacement of “attitude” and “satisfaction” in my
prospectus. I appreciate Dr. Jae-Hua Shin and Dr. David R. Davies, both of them agreed
to join my committee without any hesitation during the time I almost finished the data
analyses. Reforming dissertation committee can be challenging, but Dr. Shin and Dr.
Davies were both very understandable and supportive to my dissertation topic.
Last but not the least, I would like to appreciate Dr. Jun Heo and Dr. Gina
Massulo Chen, both of them served as the committee members for my prospectus before
leaving our school. Dr. Jun Heo taught me how to use IBM SPSS Amos as well as apply
structural equation modeling to my research. Dr. Gina Massulo Chen helped me solve
some of the writing issues in my prospectus. Without their kind assistance, I would not
have been able to put this dissertation together.
iv
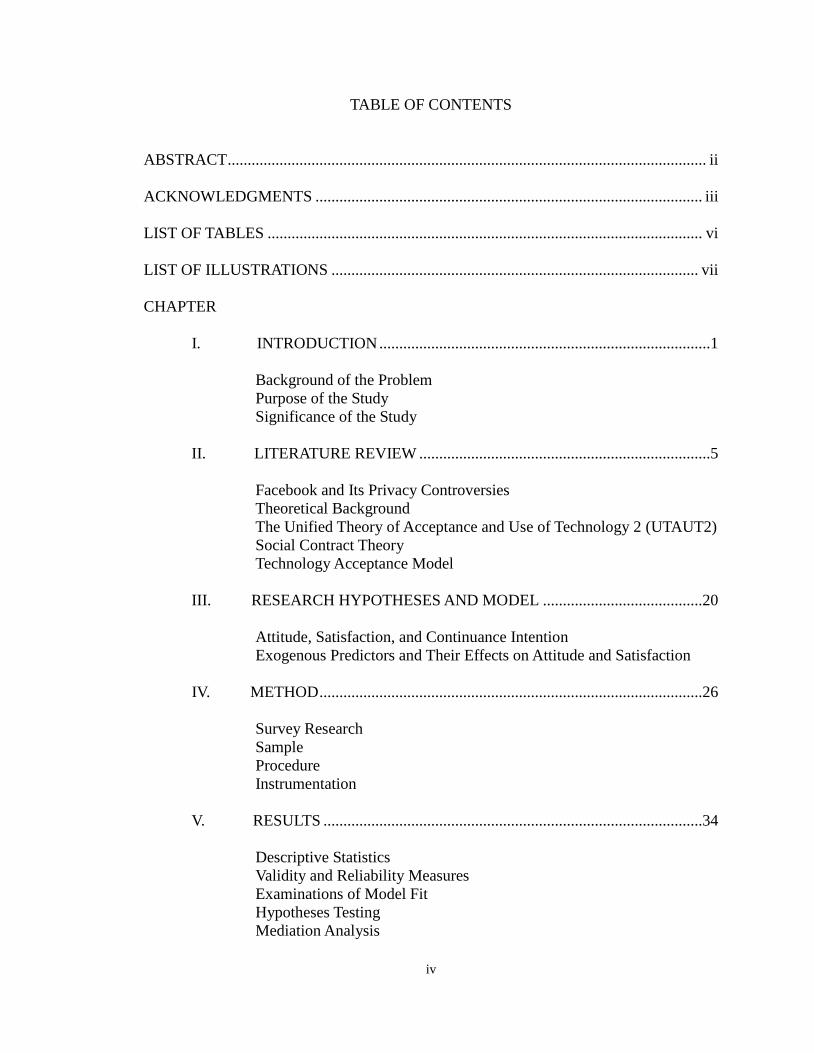
TABLE OF CONTENTS
ABSTRACT ........................................................................................................................ ii
ACKNOWLEDGMENTS ................................................................................................. iii
LIST OF TABLES ............................................................................................................. vi
LIST OF ILLUSTRATIONS ............................................................................................ vii
CHAPTER
I. INTRODUCTION ...................................................................................1
Background of the Problem
Purpose of the Study
Significance of the Study
II. LITERATURE REVIEW .........................................................................5
Facebook and Its Privacy Controversies
Theoretical Background
The Unified Theory of Acceptance and Use of Technology 2 (UTAUT2)
Social Contract Theory
Technology Acceptance Model
III. RESEARCH HYPOTHESES AND MODEL ........................................20
Attitude, Satisfaction, and Continuance Intention
Exogenous Predictors and Their Effects on Attitude and Satisfaction
IV. METHOD ................................................................................................26
Survey Research
Sample
Procedure
Instrumentation
V. RESULTS ...............................................................................................34
Descriptive Statistics
Validity and Reliability Measures
Examinations of Model Fit
Hypotheses Testing
Mediation Analysis

v
VI. DISCUSSION .........................................................................................47
Discussion of Results
Theoretical Ramifications
Practical and Marketing Implications
VII. Limitations and Future Research .............................................................53
APPENDIXES ...................................................................................................................56
REFERENCES ..................................................................................................................69

vi
LIST OF TABLES
Table
1. Core Constructs and Root Constructs/ Theories for UTAUT ..................................9
2. Added Constructs and Root Studies for UTAUT2 ................................................. 11
3. Core Constructs and Root Constructs/ Theories for TCT ......................................18
4. Descriptive Demographic Statistics .......................................................................27
5. Descriptive Statistics ..............................................................................................35
6. Convergent Validity ...............................................................................................39
7. Discriminant Validity .............................................................................................40
8. Fit Indices for the Measurement Model .................................................................41
9. Hypotheses Testing ................................................................................................44
10. Bootstrap Values for Direct, Indirect, and Total Effect ..........................................45
vii
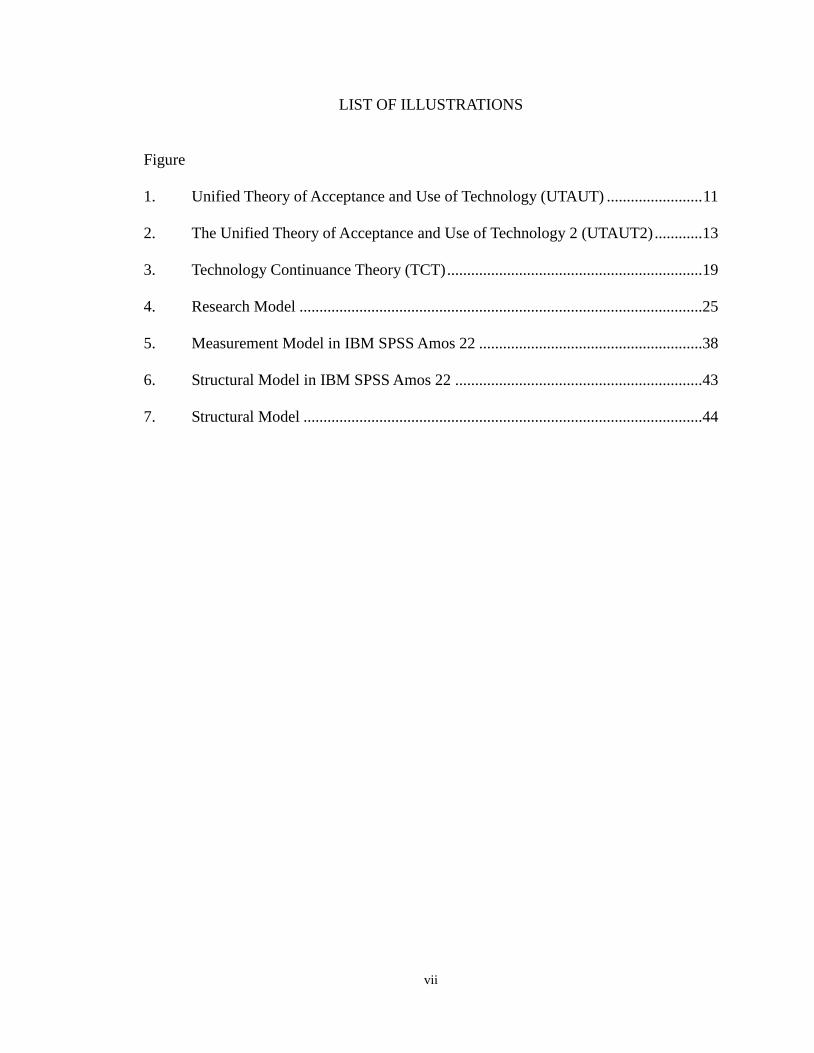
LIST OF ILLUSTRATIONS
Figure
1. Unified Theory of Acceptance and Use of Technology (UTAUT) ........................ 11
2. The Unified Theory of Acceptance and Use of Technology 2 (UTAUT2) ............13
3. Technology Continuance Theory (TCT) ................................................................19
4. Research Model .....................................................................................................25
5. Measurement Model in IBM SPSS Amos 22 ........................................................38
6. Structural Model in IBM SPSS Amos 22 ..............................................................43
7. Structural Model ....................................................................................................44

1
CHAPTER I
INTRODUCTION
Background of the Problem
In the past decade, social media has become a major part of people’s everyday
lives. According to Experian Marketing Services, users in the United States spend 16
minutes out of every hour on social media (Tatham, 2013). Among the various online
platforms, Facebook makes up 83% of the total time Americans spend on
social-networking sites (Leonard, 2013); therefore, Facebook has been ranked the most
popular social media platform from among the many other competitors in the market (e.g.,
Twitter, LinkedIn, and Pinterest). As of September 30, 2012, Facebook had more than
166 million users in the United States, meaning that one out of every two Americans had
a Facebook account (Internet World Stats, 2012). Because of its high penetration rate,
Facebook has not only played an important role in users’ everyday lives, but has also
become one of the most efficient and effective marketing tools.
Since Facebook requires its users’ personal information to provide customized
services (e.g., suggestions of friends and fan pages, location-based services, etc.),
collecting private personal data and tracking a user’s online activities are necessity for
Facebook (Facebook Terms and Policies, 2013). On the other hand, advertising is
Facebook’s major revenue source, accounting for $1.33 billion earned in the fourth
quarter of 2012 (Cutler, 2013). Because most advertising on Facebook targets certain
audiences, the amount of user-related information Facebook can collect from its users
significantly impacts the revenue Facebook gets from targeted marketing and advertising.
Although revealing personal information seems natural to most Facebook users, online

2
stalking, identity theft, harassment, and other privacy-related issues have gradually
become major concerns that impede users from continuously using their Facebook
accounts. For example, Stieger, Burger, Bohn, and Voracek’s (2013) study found that
nearly half the users (48%) who quit their Facebook accounts did so because of privacy
concerns—the number one reason that users deactivated their Facebook pages. There is
an urgent need for Facebook, as well as other social media organizations, to understand
how to keep their existing users, and how privacy-related issues, among other factors, can
come into play to affect users’ continued use of social networking sites. This study would
therefore attempt to enrich the literature in this field by proposing a new behavior model
explaining users’ intention to continue using Facebook.
Purpose of the Study
The present study aims to answer the following two overarching questions: 1)
What are the reasons behind Facebook continuance? and 2) How do different factors
explain such intention? This study administered an online survey to address these issues.
Three theories are utilized to create a new behavior model: The unified theory of
acceptance and use of technology 2 (UTAUT2; Venkatesh, Thong, & Xu, 2012), social
contract theory (Milne & Gordon, 1993), and technology continuance theory (TCT; Liao,
Palvia, & Chen, 2009). The constructs from UTAUT2 (i.e., performance expectancy,
effort expectancy, social influence, facilitating conditions, hedonic motivation) and social
contract theory (i.e., trust and perceived risks) are examined as exogenous predictive
variables. Satisfaction and attitude, the precursors for behavioral intention suggested by
TCT, are examined as endogenous predictive variables. This study investigates the
various predictors’ influence on a user’s continued intention to use Facebook, the

3
outcome variable for the proposed behavior model. Therefore, the purpose of this study is
four-fold: 1) It investigates the proposed model’s explanatory ability for predicting users’
intention to continue using Facebook; 2) It examines the effects of users’ attitude toward
and satisfaction with Facebook on their continuance intention, as well as examining the
precursors of attitude and satisfaction; 3) It probes each exogenous predictive variable’s
influence on the gauged intention, mediated through users’ attitude toward and
satisfaction with Facebook; and, 4) It provides theoretical ramifications for future
research, as well as practical implications for social media companies and marketers, by
discussing a strategy for keeping existing users active on the sites.
Significance of the Study
The significance of this study is both theoretical and practical. First, social media
use is different from traditional media consumption in that social media use requires a
user’s active participation to create user-generated content and online interaction (Gallant
& Boone, 2011). Because of this participation, social media use, known as a form of
computer-mediated communication, is considered a behavior relying more on
information and communication technology (ICT) than on the use of traditional media.
This leads to the present study’s intention to adapt theories from the field of ICT. Because
UTAUT2 has been empirically verified to have the highest predictive ability toward
users’ adoption of ICT compared to other technology acceptance models (Venkatesh et al.,
2012), examining how UTAUT2 can be applied to Facebook use would lead to a
significant theoretical contribution in the field of social media research. Additionally,
because online stalking, identity theft, harassment, and other privacy-related issues have
become the major reason why users discontinue their Facebook accounts in recent years

4
(Stieger et al, 2013), the present study regards the use of Facebook as a risky behavior by
incorporating the concepts of trust and perceived risks from social contract theory to
better understand users’ intention to continue using Facebook. Furthermore, previous
studies have explored various online platforms and proposed insightful arguments
regarding the factors influencing users’ adoption of social media (e.g., Hargittai, 2007;
Hargittai & Litt, 2011). However, as Facebook’s penetration rate rises, retaining existing
users instead of attracting newer ones is considered a more significant agenda for
Facebook. Early studies on Facebook continuance either do not comprehensively
examine aforehand mentioned factors or simply focus on small Facebook markets. For
example, Hsu and Wu (2011) and Wu, Huang, and Hsu (2014) explore Facebook
continuance in Taiwan, yet their studies falls short of a small Facebook population and
snowball sampling method. For a better understanding of continuance intention,
technology continuance theory (TCT) suggests that attitude and satisfaction are the two
precursors of users’ intentions to continue using ICT (Liao et al., 2009). Previous
literature also found that users’ attitude and satisfaction could serve as the outcomes for
the predicted variables proposed by this study (for more details, see research hypotheses
and model). Therefore, the mediating role of users’ attitude and satisfaction are
investigated to provide in-depth information for theoretical and practical implications.

5
CHAPTER II
LITERATURE REVIEW
Facebook and Its Privacy Controversies
Facebook, one of the most popular social networking sites, was launched by Mark
Zuckerberg in 2004, then a sophomore at Harvard University (Nicholas, 2010). At first,
Facebook only accepted membership registrations from Harvard University students, and
it later expanded to general users and soon became one of the most popular social media
outlets (Nicholas, 2010). In May 2008, Facebook surpassed MySpace as the most visited
social networking site worldwide (McCarthy, 2008). In October 2009, Facebook again
beat MySpace to become the most popular social networking site in the United States
(Smith, 2009). As of the first quarter of 2013, Facebook reported that there are 1.19
billion global Facebook users (Facebook, 2013). According to Experian Marketing
Services, online users in the United States spend 16 minutes out of every hour on social
media (Tatham, 2013), of which Facebook makes up 83% of the total time Americans
spend on social-networking sites (Leonard, 2013). As of September 30, 2012, Facebook
had more than 166 million users in the United States, meaning that one out of every two
Americans had a Facebook account (Internet World Stats, 2012). This high penetration
rate has made Facebook an indispensible part of Americans’ everyday lives.
Facebook tracks users’ online activities and requires users to voluntarily disclose
personal information to provide customized service such as suggestions of friends and fan
pages, location-based services, etc. (Chang & Heo, 2014; Facebook Terms and Policies,
2013). For example, Facebook’s “nearby places” function provides its users with
information about nearby stores based on users’ specific geographical locations. There is
6
no service fee required from Facebook users because Facebook also utilizes users’
information for targeted advertising and marketing. According to Cutler (2013),
advertising is Facebook’s major revenue source, accounting for $1.33 billion earned in
the fourth quarter of 2012. Since most advertising on Facebook targets certain audiences,
the amount of user-related information Facebook collects severely impacts the revenue
Facebook can get from targeted marketing and advertising. This business mechanism has
been proven successful because Facebook has become one of the most efficient and
effective marketing tools in recent years. However, Facebook has faced a major challenge
with regard to privacy-related issues, and this challenge has further led to both users’
reluctance to use Facebook and the discontinuance of their existing Facebook accounts
(Stieger et al., 2013). Because active users are considered to be Facebook’s major asset,
this problem has caused an unprecedented crisis for this social media giant.
Even though Facebook claims it only utilizes users’ information for advertising
and marketing purposes, security malfunctions, which could possibly compromise users’
information safety, have been regularly reported. For example, a severe security glitch
that released users’ personal information to unauthorized personnel was discovered on
Facebook in 2010 (Wortham, 2010). This has made Facebook users vulnerable to online
predators, harassment, identity theft, and other potential risks. For example, Facebook’s
location-based service may disclose users’ physical locations, providing burglars with the
opportunity to break into users’ houses. Furthermore, Facebook utilizes users’ personal
information for advertising, even though it may cause potential risks for its users. For
example, Working to Halt Online Abuse (WHOA; 2009) reported that cyber-stalking on
Facebook threatens young adults and female users. Nevertheless, Facebook allows

7
teenagers’ status postings to be viewed by the general public to gain more profit from
advertisers targeting young Facebook users (Kelly, 2013). Perhaps most importantly,
Facebook shares its users’ personal information with third parties to boost its profit,
although Facebook claims that, in doing so, it aims to provide a better personalized
experience (Pegoraro, 2010). In this respect, if users log into a third party’s website by
using their Facebook accounts (i.e., users “link” their Facebook accounts with the third
party’s website), their Facebook friends logging into the same site later on could possibly
see the users’ relevant activities (e.g., news users have read, music users have listened to,
products users have purchased, etc.; Wolverton, 2010). Thus, Facebook users’
information is at risk of being improperly used, which could lead to potential property
loss and endangerment of personal lives.
Because of the privacy-related issues, Facebook has continued to regularly update
its privacy settings. For example, Facebook users have been able to decide who can see
their individual postings on their profile pages (i.e., “Everyone,” “friends of friends,”
“friends only,” and “only me”) since 2009. In May 2010, Facebook further provided its
users with a more user-friendly interface for privacy settings. Even though Facebook tried
hard to improve its privacy protection, its regular technological glitches and the sharing
of personal information for targeted advertising make users’ privacy concerns inevitable.
Consequently, privacy-related issues on Facebook have become the major reason leading
to users’ discontinuance of their Facebook accounts (Smith, 2010). Stieger and
colleagues’ (2013) study found that nearly half of the users (48%) who quit their
Facebook accounts did so because of privacy concerns—the number one reason for users
deactivating their Facebook pages. In this respect, there is an urgent need for Facebook
8
and other social media companies to understand how to keep their existing users, and
how privacy-related issues, among other factors, can come to affect users’ intention to
continue using social media. Although privacy-related issues on Facebook have recently
received a lot of attention from the public, the surprisingly limited development of
research in this field requires more exploration (Piotrowski, 2012). This study would
therefore attempt to enrich the literature in this field by proposing a new behavior model
for explaining users’ intention to keep using Facebook.
Theoretical Background
Social media use is different from traditional media consumption in that social
media use requires users’ active participation to create user-generated content and online
interaction (Gallant & Boone, 2011). Because of this reason, social media use, known as
a form of computer-mediated communication, is considered to be a behavior relying more
on ICT than the use of traditional media. This leads to the present study’s intention to
adapt theories from the field of ICT. Because UTAUT2 has been empirically verified to
have the highest predictive ability toward users’ adoption of ICT compared to other
technology acceptance models (Venkatesh et al., 2012), this study examined how
UTAUT2 can be also applied to the field of social media research.
The Unified Theory of Acceptance and Use of Technology 2 (UTAUT2)
UTAUT2 (Venkatesh et al., 2012) are extensions of UTAUT, proposed by
Venkatech, Morris, G. B. Davis and F. D. Davis in 2003. UTAUT is a combination of
eight behavior models and theories that have been frequently used to examine users’
adoption of ICT: the theory of reasoned action (TRA), the technology acceptance model
(TAM), the motivational model (MM), the theory of planned behavior (TPB), the

9
combined theory of planned behavior/technology acceptance model (C-TPB-TAM), the
model of personal computer use (MPCU), the innovation diffusion theory (IDT), and the
social cognitive theory (SCT; Venkatech et al., 2003). By empirically examining users’
adoption of information technology (IT) in an organizational context, Venkatech, Morris,
Davis and Davis found that UTAUT predicts 70% of users’ adoption intentions and 50%
of their adoption behavior, which are better results than other existing technology
acceptance models. A decade after UTAUT was first introduced to academia, Venkatesh,
Morris, Davis and Davis’s article was ranked the second most cited paper in MIS
Quarterly (Venkatesh, 2012). The core constructs for UTAUT are all borrowed and
developed from the previously mentioned eight models and theories (see Table 1).
Table 1
Core Constructs and Root Constructs/ Theories for UTAUT
Core Constructs Definition Root Constructs/Theories
Performance
Expectancy
“The degree to which an individual
believes that using the system will
help him or her to attain gains in job
performance” (p.447).
1. Perceived Usefulness
(TAM/TAM2/C-TAM-TPB)
2. Extrinsic Motivation (MM)
3. Job-fit (MPCU)
4. Relative Advantage (IDT)
5. Outcome Expectations (SCT)
Effort Expectancy “The degree of ease associated with
the use of the system” (p.450).
1. Perceived Ease-of-Use
(TAM/TAM2)
2. Complexity (MPCU)
3. Ease-of-Use (IDT)
Social Influence “The degree to which an individual
perceives that important others believe
he or she should use the new system”
(p.451).
1. Subjective Norm (TRA, TAM2,
TPB/DTPB, and C-TAM-TPB)
2. Social Factors (MPCU)
3. Image (IDT)
Facilitating Conditions “The degree to which an individual
believes that an organizational and
technical infrastructure exists to
support use of the system” (p.453).
1. Perceived Behavioral Control
(TPB/DTPB, C-TAM-TPB)
2. Facilitating Conditions (MPCU)
3. Compatibility (IDT)
Note: More details can be found from Venkatesh et al. (2003). User acceptance of information technology: Toward a
unified view, MIS Quarterly, 27(3), 425-478.

10
The UTAUT model has been empirically verified and consists of several
predictive relationships and moderators:
1. Users’ performance expectancy, effort expectancy, and social influence predict users’
intention in adopting IT, whereas users’ facilitating conditions and adoption intention
predict their actual IT use (Venkatech et al., 2003). This primitive UTAUT model has
been widely extended to examine ICT adoption by researchers from different fields
(e.g., Lin & Anol, 2008; Wang & Wang, 2010; Wang, Wu, & Wang, 2009).
2. When four moderators (i.e., gender, age, experience, and voluntariness to use) were
further added to the primitive UTAUT model, UTAUT can explain 70% of the
variance regarding users’ adoption intention (Venkatech et al., 2003).
3. Regarding the moderating variables for UTAUT, users’ age and gender both moderate
the effects of users’ performance expectancy, effort expectancy, and social influence
on users’ adoption intention; users’ experience moderates the effects of users’ effort
expectancy and social influence on users’ behavior intention; and, users’ voluntariness
to use new IT moderates the effect of users’ social influence on their adoption
intention (Venkatech et al., 2003). Moreover, the effect of users’ facilitating
conditions on users’ adoption intention is moderated by users’ age and experience
(Venkatech et al., 2003; for UTAUT model, see Figure 1).

11
Effort
Expectancy
Social
Influence
Facilitating
Condition
Age Gender Experience Voluntariness
of Use
Behavioral
Intention Use Behavior
Performance
Expectancy
Figure 1. Unified Theory of Acceptance and Use of Technology (UTAUT).
UTAUT has been verified to have a high predictive power towards users’ IT
adoption in an organizational context and has been applied and extended to other contexts.
For example, Hsu and Wu (2011) and Wu, Huang, and Hsu (2014) extend UTAUT to
examine Facebook continuance in Taiwan. Their findings suggest that performance
expectance, effort expectancy, social influence, and facilitating conditions are the
predictors for Facebook continuance intention. However, Venkatesh and colleagues (2012)
believed it can be problematic if researchers directly apply UTAUT to examine
consumers’ adoption of ICT because of the difference of users’ roles as employer and
consumer. Therefore, three additional predictors (i.e., hedonic motivation, price value,
and habit) were added to the UTAUT2, based on the literature on consumer research, to
examine general users’ adoption of ICT (Venkatesh et al., 2012; see Table 2).

12
Table 2
Added Constructs and Root Studies for UTAUT2
Constructs Definition Root Studies
Hedonic Motivation “The fun or pleasure derived from using a
technology” (p.161).
1. Brown and Venkatesh (2005)
2. Childers et al. (2001)
3. Thong et al. (2006)
4. Van der Heijden (2004)
Price Value “Consumers’ cognitive tradeoff between
the perceived benefits of the applications
and the monetary cost for using them”
(p.161).
1. Chan et al. (2008)
2. Dodds et al. (1991)
3. Zeithaml (1988)
Habit “The extent to which people tend to
perform behaviors automatically because
of learning” “Scholars also equate habit
with automaticity” (p.161).
1. Ajzen (2002)
2. Ajzen & Fishbein (2005)
3. Kim & Malhotra (2005)
4. Limayem et al. (2007)
5. Ouellette & Wood (1998)
Note: More details can be found from Venkatesh et al. (2012). Consumer acceptance and use of information technology:
Extending the unified theory of acceptance and use of technology. MIS Quarterly, 36(1), 157-178.
UTAUT2 was empirically verified and suggests the following predictive
relationships for its constructs:
1. All seven predictive variables (i.e., users’ performance expectancy, effort expectancy,
social influence, facilitating conditions, hedonic motivation, price value, and habit)
influence users’ intention in adopting ICT (Venkatesh et al., 2012).
2. Users’ facilitating conditions, habit, and adoption intention directly predict their
adoption behavior (Venkatesh et al., 2012).
Three individual differences (i.e., age, gender, experience) are the moderators for
UTAUT2, after deleting “voluntariness of use” from UTAUT. This is mainly because
employees in an organization are often forced to adopt new ICT to increase the workplace
efficiency, whereas consumers use new ICT of their own free will (Venkatesh et al.,
2012). Hence, the following moderating effects are suggested by UTAUT2:
13
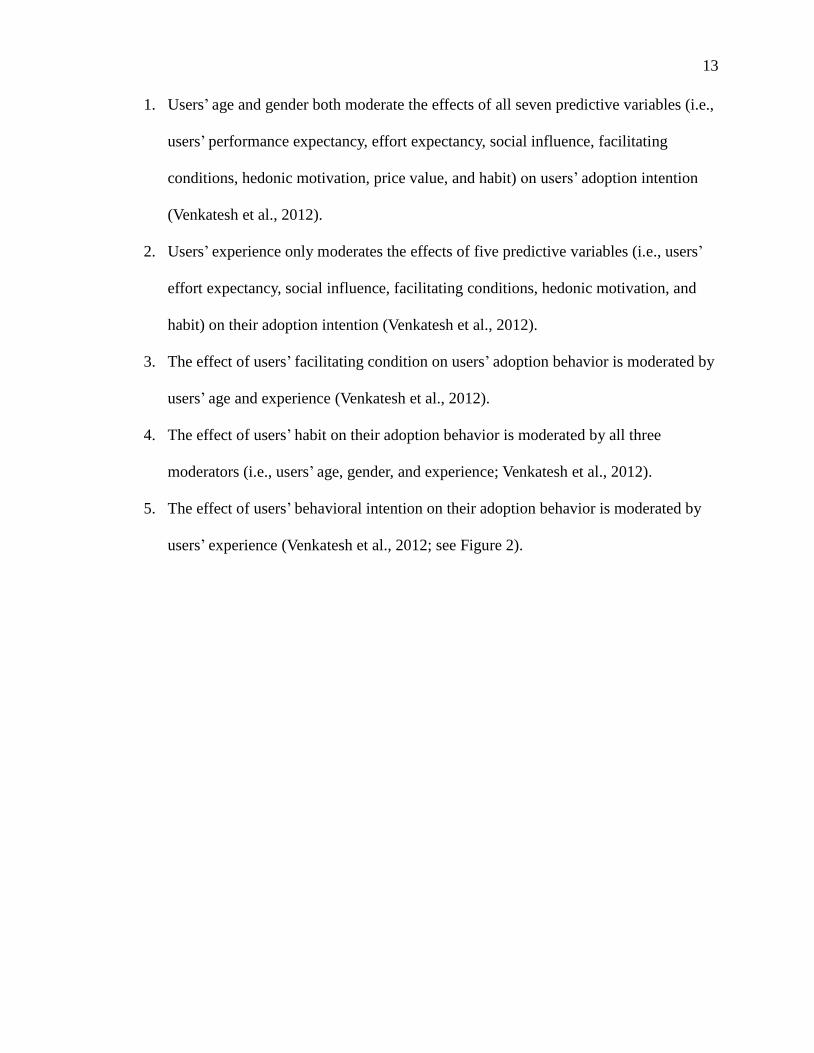
1. Users’ age and gender both moderate the effects of all seven predictive variables (i.e.,
users’ performance expectancy, effort expectancy, social influence, facilitating
conditions, hedonic motivation, price value, and habit) on users’ adoption intention
(Venkatesh et al., 2012).
2. Users’ experience only moderates the effects of five predictive variables (i.e., users’
effort expectancy, social influence, facilitating conditions, hedonic motivation, and
habit) on their adoption intention (Venkatesh et al., 2012).
3. The effect of users’ facilitating condition on users’ adoption behavior is moderated by
users’ age and experience (Venkatesh et al., 2012).
4. The effect of users’ habit on their adoption behavior is moderated by all three
moderators (i.e., users’ age, gender, and experience; Venkatesh et al., 2012).
5. The effect of users’ behavioral intention on their adoption behavior is moderated by
users’ experience (Venkatesh et al., 2012; see Figure 2).

14
UTAUT
UTAUT2
Performance
Expectancy
Effort
Expectancy
Social
Influence
Facilitating
Condition
Hedonic
Motivation
Price Value
Habit
Age Gender Experience
Behavioral
Intention Use Behavior
Figure 2. The Unified Theory of Acceptance and Use of Technology 2 (UTAUT2)
UTAUT2 has not only been extended to different types of ICT adoption (e.g.,
Huang, Kao, Wu, & Tzeng, 2013; Slade, Williams, & Dwivedi, 2013), but also been used
to examine users’ ICT adoption under diverse cultural contexts (e.g., Alawan, Dwivedi, &
Williams, 2013; Chong & Ngai, 2013). Although UTAUT2 has been widely applied by
behavioral science researchers from different fields, there has been no journal publication
utilizing UTAUT2 in the examination of the adoption of social media. Because social
media use, known as a form of computer-mediated communication, relies more on
technology than on the consumption of traditional media, incorporating the major
predictors from UTAUT2 to the proposed model would provide a significant theoretical
contribution in this field of social media research. Perhaps most importantly, social media
plays an important role in modern advertising/marketing; therefore, this study would also

15
provide useful implications for social media companies. To make the analysis more
manageable, the present study only used five predictive variables (i.e., users’ performance
expectancy, effort expectancy, social influence, facilitating conditions, and hedonic
motivation) and excluded the influences from moderators suggested by UTAUT2. “Price
value” was withdrawn from the proposed model since Facebook does not charge a fee
from its users; “habit” was also eliminated because of a lack of literature support.
Social Contract Theory
Social contract theory is also applied for the model construction based on prior
literature on Internet online social community (Fogel & Nehmad, 2009). This is because
online stalking, identity theft, harassment, and other privacy-related issues have become
the major reason for why users discontinue their Facebook accounts in recent years
(Stieger et al., 2013). The present study therefore regards the use of Facebook as a risky
behavior, different from general technology adoption, by including social contract theory
as its theoretical framework.
Social contract theory is a political philosophy that is used to explain the
relationship among the individual, government, and society (Locke, 2007; Macneil, 1974;
Riley, 2006; Rousseau, 1971). Social contract theory assumes that the individual is
rational and understands that his/her unlimited freedom in our society may pose a risk of
harm to others; in this respect, the individual voluntarily gives up certain degrees of
freedom (e.g., not breaking the laws and regulations made by the government) in
exchange for a better social order (Rachels & Rachels, 2011; Rousseau, 1971). This kind
of voluntary consent is therefore considered a “social contract,” ensuring the benefit to
our society and the individuals living within it (Locke, 2007; Macneil, 1974; Riley, 2006;

16
Rousseau, 1971). Previous studies have applied social contract theory to examine the
“implicit social contract” (Milne & Gordon, 1993, p.207), a relative concept compared to
the “explicit (legal) social contract (i.e., law),” between marketers/advertisers and
consumers (e.g., Milne & Gordon, 1993; Okazaki, Li, & Hirose, 2009). Based on the
assumption that businesses and firms provide advantages to our society (Quelch & Jocz,
2008), the implicit social contract implies that consumers would voluntarily provide
personal or private information for services if marketers/advertisers keep their promise to
use consumers’ information for proper purposes only (Chang & Heo, 2014; Milne &
Gordon, 1993). In this respect, consumers’ trust toward marketers/advertisers, in terms of
whether they would behave in a responsible way, plays an important role in consumers’
voluntary consent for this implicit social contract (Okazaki et al., 2009). Moreover, when
providing personal information in exchange for services, consumers perceive not only
benefits from the services, but also risks from unexpected problems (Fogel & Nehmad,
2009; McKnight & Lankton, 2010; Quelch & Jocz, 2008). Culnan and Armstrong’s (1999)
study suggests that consumers would provide information in exchange for services only
under the circumstances that their perception of the benefits is higher than the risks
(Chang & Heo, 2014). Additionally, consumers’ perceived risks can be mitigated if their
level of trust is high (Krasnova, Spiekermann, Koroleva, & Hildebrand, 2010). In other
words, consumers’ trust, perceived benefits, and perceived risks all play a role in
affecting their voluntary consent for this implicit social contract.
Based on the assumptions of social contract theory, this study regards Facebook
users’ voluntary disclosure of personal information in exchange for social networking
services as a form of implicit social contract. When using Facebook, users are required to

17
provide personal information and allow the Facebook server to track their online
activities for providing customized services (e.g., suggestions of friends and fan pages,
location-based services, etc.; Facebook Terms and Policies, 2013). In this respect, users
trust that Facebook will behave properly and protect their personal information from
unauthorized use. However, if Facebook fails to keep its promise, consumers would be
less likely to trust Facebook, leading to their reluctance to provide personal information.
Previous studies have provided empirical evidence supporting the postulation that users’
trust affects their information disclosure on the web (e.g., Hoffman, Novak, & Peralta,
1999; Metzger, 2004). Trust is also considered to be the precursor of other kinds of social
contracts such as online transactions (Jarvenpaa & Tractinsky, 1999). Furthermore, users
understand that the disclosure of personal information, on one hand, guarantees a better
user experience on Facebook and, on the other hand, may also cause potential problems
such as online stalking, identity theft, harassment, and other privacy issues (Ibrahim,
2008; McKnight & Lankton, 2010; Tufekci, 2008). A previous study has found empirical
evidence that users’ privacy concern on Facebook is one of the significant precursors
predicting his or her discontinuance of Facebook use (Stieger et al., 2013). Krasnova,
Spiekermann, Koroleva, and Hildebrand (2010) also suggest Facebook users’ perceived
risks affect their willingness to disclose personal information. Consequently, this study
borrows the constructs of users’ trust and perceived risks from social contract theory for
the model construction. Because the construct of perceived benefits is very similar to
performance expectancy from UTAUT2, the researcher decided not to include it in the
research model.

18
Technology Continuance Theory (TCT)
Previous studies have explored various online platforms and proposed insightful
arguments regarding the factors influencing users’ adoption of social media (e.g.,
Hargittai, 2007; Hargittai & Litt, 2011). However, as Facebook’s penetration rate rises,
retaining existing users, instead of attracting newer ones, is considered a more significant
agenda for Facebook. For example, Hsu and Wu (2011) and Wu, Huang, and Hsu (2014)
explore Facebook continuance in Taiwan, yet their studies falls short of a small Facebook
population and snowball sampling method. For a better understanding of continuance
intention, technology continuance theory (TCT) was also applied for the model
construction in this study. TCT was proposed by Liao, Palvia, and Chen’s (2009) study on
information system adoption and continuance. It is an integrated model, incorporating the
technology acceptance model (TAM), the expectation confirmation model (ECM), and
the cognitive model (COG; Liao et al., 2009). The core constructs for TCT are all
borrowed and developed from the previously mentioned three models (see Table 3).
Table 3
Core Constructs and Root Constructs/ Theories for TCT
Core Constructs Definition Root Constructs/Theories
Perceived Usefulness “The prospective user’s subjective probability that
using a specific application system will increase
job performance (Davis, Bagozzi, & Warshaw,
1989, p. 985)” (p.310).
Technology Acceptance
Model (TAM)
Perceived
Ease-of-Use
“The degree to which the prospective user expects
the target system to be free of effort (Davis et al.,
1989, p. 985)” (p.310).
Technology Acceptance
Model (TAM)

19
Table 3 (continued).
Core Constructs Definition Root Constructs/Theories
Confirmation “Disconfirmation is defined as the discrepancy
between a user’s pre-adoption expectations and
perceived performance (Churchill & Suprenant,
1982; Oliver, 1980). The polarity of
disconfirmation is positive when the perceived
performance is higher than pre-adoption
expectations and the user is satisfied, or is negative
when perceived performance falls short of
expectations and the user is dissatisfied” (p.311).
Expectation Confirmation
Model (ECM)
Satisfaction “An individual’s post-consumption evaluation of a
specific transaction (Bolton & Drew, 1991; Hunt,
1977)” (p.311).
Cognitive Model (COG)
Attitude “An individual’s overall evaluation of a product or
service offering (Bolton & Drew, 1991; Hunt,
1977)” (p.311).
Cognitive Model (COG)
Note: More details can be found from Liao et al. (2009). Information technology adoption behavior life cycle: Toward a
Technology Continuance Theory (TCT). International Journal of Information Management, 29(4), 309-320.
Based on the empirical data on technology continuance, the TCT model proposes
the following assumptions:
1. Users’ perceived usefulness, satisfaction and attitude directly influence their intention
to continue using information systems (Liao et al., 2009).
2. Users’ perceived usefulness serves as the mediating role in the relationships between
1) users’ confirmation and their continuance intention and 2) user’s perceived
ease-of-use and their continuance intention (Liao et al., 2009).
3. Users’ satisfaction serves as the mediating role in the relationships between 1) users’
confirmation and their continuance intention and 2) users’ perceived usefulness and
their continuance intention (Liao, et al., 2009).
4. Users’ attitude serves as the mediating role in the relationships between 1) users’
perceived usefulness and their continuance intention, 2) users’ perceived ease-of-use

20
Confirmation
Perceived
Usefulness
Perceived
Ease-of-Use Attitude
IS Continuance
Intention
Satisfaction
and their continuance intention, and 3) user’s satisfaction and their continuance
intention (Liao et al., 2009; see Figure 3).
Although TCT has not been widely applied to different research, this study
considers TCT useful for suggesting the predictive roles of users’ attitude and satisfaction
on their continuance intention of information systems.
Figure 3. Technology Continuance Theory (TCT)
21
CHAPTER III
RESEARCH HYPOTHESES AND MODEL
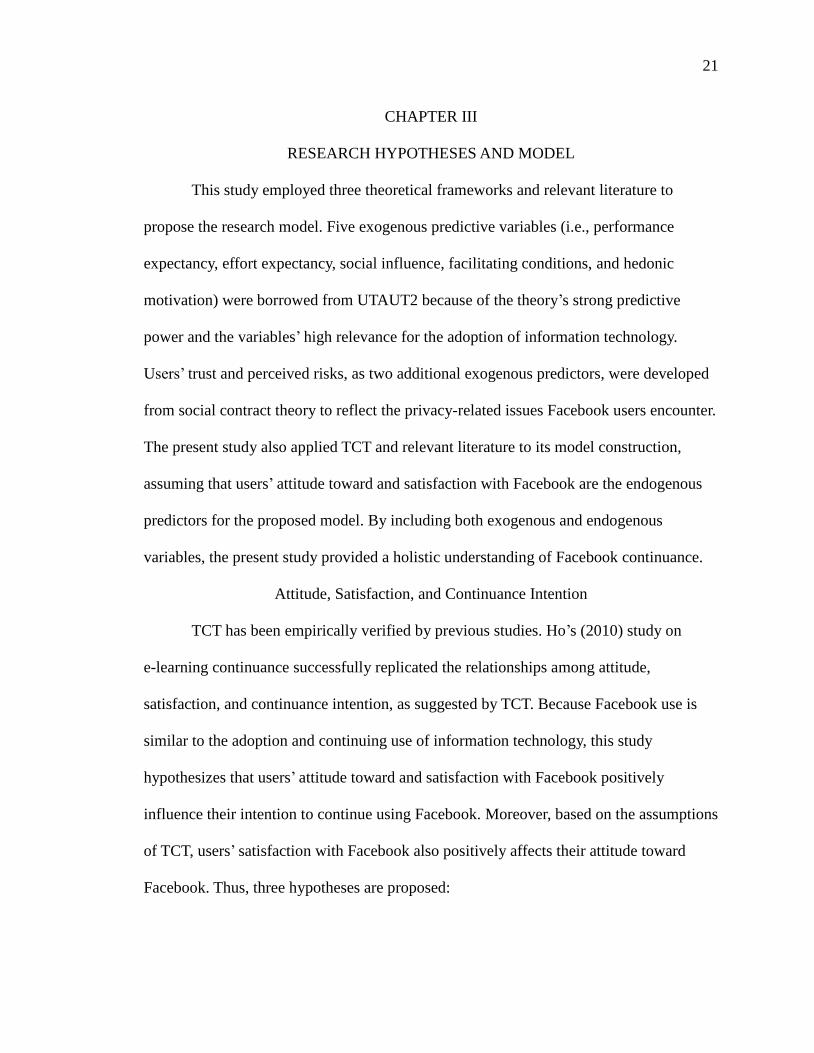
This study employed three theoretical frameworks and relevant literature to
propose the research model. Five exogenous predictive variables (i.e., performance
expectancy, effort expectancy, social influence, facilitating conditions, and hedonic
motivation) were borrowed from UTAUT2 because of the theory’s strong predictive
power and the variables’ high relevance for the adoption of information technology.
Users’ trust and perceived risks, as two additional exogenous predictors, were developed
from social contract theory to reflect the privacy-related issues Facebook users encounter.
The present study also applied TCT and relevant literature to its model construction,
assuming that users’ attitude toward and satisfaction with Facebook are the endogenous
predictors for the proposed model. By including both exogenous and endogenous
variables, the present study provided a holistic understanding of Facebook continuance.
Attitude, Satisfaction, and Continuance Intention
TCT has been empirically verified by previous studies. Ho’s (2010) study on
e-learning continuance successfully replicated the relationships among attitude,
satisfaction, and continuance intention, as suggested by TCT. Because Facebook use is
similar to the adoption and continuing use of information technology, this study
hypothesizes that users’ attitude toward and satisfaction with Facebook positively
influence their intention to continue using Facebook. Moreover, based on the assumptions
of TCT, users’ satisfaction with Facebook also positively affects their attitude toward
Facebook. Thus, three hypotheses are proposed:

22
H1: Attitude toward Facebook positively predicts intention to continue using
Facebook.
H2: Satisfaction with Facebook positively predicts intention to continue using
Facebook.
H3: Satisfaction with Facebook positively predicts attitude toward Facebook.
Exogenous Predictors and Their Effects on Attitude and Satisfaction
Performance expectancy. The construct of performance expectancy was originally
developed from perceived usefulness, both of which measure similar psychological
concepts. Because perceived usefulness influences one’s attitude toward and satisfaction
with information systems (TCT; Ho, 2010), it is reasonable to assume that performance
expectancy would have the same effects under the context of Facebook use, which was
verified by Bonson, Escobar, and Ratkai’s (2014) study:
H4a: Performance expectancy on Facebook positively predicts attitude toward
Facebook.
H4b: Performance expectancy on Facebook positively predicts satisfaction with
Facebook.
Effort expectancy. Previous studies found that users’ perceived ease-of-use
influences their attitude (TCT model and Ho, 2010) toward and satisfaction with
Facebook use (Sibona and Choi, 2012). Because users’ perceived ease-of-use is exactly
the same as the construct of users’ effort expectancy from UTAUT2, this study
hypothesizes that users’ effort expectancy on Facebook would negatively influence their
attitude toward and satisfaction with Facebook:
23
H5a: Users’ effort expectancy on Facebook negatively predicts their attitude
toward Facebook.
H5b: User’s effort expectancy on Facebook negatively predicts their satisfaction
with Facebook.
Social influence. UTAUT2 and several behavioral and technology acceptance
models (e.g., TPB, TRA, C-TAM-TPB, TAM2 and MPCU) have provided empirical
evidence that users’ social influence affects their intention to adopt ICT. Although there is
still a lack of research examining how users’ social influence affects their attitude in a
social media or ICT context, previous studies have suggested that consumers’ subjective
norms, a construct very similar to social influence, affect their attitude toward products
and consumption behaviors (e.g., Ang, Cheng, Lim, & Tambyah, 2001; De Matos, Ituassu,
& Rossi, 2007; Phau & Teah, 2009; Tang & Farn, 2005). Thus, it is reasonable to
hypothesize that users’ social influence, such as the opinions or suggestions from their
family members and close friends, would positively influence users’ attitude toward
Facebook. Because Hsu and Chiu’s (2004) study also suggests that users’ interpersonal
influence affects their satisfaction with information systems, this study hypothesizes that
users’ social influence on Facebook use would positively influence their satisfaction with
Facebook:
H6a: User’s social influence on Facebook use positively predicts their attitude
toward Facebook.
H6b: User’s social influence on Facebook use positively predicts their satisfaction
with Facebook.

24
Facilitating conditions. A study on consumer behavior found that users’
perceiving better facilitating conditions would have more positive attitudes toward the
behavior (Limayem, Khalifa, & Chin, 2004). Yen and Gwinner’s (2003) study also
provides empirical evidence that users’ perceived behavior control directly influences
their satisfaction with information systems. Thus, this study assumes that users’
facilitating conditions on Facebook use would positively influence their attitude toward
and satisfaction with Facebook:
H7a: User’s facilitating condition on Facebook use positively predicts their
attitude toward Facebook.
H7b: User’s facilitating condition on Facebook use positively predicts their
satisfaction with Facebook.
Hedonic motivation. Hedonic motivation is considered the precursor of users’
attitude toward information systems (Childers, Carr, Peck, & Carson, 2001). A previous
study on consumer behavior also suggests both consumers’ utilitarian and hedonic values
predict their satisfaction (Ryu, Han, & Jang, 2010). Thus, this study hypothesizes that
users’ hedonic motivation for using Facebook would positively influence their attitude
toward and satisfaction with Facebook:
H8a: User’s hedonic motivation for using Facebook positively predicts their
attitude toward Facebook.
H8b: User’s hedonic motivation for using Facebook positively predicts their
satisfaction with Facebook.
Trust. Early literature found that trust predicts users’ attitude toward social
networking systems (Shin & Kim, 2010). A study on consumer behavior also suggests

25
that users’ trust in technology systems predicts their satisfaction with online
consumer-to-consumer platforms (Lu, Wang, & Hayes, 2012). Based on previous
findings, this study postulates that users’ trust in Facebook would positively predict their
attitude toward and satisfaction with Facebook:
H9a: User’s trust in Facebook positively predicts their attitude toward Facebook.
H9b: User’s trust in Facebook positively predicts their satisfaction with
Facebook.
Perceived Risks. De Matos and colleagues’ (2007) study on consumer behavior
found that users’ perceived risks predict their attitude toward products (De Matos et al.,
2007). Although there is a lack of literature exploring the effect of users’ perceived risks
on their satisfaction with information technology or social media, it is reasonable that
users’ perceived risks would affect their satisfaction with Facebook use. Hence, this study
hypothesizes that users’ perceived risks of Facebook use would negatively predict their
attitude toward and satisfaction with Facebook:
H10a: User’s perceived risks of Facebook use negatively predict their attitude
toward Facebook.
H10b: Users’ perceived risks of Facebook use negatively predict their satisfaction
with Facebook.

26
TCT
Social Contract Theory
UTAUT2
H1
H2
H3
H4b
H5b
H6b
H5a
H9a
H9b
H8b
H8a
H7b
H7a
H10b
Performance Expectancy (PE)
Effort Expectancy (EE)
Facilitating Condition (FC)
Hedonic Motivation (HM)
Attitude (ATT)
Satisfaction (S)
Continued Intention (CI)
H4a
H6a Social Influence (SI)
H10a
Trust
Perceived Risks (PR)
Based on the hypotheses, the research model was proposed (see Figure 4).
Figure 4. The Research Model

27
CHAPTER IV
METHOD
Survey Research
This study intends to measure users’ perception, attitude, satisfaction, and
behavioral intention toward Facebook use and to test the relationships among these
variables by conducting a structural equation modeling (SEM) analysis. Because survey
research has been prevalently used in the field of behavioral sciences for describing the
subject population’s opinions, attitudes, behaviors etc. (Gravetter & Forzano, 2010), this
study used an online survey to collect data and later conducted a modeling test in IBM
SPSS Amos. The data were collected in late January and early February, 2014.
Sample
In order to generalize the results to the general population, the subject population
for this study is Facebook users over 18-years old in the United States (the relevant
research laws and regulations also require the participants to be 18-years old or older).
This study administrated a random sampling method by recruiting participants from
Amazon Mechanical Turk (MTurk) because of its reasonable cost compared to Qualtrics
and SurveyMonkey. Previous studies have suggested that MTurk represents a larger
population and is considered to be reliable (e.g., Buhrmester, Kwang, & Gosling, 2011).
Besides the representativeness of sampling, SEM also requires large numbers of cases.
Kenny (2012) and Kline (2011) suggest that a study of at least 200-400 cases is
considered a suitable sample size for running a SEM analysis. For this study, 450 cases
were used for the data analysis (see Table 4 for descriptive demographic statistics).
28
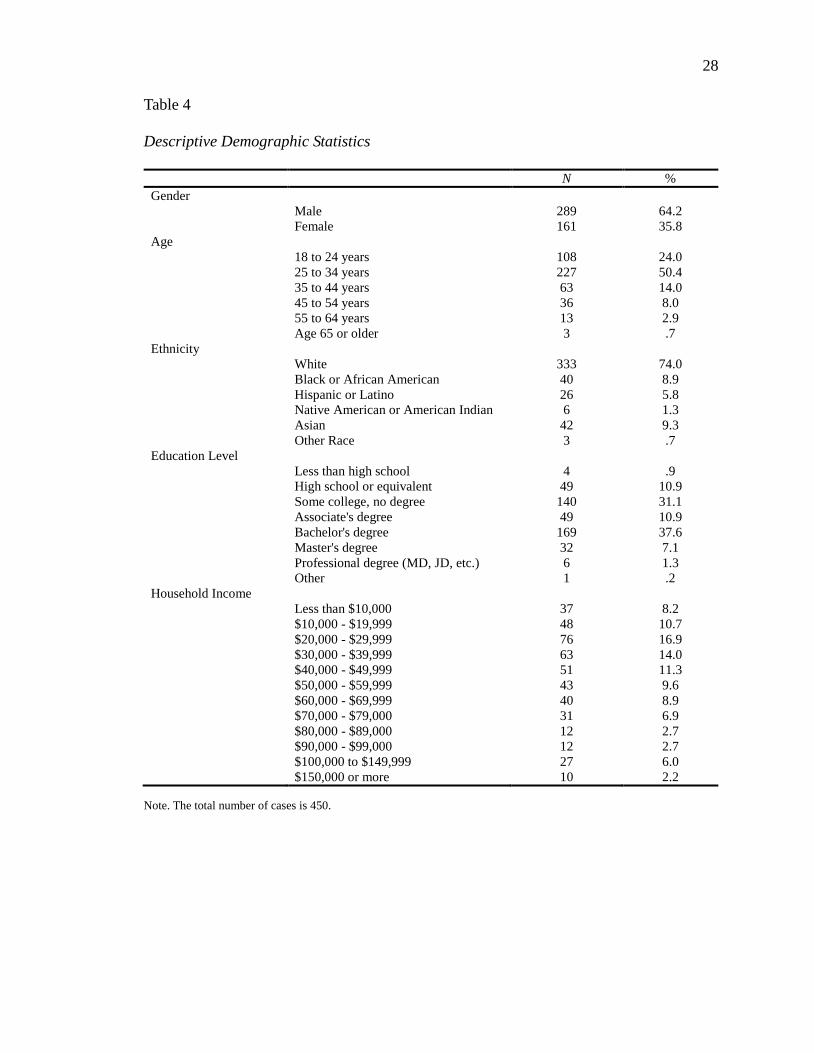
Table 4
Descriptive Demographic Statistics
N %
Gender
Male
Female
289
161
64.2
35.8
Age
18 to 24 years
25 to 34 years
35 to 44 years
45 to 54 years
55 to 64 years
Age 65 or older
108
227
63
36
13
3
24.0
50.4
14.0
8.0
2.9
.7
Ethnicity
White
Black or African American
Hispanic or Latino
Native American or American Indian
Asian
Other Race
333
40
26
6
42
3
74.0
8.9
5.8
1.3
9.3
.7
Education Level
Less than high school
High school or equivalent
Some college, no degree
Associate's degree
Bachelor's degree
Master's degree
Professional degree (MD, JD, etc.)
Other
4
49
140
49
169
32
6
1
.9
10.9
31.1
10.9
37.6
7.1
1.3
.2
Household Income
Less than $10,000
$10,000 - $19,999
$20,000 - $29,999
$30,000 - $39,999
$40,000 - $49,999
$50,000 - $59,999
$60,000 - $69,999
$70,000 - $79,000
$80,000 - $89,000
$90,000 - $99,000
$100,000 to $149,999
$150,000 or more
37
48
76
63
51
43
40
31
12
12
27
10
8.2
10.7
16.9
14.0
11.3
9.6
8.9
6.9
2.7
2.7
6.0
2.2
Note. The total number of cases is 450.

29
Procedure
Preparation
As a survey research involving human subjects, this study was approved by the
IRB office at The University of Southern Mississippi to ensure its less than minimum risk
(for the approval letter, see Appendix A). In order to reach participants all around the
United States, an online questionnaire consisting of 81 questions on Qualtrics
(http://qualtrics.com/) was designed for data collection (For a sample questionnaire, see
Appendix B). All the questions were either borrowed or adapted from previous scales that
have been verified to have high reliabilities. An introduction page was produced to ensure
the participants answer the questionnaire truthfully and to the best of their knowledge.
The researcher’s contact information was also provided to the participants, in case they
had any questions or concerns about this study.
Pretest
Singh (2007) suggests that a pretest is an indispensable process in a survey
research. Frequently, survey researchers only use questionnaires that have first been
pretested (Weisberg, Krosnick, & Bowen, 1996). The pretest is often conducted with the
researcher’s colleagues and target participants to detect any potential issues with or in the
instrument (Zikmund & Babin, 2009). For this study, social media professionals and
heavy users were asked to examine the questionnaire. Some minor revisions were made
based on the responses and suggestions.
Administration
This study recruited participants from Amazon Mechanical Turk (MTurk)
(https://www.mturk.com/mturk/) by paying each of them 50 cents (USD) as
30
compensation. Participants were provided a URL link to Qualtrics to answer the
questionnaire individually at their own convenience. To ensure privacy, all the
questionnaires were collected anonymously. For each part of the questionnaire, the
researcher provided detailed instructions to help participants answer individual questions
truthfully and to the best of their knowledge. The function of “force answering” for
individual questions was also used in Qualtrics to prevent participants from skipping any
questions. Only when the participants completed all of the questions, could they be
considered valid cases. Generally speaking, each participant spent about 12 to 15 minutes
finishing the survey.
Instrumentation
Screening Questions
Three screening questions (yes/no) were used for filtering the participants in this
study. The first screening question was used to ensure that the respondents were
US-based Mturk participants. The second screening question was asked to make sure all
of the participants were Facebook users. To comply with relevant research laws and
regulations, the third screening question was asked to guarantee the participants in this
study were at least 18-years old or older. Those participants answering “no” for any of the
screening questions were immediately led to a thank you page and considered invalid
cases for this study.
Exogenous Predicted Variables from UTAUT2
Five predicted variables for this study (i.e., performance expectancy, effort
expectancy, social influence, facilitating condition, and hedonic motivation) were
borrowed from UTAUT2. To measure these variables, questions using a 7-point Likert

31
scale (disagree/agree) were developed from the UTAUT2 and UTAUT models.
Performance expectancy. Four questions were asked to measure the degree to
which users believe using Facebook increases their effectiveness and efficiency in their
everyday lives: “I find Facebook useful in my daily life;” “Using Facebook increases my
chances of connecting with people that are important to me;” “Using Facebook increases
my chances of obtaining information that is important to me;” and “Using Facebook
increases my efficiency in everyday life.”
Effort expectancy. Three questions were asked to investigate the degree to which
Facebook users believe using Facebook is effortless for them: “Learning how to use
Facebook is easy for me;” “I find Facebook easy to use;” and “It is easy for me to
become skilled in using Facebook.”
Social influence. Three questions were asked to gauge the degree to which
Facebook users’ significant others believe they should use Facebook: “People who are
important to me think that I should use Facebook;” “People who influence my behavior
think that I should use Facebook;” and “People whose opinions that I value prefer that I
use Facebook.”
Facilitating conditions. Four questions were asked to examine the degree to
which Facebook users believe they have the appropriate
technologies/knowledge/resources to use Facebook: “I have the technologies necessary
(e.g., computer or smartphone) to use Facebook;” “I have the knowledge necessary to use
Facebook;” “Facebook is compatible with other technologies I use;” and “I can get help
from others when I have difficulties using Facebook.”

32
Hedonic motivation. Three questions were asked for measuring the degree of fun
or pleasure a user obtains from using Facebook: “Using Facebook is fun;” “Using
Facebook is enjoyable;” and “Using Facebook is very entertaining.”
Exogenous Predicted Variables from Social Contract Theory
Trust and perceived risks were developed from social contract theory. Because the
construct of perceived benefits is considered similar to the performance expectancy
metric from UTAUT2, trust and perceived risks were measured.
Trust. To examine the degree to which users trust in Facebook, questions using a
7-point Likert scale (disagree/agree) were directly borrowed from Fogel and Nehmad’s
(2009) study, which was originally developed by Pan and Zinkhan (2006). Four questions
were asked: “Facebook is a trustworthy social network;” “I can count on Facebook to
protect my privacy;” “I can count on Facebook to protect customers’ personal
information from unauthorized use;” and “Facebook can be relied on to keep its
promises.”
Perceived risks. Regarding the measurement for perceived risks, questions using a
7-point Likert scale (disagree/agree) were developed from Debatin, Lovejoy, Horn, and
Hughes’s (2009) study on Facebook and online privacy. Three questions were asked to
measure the degree of risks users perceive while using Facebook: “I’m worried that I may
encounter unwanted advances, stalking, or harassment on Facebook;” “I’m worried that I
may encounter damaging gossip or rumors on Facebook;” and “I’m worried that I may
encounter personal data stolen/abused by others on Facebook.”

33
Endogenous Predicted Variables from TCT
Based on TCT and previous literature, the constructs of attitude and satisfaction
were examined as the two endogenous predicted variables for the proposed model.
Attitude. Developed from Liao and colleagues’ (2009) study, four questions using
a 7-point Likert scale (disagree/agree) were asked to measure users’ general attitude
toward Facebook use: “Using Facebook would be a good idea;” “Using Facebook would
be a wise idea;” “I like the idea of using Facebook;” and “Using Facebook would be a
pleasant experience.”
Satisfaction. The questions for measuring users’ satisfaction with Facebook use
were adapted from Liao et al.’s (2009) study, which was originally developed by Spreng,
MacKenzie, and Olshavsky (1996). A statement was provided to the participants: “My
overall experience of Facebook use was ______.” Four 7-point semantic differential
scales (displeased/pleased, frustrated/contented, terrible/delighted, and
dissatisfied/satisfied) were used for measuring users’ satisfaction with Facebook use.
Dependent Variable
The dependent variable measured by this study is users’ continued intention of
Facebook use. Three questions using a 7-point Likert scale (disagree/agree) were
developed from Liao and colleagues’ (2009) study: “I intend to continue using Facebook
rather than discontinue its use;” “My intentions are to continue using Facebook rather
than using any alternative social media;” and “If I could, I would like to continue using
Facebook as much as possible.”

34
Demographic Information
Five questions concerning participants’ gender, age, ethnicity, education level, and
household income were also asked to gather basic demographic information.

35
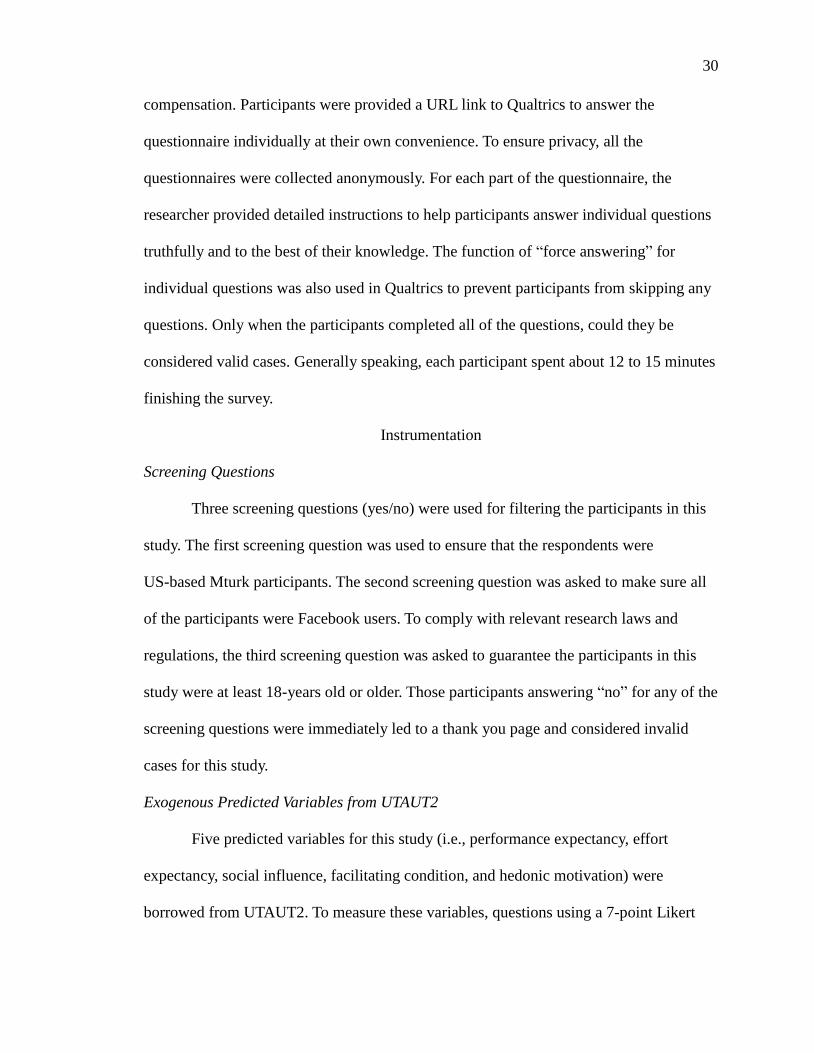
CHAPTER V
RESULTS
This study used IBM SPSS 22 and IBM SPSS Amos 22 to conduct a structural
equation modeling (SEM) analysis. According to Dwyer, Gill, and Seetaram (2012),
“structural equation modeling (SEM) is a statistical technique for testing and estimating
causal relations using a combination of statistical data and qualitative causal
assumptions” (p.3; this definition was originally formed by Judea Pearl in 2000). Because
“SEM may be used as a more powerful alternative to multiple regression, path analysis,
factor analysis, time series analysis, and analysis of covariance” (Garson, 2008), it
provides robust results compared to other statistical methods. For this study, the
researcher followed Anderson and Gerbing’s (1988) two-step modeling approach. For the
first step of the analysis, a measurement model was created to examine the validity (i.e.
convergent validity and discriminant validity) and reliability and to conduct a model fit
analysis. For the second step, a structural model was constructed to examine the
regression paths between the variables proposed in this study.
Descriptive Statistics
By examining the descriptive statistics of the data, 10 major themes can be
identified: 1) The participants in general had a slightly high performance expectancy on
Facebook (M: 4.643, SD: 1.538); 2) Users slightly agreed that using Facebook is not a
tough task for them (M: 4.521, SD: 1.437); 3) Generally speaking, participants strongly
believed that their family or close friends think they should use Facebook (M: 6.132, SD:
0.912); 4) The participants’ knowledge, technology, and environment strongly supported
their Facebook use (M: 5.987, SD: 1.110); 5) Users slightly agreed that they use

36
Facebook for their hedonic motivation (M: 5.133, SD: 1.390); 6) In general, participants
slightly distrusted Facebook (M: 3.853, SD: 1.652); 7) The participants had slightly low
perceived risks when using Facebook (M: 3.964, SD: 1.697); 8) Users had a slightly
positive attitude toward Facebook (M: 4.881, SD: 1.404); 9) Users were slightly satisfied
with Facebook (M: 5.006, SD: 1.453); and 10) Generally speaking, participants slightly
agreed that they will continue using Facebook (M: 4.906, SD: 1.537; see Table 5).
Table 5
Descriptive Statistics
Construct Item Question M SD
Performance
Expectancy (PE) PE1 I find Facebook useful in my daily life. 4.653 1.551
PE2 Using Facebook increases my chances of connecting
people that are important to me. 5.142 1.460
PE3 Using Facebook increases my chances of obtaining
information that are important to me. 5.022 1.427
PE4 Using Facebook increases my efficiency in everyday life 3.753 1.714
4.643 1.538
Effort
Expectancy (EE) EE1 Learning how to use Facebook is easy for me. 4.518 1.450
EE2 I find Facebook easy to use. 4.391 1.490
EE3 It is easy for me to become skillful at using Facebook. 4.653 1.371
4.521 1.437
Social Influence
(SI)
SI1
People who are important to me think that I should use
Facebook. 6.144 0.915
SI2
People who influence my behavior think that I should use
Facebook. 6.142 0.923
SI3 People whose opinions that I value prefer I use
Facebook. 6.111 0.898
6.132 0.912
Facilitating
Condition (FC)
FC1
I have the technologies necessary (e.g. computer or
smartphone) to use Facebook. 6.244 1.077
FC2 I have the knowledge necessary to use Facebook. 6.233 0.986
FC3 Facebook is compatible with other technologies I use. 6.064 1.046
FC4 I can get help from others when I have difficulties using
Facebook. 5.407 1.329
5.987 1.110

37
Table 5 (continued).
Construct Item Question M SD
Hedonic
Motivation (HM) HM1 Using Facebook is fun. 5.127 1.351
HM2 Using Facebook is enjoyable. 5.189 1.347
HM3 Using Facebook is very entertaining. 5.082 1.471
5.133 1.390
Trust Trust1 Facebook is a trustworthy social network. 4.262 1.591
Trust2 I can count on Facebook to protect my privacy. 3.660 1.690
Trust3
I can count on Facebook to protect customers’ personal
information from unauthorized use. 3.724 1.683
Trust4 Facebook can be relied on to keep its promises. 3.764 1.644
3.853 1.652
Perceived Risks
(PR)
PR1
I’m worried that I may encounter unwanted advances,
stalking, or harassment on Facebook. 3.649 1.716
PR2 I’m worried that I may encounter damaging gossip or
rumors on Facebook. 3.751 1.704
PR3 I’m worried that I may encounter personal data
stolen/abused by others on Facebook. 4.438 1.670
3.964 1.697
Attitude (ATT) ATT1 Using Facebook would be a good idea. 4.936 1.351
ATT2 Using Facebook would be a wise idea. 4.540 1.395
ATT3 I like the idea of using Facebook. 4.998 1.458
ATT4 Using Facebook would be a pleasant experience. 5.049 1.410
4.881 1.404
Satisfaction (S) S1
My overall experience of Facebook use was
displeased/pleased. 5.142 1.427
S2 My overall experience of Facebook use was
frustrated/contented. 4.980 1.501
S3 My overall experience of Facebook use was
terrible/delighted. 4.882 1.364
S4 My overall experience of Facebook use was
dissatisfied/satisfied. 5.020 1.518
5.006 1.453
Continuance
Intention (CI)
CI1
I intend to continue using Facebook rather than
discontinue its use. 5.280 1.396
CI2
My intentions are to continue using Facebook than use
any alternative social media. 4.933 1.548
CI3 If I could, I would like to continue using Facebook as
much as possible. 4.504 1.668
4.906 1.537

38
Validity and Reliability Measures
Convergent Validity
According to Hair, Black, Babin, Anderson, and Tatham’s (2006) definition,
convergent validity is “the extent to which indicators of a specific construct converge or
share a high proportion of variance in common” (p. 771). After cleaning the data in IBM
SPSS 22, the researcher created a measurement model in IBM SPSS Amos 22 (see Figure
5). Followed by Hair et al. (2006), Kline (2011), and Schumacker, and Lomax’s (2004)
suggestions, the researcher examined the factor loading for each measurement item and
calculated the average variance extracted (AVE) and composite reliability (CR) values to
ensure the convergent validity for the measurement model. As can be seen from Table 6,
the factor loadings for all the measurement items ranged from 0.715 to 0.965 (after
deleting those items below .70), which are all greater than the threshold value of .70. The
AVE values for the constructs also meet the threshold requirement (> .50), ranging
from .764 to .982. For CR values, all the constructs are above the minimum threshold
of .60. The examination of factor loading, AVE, and CR values indicates the convergent
validity was met by the proposed model (for details, see Table 6).

39
Figure 5. Measurement Model in IBM SPSS Amos 22
Table 6
Convergent Validity
Construct/Factor Item Standardized
Loading
Average variance
extracted (AVE)
Composite
reliability (CR)
Reliability
(Alpha Value)
Performance
Expectancy (PE)
PE1
PE2
.874
.715
0.885 0.939 .768

40
Table 6 (continued).
Construct/Factor Item Standardized
Loading
Average variance
extracted (AVE)
Composite
reliability (CR)
Reliability
(Alpha Value)
Effort Expectancy
(EE)
EE1
EE2
EE3
.910
.926
.830
0.947 0.982 .918
Social Influence
(SI)
SI1
SI2
SI3
.908
.938
.870
0.982 0.990 .932
Facilitating
Condition (FC)
FC1
FC2
FC3
.828
.964
.762
0.959 0.986 .886
Hedonic
Motivation (HM)
HM1
HM2
HM3
.955
.965
.879
0.975 0.991 .840
Trust Trust1
Trust2
Trust3
Trust4
.829
.964
.972
.925
0.964 0.991 .958
Perceived Risks
(PR)
PR1
PR2
.841
.888
0.764 0.866 .855
Attitude (ATT) ATT1
ATT2
ATT3
.805
.934
.943
0.962 0.987 .895
Satisfaction (S) S1
S2
S3
.908
.938
.870
0.948 0.982 .896
Continuance
Intention (CI)
CI1
CI2
CI3
.806
.807
.875
0.914 0.970 .870
Discriminant Validity
According to Hair et al.’s (2006) definition, discriminant validity is “the extent to
which a construct is truly distinct from other construct” (p. 771). Followed by Hair and
colleagues (2006), Kline (2011), and Schumacker, and Lomax’s (2004) suggestion,
discriminant validity was tested by comparing the square root of the AVE of a specific
construct (the bold numbers in Table 7) to the factor correlation coefficients between the
specific construct and other constructs. The results show the square root of the AVE for
each construct is greater than its correlation coefficients with other constructs, indicating
a good discriminant validity for the proposed model.

41
Table 7
Discriminant Validity
Construct PE EE SI FC HM Trust PR ATT S CI
PE
EE
SI
FC
HM
Trust
PR
ATT
S
CI
0.940
0.515
0.258
0.212
0.700
0.477
-0.049
0.735
0.704
0.865
0.973
0.066
0.007
0.425
0.344
0.009
0.428
0.374
0.393
0.991
0.444
0.312
0.147
-0.076
0.299
0.293
0.246
0.979
0.126
-0.009
-0.149
0.108
0.193
0.185
0.987
0.496
-0.028
0.941
0.809
0.717
0.982
-0.238
0.550
0.651
0.537
0.874
-0.113
-0.189
-0.138
0.981
0.845
0.757
0.974
0.767
0.956
Reliability
According to Hair and colleagues’ (2006) definition, reliability is “an assessment
of the degree of consistency between multiple measurements of a variable” (p. 137). This
study used Cronbach’s alpha to examine reliability because it is considered the most
common measurement among many other reliability statistics. The Cronbach’s alpha
reliability for the constructs of PE, EE, SI, FC, HM, Trust, PR, ATT, S, and CI were
calculated using IBM SPSS 22. The results showed the coefficients for Cronbach’s alpha
range from .84 to .96 for the constructs of EE, SI, FC, HM, Trust, PR, ATT, S, and CI,
indicating a high internal consistency. The construct of PE had an acceptable internal
consistency with .77 for Cronbach’s alpha. Overall, the measurement items for individual
constructs are considered reliable based on the threshold value of .70 suggested by
Hatcher and Stepanski (1994; for details, see Table 6).
Examination of Model Fit
According to El-Hajjar (2014), “the goodness-of-fit of a statistical model
describes how well it fits a set of observations” (p. 233). Researchers usually compare the
observed values of a set of indices to the recommended values to determine the

42
goodness-of-fit of a proposed model (Hair et al., 2006; Kline, 2011; Schumacker &
Lomax, 2004). To examine the measurement model fit, a list of goodness-of-fit indices
were used for comparison based on the suggestions by Hair et al. (2006), Kline (2011),
and Schumacker and Lomax (2004). These indices include three major types: 1) absolute
fit indices: chi-squared/df (the ratio between the chi-square and degrees of freedom), GFI
(Goodness of Fit Index), AGFI (Adjusted Goodness of Fit Index), and RMSEA (Root
Mean Square Error of Approximation); 2) incremental fit indices: NFI (Normed Fit
Index), RFI (Relative Fit Index), IFI (Incremental Fit Index), TLI (Tucker-Lewis Index),
CFI (Comparative Fit Index); and 3) parsimonious fit indices: PCFI (Parsimony
Comparative Fit Index), PNFI (Parsimonious Normed-Fit Index). The results indicate that
the proposed model has a good fit to the collected data when rounding the actual values
of indices to one decimal place. Table 8 shows the recommended value and actual value
for individual indices.
Table 8
Fit Indices for the Measurement Model
Goodness-of-fit indices Recommended value Actual value
Absolute fit indices χ2/df <3 2.263
GFI >0.90 0.893
AGFI >0.80 0.860
RMSEA <0.08 0.053
Incremental fit indices NFI >0.90 0.943
RFI >0.90 0.930
IFI >0.90 0.967
TLI >0.90 0.960
CFI >0.90 0.967
Parsimonious fit indices PCFI >0.50 0.791
PNFI >0.50 0.777

43
Hypotheses Testing
For the second step of the data analysis, the researcher drew all the paths
hypothesized by this study to construct a structural model in IBM SPSS Amos 22 (see
Figure 6). As can be seen from Figure 7, 12 out of 17 paths were supported at a
significance level of .05. One path was marginally supported at an alpha value of .10.
Attitude is influenced by satisfaction (β = .158), performance expectancy (β = .137),
facilitating conditions (β = -.055), hedonic motivation (β = .713), and perceived risks (β =
-.060). Satisfaction is affected by performance expectancy (β = .238), effort expectancy
(β = .075, p = .068), facilitating conditions (β = .075), hedonic motivation (β = .515),
trust (β = .289), and perceived risks (β = -.086). Continuance intention is predicted by
attitude (β = .374) and satisfaction (β = .464). The R2 value shows that the model explains
92% of the variance in users’ attitude toward Facebook, 79% of the variance in users’
satisfaction with Facebook, and 65% of the variance in users’ intention to continue using
Facebook. Table 9 shows a summary table of the hypotheses testing in this study.

44
Figure 6. Structural Model in IBM SPSS Amos 22

45
0.238***
-0.006
-0.007
0.015
0.289***
0.515***
0.713***
0.075*
-0.055*
-0.086**
Performance Expectancy (PE)
Effort Expectancy (EE)
Facilitating Condition (FC)
Hedonic Motivation (HM)
Attitude (ATT) (R2= 0.918)
Satisfaction (S) (R2= 0.786)
Continuance Intention (CI)
(R2= 0.649)
.0.137**
0.012 Social Influence (SI)
-0.060*
Trust
Perceived Risks (PR)
0.158**
0.374***
0.464***
-0.063+
*p<0.05; **p<0.01; ***p<0.001. +
p<0.10
Figure 7. Structural Model
Table 9
Hypotheses Testing
Hypothesis Path β t p Result
H1 ATT CI 0.374 4.990 *** Supported
H2 S CI 0.464 5.993 *** Supported
H3 S ATT 0.158 3.075 0.002 Supported
H4a PE ATT 0.137 3.175 0.001 Supported
H4b PE S 0.238 4.259 *** Supported
H5a EE ATT -0.007 -0.268 0.789 Not Supported
H5b EE S -0.063 -1.822 0.068 Marginally Supported
H6a SI ATT 0.012 0.521 0.602 Not Supported
H6b SI S -0.006 -0.186 0.853 Not Supported
H7a FC Att -0.055 -2.280 0.023 Supported
H7b FC S 0.075 2.291 0.022 Supported
H8a HM ATT 0.713 15.539 *** Supported
H8b HM S 0.515 10.146 *** Supported
H9a Trust ATT 0.015 0.520 0.603 Not Supported
H9b Trust S 0.289 7.975 *** Supported
H10a PR ATT -0.060 -2.588 0.010 Supported
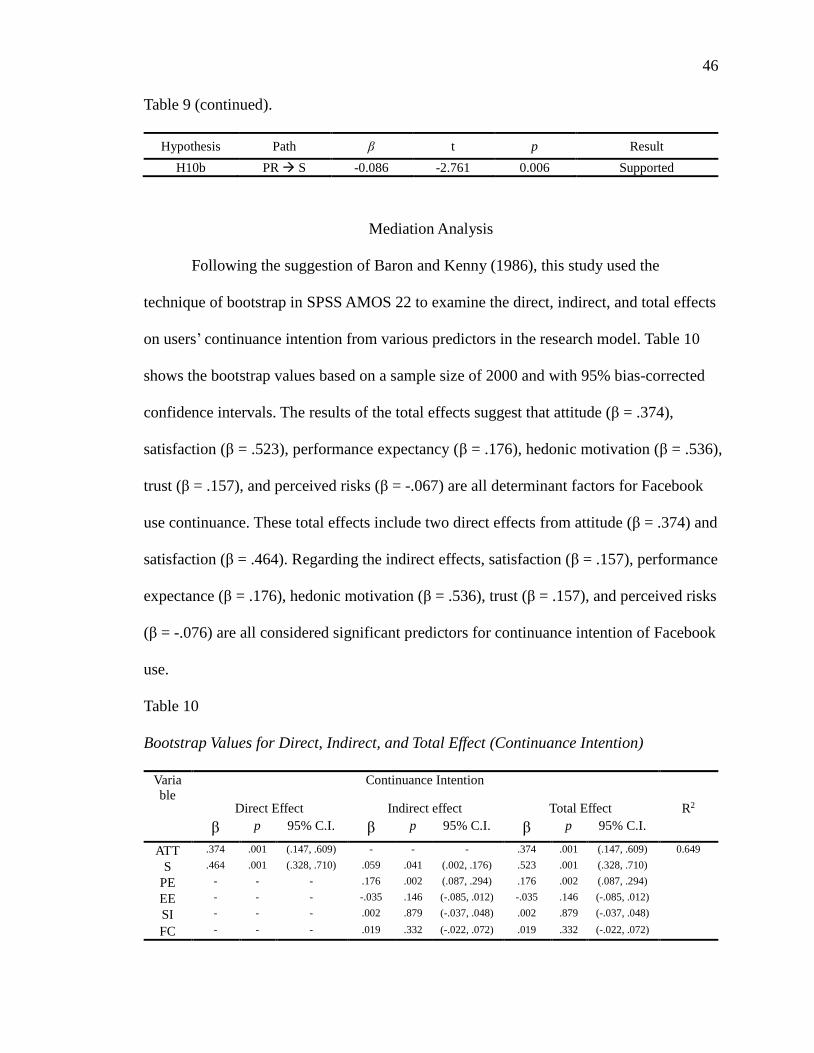
46
Table 9 (continued).
Hypothesis Path β t p Result
H10b PR S -0.086 -2.761 0.006 Supported
Mediation Analysis
Following the suggestion of Baron and Kenny (1986), this study used the
technique of bootstrap in SPSS AMOS 22 to examine the direct, indirect, and total effects
on users’ continuance intention from various predictors in the research model. Table 10
shows the bootstrap values based on a sample size of 2000 and with 95% bias-corrected
confidence intervals. The results of the total effects suggest that attitude (β = .374),
satisfaction (β = .523), performance expectancy (β = .176), hedonic motivation (β = .536),
trust (β = .157), and perceived risks (β = -.067) are all determinant factors for Facebook
use continuance. These total effects include two direct effects from attitude (β = .374) and
satisfaction (β = .464). Regarding the indirect effects, satisfaction (β = .157), performance
expectance (β = .176), hedonic motivation (β = .536), trust (β = .157), and perceived risks
(β = -.076) are all considered significant predictors for continuance intention of Facebook
use.
Table 10
Bootstrap Values for Direct, Indirect, and Total Effect (Continuance Intention)
Varia
ble
Continuance Intention
Direct Effect Indirect effect Total Effect R2
β p 95% C.I. β p 95% C.I. β p 95% C.I.
ATT .374 .001 (.147, .609) - - - .374 .001 (.147, .609) 0.649
S .464 .001 (.328, .710) .059 .041 (.002, .176) .523 .001 (.328, .710)
PE - - - .176 .002 (.087, .294) .176 .002 (.087, .294)
EE - - - -.035 .146 (-.085, .012) -.035 .146 (-.085, .012)
SI - - - .002 .879 (-.037, .048) .002 .879 (-.037, .048)
FC - - - .019 .332 (-.022, .072) .019 .332 (-.022, .072)

47
Table 10 (continued).
Variable Continuance Intention
Direct Effect Indirect effect Total Effect R2
β p 95% C.I. β p 95% C.I. β p 95% C.I.
HM - - - .536 .000 (.420, .640) .536 .000 (.420, .640) 0.649
Trust - - - .157 .001 (.092, .224) .157 .001 (.092, .224)
PR - - - -.067 .003 (-.115, -.023) -.067 .003 (-.115, -.023)

48
CHAPTER VI
DISCUSSION
Discussion of Results
This theory-driven study establishes a new continuance model for Facebook use,
explaining 65% of the variance for Facebook users’ continuance intention. The results
suggest the following five major findings:
1. Users’ attitude toward Facebook (β = .374, p < .001) and satisfaction with Facebook
use (β = .464, p < .001) are the two strongest predictors for their continuance
intention.
2. Users’ satisfaction with Facebook use affects their attitude toward Facebook (β = .158,
p < .05), which indirectly influences their continuance intention of Facebook use (β
= .059, p < .05, 95% C.I. = .002, .176).
3. Users’ performance expectancy, hedonic motivation, and perceived risks directly
influence their attitude toward Facebook (performance expectancy: β = .137, p < .01;
hedonic motivation: β = .713, p < .001; perceived risks: β = -.060, p < .05) and
satisfaction with Facebook use (performance expectancy: β = .238, p < .01; hedonic
motivation: β = .515, p < .001; perceived risks: β = -.086, p < .01), which later affect
users’ Facebook continuance intention (indirect effect from performance expectancy:
β = .176, p < .01, 95% C.I. = .087, .294; indirect effect from hedonic motivation: β
= .536, p < .001, 95% C.I. = .420, .640; and indirect effect from perceived risks: β =
-.067, p < .01, 95% C.I. = -.115, -.023).

49
4. Users’ trust in Facebook affects their satisfaction with Facebook use (β = .289, p
< .001), which later influences their continuance intention of Facebook use (indirect
effect from users’ trust: β = -.067, p < .01, 95% C.I. = .092, .224).
5. Although users’ facilitating condition does not influence their continuance intention,
it does predict users’ attitude toward Facebook (β = -.055, p < .05) and satisfaction
with Facebook use (β = .075, p < .005).
These results suggest that the theories applied in this study (i.e., UTAUT2, social
contract theory, and TCT) can be used to explain the continuance intention of Facebook
use, with only minor adjustments required to tailor the theories to the context of social
media research. Both theoretical ramifications and marketing implications are provided
and discussed in the rest of this chapter.
Theoretical Ramifications
The findings from this study are consistent with the TCT model, and a previous
study (Ho, 2010) in information system use continuance. For example, the total effects
for the structural model suggest that users’ attitude and satisfaction with Facebook are the
two strongest precursors for Facebook use continuance intention. The mediation analysis
also reveals both the direct and indirect effects from users’ satisfaction on continuance
intention. Regarding the indirect effect, users’ satisfaction with Facebook influences their
attitude toward Facebook, which later predicts users’ continuance intention of Facebook
use. Although the proposed research model in this study did not comprehensively test all
the assumptions by TCT, this study suggests the potential for the TCT model to be
extended to the context of social media research.
50
This study suggests UTAUT2 can help better understand users’ continued
intention of Facebook use. Because of social media’s unique characteristics compared to
other technology, a couple of constructs in UTAUT2 are not as strong predictors for
continued use as other literature suggests. Performance expectancy and hedonic
motivations from UTAUT2 are considered two determent predictors for continuance
intention of Facebook, mediated through users’ attitude toward Facebook and satisfaction
with Facebook use. This means that users continue using Facebook if they consider
Facebook useful or fun either for their everyday lives or jobs. However, when using
users’ attitude and satisfaction with Facebook as two mediating factors, this study did not
find any statistically significant influences from effort expectancy, social influence, and
facilitating conditions. It is possible that the prevalence of wireless internet and mobile
devices as well as the popularity of Facebook have decreased the influences from users’
effort expectancy and facilitating conditions. Since users’ mobile technology and prior
use experience has made Facebook use an effortless activity, users’ effort expectancy and
facilitating conditions may no longer predict their intention to continue using Facebook.
Users’ social influence, on the other hand, may be a strong predictor for users’ initial
adoption behavior of information technology (e.g., Venkatech et al., 2003; Venkatesh et
al., 2012) rather than continuance intention. Even so, users’ facilitating condition, based
on the measurement model, influences their attitude toward Facebook and satisfaction
with Facebook use; however, it is users’ attitude and satisfaction, rather than their
facilitation condition, that predict their continuance intention of Facebook use.
The results of this study also suggest that users’ continuance of Facebook is an
implicit social contract. When people use Facebook, they believe that Facebook is a

51
reliable social networking company and trust that Facebook would not use their personal
information for unauthorized purposes. Nevertheless, if Facebook breaks this social
contract with its users, people will have lower degrees of trust in this online social
networking platform. Facebook users’ levels of perceived risks will also likely soar
because they consider Facebook to be untrustworthy. In this respect, users’ trust and
perceived risks affect their attitude toward Facebook as well as their satisfaction with
Facebook use, which indirectly determine their continuance intention of Facebook. These
findings echo the results from previous literature that users’ perceived risks affect their
willingness to disclose personal information on Facebook (Krasnova et al., 2010). Users’
privacy concern on Facebook, therefore, has become one of the significant reasons for
users to discontinue their Facebook use (Stieger et al., 2013).
Practical and Marketing Implications
Based on the empirical findings in this study, several marketing and practical
suggestions are also provided to improve the business practices of social media
companies and marketers.
For social media companies and marketers, this study suggests that boosting
users’ positive attitude toward and satisfaction with Facebook would ensure their use
continuance intention. To ensure users’ positive attitude, social media companies are
suggested to enhance users’ satisfaction, performance expectancy, facilitating conditions,
and hedonic motivation. At the same time, users’ perceived risks need to be alleviated. On
the other hand, users’ satisfaction with Facebook use can be boosted by ensuring their
performance expectancy, effort expectancy, facilitating conditions, hedonic motivation,
and trust are met. Similarly, social media companies need to decrease users’ perceived
52
risks to ensure their satisfaction with Facebook. Other than enhancing users’ positive
attitude toward Facebook and satisfaction with Facebook use, increasing users’
performance expectancy, hedonic motivation, and trust, as well as decreasing their
perceived risks, would ensure users’ continuance intention, mediated through their
attitude toward and satisfaction with Facebook.
Based on the effect of performance expectancy, users are more likely to continue
using Facebook when they consider Facebook to be useful in their everyday lives or jobs.
This study therefore encourages social media companies to develop useful functions for
their users. For example, the birthday reminder is considered practical for most Facebook
users, as Facebook users will now not forget to send birthday wishes to their friends.
Based on the effect of the facilitating condition found by this study, social media
companies need to enhance their platform compatibility with different technological
platforms (e.g., Mac OX, PC Windows, Linex, etc.) or mobile devices (e.g., iPhone, iPad,
Android Phone, etc.) to increase users’ level of perceived facilitating conditions. Since
some users may still use old computer systems and out-dated browsers, or they do not
have the most up-to-date Java or Flash to appropriately display multi-media social media
platforms, social media companies may consider providing different versions of the sites
based on users’ system and browser capability. By doing so, more users will be able to
access the social media platforms even though they only have very basic technological
facilities. Based on the effect of hedonic motivation, social media companies are
encouraged to increase users’ fun and enjoyable experience while using social media. For
example, game applications have been widely applied by Facebook, which might explain
part of the reasons for why Facebook has been rated the most popular social networking
53
website. This study suggests that other social media platforms adopt a similar strategy to
provide a more fun and enjoyable experience for their users, which will enhance their use
continuance intention.
Last, this study suggests that the business integrity of social media companies and
users’ risk concerns play an important role in users’ continuance intention of social media.
Based on the effect of trust found in this study, social media companies may consider
enhancing users’ trust beliefs for using their platforms. To achieve this goal, up-to-date
terms and policies regarding how social media companies can utilize users’ personal
information for customized service are required. Social media companies also need to
keep their promises to behave properly and to protect users’ personal information from
unauthorized use. On the other hand, based on the effect of perceived risks, social media
companies should enhance their privacy protections to alleviate users’ risk concerns. In
addition to the use of an up-to-date encryption algorithm for the security of online
platforms, social media companies are strongly encouraged to perform data
anonymization before applying users’ personal information for targeted advertising and
marketing. When sharing information with third parties for services, no personally
identifiable information should be included or provided.

54
CHAPTER VII
LIMITATIONS AND FUTURE RESEARCH
Although this study creates a strong and holistic model for predicting Facebook
use continuance, the research has its limitations. Future research projects are encouraged
based on the following suggestions.
First, this study borrows constructs and develops its measure scales from other
research in the fields of ICT and information science. Because social media use may be
different from the adoption of communication technology, this discrepancy might cause
doubt about the validity of this study regarding what has been measured. Future studies
should conduct exploratory factor analyses to develop original scales as well as to modify
relevant psychological constructs based on the context of social media use. For example,
the construct of “effort expectancy” or “perceived effort” has been widely applied to ICT
adoption studies. When it comes to Facebook, already having a high penetration rate in
the United States, no one really needs to take the effort to use it. Nevertheless, to use
Facebook and to be proficient in using it might be different for different users. Some
people use Facebook without the ability to manage their content and privacy settings,
which may be a potential factor affecting their willingness to continue using Facebook.
Second, this study uses the two endogenous variables of attitude and satisfaction
to provide a holistic understanding of Facebook use continuance. However, the indirect
effects from various exogenous variables are not distinguished regarding whether they are
mediated through attitude or satisfaction. For example, the results of this study suggest
that perceived risks affect use continuance intention, mediated through users’ attitude
toward and satisfaction with Facebook. More studies are required to explore whether this
55
mediation effect is mainly from attitude or satisfaction, or maybe both. The influence of
attitude on satisfaction also needs further exploration. Because the difference between
users’ attitude and satisfaction may affect the inferred implications of the structural model,
future research is needed to examine the mediating roles of attitude and satisfaction more
carefully.
Third, although Facebook is one of the most popular social networking sites, it
might not be a good representative for other social media platforms, such as Twitter,
Instagram, Google Plus, etc. As more and more alternative social networking sites
become more popular and reach large numbers of users, follow-up research projects may
apply a similar research model for examining other social media platforms as well as
comparing the similar and contradictory results among different social media outlets.
This type of cross-platform research will enrich our understanding of social media use
continuance both at the theoretical and practical levels. As modern advertisers and
marketers target their customers through multiple social media platforms simultaneously,
it is essential for researchers to examine multiple social networking sites as a whole
rather than focus on one single social media company.
Fourth, the nature of social media is globalized and geographically boundless. As
advertisers and marketers utilize social media to target customers all around the world, it
is imperative for researchers to continue exploring overseas users from diverse cultural
backgrounds or geographical areas. To better understand universal users’ social media use
continuance, studies must take cultural factors, which have not been fully explored by the
existing social media literature and the present study, into consideration.

56
APPENDIX A
IRB APPROVAL LETTER
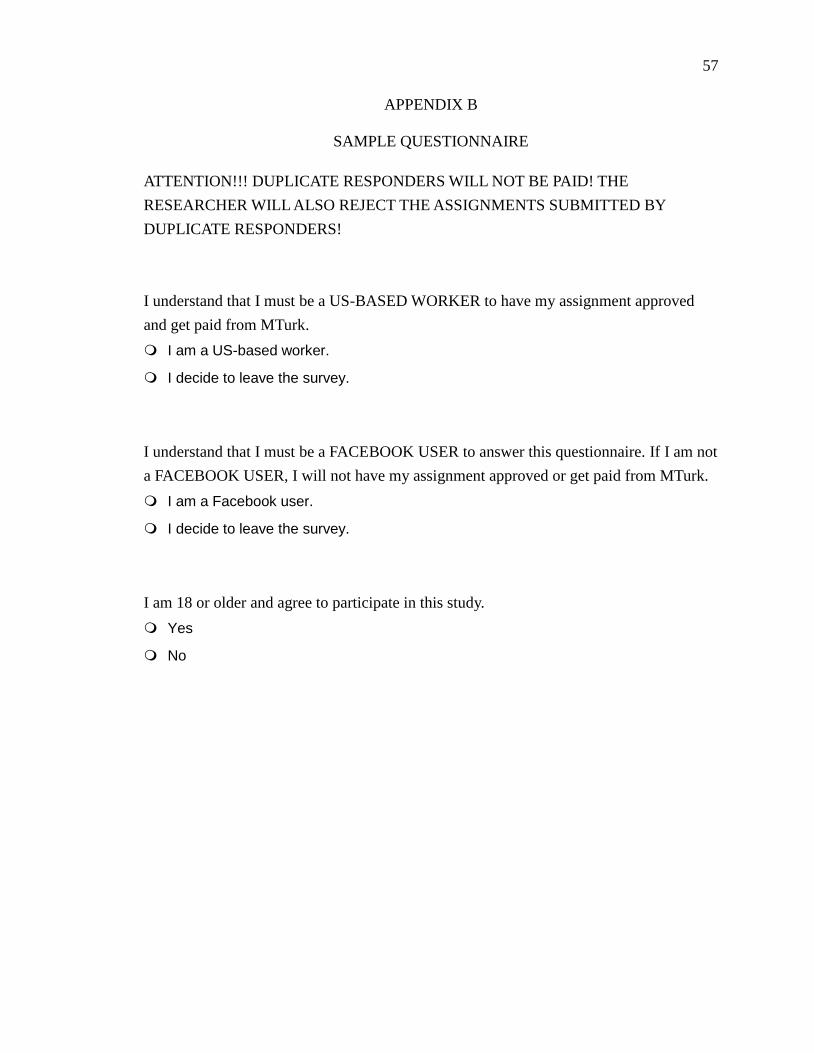
57
APPENDIX B
SAMPLE QUESTIONNAIRE
ATTENTION!!! DUPLICATE RESPONDERS WILL NOT BE PAID! THE
RESEARCHER WILL ALSO REJECT THE ASSIGNMENTS SUBMITTED BY
DUPLICATE RESPONDERS!
I understand that I must be a US-BASED WORKER to have my assignment approved
and get paid from MTurk.
I am a US-based worker.
I decide to leave the survey.
I understand that I must be a FACEBOOK USER to answer this questionnaire. If I am not
a FACEBOOK USER, I will not have my assignment approved or get paid from MTurk.
I am a Facebook user.
I decide to leave the survey.
I am 18 or older and agree to participate in this study.
Yes
No
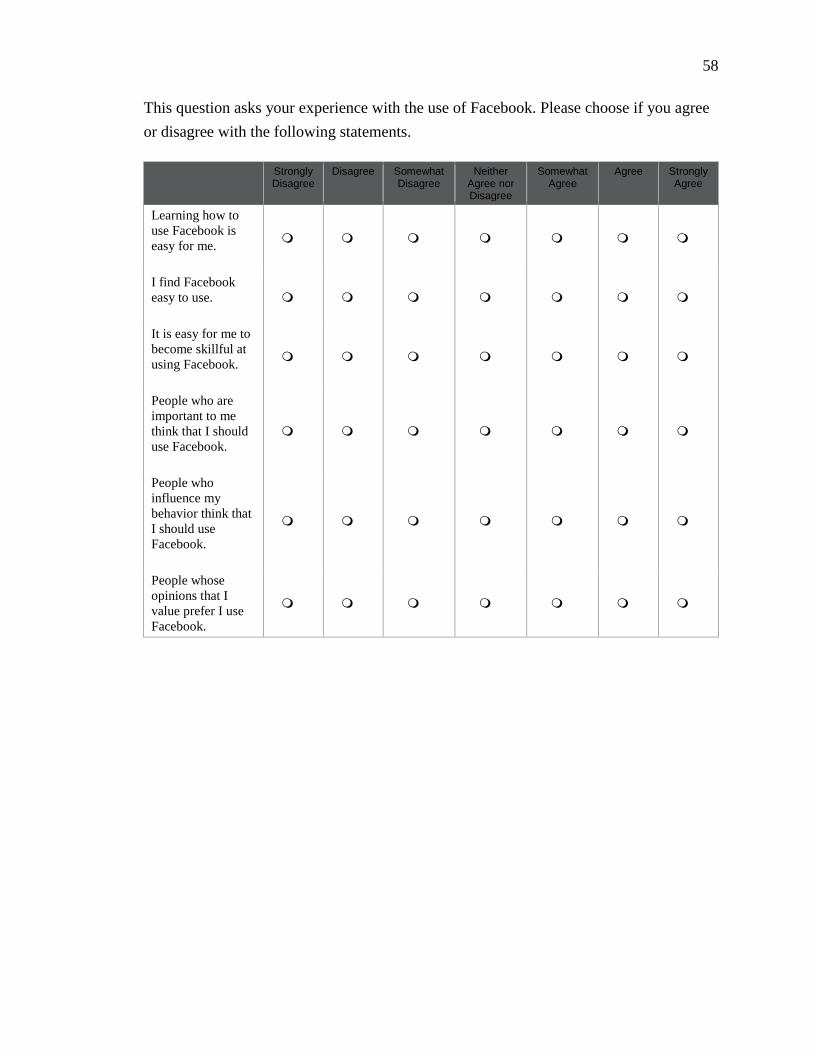
58
This question asks your experience with the use of Facebook. Please choose if you agree
or disagree with the following statements.
Strongly Disagree
Disagree Somewhat Disagree
Neither Agree nor Disagree
Somewhat Agree
Agree Strongly Agree
Learning how to
use Facebook is
easy for me.
I find Facebook
easy to use.
It is easy for me to
become skillful at
using Facebook.
People who are
important to me
think that I should
use Facebook.
People who
influence my
behavior think that
I should use
Facebook.
People whose
opinions that I
value prefer I use
Facebook.
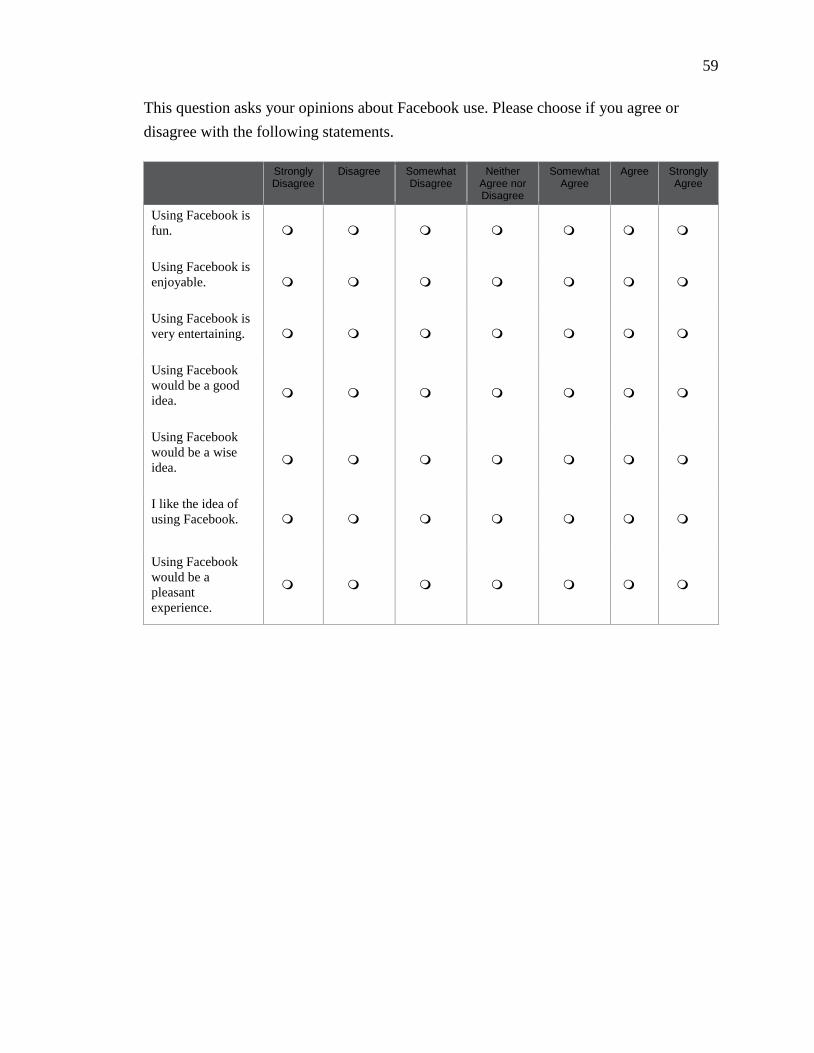
59
This question asks your opinions about Facebook use. Please choose if you agree or
disagree with the following statements.
Strongly Disagree
Disagree Somewhat Disagree
Neither Agree nor Disagree
Somewhat Agree
Agree Strongly Agree
Using Facebook is
fun.
Using Facebook is
enjoyable.
Using Facebook is
very entertaining.
Using Facebook
would be a good
idea.
Using Facebook
would be a wise
idea.
I like the idea of
using Facebook.
Using Facebook
would be a
pleasant
experience.

60
Please choose the bubble that best represents how you feel about each statement.
Strongly Disagree
Disagree Somewhat Disagree
Neither Agree nor Disagree
Somewhat Agree
Agree Strongly Agree
I use Facebook to
post a message on
my friend’s wall.
I use Facebook to
occupy my time.
I use Facebook to
find more interesting
people than in real
life.
I use Facebook to
read other people’s
profiles.
I use Facebook to
have fun.
I use Facebook when
no one to talk or be
with.
I use Facebook to
organize or join
events.
I use Facebook to
share / post
photographs.
I use Facebook to use
applications.
I use Facebook to
meet new people.
I use Facebook to
view other people’s
friends.
I use Facebook to see
what people have put
as their status.

61
This question asks your Facebook usage. Please choose if you agree or disagree with the
following statements.
Strongly Disagree
Disagree Somewhat Disagree
Neither Agree nor Disagree
Somewhat Agree
Agree Strongly Agree
The use of Facebook
has become a habit
for me.
I am addicted to
using Facebook.
I must use Facebook.
Using Facebook has
become natural to
me.
I have the
technologies
necessary (e.g.
computer or
smartphone) to use
Facebook.
I have the knowledge
necessary to use
Facebook.
Facebook is
compatible with
other technologies I
use.
I can get help from
others when I have
difficulties using
Facebook.

62
This question asks your perceptions of Facebook use. Please choose if you agree or
disagree with the following statements.
Strongly Disagree
Disagree Somewhat Disagree
Neither Agree
nor Disagree
Somewhat Agree
Agree Strongly Agree
I intend to continue
using Facebook rather
than discontinue its use.
My intentions are to
continue using
Facebook than use any
alternative social
media.
If I could, I would like
to continue using
Facebook as much as
possible.
I find Facebook useful
in my daily life.
Using Facebook
increases my chances
of connecting people
that are important to
me.
Using Facebook
increases my chances
of obtaining
information that are
important to me.
Using Facebook
increases my efficiency
in everyday life.

63
Please choose the bubble that best represents how you feel about each statement.
Strongly Disagree
Disagree Somewhat Disagree
Neither Agree nor Disagree
Somewhat Agree
Agree Strongly Agree
I use Facebook to
send a message to a
friend.
I use Facebook to
pass time when I feel
bored.
I use Facebook to
develop romantic
relationship.
I use Facebook to see
other people’s
pictures.
I use Facebook
because it is cool.
I use Facebook to
feel less lonely.
I use Facebook to
join groups.
I use Facebook to tag
photos.
I use Facebook to
play games.
I use Facebook for
advanced search to
look for specific
types of people.
I use Facebook to
look at the profiles of
people I don’t know.
I use Facebook to
update my own
status.
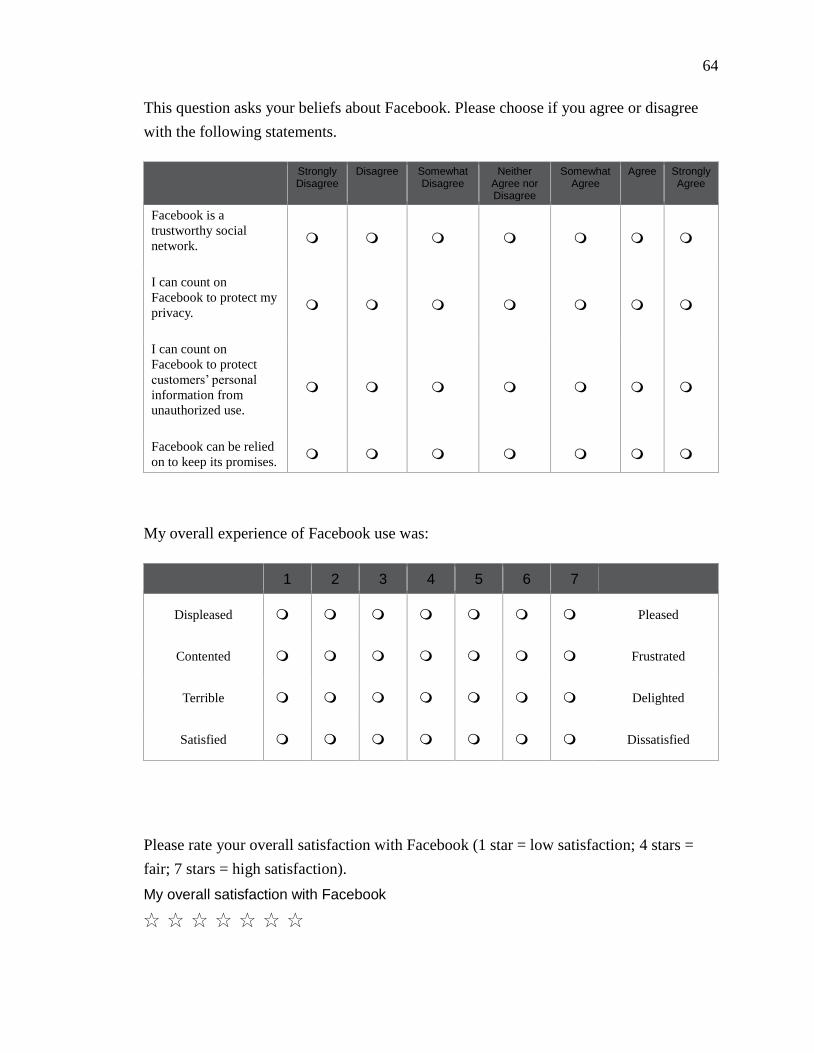
64
This question asks your beliefs about Facebook. Please choose if you agree or disagree
with the following statements.
Strongly Disagree
Disagree Somewhat Disagree
Neither Agree nor Disagree
Somewhat Agree
Agree Strongly Agree
Facebook is a
trustworthy social
network.
I can count on
Facebook to protect my
privacy.
I can count on
Facebook to protect
customers’ personal
information from
unauthorized use.
Facebook can be relied
on to keep its promises.
My overall experience of Facebook use was:
1 2 3 4 5 6 7
Displeased Pleased
Contented Frustrated
Terrible Delighted
Satisfied Dissatisfied
Please rate your overall satisfaction with Facebook (1 star = low satisfaction; 4 stars =
fair; 7 stars = high satisfaction).
My overall satisfaction with Facebook
☆ ☆ ☆ ☆ ☆ ☆ ☆
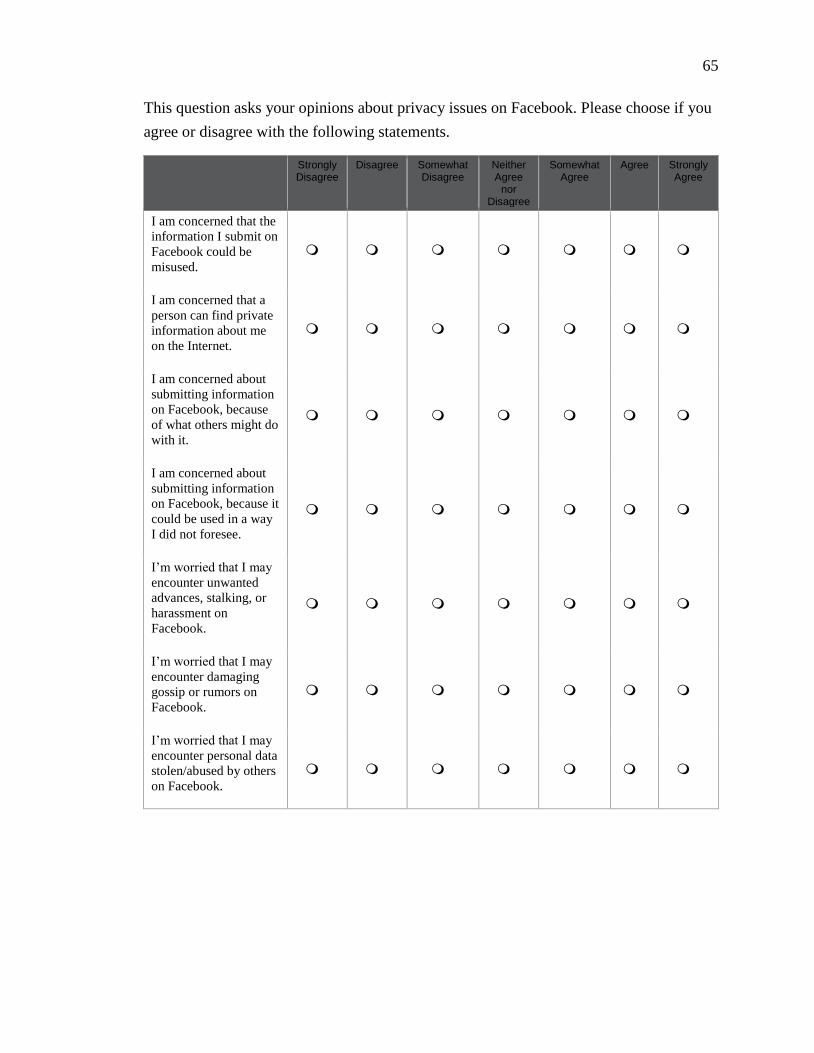
65
This question asks your opinions about privacy issues on Facebook. Please choose if you
agree or disagree with the following statements.
Strongly Disagree
Disagree Somewhat Disagree
Neither Agree
nor Disagree
Somewhat Agree
Agree Strongly Agree
I am concerned that the
information I submit on
Facebook could be
misused.
I am concerned that a
person can find private
information about me
on the Internet.
I am concerned about
submitting information
on Facebook, because
of what others might do
with it.
I am concerned about
submitting information
on Facebook, because it
could be used in a way
I did not foresee.
I’m worried that I may
encounter unwanted
advances, stalking, or
harassment on
Facebook.
I’m worried that I may
encounter damaging
gossip or rumors on
Facebook.
I’m worried that I may
encounter personal data
stolen/abused by others
on Facebook.

66
How many YEARS have you used Facebook?
_________ year(s)
How many DAYS do you use Facebook on a weekly basis?
1 day
2 days
3 days
4 days
5 days
6 days
7 days
How many TIMES do you use Facebook on a daily basis?
_________ time(s)
How many MINUTES do you usually spend on Facebook on a daily basis?
_________ minute(s)
How often do you update your status on Facebook?
Never
Rarely
Sometimes
Often
All of the Time

67
How many friends do you have on Facebook? (You may have to check your Facebook
account to answer this question.)
_________
What country do you currently live in?
_________
What is your gender?
Male
Female
What is your age?
Under 18 years
18 to 24 years
25 to 34 years
35 to 44 years
45 to 54 years
55 to 64 years
Age 65 or older
What Is your ethnicity?
White
Black or African American
Hispanic or Latino
Native American or American Indian
Asian
Native Hawaiian and Other Pacific Islander
Other race
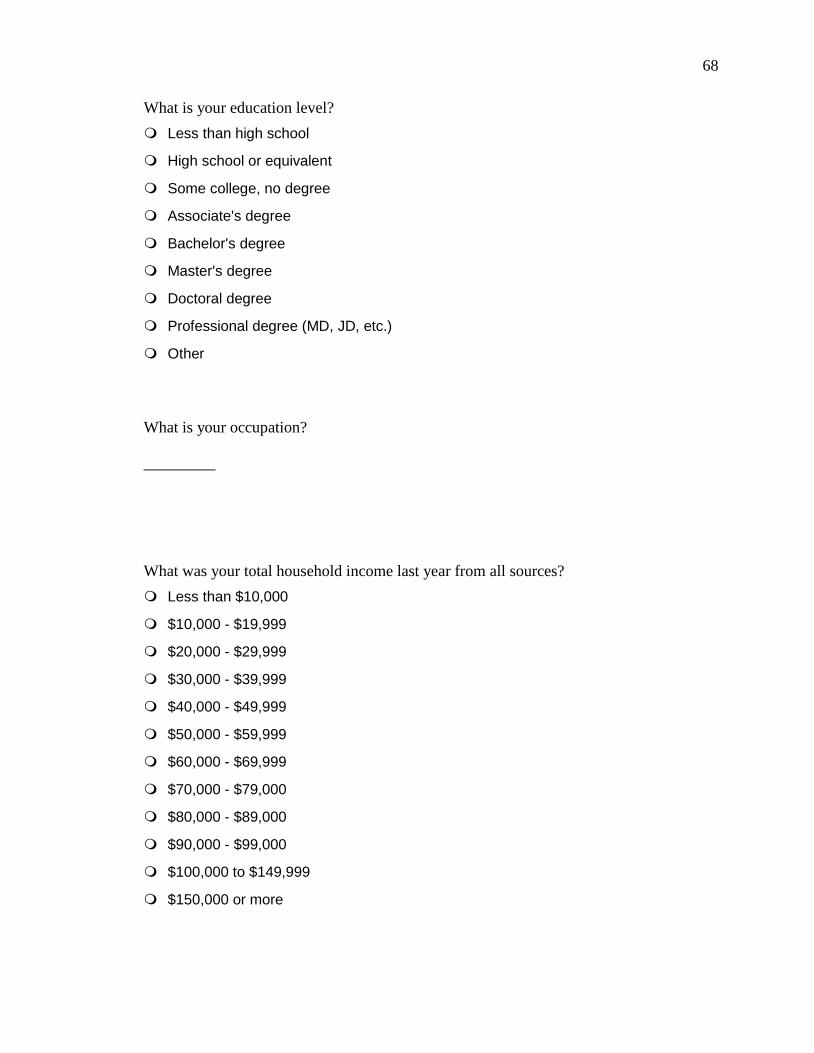
68
What is your education level?
Less than high school
High school or equivalent
Some college, no degree
Associate's degree
Bachelor's degree
Master's degree
Doctoral degree
Professional degree (MD, JD, etc.)
Other
What is your occupation?
_________
What was your total household income last year from all sources?
Less than $10,000
$10,000 - $19,999
$20,000 - $29,999
$30,000 - $39,999
$40,000 - $49,999
$50,000 - $59,999
$60,000 - $69,999
$70,000 - $79,000
$80,000 - $89,000
$90,000 - $99,000
$100,000 to $149,999
$150,000 or more

69
REFERENCES
Ajzen, I. (2002). Residual effects of past on later behavior: Habituation and reasoned
action perspectives. Personality & Social Psychology Review, 6(2), 107-122.
Ajzen, I., & Fishbein, M. (2005). The influence of attitudes on behavior. In D. Albarracín,
B. T. Johnson & M. P. Zanna (Eds.), The handbook of attitudes (pp. 173-221).
Mahwah, NJ: Erlbaum.
Alawan, A. A., Dwivedi, Y. K., & Williams, M. D. (2013). Adoption of self-service
technology by Jordanian customers. Proceedings of Swansea University Business
School Postgraduate Research Conference (pp.8-16). Swansea, Wales, United
Kingdom.
Anderson, J. C., & Gerbing, D. W. (1988). Structural equation modeling in practice: A
review and recommended two-step approach. Psychological Bulletin, 103(3),
411-423.
Ang, S. H., Cheng, P. S., Lim, A. C., & Tambyah, S. K. (2001). Spot the difference:
Consumer responses towards counterfeits. Journal of Consumer Marketing, 18(3),
219-235.
Baron, R. M., & Kenny, D. A. (1986). The moderator-mediator variable distinction in
social psychological research: Conceptual, strategic, and statistical considerations.
Journal of Personality and Social Psychology, 51(6), 1173.
Bolton, R. N., & Drew, J. H. (1991). A longitudinal analysis of the impact of service
changes on customer attitudes. Journal of Marketing, 55(1), 1-9.

70
Bonsón, E., Escobar, T., & Ratkai, M. (2014). Testing the inter-relations of factors that
may support continued use intention: The case of Facebook. Social Science
Information, 53(3), 293-310.
Brown, S. A., & Venkatesh, V. (2005). Model of adoption of technology in the household:
A baseline model test and extension incorporating household life cycle. MIS
Quarterly, 29(3), 399-426.
Buhrmester, M., Kwang, T., & Gosling, S. (2011). Amazon’s Mechanical Turk A New
Source of Inexpensive, Yet High-Quality, Data? Perspectives on Psychological
Science, 6(1), 3-5.
Chan, K. Y., Gong, M., Xu, Y., & Thong, J. Y. L. (2008). Examining user acceptance of
SMS: An empirical study in China and Hong Kong. PACIS 2008 Proceedings
(paper 294). Suzhou, China.
Chang, C.-W., & Heo, J. (2014).Visiting theories that predict college students’
self-disclosure on Facebook. Computers in Human Behavior, 30(1), 79-86.
Childers, T. L., Carr, C. L., Peck, J., & Carson, S. (2001). Hedonic and utilitarian
motivations for online retail shopping behavior. Journal of Retailing, 77(4),
511-535.
Chong, A. Y.-L., & Ngai, E. T. W. (2013). What influences travelers’ adoption of a
location-based social media service for their travel planning? PACIS 2013
Proceedings (paper 210). Jeju Island, Korea.
Churchill, G. A., & Suprenant, C. (1982). An investigation into the determinants of
customer satisfaction. Journal of Marketing Research, 19(4), 491-504.

71
Culnan, M. J., & Armstrong, P. K. (1999). Information privacy concerns, procedural
fairness, and impersonal trust: An empirical investigation. Organization Science,
10(1), 104-115.
Cutler, K. (2013). Facebook’s Q4 revenue rises 40% to $1.59B, shares down slightly in
after-hours. Retrieved from
http://techcrunch.com/2013/01/30/facebooks-q4-revenue-rises-40-to-1-59b-shares-
decline-7-percent-in-after-hours/
Davis, F. D., Bagozzi, R. P., & Warshaw, P. R. (1989). User acceptance of computer
technology: A comparison of two theoretical models. Management Science, 35(8),
982-1002.
De Matos, C. A., Ituassu, C. T., & Rossi, C. A. V. (2007). Consumer attitudes toward
counterfeits: A review and extension. Journal of Consumer Marketing, 24(1),
36-47.
Debatin, B., Lovejoy, J. P., Horn, A. K., & Hughes, B. N. (2009). Facebook and online
privacy: Attitudes, behaviors, and unintended consequences. Journal of
Computer-Mediated Communication, 15(1), 83-108.
Dodds, W. B., Monroe, K. B., & Grewal, D. (1991). Effects of price, brand, and store
information on buyers. Journal of Marketing Research, 28(3), 307-319.
Dwyer , L., Gill, A., & Seetaram, N., (eds.) (2012). Handbook of research methods in
tourism: Quantitative and qualitative approaches. Cheltenham, UK: Edward Elgar.
El-Hajjar, S. T. (2014). Basic & business course in statistics II. Bloomington, IN:
AuthorHouse.

72
Facebook (2013) Facebook reports first quarter 2013 results. Retrieved from
http://investor.fb.com/releasedetail.cfm?ReleaseID=761090
Facebook terms and policies (2013). Retrieved from https://www.facebook.com/policies/
Fogel, J., & Nehmad, E. (2009). Internet social network communities: Risk taking, trust,
and privacy concerns. Computers in Human Behavior, 25(1), 153-160.
Gallant, L. M., & Boone, G. M. (2011). Communicative informatics: An active and
creative audience framework of social media. Cognition, Communication,
Co-Operation, 9(2), 231-246.
Garson, D. (2008). Statnotes: Topics in multivariate analysis. Retrieved from
http://faculty.chass.ncsu.edu/garson/pa765/statnote.htm
Gravetter, F. J., & Forzano, L. B. (2010). Research methods for the behavioral sciences.
Belmont, CA: Wadsworth.
Hair, J. F., Black, W. C., Babin, B. J., Anderson, R. E., & Tatham, R. L. (2006).
Multivariate data analysis (6th edition). Upper Saddle River, NJ: Pearson.
Hargittai, E. (2007). Whose space? Differences among users and non-users of social
network sites. Journal of Computer-Mediated Communication, 13(1), 276-297.
Hargittai, E., & Litt, E. (2011). The tweet smell of celebrity success: Explaining variation
in Twitter adoption among a diverse group of young adults. New Media & Society,
13(5), 824-842.
Hatcher, L., & Stepanski, E. J. (1994). A step-by-step approach to using the SAS system
for univariate and multivariate statistics. Cary, NC: SAS Institute.
Haytko, D. L., & Baker, J. (2004). It’s all at the mall: exploring adolescent girls’
experiences. Journal of Retailing, 80(1), 67-83.

73
Ho, C. H. (2010). Continuance intention of e-learning platform: Toward and integrated
model. International Journal of Electronic Business Management, 8(3), 206-215.
Hoffman, D. L., Novak, T. P., & Peralta, M. (1999). Building consumer trust online.
Communications of the ACM, 42(4), 80–85.
Hsu, M., & Chiu, C. (2004). Predicting electronic service continuance with a decomposed
theory of planned behaviour. Behaviour & Information Technology, 23(51),
359-373.
Hsu, C. L., & Wu, C. C. (2011). Understanding users’ continuance of Facebook: An
integrated model with the unified theory of acceptance and use of technology,
Expectation disconfirmation model, and flow theory. International Journal of
virtual communities and social networking (IJVCSN), 3(2), 1-16.
Huang, C. Y., Kao, Y. S., Wu, M. J., & Tzeng, G. H. (2013). Deriving factors influencing
the acceptance of Pad Phones by using the DNP based UTAUT2 framework.
Proceedings of PICMET 2013 (pp.880-887). San Jose, CA.
Hunt, H. K. (1977). CS/D-overview and future research directions. In H. K. Hunt (Ed.),
Conceptualization and measurement of consumer satisfaction and dissatisfaction.
Cambridge, MA: Marketing Science Institute.
Hunt, S. D., Sparkman Jr., R. D., & Wilcox, J. B. (1982). The pretest in survey research:
Issues and preliminary findings. Journal of Marketing Research, 19(2), 269-273.
Ibrahim, Y. (2008). The new risk communities: Social networking sites and risk.
International Journal of Media & Cultural Politics, 4(2), 245-253.
Internet World Stats (2012). Retrieved from http://www.internetworldstats.com/stats2.htm

74
Jarvenpaa, S. L., & Tractinsky, N. (1999). Consumer trust in an Internet store: A
cross-cultural validation. Journal of Computer Mediated Communication, 5(2),
1-36.
Kelly, H. (2013). Facebook changes privacy settings for teens. Retrieved from
http://www.cnn.com/2013/10/16/tech/social-media/facebook-teens-privacy/
Kenny, D. A. (2012). Measuring model fit. Retrieved from
http://www.davidakenny.net/cm/fit.htm
Kim, S. S., & Malhotra, N. K. (2005). A longitudinal model of continued IS use: An
integrative view of four mechanisms underlying post-adoption phenomena.
Management Science, 51(5), 741-755.
Kline, R. B. (2011). Principles and practice of structural equation modeling (3rd edition).
New York: The Guilford Press.
Krasnova, H., Spiekermann, S., Koroleva, K., & Hildebrand, T. (2010). Online social
networks: Why we disclose. Journal of Information Technology, 25(2), 109-125.
LaTour, S. A., & Peat, N. C. (1980). The role of situationally-produced expectations,
others’ experiences, and prior experience in determining consumer satisfaction. In J.
C. Olson (Ed.), Advances in Consumer Research (pp. 588-592). Ann Arbor, MI:
Association for Consumer Research.
Leonard, H. (2013). Americans Still Spend Far More Time On Facebook Than Other
Social Media. Retrieved from
http://www.businessinsider.com/facebook-wins-in-social-media-time-spend-2013-3

75
Liao, C., Palvia, P., & Chen, J. (2009). Information technology adoption behavior life
cycle: Toward a Technology Continuance Theory (TCT). International Journal of
Information Management, 29(4), 309-320.
Limayem, M., Hirt, S. G., & Cheung, C. M. K. (2007). How habit limits the predictive
power of intentions: The case of IS continuance. MIS Quarterly, 31(4), 705-737.
Limayem, M., Khalifa, M., & Chin, W. W. (2004). Factors motivating software piracy: A
longitudinal study. IEEE Transactions on Engineering Management, 51(4),
414-425.
Lin, C. P., & Anol, B. (2008). Learning online social support: An investigation of network
information technology. CyberPsychology and Behavior, 11(3), 268-272.
Locke, J. (2007). The social contract. In J. E. Adler & C. Z. Elgin (Ed.), Philosophical
inquiry: Classic and contemporary readings (pp.653-663). Indianapolis, IN:
Hackett Publishing Company.
Lu, J., Wang, L., & Hayes, L. A. (2012). How do technology readiness, platform
functionality and trust influence C2C user satisfaction? Journal of Electronic
Commerce Research, 13(1), 50-69.
Macneil, I. R. (1974). The many futures of contracts. Southern California Law Review,
47(3), 691-816.
McCarthy, C. (2008). ComScore: Facebook is beating MySpace worldwide. Retrieved
from http://news.cnet.com/8301-13577_3-9973826-36.html

76
McKnight, D. H., Lankton, N., & Tripp, J. (2011, January). Social networking
information disclosure and continuance intention: A disconnect. In System
Sciences (HICSS), 2011 44th Hawaii International Conference on (pp. 1-10).
IEEE.
Metzger, M. J. (2004). Privacy, trust, and disclosure: Exploring barriers to electronic
commerce. Journal of Computer-Mediated Communication, 9(4). Retrieved from
http://jcmc.indiana.edu/vol9/issue4/metzger.html
Milne, G. R., & Gordon, M. E. (1993). Direct mail privacy-efficiency trade-offs within an
implied social contract framework. Journal of Public Policy and Marketing, 12(2),
206-215.
Nicholas, C (2010). At Last – The Full Story Of How Facebook Was Founded. Retrieved
from http://www.businessinsider.com/how-facebook-was-founded-2010-3?op=1
Oliver, R. L. (1980). A cognitive model for the antecedents and consequences of
satisfaction. Journal of Marketing Research, 17, 460-469.
Okazaki, S., Li, H., & Hirose, M. (2009). Consumer privacy concerns and preference for
degree of regulatory control. Journal of Advertising, 38(4), 63-77.
Ouellette, J. A., & Wood, W. (1998). Habit and intention in everyday life: The multiple
processes by which past behavior predicts future behavior. Psychological Bulletin,
124(1), 54-74.
Pan, Y., & Zinkhan, G. M. (2006). Exploring the impact of online privacy disclosures on
consumer trust. Journal of Retailing, 82(4), 331-338.
Papadopoulou, P. (2007). Applying virtual reality for trust-building e-commerce
environments. Virtual Reality, 11(2), 107-127.
77
Pegoraro, R. (2010). The latest Facebook fracas: Your privacy vs. its profit. Retrieve from
http://www.washingtonpost.com/wp-dyn/content/article/2010/04/02/AR201004020
0762.html
Phau, I., & Teah, M. (2009). Devil wears (counterfeit) Prada: A study of antecedents and
outcomes of attitudes towards counterfeits of luxury brands. Journal of Consumer
Marketing, 26(1), 15-27.
Piotrowski, C. (2012). Facebook: A bibliographic analysis of the PsycINFO database.
Journal of Instructional Psychology, 39(1), 63.
Quelch, J. A., & Jocz., K. A. (2008). Greater good: How good marketing makes for better
democracy. Cambridge, MA: Harvard Business Press.
Rachels, J., & Rachels, S. (2011). Elements of moral philosophy. New York:
McGraw-Hill.
Riley, P. (2006). The social contract and its critics. In M. Goldie & R. Wokler (Eds.), The
Cambridge history of eighteenth-century political thought (pp.347-375).
Cambridge, UK: Cambridge University Press.
Rousseau, J. J. (1971). The social contract. London: Penguin Books.
Ryu, K., Han, H., & Jang, S. S. (2010). Relationships among hedonic and utilitarian
values, satisfaction and behavioral intentions in the fast-casual restaurant industry.
International journal of contemporary hospitality management, 22(2), 416-432.
Schumacker, R. E., & Lomax, R.G. (2004). A beginner’s guide to structural equation
modeling. Mahwah, NJ: Lawrence Erlbaum Associates.

78
Shin, D.-H., Kim, Y. (2010). Effect of trust and privacy concerns on social networking: A
trust-based acceptance model for social networking systems. Paper presented at the
annual meeting of the International Communication Association. Retrieved from
http://citation.allacademic.com/meta/p402742_index.html
Sibona, C., & Choi, J. H. (2012). Factors affecting end-user satisfaction on Facebook.
Proceedings of the Sixth International AAAI Conference on Weblogs and Social
Media (pp. 575-578). Denver, CO.
Singh, K. (2007). Quantitative social research methods. Thousand Oaks, CA: Sage
Publications.
Slade, E. L., Williams, M., & Dwivedi, Y. (2013). An extension of the UTAUT 2 in a
healthcare context. UK Academy for Information Systems Conference Proceedings
2013 (paper 55). Oxford, United Kingdom.
Smith, C. (2010). Delete your Facebook account: ‘Quit Facebook day’ wants users to
leave. Retrieved from
http://www.huffingtonpost.com/2010/05/15/delete-facebook-account-q_n_576956.
html
Smith, J. (2009). December data is in: Facebook surpasses MySpace in US uniques.
Retrieved from
http://www.insidefacebook.com/2009/01/08/december-data-is-in-facebook-surpass
es-myspace-in-us-uniques/
Spreng, R. A., MacKenzie, S. B., & Olshavsky, R. W. (1996). A reexamination of the
determinants of consumer satisfaction. Journal of Marketing, 60(July), 15-32.

79
Stieger, S., Burger, C., Bohn, M., & Voracek, M. (2013). Who commits virtual identity
suicide? Differences in privacy concerns, Internet addiction, and personality
between Facebook users and quitters. Cyberpsychology, Behavior, and Social
Networking, 16(9), 629-634.
Tang, J. H., & Farn, C. K. (2005). The effect of interpersonal influence on softlifting
intention and behaviour. Journal of Business Ethics, 56(2), 149-161.
Tatham, M. (2013). For every hour online Americans spend 16 minutes on social
networks. Retrieved from
http://www.experian.com/blogs/marketing-forward/2013/04/18/for-every-hour-onli
ne-americans-spend-16-minutes-on-social-networks/
Thong J. Y. L., Hong, S. J., & Tam, K. Y. (2006). The effects of post-adoption beliefs on
the expectation-confirmation model for information technology continuance.
International Journal of Human-Computer Studies, 64(9), 799-810.
Tufekci, Z. (2008). Can you see me now? Audience and disclosure regulation in online
social network sites. Bulletin of Science, Technology & Society, 28(1), 20-36.
Van der Heijden, H. (2004). User acceptance of hedonic information systems. MIS
Quarterly, 28(4), 695-704.
Venkatesh, V. (2012). Models. Retrieved from
http://www.vvenkatesh.com/organizations/models.asp
Venkatesh, V., Thong, J. Y. L., & Xu, X. (2012). Consumer acceptance and use of
information technology: Extending the unified theory of acceptance and use of
technology. MIS Quarterly, 36(1), 157-178.

80
Venkatesh, V., Morris, M. G., Davis, G. B., & Davis, F. D. (2003). User acceptance of
information technology: Toward a unified view, MIS Quarterly, 27(3), 425-478.
Wang, H. W., & Wang, S. H. (2010). User acceptance of mobile Internet based on the
Unified Theory of Acceptance and Use of Technology: Investigating the
determinants and gender differences. Social Behavior & Personality: An
International Journal, 38(3), 415-426.
Wang, Y. S., Wu, M. C., & Wang, H. Y. (2009). Investigating the determinants and age
and gender differences in the acceptance of mobile learning. British Journal of
Educational Technology, 40(1), 92-118.
Weisberg, H., Krosnick, J. A., & Bowen, B. D. (1996). An introduction to survey research,
polling, and data analysis. Thousand Oaks, CA: Sage.
Whitley, B. E. (1997). Gender differences in computer-related attitudes and behavior: A
meta-analysis. Computers in Human Behavior, 13(1), 1-22.
WHOA (2009). 2009 cyberstalking statistics. Retrieved from
http://www.haltabuse.org/resources/stats/2009Statistics.pdf
Wolverton, T. (2010). Wolverton: New Facebook changes threaten privacy. Retrieved
from http://www.mercurynews.com/404/ci_20040400?source=404_14985800
Wortham, J. (2010). Facebook and privacy clash again. Retrieved from
http://query.nytimes.com/gst/fullpage.html?res=9D02E3D61431F935A35756C0A9
669D8B63&pagewanted=all
Wu, C. C., Huang, Y., & Hsu, C. L. (2014). Benevolence trust: a key determinant of user
continuance use of online social networks. Information Systems and e-Business
Management, 12(2), 189-211.
81
Yen, H. J. R., & Gwinner, K. P. (2003). Internet retail customer loyalty: The mediating
role of relational benefits. International Journal of Service Industry Management,
14(5), 483-500.
Zeithaml, V. A. (1988). Consumer perceptions of price, quality, and value: A means–end
model and synthesis of evidence. Journal of Marketing, 52(3), 2-22.
Zikmund, W. G., & Babin, B. J. (2009). Essentials of marketing research (4th edition).
Mason, OH: Thomson/South-Western.


![WELCOME [shhs1986.com]shhs1986.com/SHHS-25-Reunion-Handout.pdf · Facebook has helped continue contact with everyone since then. Benka, Michael “Mickey” mixter5@yahoo.com. Currently](https://static.fdocuments.us/doc/165x107/6088f4f2298cb865202d83a4/welcome-facebook-has-helped-continue-contact-with-everyone-since-then-benka.jpg)