
Why Do Neighbourhoods Stay Poor? - Barrow Cadbury … · Why Do Neighbourhoods Stay Poor?...
68
Why Do Neighbourhoods Stay Poor? Deprivation, Place and People in Birmingham A report to the Barrow Cadbury Trust Alex Fenton, Peter Tyler, Sanna Markkanen, Anna Clarke, Christine Whitehead Centre for Housing and Planning Research and Department of Land Economy University of Cambridge
-
Upload
hoangthuan -
Category
Documents
-
view
237 -
download
0
Transcript of Why Do Neighbourhoods Stay Poor? - Barrow Cadbury … · Why Do Neighbourhoods Stay Poor?...

Why Do Neighbourhoods Stay Poor?Deprivation, Place and People in Birmingham
A report to the Barrow Cadbury Trust
Alex Fenton, Peter Tyler, Sanna Markkanen, Anna Clarke, Christine WhiteheadCentre for Housing and Planning Research and Department of Land EconomyUniversity of Cambridge

This report is based upon research funded by the Barrow Cadbury Trust. The authors gratefully acknowledge the support of the following individuals and organisations:
• The staff and trustees of the Barrow Cadbury Trust;
• Agencies and voluntary groups in Birmingham, including Aston Pride, the Islamic Resource Centre, the Ashiana Community Project, Nechells Regeneration Project, free@last, HomeStart, St Luke’s Community Project, Kingstanding Youth Inclusion Project, Base K/S, Christ the King Church, Pridestart, Hawkesley Community Centre, Youth Information Shop and Three Estates NDC;
• Residents in the case-study areas who agreed to be interviewed, and those who participated in the Aston community round-table;
• The research steering group: Asif Afridi, Meena Bharadwa, Ruth Lupton, Lucinda Platt and Joy Warmington.
The report is the sole responsibility of the authors, and does not necessarily reflect the views held by the Trust.
All photographs © Alex Fenton

Contents
Foreword
Chapter 1
IntroductionKey FindingsOutline of the Report
Chapter 2 The Location of Neighbourhood Deprivation in Birmingham
An Introduction to the Case Studies
Chapter 3 Why do Concentrations of Deprivation Emerge and Persist?
The Historical Roots of Urban Poverty in BirminghamExplaining the Persistence of Area DisadvantageEconomic RestructuringCase Studies: EmploymentPopulation Movement
Chapter 4 Ethnicity, Race and Poverty
The History of Migration to BirminghamSkills and Human CapitalRacism and ‘Cultural Issues’Case Studies: Stigma and DiscriminationBeyond Race and Ethnicity?Conclusions from Case Study Interviews with Young People
Chapter 5 The Response
The Voluntary SectorRegeneration and RenewalAreas for Further Research and Discussion
1
5
579
13
16
21
2123242931
37
374145464750
55
555758

1
Foreword
Why do neighbourhoods stay poor is a study into the fortunes of some of the most deprived areas of Birmingham. It charts the factors which have determined the ability of these neighbourhoods to prosper – from the impact of the housing structure and the decline of the manufacturing industry to the effects of migration and internal mobility.
Overall it tells a very difficult story about disadvantage in the city, particularly among young people. One of the key findings of the report is that, even before the recession, the prospects of the poorest workers in the city had stalled. Between 2001 and 2008, average real wages in Birmingham fell by 3.5% and those of the lowest paid by 4.5%. This is striking given that this was the longest period of sustained growth in post-war history and that wages kept pace with inflation in the rest of England.
It is therefore unsurprising that one of the most pressing challenges for young people in these disadvantaged neighbourhoods is to find meaningful work. Researchers recorded numerous accounts of soul destroying days stacking shelves and working shifts. In the case of women, casual work within services such as the beauty industry or commission-based sales work was widespread. The young men for the larger part were reliant on extended families to find cash-in-hand work – plastering for a day or working the odd shift collecting glasses for a family member in a nightclub. While no one looked back nostalgically on the days of plentiful jobs in the old car manufacturing firms, most were despondent about the future.
While economic insecurity is widespread, concerns about safety among young people seem to be much more localized. Many of the young people expressed amazement about outsiders’ perceptions about their local areas being dangerous. What was shared however was a sense that many deprived areas were heavily stigmatised. In many cases, people felt that this form of discrimination was more problematic than for example racially driven prejudice.
The report also highlights a growing disenchantment with publicly driven regeneration. Responses to physical regeneration drives were generally mixed. While people seemed to value new facilities, particularly those benefiting young people, in general those consulted felt that these had come at the expense of investment into the types of social and community activities which help local areas feel, rather than look, better.

2 Finally, the report illustrates that these neighbourhoods have remained persistently poor over decades. Although their trajectories have been very mixed, the four case study wards could have been the subject of a study on poor neighbourhoods written four, five or even six decades ago.
So how should a medium-sized grantmaking Trust like Barrow Cadbury respond to challenges of this scale?
At a time when policymakers are increasingly fixated on cutting budgets, our aim over the course of the next year will be to make the case for ongoing investment into community development in disadvantaged areas. Increasingly, evidence shows that those communities which benefit from a strong ‘associational life’ have better outcomes – from greater social cohesion and better race relations to improved well being. In our experience, community infrastructure is also critical in helping individuals, particularly the most vulnerable, cope with shocks such as job loss or indebtedness. This report highlights how people themselves want more investment in this type of community regeneration.
Unfortunately, during the times of plenty, many of the regeneration drives of the past twelve years failed to take this lesson on board, prioritizing eye-catching infrastructure projects over the often more understated investments into community groups in disadvantaged areas. This has been particularly problematic in areas which have been affected by economic decline.
Now, as we enter a period of austerity, the risks are different. It is important for policymakers to avoid opportunistic approaches to community groups and their leaders, seeking out opportunities to buy services for less. Far more important at times of economic hardship, in Barrow Cadbury’s view, are the social contributions which are harder to measure.
We hope that the rich evidence base contained in this report will help us make the case for greater investment in the community development needs of the most disadvantaged areas. In addition to our work with community groups operating in these settings, over the course of the next year, we will be working with a range of experts to develop a robust case for ongoing investment in community development.
Sara LewellinChief Executive The Barrow Cadbury Trust

3Chapter One: Introduction


5For 20 years, the skyline of Birmingham has been crowded with cranes and the air filled with the sound of diggers. Central Birmingham’s long makeover has stripped away the dour concrete that obscured Joseph Chamberlain’s monuments to Victorian civic pride.
Away from the city centre there has also been a boom in the development of new housing. Large sums of public regeneration money have gone into Aston and King’s Norton – 2 of the 39 national projects funded with around £5 million a year for 10 years under the New Deal for Communities Programme. This has paid not just for new heating, insulation and security but for programmes to tackle crime, educational under-achievement and health.
Despite these huge investments over the last ten years, by some measures Birmingham has been in continued economic decline. Manufacturing has suffered grievously since the era when Birmingham was known as the ‘city of a thousand trades’. Famous locally manufactured brands such as Rover and HP Sauce and much of its industrial capacity has been lost. It is widely believed that the loss of large-scale manual employment has been a huge blow for Birmingham’s white and Caribbean men. This report shows that the ripples have gone wider.
Though deprivation is widespread across Birmingham, and is severe in many neighbourhoods, it takes distinctive forms in different parts of the city. Some inner-city areas, like Sparkbrook, teem with economic activity, with long shopping streets selling everything from food to fashion to furniture. Despite this appearance, these areas have severe problems of unemployment, low incomes, overcrowding and poor-quality housing. Inner Birmingham receives large numbers of international migrants, many of whom start without the language skills or qualifications to find good employment. Closeness to the city centre is no guarantee that services and connections will be good. Nechells, within walking distance of the Bullring but cut-up and isolated by roads, railways and derelict land, has few shops and services, and scant public transport connections to the rest of the city.
Travel 30 minutes or so out of the city and you reach traditionally white housing estates like Kingstanding and King’s Norton’s Three Estates. They offer housing that is more spacious and comfortable than the Victorian city-centre slums they were built to replace. Though less prominent in popular images of urban poverty than the inner city, these areas have also suffered from the decline of manufacturing. In areas like King’s Norton, on the very edge of the city, residents are isolated from most of the jobs in the service sector that have replaced declining industries. There is less population movement in and out of these
Chapter One:Introduction
(left) Post-war housing in Sparkbrook, near the top of Stratford Road.

6 suburban areas, and young people draw on local family connections to find work. Although this means they can bring in a wage, it also means they enter into same employment sectors as their parents, where low pay, insecurity and limited advancement are common.
Although public debate on poverty often focuses on London and the North, there are lessons to be learned from Birmingham’s experience – particularly in terms of the more recent poverty of once thriving estates on the edge of cities. In Autumn 2007, the Barrow Cadbury Trust (BCT) commissioned the Centre for Housing and Planning Research at the University of Cambridge to undertake a study of poverty and deprivation in Birmingham. The motive for the research was the Trust’s longstanding concern with social justice and its particular focus on the West Midlands. The study aimed to integrate different explanations of poverty by focusing on a single large city and a small number of neighbourhoods within it. It sought to relate the long-term economic restructuring taking place in the region to the fortunes of different parts of the city and to the experiences of those living in some of the most disadvantaged neighbourhoods. Particular attention was given to understanding the differences between inner-urban, ethnically diverse areas and deprived areas in suburban or peripheral locations.
Fieldwork and analysis for the research was carried out from Autumn 2007 to Spring 2009. The starting point for the work was the analysis and mapping of historical and current data on population, migration, housing, the economy and the labour market. This was used to select four case-study neighbourhoods that reflected different types of deprived neighbourhood identified in the city as a whole.
Across these four neighbourhoods, around 50 young adults aged 16–35 were interviewed about their lives – including their views of their local area, their experiences of compulsory education and their plans for the future. Topics were chosen that young people would be able to recall easily and that would help the researchers understand how those who had grown up and stayed in the neighbourhoods interpreted their life course. Around 35 stakeholders from a range of professions and organisations were also interviewed, some with extensive experience of working with the case-study neighbourhoods; others with a broad view of the issues addressed by the research.

7Key Findings
Since 2000, Birmingham has continued to experience a reshaping of its economy, with the contribution of manufacturing declining sharply in favour of services and public-sector activities. Its prosperity relative to the UK as a whole has decreased. Average earnings in the city have fallen in real terms and the wages of lower-paid workers especially have been affected. Birmingham, along with other cities in the North and West Midlands, has suffered more than other parts of the UK in the current recession. While all wards in the city have been affected by a decline in manufacturing, some wards have fared considerably worse than others. The common perception is that the decline in manufacturing has mainly affected the large, outer estates in South Birmingham – like King’s Norton, Northfield and Weoley – with a high proportion of the white working-class men who were the dominant part of the manufacturing workforce. Whilst these wards have indeed been badly affected, inner-ring poor wards like Nechells, Aston and Handsworth have also suffered. In Aston, next to North Nechells, manufacturing employment fell by nearly a half between 1991 and 2001. The lost jobs in manufacturing have been replaced by work in transport and distribution, retail and wholesaling, and hotels and restaurants – all sectors where low pay, low skills and casualisation of labour are common. This economic shift is a large part of the explanation for real wages falling in recent years.
There are many neighbourhoods with high levels of economic and social disadvantage located in Birmingham, both in the inner city and the suburbs. These concentrations of deprivation have persisted for long periods: the same group of 13 wards had the highest proportions of economically inactive people in 1991 and in 2001.
In Birmingham, minority ethnic people are more likely than white Britons to be living in deprived areas. The population of deprived Birmingham could be described as ‘majority minority’ in its ethnic composition, with no single category making up a majority. However, there remain disadvantaged neighbourhoods with a largely white British population, typically suburban areas with much social rented housing. These are often overlooked in discussion of poverty in Birmingham.
The movement of people within the city contributes to the ongoing concentration of poverty in particular places. There is a net out-flow of people in higher status jobs from the most disadvantaged wards, and a net in-flow of the unemployed and those in lower status, and hence poorer paid, work. The concentration of housing that is affordable to people on low incomes is a central part of explaining this. In many

8 neighbourhoods, though not all, this affordable housing is social rented; Birmingham City Council remains the largest public landlord in England by the number of dwellings it owns and lets out. The inner-city deprived wards also receive large numbers of international migrants from Commonwealth countries, the European Union accession states in Eastern Europe and elsewhere. Less is known about the subsequent movement of migrants once in Birmingham, including whether, and where, they choose to settle in the long-term. Those not born in the UK have on average fewer recognised qualifications and can expect to earn less than their British-born peers for a considerable time after arrival. The research also sought to develop a picture of the ‘lived experience’ in these deprived areas. The young adults interviewed were directed towards low-status, low-paid or insecure employment by several factors. Many had not completed compulsory education or had left school with few qualifications. Their entry into the labour market was typically informal, with jobs secured through family and friends. There were strong distinctions between the sexes in preferences for and movement into different kinds of work. Young women tended towards service occupations such as retail, leisure and personal care – all poorly paid sectors. Young men tended towards skilled and semi-skilled manual occupations, such as the construction trades, that are vulnerable to cyclical downturns. As might be expected, residents’ broader views of their local areas were quite mixed. On the one hand, fears about safety, in part fuelled by conflict between those from different areas, were an underlying concern which made some unwilling to stray far from home. In all the case-study areas, interviewees felt that people in other places looked down upon, feared or were ignorant of the neighbourhood. On the other hand, many interviewees had a sense of belonging that stemmed from the nearness of family, and a broader sense of knowing the place and being known by others. A considerable number of policy interventions had been made over many years in the case-study neighbourhoods – especially since 1997 – and continue in some of them. These have ranged from physical regeneration – construction, replacement or improvement of housing and infrastructure – to supporting social and community activities. Whilst these regeneration initiatives have provided some valued facilities and supported services which some feel they have benefited from, they have not as yet produced the hoped-for change in the relative positions of the neighbourhoods on scales of disadvantage.

9The study looked particularly at the provision of recreational activities and support to young adults. Although voluntary organisations were active in all of the case-study neighbourhoods, some appeared to offer considerably greater richness and range than others. This variation was not easily explained by population composition, for example by ethnic homogeneity, or the size of ethnic populations that had settled. In some areas voluntary organisations had emerged through links between those within of common cultural background. In others, traditional institutions like churches remained important bases for voluntary activities. Several areas appear to merit further research and policy discussion. One of these is population mobility, especially in relation to poor neighbourhoods: when, where and how do households decide to move into and out of deprived areas? This has implications for both regeneration programmes – in finding out how often those who benefit from local initiatives move away – and for policies for the reception of international migrants. Those working in economic development face a challenge in increasing employment and improving the quality, pay and security of new jobs. The fact that concentrations of deprivation have persisted in the same places over very long periods in spite of a variety of regeneration initiatives suggests that attention should be given both to regeneration policies and to the way resources are allocated to areas with high levels of need.
Outline of the Report
An overview of the geography of deprivation in Birmingham is given in Chapter 2. The four case-study neighbourhoods are then briefly introduced to illustrate the variety of types of place that have high proportions of disadvantaged households.
Chapter 3 looks closer at the extent to which deprivation has persisted in the same neighbourhoods. Competing explanations for the persistence of concentrated poverty are examined; the chapter also looks at the roles played by economic restructuring and population movement as well as at more local factors such as housing and transport. The chapter turns to the interviews with residents of the four case-study neighbourhoods to look at the ways in which place influences growing up and, in particular, entry to the labour market.

10 Birmingham is a highly ethnically diverse city and Chapter 4 assesses the degree to which ethnic minorities are concentrated in areas with high levels of deprivation. The chapter looks at why this might be so and argues that analyses that start with a premise of ethnic difference may serve to obscure underlying issues of class and poverty. The chapter also considers young adults’ experiences of day-to-day life in the case-study areas, concluding with overall findings from the case-study interviews with young people.
Chapter 5 examines how public bodies and voluntary organisations have focused on housing, employment and regeneration policy in the city to meet the needs of poor areas and their ethnic minorities. It concludes by proposing a number of questions for policy development and for future research.

11Chapter Two: The Location of Neighbourhood
Deprivation in Birmingham


13• Many of the most deprived parts of Birmingham form an unbroken ring around the city centre;
• Some of these areas, like our case study of Sparkbrook, have original housing from the latter part of Birmingham’s industrial expansion; others, like Nechells, were redeveloped as municipal housing under slum-clearance programmes;
• There are also deprived areas in scattered suburban and peripheral locations that mostly include larger social housing estates;
• As well as differences in urban location and housing tenure, the four case studies differ substantially in the ethnic composition of the population, connectedness and range of local facilities.
Since the study’s focus is neighbourhoods with high incidence of poverty and deprivation, the first task is to describe where in Birmingham these are found. It should be remembered that not all people and households experiencing deprivation live in such neighbourhoods and that not all people in ‘deprived neighbourhoods’ are deprived. However, in terms of deprivation the bottom third of the population is disproportionately concentrated – often in inner cities. The data for Birmingham shows that there are clearly identifiable concentrations of people experiencing deprivation of various sorts: income poverty, unemployment, inadequate housing, ill health and so on. Similar patterns are found in other UK cities. Although Birmingham is England’s second largest city, it is more similar to the large northern cities than to London. These large cities all have numerous areas with high levels of deprivation, but London also has much more extreme polarisation between rich and poor.
For an initial mapping of the city, the Index of Multiple Deprivation (IMD) was used. The IMD is produced by central government, drawing together sources such as the Census and records from the administration of health, welfare and education services, and reported crimes. Although it is heavily weighted to the prevalence of income poverty and unemployment, it also reflects other dimensions in which people may experience relative deprivation, such as health, education and their physical environment. Birmingham’s population has the highest proportion of income poverty and work poverty among all English districts, playing a major role in Birmingham’s position in the IMD.
A considerable advantage of the IMD is that is published for around 30,000 small areas, each with a roughly similar population, in England and can therefore show up some of the fine-grained differences that can exist between neighbouring parts of urban areas. The mapping of the IMD for Birmingham produces the distinctive pattern, shown in Figure 1 (page 14). All of the areas of the city shown in grey on this
Chapter Two: The Location of Neighbourhood Deprivation in Birmingham

14 map are within the 10% most deprived in England; those in the darkest grey are among the 1% most deprived. Given the way the IMD is constructed, these latter neighbourhoods are experiencing exceptionally high levels of unemployment and income poverty compared to the English average. IMD measures of the extent and concentration of local deprivation consistently place Birmingham between 10th and 15th highest among all English districts.
Figure 1: Index of Multiple Deprivation 2007 in Birmingham: IMD percentile
Lichfield
Walsall
North Warwickshire
Solihull
Bromsgrove
Dudley
Kingstanding
Nechells
Sparkbrook
King’s Norton
Case study wards
IMD 2007 in Birmingham IMD percentile
Among 1% most deprived in England
Among 5% most deprived in England
Among 10% most deprived
All others
Sandwell

15From the map we see that a solid ring of deprived neighbourhoods spanning the wards1 of Ladywood, Sparkbrook, Small Heath, Washwood Heath, Nechells, Aston and Soho surrounds the city centre. Towards the city’s periphery, there are also other places with several deprived parts, found in wards such as Shard End, King’s Norton, Kingstanding, Longbridge and Weoley. The four case studies carried out for this research are highlighted in blue and labelled on the map. Case studies were selected with considerable attention to what deprived neighbourhoods in Birmingham have in common, and what they do not. These features are worth describing now to outline some of the reasons why disadvantaged households are more likely to be clustered in certain places and why these patterns persist over long periods.
The geographical distribution of deprivation in the city has remained largely stable over a long period, including in the case-study areas. However, contrary to common perceptions about poor areas, it is not always the same people and households living in the same place over time. Chapter 3 looks at why deprivation has remained concentrated in certain places and at how the movement of people between areas affects the incidence of deprivation.
The concentrations of deprivation shown opposite often correspond with the location of social rented housing in the city. Birmingham remains the largest single public landlord in England, with over 65,000 council dwellings in 2008.2 Its management of housing is significant both for the welfare of the city’s residents and for wider national discussions about the future of public housing. Birmingham’s social housing has been developed since the inter-war period both by slum clearance and new building at the city’s edge. All but one of the case studies (Sparkbrook) originated as major municipal projects. Housing markets, housing policy and housing preference play an important role in this report.
1 Birmingham reorganised its electoral wards in 2004; throughout this report, we refer to the wards as they were in 2001.2 Communities and Local Government (2008) Housing Strategy Statistical Appendix 2007/08.
Original housing near the centre of the Kingstanding Estate

16 Inner-urban deprived areas, including the case-study areas of Sparkbrook and Nechells, are also those where a high proportion of the population are minority ethnic. The correlations were clearly set out in previous research commissioned by the Barrow Cadbury Trust.3 This present research found that most non-white ethnic minority groups are disproportionately likely to be living in deprived parts of Birmingham and that deprived Birmingham could already be described as ‘majority minority’ – that is, composed of places where no single ethnic group forms over 50% of the population. We return to the implications of this in Chapter 4.
An Introduction to the Case Studies
The four case studies were selected by their history, location and social composition. Wards were selected with several areas in the 5% most deprived nationally and which also scored highly on a work-poverty measure from the 2001 Census. Then, as wards in Birmingham are large areas, more detailed study was made of housing and population characteristics within the deprived wards to identify a smaller case-study area. Some of the salient features of the four case studies are summarised below.
3 A. Cangiano (2007) Mapping of Race and Poverty in Birmingham, Barrow Cadbury Trust.
Ward
Case-study area
Urban location
Development
Housing Tenure
Ethnicity
Sparkbrook
Upper Stratford Road
Inner urban
Late nineteenth century onwards
Mixed
Mixed, majority British Pakistani
Nechells
North Nechells
Inner urban
Post-war slum clearance and regeneration
Predominantly social rented
Diverse
Kingstanding
Kingstanding Estate
Suburban
Inter-war public housing
Predominantly council
Predominantly White British
King’s Norton
‘Three Estates’
Peripheral
Post-war public housing
Predominantly council
Predominantly White British
Table 2: Features of the case-study areas
17We now introduce each of the four case studies in some more detail: their location and connections to other parts of the city, their history and development, their housing and local facilities, and the reasons for selection.
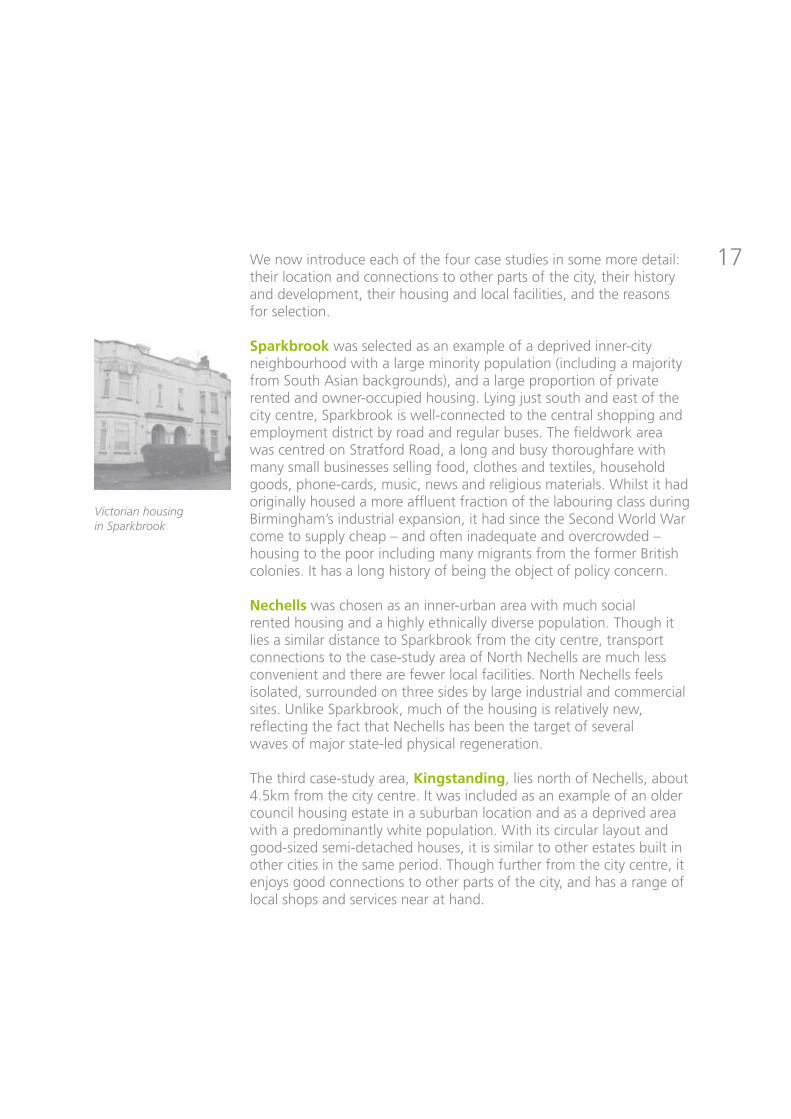
Sparkbrook was selected as an example of a deprived inner-city neighbourhood with a large minority population (including a majority from South Asian backgrounds), and a large proportion of private rented and owner-occupied housing. Lying just south and east of the city centre, Sparkbrook is well-connected to the central shopping and employment district by road and regular buses. The fieldwork area was centred on Stratford Road, a long and busy thoroughfare with many small businesses selling food, clothes and textiles, household goods, phone-cards, music, news and religious materials. Whilst it had originally housed a more affluent fraction of the labouring class during Birmingham’s industrial expansion, it had since the Second World War come to supply cheap – and often inadequate and overcrowded – housing to the poor including many migrants from the former British colonies. It has a long history of being the object of policy concern.
Nechells was chosen as an inner-urban area with much social rented housing and a highly ethnically diverse population. Though it lies a similar distance to Sparkbrook from the city centre, transport connections to the case-study area of North Nechells are much less convenient and there are fewer local facilities. North Nechells feels isolated, surrounded on three sides by large industrial and commercial sites. Unlike Sparkbrook, much of the housing is relatively new, reflecting the fact that Nechells has been the target of several waves of major state-led physical regeneration.
The third case-study area, Kingstanding, lies north of Nechells, about 4.5km from the city centre. It was included as an example of an older council housing estate in a suburban location and as a deprived area with a predominantly white population. With its circular layout and good-sized semi-detached houses, it is similar to other estates built in other cities in the same period. Though further from the city centre, it enjoys good connections to other parts of the city, and has a range of local shops and services near at hand.
Victorian housing in Sparkbrook

18 The Three Estates in King’s Norton were chosen as comprising a neighbourhood with a mix of dwelling types and tenures on the city’s periphery. Whilst King’s Norton is an historic village now absorbed into the city, the case-study area is three contiguous post- war housing estates built in a valley next to the original village, about 8km from the city centre. King’s Norton was also selected for its location near to many of the former large car-manufacturing plants, and within a city zone with a mixture of deprived, middling and more affluent neighbourhoods.
(below) View over part of the Three Estates, King’s Norton, from near the Redditch Road.

19Chapter Three: Why do
Concentrations of Deprivation Emerge
and Persist?

21Many of the same areas have long been among the most deprived in Birmingham and the disparity in employment rates has not decreased in recent times.
• Economic restructuring, particularly the decline of the manufacturing sector in Birmingham, plays an important role in explaining this. The loss of these jobs has disproportionately affected already deprived areas.
• Birmingham is becoming a low-wage economy. Since 2001, wages have fallen in real terms and at a faster rate amongst the lower-paid.
• Internal migration within the city has also tended to concentrate less advantaged people within already deprived areas largely due to the cost, tenure and availability of housing.
• The availability of affordable housing – either social rented or cheap private housing – in particular areas mean that those with least choice tend to move to those places.
The Historical Roots of Urban Poverty in Birmingham
Birmingham’s population and city boundaries expanded rapidly at the end of the nineteenth century as its manufacturing industry grew. The central area of Birmingham, including Nechells, consisted of workshops and factories intermingled with the closely packed courts and back-to-back houses. Sparkbrook and similar areas had somewhat better terraced housing, housing artisanal families. At the same time the professional middle classes were moving out of the city centre to new, exclusive areas such as Edgbaston and Moseley.4
From the outset some areas such as Nechells housed the poorest fraction of the urban working class; others, such as Sparkbrook, only later came to be areas of cheap private housing. From the late 1920s until the 1970s, the municipal authorities were highly active in developing new public housing on the city’s suburban fringes in areas like Kingstanding, Kingsbury, Shard End and Longbridge. The standard of these houses was considerably better than those available in the inner city at the time.5 Many existing residents of the inner city took the opportunity to move. These opportunities were more readily available to some than to others; at first, preference was given to ‘respectable’ households and, later, more or less overt racial preference operated in the allocation of public housing.6 In the early period of large-scale post-
Chapter Three: Why do Concentrations of Deprivation Emerge and Persist?
4 G. E. Cherry (1994) Birmingham: A Study in Geography, History and Planning, Wiley.5 N. Chinn (1994) Birmingham: The Great Working City, Birmingham Books.6 R. Skellington (1981) ‘How Blacks lose out in council housing’, New Society, 29 January 1981; V. Henderson and V. Kahn (1984)
‘Race, class and the allocation of public housing in Britain’, Urban Studies, vol 21, no 2, pp115–28.
22 war immigration, qualifying conditions and administrative discretion in allocating public housing worked against migrants, which was part of the reason they resorted to cheap private-sector rented housing in areas like Sparkbrook. In more recent decades, despite anti-discrimination legislation, allocations have still tended to place people of certain backgrounds in certain places, either because officers consider it best to do so or because some estates have been seen to have problems with racism. Certainly, racism was widespread and virulent in poor areas as recently as the 1980s.7
As the 1960s and 1970s progressed many of these inter- and post-war council estates began to show considerable social stress. While in the 1970s council housing in general accommodated a broad range of income groups, from the 1980s onward it came to meet the needs primarily of those households least able to afford housing in the open market as better-off tenants exercised the right to buy and, as credit became easier, were able to get mortgages for properties elsewhere. The disproportionate loss of the most attractive council stock to right-to-buy, the allocation of social housing on the basis of need and the falling status of council housing have been mutually reinforcing trends. The history of public housing in England goes a long way to explaining the clusters of deprivation found in the suburban and peripheral estates in Birmingham.
Alongside the building of new estates on the city’s fringes, the authorities intervened in some of the inner-city ‘slums’ such as Duddeston and Nechells, demolishing them and rebuilding with both houses and high-rise buildings. By the time of our study some parts of Nechells have been built, then twice demolished and redeveloped in barely a hundred years. Sparkbrook and the surrounding area saw more limited state activity, but became a less sought-after location as a more general trend to suburbanisation drew the better-off out of city centres.From this brief account, a number of distinct ‘histories’ behind the poorer neighbourhoods in Birmingham emerge:
• Inner-urban areas such as Nechells that were developed with low-quality housing for the industrial working class, and that have subsequently undergone repeated efforts at ‘regeneration’ and rebuilding;
• Inner-urban areas like Sparkbrook that were originally built to meet the needs of a more affluent fraction of the working population, but have increasingly come to serve the needs of those least able to afford private housing;
7 E. Ellis Cashmore (1987) The Logic of Racism, Harper Collins.

23• Suburban municipal estates of the kind found in King’s Norton which, as council accommodation became increasingly the resort of only those most in need, have come to house increasing concentrations of deprived households.
It is also important to examine the extent to which the relative positions of these wards in Birmingham have changed in recent years compared to other cities in the UK. In order to compare changes between 1991 and 2001, the proportion of working-age adults out of work through unemployment or ill health (‘work-deprived’) was measured. The most striking finding was that the 13 wards with the highest rates – the most deprived third in the city – were the same in 1991 and 2001. And, whilst work deprivation rates generally fell across the city (as across the country over the same period), the proportion of people out of work increased in many urban wards.
Areas of suburban deprivation – for example, Kingstanding and King’s Norton – did considerably better than the average. From the Census data alone, it is not easy to explain these differences, as it is impossible to tell how much this is due to the same people remaining in the area and improving their circumstances, and how much this is due to the movement of people between areas. As the next section shows, population movement is a central part of explaining why levels of deprivation remain high in some areas and not others. Overall, however, this suggests that in recent decades there has not been a convergence between the least and most affluent but, in much of the inner city in particular, an intensification and concentration of deprivation.
Explaining the Persistence of Area Disadvantage
The reasons that the same neighbourhoods and the same regions have higher poverty rates relative to others over time are much debated. As the historical survey above has suggested, at the neighbourhood level the housing stock in a place is closely linked to its function within the wider urban system – for example, providing low-cost housing for those with little other housing choice. The contribution of housing mix to the demographic, income and class profile has been a significant starting point for much urban regeneration policy, most recently under the guise of ‘mixed communities’.
24 However, housing stock and tenure are certainly not the only reasons that neighbourhoods rise, decline or remain deprived. The relative contribution of other factors has been much debated; here, we review how convincing other interpretations are in explaining what we observe in Birmingham. We look first at the role of economic restructuring (in particular the declining importance of manufacturing to the regional economy), population mobility and discrimination in keeping some neighbourhoods at the bottom of the pile.
Economic Restructuring
One of the primary explanations for the relative overall affluence of some English regions – for example, London and the South East – has been their ability to restructure away from industry and manufacturing. The North and the Midlands regions have not been able to adapt as fast. As certain industries have contracted and become less competitive with overseas enterprises, so the regions and cities whose economies depended on them have become less successful. The evidence suggests that on the grand scale, the gap between the more prosperous East and South of England and the less prosperous North and West has increased over recent years. However, individual cities within the same region have adapted differently and performed better and worse.8
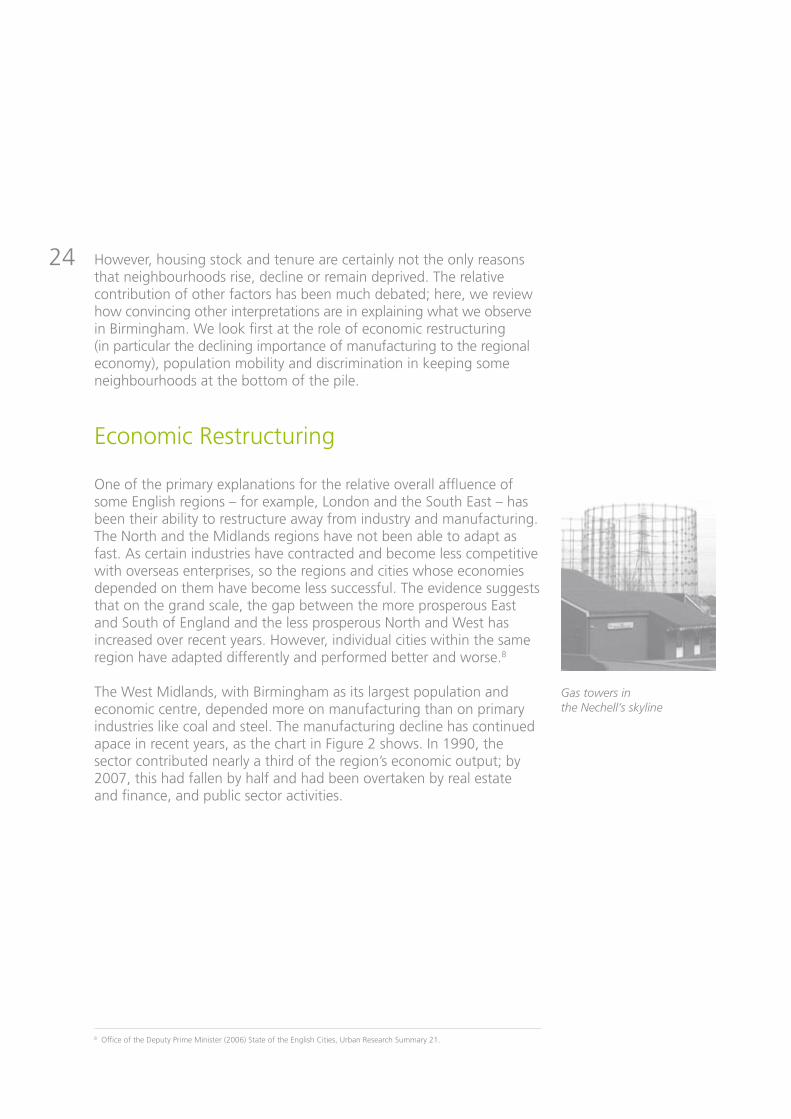
The West Midlands, with Birmingham as its largest population and economic centre, depended more on manufacturing than on primary industries like coal and steel. The manufacturing decline has continued apace in recent years, as the chart in Figure 2 shows. In 1990, the sector contributed nearly a third of the region’s economic output; by 2007, this had fallen by half and had been overtaken by real estate and finance, and public sector activities.
8 Office of the Deputy Prime Minister (2006) State of the English Cities, Urban Research Summary 21.
Gas towers in the Nechell’s skyline

25Manufacturing
Real Estate & Finance
Public Sector Activities inc Health and Education
West Midlands Gross Value Added as a percent of England GVA (right hand scale)
Figure 2: Contribution of selected sectors to regional economic output in the West Midlands
This decline of manufacturing has happened at the same time as a decline in the West Midland’s prosperity relative to the UK and other English regions. Although comparable data specific to Birmingham is only available since 2001, this erosion of prosperity is clearly reflected in falling real wages in the city. Whilst across England wages (mean or median average) just about kept pace with inflation between 2001 and 2008, in Birmingham the average real wage fell by 3.5%. Significantly, this erosion of real wages was even more pronounced when looking at the lower end of the income distribution, which saw a fall of 4.5%. Lower-end wages were higher in Birmingham than England in 2001, but the position has reversed: Birmingham has increasingly become a low-wage economy with wage levels comparable to Sheffield (see Table 2 page 26).
1989
1990
1991
1992
1993
1994
1995
1996
1997
1998
1999
2000
2001
2002
2003
2004
2005
2006
40% 100%
96%
98%
94%
91%
25%
10%
35%99%
95%
92%
97%
93%
90%
20%
5%
30%
15%
0%

26 Leeds £330.5
Glasgow City £321.6
Nottingham £317.0
Birmingham £313.9
Sheffield £312.8
Manchester £310.8
Liverpool £307.8
Table 2: 2008 lower quartile gross weekly wages for selected large cities (Annual Survey of Hours and Earnings)
The question for this study is whether the decline of manufacturing and falling real wages has had a disproportionate impact on certain neighbourhoods. We would expect those to be wards where a high proportion of the working population was previously employed in industry and was therefore vulnerable to losing their jobs as the sector has declined.
Figure 3 opposite shows those wards of Birmingham where, in 1991, a high proportion of the working population was employed in manufacturing. Ten years later, in 2001, the proportion employed in that sector had fallen across all wards. However, some wards have fared considerably worse than others including poor wards in the inner-ring, like Nechells, Aston and Handsworth, and wards with large estates in South Birmingham, like King’s Norton, Northfield and Weoley. In Aston, next to North Nechells, manufacturing employment fell by nearly half.
England average
West Midlands average
Birmingham average
England bottom 25%
West Midlands bottom 25%
Birmingham bottom 25%
2001
£324.8
£309.4
£312.3
2001
£198.8
£191.9
£200.3
2008
£388.4
£367.1
£362.4
2008
£238.3
£229.6
£230.0
Change in real terms
-0.5%
-1.3%
-3.5%
Change in real terms
-0.3%
-0.5%
-4.5%
Table 3: Median and lower quartile gross weekly wages in England, West Midlands and Birmingham, and change after inflation (Annual Survey of Hours and Earnings; Bank of England GDP deflators)

27
Figure 3: Decline in manufacturing employment in Birmingham wards 1991-2001
Manufacturing Decline % Decline in Manufacturing Jobs 1991-2001, Wards with > 25% manufacturing employment in 1991
11 - 20
21 - 30
31 - 40
41 - 50
Sutton Four Oaks
Erdington
KingsburyStockland Green
Yardley
Shard End
Hodge Hill
Washwood Heath
Small Heath
Sparkbrook
Moseley
Ladywood
Edgbaston
Selly Oak
WeoleyBournville
Fox Hollies
Hall Green
Billesley
Brandwood
HarborneQuinton
Bartley Green
King’s NortonNorthfield
Longbridge
Sparkhill
Acock’s GreenSheldon
Nechells
Sutton VeseyOscott
Soho
Perry Barr
Kingstanding
Sandwell
Handsworth
Aston
Sutton New Hall

28 The lost jobs in manufacturing have been replaced by work in transport and distribution, retail and wholesaling and hotels and restaurants – all sectors where low pay, low skills and casualisation of labour are common. The continued shift between economic sectors since 2001 explains a substantial part of the falling real wages in the city in recent years.
The current recession and the previous one of the early 1990s have amplified the differences in unemployment between more and less deprived areas.9 Neighbourhoods with an underlying higher level of benefit claims tend to see greater rises in Job Seeker’s Allowance claimant rates.10 In the most recent recession the West Midlands and Birmingham have suffered more than England on average,11 although the pattern at neighbourhood level for the case-study areas is more mixed (Table 4). Looking at the effect on benefit claims in all Birmingham wards over the relatively short-term of the recession, it is notable that whilst the numbers and rates change, the relative positions of wards change much less. The same 12 wards have the highest rates before and after, and the gap between the worst-off and the best-off has not narrowed.
9 R. Tunstall with A. Fenton (2009) Communities in Recession: The Impact on Deprived Neighbourhoods, Joseph Rowntree Foundation.10 JSA claims are an imperfect proxy for unemployment, but this is the only source that is available currently and for small geographic
areas such as wards and neighbourhoods.11 J. Jenkins and D. Leaker (2009) The Labour Market Across the UK in the Current Recession, Office of National Statistics.
England
Birmingham
King’s Norton
Kingstanding
Sparkbrook
Nechells
JSA claimant rate (% of working population)
Sep 2007
2.2
5.5
5.9
6.9
10.4
8.5
Sep 2009
4.2
8.2
8.2
10.4
12.5
11.2
Change
+2.0
+2.7
+2.3
+3.5
+2.1
+2.7
Table 4: Job Seeker’s Allowance Claimant Rate (percentage of working-age population). Source: NOMIS
29In summary, both long-term trends and the shorter shocks of recession have hit Birmingham harder than many other parts of the country. The effects within Birmingham have fallen heaviest on jobs that pay less than the average and are more common in less prosperous areas.
Case Studies: Employment
Many of the interviewees left school having gained few qualifications. They described school careers that had been disrupted by exclusion or suspension and school environments that were sometimes disordered or even chaotic. Therefore, when leaving school and considering work or further education, many of the respondents were already in a disadvantaged position.
For those old enough to experience employment, the quality of jobs on offer for the unskilled who used to find work readily in the factories of Birmingham was often unsatisfying and repetitive. For example, Tashelle, from Nicholls, was now aged 19 and had been in and out of work for three years. She got her first job through a relative, selling telecoms on the streets. ‘You know I didn’t mind that whole customer service thing … but standing outside in the cold I couldn’t stand it … the thing with these like, field sales is, like, a lot of people have already got broadband … if they really wanted it they’d phone and get it themselves, they don’t really need people out selling these type of things. It just didn’t make no sense to me really.’
After a few months in retail, she got a job in a warehouse: ‘It’s just like stacking … you look after these stacking shelves all day and then there’s bell rings you have to run to the till and then be on the till for like 20 minutes and the bell rings and then you have to run back to stacking shelves because ... It’s a disgusting job. I hated it. It’s horrible. It’s so tiring, I left there – I don’t think I was there a full month!’
Although her boss in the most recent job, in telesales, encouraged her to stay, she quit that too, as the appointments – and hence earnings – dried up: ‘Cos there was too much pressure, like I wasn’t making any appointments … in my last two months I just wasn’t making anything’.

30Other interviewees similarly related a link between the unsatisfactory, low-status nature of the employment they were able to find and rapid moves between those jobs:Ethan: I’ve had loads of jobs, probably over 30 jobs but I’ve never stuck at them or anything … the jobs I’ve gone into, it’s just for the money really and I’ve never really enjoyed them.Interviewer: What kinds of jobs have you done?Ethan: A window cleaner, estate agent, I worked at Cadbury’s.
Interviewees also described the inherent instability of the work they felt themselves able to get: ‘I did childcare, I did my NVQ2 when I was pregnant with my last child and then I thought there was no point having the 2 without the [NVQ] 3 … but four years ago I did false nails and beauty and that really interested me so I wanted to go back into that. So I’ve done waxing and then I’ve gone into make-up, it just really interests me, but I’ve always got one or the other to fall back on ... So I think in this day and age, you’ve got to have some sort of back-up plan.’ (Brittany, from Kingstanding)
‘I went into plastering with my brother-in-law … It was just pick me up in the morning and everything he done, I’d have to try it after until I’d got it bang on so I knew. He wouldn’t just let me sit about. He made me work – to graft – which I thought was good.’ (Justin, Kingstanding)
‘That [cleaning work] was with my boyfriend’s mum, like she’s setting up her own business. So she was taking me like to jobs where she needed a hand and that.’ (Erin, King’s Norton)
‘My mum’s mate got me it [work in plastering], but then they had no work so I had to stop doing that. Sometimes I help my mum cleaning the school and my mum gives me some money for helping her cleaning the school.’ (Robert, Kingstanding)
‘My brother used to be the manager at the nightclub and, at the time, they were desperate for somebody to work just for one night because quite a few of them had phoned in sick. So he phoned me and asked me if I wanted to do it just for the night and I was like “yeah, okay”. So I went in and I was glass collecting for the night and then he phoned me up in the week and he says, “do you want a job?” and I was like “okay, then”.’ (Amber, Kingstanding)

31Very few had successful experiences with more formal job-finding approaches so the alternative to work secured through family and friends was likely to have been unemployment. This route to work was often described without any longer-term talk of a ‘career’. In this way, insecure employment in poorly paid sectors is transmitted through generations – just as those from relatively privileged backgrounds may use family connections to assist entry to more privileged posts.
Population Movement
One common mistaken assumption is that, because the same areas have high poverty rates over time, it is the same people staying in those places. In fact, people and households move around relatively frequently within and between towns and cities. For local moves, such as within a city, the reasons are most likely to be personal and family ones. However, economic considerations often also play a role. What differences are there between those who move out of deprived areas and those who move in? For now, we look only at mobility within the city; we later look at the effect of international migration into the inner city.
There is clear evidence that at least part of the continued prevalence of poverty in inner-city neighbourhoods results from the net out-movement of those with better-paid, higher-status employment and in-movement of those with fewer skills and those without work. The chart in Figure 4 shows the net flows of people into the most deprived, average and least deprived groups of wards in Birmingham in 2000–2001.

32
In the most deprived wards, on the left of the chart, households moving in contributed to a net increase of people employed in manual work and of those who had never worked or were long-term unemployed. Over the same period the same deprived wards were net losers of people in professional and managerial occupations; the trend is for better-paid, better-qualified people to leave these places to move elsewhere in Birmingham. The opposite pattern is observed in the least-deprived wards, places like Edgbaston and Moseley; professional people are moving in, whilst those in less advantaged positions are moving out.
This accorded with interviewees’ statements that the better qualified, ‘upwardly mobile’ move out of neighbourhoods like Sparkbrook. However, the population turnover is not the same in all deprived neighbourhoods. There is a greater degree of movement of population both into and out of the areas in Nechells and Sparkbrook than in the more settled areas of Kingstanding and King’s Norton. The degree to which this geographical mobility is associated with social mobility in different areas is not entirely clear. A major recent study by B. Robson et al. classified all deprived areas within England according
Figure 4: Net migration by social class, Birmingham Ward 2000–2001 (Census Migration Statistics)
Most work-poor wards Middle wards Least work-poor wards
Net
mig
rati
on
, peo
ple
0
500
-500
-1000
-1500
1000
1500Managerial & Professional Occupations
Intermediate Occupations
Routine & Manual Occupations
Never Worked & Long-term Unemployed
33to whether the predominant residential flow into and out of the areas was to places that were more, similarly or less deprived.12 Robson’s categories of ‘Transit’ and ‘Escalator’ areas are those where a majority of those moving out are doing so to less deprived areas. ‘Isolate’ areas are those where most moves are between similarly or more deprived areas; they ‘can be seen as neighbourhoods associated with a degree of entrapment of poor households who are unable to break out of living in deprived areas’. The case-study neighbourhoods all fall within the ‘Isolate’ category, indicating that in all of them the predominant movement was into and out of other deprived areas, rather than up the social scale. Across Birmingham more generally, it was in the less severely deprived suburban areas and the very central neighbourhoods that more socially mobile population movement was found. These areas are often the ones that are attractive to students and adults early in careers, who are more able to move as their circumstances improve. The same opportunities are not so often available to those in jobs where continuity of employment is not guaranteed and where salaries rarely progress.
The reasons for population movement are complex: households may move for personal or family reasons, to follow work and/or to take up better or more affordable housing. However, the net effect of these flows is clear: even if individual households in poor areas are able to improve their circumstances, the aggregate level of poverty in the area may improve much less if better-off households leave and new poor households move in. This trend remains an important counter-balance to perceptions of poverty as ‘static’, affecting the same people in the same places over time.
This is not a new observation. A government report from the 1970s noted that ‘the concentration of the worst off members of our society in collectively deprived areas such as Small Heath has, then, come about through selective inward and outward movement of people’.13 Compared to then, however, the opportunities and sources for detailed analysis of population are much more advanced. Increased understanding of flows of people and households into and out of disadvantaged areas are highly relevant to policy evaluation in looking, for example, at whether those who benefit from regeneration programmes remain in the same place. Further research on this offers the potential of yielding substantial practical benefits.
12 B Robson et al. (2009) A Typology of the Functional Roles of Deprived Neighbourhoods, Communities and Local Government.13 Department of Environment (1977) The Unequal City, HMSO.

Chapter Four: Ethnicity, Race
and Poverty


37Birmingham is already a highly ethnically mixed city with population forecasts suggesting that no one ethnic category will be in a majority by 2026.14 As with deprivation, the minority ethnic population is not evenly distributed across the city. When the four case studies were introduced, it was noted that one feature that distinguished the two inner-urban areas of Nechells and Sparkbrook from the neighbourhoods further from the city centre was their ethnic composition. In the outer areas, much the largest part of the population is white British, who make a greater proportion of the population than they do in the city as a whole, including in non-deprived areas. This does not mean that all inner-city areas should be described as ‘diverse’: in a few neighbourhoods, like the Sparkbrook case study, a majority of residents describe themselves as (British) Pakistani.
The coincidences between ethnicity and deprivation in the city’s neighbourhoods are too powerful to be accidental yet interpreting them is less easy. As the preceding chapter has shown, there is no single explanation of why people in positions of relative disadvantage are concentrated in certain neighbourhoods. Equally, there is no single reason why disadvantage is found disproportionately among certain ethnic groups. This chapter first looks at the history of international migration to Birmingham and briefly reviews the usefulness of ‘ethnic groups’ in analysing inequality.
The History of Migration to Birmingham
As one of the most ethnically diverse cities in the UK, Birmingham’s population structure has been shaped in significant ways by international migration. Although in-migration took place during the nineteenth and early twentieth centuries, predominantly from Ireland, it was the rapid increase in the number of international, largely non-white migrants after the end of World War II that has contributed most notably to the ethnic composition of Birmingham’s population today.
In 1945, significant numbers of predominantly Commonwealth migrants from the West Indies, India and Pakistan began to arrive in Birmingham, many of them attracted by the availability of jobs in the thriving motor and engineering industries.15 At the same time, a large proportion of Birmingham’s population was still living under slum conditions as the city struggled to provide adequate housing to its population. The employment patterns of the post-war
Chapter Four: Ethnicity, Race and Poverty
14 D. Dorling and B. Thomas (2008) Cities In Transition: Britain’s Increasing Plurality, Barrow Cadbury Trust.15 R. J. Smith (1969) Migration in Post-war Birmingham, University of Birmingham.
(left) Charity appeal poster on Stratford Road in Sparkbrook.

migrants, together with the limited availability of housing in post-war Birmingham, resulted in some distinctive settlement patterns that continue to influence the city’s landscape.
The movement of people from one country to another is commonly explained in terms of push and pull factors. For the early West Indian migrants, the key push factors included population pressure, high unemployment and low wages in the Caribbean. The pull factors, on the other hand, consisted of political developments that limited West Indians’ opportunities to migrate to the US as well as the demand for unskilled labour in the UK. Birmingham was one of the areas where the labour shortage was most acute, largely due to gaps in the service sectors such as public transportation and the more unpleasant and unskilled jobs. The reasons why Indians and Pakistanis came to Birmingham were largely similar to those of the West Indians. Sikhs came to work as moulders, grinders, press cutters and general labourers. Some from the Indian subcontinent opened food shops and ran warehouses that catered to the needs and tastes of other Asians.
In spite of increased regulation of international in-migration during the latter part of the twentieth century and since the turn of the millennium, Birmingham continued to receive substantial numbers of immigrants. At the same time, ethnic minority populations grew, both numerically and proportionally, due largely to higher rates of natural increase and a younger age profile. More recently, new migrant populations of both refugees and from the EU Accession states, such as Poles, Somalis, Kurds and Yemenis, have emerged alongside the initial post-war migrant groups from the Commonwealth countries, adding to the city’s ethnic complexity.
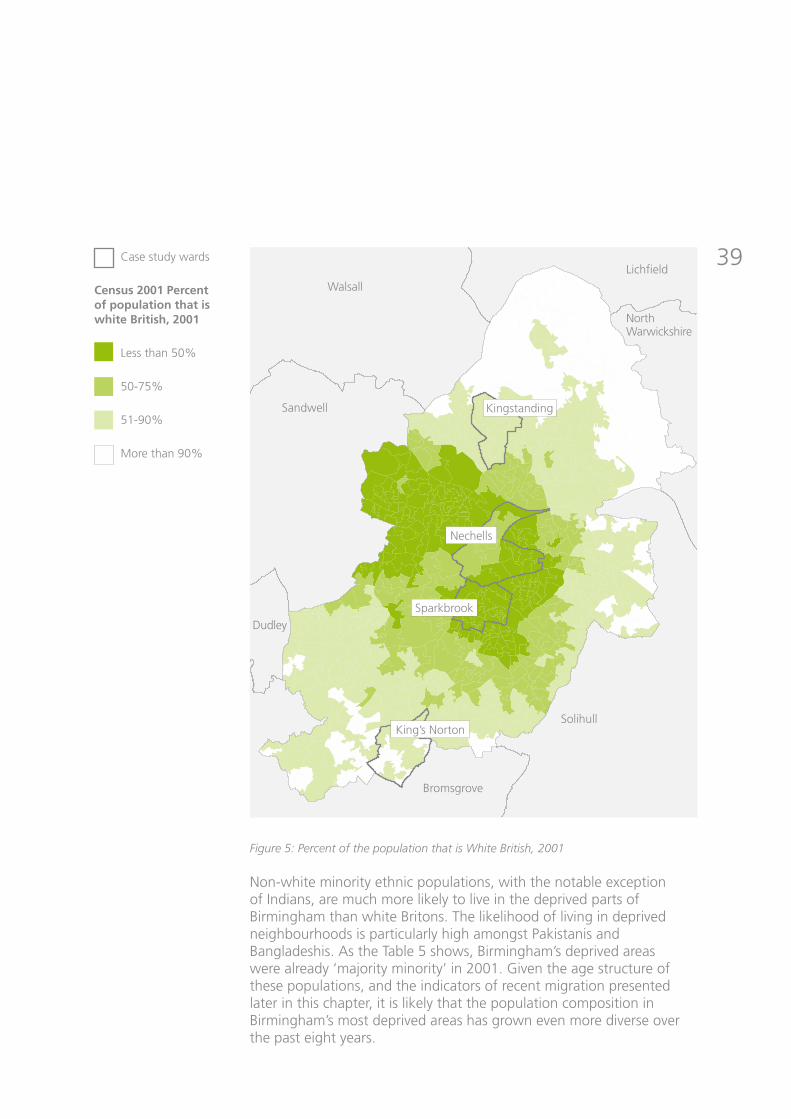
Today, minority ethnic populations are not equally distributed throughout Birmingham, but are concentrated predominantly in inner-urban areas. As shown in Figure 5, most of these areas where non-white people comprise over half of the population coincide with the most deprived areas on the deprivation map (compare with Figure 1 page 14).
38
39
Figure 5: Percent of the population that is White British, 2001
LichfieldWalsall
North Warwickshire
Solihull
Bromsgrove
Dudley
Kingstanding
Nechells
Sparkbrook
King’s Norton
Sandwell
Case study wards
Census 2001 Percent of population that is white British, 2001
Less than 50%
50-75%
51-90%
More than 90%
Non-white minority ethnic populations, with the notable exception of Indians, are much more likely to live in the deprived parts of Birmingham than white Britons. The likelihood of living in deprived neighbourhoods is particularly high amongst Pakistanis and Bangladeshis. As the Table 5 shows, Birmingham’s deprived areas were already ‘majority minority’ in 2001. Given the age structure of these populations, and the indicators of recent migration presented later in this chapter, it is likely that the population composition in Birmingham’s most deprived areas has grown even more diverse over the past eight years.

40
This begs the question: are these neighbourhoods poor because they are predominantly non-white, or are they predominantly non-white because they are deprived and offer cheaper housing opportunities? What is the role of ‘ethnicity’?16
According to national data, non-white ethnic groups have, on average, higher levels of unemployment, lower skills and qualifications, and lower incomes than white Britons.17 The poverty rates amongst ethnic minority populations are higher than those of white Britons. The highest rates of poverty can be found amongst Bangladeshi, Pakistani and Black African populations. Regardless of which measures of poverty and deprivation are used, such as lack of material goods, duration of poverty or income insecurity, minority ethnic populations have a higher risk of living in poverty.18
White British
Irish
Indian
Pakistani
Bangladeshi
Black Caribbean
Mixed White/Black Caribbean
% of Birmingham’s population
65.6
3.2
5.7
10.6
2.1
4.9
1.6
% of most deprived areas’ population
49.8
3.0
5.4
20.4
4.5
7.3
2.2
% living in most deprived areas
30.5
37.5
38.2
77.2
85.5
60.4
56.5
Table 5: Area deprivation and ethnic population in Birmingham (Census 2001; IMD 2004)
16 ‘Ethnicity’ is a more relevant concept than race in the present discussion of inequalities. Whereas ‘race’ is seen to imply belief in the existence of significant biological difference in physical, but also mental, characteristics, ‘ethnicity’ brings together a range of characteristics – language, national origin, physical appearance and cultural practices from food to religion. Unfortunately, it is only sometimes possible to analyse these aspects of ‘ethnicity’ separately. The research sometimes could not avoid using the ethnic categories used in UK official statistics, which are organised by ‘race’, and then by regional or national origin – for example ‘Black/Black British – African’.
17 Family Resources Survey 2002–2005.18 L. Platt (2007) Poverty and Ethnicity in the UK, Joseph Rowntree Foundation.

41One implication of this is that the greater likelihood that non-white people live in poor neighbourhoods can be accounted for in part by socio-economic characteristics of those people, rather than the characteristics of those places. The concentration of non-white people in some of the poorest neighbourhoods in Birmingham is strongly related to their lower average economic position, and hence their more constrained choice in where to live. Within those constrained choices, people will go where housing is made available to them, either by the state, the market or by informal or family contacts, and where they believe they will be happiest with the neighbourhood’s facilities and social environment. As already argued, we should look at demographics, labour markets, migration and housing to understand why one or another group of people become concentrated in one place, rather than jumping to assume that it reflects a conscious desire to segregate.
Skills and Human Capital
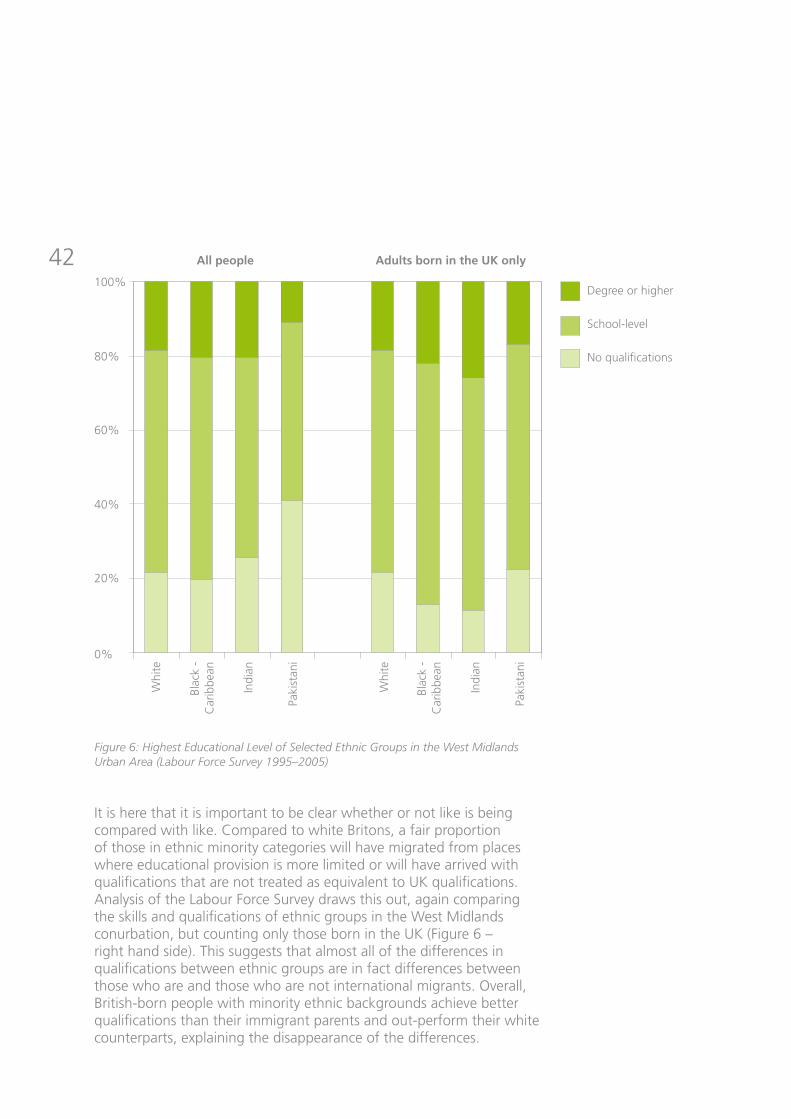
If ethnic inequalities in employment and pay are an important part of determining people’s income, and hence their choice of where to live, then the causes of these differences in employment and income need to be explained. The relationship between education and income is a well-established one: people with higher educational attainment tend to have better employment prospects and higher wages. Analysis of the Labour Force Survey in the West Midlands Conurbation revealed significant differences in the highest educational qualification between different ethnic groups (Figure 6 – left hand side). When the working-age population as a whole is considered, a higher proportion of those in the non-white minorities have no skills and qualifications, with all that implies for their employment prospects. However, the graphs also show that most of these apparently ‘ethnic’ differences in qualifications disappear when we look only at the differences between those born and brought up in Britain.
42
It is here that it is important to be clear whether or not like is being compared with like. Compared to white Britons, a fair proportion of those in ethnic minority categories will have migrated from places where educational provision is more limited or will have arrived with qualifications that are not treated as equivalent to UK qualifications. Analysis of the Labour Force Survey draws this out, again comparing the skills and qualifications of ethnic groups in the West Midlands conurbation, but counting only those born in the UK (Figure 6 – right hand side). This suggests that almost all of the differences in qualifications between ethnic groups are in fact differences between those who are and those who are not international migrants. Overall, British-born people with minority ethnic backgrounds achieve better qualifications than their immigrant parents and out-perform their white counterparts, explaining the disappearance of the differences.
Whi
te
Whi
te
Blac
k -
Car
ibbe
an
Blac
k -
Car
ibbe
an
Indi
an
Indi
an
Paki
stan
i
Paki
stan
i
100%
60%
80%
40%
20%
0%
All people Adults born in the UK only
Degree or higher
School-level
No qualifications
Figure 6: Highest Educational Level of Selected Ethnic Groups in the West Midlands Urban Area (Labour Force Survey 1995–2005)

43The sample size of even the Labour Force Survey is too small to easily identify whether, and why, ethnic minorities in Birmingham are less likely to be in well-paid or higher status employment than white Britons with equivalent qualifications. Nationwide research finds that, despite upward educational and occupational mobility, ‘ethnic penalties’ in the labour market can be identified for the British-born black African, black Caribbean, Pakistani and Bangladeshi men in unemployment, earnings and occupational attainment.19
Research on pay shows that international migration specifically, rather than ethnicity generally, is a central explanation for differences between ethnic groups. The average pay gap between newly arrived migrants and their native born counterparts is over 30% for men and 15% for women.20 Although this pay penalty declines with years spent in Britain, it is a difference that takes an average male-born migrant 20 years to eradicate.
The process is, however, somewhat quicker for women and there is a great deal of variation between migrants from different countries. The relevance of this to understanding the distribution of poverty becomes clear when looking at the numbers of international migrants arriving in different case-study areas. As Figure 7 shows, the inner-urban, deprived areas in Birmingham, such as Ladywood (including Nechells) and Sparkbrook/Small Heath, receive exceptionally high numbers of international immigrants relative to other parts of the city and the UK. The numbers arriving in Erdington (Kingstanding) and, especially, Selly Oak (King’s Norton) are far fewer. These figures are drawn from National Insurance registrations so are not an actual count of in-migration by year: they do not include, for example, children or others who are not in the labour market, such as women caring for children. Nonetheless, this considerable migration affects the population composition of the areas and will affect poverty rates if large numbers of the migrants are, initially at least, in insecure or low-paid employment. The population will face further pressures if, as the previous chapter showed, those moving out of poor neighbourhoods are more likely to be in managerial and professional occupations.
19 T. Modood (2003) ‘Ethnic differentials in educational performance’, in D. Mason (ed.) Explaining Ethnic Differences: Changing Patterns of Disadvantage in Britain, Policy Press.
20 R. Dickens and A. McKnight (2008) Assimilation of Migrants into the British Labour Market, Centre for Economic Performance, LSE.

44
While significant proportions of these new migrants to Sparkbrook are Polish and Pakistani, the Nechells area in Ladywood has over the past decade experienced a notable increase in the number of migrants from both Poland and sub-Saharan Africa. Not all the resources needed by recent migrants are readily made available by the state. Several of the voluntary organisations contacted in this research were engaged, among other things, in assisting clients who were international migrants, supporting those with insufficient knowledge of the workings of state systems (such as social housing and the regulation of private housing) and other institutions, such as utilities. Community representatives and workers also pointed to limitations in the availability, accessibility and sometimes quality of English as a second or other language (ESL or ESOL training).
Figure 7: International in-migration indicator, Birmingham Parliamentary Constituencies 2005–2007 (HMRS National Insurance Registrations)
UK Average
Ladywood
Sp’brook & Sm’Heath
Perry Barr
Edgbaston
Erdington
Selly Oak
Hodge Hill
Yardley
Hall Green
Northfield
0 500 1000 1500 2000 2500 3000 3500
Poland
Pakistan
India
All others

45Racism and ‘Cultural Issues’
In urban areas such as Sparkbrook and Nechells, it is important to note that, once migration is taken into account, there is weak evidence to suggest that the ethnic composition of the population is the key explanatory factor in deprivation. There are, however, some factors that may influence the ability of some of the minority ethnic households living in these areas to move securely out of poverty and, if they wished, to move elsewhere in the city.
The most significant of the ethnicity-related explanations is the role of racism and discrimination. Although legislative measures have prohibited ethnic discrimination since 1976, covert, indirect and subtle discrimination continue to affect the employment and career development opportunities of non-white people. White and non-white residents interviewed in Sparkbrook and Nechells almost universally stated that they had not experienced racial harassment or conflict within their own neighbourhoods – but many felt that there was racism towards the area and this affected how its residents were treated in the wider world.
A low level of economic activity among South Asian Muslim women, with few double-income families, adds to the poverty of such households. The single-earner household pattern is particularly prominent amongst foreign-born Pakistanis and Bangladeshis, who comprise a large proportion of Sparkbrook’s population. Recent research findings, however, suggest that British-born Muslim girls have made significant progress and achieved much higher levels of qualifications than their foreign-born mothers. This is likely to affect the fertility rates among British-born Muslim women, as women with higher levels of educational attainment commonly delay having children and aspire to have fewer children than their less educated counterparts.
46Case Studies: Stigma and Discrimination
The fieldwork team sought to find out whether, and how, racism was experienced in the neighbourhood, particularly in the two inner-urban case-study areas with large minority ethnic populations. Some residents had experienced racial threats in other areas, but no respondent in either inner-urban case-study area felt that racism within their own neighbourhood was a problem. However, many felt that there was a clear difference in the way that the area was treated and viewed by outsiders. In a focus group in Aston, next to Nechells, participants said they did not see racism within the area, but felt that it very much existed towards the area. The fear of racism, discrimination, or more generally feeling like an outsider was also a strong factor in discouraging young people from leaving the area, especially in Sparkbrook.
As in Kingstanding and King’s Norton, many respondents in Nechells thought that their area was viewed as rough by people who lived elsewhere: ‘proper ghetto’ (Jacob, Nechells). The choice of the word ‘ghetto’ here is significant, suggesting as it does a specifically racial element to the area’s poor reputation. This came out more overtly in another interview:Interviewer: Have you ever invited them [college friends] down to Nechells?Elesha: No they wouldn’t come down. They think it’s rough. They think it’s a rough area. So no.Int: Actually how do you think people in general who don’t live here see this area?Elesha: Rough.Int: Rough?Elesha: Because they hear it all on the news. People make it [the area], and you know black people say that they’re picking on me because I’m black and its not, it’s because black people give themselves a bad name when they shouldn’t.

47
21 See, for example, N Finney and L Simpson (2007) ‘Internal Migration and Ethnic Group: Evidence for Britain from the 2001 Census’/ Population, Space and Place/ 14. 63-83.
Beyond Race and Ethnicity?
Deprived areas such as Nechells and Sparkbrook should not be seen ethnic enclaves. As Simpson, among others, has argued, non-white people are more likely to move away from ethnically diverse areas than their white counterparts, indicating that the attachment of minority ethnic residents to these areas is not the primary factor that prevents them from leaving.21 Analysis of the migration statistics for this research showed that non-whites already living in Birmingham were more likely to be leaving than moving into the areas where there are most ethnic minorities. In the interviews for this research, young people’s aspirations of where they would like to live were much more frequently expressed in terms of an area’s prosperity rather than of its ethnic composition.
As well as looking at some of the differences between neighbourhoods and ethnic groups as measured by official statistics, it is worth considering what people in those neighbourhoods make of differences themselves. The interviews with young people in the case-study areas suggest the development of a youth culture in which ethnicity is regarded as of less importance in shaping their lives than other factors, such as the area where they live. Respondents sometimes explicitly repudiated official ethnic categories. For example, when asked for his ethnic identity, one young man described himself as of ‘urban’ ethnicity. Some young people also created their own ethnic categories, perhaps to illustrate the irrelevance of the official categories to there lived experience. As 17-year-old Elesha put it: ‘my dad’s from Jamaica; my mum’s half Asian, half white so that means I’m Jamaican Indian’.
Ethnicity-focused initiatives to improve the areas were not viewed favourably by the workers and voluntary activists interviewed. The key reasons they gave were the meaninglessness of the existing ethnic categories and the exclusionary force of such initiatives. As one community representative remarked, many problems in deprived areas affect a cross-section of residents regardless of their ethnicity. Growing numbers of young people classified as ‘minority ethnic’ are of mixed heritage or British-born, or both, and do not fit comfortably into any of the ethnic categories. Even amongst the British-born, the importance of ethnic identity may be fading. Although ethnicity may form an aspect of identity, it is not necessarily the most central one and other identities may be regarded as more important. Equality initiatives are increasingly focusing on diversity and inequality more broadly – a development often welcomed in ethnically diverse areas.

Church of the God of Prophecy, Nechells

49
22 R Lupton (2003) ‘Neighbourhood Effects’: Can we measure them and does it matter? CASE Paper 073
In policy and service design, non-white skin or ‘ethnic group’ should no longer be used as a proxy for migrant status or migrant past, as more and more non-white people in the UK are British-born and a growing proportion of white residents are immigrants. New migrants who were not recruited directly from abroad tend to be disadvantaged in comparison to established residents regardless of their skin colour or ethnicity. Although racism and discrimination are likely to affect non-white migrants more than their white counterparts, factors such as limited language skills that have a major influence on employment prospects and labour market position require measures that target all new migrants rather than some specific ‘ethnic’ groups.
How living and growing up in a high-poverty neighbourhood affects individuals has been much analysed in the academic and policy literature.22 Research approaches have ranged from sophisticated statistical modelling seeking to identify an independent effect of neighbourhood on life outcomes to in-depth qualitative studies based on interviewing or participant observation in selected areas.
Does the geographical concentration of disadvantaged people, described above, matter in the sense that it imposes additional obstacles to individuals improving their circumstances and wellbeing? The evidence is not easy to interpret and is rather mixed. Part of the problem is that ‘place’ is a complex concept: it encompasses physical aspects, such as buildings and location, institutional aspects, such as the allocation and organisation of public services, and social and cultural aspects, such as population composition and history.
Some of the most important effects of place upon people in deprived areas postulated by the literature are:
• The loss of sense of personal and collective efficacy; low aspirations and cultural expectations; lack of knowledge of opportunities in education and employment;
• Unequal treatment in employment or by institutions for residents of areas with a poor reputation;
• High demands placed on local public services by people with more needs and fewer resources to help themselves;
• Unequal or unfair allocation of public money to high- poverty neighbourhoods;
• A lack of spending power to support variety and quality in local private-sector services.
50Conclusions From Case Study Interviews with Young People
• The physical, social and institutional aspects of place each affected the lives of the young adults interviewed in the case-study neighbourhoods.
• For many, secondary school had been a difficult and disrupted environment, and the education of many had been broken up by suspension, forced transfer, expulsion or reduced timetables.
• Gender differences in the kind of paid work sought were very strong: young women aspired to work in public- and private-sector services, whilst for most young men, trades and similar occupations were desirable.
• A risk of violence was seen as a given feature of life, particularly for young men; sticking to some parts of the district and the city, and avoiding others, was an important way of mitigating this danger.
• Some felt frustrated and bored by the limited opportunities where they lived.
• A belief that outsiders looked down upon the neighbourhood and other places like it was, for some, tempered by a sense of equality or, in fewer cases, community within the area.


53Chapter Five: The Response

55The primary purpose of the study is to enhance knowledge of the distribution of neighbourhood deprivation in Birmingham and to better understand the dynamics of migration, mobility, housing and the labour market in poor neighbourhoods. In the course of the research a considerable number of stakeholders working and volunteering in deprived areas were interviewed. Some of these interviewees worked in the public sectors in, for example, regeneration initiatives or housing. Others were involved in various ways in local voluntary organisations that provided specific services and facilities within the case-study neighbourhoods. Therefore, before concluding with some suggestions for further research, this chapter briefly considers the response to concentrations of deprivation.
The Voluntary Sector
The research team worked with several voluntary and community organisations (VCOs) in each case-study area, both to provide perspectives on the neighbourhoods and to assist in the recruitment of hard-to-reach groups for the resident interviews. However, forming an accurate, representative and comprehensive picture of the whole range of voluntary-sector activities in the case-study areas is complicated. While BVSC (Birmingham Voluntary Service Council), an umbrella support organisation for voluntary and community organisations (VCOs) in Birmingham, provides a database of voluntary-sector agencies by type, location and services provided, many organisations have not registered with this and are hence more difficult to locate. An overview of the agencies in the database shows that while many citywide agencies, or other service providers with larger catchment areas, serve the case-study wards, few are actually located in these areas. Consequently, even if a good range of services are available in principle, people living in these areas may not be aware of them or may experience difficulties in accessing them. For example, transport connections and costs and commitments to provide care can all impinge on the ability of people on low incomes in particular to make use of services.
Not surprisingly, VCO services in the case-study neighbourhoods addressed issues that were seen by the providers to be particularly common or to constitute particular social problems in the areas. In practice this meant support for young mothers, victims of domestic abuse, the disabled and disadvantaged people, and providing activities to divert young people away from crime.
Chapter Five: The Response

56 Many of the services based in or covering Sparkbrook and Nechells also addressed themselves to the problems that confront recently arrived migrants or certain ethnic minorities. Such organisations had often been founded to provide mutual assistance among those of a common cultural or religious background distinct from the wider majority. They mediate on behalf of immigrants in difficulty with what might be unfamiliar institutions, such as utility companies, or unfamiliar rules, such as benefits entitlements and landlord-tenant law. However, even if they had emerged within particular communities, the organisations contacted in the course of the research were in fact open to everybody. Instead of showing signs of ethnic exclusivity, their clientele appeared to reflect the mix of those in need. More well-established VCOs had moved to identifying their services in terms of particular ‘issues’ rather than particular client groups. The development of self-help organisations among migrants is a longstanding pattern and those with an overview of Birmingham’s VCO scene noted groups continuing to emerge among recent arrivals. They are also unlikely to be in touch with structures, like BVSC, which aim to support VCOs.23
Christian churches represent another basis upon which VCOs might be founded; indeed, some of the more localised voluntary-sector agencies that could be located in Kingstanding and Nechells via BVSC, and were consequently contacted in the research, had originated in this way. In Kingstanding, in particular, both Catholic and Protestant churches were active. Christian-based organisations were engaged in a range of services, including youth work. However, as with the longer established culturally founded groups in Sparkbrook, interviewees stated that their clientele extended beyond the congregations and the faithful, and instead reflected the composition of the local population comprising people from all kinds of backgrounds, including from other religious affiliations.
Certain themes emerged across the board from interviews with individuals active in VCOs. These themes are familiar from much previous research on the voluntary and community sector: lack of funding, lack of knowledge of where additional or more continuous funding may be acquired and lack of the skills required to ensure better access to funding. However, the effect of inadequate or unreliable funding may be most pronounced in areas like the case-study neighbourhoods, where the level of need amongst the local population is particularly high and the financial resources of the community members overall is limited.
23 A. Afridi (2007) Performance and Race Equality Project Research Report, B:RAP.

57Fragmentation and duplication of services was a concern for a number of reasons across the areas. For one, stakeholders reported that potential clients preferred highly localised services. This backs the views of residents in King’s Norton within the case studies where each of the three estates inspired its own loyalty, and so different youth clubs served different though relatively close areas. In some areas – Kingstanding for example – community organisations were involved in networks to coordinate their activities and reduce duplication. Duplication was also possible between the public sector and voluntary organisations. This could happen if services were commissioned with area-based funding, for example, without a full understanding of the existing range of organisations and activities in a neighbourhood.
Regeneration and Renewal
As with the voluntary sector, it was not an aim of the research to carry out a thoroughgoing review of regeneration programmes in operation across Birmingham. However, state-funded interventions intended to address the perceived problems of the case-study neighbourhoods formed an important and unavoidable part of both their history and their current landscape. The UK has a long tradition of area-based interventions: policy programmes which seek to bring about an improvement of some sort within local priority areas. Amongst the earliest area-based policies were the Educational Priority Areas of the late 1960s, and Sparkbrook was among the small number of neighbourhoods targeted by this programme.24
The emphasis of some past programmes has been on the built form and physical environment of disadvantaged neighbourhoods. As discussed previously, among the case-study neighbourhoods, Nechells has experienced this type of physical regeneration twice in the period since World War II. It was among the first areas scheduled for slum clearance, and then underwent a further round of demolition and rebuilding in the 1980s and 1990s under the ‘Birmingham Heartlands’ programme, which sought, among other things, to replace defective and unpopular housing types.
New Labour, particularly in its early period in the late 1990s, placed particular emphasis on reducing place-based disadvantage. A central policy for this was the New Deal for Communities (NDC). This was distinct from previous policies in both its tight geographical focus on 39 highly disadvantaged neighbourhoods, in its initial emphasis on
24 Community Development Programme (n.d.) Gilding the Ghetto: The State and Poverty Experiments, CDP.
Kingstanding Leisure Centre, on the Kingstanding Estate.
58 community governance, and in the amount and length of funding provided: in the region of £5 million a year for ten years to each NDC. There are two NDC areas within Birmingham: Aston and, among the case-study neighbourhoods, the Three Estates in King’s Norton. Funding from the NDC also supported a number of the organisations interviewed in the research in King’s Norton, although the ten-year period is soon to finish.
It is clear that even previous large-scale physical programmes like the Heartlands in Nechells have not brought about a radical change in the disadvantaged neighbourhoods’ position relative to other parts of the city. Despite the investment in physical and social infrastructure, they continue to have rates of poverty and deprivation well above the city and national averages. This begs the question of whether this is attributable to flaws in the design of the programmes or whether the constant movement of people and households will naturally tend to reproduce concentrations of deprivation. The NDC included a comprehensive evaluation that included longitudinal surveys of residents of the target areas, and studies of moves and of comparator areas. When the final report on this becomes available, it is hoped that it will answer at least some of these questions.
Areas for Further Research and Discussion
Whilst some of the problems and dynamics of poor neighbourhoods described in this report are well known and well researched, others merit further investigation to inform the work of policy-makers and practitioners.
Firstly, the broad context for the study is the economic restructuring of Birmingham, with the decline of manufacturing and the increased size and importance of service industries. However, both the objective evidence provided by data on real wages and the qualitative research from the resident interviews point to an increase in low-paid, unsatisfying and insecure forms of employment. This suggests that those involved in local and regional economic development need to look at ways to not only create jobs and reduce unemployment, but also to foster industries that offer better paid, more secure and higher-status work.
59International migration and the movement of people within cities have been shown in this report to contribute to the long-term persistence of concentrations of disadvantage in particular places. Over the past ten years there has been a considerable increase in the range of sources available to understand neighbourhood-level population turnover, lettings patterns and indicators of deprivation, and further analysis of these would offer the opportunity to understand better the dynamics of different types of deprived area. This would have obvious applications to the design and evaluation of regeneration programmes, as noted above. Relatively little is known about the moves of new migrants after their arrival in the country and greater knowledge of this could contribute to the effective provision of reception services.
Popular images of deprived neighbourhoods in major urban areas often focus on the archetypal inner city. Suburban and peripheral areas are somewhat less researched and there remains scope to look further at the particular dimensions in which outer areas experience high levels of disadvantage. Where, as in Birmingham, the ethnic composition of outer deprived areas is predominantly white British, such research might also seek to look at the roots of resentment and, where it has emerged, racialised politics.
The findings on ethnicity and disadvantage in Birmingham suggest that while ethnicity has become a common starting point for analysing inequalities, it is not in itself an explanation for differences between ethnic groups. Factors such as international migration may go further towards explaining why some groups do better than others on measures like income, educational attainment and health. Those charged with monitoring and reporting equalities need to go beyond merely providing statistical breakdowns by standard ethnic categories to look at what factors explain these differences and, where possible, act on them. This sort of analysis needs to start by looking at the specific ‘issue’ – for example, GCSE attainment – not by looking at ‘ethnicity’.
The fact that different regeneration initiatives have not produced major adjustments in the relative position and hierarchy of neighbourhoods is striking. It is, however, not surprising when the findings on housing and mobility are considered: differentiation of neighbourhoods is to be expected where income determines where one can live. An unequal society is likely to produce spatial polarisation, as the better-off pay more to live in more ‘desirable’ areas. This is not to suggest that area

60 regeneration, involving both social and economic investment, and, where necessary, physical improvements to housing and infrastructure, should be abandoned. However, it does suggest that we should not rely on regeneration to ‘transform’ areas, but also look at how core public resources are allocated to ensure that they are commensurate with varying levels of need and deprivation in different neighbourhoods. Even though inequalities might persist, people of all backgrounds, in Birmingham and beyond, might be assured of the quality of life and range of opportunities to which they might reasonably aspire.


Design by: David Carroll & Co

Barrow Cadbury TrustKean House6 Kean StreetLondonWC2B 4AS
T 020 7632 9060F 020 7632 9061
www.barrowcadbury.org.uk