
WHY DO FIRMS EVADE TAXES? THE ROLE OF INFORMATION …
59
WHY DO FIRMS EVADE TAXES? THE ROLE OF INFORMATION SHARING AND FINANCIAL SECTOR OUTREACH By Thorsten Beck, Chen Lin and Yue Ma August 2010 European Banking Center Discussion Paper No. 2010–26 This is also a CentER Discussion Paper No. 2010-93 ISSN 0924-7815 brought to you by CORE View metadata, citation and similar papers at core.ac.uk provided by Research Papers in Economics
Transcript of WHY DO FIRMS EVADE TAXES? THE ROLE OF INFORMATION …
WHY DO FIRMS EVADE TAXES? THE ROLE OF INFORMATION SHARING AND FINANCIAL SECTOR OUTREACH
By Thorsten Beck, Chen Lin and Yue Ma August 2010 European Banking Center Discussion Paper No. 2010–26
This is also a CentER Discussion Paper No. 2010-93
ISSN 0924-7815
brought to you by COREView metadata, citation and similar papers at core.ac.uk
provided by Research Papers in Economics

1
Why Do Firms Evade Taxes? The Role of Information
Sharing and Financial Sector Outreach
Thorsten Beck, Chen Lin and Yue Ma
This draft: 28 August 2010
Abstract: Informality is a wide-spread phenomenon across the globe. We show that firms in countries with better information sharing systems and greater financial sector outreach evade taxes to a lesser degree, an effect that is stronger for smaller firms, firms in smaller cities and towns, and firms in industries relying more on external financing, with higher liquidity needs and with greater growth potential. However, it is variation in firm size that dominates firm variation in location and industry variation in explaining cross-firm and cross-country variation in tax evasion. This effect is robust to controlling for an array of other measures of the financial and institutional environment firms face. The effect is also robust to controlling for fixed firm effects in a smaller panel dataset of Central and Eastern European countries many of which introduced credit registries or upgraded them in the early 2000s. JEL Codes: E26, G2, H26, O17 Key Words: Formal and informal sector, tax evasion, financial sector development, ________________________________________________________________________ Beck ([email protected]): Tilburg University and CEPR; Lin: City University of Hong Kong and Ma: Lingnan
University. We gratefully acknowledge comments by Alex Popov, Steven Ongena, Michael Weisbach, and
seminar participants at Tilburg University, Heriot-Watt University, St. Andrews College and the FIRS
Conference 2010 in Florence.

2
1. Introduction
A growing literature dating back to King and Levine (1993) demonstrates the
important connections between financial development and growth. Research in this area
generally finds that financial intermediary development exerts a first-order impact on
economic growth (e.g. Levine and Zervos, 1998; Demirgüç-Kunt and Maksimovic, 1998;
Beck and Levine, 2002). This important link has spurred further exploration into the various
channels through which the financial development influences the real side of the economy.1
More recently, the focus has shifted from financial depth to financial penetration and access
to finance by households and small enterprises (Beck, Demirguc-Kunt and Martinez Peria,
2007; Beck and Demirguc-Kunt, 2006). This paper assesses the impact of credit information
sharing and financial sector outreach on the incidence and extent of informality across firms
and across countries.
Existing studies in the finance and growth literature examine the links between
financial development and formal economic activities. Noticeably absent in this literature is
an examination of the links between financial intermediary development and informal
(unofficial) economic activities.2 The omission is somewhat surprising given the
pervasiveness of informality amongst firms in developed and developing countries alike, and
given the potentially important effect of informality on economic growth. According to
estimates by Johnson, Kaufmann and Zoido-Lobaton (1998) and Friedman et al. (2000), the
size of the unofficial economic activities as a proportion of GDP ranges from 10-15% in
developed countries and 19-46% in developing countries, and reaches in some cases, such as
Cameroon or Croatia, the staggering figure of 60% or more. As Johnson et al. (2000) point
out, informality can impede economic growth in several ways. First, firms operating
1 In this spirit, Beck, Levine and Loayza (2000) find that the level of financial intermediary development exerts a large and positive impact on total factor productivity growth, which feeds through to overall economic growth. Love (2003) provides evidence that financial development reduces firms’ financing constraints. Raddatz (2006) find that financial development has a large causal effect in the reduction of industrial output volatility. Using the banking crises as natural experiments, Kroszner, Laeven and Klingebiel (2007) find that more financially dependent sectors tend to experience a substantially greater contraction of value added during a banking crisis in countries with deeper financial systems than countries with shallower financial system. For a detailed review of the literature, we refer to Levine (2005). 2 For an excellent review on measurement and determinants of informal economic activity, see Schneider and Ernste (2000).

3
informally cannot make good use of market-supporting institutions and are therefore subject
to underinvestment problems. Second, doing business in secret may generate further
distortions because of the efforts in avoiding detection and punishment. Furthermore, the
hidden resources may not find their most productive uses. In fact, a series of high profile
sector studies by the McKinsey Global Institute conclude that “in Portugal and Turkey, for
instance, informality accounts for nearly 50% of the overall productivity gap with the United
States” (Farrell, 2004). Third, high aggregate informality costs the government tax revenues
and therefore might cause the under-provision of public infrastructure and services, which
will impede economic growth (Johnson et al., 2000; Loayza, 1996). Other authors question
the negative effect of informality on growth, pointing to informality as a second-best
response to institutional deficiencies and/or high taxation (Sarte, 2000). The relationship
between informality and growth might therefore be non-linear and the optimal level of
informality not zero. Firm-level evidence, however, suggests that informality in developing
countries is growth impeding rather than growth enhancing (La Porta and Shleifer, 2008).
Hence, understanding the relationship between financial intermediary development
and informality helps understand an additional channel through which financial development
can impact the real sector. Our paper aims to fill this gap by exploring in detail the role that
financial sector outreach plays in explaining cross-country and cross-firm variation in the
incidence and extent of informality and tax evasion. Specifically, we focus on two
dimensions capturing the outreach dimension of financial sector development: credit
information sharing and physical banking sector outreach.
The existing literature suggests several channels through which financial sector
outreach might affect corporate tax evasion. First, Johnson et al. (2000) point out that firms
are more likely to hide output in economies with underdeveloped market-supporting
institutions because they gain little from being formal. In this spirit, Straub (2005) develops a
model in which firms face a choice between formality and informality. Using this framework,
he shows that better access to formal credit services increases the benefits of formality. Beck,
Demirguc-Kunt and Martinez Peria (2007) find that banking sector outreach helps reduce
4
firms’ financing obstacles. Furthermore, as documented in the recent literature, credit
information sharing is associated with lower transaction costs (Miller, 2003), improved
availability and lower cost of credit to firms (Brown, Jappelli and Pagano, 2009), lower level
of corruption in bank lending to firms (Barth, Lin, Lin, and Song, 2009) and higher level of
bank risk taking (Houston, Lin, Lin, and Ma, 2010). Overall, this would imply higher benefits
from formality in economies with more effective credit information sharing and higher
branch penetration by gaining access to the formal financial sector.
Second, in order to evade the taxes, firms inevitably need to manipulate their financial
information (“cook the books”). As documented in the literature, firms suffer significant
reputation losses and incur much higher financing costs due to their illegal misconduct such
as corporate misreporting (e.g., Graham, Li and Qiu, 2008). From a bank’s perspective, tax
evasion creates uncertainty about the credibility of financial statements and signals low
quality of disclosed company information and other aspects of the firm's operations.3 In
addition, tax evasion is usually associated with significant legal liabilities, further worsening
future prospects of the firms and increasing the default risks. As a result, the perceived
information asymmetry between borrowers and lenders increases with higher tax avoidance.
The increased information asymmetry, in turn, affects banks’ lending decisions and requires
banks to monitor firms more intensively. The higher costs are passed along to borrowers in
the form of reduced credit availability, higher interest rates and more stringent loan terms
(Graham et al., 2008). In an economy with higher branch penetration and better credit
information sharing, the information of corporate misconduct can be more easily observed
and shared among all other potential lenders, which in turn will make it more difficult and/or
more expensive to receive future loans (Jappelli and Pagano, 2002).4 Hence, the opportunity
costs of engaging in tax evasion would be higher in countries with higher branch penetration
and better credit information sharing mechanisms. The aforementioned channels suggest that
3 The reputation losses might also affect the firm’s investors, customers, and suppliers and change the terms of trade on which they do business with the firm. This might further affects the firm’s value by reducing the present value of firm’s future cash flows (Graham et al, 2008). 4 In fact, tax information is often collected by credit registries or private bureaus and shared among financial institutions (Miller, 2003).

5
firms in countries with higher branch penetration and better information sharing have
stronger incentives to operate formally since both the benefits of formality and the costs of
informality are higher in these countries.
However, there might be a countervailing effect. As well documented in the literature,
the collateral value is also an important determinant of access to finance and the loan terms.
In the case of tax evasion and informality, the more wealth a firm hides, the less collateral it
can offer for securing a loan and the worse is the likelihood of getting access to credit with
reasonable terms and conditions. As shown by Blackburn, Bose and Capasso (2009), the
marginal net benefit of tax evasion thus decreases with easier access to credit. This effect
might be strongest for the informationally opaque firms since such firms could credibly
commit to lower asset substitution by providing collateral (Stulz and Johnson, 1985;
Holmstrom and Tirole, 1997). In economies with better credit information sharing and higher
branch density, however, the presence of collateral might be less important to creditors
because the information gap between creditor and borrower is smaller and because creditors
can monitor the firms more effectively.5 In this regard, the likelihood of access to finance
might be less sensitive to the change of the collateral values in economies with better credit
information sharing and higher branch density, while at the same time, the benefits of getting
access to finance would be higher in these countries. Therefore, the overall opportunity costs
of tax evasion, from this perspective, may be either higher or lower in more financially
developed countries, which leaves the question for our empirical tests.
Using a unique dataset across 43 countries and over 22,000 firms, we examine the
relationship between banking sector outreach, credit information sharing and corporate tax
evasion. We find very strong evidence that credit information sharing and banking sector
outreach are significantly and negatively associated with the incidence and extent of tax
evasion, suggesting that the net effect of financial sector outreach on corporate tax evasion
5 As Holmstrong and Tirole point out (p.665), “Firms with low net worth have to turn to financial intermediaries, who can reduce the demand for collateral by monitoring more intensively. Thus, monitoring is a partial substitute for collateral”. This is empirically confirmed by Beck, Demirguc-Kunt and Martinez Peria (2010) who show that banks are less likely to use collateral for small and medium enterprises in developed than in developing countries.

6
tends to be negative and significant. This result is robust to controlling for a standard
indicator of financial depth and for an array of other indicators of the institutional framework
firms operate in.
Using the same analytical framework as above, we conjecture that the relative
benefits and costs of access to formal financial services vary across firms of different sizes as
well as locations.6 Smaller firms and firms in smaller cities and towns stand to benefit more
from gaining access to formal finance than large firms and firms closer to the economic
center of a country.7 Similarly, firms that depend more on external finance for technological
reasons, such as a long gestation period or indivisibility of investment, as well as firms with
higher growth opportunities, benefit more from access to formal finance than others (Rajan
and Zingales, 1998; Houston et al., 2010). We should therefore observe a stronger
relationship between credit information sharing and banking sector outreach, on the one hand,
and tax evasion, on the other hand, for smaller firms, firms in smaller towns and firms that
rely more on external finance and have higher growth opportunities. Our empirical results
strongly confirm our expectations. The relationship between credit information sharing,
banking sector outreach and corporate tax evasion is indeed stronger for smaller firms, firms
in smaller cities, and firms in industries more dependent on external finance, with higher
liquidity needs and higher growth opportunities. However, it is variation in firm size that
dominates firm variation in location and industry variation in explaining cross-firm and cross-
country variation in tax evasion.
As final robustness test, we confirm our results for a more limited sample of 897 firms
across 26 Central and European countries, many of which introduced credit registries or
upgraded them in the early 2000s. These firms were interviewed in 2002 and 2005 so that we
can directly observe whether there is a relationship between changes in the quality of credit
information sharing and firms’ tax evasion. We confirm our results both for the level and the
differential effect of credit information sharing on tax evasion, further alleviating concerns of
6 Straub (2005) shows how the threshold size, above which a firm decides to become formal, varies with different institutional and financial constraints. 7 For the relative effect of financial sector depth on the growth of small vs. large firms, see Beck, Demirguc-Kunt and Maksimovic (2005).

7
simultaneity and endogeneity biases.
This paper contributes to the literature in several important ways. First, this is the first
paper, to our best knowledge, that links specific dimensions of financial sector outreach, i.e.
credit information sharing and branch penetration, to the incidence and extent of informality.
The empirical findings shed light on an important channel (i.e. reducing informality) through
which financial intermediary development can improve economic growth. While previous
work had to rely mostly on aggregate financial depth indicators such as total credit in an
economy, financial penetration through banking sector outreach has only recently become a
topic of interest, mainly due to the availability of data (Beck, Demirguc-Kunt and Martinez
Peria, 2007). In this study, we use data on branch penetration per capita and per square km to
capture the geographic proximity of bank outlets to enterprises (Beck, Demirguc-Kunt and
Martinez Peria, 2007). We thus contribute to the exploration of the real economy effects of
banking sector outreach, beyond financial depth.
Second, this paper is related to a small but growing literature on credit information
sharing. In their theoretical work, Pagano and Jappelli (1993) show that information sharing
reduces adverse selection by improving the pool of borrowers. It can also reduce moral
hazard risk through its incentive effects on curtailing imprudent borrower behavior (Padilla
and Pagano, 1997). Using cross-country data, Jappelli and Pagano (2002) find that the
breadth of credit markets is associated with information sharing. More recently, Djankov,
McLeish, and Shleifer (2007) find that both creditor protections through the legal system and
information-sharing institutions are associated with higher ratios of private credit to GDP
using country-level data in 129 countries. Using firm-level data, Brown, Jappelli and Pagano
(2009) show that credit information sharing reduces firms’ financing obstacles and increases
external financing, while Barth et al. (2009) show that it helps reduce corruption in lending.
Our paper adds to the literature by finding evidence that information sharing is also an
effective device in curbing corporate tax evasion.
Third, the study is related to the determinants of informality, most of which focus on
specific factors that can explain informality such as high tax rate, burdensome regulation,

8
corruption, organized crime and inadequacy of the institutional environment (e.g. Johnson
and Shleifer, 1997; Johnson et al, 1998, 2000; Friedman et al., 2000; Botero et al., 2004;
Dabla-Norris, Gradstein and Inchauste, 2008). We add to this literature by showing that credit
information sharing and financial sector outreach are important determinants of informality.
While our paper offers novel insights and results, some caveats are due. First, our
results come mostly from cross-sectional variation and although we control for an array of
other financial sector and institutional indicators, we can therefore not completely exclude the
possibility of omitted variable bias. We mitigate this concern, however, by testing for the
differential effect of information sharing and banking sector outreach on firms of different
sizes, locations and financing needs, by employing an instrumental variable analysis, and by
using firm-level fixed effects analysis for a smaller sample of countries. Second, our
measures of information sharing and banking sector outreach are proxies for the actual
possibility of firms to access formal financial institutions for credit, savings and transaction
services and thus subject to measurement bias. Previous research, however, has shown that
the quality of credit information sharing and banking sector outreach is associated with lower
financing constraints of firms (Beck et al., 2007; Brown et al., 2009).
The remainder of the paper is organized as follows. Section 2 describes data and
methodology. Section 3 discusses our results and section 4 concludes.
2. Data and methodology
In order to test the impact of financial sector outreach on the pervasiveness of tax
evasion, we combine firm-level data from the World Bank-IFC Enterprise Surveys with
indicators of financial sector depth, breadth and infrastructure as well as other
macroeconomic indicators. This section discusses the different data sources and variables we
will be utilizing and the methodology.
2.1 Data
We use data from the World Bank-IFC Enterprise Surveys to measure both the degree
9
of tax evasion and construct an array of firm-level control variables. The Enterprise Surveys
have been conducted over the past eight years in over 100 countries with a consistent survey
instrument.8 The surveys try to capture business perceptions on the most important obstacles
to enterprise operation and growth, but also include detailed information on management and
financing arrangements of companies. Sample sizes vary between 250 and 1,500 companies
per country and data are collected using either simple random or random stratified sampling.
The sample includes formal enterprises of all sizes, different ownership types and across 26
industries in manufacturing, construction, services and transportation. Firms from different
locations, such as capital city, major cities and small towns are included.
The use of firm-level survey data in cross-country work has become increasingly
popular in recent years and has several decisive advantages over the use of aggregate
country-level data.9 First, the dataset provides very unique and direct evidence on firm-level
corporate tax evasion, which is not available in aggregate numbers that are mostly
extrapolated (Dabla-Norris, Gradstein and Inchauste, 2008). Second, we are able to explore
within-country variation in tax evasion across firms of different types. Specifically, we will
be able to compare firms of different sizes and in different locations, as well as firms from
industries with different financing needs, thus not only getting closer to the issue of causality
by applying a difference-in-difference approach, but also testing more specific mechanisms.
Third, by utilizing firm-level data, we are able to control for cross-country differences in the
composition of corporate sectors, which might cause a spurious correlation in aggregate
regressions.
We use data from 65 surveys across 43 countries over the period 2002 to 2005. 18
countries have conducted two surveys, while two countries have conducted three surveys; the
8 See www.enterpriseseurveys.org for more details. Similar surveys were previously conducted under the leadership of the World Bank and other IFIs in Africa (REPD), the Central and Eastern European transition economies (BEEPS) in the 1990s and world-wide in 2000 (World Business Environment Survey). 9 Among the many studies using firm-level surveys, Beck, Demirguc-Kunt and Maksimovic (2005) show a negative relationship between self-reported financing constraints and actual firm growth, a relationship stronger for small firms and in countries with less developed financial systems; Djankov et al. (2003) show that a higher degree of judicial formalism is associated with lower perceptions of enterprises of courts’ fairness, honesty and consistency; Beck, Demirguc-Kunt and Levine (2006) and Barth et al. (2009) show that a more market-based supervisory approach and more efficient systems of credit information sharing are associated with lower financing constraints.

10
remaining 23 countries have one survey each. Note, however, that these are not panel data,
as not the same firms are being surveyed in subsequent surveys in the same country. As our
variables of interest – branch penetration and credit information sharing – are either available
only at one point of time or show little if any time variation, our variation comes from the
cross-section rather than time-series. In order to control for confounding factors, we control
with year dummies for the year of the survey. We also confirm all our findings with
regressions that only use data from the latest enterprise survey of each sample country.
We construct the tax evasion variable using responses from the following question:
“Recognizing the difficulties many enterprises face in fully complying with taxes and
regulations, what percentage of total sales would you estimate the typical establishment in
your area of activity reports for tax purposes?” Using responses on this question, we
construct two variables: the tax evasion ratio is one minus the share of sales reported for tax
purposes, while the tax evasion dummy is one if a company reports that any sale goes
unreported. The tax evasion ratio ranges from an average of 42% in China to less than 3% in
Chile, with an average across countries of 16%. While in Brazil 83% of firms report tax
evasion in their industry, in Chile it is only 14 % and the average across countries is 45%.
Table 1 reports the average values for these two indicators across the countries in our sample.
However, there is not only a large cross-country, but also a large within-country variation in
tax evasion. Specifically, the between country standard deviation of the tax evasion ratio is
0.116, while the within-country standard deviation is 0.237, thus almost twice as large.10
[Table 1 here]
The question on tax evasion is worded in this indirect way to elicit more honest
answers. On the other hand, this wording might provide some measurement error as
responses might truly reflect perceived industry averages rather than own behavior. There
are several reasons to believe that this will not bias our results. First, tax evasion ratios are
10 The within-country standard deviation is calculated using the deviations from country averages, whereas the between-country standard deviation is calculated from the country averages.

11
relatively stable over time within a country. The correlation between tax evasion ratios from
the Enterprise Surveys and from the World Business Environment in 1999/200 is 64%.
Second, there is a high correlation between the ratio of informal activity to GDP and tax
evasion. Specifically, using data from Schneider and Ernste (2000) we find a correlation
coefficient of 65%, significant at the 1% level. We also find a high correlation (>60%)
between our tax evasion measure and the tax evasion index developed by the World
Competitiveness Yearbook.11 Finally, if firms evading taxes to the same degree respond
differently to the question in different institutional environments, this would bias our results
against finding any significant relationship. A somewhat different measurement concern is
that we measure tax evasion only for existing formal enterprises, thereby not capturing
informal enterprises; however, this will rather underestimate the variation in tax evasion
across countries (Johnson et al., 2000).
We relate our measures of tax evasion to an array of financial sector indicators. We
start with a standard indicator of financial depth, Private Credit to GDP, which measures
total outstanding claims of financial institutions on the domestic nonfinancial private sector,
relative to GDP (Beck, Demirguc-Kunt and Levine, 2010). Previous research has shown a
positive and significant relationship between financial sector depth and economic growth
(Beck, Levine and Loayza, 2000). While Private Credit to GDP has been traditionally used
as indicator of financial development, it does not properly measure the breadth of the
financial system, i.e. the extent to which financial institutions cater to smaller and
geographically more remote customers. We therefore use a recently compiled data set on
banking sector outreach (Beck, Demirguc-Kunt and Martinez Peria, 2007). Specifically, we
use geographic branch penetration, which is the number of bank branches per square
kilometer and demographic branch penetration, which is the number of bank branches per
capita, both measured for 2003/4.12 While both indicators of branch penetration are
positively correlated with Private Credit to GDP, this correlation is far from perfect. For
11 This indicator is based on expert assessment of how widespread tax evasion is in a country, ranging from zero – common – to ten – not common. 12 Beck, Demirguc-Kunt and Martinez Peria (2007) also present data on the number of loan account and the average loan balance to income per capita, but these data are available for a much smaller set of countries.

12
example, both Estonia and El Salvador have Private Credit to GDP ratios around 40%, but
demographic branch penetration is 15.2 per 100,000 people in Estonia, while it is 4.6 in El
Salvador. Beck, Demirguc-Kunt and Martinez Peria (2007) show that higher branch
penetration is associated with a higher share of households and firms that use formal financial
services and with lower self-reported financing constraints of firms.
In addition to indicators of banking sector outreach, we use several indicators of the
information framework supporting the banking sector, as previous research has shown the
relevance of credit information sharing especially for smaller firms (Brown, Jappelli, and
Pagano, 2009). We include a dummy variable – Credit Information Sharing - indicating
whether a country has a functioning credit registry. We also use a more detailed indicator of
the Depth of Credit Information Sharing , which ranges from zero to six and indicates how
much information on what share of the borrower population is collected and distributed, as
well as whether both financial and non-financial institutions are tapped for information.
Specifically, a value of one is added to the index when a country’s information agencies have
each of these characteristics: (1) both positive and negative credit information are distributed;
(2) data on both firms and individual borrowers are distributed; (3) data from retailers, trade
creditors, or utilities, as well as from financial institutions, are distributed; (4) more than two
years of historical data are distributed; (5) data are collected on all loans of value above 1%
of income per capita; and (6) laws provide for borrowers’ right to inspect their own data.
We also include dummy indicators for the existence of a Public or Private Credit Registry
as well as indicators of the Private or Public Credit Registry Coverage, measured as the
number of firms and individuals listed in registries relative to the adult population. While
private credit registries have the advantage that they often include data from non-regulated
financial and non-financial corporations, public registries might be more complete as
reporting is compulsory. Since the earliest data available for Depth of Credit Information
Sharing and Credit Registry Coverage are from 2003 in the World Bank Doing Business
Databank, we use the average values of 2003 and 2005 for these variables. For Public of
Private Credit Registry dummies, the historical data are available from Djankov et al. (2007)

13
so that we use value for the same year as the respective firm-level survey. We control for an
array of firm characteristics that might be correlated with the decision to underreport sales
and which are defined in more detail in Appendix Table 1. Specifically, we include the size
of the enterprise, as measured by the log of number of employees, the log of firm age, the
location – capital city or small city/town, with medium-sized city the omitted category -, a
dummy variable if the firm is an exporter and the share of state ownership. Finally, we
control for the education of the manager of the firm, varying from less than secondary
education to postgraduate degree. From theory and previous research, we expect size, age,
exporter and state ownership to be negatively associated with tax evasion, while we expect
firms that are located in smaller towns to be more likely to evade taxes.13 The association
with manager education, on the other hand, is a-priori ambiguous. 23% of the firms in our
sample are small firms (fewer than 20 employees), while 45% are large firms (more than 100
firms), with an average of 30 employees. On average, firms are 14 years old and the average
share of government ownership is 7%. 21% of firms are exporting; 40% of firms are in small
cities and towns, while 31% are in the capital city. Finally, on average, managers have at least
secondary education.
We also include an array of country control variables. In addition to controlling for
financial depth, we include an indicator of Bank Concentration, which is the share of the
largest three banks’ assets in total assets of the banking system. Controlling for Private
Credit to GDP and Bank Concentration will increase our confidence that the proxies of
banking sector outreach and credit information sharing do not capture other dimensions of
financial development. In addition, we control for GDP per capita, to thus discriminate
between economic and financial development. Our sample varies between Madagascar with
162 U.S. dollars GDP per capita and Germany with a GDP per capita of more than 30,000
dollars. As with all time-varying country-level variables, we use the value for the same year
as the respective firm-level survey.
We also include several proxies for alternative explanations of tax evasion, using both
13 Ideally, we would like to have an indicator of actual distance from the economic center of the country, but are restricted to using this location indicator as proxy variable.

14
firm-level and country-level indicators. First, we include the Tax Rate, which is measured as
the tax rate a typical commercial enterprise pays on profits (Djankov et al., 2009). Our data
vary between 20% and 87%. We also include the firm-level survey response to the question
whether taxation is an obstacle for the operation and growth of the enterprise, with the
responses varying between zero (no obstacle) and four (very severe obstacle). Second, we
include an array of institutional indicators to control for the hypothesis that weak legal and
political institutions causing corruption and deficient public services explain why firms prefer
to go underground. In our baseline regressions, we include a country-level indicator of
Control of Corruption from the Kaufman, Kraay, and Mastruzzi (2008) Governance
Matters database as well as a firm-level survey response to the question whether corruption
is an obstacle to the operation and growth of the enterprise. We also include the Kaufman,
Kraay, and Mastruzzi (2008) indicator on Government Effectiveness and the firm-level
survey response to whether Crime is an obstacle to the operation and growth of the
enterprise. In robustness tests, we will include additional indicators of countries’ institutional
framework; we will discuss them below.
Panel A of Table 2 presents the descriptive statistics of all variables, while Panel B
shows the correlations between the different variables. We find that firms located in smaller
towns, smaller firms and younger firms evade a higher share of taxes, while state-owned
firms, exporting firms and firms with better educated managers evade taxes to a lesser degree.
Firms that report taxation, corruption and crime as higher obstacle and have less confidence
in the judiciary also evade more taxes. However, there are also many significant correlations
between firm characteristics. Smaller firms are more likely to be located in smaller towns and
are less likely to be exporter, are younger and are less likely to have managers with a higher
education degree. The different indicators of growth obstacles and confidence in the judiciary
are also significantly correlated with each other. The country-level correlations show that tax
evasion by firms is more prominent in countries with lower branch penetration and less
efficient credit information sharing. However, tax evasion is also significantly associated
with corruption, taxation, government effectiveness and economic and financial development,

15
underlining the need for multivariate analysis.
[Table 2 here]
2.2. Methodology
To assess the relationship between tax evasion and banking sector outreach, we run
the following regression:
Tijk = αFi + βCi + γBj + ιk + εijk (1)
where T is the tax evasion ratio or dummy as reported by firm j in country i and industry k, F
is a vector of financial sector indicators, including indicators of credit information sharing
and banking outreach, C is an array of country-level control variables, B is a vector of firm-
level control variables, as discussed above. ι is a vector of 26 industry dummies and ε the
white-noise error term. We also include year dummies for the year the survey was conducted
to thus control for any global trends and for differences within countries with several surveys.
We use a tobit model for the regression of the tax evasion ratio, as the variable is bounded
between zero and one, and a probit model for the regressions of the tax evasion dummy. We
report marginal effects rather than coefficient estimates to gauge the statistical as well as
economic significance of our regression results. Further, we report clustered standard errors,
i.e. allow for correlation between error terms within countries, but not across countries. A
negative and significant α would indicate that deeper financial systems, higher banking
outreach and a more effective and inclusive information framework are associated with a
lower incidence of informality and tax evasion ratio.
The variation across firms of different sizes, location and sectors allows us to test for
a differential impact of financial sector development on tax evasion. Specifically, the
hypotheses formulated above would predict the impact of financial sector development to be
stronger for smaller firms and for firms in more remote location. We will test for such
differential impact by utilizing the following regression models:
Tijk = αFi + βCi + γBj + δFi*Sizej + ιk + εijk (2)

16
and
Tijk = αFi + βCi + γBj + δFi*Locationj + ιk + εijk (3)
where size is a vector of dummies for small and large firms (with medium-sized firms being
the benchmark category) and Location a vector of dummies for firms in the capital city and
small city (with firms in medium-sized cities being the benchmark category).14 Theory
would suggest a negative coefficient on the interaction of financial sector depth and outreach
with Small firm and Small city, while we expect positive coefficients on the interaction of
financial sector depth and outreach with Large firm and Capital city. We also use an indicator
variable Firm Location, which ranges from 1 (capital city) to 5 (small town) as alternative to
the firm location dummies and expect a negative sign on its interaction with the financial
sector indicators.15
Beyond size and location influencing firms’ increasing benefits from formality in
countries with more effective credit information sharing and better banking sector outreach,
there might also be industry-variation in such benefits. A large literature has exploited
industry variation in characteristics such as dependence on external financing, liquidity needs
and growth opportunities as identification condition to assess the impact of financial and
institutional development on firm growth. Such an identification strategy relies on the
assumption that such industry features are constant across countries and uses actual data on
external financing, liquidity holdings and growth from industries in the U.S. as benchmark
under the assumption that they reflect demand rather conditions.16 We will focus on three
industry characteristics constructed with these assumptions. First, dependence on external
finance is the fraction of capital expenditures not financed with internal funds (Rajan and
Zingales, 1998). Similarly, liquidity needs is constructed as the ratio of inventories over sales
14 Small firms are defined as firms with less than 20 employees, while large firms are defined as firms with more than 100 employees. A small city is defined as having less than 250,000 inhabitants. 15 Using the location indicator assumes that the variation in the relationship between tax evasion and financial sector outreach is linear across the five location categories, a rather heroic assumption. Given that we get qualitatively similar results using location dummies or the indicator variable, however, we do not think that this biases our results. 16 As in Rajan and Zingales (1998), Raddatz (2006), the U.S. is not included in our sample. The calculation of industry values is based on data from large firms for which market frictions should be significantly smaller than for small and medium-sized firms and should reflect mostly demand.
17
(Raddatz, 2006). Finally, growth opportunities is measured by the market-book ratio,
measured as the median ratio of the sum of market value of equity plus the book value of debt
divided by total assets for listed U.S. enterprises in the same industry over the period 2000-
2005, following Graham et al. (2008). A higher market-book ratio would indicate higher
growth opportunities and thus higher loan demand. We have data for 26 industries.
To test for a differential impact of banking sector outreach on firms in different
industries, we utilize the following specification.
Tijk = αFi + βCi + γBj + δFi*Industryk + ιk + εijk (4)
where Industry is an industry characteristics; either dependence on external finance, liquidity
needs or growth opportunities.17 Since we control for industry dummies and include the
levels of the respective financial sector indicators, the δ coefficients will capture the
differential effect of credit information sharing and banking sector outreach on firms in
industries with different financing and liquidity needs and growth opportunities.
While we report Tobit regressions to assess the differential impact of size, location
and industry characteristics on the relationship between branch penetration, credit
information sharing and tax evasion, we confirm all our findings with OLS regressions given
the difficulty of interpreting the marginal effects of interaction terms in non-linear models (Ai
and Norton, 2003).
In a final set of regressions, we use a smaller panel sample of firms and countries to
test the relationship between credit information sharing and tax evasion over time:
Tijkt = αFi,t + βCi,t + γBj,t +δX j + εijk (5)
where Xj are firm fixed effects and t is either 2002 or 2005. Here, we only include the
constraint and firm size variables among the vector B of firm-level characteristics, as other
firm characteristics are time-invariant. We also use interaction regressions as in (2) – (4),
interacting credit information sharing with size, location and industry characteristics. Unlike
the remainder of the regressions, we use OLS to estimate specification (5), given that Tobit
17 Since these three industry characteristics are significantly correlated with each other, we do not include them at the same time.

18
panel data model with fixed effects yields biased estimates (see Greene, 2004).18
3. Results
Combining firm-level, industry-level and country-level variation, this section tests
whether better credit information sharing and higher banking sector outreach are associated
with lower tax evasion. We first explore cross-country variation in credit information sharing
and banking sector outreach, before combining it with firm-level and industry-level variation.
Finally, we use firm-level fixed effects regression for a sub-sample to control even more
rigorously for simultaneity and endogeneity biases.
3.1. Basic results
The results in Table 3 show a statistically and economically significant relationship
between banking sector outreach and the incidence of informality across countries. We
report both probit (Panel A) and tobit regressions (Panel B) that include unreported industry
and year dummies and are clustered on the country level.
[Table 3 here]
As can be seen from the table, the existence and depth of credit registries is associated
with a lower incidence of tax evasion. Both the credit registry dummy and the indicator of the
depth of the information framework enter negatively and significantly in both probit and tobit
regressions. The effect is also economically significant. Firms in countries with a credit
registry are 20% less likely to evade taxes and the tax evasion ratio is 11% lower in these
countries. A one standard deviation increase in depth of information sharing is associated
with a 13% drop in the likelihood of corporate tax evasion and a 9.2% drop in the tax evasion
ratio. It is important to note that this effect is in addition to the positive effect that credit
information sharing has on financial depth, which we proxy with Private Credit to GDP in the
18 However, cross-sectional Tobit models do not have this kind of problem (see Wooldridge, 2002, p.538).
19
regression (Jappelli and Pagano, 2002).
Greater banking sector outreach is also significantly associated with a lower incidence
of informality. Both geographic and demographic branch penetration enter significantly and
negatively in probit and tobit regressions. As in the case of credit information sharing, the
effect is also economically significant, with a one standard deviation increase in demographic
bank branch penetration being associated with a reduction in the incidence of tax evasion of
13.9% and a reduction of the tax evasion ratio of 10.3%.19 Similarly, a one standard deviation
increase in geographic bank branch penetration is associated with a reduction in the incidence
of tax evasion of 14.9% and a reduction of the tax evasion ratio of 12.3%.
Turning to the control variables, we find that higher financial sector depth, as proxied
by Private Credit to GDP, is associated with a lower incidence and extent of informality,
while higher bank concentration is associated with higher informality, although the latter
result is not significant at the 5% level in all regressions. We also find a negative relationship
between the level of economic development and informality, although GDP per capita does
not enter significantly in all regressions.
Several of the firm-level variables enter significantly in the regressions. We find that
smaller firms (as measured by the log of employment) report consistently a higher incidence
and extent of informality, while exporters are less likely to evade taxes. Firms in small towns
are more likely to evade taxes, while firms in the capital city are less likely to do so. Some of
these relationships, however, are not consistent across the different models. There is some,
not surprising, evidence that state-owned enterprises are less likely to evade taxes, as are
older firms.
Concerning alternative explanations of informality, we find that higher taxation,
measured both on the firm level as on the economy-wide level, is associated with a higher
incidence and extent of informality. Institutional variables including the control of corruption
and government quality, on the other hand, enter negatively, but not always significantly in
the regressions. Similarly, crime as a growth constraint (as self-reported by firms) enters
19 Please note that these marginal effects and elasticities are computed at the mean of all variables and there might be variation across the distribution.

20
positively, but not consistently significant. On the other hand, we find strong evidence for the
contractual hypothesis as firms that have more trust in the judicial systems, report a lower
degree of tax evasion.
In unreported robustness tests (available on request), we instrument for both credit
information sharing and banking sector outreach with exogenous country traits, including
legal origin, latitude and ethnic fractionalization and confirm our findings.20 The empirical
results are highly robust. In fact, the IV coefficients are somewhat larger than the OLS
coefficients, indicating the existence of potential measurement error, which would tend to
“attenuate” the coefficient estimate toward zero. However, it might also be possible that the
larger IV estimate is driven by the omission of other institutional variables correlated with tax
evasion and with our instrumental variables, as noted by Pande and Udry (2006).
Table 4 shows the robustness of our findings to utilizing alternative measures of the
information sharing framework and to controlling for an array of additional institutional
indicators. While we present only the Tobit regressions of the tax evasion ratio, we obtain the
same or similar results when using the Probit specification with the tax evasion dummy,
available on request. Specifically, the results in columns (1) and (2) show that both private
and public credit registries are associated with lower tax evasion ratios, with the economic
size of the effects being similar. While in column (1), we use simple dummy variables
indicating the existence of a public or private credit registry, column (2) uses indicators of the
coverage of public and private credit registries, as measured by the proportion of the adult
population covered by the respective credit registries. All four indicators enter negatively and
significantly. While demographic branch penetration continues to enter negatively and
significantly when controlling for the dummy variables, it loses significance when
introducing the credit registry coverage variables, suggesting that “inclusion” in the
information framework might better capture access to and inclusion into the formal banking
system than banking sector outreach. Private Credit to GDP does not enter significantly in
either of the two regressions.
20 We base the selection of instrumental variables on the theoretical and empirical work in the law, institution and finance literature (e.g. Acemoglu, Johnson and Robinson , 2001, Beck et al., 2003).
21
The column (3) – (10) results of Table 4 show that our findings are robust to
controlling for most, but not all dimensions of a country’s institutional framework. We first
control for additional institutional indicators from the Kaufman, Kraay and Mastruzzi (2008)
Governance Matters database.21 Rule of Law enter negatively and significantly at least on
the 5% level, while Voice and Accountability, Political Stability, and Regulatory Quality do
not enter significantly. Depth of Information Sharing loses its significance when controlling
for Voice and Accountability, while Demographic Branch Penetration continues to enter
negatively and significantly in all regressions. Next, we control for specific policy elements
of the institutional framework. Specifically, we control for Creditor Rights (the rights of
secured creditors vis-à-vis a company in bankruptcy), Contract Enforcement (the number of
legal steps to enforce a bounced check), Entry Barriers (number of registration steps for a
new formal enterprise), and Labor Market Rigidity. All four indicators are from the IFC’s
Doing Business database and previous research has shown a significant association of these
dimensions of the business environment with the incidence of informality and firm entry
(Botero et al., 2004; Djankov et al., 2002; Klapper, Laeven and Rajan, 2006). Creditor Rights
enters significantly, while Contract Enforcement, Entry Barriers and Labor Market Rigidity
do not enter significantly. Controlling for Contract Enforcement reduces the significance of
Demographic Branch Penetration below 10%, while controlling for Entry Barriers reduces
the significance of Depth of Information Sharing below 10%.
In summary, our findings of a negative relationship between credit information
sharing and banking sector outreach, on the one hand, and tax evasion, of the other hand, are
robust to controlling for other elements of the institutional and business environment
associated with the incidence of informality. In some cases, it is hard to distinguish between
specific dimensions, due to the high correlation between different dimensions of the policy
toolkit.
[Table 4 here]
21 Given the high correlation between these measures, we do not include Control of Corruption in these regressions.

22
We conduct some further robustness, which are available on request. First, we test
whether our results are driven by one specific country and replicate the Table 3 results
omitting each country one-at-a-time; the results hold. Since the relationship between credit
information sharing, banking sector outreach and tax evasion might vary with the income
level, we also drop all six high-income countries and confirm our findings. Second, we are
concerned that the obstacle variables are endogenous to the incidence and extent of tax
evasion and might therefore bias our results. We therefore re-run our regressions, excluding
all obstacle variables; all results are confirmed, not only in statistical significance but also in
coefficient size. Third, we limit our sample to the latest survey for each country. While our
sample is reduced to 18,500 firms, all our findings are confirmed. Finally, we are concerned
that the firm-level responses on tax evasion might be subject to measurement error, reflecting
either their own tax evasion or the average for the industry. We therefore re-run our
regressions on the industry-level, averaging firm-level responses and firm-level values for
each industry-country cell. All our findings are confirmed.
Up to now we have related firm-level responses to country-level variation in credit
information sharing and banking sector outreach. However, different firms might react
differently to the incentives and opportunities provided by better credit information sharing
and banking sector outreach. We will explore this possibility in the following; testing for
such differential impact also allows us to more rigorously address the issue of omitted
variables and causality.
3.2. Exploiting firm heterogeneity
The hypotheses formulated in the Introduction suggest a differential relationship of
information sharing and banking sector outreach with firms’ decision to evade taxation across
firms of different sizes and in different locations. Specifically, smaller firms and firms in
more remote areas are conjectured to respond more strongly to incentives and opportunities
provided by more effective information sharing and banking sector outreach. We test this
conjecture and present the empirical results in Table 5.

23
[Table 5 here]
The results in Table 5 confirm this conjecture and show a significant variation of the
relationship between information sharing and banking sector outreach, on the one hand, and
firms’ decision to evade taxes, on the other hand, across different locations within a country.
Here we add interaction terms of Depth of Information Sharing, Demographic Branch
Penetration and Geographic Branch Penetration with dummy variables that indicate whether
a firm is located in the capital city or a small town, with the omitted category being firms in
mid-sized towns. While we find a more muted relationship between information sharing,
banking sector outreach and tax evasion for firms in the capital city, the relationship is even
stronger for firms in small towns. The differences in the relationship across firms of different
locations are also economically significant. A one standard deviation increase in the Depth of
information decreases the tax evasion by 6.4% for firms in capital city, but decreases the tax
evasion by about 16.8% for firms in small towns (Column 1). Similarly, a one standard
deviation increase in the demographic branch penetration decreases the tax evasion by 3.7%
for firms in capital city, but decreases the tax evasion by about 10.6% for firms in small
towns (Column 2). Using geographic branch penetration yields statistically and economically
similar results (column 3). Finally, we include interaction terms of both firm location with
Depth of Information Sharing and Demographic Branch Penetration (column 4) and, in
addition, control for the interaction of Private Credit to GDP with firm location (column 5).
Here, rather than introducing separate interaction terms with Small town and Capital City, we
use the Firm Location indicator ranging from capital city (1) to towns with fewer than 50,000
inhabitants (5). We find an increasing impact of this firm location indicator on the
relationship between both information sharing depth and banking sector outreach, on the one
hand, and reductions in tax evasion, on the other hand, as we move from firms in capital
cities to large cities and small towns. This finding is robust to controlling for the interaction
of Private Credit to GDP and firm location, which also enters negatively and significantly at

24
the 10% level (column 5). Compared to the location interaction terms with credit information
depth and banking sector outreach, however, the interaction of firm location with financial
depth is small in size, suggesting only a small differential impact of financial depth on firms
in different locations.
The results in Table 6 show that the relationship between information sharing,
banking sector outreach and tax evasion varies significantly across firms of different sizes. A
one standard deviation increase in the Depth of Information Sharing decreases the tax evasion
by 7.7% for large, but by about 15.2% for small firms (Column 1). Similarly, a one standard
deviation increase in the demographic branch penetration decreases the tax evasion by 2.8%
for large firms, but decreases the tax evasion by about 11.3% for small firms (Column 2). The
interaction of Demographic Branch Penetration and the small firm dummy is not significant,
however, suggesting that there is no significant additional effect of banking sector outreach as
we move from mid-sized to small firms. When using Geographic Branch Penetration, we find
that the marginal effect of banking sector outreach on large firms’ incentives to evade taxes is
not significantly different from those of medium-sized firms, while smaller firms face
significantly higher incentives. The column (4) results show that the effect of information
sharing and of banking sector outreach on tax evasion varies with firm size, but not with firm
location, once we control for the interaction with firm size. While the interaction of Small
firm with depth of information sharing and demographic branch penetration continue to enter
negatively and significantly, the interactions of the financial sector variables with firm
location enter negatively but insignificantly. The column 5 regressions finally show that
Private Credit to GDP interacts significantly (but with a small economic effect) with firm size
in its effect on tax evasion, while it does not interact significantly with firm location.
[Table 6 here]
Summarizing it seems that it is rather size than location of the firm, which allows us
to observe a differential effect of banking sector outreach and credit information sharing on
25
tax evasion.22 This suggests that the channel through which financial sector outreach helps
reduce informality is by expanding access to financial services for smaller firms rather than
through geographic expansion of outreach.
3.3 Exploiting industry heterogeneity
The results in Table 7 show that that banking sector outreach and credit information
sharing have a differential impact on tax evasion across firms in different industries. As
discussed above, here we interact an industry characteristic (external dependence, liquidity
needs or growth opportunities) with our financial sector indicators. The regressions in
columns 1 and 2 suggest that the effect of demographic and geographic banking sector
outreach and of credit information on reducing tax evasion sharing increases in firms’
dependence on external finance. This effect is in addition to the negative and significant
interaction of financial depth with external dependence. The economic size of this effect is
moderate, compared to the economic size of the firm size effect discussed above: an increase
of one standard deviation in external dependence increases the marginal effect of credit
information sharing by 1.7% and the marginal effect of demographic branch penetration by
1.2%. Similarly, the column 3 and 4 regressions show that the effect of geographic banking
sector outreach and of credit information on reducing tax evasion sharing increases in firms’
liquidity needs, while the interaction with demographic branch penetration does not enter
significantly. The economic size of this effect, however, is even smaller than in the case of
external dependence: an increase of one standard deviation in liquidity needs increases the
marginal effect of credit information sharing by 0.4% and the marginal effect of geographic
branch penetration by 0.2%. The columns 5 and 6 regressions, finally, suggest a differential
impact of banking sector outreach and credit information sharing and demographic branch
penetration on firms in industries with different growth opportunities, with the economic
effect being 1.2% and 1.5%, respectively. This suggests that financial sector outreach
22 In unreported robustness tests, we also tested for the significance of triple interaction terms, thus assessing whether the effect of banking sector outreach and credit information sharing varies for firms of a specific size class across different location and for firms in a specific location across different sizes. None of the triple interaction terms, however, entered significantly.
26
increases incentives for firms that are more dependent on external finance and have higher
liquidity needs and growth opportunities to enter the formal economy.
[Table 7 here]
The Table 8 regressions, finally, confirm that there is a differential effect of banking
sector outreach and credit information sharing on tax evasion across firms of different size
and firms in industries with different financing, liquidity needs and growth opportunities,
while there is no differential effect on firms in different locations. Here we include
interaction terms of (i) depth of information sharing, (ii) demographic or geographic branch
penetration and (iii) Private Credit to GDP with (i) small and large firm dummies, (ii) the
firm location indicator and (iii) an industry characteristic. While the significance levels of
some of the interaction terms decrease, overall we confirm our previous findings that banking
sector outreach and credit information sharing explain a larger variation in tax evasion among
small firms and firms in industries with higher financing, liquidity needs and growth
opportunities than among larger firms and firms in industries with lower financing and
liquidity needs and growth opportunities. With the caveat that these are cross-sectional data,
this suggests that smaller firms and firms with higher financing and liquidity needs as well as
higher growth opportunities react more strongly to greater banking sector outreach and to
more effective and inclusive credit registries by reducing the incidence and amount of tax
evasion. On the other hand, we do not find significant interaction terms of the credit
information sharing and branch penetration variables with the indicator of firm location. In
addition, the interaction terms with the industry indicators enter with reduced significance
and with even smaller economic effects than in the Table 7 regressions, where we do not
control for the interaction with firm size. Overall, this suggests that it is foremost the
variation in firm size that is significant in its interaction with credit information sharing and
branch penetration in explaining cross-firm and cross-country variation in tax evasion, with
some variation being explained by industry variation in the need for external finance and

27
liquidity needs and no variation explained by the different locations of firms.
[Table 8 here]
The Table 9 regressions show that our findings are robust to using country-fixed
effects rather than country-level variables. Here, we drop all country-level variables,
including our financial sector indicators and replace them with country dummies. This allows
us to control even more rigorously for confounding country factors. All our findings are
confirmed; while the interaction terms of firm size with branch penetration and credit
information sharing enter significantly, the interaction terms of firm location do not.
Similarly, the interaction terms of external dependence, liquidity needs and growth
opportunities enter significantly and negatively. However, not only the significance levels,
but also the economic size of the coefficients is very similar to the previous results.
[Table 9 here]
3.4 Exploiting time-series variation
In this final section, we exploit time-series variation in credit information sharing
across a sample of 26 transition economies as final robustness tests. While we do not have
sufficient time-series variation in branch penetration as of yet, we have data for a panel of
897 firms across 26 Central and Eastern European countries for 2002 and 2005 as well as
variation in credit information sharing over the same time period (Brown, Jappelli and
Pagano, 2009).23 Since the same firms were interviewed twice, we can include firm-fixed
effects and therefore drop firm characteristics except for the log of employees, but include the
obstacle variables.24 Since panel Tobit estimates with fixed effects tend to be biased (Greene,
2004), we use OLS regressions for our panel regressions. Between 2002 and 2005, eight of
23 The sample in these regressions is only partly overlapping with the previous cross-sectional samples, as we also include countries, for which we do not have branch penetration data in our cross-sectional estimations. 24 While some of these firms were surveyed again in 2008, the tax evasion question was unfortunately not included in this latest round.
28
the 26 countries introduced or upgraded their credit information system, with four countries
introducing credit registries and another four improving the collection and distribution of
information.
The results in Table 10 show a negative relationship between credit information
sharing and tax evasion. The result in column 1 shows a negative and significant coefficient
on Depth of Information Sharing. The estimates in column 2 show that this relationship is
stronger for smaller firms, while the effect does not vary across firms in different locations
(column 3). The effect also varies significantly with industry characteristics, with firms in
industries with higher liquidity needs and better growth opportunities reducing tax evasion
more in response to improvements in credit information sharing (columns 5 and 6), while the
interaction of external dependence with Depth of Information Sharing is insignificant
(column 4). Including size, location and industry interaction terms at the same time confirms
the previous findings (columns 7 – 9). We note that as in the above regressions, this level and
differential effect of credit information sharing comes on top of the effect of higher credit to
the private sector following the improvements in credit information sharing. In unreported
regressions we confirm these findings for our tax evasion dummy variable. Overall, the fixed-
firm effect regressions provide powerful evidence that our cross-country estimations are not
driven by simultaneity or endogeneity bias. Firms in countries that improve their systems of
credit information sharing report lower tax evasion after such an improvement and it is
especially the smaller firms and firms with higher liquidity needs and growth opportunities
that report lower tax evasion.
[Table 10 here]
4. Conclusions
This paper explores the association of credit information sharing and banking sector
outreach with the incidence and extent of informality across countries and across firm. We
find strong evidence that firms in countries with deeper and more effective systems of tax
evasion and higher branch penetration are less likely to evade taxes and hide a smaller share

29
of their sales. This effect decreases in firm size, i.e. smaller firms are especially sensitive to
credit information sharing and branch penetration. While we also find variation in the
relationship between financial sector outreach and tax evasion across firms in different
locations, this interaction turns insignificant once we control for the interaction with firm
size. Similarly, while we also find variation in the relationship between financial sector
outreach and tax evasion across industries with different financing and liquidity needs and
growth opportunities, this relationship turns economically and statistically weaker once we
control for the interaction with firm size. This underlines the importance of firm size when
assessing the impact of institutional reforms (Beck, Demirguc-Kunt and Maskimovic, 2005).
The results are robust to controlling for other institutional factors that can explain cross-
country variation in tax evasion and informality, thus underlining the importance that
financial sector policies have in addressing wide-spread informality in many developing
countries. Critically, our findings are robust to controlling for a standard measure of financial
depth, suggesting that specific outreach dimensions have a first-order effect on real sector
outcomes. Finally, our findings on credit information sharing are confirmed in a smaller
panel sample of Central and East European countries where we show that the same firms
report lower tax evasion after the introduction or improvements in credit information sharing.
Our findings are consistent with theories that posit increased opportunity costs of tax evasion
in financial systems that provide easier access to credit. They also show that financial sector
outreach is an important policy lever to bring more small firms into the formal economy.
We see this paper as a first exploration of the relationship between financial sector
outreach and tax evasion. As more data become available, time variation in banking sector
outreach as well as the introduction or upgrading of credit information sharing can be linked
to tax evasion and informality.

30
References
Acemoglu, D., Johnson, S., Robinson, J., 2001. The colonial origins of comparative development: An empirical investigation. American Economic Review 91, 1369-1401. Ai, C. and E. Norton, 2003. Interaction terms in logit and probit models. Economics Letters 80,123−129. Barth, J., C. Lin, P. Lin and F. Song, 2009. Corruption in Bank Lending to Firms: Cross-Country Micro-evidence on the Beneficial Role of Competition and Information Sharing, Journal of Financial Economics 91, 361-88.
Beck, T. and A. Demirguc-Kunt. 2006. Small and Medium-Size Enterprises. Access to Finance as Growth Constraint, Journal of Banking and Finance 30, 2931-43. Beck, T., A. Demirguc-Kunt, and R. Levine. 2003 Law, Endowments, and Finance. Journal of Financial Economics 70, 137-181. Beck, T., A. Demirguc-Kunt, and R. Levine, 2006, Bank supervision and corruption in lending, Journal of Monetary Economics 53, 2131-2163. Beck, T., A. Demirguc-Kunt, and R. Levine, 2010, Financial Institutions and Markets across Countries and over Time: The Updated Financial Development and Structure Database. World Bank Economic Review 24, 77-92. Beck, T., A. Demirguc-Kunt, and V. Maksimovic, 2005, Financial and legal constraints to firm growth: Does size matter? Journal of Finance 60, 137-77. Beck, T., A. Demirguc-Kunt, M.S.Martinez Peria, 2007: Reaching Out: Access to and Use of Banking Services across Countries. Journal of Financial Economics 85: 234-66. Beck, T., R. Levine and N. Loayza, 2000. Finance and the Sources of Growth, Journal of Financial Economics 58, 261-300. Beck, T. and R. Levine, 2002. Industry growth and capital allocation: does having a market- or bank-based system matter? Journal of Financial Economics 64,147-180. Blackburn, K., N. Bose and S. Capasso. 2010. Tax Evasion, the Underground Economy and Financial Development. University of Manchester mimeo. Botero, J., S. Djankov, R. La Porta, F. Lopez-de-Silanes, and A. Shleifer. 2004. The Regulation of Labor. Quarterly Journal of Economics 119, 1339-82.
31
Brown, M,, T. Jappelli, and M. Pagano, 2009. Information sharing and credit: Firm-level evidence from transition countries, Journal of Financial Intermediation 18, 151-172. Dabla-Norrisa, E, M. Gradstein, and G. Inchaust, 2008. What causes firms to hide output? The determinants of informality, Journal of Development Economics 85, 1-27 Demirguc-Kunt, A. and V. Maksimovic, 1998, Law, finance and firm growth, Journal of Finance 53, 2107-2137. Djankov, S., R. La Porta, F, Lopez-de-Silanes, and A. Shleifer. 2002. The Regulation of Entry. Quarterly. Journal of Economics 117, 1-37. Djankov, S., R. La Porta, F, Lopez-de-Silanes, and A. Shleifer. 2003 Courts. Quarterly. Journal of Economics 118, 457-522. Djankov, S., C. McLiesh, and A. Shleifer. 2007. Private Credit in 129 Countries. Journal of Financial Economics 84, 299-329. Djankov, S., T. Ganser, C. McLiesh, R. Ramalho and A. Shleifer. 2009. The Effect of Corporate Taxes on Investment and Entrepreneurship. NBER Working Paper 13756. Farrell, D., 2004. The hidden dangers of the informal economy. The McKinsey Quarterly (No. 3). Friedman, E., S. Johnson, D. Kaufmann and P. Zoido-Lobaton, 2000. Dodging the grabbing hand: the determinants of unofficial activity in 69 countries, Journal of Public Economics 76, 459–493 Graham, J., S. Li, and J. Qiu, 2008, Corporate misreporting and bank loan contracting, Journal of Financial Economics 89, 44.61. Greene, W., 2004, Fixed Effects and the Incidental Parameters Problem in the Tobit Model, Econometric Reviews 23, 125-148. Holmstrom, B., and J. Tirole, 1997. Financial intermediation, loanable funds, and the real sector, Quarter Journal of Economics 112, 663-91. Houston, J., C. Lin, P. Lin and Y. Ma, 2010, Creditor Rights, Information Sharing and Bank Risk Taking, Journal of Financial Economics 96, 485-512.

32
Jappelli, T., and M. Pagano, 2002. Information Sharing, Lending and Defaults: Cross-Country Evidence. Journal of Banking and Finance 26:10, 2017-45. Johnson, S., D. Kaufmann and A.Shleifer, 1997. The unofficial economy in transition, Brookings Papers on Economic Activity 2, 159–221. Johnson, S., D. Kaufmann and P. Zoido-Lobaton, 1998. Regulatory discretion and the unofficial economy, American Economic Review 88, 387-392. Johnson, S., D. Kaufmann, J. McMillan and C. Woodruff, 2000. Why do firms hide? Bribes and unofficial activity after communism, Journal of Public Economics 76, 495–520. Kaufman, D., A. Kraay and M. Mastruzzi. 2008. Governance Matters. World Bank. King, R. G. and R. Levine. 1993. Finance and Growth: Schumpeter Might Be Right, Quarterly Journal of Economics 108, 717–37. Klapper, L., L. Laeven and R. Rajan. 2006. Entry Regulation as a Barrier to Entrepreneurship. Journal of Financial Economics 82, 591-62 Kroszner, R., L. Laeven, and D. Klingebiel, 2007. Banking crises, financial dependence, and growth, Journal of Financial Economics 84, 187–228. La Porta, R. and A. Shleifer. 2008. The Unofficial Economy and Economic Development. Brookings Papers on Economic Activity Fall 2008, 275-352. Levine, R., 2005. Finance and Growth: Theory, Evidence. In P. Aghion and S. Durlauf (Eds.) Handbook of Economic Growth, 865-934. Amsterdam: Elsevier. Levine, R. and S. Zervos, 1998. Stock Markets, Banks, and Economic Growth, American Economic Review 88, 537-558. Loayza, N. 1996. The economics of the informal sector: A simple model and some empirical evidence from Latin America. Carnegie-Rochester Conference Series on Public Policy, 45, 129-162. Love, I. 2003. Financial Development and Financing Constraints: International Evidence from the Structural Investment Model. Review of Financial Studies 16, 765-91. Miller, M., 2003. Credit reporting systems around the Globe: the state of the art in public credit registries and private credit reporting firms. In Miller, M., (Ed.), Credit Reporting Systems and International Economy. Cambridge, MA: MIT Press.

33
Padilla, A., and M. Pagano, 1997. Endogenous communication among lenders, and entrepreneurial incentives. Review of Financial Studies 10, 205-236. Pagano, M., and T. Jappelli, 1993. Information sharing in credit markets. Journal of Finance 48, 1694-1718. Pande, R. and C. Udry, 2006. Institutions and Development: A View from Below, in R. Blundell, W. Newey and T. Persson, eds. Advances in Economics and Econometrics. Cambridge: Cambridge University Press. Raddatz, C., 2006. Liquidity Needs and Vulnerability to Financial Underdevelopment” Journal of Financial Economics 80, 677-722 Rajan, R., and L, Zingales. 1998. Financial Dependence and Growth, American Economic Review 88, 559-587. Sarte, P.-D., 2000. Informality and Rent-Seeking Bureaucracies in a Model of Long-Run Growth, Journal of Monetary Economics 46, 173-197. Schneider, F and Ernste, D., 2000. Shadow Economies: Size, Causes and Consequences. Journal of Economic Literature 38, 77-114. Straub, S., 2005. Informal Sector: The Credit Market Channel, Journal of Development Economics 78, 299-321. Stulz, R. and H. Johnson, 1985. An analysis of secured debt. Journal of Financial Economics 14, 501-21. Wooldridge, J. M., 2002, Econometric Analysis of Cross Section and Panel Data, Cambridge, MA.: MIT Press.

34

35
Table 1. Tax evasion across sample countries Country Tax evasion ratio (mean) Tax evasion dummy (mean)
1 Albania 0.228 0.673
2 Armenia 0.060 0.278
3 Azerbaijan 0.137 0.363
4 Belarus 0.076 0.254
5 Bosnia and Herzegovina 0.209 0.412
6 Brazil 0.327 0.828
7 Bulgaria 0.136 0.399
8 Chile 0.029 0.142
9 China 0.424 0.494
10 Costa Rica 0.283 0.683
11 Croatia 0.096 0.383
12 Czech Republic 0.118 0.476
13 Ecuador 0.203 0.489
14 El Salvador 0.241 0.521
15 Estonia 0.050 0.330
16 Georgia 0.235 0.548
17 Germany 0.057 0.447
18 Greece 0.110 0.532
19 Guatemala 0.230 0.645
20 Guyana 0.271 0.744
21 Honduras 0.316 0.654
22 Hungary 0.114 0.409
23 Ireland 0.038 0.288
24 Kazakhstan 0.096 0.290
25 Kenya 0.134 0.459
26 Korea, Rep. 0.100 0.437
27 Kyrgyz Republic 0.200 0.492
28 Lithuania 0.126 0.414
29 Madagascar 0.065 0.210
30 Nicaragua 0.336 0.650
31 Philippines 0.220 0.579
32 Poland 0.098 0.415
33 Portugal 0.082 0.373
34 Romania 0.085 0.316
35 Russian Federation 0.167 0.433
36 Slovak Republic 0.081 0.352
37 Slovenia 0.118 0.449
38 South Africa 0.091 0.158
39 Spain 0.037 0.183
40 Sri Lanka 0.077 0.420
41 Tanzania 0.305 0.730
42 Turkey 0.363 0.683
43 Zambia 0.158 0.535
Note: The tax evasion ratio is computed on basis of question c241 from the Enterprise Surveys: Recognizing the difficulties many enterprises face in fully complying with taxes and regulations, what percentage of total sales would you estimate the typical establishment in your area of activity reports for tax purposes? The tax evasion ratio is equal to one minus the answered number. The tax evasion dummy equals one if tax evasion ratio is greater than zero, otherwise zero.
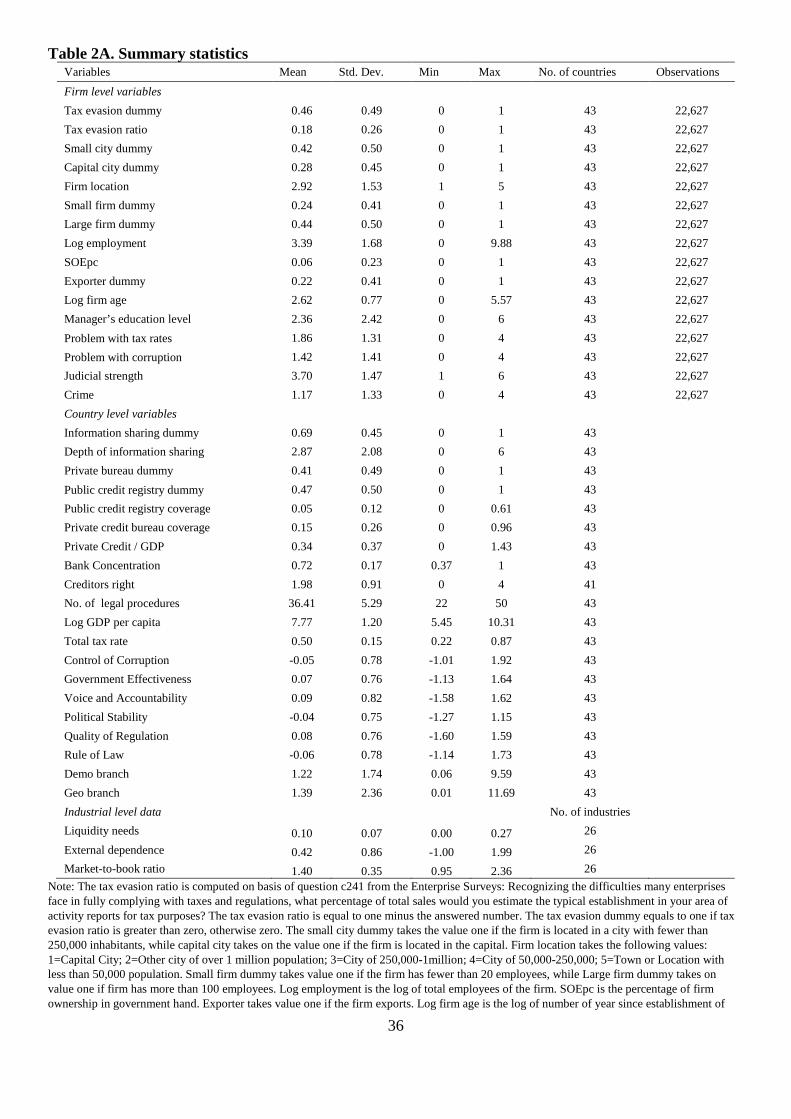
36
Table 2A. Summary statistics Variables Mean Std. Dev. Min Max No. of countries Observations
Firm level variables
Tax evasion dummy 0.46 0.49 0 1 43 22,627
Tax evasion ratio 0.18 0.26 0 1 43 22,627
Small city dummy 0.42 0.50 0 1 43 22,627
Capital city dummy 0.28 0.45 0 1 43 22,627
Firm location 2.92 1.53 1 5 43 22,627
Small firm dummy 0.24 0.41 0 1 43 22,627
Large firm dummy 0.44 0.50 0 1 43 22,627
Log employment 3.39 1.68 0 9.88 43 22,627
SOEpc 0.06 0.23 0 1 43 22,627
Exporter dummy 0.22 0.41 0 1 43 22,627
Log firm age 2.62 0.77 0 5.57 43 22,627
Manager’s education level 2.36 2.42 0 6 43 22,627
Problem with tax rates 1.86 1.31 0 4 43 22,627
Problem with corruption 1.42 1.41 0 4 43 22,627
Judicial strength 3.70 1.47 1 6 43 22,627
Crime 1.17 1.33 0 4 43 22,627
Country level variables
Information sharing dummy 0.69 0.45 0 1 43
Depth of information sharing 2.87 2.08 0 6 43
Private bureau dummy 0.41 0.49 0 1 43
Public credit registry dummy 0.47 0.50 0 1 43
Public credit registry coverage 0.05 0.12 0 0.61 43
Private credit bureau coverage 0.15 0.26 0 0.96 43
Private Credit / GDP 0.34 0.37 0 1.43 43
Bank Concentration 0.72 0.17 0.37 1 43
Creditors right 1.98 0.91 0 4 41
No. of legal procedures 36.41 5.29 22 50 43
Log GDP per capita 7.77 1.20 5.45 10.31 43
Total tax rate 0.50 0.15 0.22 0.87 43
Control of Corruption -0.05 0.78 -1.01 1.92 43
Government Effectiveness 0.07 0.76 -1.13 1.64 43
Voice and Accountability 0.09 0.82 -1.58 1.62 43
Political Stability -0.04 0.75 -1.27 1.15 43
Quality of Regulation 0.08 0.76 -1.60 1.59 43
Rule of Law -0.06 0.78 -1.14 1.73 43
Demo branch 1.22 1.74 0.06 9.59 43
Geo branch 1.39 2.36 0.01 11.69 43
Industrial level data No. of industries
Liquidity needs 0.10 0.07 0.00 0.27 26
External dependence 0.42 0.86 -1.00 1.99 26
Market-to-book ratio 1.40 0.35 0.95 2.36 26
Note: The tax evasion ratio is computed on basis of question c241 from the Enterprise Surveys: Recognizing the difficulties many enterprises face in fully complying with taxes and regulations, what percentage of total sales would you estimate the typical establishment in your area of activity reports for tax purposes? The tax evasion ratio is equal to one minus the answered number. The tax evasion dummy equals to one if tax evasion ratio is greater than zero, otherwise zero. The small city dummy takes the value one if the firm is located in a city with fewer than 250,000 inhabitants, while capital city takes on the value one if the firm is located in the capital. Firm location takes the following values: 1=Capital City; 2=Other city of over 1 million population; 3=City of 250,000-1million; 4=City of 50,000-250,000; 5=Town or Location with less than 50,000 population. Small firm dummy takes value one if the firm has fewer than 20 employees, while Large firm dummy takes on value one if firm has more than 100 employees. Log employment is the log of total employees of the firm. SOEpc is the percentage of firm ownership in government hand. Exporter takes value one if the firm exports. Log firm age is the log of number of year since establishment of
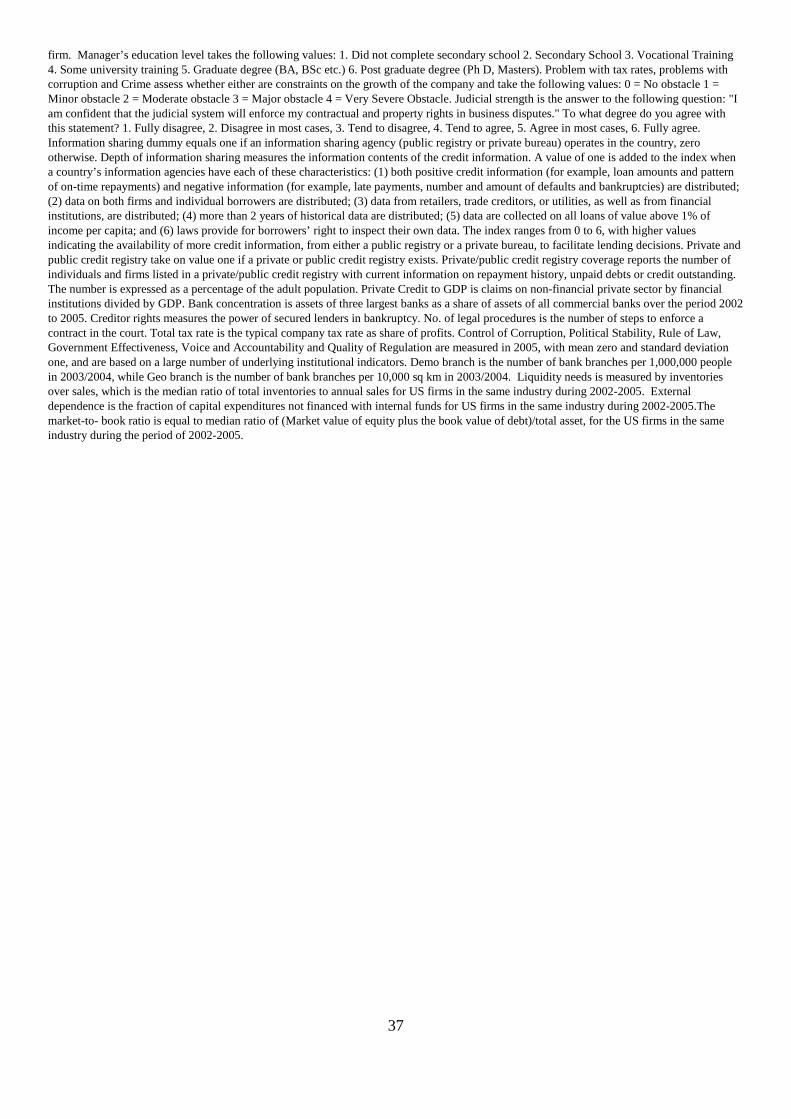
37
firm. Manager’s education level takes the following values: 1. Did not complete secondary school 2. Secondary School 3. Vocational Training 4. Some university training 5. Graduate degree (BA, BSc etc.) 6. Post graduate degree (Ph D, Masters). Problem with tax rates, problems with corruption and Crime assess whether either are constraints on the growth of the company and take the following values: 0 = No obstacle 1 = Minor obstacle 2 = Moderate obstacle 3 = Major obstacle 4 = Very Severe Obstacle. Judicial strength is the answer to the following question: "I am confident that the judicial system will enforce my contractual and property rights in business disputes." To what degree do you agree with this statement? 1. Fully disagree, 2. Disagree in most cases, 3. Tend to disagree, 4. Tend to agree, 5. Agree in most cases, 6. Fully agree. Information sharing dummy equals one if an information sharing agency (public registry or private bureau) operates in the country, zero otherwise. Depth of information sharing measures the information contents of the credit information. A value of one is added to the index when a country’s information agencies have each of these characteristics: (1) both positive credit information (for example, loan amounts and pattern of on-time repayments) and negative information (for example, late payments, number and amount of defaults and bankruptcies) are distributed; (2) data on both firms and individual borrowers are distributed; (3) data from retailers, trade creditors, or utilities, as well as from financial institutions, are distributed; (4) more than 2 years of historical data are distributed; (5) data are collected on all loans of value above 1% of income per capita; and (6) laws provide for borrowers’ right to inspect their own data. The index ranges from 0 to 6, with higher values indicating the availability of more credit information, from either a public registry or a private bureau, to facilitate lending decisions. Private and public credit registry take on value one if a private or public credit registry exists. Private/public credit registry coverage reports the number of individuals and firms listed in a private/public credit registry with current information on repayment history, unpaid debts or credit outstanding. The number is expressed as a percentage of the adult population. Private Credit to GDP is claims on non-financial private sector by financial institutions divided by GDP. Bank concentration is assets of three largest banks as a share of assets of all commercial banks over the period 2002 to 2005. Creditor rights measures the power of secured lenders in bankruptcy. No. of legal procedures is the number of steps to enforce a contract in the court. Total tax rate is the typical company tax rate as share of profits. Control of Corruption, Political Stability, Rule of Law, Government Effectiveness, Voice and Accountability and Quality of Regulation are measured in 2005, with mean zero and standard deviation one, and are based on a large number of underlying institutional indicators. Demo branch is the number of bank branches per 1,000,000 people in 2003/2004, while Geo branch is the number of bank branches per 10,000 sq km in 2003/2004. Liquidity needs is measured by inventories over sales, which is the median ratio of total inventories to annual sales for US firms in the same industry during 2002-2005. External dependence is the fraction of capital expenditures not financed with internal funds for US firms in the same industry during 2002-2005.The market-to- book ratio is equal to median ratio of (Market value of equity plus the book value of debt)/total asset, for the US firms in the same industry during the period of 2002-2005.

38
Table 2B. Correlation matrixes
Firm level Tax evasion
ratio Firm
location Log
employment SOEpc
Exporter dummy
Log firm age
Manager’s education
level
Problem with tax
rates
Problem with
corruption Crime
Firm location 0.076** 1
Log employment -0.053** -0.133*** 1
SOEpc -0.046** -0.005 0.258*** 1
Exporter dummy -0.041*** -0.070** 0.368*** 0.002 1
Log firm age -0.085*** -0.052*** 0.274*** 0.142** 0.140*** 1
Manager’s education level 0.152** -0.185*** 0.284*** 0.061** 0.130*** 0.107** 1
Problem with tax rates 0.140*** -0.043* 0.014 -0.091*** 0.016* 0.053*** 0.106** 1
Problem with corruption 0.231** -0.097* 0.052* -0.076*** 0.020*** -0.042*** 0.191** 0.401*** 1
Crime 0.180*** -0.072* 0.036* -0.063*** -0.004 -0.026** 0.186*** 0.333** 0.661*** 1
Judicial strength -0.088*** 0.043* 0.087* 0.065*** 0.008* 0.051*** -0.028*** -0.163*** -0.217*** -0.159***
Country level Tax evasion ratio
Demo branch
Geo branch Infoshare dummy
Depth of infoshare
Private Credit / GDP
Bank Concentration
Total_tax rate
Control of Corruption
Government Effectiveness
Demo branch -0.392*** 1
Geo branch -0.361** 0.802*** 1
Info share dummy -0.114** 0.236 0.277* 1
Depth of info share -0.251*** 0.464*** 0.471*** 0.754*** 1
Private Credit / GDP -0.443** 0.768** 0.718*** 0.326*** 0.514*** 1
Bank Concentration 0.128* 0.151 0.082 0.061 0.074 0.075 1
Total tax rate 0.056*** 0.056 0.018 0.102 -0.072 -0.200** -0.169 1
Control of Corruption -0.392** 0.652*** 0.622*** 0.454** 0.682*** 0.781*** 0.160 -0.159 1
Government Effectiveness -0.379*** 0.597** 0.563*** 0.355*** 0.577** 0.772*** 0.140* -0.249*** 0.946*** 1
Log GDP per capita -0.324** 0.625*** 0.599** 0.391*** 0.664*** 0.773*** 0.119 -0.233* 0.843*** 0.850***
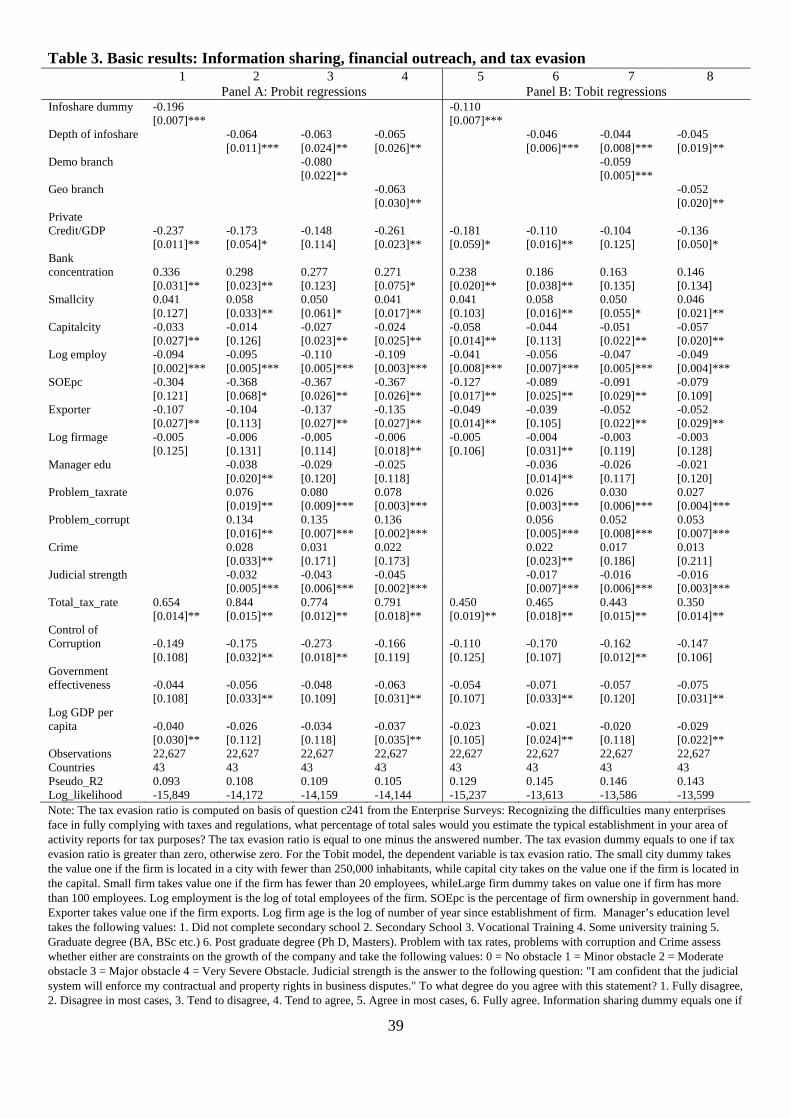
39
Table 3. Basic results: Information sharing, financial outreach, and tax evasion 1 2 3 4 5 6 7 8
Panel A: Probit regressions Panel B: Tobit regressions Infoshare dummy -0.196 -0.110 [0.007]*** [0.007]*** Depth of infoshare -0.064 -0.063 -0.065 -0.046 -0.044 -0.045 [0.011]*** [0.024]** [0.026]** [0.006]*** [0.008 ]*** [0.019]** Demo branch -0.080 -0.059 [0.022]** [0.005]*** Geo branch -0.063 -0.052 [0.030]** [0.020]** Private Credit/GDP -0.237 -0.173 -0.148 -0.261 -0.181 -0.110 -0.104 -0.136 [0.011]** [0.054]* [0.114] [0.023]** [0.059]* [0.016]** [0.125] [0.050]* Bank concentration 0.336 0.298 0.277 0.271 0.238 0.186 0.163 0.146 [0.031]** [0.023]** [0.123] [0.075]* [0.020]** [0.038]** [0.135] [0.134] Smallcity 0.041 0.058 0.050 0.041 0.041 0.058 0.050 0.046 [0.127] [0.033]** [0.061]* [0.017]** [0.103] [0.016]** [0.055]* [0.021]** Capitalcity -0.033 -0.014 -0.027 -0.024 -0.058 -0.044 -0.051 -0.057 [0.027]** [0.126] [0.023]** [0.025]** [0.014]** [0.113] [0.022]** [0.020]** Log employ -0.094 -0.095 -0.110 -0.109 -0.041 -0.056 -0.047 -0.049 [0.002]*** [0.005]*** [0.005]*** [0.003]*** [0.008 ]*** [0.007]*** [0.005]*** [0.004]*** SOEpc -0.304 -0.368 -0.367 -0.367 -0.127 -0.089 -0.091 -0.079 [0.121] [0.068]* [0.026]** [0.026]** [0.017]** [0.025]** [0.029]** [0.109] Exporter -0.107 -0.104 -0.137 -0.135 -0.049 -0.039 -0.052 -0.052 [0.027]** [0.113] [0.027]** [0.027]** [0.014]** [0.105] [0.022]** [0.029]** Log firmage -0.005 -0.006 -0.005 -0.006 -0.005 -0.004 -0.003 -0.003 [0.125] [0.131] [0.114] [0.018]** [0.106] [0.031]** [0.119] [0.128] Manager edu -0.038 -0.029 -0.025 -0.036 -0.026 -0.021 [0.020]** [0.120] [0.118] [0.014]** [0.117] [0.120] Problem_taxrate 0.076 0.080 0.078 0.026 0.030 0.027 [0.019]** [0.009]*** [0.003]*** [0.003]*** [0.00 6]*** [0.004]*** Problem_corrupt 0.134 0.135 0.136 0.056 0.052 0.053 [0.016]** [0.007]*** [0.002]*** [0.005]*** [0.00 8]*** [0.007]*** Crime 0.028 0.031 0.022 0.022 0.017 0.013 [0.033]** [0.171] [0.173] [0.023]** [0.186] [0.211] Judicial strength -0.032 -0.043 -0.045 -0.017 -0.016 -0.016 [0.005]*** [0.006]*** [0.002]*** [0.007]*** [0.0 06]*** [0.003]*** Total_tax_rate 0.654 0.844 0.774 0.791 0.450 0.465 0.443 0.350 [0.014]** [0.015]** [0.012]** [0.018]** [0.019]** [0.018]** [0.015]** [0.014]** Control of Corruption -0.149 -0.175 -0.273 -0.166 -0.110 -0.170 -0.162 -0.147 [0.108] [0.032]** [0.018]** [0.119] [0.125] [0.107] [0.012]** [0.106] Government effectiveness -0.044 -0.056 -0.048 -0.063 -0.054 -0.071 -0.057 -0.075 [0.108] [0.033]** [0.109] [0.031]** [0.107] [0.033]** [0.120] [0.031]** Log GDP per capita -0.040 -0.026 -0.034 -0.037 -0.023 -0.021 -0.020 -0.029 [0.030]** [0.112] [0.118] [0.035]** [0.105] [0.024]** [0.118] [0.022]** Observations 22,627 22,627 22,627 22,627 22,627 22,627 22,627 22,627 Countries 43 43 43 43 43 43 43 43 Pseudo_R2 0.093 0.108 0.109 0.105 0.129 0.145 0.146 0.143 Log_likelihood -15,849 -14,172 -14,159 -14,144 -15,237 -13,613 -13,586 -13,599 Note: The tax evasion ratio is computed on basis of question c241 from the Enterprise Surveys: Recognizing the difficulties many enterprises face in fully complying with taxes and regulations, what percentage of total sales would you estimate the typical establishment in your area of activity reports for tax purposes? The tax evasion ratio is equal to one minus the answered number. The tax evasion dummy equals to one if tax evasion ratio is greater than zero, otherwise zero. For the Tobit model, the dependent variable is tax evasion ratio. The small city dummy takes the value one if the firm is located in a city with fewer than 250,000 inhabitants, while capital city takes on the value one if the firm is located in the capital. Small firm takes value one if the firm has fewer than 20 employees, whileLarge firm dummy takes on value one if firm has more than 100 employees. Log employment is the log of total employees of the firm. SOEpc is the percentage of firm ownership in government hand. Exporter takes value one if the firm exports. Log firm age is the log of number of year since establishment of firm. Manager’s education level takes the following values: 1. Did not complete secondary school 2. Secondary School 3. Vocational Training 4. Some university training 5. Graduate degree (BA, BSc etc.) 6. Post graduate degree (Ph D, Masters). Problem with tax rates, problems with corruption and Crime assess whether either are constraints on the growth of the company and take the following values: 0 = No obstacle 1 = Minor obstacle 2 = Moderate obstacle 3 = Major obstacle 4 = Very Severe Obstacle. Judicial strength is the answer to the following question: "I am confident that the judicial system will enforce my contractual and property rights in business disputes." To what degree do you agree with this statement? 1. Fully disagree, 2. Disagree in most cases, 3. Tend to disagree, 4. Tend to agree, 5. Agree in most cases, 6. Fully agree. Information sharing dummy equals one if

40
an information sharing agency (public registry or private bureau) operates in the country, zero otherwise. Depth of information sharing measures the information contents of the credit information. A value of one is added to the index when a country’s information agencies have each of these characteristics: (1) both positive credit information (for example, loan amounts and pattern of on-time repayments) and negative information (for example, late payments, number and amount of defaults and bankruptcies) are distributed; (2) data on both firms and individual borrowers are distributed; (3) data from retailers, trade creditors, or utilities, as well as from financial institutions, are distributed; (4) more than 2 years of historical data are distributed; (5) data are collected on all loans of value above 1% of income per capita; and (6) laws provide for borrowers’ right to inspect their own data. The index ranges from 0 to 6, with higher values indicating the availability of more credit information, from either a public registry or a private bureau, to facilitate lending decisions. Private Credit to GDP is claims on non-financial private sector by financial institutions divided by GDP. Bank concentration is assets of three largest banks as a share of assets of all commercial banks over the period 2002 to 2005. Total tax rate is the typical company tax rate as share of profits. Control of Corruption and Government Effectiveness are measured in 2005, with mean zero and standard deviation one, and are based on a large number of underlying institutional indicators. Demo branch is the number of bank branches per 1,000,000 people in 2003/2004, while Geo branch is the number of bank branches per 10,000 sq km in 2003/2004. The pooled sample period is 2002 to 2005. The estimation is based on cross section data and includes a full set of industry and year dummies. The omitted variables are medium-sized city, domestic firms, and non-exporters. The marginal effects (dy/dx) of the regressions are presented. The marginal effect of a dummy variable is calculated as the discrete change in the expected value of the dependent variable as the dummy variable changes from 0 to 1. P-values are computed by the heteroskedasticity-robust standard errors clustered for countries and are presented in brackets. *, **, *** represent statistical significance at the 10%, 5% and 1% level respectively.

41
Table 4 Alternative measures of information sharing and more institutional controls 1 2 5 6 7 8 9 3 4 10
Private bureau dummy -0.106
[0.007]***
Public registry dummy -0.133
[0.004]***
Public registry coverage (% adults) -0.140
[0.003]***
Private bureau coverage (% adults) -0.096
[0.006]***
Voice and Accountability -0.062
[0.195]
Political stability -0.149
[0.105]
Quality and Regulation -0.028
[0.117]
Rule of Law -0.145
[0.034]** No. of registering procedures for new business 0.005
[0.308]
Creditors right -0.037
[0.006]***
Number of legal procedures 0.005
[0.124]
Rigidity of employment 0.040
[0.215]
Depth of infoshare -0.036 -0.048 -0.050 -0.054 -0.028 -0.050 -0.052 -0.028
[0.108] [0.058]* [0.027]** [0.038]** [0.105] [0.014]** [0.030]** [0.056]*
Demo branch -0.040 -0.025 -0.045 -0.048 -0.044 -0.041 -0.037 -0.057 -0.031 -0.026
[0.006]*** [0.132] [0.007]*** [0.004]*** [0.002]** * [0.005]*** [0.000]*** [0.019]** [0.101] [0.092]*
Observations 22,627 22,627 22,627 22,627 22,627 22,627 22,627 22,627 22,627 22,627

42
Countries 43 43 43 43 43 43 43 43 43 43
Pseudo_R2 0.157 0.147 0.151 0.155 0.147 0.147 0.148 0.153 0.149 0.149
Log_likelihood -13,482 -13,597 -13,565 -13,458 -13,576 -13,574 -13,585 -13,302 -13,565 -13,583 Note: The dependent variable is tax evasion ratio, computed on basis of question c241 from the Enterprise Surveys: Recognizing the difficulties many enterprises face in fully complying with taxes and regulations, what percentage of total sales would you estimate the typical establishment in your area of activity reports for tax purposes? The tax evasion ratio is equal to one minus the answered number. The pooled sample period is 2002 to 2005. The estimation is based on cross section Tobit model and includes a full set of industry and year dummies. Private and public credit registry take on value one if a private or public credit registry exists. Private/public credit registry coverage reports the number of individuals and firms listed in a private/public credit registry with current information on repayment history, unpaid debts or credit outstanding. The number is expressed as a percentage of the adult population. Creditor rights measures the power of secured lenders in bankruptcy. No. of legal procedures is the number of steps to enforce a contract in the court. Total tax rate is the typical company tax rate as share of profits. Control of Corruption, Political Stability, Rule of Law, Government Effectiveness, Voice and Accountability and Quality of Regulation are measured in 2005, with mean zero and standard deviation one, and are based on a large number of underlying institutional indicators. Demo branch is the number of bank branches per 1,000,000 people in 2003/2004. The regressions contain the same control variables as reported in Table 3. The marginal effect of a dummy variable is calculated as the discrete change in the expected value of the dependent variable as the dummy variable changes from 0 to 1. P-values are computed by the heteroskedasticity-robust standard errors clustered for countries and are presented in brackets. *, **, *** represent statistical significance at the 10%, 5% and 1% level respectively.

43
Table 5. Firm location and tax evasion 1 2 3 4 5
Depth of infoshare -0.052 -0.047 -0.056 -0.055 -0.050
[0.015]** [0.051]* [0.015]** [0.016]** [0.023]**
Demo branch -0.038 -0.042 -0.041 -0.038
[0.004]*** [0.006]*** [0.014]** [0.020]**
Geo branch -0.048
[0.057]*
Smallcity x depth infoshare -0.029
[0.028]**
Capitalcity x depth infoshare 0.021
[0.050]*
Smallcity x demo branch -0.019
[0.066]*
Capitalcity x demo branch 0.021
[0.028]**
Smallcity x geo branch -0.023
[0.023]**
Capitalcity x geo branch 0.022
[0.063]*
Firm location x depth infoshare -0.029 -0.027
[0.015]** [0.027]**
Firm location x demo branch -0.035 -0.026
[0.017]** [0.030]** Firm location x Private Credit/GDP -0.007
[0.077]*
Private Credit/GDP -0.144 -0.133 -0.097 -0.141 -0.137
[0.019]** [0.059]* [0.114] [0.011]** [0.028]**
Bank concentration 0.096 0.076 0.073 0.098 0.087
[0.032]** [0.118] [0.128] [0.029]** [0.031]**
Smallcity 0.052 0.034 0.053 0.057 0.050
[0.022]** [0.117] [0.009]*** [0.031]** [0.033]**
Capitalcity -0.027 -0.037 -0.046 -0.050 -0.048
[0.138] [0.052]* [0.037]** [0.059]* [0.020]**
Observations 22,627 22,627 22,627 22,627 22,627
Countries 43 43 43 43 43
Pseudo_R2 0.147 0.148 0.145 0.148 0.150
Log_likelihood -13,586 -13,565 -13,585 -13,563 -13,562 Note: The dependent variable is tax evasion ratio, computed on basis of question c241 from the Enterprise Surveys: Recognizing the difficulties many enterprises face in fully complying with taxes and regulations, what percentage of total sales would you estimate the typical establishment in your area of activity reports for tax purposes? The tax evasion ratio is equal to one minus the answered number. The pooled sample period is 2002 to 2005. The estimation is based on cross section Tobit model and includes a full set of industry and year dummies. The small city dummy takes the value one if the firm is located in a city with fewer than 250,000 inhabitants, while capital city takes on the value one if the firm is located in the capital. Firm location takes the following values: 1=Capital City; 2=Other city of over 1 million population; 3=City of 250,000-1million; 4=City of 50,000-250,000; 5=Town or Location with less than 50,000 population. Depth of information sharing measures the information contents of the credit information. A value of one is added to the index when a country’s information agencies have each of these characteristics: (1) both positive credit information (for example, loan amounts and pattern of on-time repayments) and negative information (for example, late payments, number and amount of defaults and bankruptcies) are distributed; (2) data on both firms and individual borrowers are distributed; (3) data from retailers, trade

44
creditors, or utilities, as well as from financial institutions, are distributed; (4) more than 2 years of historical data are distributed; (5) data are collected on all loans of value above 1% of income per capita; and (6) laws provide for borrowers’ right to inspect their own data. The index ranges from 0 to 6, with higher values indicating the availability of more credit information, from either a public registry or a private bureau, to facilitate lending decisions. Private Credit to GDP is claims on non-financial private sector by financial institutions divided by GDP. Bank concentration is assets of three largest banks as a share of assets of all commercial banks over the period 2002 to 2005. Demo branch is the number of bank branches per 1,000,000 people in 2003/2004, while Geo branch is the number of bank branches per 10,000 sq km in 2003/2004. The marginal effects (dy/dx) of the Tobit regressions are presented. The regressions contain the same control variables as in Table 3. The marginal effect of a dummy variable is calculated as the discrete change in the expected value of the dependent variable as the dummy variable changes from 0 to 1. P-values are computed by the heteroskedasticity-robust standard errors clustered for countries and are presented in brackets. *, **, *** represent statistical significance at the 10%, 5% and 1% level respectively.

45
Table 6. Firm size and tax evasion 1 2 3 4 5
Depth of infoshare -0.049 -0.037 -0.052 -0.050 -0.049
[0.016]** [0.056]* [0.017]** [0.018]** [0.021]**
Demo branch -0.032 -0.043 -0.044 -0.040
[0.054]* [0.021]** [0.023]** [0.036]**
Geo branch -0.042
[0.012]**
Smallfirm x depth of infoshare -0.024 -0.020 -0.017
[0.030]** [0.056]* [0.068]*
Bigfirm x depth of infoshare 0.021 0.025 0.026
[0.052]* [0.020]** [0.029]**
Smallfirm x demo branch -0.022 -0.026 -0.029
[0.122] [0.017]** [0.022]**
Bigfirm x demo branch 0.027 0.015 0.018
[0.032]** [0.113] [0.141]
Smallfirm x geo branch -0.021
[0.019]**
Bigfirm x geo branch 0.020
[0.126]
Small firm x Private Credit/GDP -0.004
[0.059]*
Large firm x Private Credit/GDP 0.004
[0.108]
Firm location x depth infoshare -0.030 -0.024
[0.114] [0.106]
Firm location x demo branch -0.035 -0.029
[0.113] [0.129]
Firm location x Private Credit/GDP -0.007
[0.195]
Private Credit/GDP -0.144 -0.141 -0.108 -0.104 -0.110
[0.018]** [0.024]** [0.131] [0.021]** [0.036]**
Bank concentration 0.081 0.090 0.081 0.082 0.080
[0.120] [0.034]** [0.108] [0.054]* [0.062]*
Smallcity 0.052 0.033 0.057 0.054 0.048
[0.013]** [0.119] [0.029]** [0.027]** [0.024]**
Capitalcity -0.050 -0.049 -0.032 -0.047 -0.041
[0.037]** [0.034]** [0.121] [0.014]** [0.084]*
Observations 22,627 22,627 22,627 22,627 22,627
Countries 43 43 43 43 43
Pseudo_R2 0.146 0.146 0.142 0.149 0.150
Log_likelihood -13,571 -13,598 -13,590 -13,572 -13,519 Note: The dependent variable is tax evasion ratio, computed on basis of question c241 from the Enterprise Surveys: Recognizing the difficulties many enterprises face in fully complying with taxes and regulations, what percentage of total sales would you estimate the typical establishment in your area of activity reports for tax purposes? The tax evasion ratio is equal to one minus the answered number. The pooled sample period is 2002 to 2005. The estimation is based on cross section Tobit model and includes a full set of industry and year dummies. The small city dummy takes the value one if the firm is located in a city with fewer than 250,000 inhabitants, while capital city takes on the value one if the firm is located in the

46
capital. Firm location takes the following values: 1=Capital City; 2=Other city of over 1 million population; 3=City of 250,000-1million; 4=City of 50,000-250,000; 5=Town or Location with less than 50,000 population. Small firm dummy takes value one if the firm has fewer than 20 employees, while Large firm dummy takes on value one if firm has more than 100 employees. Depth of information sharing measures the information contents of the credit information. A value of one is added to the index when a country’s information agencies have each of these characteristics: (1) both positive credit information (for example, loan amounts and pattern of on-time repayments) and negative information (for example, late payments, number and amount of defaults and bankruptcies) are distributed; (2) data on both firms and individual borrowers are distributed; (3) data from retailers, trade creditors, or utilities, as well as from financial institutions, are distributed; (4) more than 2 years of historical data are distributed; (5) data are collected on all loans of value above 1% of income per capita; and (6) laws provide for borrowers’ right to inspect their own data. The index ranges from 0 to 6, with higher values indicating the availability of more credit information, from either a public registry or a private bureau, to facilitate lending decisions. Private Credit to GDP is claims on non-financial private sector by financial institutions divided by GDP. Bank concentration is assets of three largest banks as a share of assets of all commercial banks over the period 2002 to 2005. Demo branch is the number of bank branches per 1,000,000 people in 2003/2004, while Geo branch is the number of bank branches per 10,000 sq km in 2003/2004. The marginal effects (dy/dx) of the Tobit regressions are presented. The regressions contain the same control variables as in Table 3. The marginal effect of a dummy variable is calculated as the discrete change in the expected value of the dependent variable as the dummy variable changes from 0 to 1. P-values are computed by the heteroskedasticity-robust standard errors clustered for countries and are presented in brackets. *, **, *** represent statistical significance at the 10%, 5% and 1% level respectively.
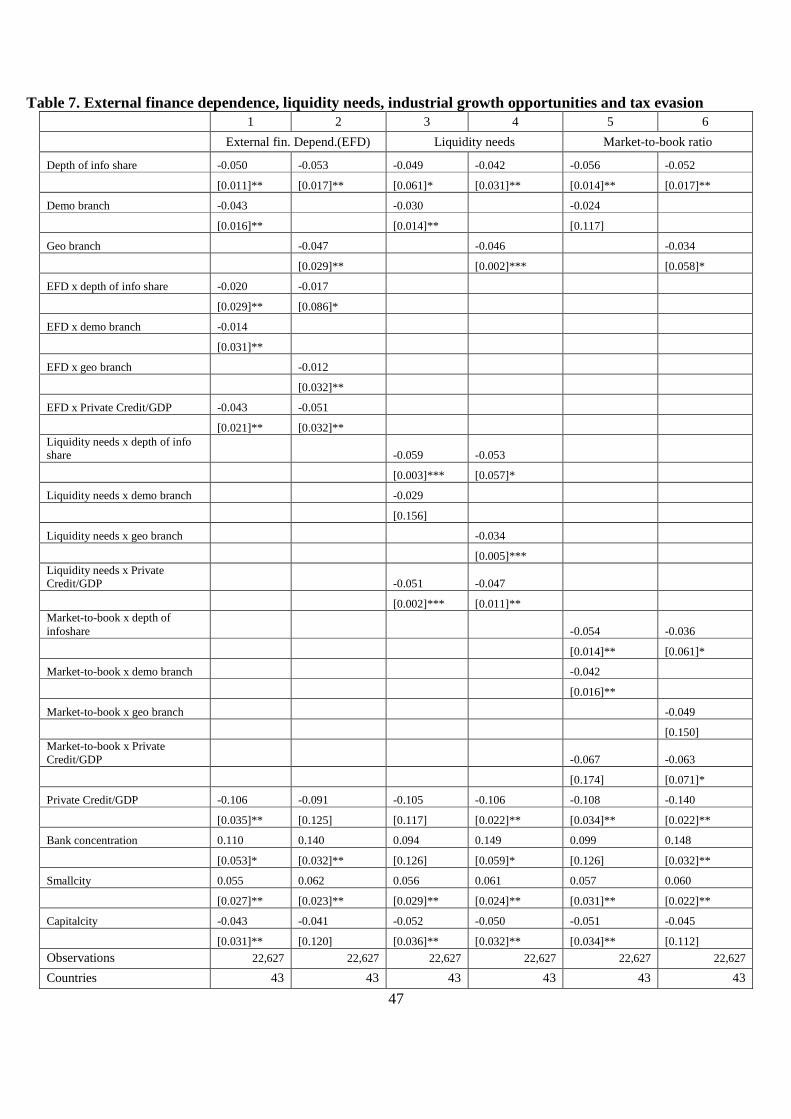
47
Table 7. External finance dependence, liquidity needs, industrial growth opportunities and tax evasion 1 2 3 4 5 6
External fin. Depend.(EFD) Liquidity needs Market-to-book ratio
Depth of info share -0.050 -0.053 -0.049 -0.042 -0.056 -0.052
[0.011]** [0.017]** [0.061]* [0.031]** [0.014]** [0.017]**
Demo branch -0.043 -0.030 -0.024
[0.016]** [0.014]** [0.117]
Geo branch -0.047 -0.046 -0.034
[0.029]** [0.002]*** [0.058]*
EFD x depth of info share -0.020 -0.017
[0.029]** [0.086]*
EFD x demo branch -0.014
[0.031]**
EFD x geo branch -0.012
[0.032]**
EFD x Private Credit/GDP -0.043 -0.051
[0.021]** [0.032]** Liquidity needs x depth of info share -0.059 -0.053
[0.003]*** [0.057]*
Liquidity needs x demo branch -0.029
[0.156]
Liquidity needs x geo branch -0.034
[0.005]*** Liquidity needs x Private Credit/GDP -0.051 -0.047
[0.002]*** [0.011]** Market-to-book x depth of infoshare -0.054 -0.036
[0.014]** [0.061]*
Market-to-book x demo branch -0.042
[0.016]**
Market-to-book x geo branch -0.049
[0.150] Market-to-book x Private Credit/GDP -0.067 -0.063
[0.174] [0.071]*
Private Credit/GDP -0.106 -0.091 -0.105 -0.106 -0.108 -0.140
[0.035]** [0.125] [0.117] [0.022]** [0.034]** [0.022]**
Bank concentration 0.110 0.140 0.094 0.149 0.099 0.148
[0.053]* [0.032]** [0.126] [0.059]* [0.126] [0.032]**
Smallcity 0.055 0.062 0.056 0.061 0.057 0.060
[0.027]** [0.023]** [0.029]** [0.024]** [0.031]** [0.022]**
Capitalcity -0.043 -0.041 -0.052 -0.050 -0.051 -0.045
[0.031]** [0.120] [0.036]** [0.032]** [0.034]** [0.112]
Observations 22,627 22,627 22,627 22,627 22,627 22,627
Countries 43 43 43 43 43 43
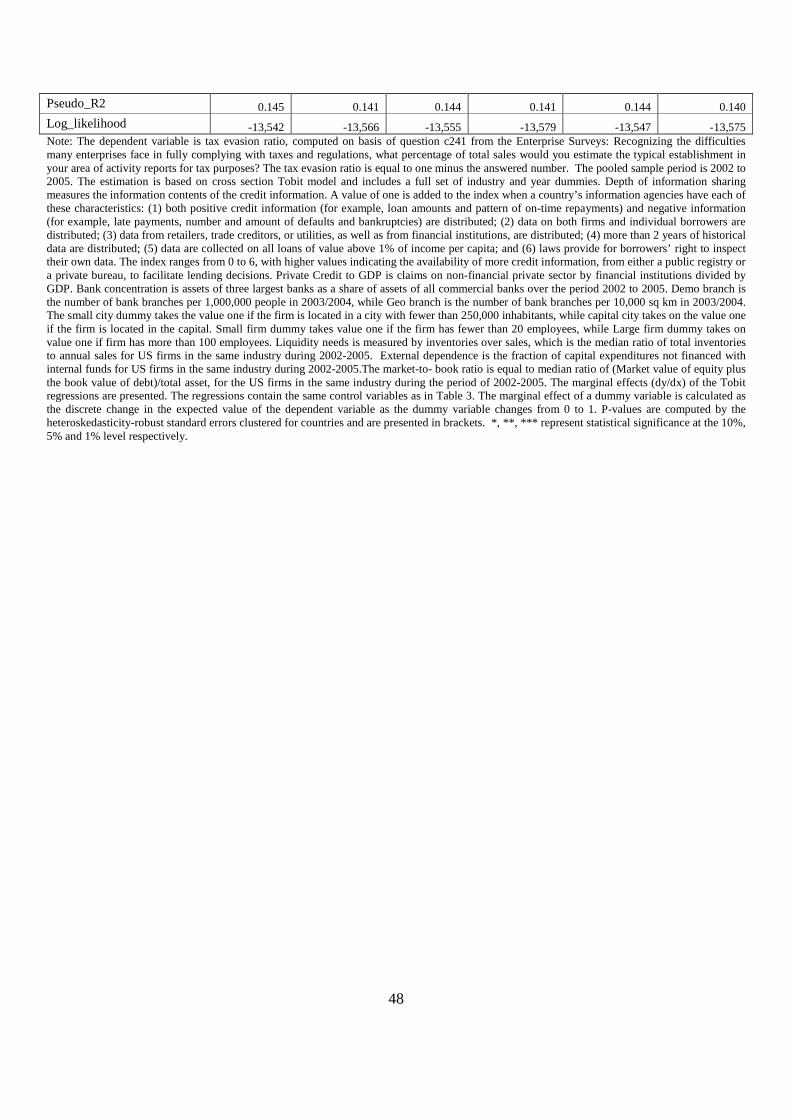
48
Pseudo_R2 0.145 0.141 0.144 0.141 0.144 0.140
Log_likelihood -13,542 -13,566 -13,555 -13,579 -13,547 -13,575 Note: The dependent variable is tax evasion ratio, computed on basis of question c241 from the Enterprise Surveys: Recognizing the difficulties many enterprises face in fully complying with taxes and regulations, what percentage of total sales would you estimate the typical establishment in your area of activity reports for tax purposes? The tax evasion ratio is equal to one minus the answered number. The pooled sample period is 2002 to 2005. The estimation is based on cross section Tobit model and includes a full set of industry and year dummies. Depth of information sharing measures the information contents of the credit information. A value of one is added to the index when a country’s information agencies have each of these characteristics: (1) both positive credit information (for example, loan amounts and pattern of on-time repayments) and negative information (for example, late payments, number and amount of defaults and bankruptcies) are distributed; (2) data on both firms and individual borrowers are distributed; (3) data from retailers, trade creditors, or utilities, as well as from financial institutions, are distributed; (4) more than 2 years of historical data are distributed; (5) data are collected on all loans of value above 1% of income per capita; and (6) laws provide for borrowers’ right to inspect their own data. The index ranges from 0 to 6, with higher values indicating the availability of more credit information, from either a public registry or a private bureau, to facilitate lending decisions. Private Credit to GDP is claims on non-financial private sector by financial institutions divided by GDP. Bank concentration is assets of three largest banks as a share of assets of all commercial banks over the period 2002 to 2005. Demo branch is the number of bank branches per 1,000,000 people in 2003/2004, while Geo branch is the number of bank branches per 10,000 sq km in 2003/2004. The small city dummy takes the value one if the firm is located in a city with fewer than 250,000 inhabitants, while capital city takes on the value one if the firm is located in the capital. Small firm dummy takes value one if the firm has fewer than 20 employees, while Large firm dummy takes on value one if firm has more than 100 employees. Liquidity needs is measured by inventories over sales, which is the median ratio of total inventories to annual sales for US firms in the same industry during 2002-2005. External dependence is the fraction of capital expenditures not financed with internal funds for US firms in the same industry during 2002-2005.The market-to- book ratio is equal to median ratio of (Market value of equity plus the book value of debt)/total asset, for the US firms in the same industry during the period of 2002-2005. The marginal effects (dy/dx) of the Tobit regressions are presented. The regressions contain the same control variables as in Table 3. The marginal effect of a dummy variable is calculated as the discrete change in the expected value of the dependent variable as the dummy variable changes from 0 to 1. P-values are computed by the heteroskedasticity-robust standard errors clustered for countries and are presented in brackets. *, **, *** represent statistical significance at the 10%, 5% and 1% level respectively.
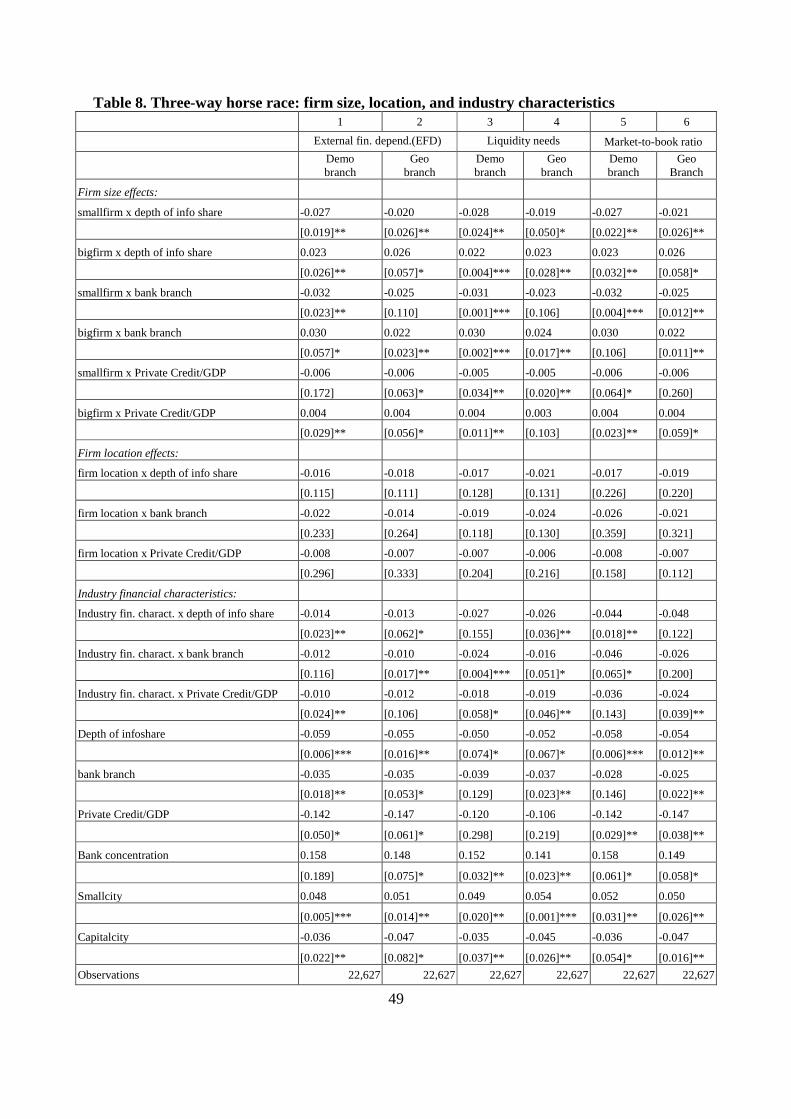
49
Table 8. Three-way horse race: firm size, location, and industry characteristics 1 2 3 4 5 6
External fin. depend.(EFD) Liquidity needs Market-to-book ratio
Demo branch
Geo branch
Demo branch
Geo branch
Demo branch
Geo Branch
Firm size effects:
smallfirm x depth of info share -0.027 -0.020 -0.028 -0.019 -0.027 -0.021
[0.019]** [0.026]** [0.024]** [0.050]* [0.022]** [0.026]**
bigfirm x depth of info share 0.023 0.026 0.022 0.023 0.023 0.026
[0.026]** [0.057]* [0.004]*** [0.028]** [0.032]** [0.058]*
smallfirm x bank branch -0.032 -0.025 -0.031 -0.023 -0.032 -0.025
[0.023]** [0.110] [0.001]*** [0.106] [0.004]*** [0.012]**
bigfirm x bank branch 0.030 0.022 0.030 0.024 0.030 0.022
[0.057]* [0.023]** [0.002]*** [0.017]** [0.106] [0.011]**
smallfirm x Private Credit/GDP -0.006 -0.006 -0.005 -0.005 -0.006 -0.006
[0.172] [0.063]* [0.034]** [0.020]** [0.064]* [0.260]
bigfirm x Private Credit/GDP 0.004 0.004 0.004 0.003 0.004 0.004
[0.029]** [0.056]* [0.011]** [0.103] [0.023]** [0.059]*
Firm location effects:
firm location x depth of info share -0.016 -0.018 -0.017 -0.021 -0.017 -0.019
[0.115] [0.111] [0.128] [0.131] [0.226] [0.220]
firm location x bank branch -0.022 -0.014 -0.019 -0.024 -0.026 -0.021
[0.233] [0.264] [0.118] [0.130] [0.359] [0.321]
firm location x Private Credit/GDP -0.008 -0.007 -0.007 -0.006 -0.008 -0.007
[0.296] [0.333] [0.204] [0.216] [0.158] [0.112]
Industry financial characteristics:
Industry fin. charact. x depth of info share -0.014 -0.013 -0.027 -0.026 -0.044 -0.048
[0.023]** [0.062]* [0.155] [0.036]** [0.018]** [0.122]
Industry fin. charact. x bank branch -0.012 -0.010 -0.024 -0.016 -0.046 -0.026
[0.116] [0.017]** [0.004]*** [0.051]* [0.065]* [0.200]
Industry fin. charact. x Private Credit/GDP -0.010 -0.012 -0.018 -0.019 -0.036 -0.024
[0.024]** [0.106] [0.058]* [0.046]** [0.143] [0.039]**
Depth of infoshare -0.059 -0.055 -0.050 -0.052 -0.058 -0.054
[0.006]*** [0.016]** [0.074]* [0.067]* [0.006]*** [0.012]**
bank branch -0.035 -0.035 -0.039 -0.037 -0.028 -0.025
[0.018]** [0.053]* [0.129] [0.023]** [0.146] [0.022]**
Private Credit/GDP -0.142 -0.147 -0.120 -0.106 -0.142 -0.147
[0.050]* [0.061]* [0.298] [0.219] [0.029]** [0.038]**
Bank concentration 0.158 0.148 0.152 0.141 0.158 0.149
[0.189] [0.075]* [0.032]** [0.023]** [0.061]* [0.058]*
Smallcity 0.048 0.051 0.049 0.054 0.052 0.050
[0.005]*** [0.014]** [0.020]** [0.001]*** [0.031]** [0.026]**
Capitalcity -0.036 -0.047 -0.035 -0.045 -0.036 -0.047
[0.022]** [0.082]* [0.037]** [0.026]** [0.054]* [0.016]**
Observations 22,627 22,627 22,627 22,627 22,627 22,627
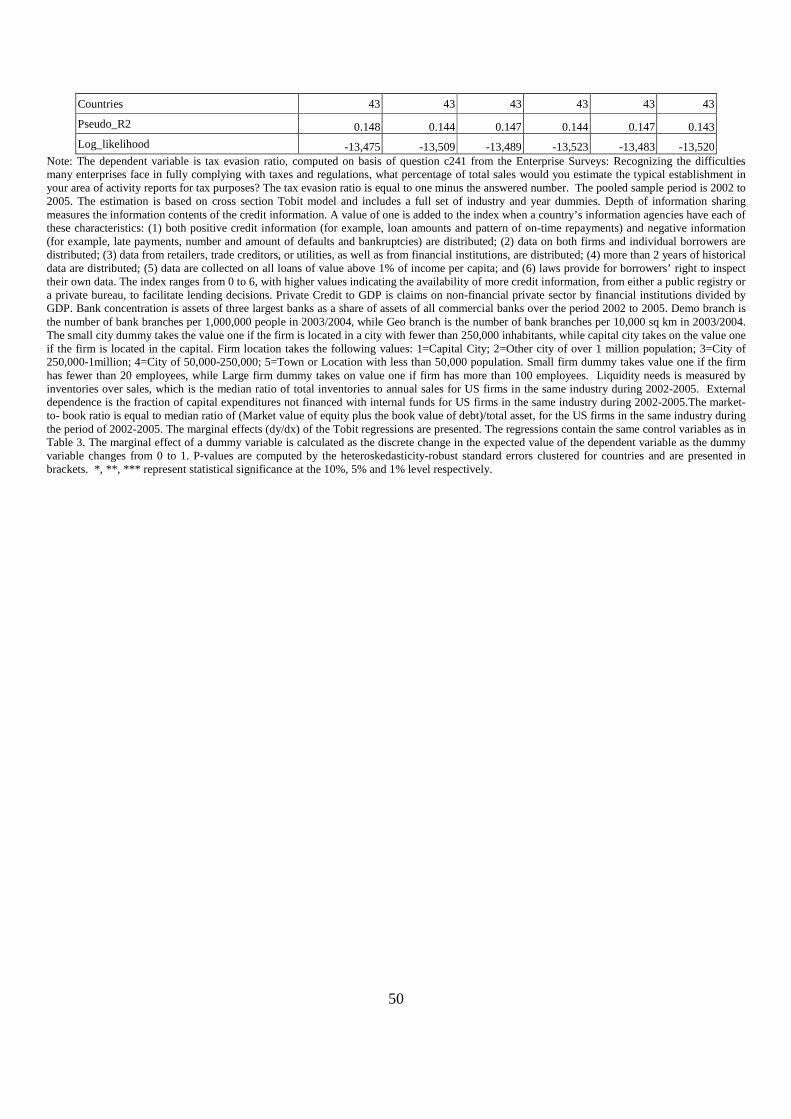
50
Countries 43 43 43 43 43 43
Pseudo_R2 0.148 0.144 0.147 0.144 0.147 0.143
Log_likelihood -13,475 -13,509 -13,489 -13,523 -13,483 -13,520 Note: The dependent variable is tax evasion ratio, computed on basis of question c241 from the Enterprise Surveys: Recognizing the difficulties many enterprises face in fully complying with taxes and regulations, what percentage of total sales would you estimate the typical establishment in your area of activity reports for tax purposes? The tax evasion ratio is equal to one minus the answered number. The pooled sample period is 2002 to 2005. The estimation is based on cross section Tobit model and includes a full set of industry and year dummies. Depth of information sharing measures the information contents of the credit information. A value of one is added to the index when a country’s information agencies have each of these characteristics: (1) both positive credit information (for example, loan amounts and pattern of on-time repayments) and negative information (for example, late payments, number and amount of defaults and bankruptcies) are distributed; (2) data on both firms and individual borrowers are distributed; (3) data from retailers, trade creditors, or utilities, as well as from financial institutions, are distributed; (4) more than 2 years of historical data are distributed; (5) data are collected on all loans of value above 1% of income per capita; and (6) laws provide for borrowers’ right to inspect their own data. The index ranges from 0 to 6, with higher values indicating the availability of more credit information, from either a public registry or a private bureau, to facilitate lending decisions. Private Credit to GDP is claims on non-financial private sector by financial institutions divided by GDP. Bank concentration is assets of three largest banks as a share of assets of all commercial banks over the period 2002 to 2005. Demo branch is the number of bank branches per 1,000,000 people in 2003/2004, while Geo branch is the number of bank branches per 10,000 sq km in 2003/2004. The small city dummy takes the value one if the firm is located in a city with fewer than 250,000 inhabitants, while capital city takes on the value one if the firm is located in the capital. Firm location takes the following values: 1=Capital City; 2=Other city of over 1 million population; 3=City of 250,000-1million; 4=City of 50,000-250,000; 5=Town or Location with less than 50,000 population. Small firm dummy takes value one if the firm has fewer than 20 employees, while Large firm dummy takes on value one if firm has more than 100 employees. Liquidity needs is measured by inventories over sales, which is the median ratio of total inventories to annual sales for US firms in the same industry during 2002-2005. External dependence is the fraction of capital expenditures not financed with internal funds for US firms in the same industry during 2002-2005.The market-to- book ratio is equal to median ratio of (Market value of equity plus the book value of debt)/total asset, for the US firms in the same industry during the period of 2002-2005. The marginal effects (dy/dx) of the Tobit regressions are presented. The regressions contain the same control variables as in Table 3. The marginal effect of a dummy variable is calculated as the discrete change in the expected value of the dependent variable as the dummy variable changes from 0 to 1. P-values are computed by the heteroskedasticity-robust standard errors clustered for countries and are presented in brackets. *, **, *** represent statistical significance at the 10%, 5% and 1% level respectively.
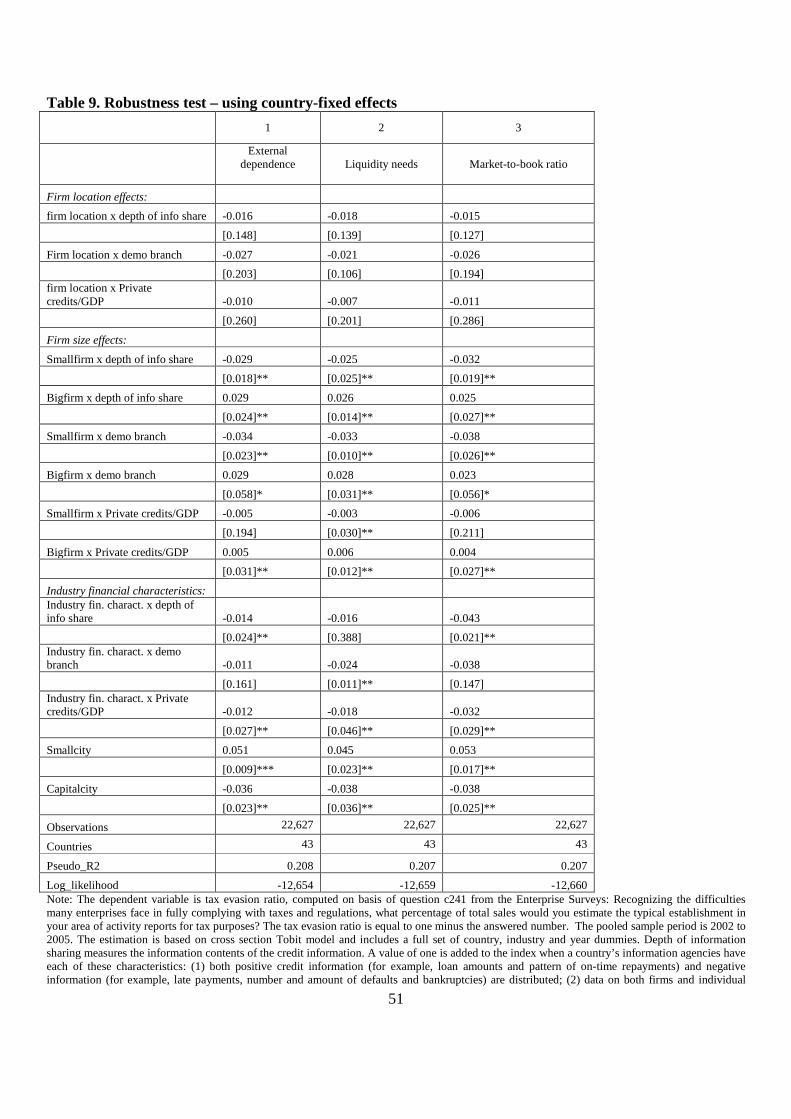
51
Table 9. Robustness test – using country-fixed effects
1 2 3
External dependence
Liquidity needs Market-to-book ratio
Firm location effects:
firm location x depth of info share -0.016 -0.018 -0.015
[0.148] [0.139] [0.127]
Firm location x demo branch -0.027 -0.021 -0.026
[0.203] [0.106] [0.194] firm location x Private credits/GDP -0.010 -0.007 -0.011
[0.260] [0.201] [0.286]
Firm size effects:
Smallfirm x depth of info share -0.029 -0.025 -0.032
[0.018]** [0.025]** [0.019]**
Bigfirm x depth of info share 0.029 0.026 0.025
[0.024]** [0.014]** [0.027]**
Smallfirm x demo branch -0.034 -0.033 -0.038
[0.023]** [0.010]** [0.026]**
Bigfirm x demo branch 0.029 0.028 0.023
[0.058]* [0.031]** [0.056]*
Smallfirm x Private credits/GDP -0.005 -0.003 -0.006
[0.194] [0.030]** [0.211]
Bigfirm x Private credits/GDP 0.005 0.006 0.004
[0.031]** [0.012]** [0.027]**
Industry financial characteristics: Industry fin. charact. x depth of info share -0.014 -0.016 -0.043
[0.024]** [0.388] [0.021]** Industry fin. charact. x demo branch -0.011 -0.024 -0.038
[0.161] [0.011]** [0.147] Industry fin. charact. x Private credits/GDP -0.012 -0.018 -0.032
[0.027]** [0.046]** [0.029]**
Smallcity 0.051 0.045 0.053
[0.009]*** [0.023]** [0.017]**
Capitalcity -0.036 -0.038 -0.038
[0.023]** [0.036]** [0.025]**
Observations 22,627 22,627 22,627
Countries 43 43 43
Pseudo_R2 0.208 0.207 0.207
Log_likelihood -12,654 -12,659 -12,660 Note: The dependent variable is tax evasion ratio, computed on basis of question c241 from the Enterprise Surveys: Recognizing the difficulties many enterprises face in fully complying with taxes and regulations, what percentage of total sales would you estimate the typical establishment in your area of activity reports for tax purposes? The tax evasion ratio is equal to one minus the answered number. The pooled sample period is 2002 to 2005. The estimation is based on cross section Tobit model and includes a full set of country, industry and year dummies. Depth of information sharing measures the information contents of the credit information. A value of one is added to the index when a country’s information agencies have each of these characteristics: (1) both positive credit information (for example, loan amounts and pattern of on-time repayments) and negative information (for example, late payments, number and amount of defaults and bankruptcies) are distributed; (2) data on both firms and individual

52
borrowers are distributed; (3) data from retailers, trade creditors, or utilities, as well as from financial institutions, are distributed; (4) more than 2 years of historical data are distributed; (5) data are collected on all loans of value above 1% of income per capita; and (6) laws provide for borrowers’ right to inspect their own data. The index ranges from 0 to 6, with higher values indicating the availability of more credit information, from either a public registry or a private bureau, to facilitate lending decisions. Demo branch is the number of bank branches per 1,000,000 people in 2003/2004. The small city dummy takes the value one if the firm is located in a city with fewer than 250,000 inhabitants, while capital city takes on the value one if the firm is located in the capital. Firm location takes the following values: 1=Capital City; 2=Other city of over 1 million population; 3=City of 250,000-1million; 4=City of 50,000-250,000; 5=Town or Location with less than 50,000 population. Small firm dummy takes value one if the firm has fewer than 20 employees, while Large firm dummy takes on value one if firm has more than 100 employees. Liquidity needs is measured by inventories over sales, which is the median ratio of total inventories to annual sales for US firms in the same industry during 2002-2005. External dependence is the fraction of capital expenditures not financed with internal funds for US firms in the same industry during 2002-2005.The market-to- book ratio is equal to median ratio of (Market value of equity plus the book value of debt)/total asset, for the US firms in the same industry during the period of 2002-2005. The marginal effects (dy/dx) of the Tobit regressions are presented. The regressions contain the same firm-level control variables as in Table 3 and country dummies. The marginal effect of a dummy variable is calculated as the discrete change in the expected value of the dependent variable as the dummy variable changes from 0 to 1. P-values are computed by the heteroskedasticity-robust standard errors clustered for countries and are presented in brackets. *, **, *** represent statistical significance at the 10%, 5% and 1% level respectively.

53
Table 10: Panel data estimation results: Firm fixed effects
1 2 3 4 5 6 7 8 9 Depth of infoshare -0.055 -0.049 -0.026 -0.051 -0.039 -0.004 -0.027 -0.002 0.012
[0.000]*** [0.000]*** [0.056]* [0.001]*** [0.008]** * [0.861] [0.059]* [0.877] [0.642]
Private credit/GDP -0.29 -0.425 -0.382 -0.144 -0.212 0.593 -0.263 -0.362 0.485
[0.013]** [0.007]*** [0.011]** [0.215] [0.139] [0.007]*** [0.061]* [0.035]** [0.048]**
Bank concentration 0.034 0.038 0.019 0.027 0.042 0.000 0.012 0.027 -0.009
[0.597] [0.548] [0.741] [0.664] [0.518] [0.996] [0.836] [0.643] [0.842]
Firm size effects:
smallfirm x Depth of infoshare -0.043 -0.043 -0.045 -0.031
[0.000]*** [0.000]*** [0.000]*** [0.000]***
bigfirm x Depth of infoshare 0.013 0.017 0.013 0.012
[0.183] [0.063]* [0.120] [0.169]
smallfirm x private credit/GDP -0.005 -0.017 -0.014 -0.005
[0.945] [0.826] [0.852] [0.946]
bigfirm x private credit/GDP -0.057 -0.147 -0.04 -0.132
[0.558] [0.097]* [0.676] [0.124]
Firm location effects:
smallcity x Depth of infoshare 0.004 -0.006 -0.005 -0.007 -0.004
[0.769] [0.586] [0.667] [0.510] [0.752]
capitalcity x Depth of infoshare -0.017 -0.018 -0.015 -0.02 -0.018
[0.328] [0.334] [0.406] [0.266] [0.331]
smallcity x private credit/GDP -0.259 -0.172 -0.213 -0.179 -0.137
[0.047]** [0.186] [0.068]* [0.161] [0.251]
capitalcity x private credit/GDP -0.024 0.002 -0.021 -0.021 -0.032
[0.859] [0.989] [0.870] [0.869] [0.792]
Industry financial characteristics:
ext fin dep x Depth of infoshare -0.004 -0.001
[0.436] [0.792]
ext fin dep x private credit/GDP -0.250 -0.303
[0.002]*** [0.000]***
liquid needs x Depth of infoshare -0.144 -0.206
[0.021]** [0.003]***

54
liquid needs x private credit/GDP -0.658 -0.218
[0.200] [0.677]
mkt-to-book ratio x Depth of infoshare -0.023 -0.020
[0.013]** [0.031]** mkt-to-book ratio x private credit/GDP -0.463 -0.460
[0.000]*** [0.000]***
Observations 1794 1794 1794 1794 1794 1794 1794 1794 1794
no. of countries 26 26 26 26 26 26 26 26 26
Number of firms 935 935 935 935 935 935 935 935 935
Adj R2 0.132 0.137 0.184 0.154 0.143 0.320 0.209 0.200 0.347
Log likelihood 1951.752 1958.712 2011.473 1975.346 1963.536 2171.856 2039.519 2029.7 2212.452
Robust p values in brackets
Note: The dependent variable is tax evasion ratio, computed on basis of question c241 from the Enterprise Surveys: Recognizing the difficulties many enterprises face in fully complying with taxes and regulations, what percentage of total sales would you estimate the typical establishment in your area of activity reports for tax purposes? The tax evasion ratio is equal to one minus the answered number. The sample period is 2002 and 2005. The estimation is based on an OLS model and includes firm and year dummies. Depth of information sharing measures the information contents of the credit information. A value of one is added to the index when a country’s information agencies have each of these characteristics: (1) both positive credit information (for example, loan amounts and pattern of on-time repayments) and negative information (for example, late payments, number and amount of defaults and bankruptcies) are distributed; (2) data on both firms and individual borrowers are distributed; (3) data from retailers, trade creditors, or utilities, as well as from financial institutions, are distributed; (4) more than 2 years of historical data are distributed; (5) data are collected on all loans of value above 1% of income per capita; and (6) laws provide for borrowers’ right to inspect their own data. The index ranges from 0 to 6, with higher values indicating the availability of more credit information, from either a public registry or a private bureau, to facilitate lending decisions. Demo branch is the number of bank branches per 1,000,000 people in 2003/2004, while Geo branch is the number of bank branches per 10,000 sq km in 2003/2004. Private Credit to GDP is claims on non-financial private sector by financial institutions divided by GDP. Bank concentration is assets of three largest banks as a share of assets of all commercial banks over the period 2002 to 2005. The small city dummy takes the value one if the firm is located in a city with fewer than 250,000 inhabitants, while capital city takes on the value one if the firm is located in the capital. Firm location takes the following values: 1=Capital City; 2=Other city of over 1 million population; 3=City of 250,000-1million; 4=City of 50,000-250,000; 5=Town or Location with less than 50,000 population. Small firm dummy takes value one if the firm has fewer than 20 employees, while Large firm dummy takes on value one if firm has more than 100 employees. Liquidity needs is measured by inventories over sales, which is the median ratio of total inventories to annual sales for US firms in the same industry during 2002-2005. External dependence is the fraction of capital expenditures not financed with internal funds for US firms in the same industry during 2002-2005.The market-to- book ratio is equal to median ratio of (Market value of equity plus the book value of debt)/total asset, for the US firms in the same industry during the period of 2002-2005. The regressions contain the same country control variables as in Table 3, plus the log of employment. P-values are computed by the heteroskedasticity-robust standard errors clustered for countries and are presented in brackets. *, **, *** represent statistical significance at the 10%, 5% and 1% level respectively.

55
Appendix Table. Variable definitions and sources Variable Definition Original Sources
Firm level data
Tax evasion ratio
Question c241: Recognizing the difficulties many enterprises face in fully complying with taxes and regulations, what percentage of total sales would you estimate the typical establishment in your area of activity reports for tax purposes?. The tax evasion ratio is equal to one minus the answered number
World Bank Private Enterprise Survey
Tax evasion dummy
Equals to one if tax evasion ratio is greater than zero, otherwise zero.
World Bank Private Enterprise Survey
SOEpc
percentage of the firm is owned by government/state (question c203c)
World Bank Private Enterprise Survey
Firm location
Question c2071: Where are this establishment and your headquarters located in this country? (Enumerator, Please code as follows: 1=Capital City; 2=Other city of over 1 million population; 3=City of 250,000-1million; 4=City of 50,000-250,000; 5=Town or Location with less than 50,000 population)
World Bank Private Enterprise Survey
Capital city Firm location = 1 (capital city)
World Bank Private Enterprise Survey
Small city Firm location = 4 and 5 (city of 50,000-250,000 and town or location with less than 50,000 population)
World Bank Private Enterprise Survey
employment Total employment of the firm World Bank Private Enterprise Survey
Small firm World Bank Private Enterprise Survey definition: those firms with less than 20 employees
World Bank Private Enterprise Survey
Large firm World Bank Private Enterprise Survey definition: those firms with 100 and over employees
World Bank Private Enterprise Survey
Exporter Export dummy =1 if the firm exports, otherwise 0. World Bank Private Enterprise Survey
Problem with tax rates Question c218e: 0 = No obstacle 1 = Minor obstacle 2 = Moderate obstacle 3 = Major obstacle 4 = Very Severe Obstacle
World Bank Private Enterprise Survey
Problem with corruption
Question c218o: 0 = No obstacle 1 = Minor obstacle 2 = Moderate obstacle 3 = Major obstacle 4 = Very Severe Obstacle
World Bank Private Enterprise Survey
Crime Question c218p: Problem with crime, theft and disorder: 0 = No obstacle 1 = Minor obstacle 2 = Moderate obstacle 3 = Major obstacle 4 = Very Severe Obstacle
World Bank Private Enterprise Survey
Firm age Calculated from the question c201: In what year did your firm begin operations in this country?
World Bank Private Enterprise Survey
Judicial strength
Question c246: "I am confident that the judicial system will enforce my contractual and property rights in business disputes." To what degree do you agree with this statement? __ 1. Fully disagree, 2. Disagree in most cases, 3. Tend to disagree, 4. Tend to agree, 5. Agree in most cases, 6. Fully agree.
World Bank Private Enterprise Survey
Manager’s education level
Question c271: What is the highest level of education of the top manager? 1. Did not complete secondary school
World Bank Private Enterprise Survey

56
2. Secondary School 3. Vocational Training 4. Some university training 5. Graduate degree (BA, BSc etc.) 6. Post graduate degree (Ph D, Masters)
Country level data
Demo branch Demographic branch penetration: number of bank branches per 1,000,000 people in 2003/2004
Beck, et al (2007)
Geo branch Geographic branch penetration: number of bank branches per 10,000 sq km in 2003/2004
Beck, et al (2007)
Bank Concentration (assets)
Assets of three largest banks as a share of assets of all commercial banks over the period 2002 to 2005.
Beck, et al (2010)
Information sharing The dummy variable equals one if an information sharing agency (public registry or private bureau) operates in the country, zero otherwise.
Djankov et al. (2007), World Bank “Doing Business” database
Public credit registry A dummy variable that equals one if a public registry operates in the country during the sample period, zero otherwise.
Djankov et al. (2007), World Bank “Doing Business” database
Private bureau A dummy variable that equals one if a private bureau operates in the country during the sample period, zero otherwise.
Djankov et al. (2007), World Bank “Doing Business” database
Public credit registry coverage
The public credit registry coverage indicator reports the number of individuals and firms listed in a public credit registry with current information on repayment history, unpaid debts or credit outstanding. The number is expressed as a percentage of the adult population. A public credit registry is defined as a database managed by the public sector, usually by the central bank or the superintendent of banks, that collects information on the creditworthiness of borrowers (persons or businesses) in the financial system and makes it available to financial institutions. If no public registry operates, the coverage value is 0.
Djankov et al. (2007), World Bank “Doing Business” database
Private credit bureau coverage
The private credit bureau coverage indicator reports the number of individuals and firms listed by a private credit bureau with current information on repayment history, unpaid debts or credit outstanding. The number is expressed as a percentage of the adult population. A private credit bureau is defined as a private firm or nonprofit organization that maintains a database on the creditworthiness of borrowers (persons or businesses) in the financial system and facilitates the exchange of credit information among banks and financial institutions. Credit investigative bureaus and credit reporting firms that do not directly facilitate information exchange among banks and other financial institutions are not considered. If no private bureau operates, the coverage value is 0.
Djankov et al. (2007), World Bank “Doing Business” database
Depth of Credit Information
An index measures the information contents of the credit information. A value of one is added to the index when a country’s information agencies have each of these characteristics: (1) both positive credit information (for example, loan amounts and pattern of on-time repayments) and negative information (for example, late payments, number and amount of defaults and bankruptcies) are distributed; (2) data on both firms and individual borrowers are distributed; (3) data from retailers, trade creditors, or utilities, as well as from financial institutions, are distributed; (4) more than 2 years of historical data are distributed; (5) data are collected on all loans of value above 1% of income per capita; and (6) laws provide for borrowers’ right to inspect their own data. The index ranges from 0 to 6, with higher values indicating the availability of more credit information, from either a public registry or a private bureau, to facilitate lending decisions.
Djankov et al. (2007), World Bank “Doing Business” database
Number of legal procedures
Number of legal procedures for contract enforcement Djankov et al. (2007),
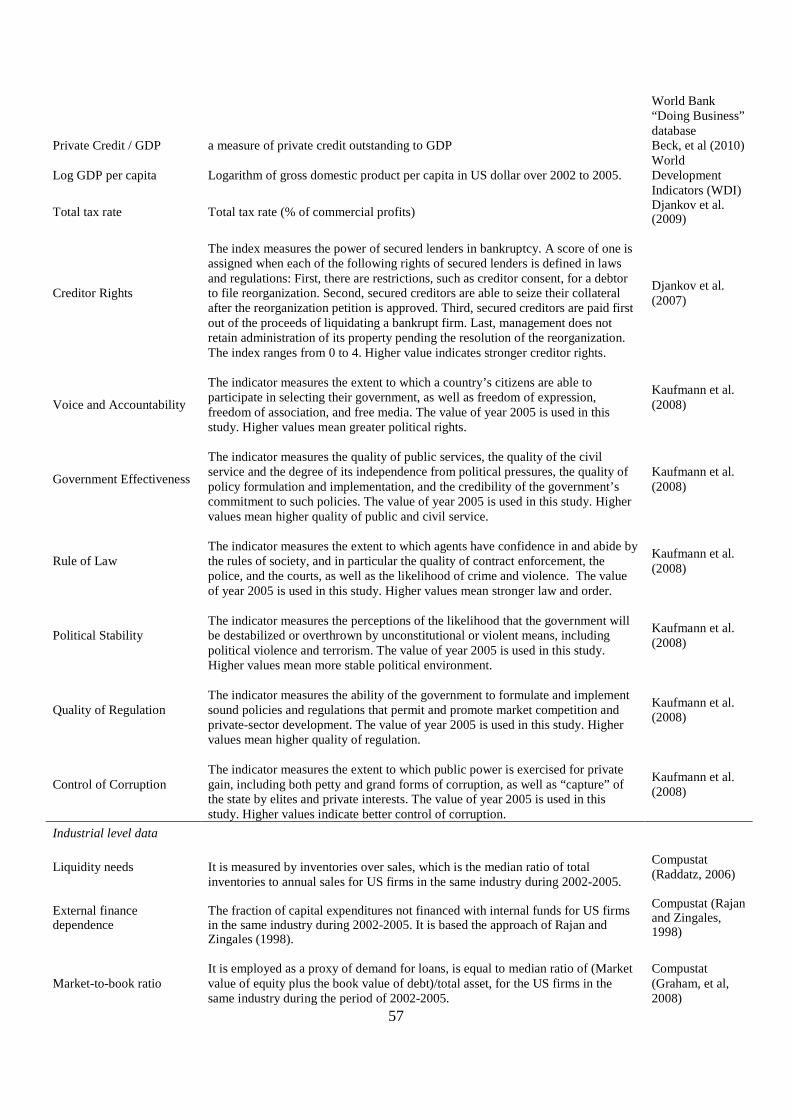
57
World Bank “Doing Business” database
Private Credit / GDP a measure of private credit outstanding to GDP Beck, et al (2010)
Log GDP per capita Logarithm of gross domestic product per capita in US dollar over 2002 to 2005. World Development Indicators (WDI)
Total tax rate Total tax rate (% of commercial profits) Djankov et al. (2009)
Creditor Rights
The index measures the power of secured lenders in bankruptcy. A score of one is assigned when each of the following rights of secured lenders is defined in laws and regulations: First, there are restrictions, such as creditor consent, for a debtor to file reorganization. Second, secured creditors are able to seize their collateral after the reorganization petition is approved. Third, secured creditors are paid first out of the proceeds of liquidating a bankrupt firm. Last, management does not retain administration of its property pending the resolution of the reorganization. The index ranges from 0 to 4. Higher value indicates stronger creditor rights.
Djankov et al. (2007)
Voice and Accountability
The indicator measures the extent to which a country’s citizens are able to participate in selecting their government, as well as freedom of expression, freedom of association, and free media. The value of year 2005 is used in this study. Higher values mean greater political rights.
Kaufmann et al. (2008)
Government Effectiveness
The indicator measures the quality of public services, the quality of the civil service and the degree of its independence from political pressures, the quality of policy formulation and implementation, and the credibility of the government’s commitment to such policies. The value of year 2005 is used in this study. Higher values mean higher quality of public and civil service.
Kaufmann et al. (2008)
Rule of Law
The indicator measures the extent to which agents have confidence in and abide by the rules of society, and in particular the quality of contract enforcement, the police, and the courts, as well as the likelihood of crime and violence. The value of year 2005 is used in this study. Higher values mean stronger law and order.
Kaufmann et al. (2008)
Political Stability
The indicator measures the perceptions of the likelihood that the government will be destabilized or overthrown by unconstitutional or violent means, including political violence and terrorism. The value of year 2005 is used in this study. Higher values mean more stable political environment.
Kaufmann et al. (2008)
Quality of Regulation
The indicator measures the ability of the government to formulate and implement sound policies and regulations that permit and promote market competition and private-sector development. The value of year 2005 is used in this study. Higher values mean higher quality of regulation.
Kaufmann et al. (2008)
Control of Corruption
The indicator measures the extent to which public power is exercised for private gain, including both petty and grand forms of corruption, as well as “capture” of the state by elites and private interests. The value of year 2005 is used in this study. Higher values indicate better control of corruption.
Kaufmann et al. (2008)
Industrial level data
Liquidity needs It is measured by inventories over sales, which is the median ratio of total inventories to annual sales for US firms in the same industry during 2002-2005.
Compustat (Raddatz, 2006)
External finance dependence
The fraction of capital expenditures not financed with internal funds for US firms in the same industry during 2002-2005. It is based the approach of Rajan and Zingales (1998).
Compustat (Rajan and Zingales, 1998)
Market-to-book ratio
It is employed as a proxy of demand for loans, is equal to median ratio of (Market value of equity plus the book value of debt)/total asset, for the US firms in the same industry during the period of 2002-2005.
Compustat (Graham, et al, 2008)

58