El Subjuntivo By Leah, Amanda, Drew, Kelsey, Kristyn, and Nina.
Upload
ira-richardsonCategory
view
220download
4
“Why Count?”: Are Ethnic Group and Visible Minority Group
Useful in the Study of Immigrant Employment Success in Canada?
Kristyn FrankUniversity of Waterloo
Waterloo, Ontario, Canada

Research Problem
Economic integration of immigrants into Canadian society is a concern to researchers, policy-makers and immigrants themselves
Some question whether employment difficulties of immigrants is due to discriminatory hiring practices
Research Questions Is the employment success of
immigrants to Canada statistically dependent on ethnic origin and/or visible minority group? If so, which groups have the greatest
and least amounts of success? If so, does ethnic group or visible
minority group have a stronger association with employment success?
Background John Porter (1965): The Vertical Mosaic
Observed Canada as an ethnically stratified society Found that British and French ethnic groups were the
most advantaged Demographic changes in immigrants shifted
focus to stratification from ethnic to racial groupings
Recent studies diverge: Some support Porter’s thesis (e.g.Nakhaie 1998;
Lautard & Loree 1984) Some find Canadian society stratified more along
racial lines (e.g. Herberg 1990; Lian and Matthews 1998)
Data Source
Survey: Longitudinal Survey of Immigrants to Canada Statistics Canada and Citizenship and
Immigration Canada Immigrants’ experiences adapting to
Canadian society in their first 4 years Includes immigrants who arrived
between Oct. 1, 2000 and Sept. 30, 2001
Methodology Scope:
Individuals aged 25-64 Individuals who stated an intended
occupation prior to immigrating Statistical Methods:
Chi-square tests of independence Cramer’s V strength of association test
Weighting: Proportional to sample size
Definition of Terms
Ethnic Group: Respondent’s ethnic or cultural identity as it relates to themselves or their ancestors
Visible Minority Group: “Visible minority” identified within Canadian society as “non-Caucasian”; based on physical attributes
Definition of Terms “Employment Success” measured by 2
dependent variables: Major Group Job Match: Whether an immigrant
obtained a job since immigrating that matches his/her intended occupation at the major group level of the 2001 National Occupational Classification (e.g. “Clerical Occupations”; “Professional Occupations in Health”)
Skill Level Match: Whether the skill level of any job that an immigrant has held since arrival matches the skill level required for his/her intended occupation (4 skill levels-2001 NOC)
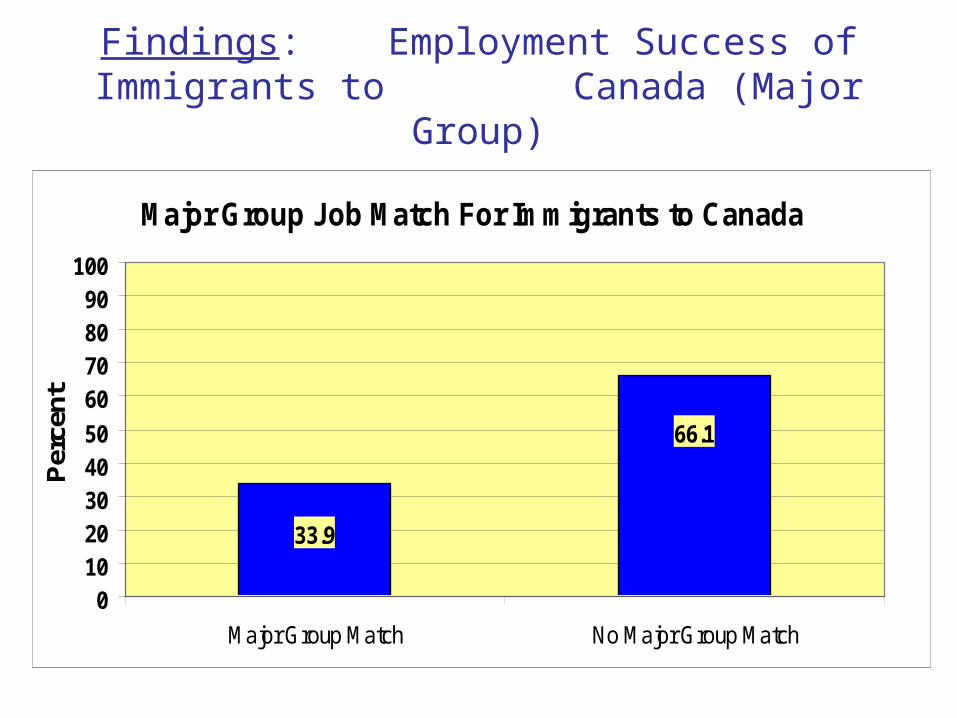
Findings: Employment Success of Immigrants to Canada (Major Group)
Major Group Job Match For Immigrants to Canada
66.1
33.9
01020304050
60708090
100
Major Group Match No Major Group Match
Per
cent
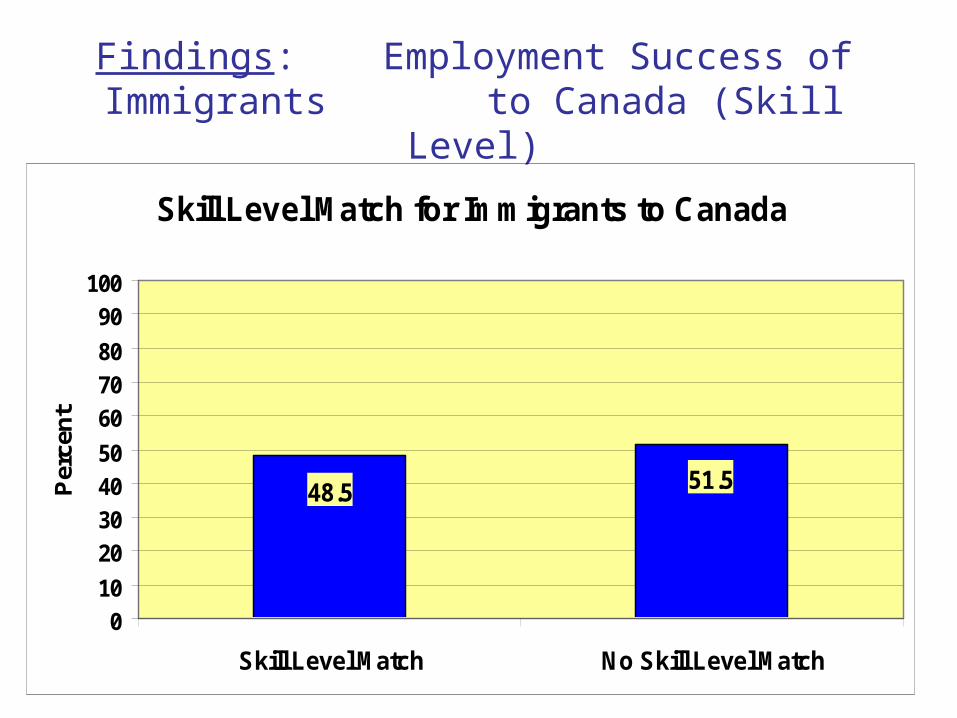
Findings: Employment Success of Immigrants to Canada (Skill Level)
Skill Level Match for Immigrants to Canada
51.548.5
0
10
20
30
40
50
60
70
80
90
100
Skill Level Match No Skill Level Match
Per
cen
t
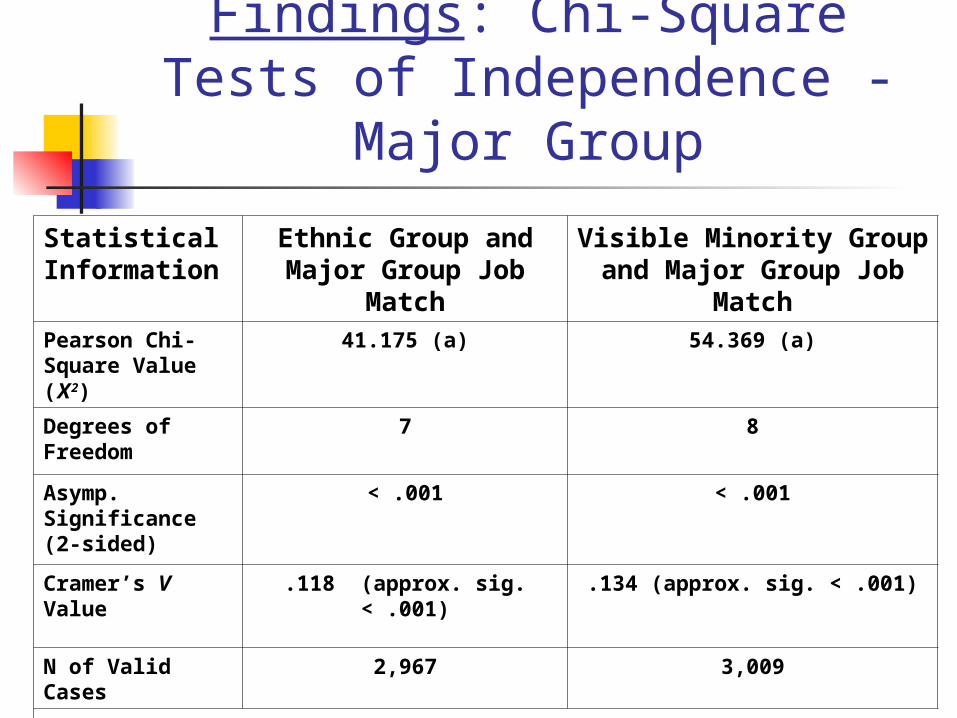
Findings: Chi-Square Tests of Independence - Major Group
Statistical Information
Ethnic Group and Major Group Job Match
Visible Minority Group and Major Group Job Match
Pearson Chi-Square Value (Χ2)
41.175 (a) 54.369 (a)
Degrees of Freedom
7 8
Asymp. Significance (2-sided)
< .001 < .001
Cramer’s V Value .118 (approx. sig. < .001) .134 (approx. sig. < .001)
N of Valid Cases 2,967 3,009
a = 0 cells have expected count less than 5.
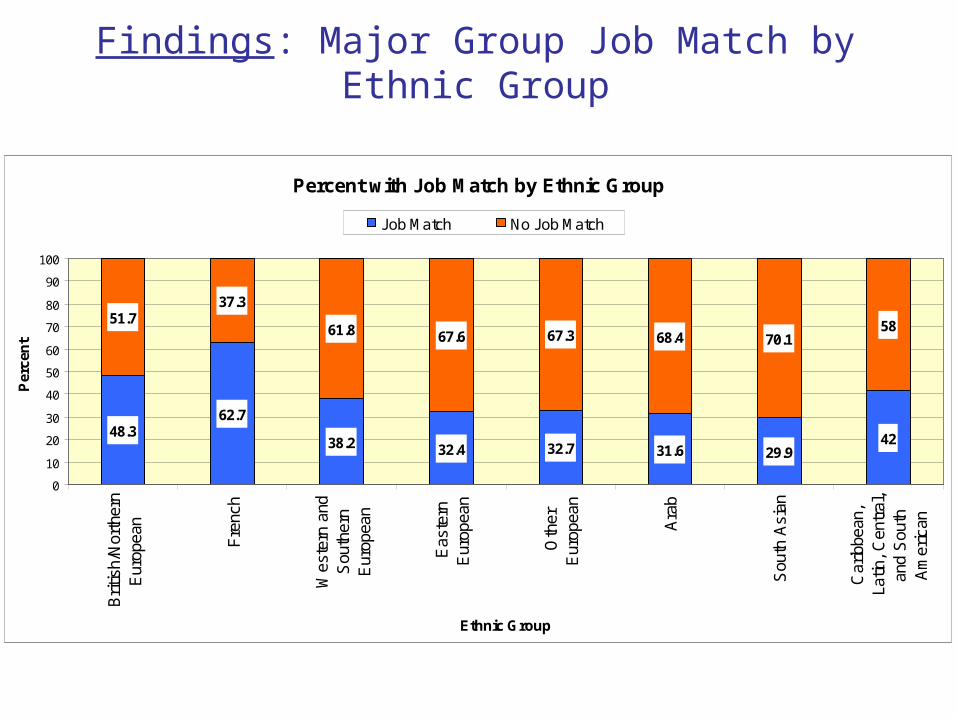
Findings: Major Group Job Match by Ethnic Group
Percent with Job Match by Ethnic Group
48.362.7
38.2 32.4 32.7 31.6 29.942
51.737.3
61.8 67.6 67.3 68.4 70.158
0
10
20
30
40
50
60
70
80
90
100
Bri
tish/
Nor
ther
nE
urop
ean
Fre
nch
Wes
tern
and
Sou
ther
nE
urop
ean
Eas
tern
Eur
opea
n
Oth
erE
urop
ean
Ara
b
Sou
th A
sian
Car
ibbe
an,
Latin
, C
entr
al,
and
Sou
thA
mer
ican
Ethnic Group
Per
cen
t
Job Match No Job Match
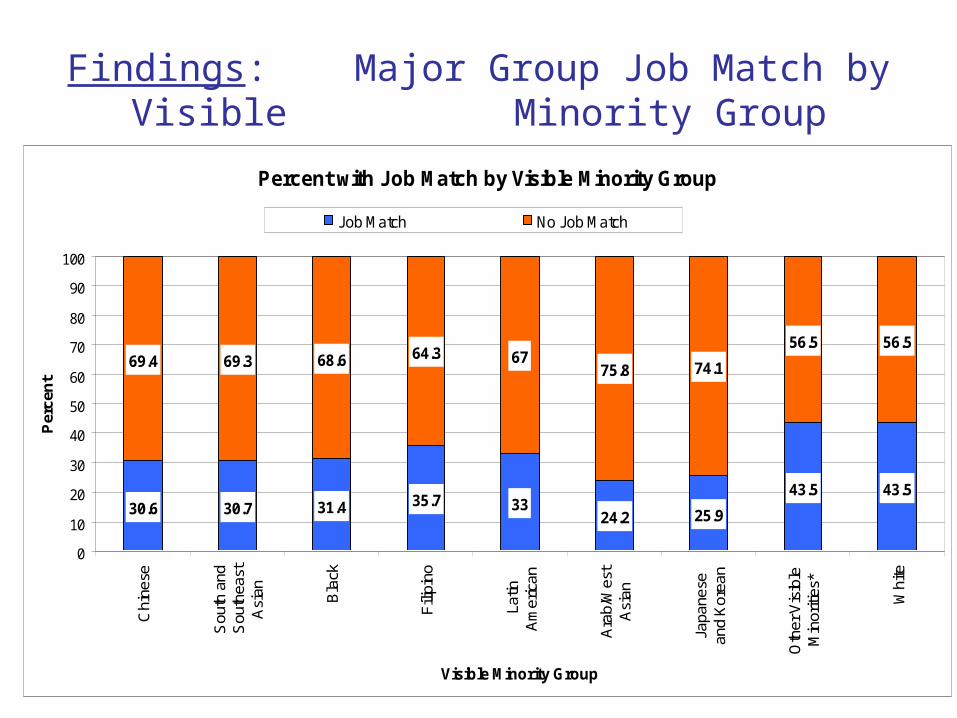
Findings: Major Group Job Match by Visible Minority Group
Percent with Job Match by Visible Minority Group
30.6 30.7 31.4 35.7 3324.2 25.9
43.5 43.5
69.4 69.3 68.6 64.3 6775.8 74.1
56.5 56.5
0
10
20
30
40
50
60
70
80
90
100
Chi
nese
Sou
th a
ndS
outh
east
Asi
an Bla
ck
Fili
pino
Latin
Am
eric
an
Ara
b/W
est
Asi
an
Japa
nese
and
Kor
ean
Oth
er V
isib
leM
inor
ities
*
Whi
te
Visible Minority Group
Per
cen
t
Job Match No Job Match
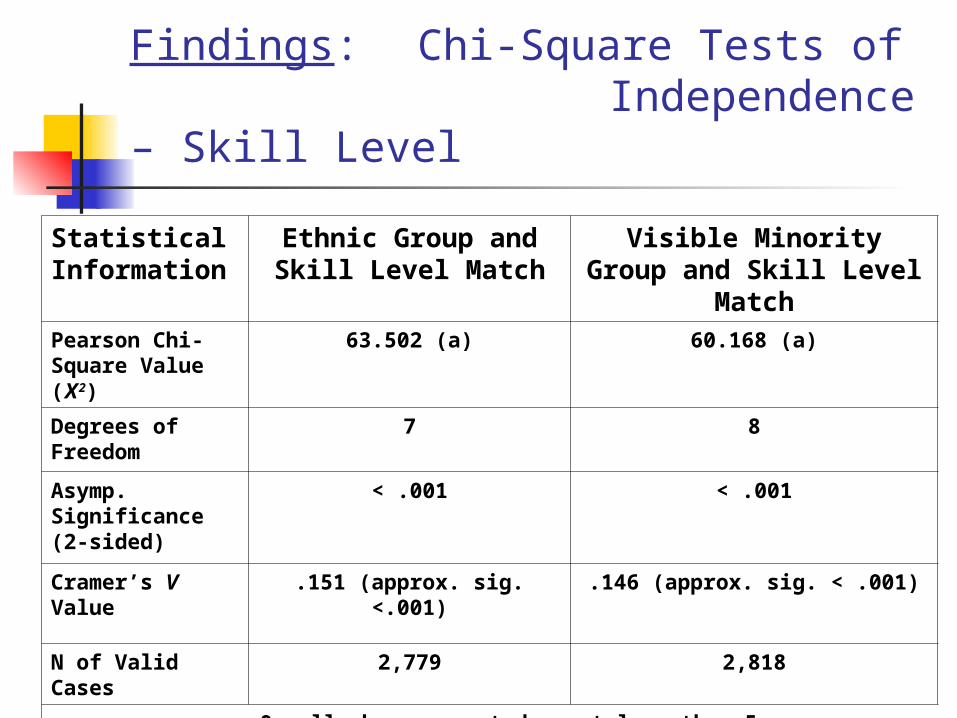
Findings: Chi-Square Tests of Independence –
Skill Level
Statistical Information
Ethnic Group and Skill Level Match
Visible Minority Group and Skill Level Match
Pearson Chi-Square Value (Χ2)
63.502 (a) 60.168 (a)
Degrees of Freedom
7 8
Asymp. Significance (2-sided)
< .001 < .001
Cramer’s V Value .151 (approx. sig. <.001) .146 (approx. sig. < .001)
N of Valid Cases 2,779 2,818
a = 0 cells have expected count less than 5.
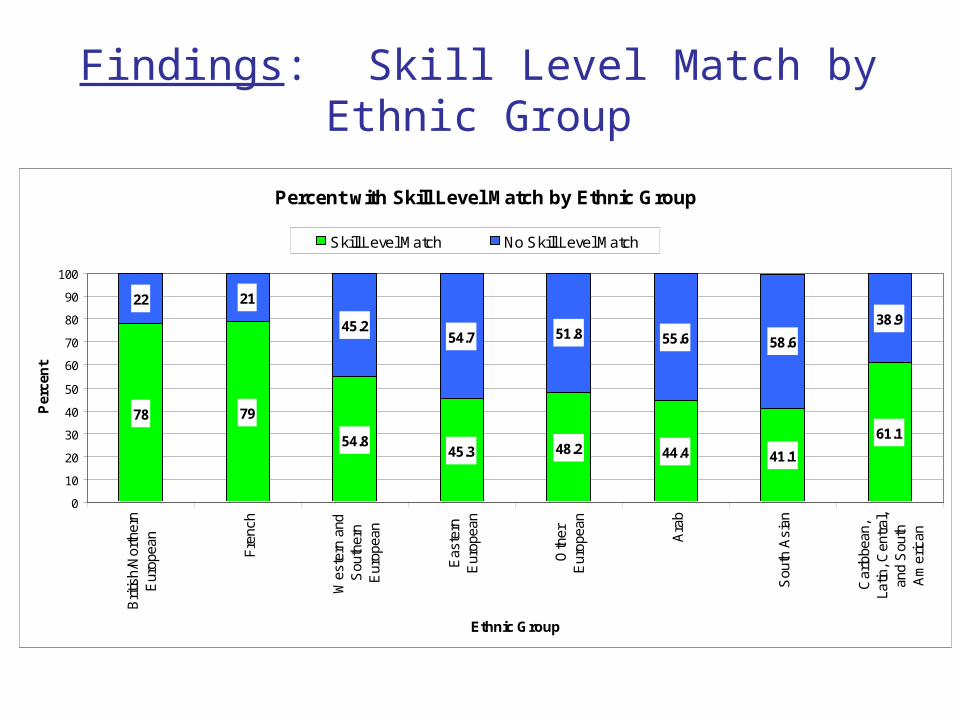
Findings: Skill Level Match by Ethnic Group
Percent with Skill Level Match by Ethnic Group
78 79
54.845.3 48.2 44.4 41.1
61.1
22 21
45.254.7 51.8 55.6 58.6
38.9
0
10
20
30
40
50
60
70
80
90
100
Brit
ish/
Nor
ther
nE
urop
ean
Fre
nch
Wes
tern
and
Sou
ther
nE
urop
ean
Eas
tern
Eur
opea
n
Oth
erE
urop
ean
Ara
b
Sou
th A
sian
Car
ibbe
an,
Latin
, Cen
tral
,an
d S
outh
Am
eric
an
Ethnic Group
Per
cen
t
Skill Level Match No Skill Level Match
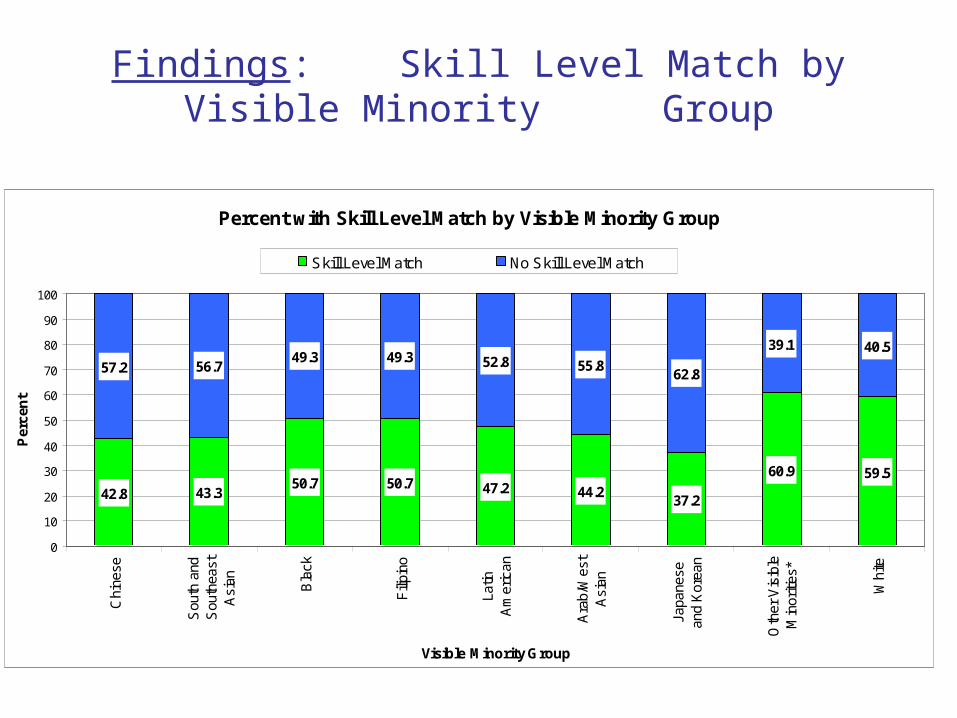
Findings: Skill Level Match by Visible Minority Group
Percent with Skill Level Match by Visible Minority Group
42.8 43.350.7 50.7 47.2 44.2
37.2
60.9 59.5
57.2 56.749.3 49.3 52.8 55.8
62.8
39.1 40.5
0
10
20
30
40
50
60
70
80
90
100
Chi
nese
Sou
th a
ndS
outh
east
Asi
an Bla
ck
Fili
pino
Latin
Am
eric
an
Ara
b/W
est
Asi
an
Japa
nese
and
Kor
ean
Oth
er V
isib
leM
inor
ities
*
Whi
te
Visible Minority Group
Per
cen
t
Skill Level Match No Skill Level Match
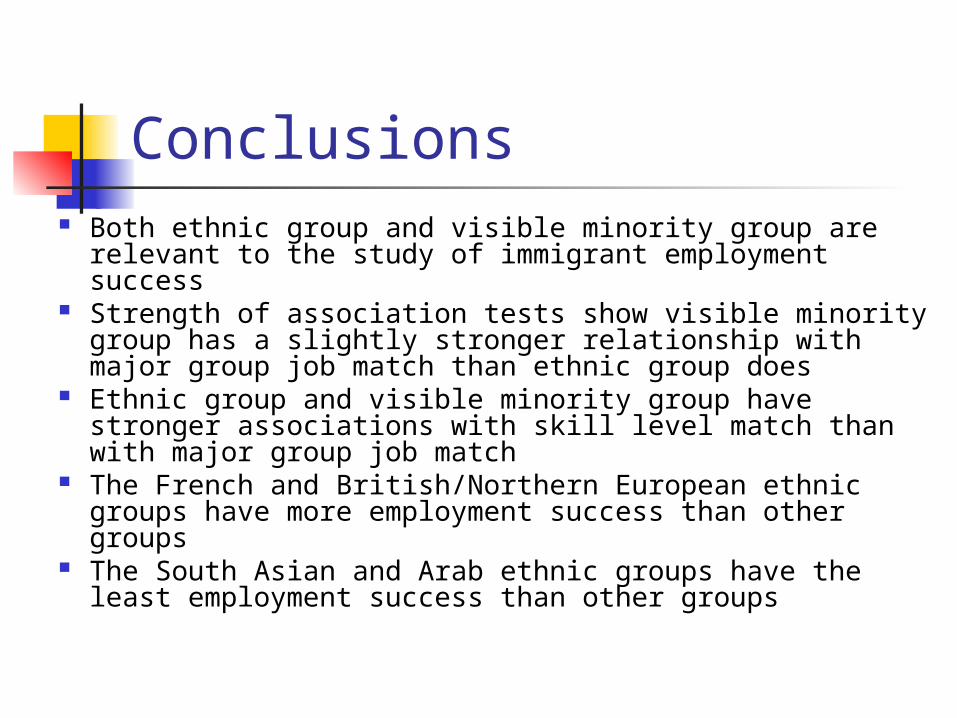
Conclusions Both ethnic group and visible minority group are
relevant to the study of immigrant employment success
Strength of association tests show visible minority group has a slightly stronger relationship with major group job match than ethnic group does
Ethnic group and visible minority group have stronger associations with skill level match than with major group job match
The French and British/Northern European ethnic groups have more employment success than other groups
The South Asian and Arab ethnic groups have the least employment success than other groups
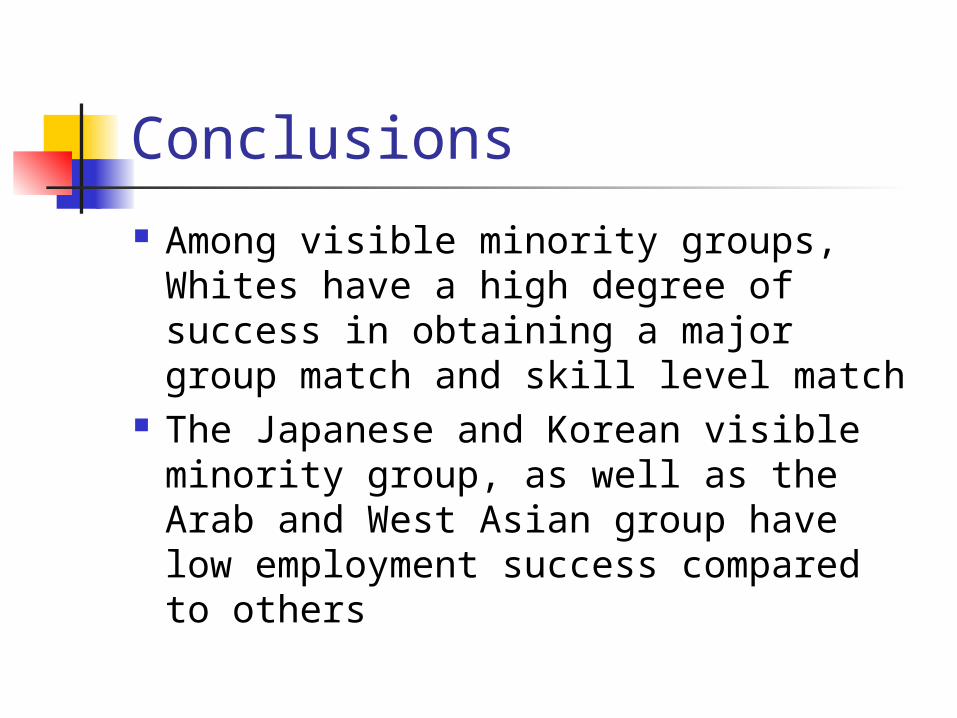
Conclusions
Among visible minority groups, Whites have a high degree of success in obtaining a major group match and skill level match
The Japanese and Korean visible minority group, as well as the Arab and West Asian group have low employment success compared to others
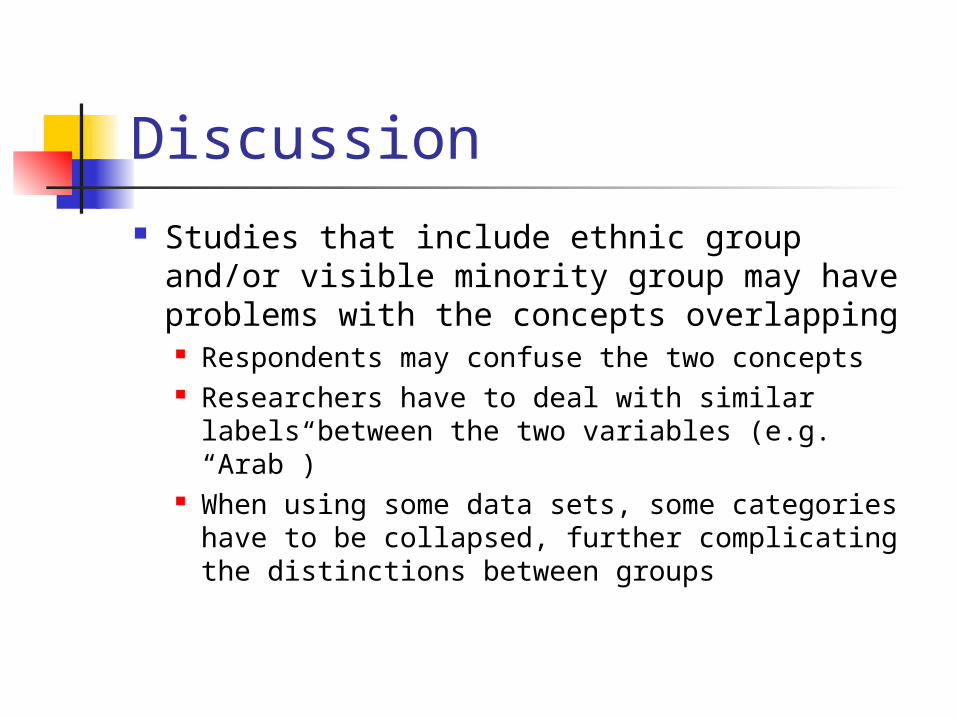
Discussion Studies that include ethnic group and/or
visible minority group may have problems with the concepts overlapping Respondents may confuse the two concepts Researchers have to deal with similar labels
between the two variables (e.g. “Arab”) When using some data sets, some
categories have to be collapsed, further complicating the distinctions between groups
Discussion
Policy Implications of focusing on Ethnic Group vs. Visible Minority Group Different policy concerns and
recommendations based on which concept is studied

Thank You! Merci!