Why Competitive Energy Markets Work – Lessons Learned in Competitive Energy Markets Throughout the...
23
Why Competitive Energy Markets Work – Lessons Learned in Competitive Energy Markets Throughout the U.S. Craig G. Goodman President National Energy Marketers Association 202-333-3288 [email protected] www.energymarketers.com Ohio Energy Management & Restructuring Conference February 27, 2008
-
Upload
wendy-price -
Category
Documents
-
view
217 -
download
1
Transcript of Why Competitive Energy Markets Work – Lessons Learned in Competitive Energy Markets Throughout the...

Why Competitive Energy Markets Work – Lessons Learned in Competitive
Energy Markets Throughout the U.S.
Craig G. GoodmanPresidentNational Energy Marketers Association202-333-3288
www.energymarketers.com
Ohio Energy Management& Restructuring Conference
February 27, 2008


National Energy Marketers Association
Overview – Who Is NEM?National Energy Marketers Association
Overview – Who Is NEM?
Non-profit trade association representing wholesale and retail marketers of natural gas, electricity, as well as energy and financial related products, services, information and advanced technologies throughout the United States, Canada and the European Union.
Independent power producers, suppliers of distributed generation ABCs-Aggregators, Energy brokers, Consultants--power traders, electronic trading exchanges and price reporting services
Advanced metering, demand side management and load management firms Billing, back office, customer service and related information technology providers

National Energy Marketers Association
Overview – Who Is NEM?National Energy Marketers Association
Overview – Who Is NEM?
Energy consumers
Inventors, patent holders, systems integrators, and developers of solar thin film building integrated photovoltaic, fuel cells, and advanced BPL, PLC technologies as well as Smart Electricity.TM
Committed to helping implement a consumer-focused, value-driven transition to a reliable, price and technology competitive market for energy and telecom related products, services, information and technologies.
Potential Benefits of Competition
Potential Benefits of Competition
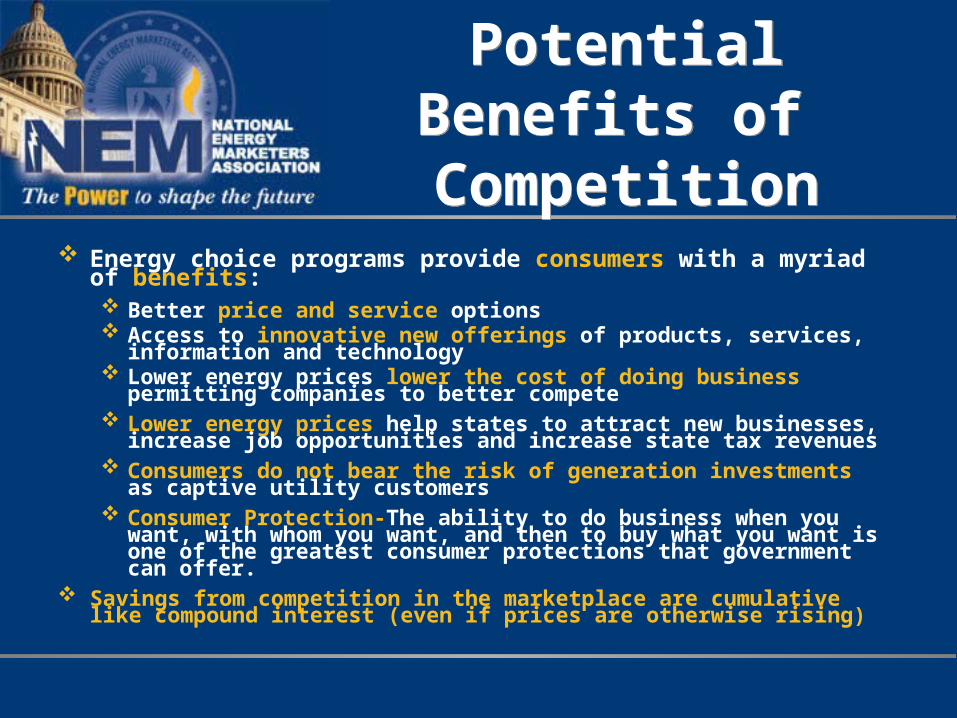
Energy choice programs provide consumers with a myriad of benefits: Better price and service options Access to innovative new offerings of products, services, information and
technology Lower energy prices lower the cost of doing business permitting
companies to better compete Lower energy prices help states to attract new businesses, increase job
opportunities and increase state tax revenues Consumers do not bear the risk of generation investments as captive
utility customers Consumer Protection-The ability to do business when you want, with
whom you want, and then to buy what you want is one of the greatest consumer protections that government can offer.
Savings from competition in the marketplace are cumulative like compound interest (even if prices are otherwise rising)

Documented Benefits of Competition
Documented Benefits of Competition
Texas ----“the competitive market has provided customers with prices that were significantly below the estimated rates that would have been in effect in a regulated environment. Even customers who did not switch to a competitive rate have benefited from the introduction of retail competition. During each of the years 2002 through 2005, the PTB [Price to Beat] was lower than the estimated regulated rates in both service areas.”*
New York---“The total real (i.e., inflation-adjusted) electric price for a typical residential retail customer in New York, including supply and delivery charges, has dropped by an average of approximately 16% between 1996 and 2004.”**
*Commission’s Legislative Report on Electricity Pricing in Competitive Retail Markets in Texas, Project 32198
**Staff Report on the State of Competitive Energy Markets: Progress To Date and Future Opportunities, March 2, 2006.

Documented Benefits of Competition
Documented Benefits of Competition
EIA Study – In the surveyed states of Ohio, Maryland, New York and Pennsylvania, “customers purchasing natural gas from marketers paid less than LDC customers in most months during 2002 to 2005.”*
CERA Study---“[t]he majority of U.S. consumers have paid less for electricity since the onset of power system deregulation in 1997, achieving total savings of about $34 billion compared with the costs if traditional regulation had continued.”**
Joskow Study------for the period of 1996 to 2004, "real residential prices fell more in states that implemented retail competition programs than in those that did not.“***
*EIA, Natural Gas Marketer Prices and Sales to Residential and Commercial Customers: 2002-2005 (June 2007).
**CERA, Press Release, “Power Deregulation Saved $34 Billion, Benefited Majority U.S. Consumers Over Past 7 Years: CERA Study,” October 19, 2005
***Markets for Power in the United States: An Interim Assessment, The Energy Journal, 2006.

Fuel Input Prices RisingFuel Input Prices Rising
Coal Petroleum Natural Gas($/ton) ($/barrel) (cents/106 Btu)
1995 27.01 16.10 1981996 26.45 18.98 2641997 26.16 17.18 2761998 25.64 12.71 2381999 24.72 14.81 2572000 24.28 26.30 4302001 24.68 23.20 4492002 25.52 20.77 3562003 26.00 26.78 5392004 27.42 26.56 5962005 31.20 39.65 8212006 34.09 37.66 694
Source: EIA, Electric Power Annual 2006, Table 4.5, Receipts, Average Cost and Quality of Fossil Fuels for the Electric Power Industry, 1995 through 2006

Total Electric Full Service Energy Only Delivery OnlyIndustry Providers Providers Service
1995 8.40 8.40 1996 8.36 8.36 8.36 1997 8.43 8.43 8.43 1998 8.26 8.26 8.26 1999 8.16 8.16 8.16 2000 8.24 8.21 12.07 2001 8.58 8.55 5.34 6.74 2002 8.44 8.40 5.43 6.57 2003 8.72 8.68 5.43 6.11 2004 8.95 8.91 5.50 6.00 2005 9.45 9.40 6.54 5.72 2006 10.40 10.36 8.23 6.19
Total Electric Full Service Energy Only Delivery OnlyIndustry Providers Providers Service
1995 7.69 7.691996 7.64 7.64 7.641997 7.59 7.59 7.591998 7.41 7.41 7.411999 7.26 7.26 7.262000 7.43 7.36 8.652001 7.92 7.84 6.22 3.44 2002 7.89 7.77 5.86 3.75 2003 8.03 7.89 6.02 3.80 2004 8.17 8.02 6.02 3.59 2005 8.67 8.46 7.15 3.45 2006 9.46 9.18 8.36 3.63
Total Electric Full Service Energy OnlyDelivery OnlyIndustry Providers Providers Service
1995 4.66 4.66 1996 4.60 4.60 4.60 1997 4.53 4.53 4.53 1998 4.48 4.48 4.48 1999 4.43 4.43 4.43 2000 4.64 4.57 6.24 2001 5.05 5.01 4.69 1.38 2002 4.88 4.78 4.53 2.08 2003 5.11 5.01 4.47 1.80 2004 5.25 5.14 4.60 1.90 2005 5.73 5.61 5.31 1.77 2006 6.16 6.00 6.25 1.96
Average Retail Pricesof Electricity to Consumers – Residential, Commercial
and Industrial
Source: EIA, Electric Power Annual 2006, Table 7.4

Choice Matters, Politically and Economically
Choice Matters, Globally and Locally
Depression Era Utility Regulations- the current utility
regulatory model was designed during the great depression. Is One Choice all We Need? (Are two choices bad and ten choices terrible?)
The Utility’s Obligation to Serve the Public Interest changed between early 20th century and early 21st century- (new competitive services, information and technology markets, global competition for jobs and economic growth and better standards of living)
How can we best serve the Public Interest in a Digital Global Economy

Choice Matters, Politically and Economically
Choice Matters, Globally and Locally
Since the end of the Cold War, countries around the globe have increasingly followed the lead of the United States in adopting market-based solutions to laws, regulations and public policies.
Western-style economies in the EU, Scandinavia, and Australia, have restructured their energy sectors to better allocate resources and encourage economic growth.
Even historical command and control economies of the former Soviet Union and the Asia Pacific are also relying more heavily on market-based solutions.
Choice Matters, Politically and Economically
Choice Matters, Globally and Locally
Choice Matters, Politically and Economically
Choice Matters, Globally and Locally
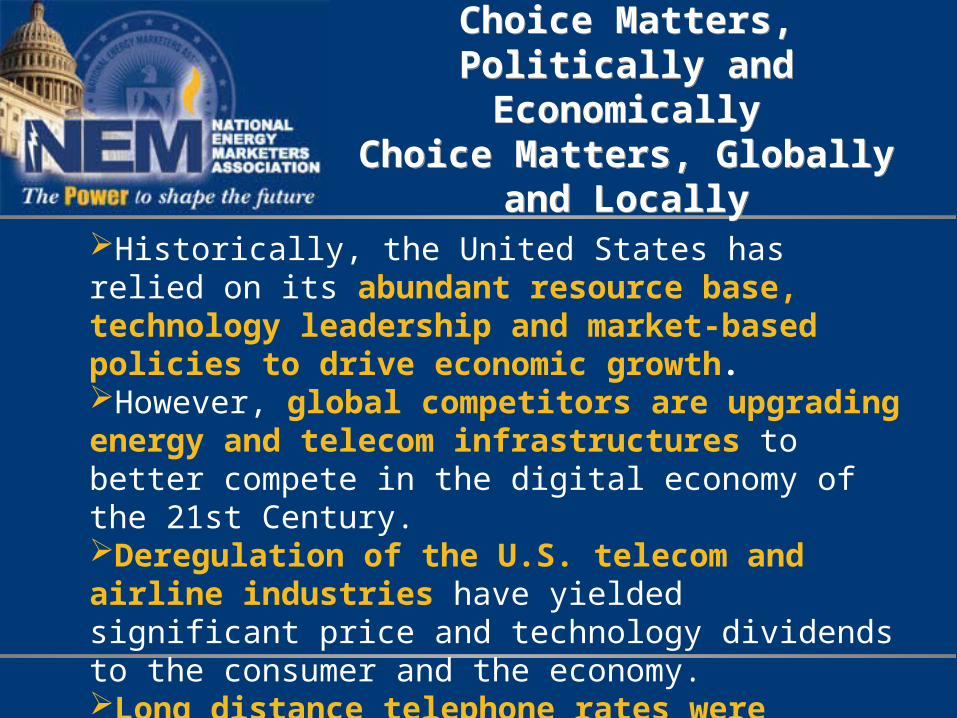
Historically, the United States has relied on its abundant resource base, technology leadership and market-based policies to drive economic growth. However, global competitors are upgrading energy and telecom infrastructures to better compete in the digital economy of the 21st Century. Deregulation of the U.S. telecom and airline industries have yielded significant price and technology dividends to the consumer and the economy. Long distance telephone rates were $4.50/minute at the dawn of telecom deregulation.

Restructuring Dividends
Restructuring Dividends
Restructuring Dividend Reinvestment Incentives- (Resources reallocated from competitive markets to reliability investments rewarded with higher rates of return )
Reliability is increased- utility retains core competency (more reliable delivery) –More Reliable Supplies market supplies competitive services (Contracts stronger than Compacts Legal and regulatory risks reduced)
Technology is the EnablerTechnology is the Enabler
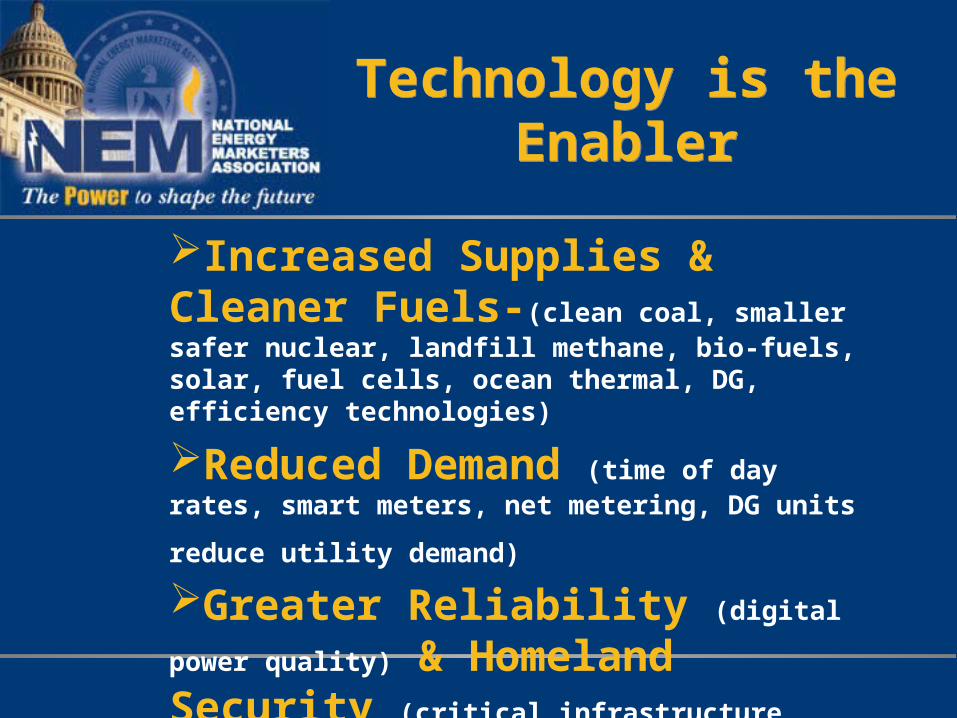
Increased Supplies & Cleaner Fuels-(clean coal, smaller safer nuclear, landfill methane, bio-fuels, solar, fuel cells, ocean thermal, DG, efficiency technologies)
Reduced Demand (time of day rates, smart
meters, net metering, DG units reduce utility demand) Greater Reliability (digital power quality) & Homeland Security (critical infrastructure protection)
Economic Growth & Job Creation

Technology is the EnablerTechnology is the Enabler
Enhanced & Advanced Metering – consumer monitoring and control of energy usage-remotely aggregated and dispatchableSolar Energy - innovative power generation technology, enables the external surfaces of a building, such as windows and other building materials, to function as solar energy systems. Hydrogen Fuel Cells – clean, no emissions powerBroadband over Power Lines (BPL) – generation and transmission of electricity commingled with information/content (inductively coupled) over electrical power
Wholesale Electric Competition
Wholesale Electric Competition
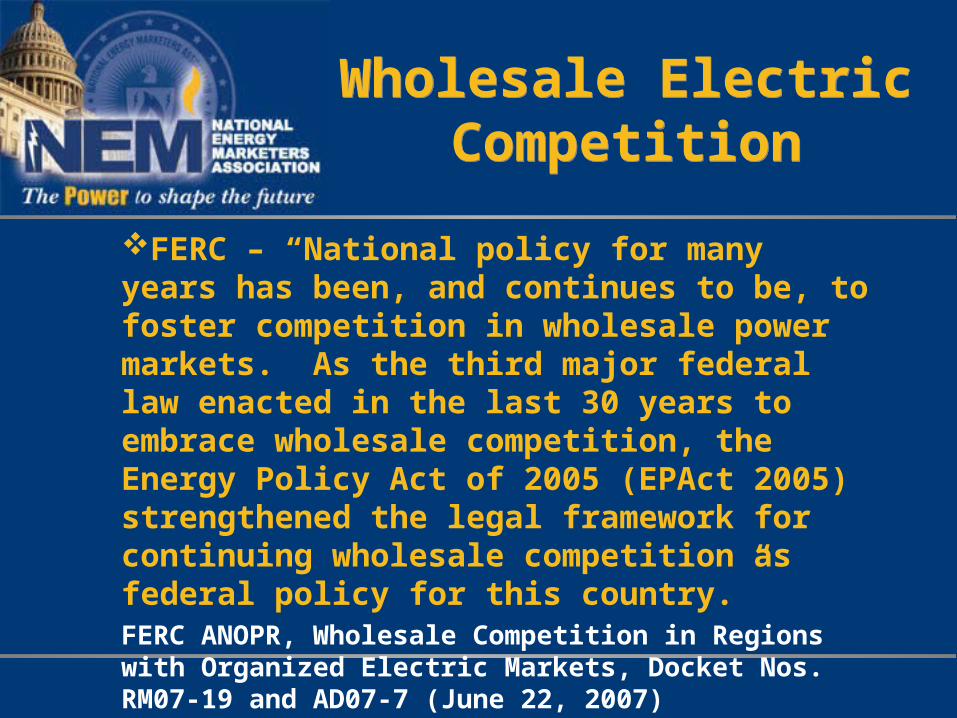
FERC – “National policy for many years has been, and continues to be, to foster competition in wholesale power markets. As the third major federal law enacted in the last 30 years to embrace wholesale competition, the Energy Policy Act of 2005 (EPAct 2005) strengthened the legal framework for continuing wholesale competition as federal policy for this country.”FERC ANOPR, Wholesale Competition in Regions with Organized Electric Markets, Docket Nos. RM07-19 and AD07-7 (June 22, 2007)

Successful Retail Energy Markets
Successful Retail Energy Markets
Texas – utility default pricing mechanism floats with commodity priceTexas electric migration rates*:
Residential – 33.9%C&I (secondary voltage level) – 39.4%C&I (primary and transmission voltage level – 61%
Georgia – Atlanta Gas Light full exit from merchant function (separate services for low income and credit challenged customers)
*Public Utility Commission of Texas, Report to the 80th Texas Legislature, Scope of Competition in
Electric Markets in Texas, January 2007
Successful Retail Energy Markets
Successful Retail Energy Markets
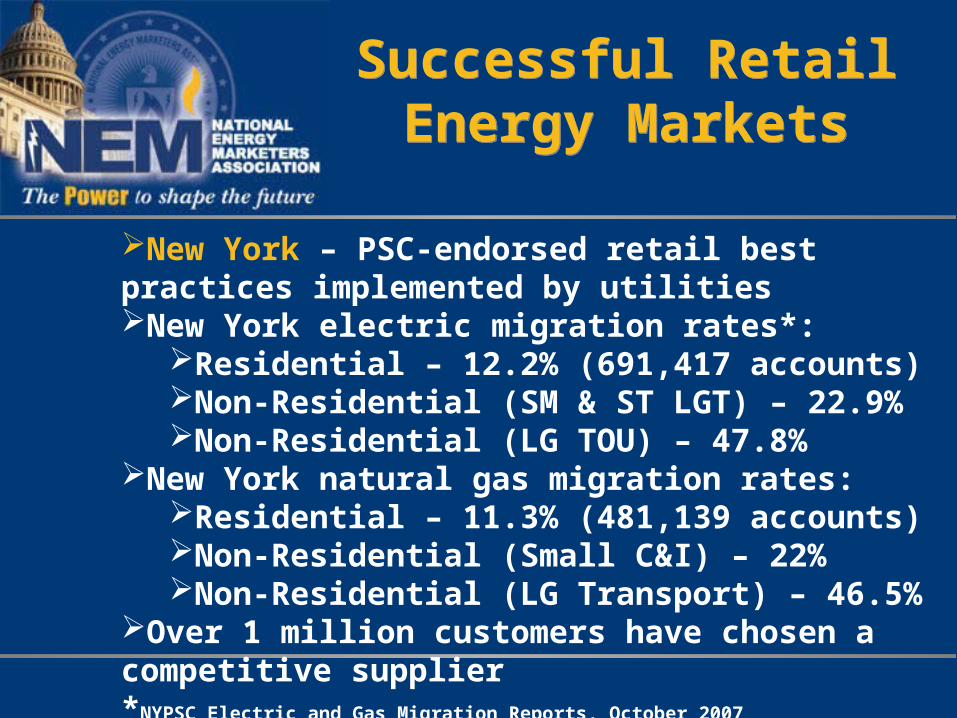
New York – PSC-endorsed retail best practices implemented by utilitiesNew York electric migration rates*:
Residential – 12.2% (691,417 accounts)Non-Residential (SM & ST LGT) – 22.9%Non-Residential (LG TOU) – 47.8%
New York natural gas migration rates:Residential – 11.3% (481,139 accounts)Non-Residential (Small C&I) – 22%Non-Residential (LG Transport) – 46.5%
Over 1 million customers have chosen a competitive supplier*NYPSC Electric and Gas Migration Reports, October 2007
Successful Retail Energy Markets
Successful Retail Energy Markets
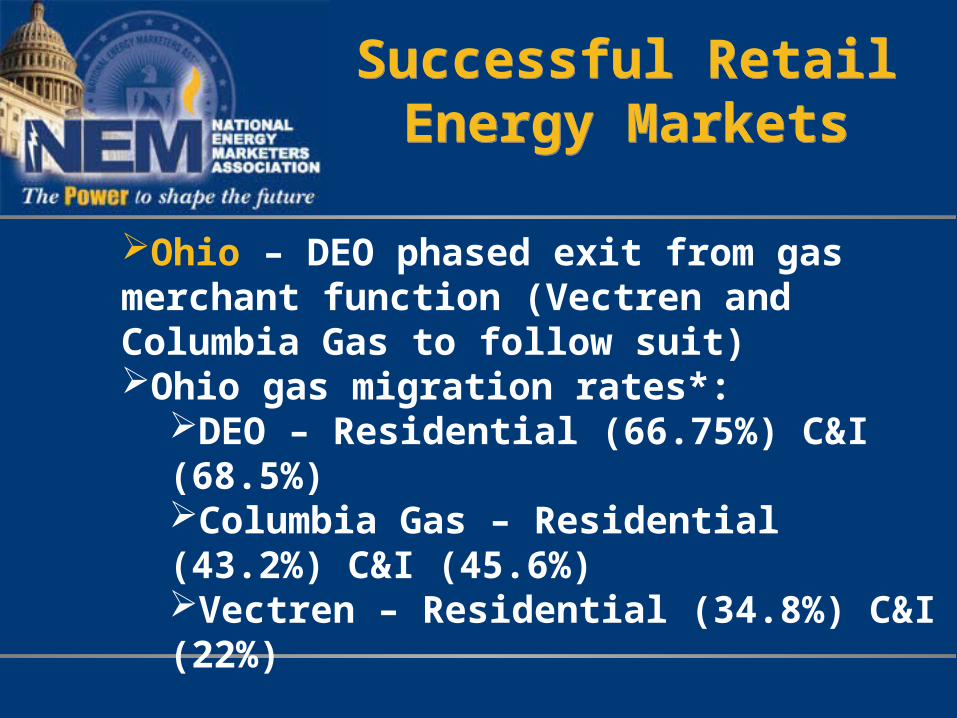
Ohio – DEO phased exit from gas merchant function (Vectren and Columbia Gas to follow suit)Ohio gas migration rates*:
DEO – Residential (66.75%) C&I (68.5%)Columbia Gas – Residential (43.2%) C&I (45.6%)Vectren – Residential (34.8%) C&I (22%)
*PUCO, Natural Gas Customer Choice Program, Customer Enrollment Levels, September 2007

Successful Retail Energy Markets
Successful Retail Energy Markets
Ohio electric customers (residential, commercial and industrial) can and should receive the same benefits of competition, already being realized by natural gas consumers in the StateOhio market region is competitive – 300 market participants clear more than $2.4 billion in energy transactions each month

Market-Based PricingMarket-Based Pricing
Extended rate caps distort commodity prices – create boom/bust cycles, cannot sustain retail market development
ElectricResidential and small commercial – monthly-adjusted, market-based pricingLarge commercial and industrial – hourly pricing
Gas – monthly adjusted, market-based pricing

Low Cost/High YieldOptions
Low Cost/High YieldOptions
Avoid Duplication of Utility Charges: Transparent Utility Bills-unbundled rates allow competition/all generation costs fully bypassable Full and Fair Disclosure of Costs and Risks Proper Consumer Shopping Credits-full embedded costs not marginal costs Purchase of receivables, esp. in conjunction with Marketer Referral Programs (NY – all utilities; NJ – PSEG, South Jersey Gas, New Jersey Natural Gas; Ohio – DEO, Columbia; PA – PECO, Columbia; MI – MichCon and Consumers; IN – NIPSCO, IL-electric legislation)

Low Cost/High YieldOptions
Low Cost/High YieldOptions
Migration Incentives –Higher returns tied to migration
Consumer Education
Data exchange standardization
Fair allocation of utility resources – (Assets follow the
customer)
Customer choice of bill provider
Customer lists and usage data