Why Coal Plants Retire: Power Market Fundamentals … Group, Inc. Page | 2 Why Coal Plants Retire:...
13
Why Coal Plants Retire: Power Market Fundamentals as of 2012 Susan F. Tierney, Ph.D. Analysis Group, Inc. February 16, 2012* ∗ Correction: pp. 8‐9 February 24, 2012
Transcript of Why Coal Plants Retire: Power Market Fundamentals … Group, Inc. Page | 2 Why Coal Plants Retire:...

Why Coal Plants Retire: Power Market Fundamentals as of 2012
Susan F. Tierney, Ph.D. Analysis Group, Inc. February 16, 2012*
∗ Correction: pp. 8‐9 February 24, 2012

Analysis Group, Inc. Page | 2
Why Coal Plants Retire: Power Market Fundamentals as of 2012
Power companies in the U.S. have announced a growing number of retirements of coal‐fired power plants over the past 12‐14 months. While not unexpected, recent announcements have sparked debate over the causes of these business decisions, with some pointing to regulations issued by the U.S. Environmental Protection Agency (“EPA”) as the primary reason. Putting aside the political context of the current debate, a closer examination of the facts reveals that the recent retirement announcements are part of a longer‐term trend that has been affecting both existing coal plants and many proposals to build new ones. The sharp decline in natural gas prices, the rising cost of coal, and reduced demand for electricity are all contributing factors in the decisions to retire some of the country’s oldest coal‐fired generating units. These trends started well before EPA issued its new air pollution rules.
In general, the owner of a coal‐fired power plant (or of any generating facility, for that matter) may decide to retire the plant when the revenues produced by selling power and capacity are no longer covering the cost of its operations. While sometimes these decisions are complex, they essentially can resemble the basic choices that households face, for example, when they have to decide whether making one more repair on an old car is worth it: often, making the repair is more expensive and risky than the decision to trade in that car and buy a new one with better mileage and other features that the old car lacks.
These plant‐retirement decisions thus turn on these economic fundamentals: can the plant produce power at electricity prices that allow the owner to cover its operating and investment costs, including the ability to earn a reasonable return from the production and sale of electricity? It is these other considerations, beyond EPA’s clean air rules, that have been influencing recent coal plant retirement decisions.
Electricity Market Dynamics
In today’s power industry, the profitability of many coal plants depends substantially on the difference in price between coal and natural gas. In competitive power markets like those in the Midwest, MidAtlantic and Northeast states, and even in more traditional power regions such as the Southeast, falling natural gas prices lead to lower

Analysis Group, Inc. Page | 3
revenues for coal plants by causing wholesale electricity prices to decline. Rising coal prices can further narrow the margins of coal plant operators. In the past year, coal plants have been facing a perfect storm of falling natural gas prices, a continued trend of high coal prices, and weak demand for electricity.
Natural gas prices have fallen to record lows, reducing the wholesale price of electricity in most of the country’s power markets. Natural gas prices fell from $4.37/mmBtu in 2010 to $3.98/mmBtu in 2011, the lowest annual average price for natural gas since 2002.1 Today, the spot market is trading at about $2.50/mmBtu. The result has been a significant drop in wholesale power prices. Wholesale electricity prices have dropped more than 50 percent on average since 2008, and about 10 percent during the fourth quarter of 2011.2 The record low natural gas prices are attributed to strong domestic production, robust storage levels, and new pipeline projects that have allowed additional supplies to get natural gas to markets.3
At the same time, coal prices have remained relatively high: According to the U.S. Energy Information Administration (“EIA”), “Delivered coal prices to the electric power sector have increased steadily over the last 10 years and this trend continued in 2011, with an average delivered coal price of $2.40 per MMBtu (5.8 percent increase from 2010).”4 Coal futures prices have been rising too (as shown at right).
Coal prices have pushed upward in part because exports have offset a drop in domestic coal consumption. The Appalachian region, in particular, saw a large increase in
1 These prices reflect Henry Hub commodity prices. Energy Information Administration (“EIA”), “2011 Brief: Energy commodity price trends varied widely during 2011,” Today in Energy, January 9, 2012.
2 “Electricity Declines 50% as Shale Spurs Natural Gas Glut: Energy,” Bloomberg, January 17, 2012.
3 Federal Energy Regulatory Commission (“FERC”), “Winter 2011‐12 Energy Market Assessment,” October 20, 2011. 4 EIA, Short‐Term Energy Outlook, February 7, 2012: “U.S. Coal Prices.”
Source: EIA, Energy in Brief, http://www.eia.gov/energy_in_brief/briefs_2011.cfm

Analysis Group, Inc. Page | 4
exports last year driven by demand for metallurgical coal used in steelmaking. U.S coal exports increased 31 percent in 2011 (see chart below), the highest level since 1991.5 The surge in exports was driven in part by reduced production in other parts of the world. Flooding last year disrupted coal mining in Australia, the worldʹs largest coal exporter, contributing to increased U.S. coal trade with India, Japan, and South Korea. Coal exports are expected to remain strong in response to global energy demand. Arch Coal, for example, made several investments in 2011 to bolster its U.S. export capabilities.6
The tighter price differentials between natural gas and coal in recent years have squeezed the financial performance of many coal plants, especially the older and less efficient ones. To illustrate, the power supply curve in the figure below indicates that in the PJM region (shown here as the RFC (“ReliabilityFirst”) region), coal‐fired power plants dispatched at higher prices in 2010 compared to 2007, with the reverse true for natural gas‐fired power plants. In this regional power market, the revenues for plants reflect the selling price of the last plant dispatched to meet loads. So, for example, a coal plant dispatched at a 125,000‐MW level of demand sold power at $24/MWh in 2007. At a higher demand level (e.g., 150,000) that same year, the clearing price would be $56/MWh, set by the dispatch of a natural gas plant. In that high‐demand hour, the referenced coal plant would receive revenues of $32/MWh (reflecting the $56/MWh clearing price less the coal plant’s own production cost (including fuel) of $24/MWh). By contrast, in 2010, the coal plant dispatching at 125,000 MW demand level sold power for $32/MWh, while the gas plant dispatched at a 150,000 MW load level was selling at $40/MWh. In 2010, therefore, the
5 EIA, “U.S. coal production rises slightly in 2011 amid lower domestic demand and higher exports,” Today in Energy, February 13, 2012. 6 Arch Coal, Inc., “Arch Coal, Inc. Reports Fourth Quarter and Full Year 2011 Results,” News release, February 10, 2012.

Analysis Group, Inc. Page | 5
referenced coal plant would receive net revenues of $8/MWh in that high‐demand hour.
Across the course of a year (e.g., in 2010 and in 2011), these much tighter gas‐coal price differentials put significant price pressure on the least efficient coal plants. Net revenues were down in the hours they operated. And in many cases, system operators were dispatching more gas‐fired power plants ahead of these less‐efficient coal plants.
Power Supply Curves: 2007 versus 2010, RFC Region (PJM)
Harvard Energy Policy Series – Future of Electric Generation
11-28-2011Page 1
2007
2010
At electricity demand levels, the average wholesale clearing prices were: @MW: 50,000 75,000 100,000 125,000 150,000 175,000 200,000$/MWh: $15 $19 $21 $24 $56 $75 $100
@MW: 50,000 75,000 100,000 125,000 150,000 175,000 200,000$/MWh: $20 $24 $27 $32 $40 $54 $78
Coal plants
Natural gas plants
Nuclear plants
Oil plants
Higher costs for coal plants in 2010
Lower costs for gas plants in 2010 Net effect:
Lower wholesale electricity
prices and less revenues to coal plants
Data from SNL Financial for 2007 and 2010 for the Reliability First Corporation region.

Analysis Group, Inc. Page | 6
The map below shows that with the exception of the ERCOT Texas market, average wholesale electricity prices were lower in 2011 versus 2010.
Source: EIA, 2011 Brief, “Wholesale electricity prices mostly lower in 2011.” January 11, 2012. http://www.eia.gov/todayinenergy/detail.cfm?id=4530
These changing natural gas and coal prices have contributed to coal‐fired electricity generation dropping by 13 percent from 2007 through 2011, while gas‐fired power production increased by 13 percent in the same period.7
Lower Demand for Electricity
On top of the economic pressures brought by lower natural gas prices, electricity demand has been muted due to the sluggish economy, increased competition from
7 EIA, Short‐Term Energy Outlook, February 2012, data for Figure 25 (U.S. electricity generation by fuel, all sectors). http://www.eia.gov/forecasts/steo/data.cfm?type=figures
Analysis Group, Inc. Page | 7
demand‐side resources, and the mild winter weather. For coal plant operators (of the least‐efficient plants, in particular), these factors are further aggravating their financial situation.
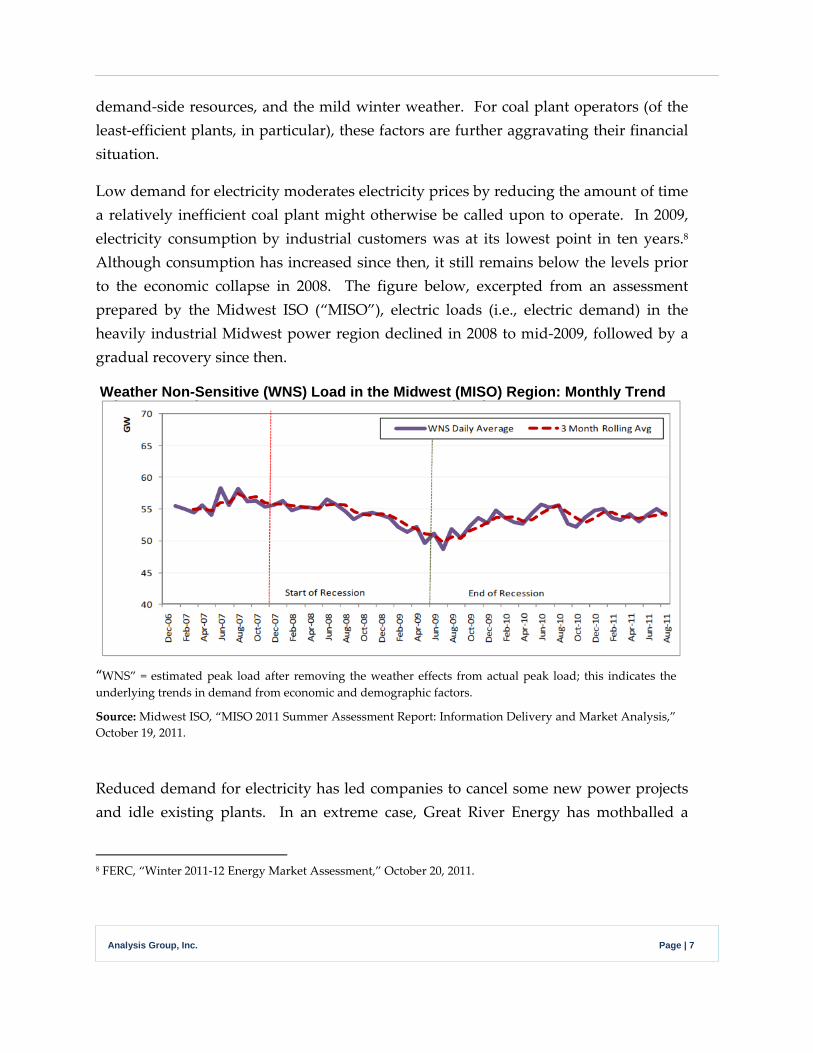
Low demand for electricity moderates electricity prices by reducing the amount of time a relatively inefficient coal plant might otherwise be called upon to operate. In 2009, electricity consumption by industrial customers was at its lowest point in ten years.8 Although consumption has increased since then, it still remains below the levels prior to the economic collapse in 2008. The figure below, excerpted from an assessment prepared by the Midwest ISO (“MISO”), electric loads (i.e., electric demand) in the heavily industrial Midwest power region declined in 2008 to mid‐2009, followed by a gradual recovery since then.
Weather Non-Sensitive (WNS) Load in the Midwest (MISO) Region: Monthly Trend
“WNS” = estimated peak load after removing the weather effects from actual peak load; this indicates the underlying trends in demand from economic and demographic factors.
Source: Midwest ISO, “MISO 2011 Summer Assessment Report: Information Delivery and Market Analysis,” October 19, 2011.
Reduced demand for electricity has led companies to cancel some new power projects and idle existing plants. In an extreme case, Great River Energy has mothballed a
8 FERC, “Winter 2011‐12 Energy Market Assessment,” October 20, 2011.

Analysis Group, Inc. Page | 8
recently constructed coal‐fired power plant in North Dakota. The plant was fully equipped with modern pollution control systems, but the owner has opted not to run the facility because of low demand for electricity and low power prices.9
Energy efficiency and other demand‐side resources have also played a role in moderating electricity prices. In PJM, the nation’s largest energy market, demand‐response and energy efficiency contribute a growing share of new capacity in the market’s forward capacity auction. Demand response, energy efficiency, and renewable resources made up about 10 percent of the resources clearing PJM’s 2014‐2015 capacity auction.10 These resources were offered into – and accepted by – the market at prices lower than other competing generating resources that did not clear in the auction. Such resources contribute to the economic pressure on existing generating resources.
Although recent summer periods have been hotter than usual (notably in Texas), the U.S. and Canada have experienced one of the warmest winters on record, reducing energy demand and exacerbating the financial conditions of many generators.11 The two‐month period from December to January was the fourth warmest on record.12 Minnesota experienced record warm temperatures for the period, with an average temperature 10.1 degrees F above average.13 A total of 22 states from Montana to Maine had December‐January temperatures ranking among their ten warmest.14 Higher [Lower][corrected 2‐24‐12] temperatures have contributed to lower natural gas demand, 9 “Brand new power plant is idled by the economy,” Minneapolis Star Tribune, January 9, 2012. Reportedly, a combination of factors made the power plant uneconomic; these included slower‐than‐expected growth in electricity demand, lower prices on power sales to the grid and the loss of a key industrial customer for some of the plantʹs steam. “We could run it, and lose money half the time,ʺ said Rick Lancaster, vice president for generation of the company that owns the plant.
10 PJM, “Demand Resources and Energy Efficiency Continue to Grow in PJM’s RPM Auction,” News release, May 13, 2011.
11 FERC, trends in cooling degrees days and heating degree days. See http://www.ferc.gov/market‐oversight/othr‐mkts/weather/othr‐wthr‐hdd.pdf, http://www.ferc.gov/market‐oversight/othr‐mkts/weather/ othr‐wthr‐cdd.pdf.
12 National Oceanic and Atmospheric Administration, “January 2012 the fourth warmest for the contiguous United States,” February 7, 2012.
13 Ibid.
14 Ibid.

Analysis Group, Inc. Page | 9
further dampening natural gas prices. Higher [Lower][corrected 2‐24‐12] temperatures have also reduced the demand for electricity. The charts below, published by EIA on February 15, 2012, illustrate the unusually low winter power prices experienced from November through the first week in February in the Northeast and Midwest, resulting from the warm weather.
Winter Power Prices in the Northeast and Midwest
Source: EIA, “Warm weather, low natural gas prices hold down wholesale power prices this winter,” February 15, 2012, http://www.eia.gov/todayinenergy/detail.cfm?id=5010

Analysis Group, Inc. Page | 10
TVA, the nation’s biggest government owned utility, attributed a 14.8 percent reduction in residential electricity consumption to the mild winter.15 TVA power sales in the fourth quarter of 2011 were cut by $260 million compared with the same quarter a year earlier. Electric demand in the residential sector is more sensitive to weather, than in the industrial sector.
Recent Corporate Announcements
On January 26, 2012, FirstEnergy Corporation announced plans to retire six older coal‐fired power plants in Ohio, Pennsylvania and Maryland, citing EPA’s mercury and air toxics standards as the cause. Other facts suggest that market conditions, combined with the remaining useful life of the plants, played a significant role in the company’s decision. Most of the retiring units are between 50 and 60 years old. They are all “merchant” power plants, whose financial performance is shaped by competitive power markets. FirstEnergy had already idled most of these units beginning in 2010 because of reduced demand for electricity and the need to reduce operating costs.16 FirstEnergy’s prior decision to retire the units by September 1, 2012 suggests that market fundamentals led the company to reach the conclusion now, rather than closer to the date on which the company would need to comply with EPA’s mercury and air toxics rule (which is March 2015, at the earliest).
15 “Mild winter pushes Tennessee Valley Authority into the red,” Chattanooga Times Free Press, February 4, 2012.
16 FirstEnergy’s press release from August 8, 2010 announced its “plans to make operational changes at certain of its smaller coal‐fired units in response to the continued slow economy and lower demand for electricity, as well as uncertainty related to proposed new federal environmental regulations. The changes… are designed to reduce operating costs and provide more predictability while maintaining availability for future operations, as needed. Efforts will be made to reassign affected employees to other FirstEnergy facilities.” Also, as “a result of the operating changes at the plants, the company estimates it could write off up to $287 million in value related to the assets.” https://www.firstenergycorp.com/content/dam/newsroom/files/news‐releases/2010‐08‐12%20FE %20Generation%20Corp.%20Announces%20Plans%20To%20Reduce%20Ope.pdf

Analysis Group, Inc. Page | 11
FirstEnergy has made similar decisions to retire older units in the past:
FirstEnergy has been retiring its oldest coal units over several decades
Plant State ClosureRockaway Ohio Demolished in 2008 Mad River Plant Ohio Closed in 1981 Gorge Plant Ohio Mothballed in 1991 Toronto Plant Ohio Closed in 1993 Edgewater Ohio Closed in 2002
Sources: “Old Ohio Edison plant to be razed by August,” Springfield News‐Sun, June 11, 2010; “By Gorge, Itʹs Lights Out: FirstEnergy to Demolish Power Plant in Akron Thatʹs Been Inactive for Years,” Akron Beacon‐Journal, October 24, 2008
A second example is American Electric Power’s June 2011 announcements of coal plant retirements. While the EPA regulations were cited in the press release announcing the retirement of nearly 6,000 MW of coal plants, market dynamics and practical business decisions played an important role. AEP’s CEO had told financial analysts at an investor conference the prior week that those coal plants were “high cost plants” and “in fact, throughout I think almost all of 2009 those plants probably didn’t run 5% of the time because natural gas prices were such that they simply weren’t dispatching. When we shut those down there will be some cost savings as well. And on balance we think that that’s the appropriate way to go not only to treat our customers but also to treat our shareholders near and long term with that small amount of the fleet going offline.”17 In 2007, AEP had signed a consent decree covering many power plants including all but one of the units in the 2011 retirement announcement;18 in that consent decree, relating to prior environmental litigation surrounding the plants, the company had already agreed to retire, retrofit or repower 4,500 MW of these plants.
Since issuing the final MATS rule, AEP has reported to investors that it has reduced its projected environmental compliance costs because of flexibility that EPA has provided
17 Transcript, Sanford C. Bernstein & Co. Strategic Decisions Conference June 1, 2011, Management Discussion Section, with Michael Morris of American Electric Power Co., interviewed by Hugh Wynne.
18 U.S.A. and State of New York, et. al., v. American Electric Power, U.S. District Court for the Southern District of Ohio, Eastern Division, Civil Actions No C2‐99‐1250 (Consolidated with C2‐99‐1182), C2‐05‐360, and C2‐04‐1098, October 9, 2007.

Analysis Group, Inc. Page | 12
in terms of the particular matter standards.19 AEP has also reduced its planned coal unit retirements. According to AEP CEO, Nicholas K. Akins:
[A]s we go through this process, we originally looked at 6,000 megawatts being retired. I think now itʹs 5200, since Big Sandy will stay online. But we also projected that we would replace that with about 1500 to 1800 megawatts of natural gas‐fired capacity, so if this fuel switching is going to continue to occur, weʹre going to retire units that are out of the market as quickly as we can. And then as far as replacement with natural gas facilities, thatʹll be primarily the fuel of choice for us, because in our eastern footprint, we never had that really before, but now we have substantial pipeline capability and the advent of the Utica and Marcellus shale has just dramatically changed the way we look at natural gas in the future.20
AEP management also told investors that the economic outlook in the 11 states where the company operates remains modest, with slight growth year‐over‐year expected in industrial and commercial sectors and flat residential load.21
Conclusion – and Other Factors Affecting Coal Plant Economics
New environmental requirements can put financial pressures on coal plant operators, but power market fundamentals, and especially tightened gas‐to‐coal price differentials and lower electricity demand, have contributed significantly to the recent business decisions of some coal plant owners to retire some of their marginal plants. Many market observers report continued pressure on the coal fleet in the near term, at a minimum, due to these economic drivers.
The timing of particular power plant retirement decisions may be triggered by other factors that affect the circumstances of a particular plant or a particular company. For 19 “AEP cuts planned coal retirements,” Argus Air Daily, February 13, 2012. Also, AEP’s February 10, 2012 presentation to analysts and investors indicates that “Competitive generation (OH) environmental CAPEX spending reduced by $700M for 2012‐20 period” relative to AEP’s June 2011 estimate.” http://www.aep.com/investors/eventspresentationsandwebcasts/documents/AEPAnalystInvestorMeeting Feb_ 10_2012.pdf 20 AEP. American Electric Power Co., Inc., 2012 Guidance/Update Call, Feb 10, 2012. 21 AEP Press Release. AEP Announces 2012 Ongoing Earnings Guidance Range Of $3.05 To $3.25 Per Share, Details Plans For 4 Percent To 6 Percent Earnings Growth. February 10, 2012.

Analysis Group, Inc. Page | 13
example, a plant with marginal economics due to fuel market pressures might be tipped into retirement at the point when the company faces a maintenance‐cycle milestone that would require a large investment just to keep the plant open for business. Similarly, a company might be facing more generalized workforce consolidation or labor‐agreement issues that contribute to the timing of closures of marginal plants. Companies sometimes time the announcements of closures to take advantage of tax opportunities or other matters affecting earnings in a particular financial reporting period. These triggers may not be as transparent as more obvious factors as lower output levels at and lower revenues received by certain plants, but they may affect the timing of some plant retirement events or announcements.