Why are cities not states?
37
Why are cities not states? Alan Freeman
description
Why are cities not states?. Alan Freeman. Governance of London. The questions Where should London’s boundaries be? How big should a borough be? How should either and both be governed?. The problem: where to stop?. East-West issues I: the jobs. East-West issues II: the commuters. - PowerPoint PPT Presentation
Transcript of Why are cities not states?

Why are cities not states?
Alan Freeman

Governance of London
The questions– Where should London’s boundaries be?– How big should a borough be?– How should either and both be governed?

The problem: where to stop?

East-West issues I: the jobs
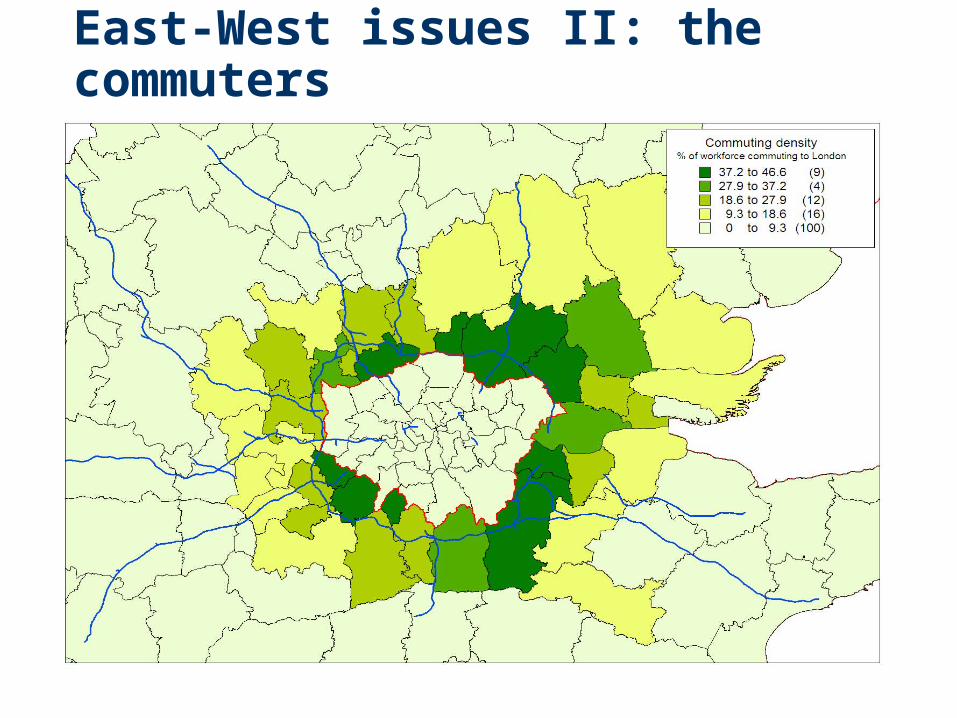
East-West issues II: the commuters

Why is a city not a state?
Only two points in history when cities assumed state-type functions– Greece 700-315 bc– Italy 950-1515
In each case absorbed by a larger territorial project
Nation state has become the dominant form

Working definition
Function of political power is to optimise the achievement of social objectives by economic means

However, the nation-state is in crisis
‘Globalisation’ (=world market in capital, plus multilateral economics institutions)
Economy is world-wide, nation is territorially bounded. Existing boundaries being redrawn But what is in question?
– Not ‘the nation’ but ‘which nation’ Devolution
– Is London really the same as Scotland? City exists as a component part of a nation

London: between two continents
Globalisation has in fact undermined the political basis of multilateralism
Return of unilateral political action Decline of the multilateral institutions But inadequacy of the national form remains Structural crisis of the nation-state But no sign that the city has heightened autonomy Conclusion: cities, even global cities, can only optimise
in context of relation to world and national economy But which nation?
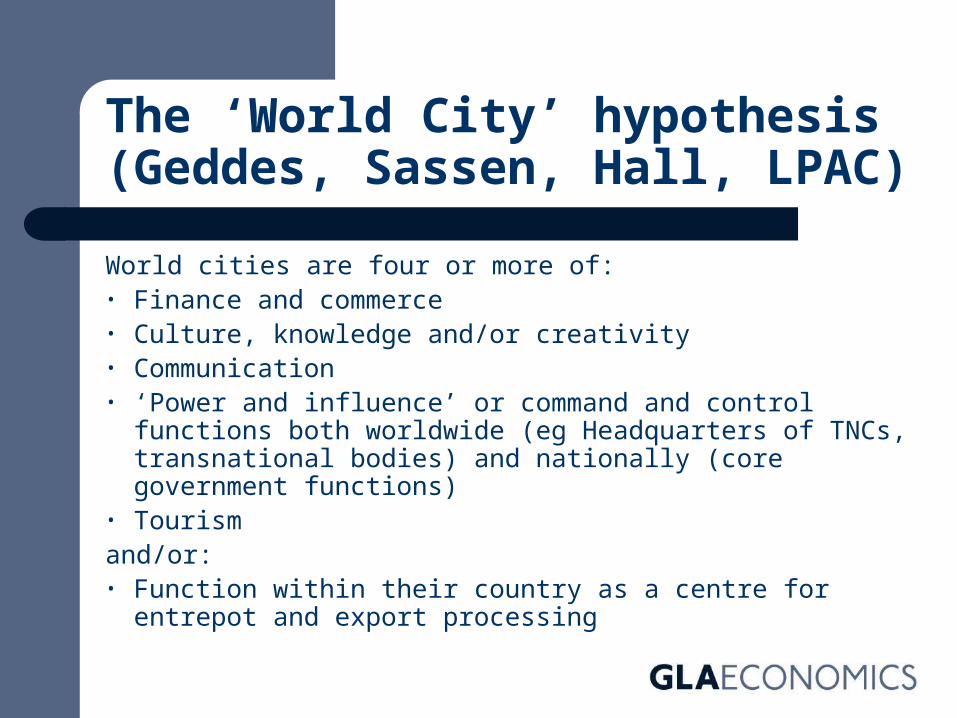
The ‘World City’ hypothesis (Geddes, Sassen, Hall, LPAC)
World cities are four or more of:• Finance and commerce• Culture, knowledge and/or creativity• Communication• ‘Power and influence’ or command and control functions both
worldwide (eg Headquarters of TNCs, transnational bodies) and nationally (core government functions)
• Tourismand/or:• Function within their country as a centre for entrepot and export
processing
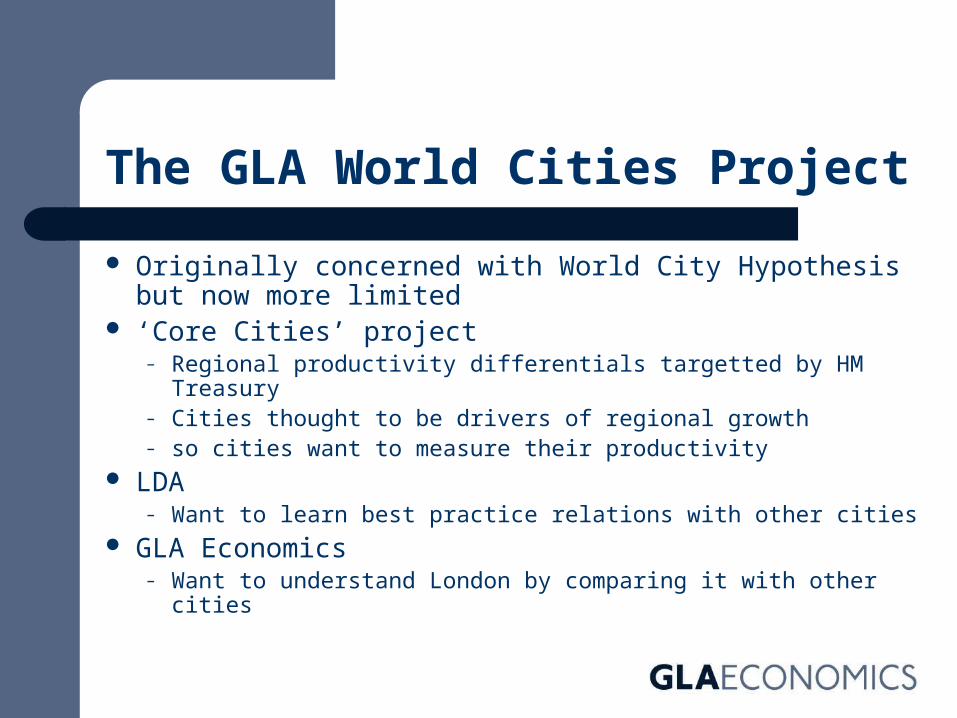
The GLA World Cities Project
Originally concerned with World City Hypothesis but now more limited
‘Core Cities’ project – Regional productivity differentials targetted by HM Treasury– Cities thought to be drivers of regional growth– so cities want to measure their productivity
LDA – Want to learn best practice relations with other cities
GLA Economics– Want to understand London by comparing it with other cities

The aims
Comparable data Continuous data Robust data
BUT…
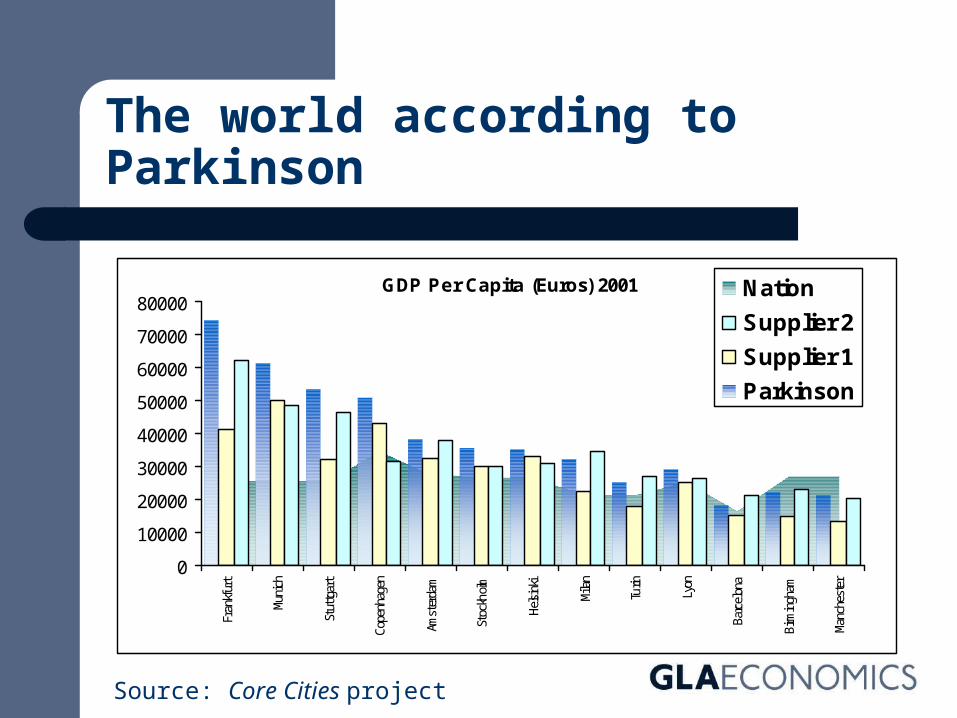
The world according to Parkinson
GDP Per Capita (Euros) 2001
0
10000
20000
30000
40000
50000
60000
70000
80000
Fran
kfur
t
Muni
ch
Stut
tgar
t
Cope
nhag
en
Amst
erda
m
Stoc
kholm
Helsi
nki
Mila
n
Turin
Lyon
Barc
elon
a
Birm
ingh
am
Manc
hest
er
Nation
Supplier 2
Supplier 1
Parkinson
Source: Core Cities project

Growth according to three suppliers
10-year annual growth in GDP per capita, 1998 PPP Euros
0%
1%
2%
3%
4%
Madr
id
Helsi
nki
Barc
elon
a
Manc
hest
er
Amst
erda
m
Birm
ingh
am
Stoc
kholm
Cope
nhag
en
Turin
Mila
n
Fran
kfur
t
Muni
ch
Lyon
Stut
tgar
t
Supplier 1
Supplier 2
Supplier 3

Why so many different estimates?
City definition Employment Output

Can this be overcome?
Extract from the Eurostat guide to regional data

Apparently not

Urban Audit – first (official) attempt to classify and measure cities
‘Cities have generally been defined as the central municipality which is responsible for local government. In most countries, the city corresponds to the concept of Local administrative unit (LAU) level 2 (formerly NUTS level 5). Exceptions to this rule are listed below. Given that the structure of local government varies a lot between EU countries, the result is a city concept that is not always comparable between countries. The emphasis has been on identifying a city concept with political responsibility in the various countries.
‘The following countries have defined “city” differently than LAU level 2 in the context of the Urban Audit.
Belgium;
France:
Portugal:
United Kingdom:
Ireland:

GLA Name1999 LSE (FUR)
GAME 1997/ 8 Supplier 1 Supplier 2 UA II UA/FUR
Supplier 2/FUR
Berlin 2,125,140 3,995,074 3,376,200 3,444,255 3,386,667 159% 162%Marseille 1,498,275 1,197,623 1,873,636 1,857,129 1,349,772 90% 124%London 9,245,799 12,653,500 7,269,093 7,191,886 7,172,036 78% 78%Rome 3,926,166 3,330,298 3,854,589 3,815,800 2,459,776 63% 97%Madrid 5,183,064 4,747,548 5,220,742 5,069,982 2,938,723 57% 98%Hamburg 3,064,151 2,213,649 1,706,697 1,732,841 1,704,735 56% 57%Cologne 2,171,206 10,336,511 1,584,997 4,302,934 962,507 44% 198%Munich 2,940,226 1,804,920 1,620,567 1,193,495 1,194,560 41% 41%Birmingham 2,870,658 3,753,500 2,615,754 976,093 977,091 34% 34%Barcelona 4,630,150 4,103,470 4,719,505 4,588,406 1,503,884 32% 99%Dublin 1,567,524 1,113,418 1,099,164 495,101 32% 70%Amsterdam 2,635,825 6,219,212 1,207,985 1,176,243 734,629 28% 45%Brussels 3,464,443 2,830,590 963,922 938,344 964,405 28% 27%Copenhagen 1,939,669 1,349,755 591,628 614,040 499,148 26% 32%Manchester 1,866,996 6,843,700 2,567,913 2,482,514 392,819 21% 133%Athens 3,535,059 3,761,478 3,470,854 736,406 21% 98%Paris 10,902,388 9,970,315 11,070,662 11,259,299 2,125,246 19% 103%Lisbon 4,077,286 2,276,890 2,589,168 3,336,215 556,797 14% 82%Stuttgart 2,616,980 1,573,303 2,361,437 3,959,421 151%
Some population estimates…

Does it matter?
Greater London 157.4
Inner London 250.6
Inner London –West 461.9
Inner London – East 129.1
Outer London 99.4
South East 116
GVA per capita in Euros – EU15=100 (Paul Cheshire)

And now for something entirely different…

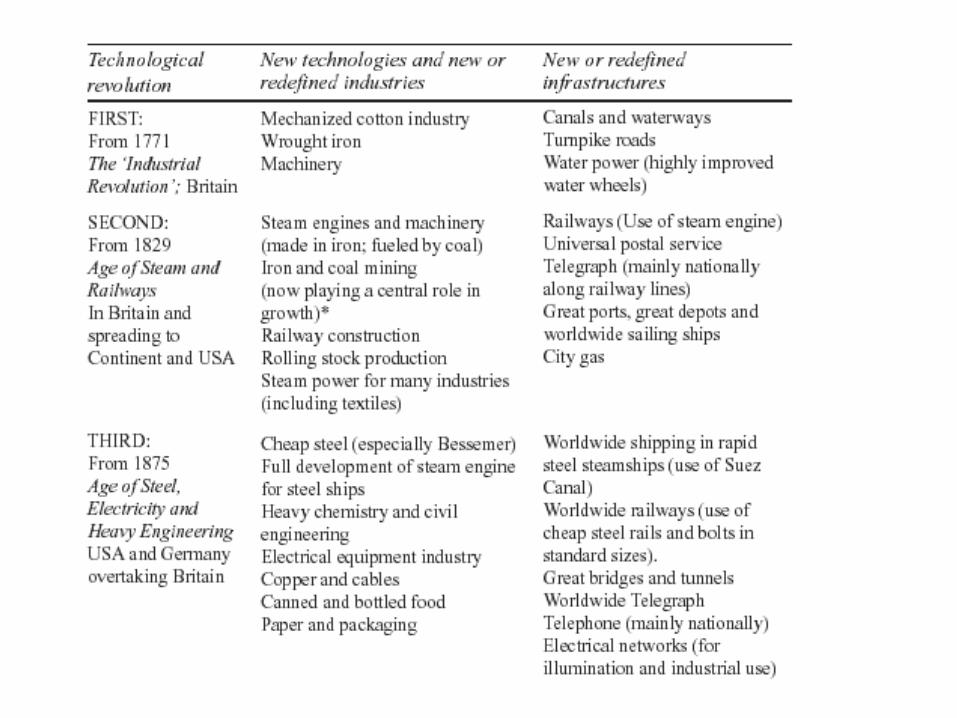
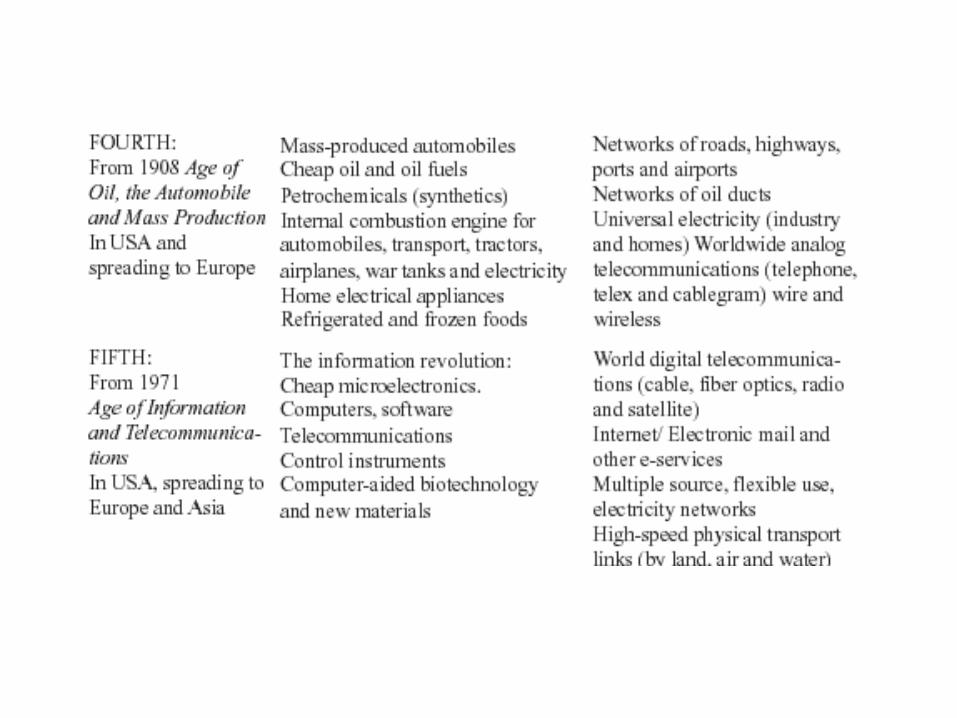
Invention and transformation: The integration of Kondratieff waves with social, geographical and geopolitical change (Perez)
Date of ‘big bang’
Boom age Popular name for the period
Core country or countries
Year Big-bang initiating the revolution
Cities born or transformed
1771 1800-1825 The ‘Industrial Revolution’
Britain Arkwright’s mill opens in Cromford
The modern Industrial City
1829 1848-73 Age of Steam and Railways
Britain (spreading to Continent and USA)
Test of the ‘Rocket’ engine for the Liverpool–Manchester railway
The North West (UK); the Midwest (US)
1875 1890-1914 ‘Belle Époque’; Age of Steel, Electricity and Heavy Engineering
USA and Germany forging ahead and overtaking Britain
Carnegie Bessemer steel plant opens in Pittsburgh, Pennsylvania
New York Ruhr
1908 1947-1962 Age of Oil, the Automobile and Mass Production
USA (with Germany at first vying for world leadership), later spreading to Europe
First Model-T comes out of Ford plant in Detroit, Michigan
Detroit Birmingham Darmstadt Etc
1971 Please wait for
announce-ments
Age of Information and Telecommunications
USA (spreading to Europe and Asia)
Intel microprocessor is announced in Santa Clara, California
Silicon Valley The West (UK) Global Cities?


Not cycling but waving?Parameters Ratios Manufacturing Services
Start point >1 means Services start earlier 1.22 0.01 0.0122Speed >1 means Services rise slower 1.86 2 3.72Top Limit >1 means Services rise further 1.44 1 1.4433
-
0.20
0.40
0.60
0.80
1.00
1.20
1.40
1.60
1.80
2.001 3 5 7 9 11 13 15 17 19 21 23 25 27 29 31 33 35
Periodmanufacturing business services Total

What happened in the nineties?
0%
5%
10%
15%
20%
25%
30%
35%
40%
1971
1974
1977
1980
1983
1986
1989
1992
1995
1998
2001
2004
2007
2010
2013
2016
Manufacturing Business services Manufacturing plus Business Services

London’s output growth 1995-
2000
Creative Industries: a qualitative reshaping of industrial structure Jobs
growth
Output growth

And a new regional pattern of growth
jobs
growth

London: CI job growth 1995-2000
Including in London itself

Job density: a reminder

Borough
Havering 2,744 4,147 6,610 281 3,866 4%Barking and Dagenham 1,948 3,587 5,074 461 3,126 9%Waltham Forest 6,566 6,900 11,726 1,740 5,160 15%Harrow 10,517 8,443 16,466 2,494 5,949 15%Greenwich 7,688 4,939 10,851 1,776 3,163 16%Bromley 16,098 9,654 21,558 4,194 5,460 19%Newham 7,072 4,295 9,417 1,950 2,345 21%Bexley 5,003 3,337 6,848 1,492 1,845 22%Hillingdon 9,961 9,420 15,874 3,507 5,913 22%Ealing 17,849 14,523 26,446 5,926 8,597 22%Croydon 12,256 12,713 20,149 4,820 7,893 24%Enfield 8,638 6,544 11,844 3,338 3,206 28%Kingston upon Thames 11,237 9,657 16,153 4,741 4,916 29%Hounslow 9,536 5,094 11,300 3,330 1,764 29%Redbridge 7,432 8,338 11,953 3,817 4,521 32%Merton 9,995 8,905 14,089 4,811 4,094 34%Lewisham 10,726 10,557 15,780 5,503 5,054 35%Sutton 9,549 7,337 12,435 4,451 2,886 36%Brent 12,721 10,794 17,068 6,447 4,347 38%Richmond upon Thames 18,232 13,535 22,736 9,031 4,504 40%Wandsworth 27,495 22,574 35,658 14,411 8,163 40%Barnet 20,093 15,791 25,479 10,405 5,386 41%Tower Hamlets 9,434 9,121 12,912 5,643 3,478 44%Westminster 21,213 15,893 25,479 11,627 4,266 46%Lambeth 20,237 17,561 25,767 12,031 5,530 47%Hammersmith and Fulham 19,341 14,931 23,344 10,928 4,003 47%Hackney 11,467 10,285 14,756 6,996 3,289 47%Kensington and Chelsea 18,410 14,641 22,243 10,808 3,833 49%Southwark 15,146 14,390 19,565 9,971 4,419 51%Camden 24,555 19,257 28,665 15,147 4,110 53%Islington 15,426 12,234 17,854 9,806 2,428 55%Haringey 18,169 13,750 20,495 11,424 2,326 56%
Is there a pattern of specialisation?
I = working in Creative industry
O= in Creative Occupation
O I = Total Creative Workforce = industry + occupation (DCMS definition)
O I = ‘specialist’ workforce (any creative occupation also working in creative industry)
O I /O I = ‘Creative Factor Utilisation’ indicator

Where is the money going?
Woodward, 30 years on
???
?
??

A new technological paradigm?
●Small runs, big bucks: mass producing difference
The end of the market in sameness
What matters: on spec, and on time
●Birth of a new industrial structureCapital flows into optimising small unit production
Flexible manufacturing becomes a universal technique
Design becomes a universal factor of production

Redefining production
Redefining the city– Economies of scale no longer a property of the unit– Agglomeration as such is the source of economy– The city is the new location for agglomeration economies
Redefining human capital– ‘Knowledge’ and ‘information’ imply once-for-all transfer– If so they cannot be a ‘factor’ of production– Creativity is ever present in production because each
project is new– Capacity to ‘transform to a vision’
(produce to an incomplete spec)

What London might be doing
New market, both domestic and globalHigh value-added, short-run, differentiated consumer services and products
New production paradigmFlexibly specialised hi-tech delivery of services, or products which are close substitutes for a service (eg films, videos)
New factor of productionCreative capacity
Organised through specialist productive units–Using the new factor of production– in the new production paradigm– to produce commodities to the new market