WHS NanoTrader Free - WH SelfInvest · Indicators: ADX, Aroon, ATR, ... Trading: Normal settings...
16
WHS NanoTrader Free Last Update: 10/09/2015
Transcript of WHS NanoTrader Free - WH SelfInvest · Indicators: ADX, Aroon, ATR, ... Trading: Normal settings...

Page 1 of 16
WHS NanoTrader Free
Last Update: 10/09/2015

NanoTrader Free
Page 2 of 16
Content
A – NanoTrader Free Start Page ............................................................................................................ 3
B - Manipulate Charts ............................................................................................................................ 4
C - Place Orders & Manage Positions .................................................................................................... 6
D - Create a Chart ................................................................................................................................... 9
E - Create a QuoteBoard....................................................................................................................... 12
F - Manage your Charts ........................................................................................................................ 13
G - Create & Manage Pages ................................................................................................................. 15

NanoTrader Free
Page 3 of 16
A – NanoTrader Free Start Page
NanoTrader Free opens up the first time on the following Start Page:
This Start Page is very simple. It is composed of three basic elements, a QuoteBoard, a Chart and an AccountBar. Using these elements you can create all the Pages you want.
You will find the tools that you need in three organizational bars, the Main ToolBar, the ChartingBar and the PagesBar.
This manual shows you how to place Orders and manage Positions, as well as, how to make your own Charts, QuoteBoards and Pages.
Good work!
QuoteBoard Linked chart
AccountBar
PagesBar
Main ToolBar
ChartingBar

NanoTrader Free
Page 4 of 16
B - Manipulate Charts
Execute the instructions below the charts to learn what effects they have on the Chart:
Centered zoom (+: in, -: out) Price-axis compression
Click on to zoom in Put the mouse over the price-axis Move up while pressing on the left button, or
roll up the mouse wheel
AB rectangular zoom Time-axis expansion
Put the mouse over A Move to B while pressing on the left button
Put the mouse over the time-axis Move to the left while pressing on the left button
Move the chart Price compression
Put the mouse in the center Move to the right while pressing on the right button
Put the mouse over the blue triangle Move up while pressing on the left button
Right-click on the blue triangle to activate upper auto zoom
A
B
NanoTrader Free
Page 5 of 16
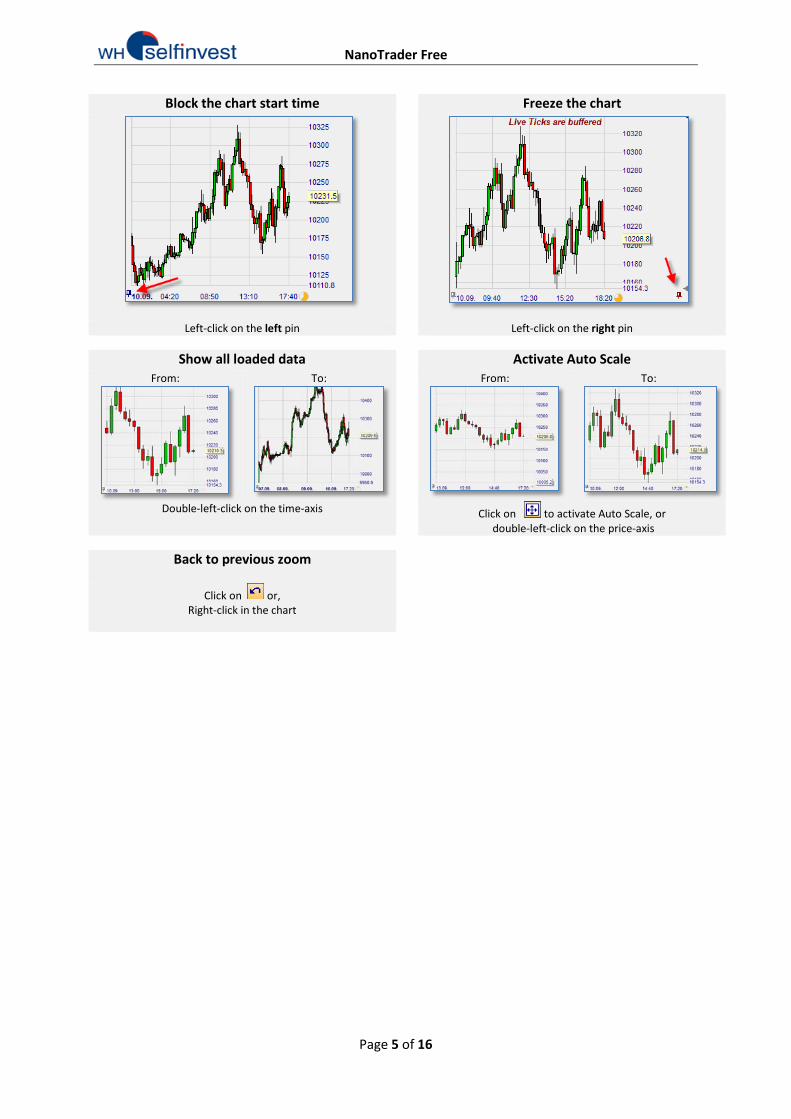
Block the chart start time Freeze the chart
Left-click on the left pin Left-click on the right pin
Show all loaded data Activate Auto Scale From:
To:
From:
To:
Double-left-click on the time-axis Click on to activate Auto Scale, or
double-left-click on the price-axis
Back to previous zoom
Click on or, Right-click in the chart

NanoTrader Free
Page 6 of 16
C - Place Orders & Manage Positions
NanoTrader Free makes placing orders both easy and pleasant as you can see in this chapter.
Place an Order
We want to buy 5 Germany 30 CFD at market with 2 contingent orders (stop & target):
(1) Click on Germany 30 CFD in the QuoteBoard to display it in the chart window.
(2) Zoom-in today’s price action and click on in the chart left top corner. NanoTrader Free opens an order ticket and displays two red lines representing the contingent orders :
(3) Grab the lower red line by the triangle and move it where you want your stop to be. Do the same with the red higher line (target). Set the volume on 5 and click on Buy.
Cool!
While moving the contingent orders, look at the risk & return parameters: Risk = return = 0.5%, RRR = return/risk = 1.0

NanoTrader Free
Page 7 of 16
Manage your Position
(4) Once your position is opened you can manage it in different ways a. The Order Pad (see 1) displays the position size, position price and P/L in real time. b. The Bid-Ask is visible in the chart.
Bid price = Last price ... prices are 100% consistent: c. See your position and P&L in the chart (see 2). d. Grab the target and move it where you want (see 3): e. Grab the stop and move it where you want (see 4):
Be Surgical with the Tactics Buttons
(5) Click on the end of the stop order line to open the Tactics buttons :
a. Click on to move the stop up by 1 tick. b. Click on to convert the stop into a trailing stop. c. If the position is sufficiently profitable click on to move
the stop one click above the average price. d. Click on to open the DesignerBar where you can set-up
the Tactics buttons.
1
2
3
4

NanoTrader Free
Page 8 of 16
OrderPad 1-click Action Buttons
(6) Perform the actions below with just 1-click: a. Buy or sell 5 lots at market with or b. Buy or sell 1 lot at market with or c. Reverse your position with d. Double your position with e. For this symbol, cancel all your open orders with f. For this symbol, close all your positions and open orders with
HotKey 1-click Market Order
(7) HotKeys are another way to place market orders by pressing a key on the keyboard:
Display Execution Fills in the Chart
(8) Click on to display the times and prices where you traded:

NanoTrader Free
Page 9 of 16
D - Create a Chart
NanoTrader Free lets you create freely all kinds of charts.
Charts and Studies Each chart is defined by several properties which can be grouped as follows:
Properties related to charting and technical analysis Types of Chart: Line, Bars, Candles, Heikin Ashi Chart Aggregation: Days, Minutes, Seconds, Ticks, Span Abs., Span %, Renko, … Indicators: ADX, Aroon, ATR, Bollinger Bands, CCI, ... Graphical Objects: Trendline, Channel, Horizontal Line, Fibonacci, ...
Properties related to trading
Order Pad: Order Pad, SpeedTrader, ... Account: Account Number, Order Volume Tactics: BrkEven, AvgPrice, +1 Tick, Trail Stop, ... All the properties are saved in a study. A chart is a symbol with a study. Below is an example:
Open a Chart on EU-USD Type of chart: Candles Chart aggregation: 15 minutes Indicators: Crossing moving average (5,25), MACD(12,26,9) Graphical objects: Trendline Trading: Normal settings
Follow these instructions:
Click on the New Chart button:
Find EUR USD with the search field or by navigating. Double-click on the Plain_10_Min study.
The chart of EUR-USD opens up with the Plain_10_Min study:

NanoTrader Free
Page 10 of 16
Add Specifications
Type of Chart:
Select Candlestick chart in the ChartingBar:
Chart Aggregation:
Click on Select 15mn:
Indicators: Click on Open the Add Indicator dialog: Built-in indicators and express indicators, including most of WHS ProStation indicators, are stored there.
Select the indicators below and click on: Crossing MA
MACD
Close the Add Indicators dialog.
The indicators are in the chart: In the Master chart the color gives the combined opinion: Green = both indicators are bullish Red = both indicators are bearish White = one bullish, one bearish If you do not want to show the indicators’ opinion un-tick this box:

NanoTrader Free
Page 11 of 16
Click on a parameter in the legend of a chart window, then change its value:
Cool! Change the value with the mouse wheel. It is so easy and fast!
To take out an indicator right-click on its name in the chart and select remove.
Graphical Objects:
Every drawing tool has an icon:
To draw a AB trendline click on then click on point A, maintain and move to point B: To remove an object right-click on it and select remove or press the Delete key on the keyboard. To remove all objects just click on
Trading: Click on the edge (orange) of the Order Pad:
Select your account:
Click on to open the Save dialog. Give a meaningful name to your study and save it.
Our advice! Learn how to name and save all your elements -Studies, QuoteBoards, Pages- so you can protect your work and quickly retrieve it when you need it.

NanoTrader Free
Page 12 of 16
E - Create a QuoteBoard
NanoTrader allows you to create QuoteBoards and to link them to Charts.
QuoteBoard Linked to a Chart Chart opened - Keep symbol & replace study by template study In the Start Page the QuoteBoard and the Chart are linked together. The linkage is done through the icons below that were set purposely on red:
Click on that icon to change the link color or unlink the Chart or QuoteBoard:
The main interest of such technique is to be able to quickly review the Charts of many symbols. To display a Chart, just click on the symbol:
Right-click on a symbol to review what other actions can be taken:
• Placing orders • Adding/removing symbols • Applying a study or a template study • Saving the QuoteBoard
Our advice! Learn how to name and save all your elements -Studies, QuoteBoards, Pages- so you can protect your work and quickly retrieve it when you need it.
Create a New QuoteBoard Chart opened - Keep symbol & replace study by template study Click on New – Standard to open a new QuoteBoard:
By default the QuoteBoard opens up on the left. You can fix it to any sides of the screen. Just grab the top of the QuoteBoard and attach it to the anchors that appear in the screen:

NanoTrader Free
Page 13 of 16
F - Manage your Charts
NanoTrader Free empowers traders by allowing them to save their Charts as studies or template studies and to easily interchange symbols and/or studies in their Charts.
Saving a Chart as a Study or as a Template Study Saving a study under another name is how you create more than one chart for a given symbol.
You can save a study as another study or as a template study. If you want to re-use it or to apply it to other symbols, it is best to save it as a template study.
Click on to open the Save dialog.
Save study as: MyStudy
Save as template study: MyTemplateStudy
Once saved this study appears in the list of studies under EUR USD:
Once saved this study appears in the list of studies under EUR USD and in the list of template studies:
Open a New Chart with a Template Study
Symbol Study From - -
To EUR USD MyTemplateStudy Click on Follow the instructions:

NanoTrader Free
Page 14 of 16
Chart Opened - Keep Symbol & Replace Study by a Template Study
Symbol Study From EUR USD MyStudy
To EUR USD MyTemplateStudy Follow the instructions:
Chart Opened - Replace Symbol & Keep Study Chart opened - Keep symbol & replace study by template study
Symbol Study From EUR USD MyStudy
To GBP JPY MyStudy Follow the instructions:
Chart Opened - Keep Symbol & Replace Study with Another Study Chart opened - Keep symbol & replace study by template study
Symbol Study From EUR USD MyStudy
To EUR USD MyStudy2 Follow the instructions:
Location of Study and Template Study Files Chart opened - Keep symbol & replace study by template study Extension Location Studies .dys Documents\NanoTrader\Dys Template studies .dys Documents\NanoTrader\DefaultDys

NanoTrader Free
Page 15 of 16
G - Create & Manage Pages NanoTrader Free allows you to create as many pages as you want. The most interesting pages can be added to the PagesBar to make them instantaneously available.
Save a Page Chart opened - Keep symbol & replace study by template study In the PageManager:
Or, in the PagesBar:
Save as MyPage1:
Add a Page to the PagesBar Chart opened - Keep symbol & replace study by template study Click on Config … in the PagesBar:
Two more tabs have been added to the PagesBar:
Move the 2 pages from left to right:
NanoTrader Free keeps each page open so you can toggle between your pages with 1-click.
Our advice! Learn how to name and save all your elements -Studies, QuoteBoards, Pages- so you can protect your work and quickly retrieve it when you need it.
Standard Button on the PagesBar C NanoTrader Free opens up the first time on a preconfigured Start Page. The configuration of the Start Page is done programmatically and cannot be changed. However, once the Start Page is opened you can adapt it to your needs and save it under a name of your choice and add it in the PagesBar.

NanoTrader Free
Page 16 of 16
Build a Page Chart opened - Keep symbol & replace study by template study To build a page just put together various elements such as Charts, QuoteBoards and AccountBars. For Charts and QuoteBoards refer to the appropriate Chapters.
For AccountBar, click on your account:
This opens the AccountBar. The AccountBar can be attached to various sides of the screen like the QuoteBoards.
Empty Page Chart opened - Keep symbol & replace study by template study In the PageManager:
Or, in the PagesBar:
The page is empty:
Save All .... Studies, QuoteBoards and Pages Chart opened - Keep symbol & replace study by template study
This is the Save All button. By default NanoTrader Free saves all your changes automatically when closing a study or terminating the program. However, it is good policy to save all from time to time just to avoid losing some good work in case of an unexpected problem.
Our advice! Learn how to name and save all your elements -Studies, QuoteBoards, Pages- so you can protect your work and quickly retrieve it when you need it.
Location of Page Files Chart opened - Keep symbol & replace study by template study Extension Location Pages .dpl Documents\NanoTrader\Layouts