WHS-07k Wheat Outlook Dec. 13, 2007 - Cornell...
20
Projected U.S. wheat ending stocks for 2007/08 are lowered 32 million bushels this month reflecting higher expected domestic use and exports. At 280 million bushels, this year’s ending stocks are the lowest in 60 years. Domestic food use is projected 5 million bushels higher this month based on the latest mill grind data reported by the U.S. Census Bureau. Domestic seed use is forecast 2 million bushels higher based on expectations for 2008 crop seedings. Exports are projected 25 million bushels higher based on increased foreign imports and reduced supplies and exports for key competitor countries. Demand for wheat remains strong globally despite record prices in most places around the world. The projected U.S. season-average farm price is raised 30 cents on each end of the range to $6.20 to $6.60 per bushel, reflecting sharply higher cash and futures prices. The projected range is well above the record of $4.55 per bushel in 1995/96. Wheat Outlook Gary Vocke and Edward Allen 2007/08 Ending Stocks Down, Price Up WHS-07k Dec. 13, 2007 Contents Domestic Outlook Intl. Outlook Contacts & Links Tables Supply & Use by Year Supply & Use by Class Quarterly Supply & Use Monthly Food Use National Avg. Prices Prices Received by Farmers by Class Cash Grain Bids Exports & Imports Census & Exports Sales Comparison Web Sites WASDE Grain Circular Wheat Briefing Room -------------- The next release is Jan. 15, 2008 -------------- Approved by the World Agricultural Outlook Board.
Transcript of WHS-07k Wheat Outlook Dec. 13, 2007 - Cornell...

Projected U.S. wheat ending stocks for 2007/08 are lowered 32 million bushels this month reflecting higher expected domestic use and exports. At 280 million bushels, this year’s ending stocks are the lowest in 60 years. Domestic food use is projected 5 million bushels higher this month based on the latest mill grind data reported by the U.S. Census Bureau. Domestic seed use is forecast 2 million bushels higher based on expectations for 2008 crop seedings. Exports are projected 25 million bushels higher based on increased foreign imports and reduced supplies and exports for key competitor countries. Demand for wheat remains strong globally despite record prices in most places around the world. The projected U.S. season-average farm price is raised 30 cents on each end of the range to $6.20 to $6.60 per bushel, reflecting sharply higher cash and futures prices. The projected range is well above the record of $4.55 per bushel in 1995/96.
Wheat Outlook Gary Vocke and Edward Allen 2007/08 Ending Stocks Down, Price Up
WHS-07k Dec. 13, 2007
Contents Domestic Outlook Intl. Outlook Contacts & Links Tables Supply & Use by Year Supply & Use by Class Quarterly Supply & Use Monthly Food Use National Avg. Prices Prices Received by Farmers by Class Cash Grain Bids Exports & Imports Census & Exports Sales Comparison Web Sites WASDE Grain Circular Wheat Briefing Room -------------- The next release is Jan. 15, 2008 -------------- Approved by the World Agricultural Outlook Board.
Domestic Situation and Outlook
2 Wheat Outlook/WHS-07k/December 13, 2007
Economic Research Service, USDA
2007/08 Projected Ending Stocks Are Down Project domestic use and exports are raised month to month. Projected food use is up 5 million bushels from November and seed use is up 2 million bushels. Food use is projected higher than expected based on the third-quarter mill grind report from Census. Seed use is projected up because of higher expectations for planted area for the 2008/09 marketing year. Projected exports are raised 25 million bushels from November based on increased foreign imports and reduced supplies and exports for key competitor countries (see the International Situation and Outlook section of this report for details). By class, hard red winter (HRW) exports are up the most, 10 million bushels. Hard red spring (HRS), soft red winter (SRW), and durum wheat are each raised 5 million bushels. At 280 million bushels, this year's projected ending stocks are the lowest in 60 years. The ending stocks for each class of wheat are very tight. Mill Grind Stronger Than Expected The U.S. Census Bureau reported 239 million bushels of wheat were ground for the third-quarter of 2007, up from 232 million bushels from the third-quarter of 2006 and 229 in 2005. Projected food use for 2007/08 is up 5 million bushels from November to 945 million bushels. Food use for 2006/07 is 933 million bushels. Per capita flour use for recent calendar years is shown in the graph.

3 Wheat Outlook/WHS-07k/December 13, 2007
Economic Research Service, USDA
100
110
120
130
140
150
1964 1968 1972 1976 1980 1984 1988 1992 1996 2000 2004
U.S. per capita wheat flour use
Pounds/person
Source: USDA, Economic Research Service.
Crop Conditions on the Central and Southern Plains Worse Than Last Year The last Crop Progress report for the year, November 26, reported that 19 percent of the winter wheat crop was in poor to very poor condition. Forty-four percent was rated in good to excellent. Last year at this time, 11 percent of the crop was rated poor to very poor and 53 percent was rated good to excellent. Crop Production reported that by November 25, 89 percent of the acreage had emerged, 4 point behind last year and normal. Development lagged behind normal by 12 points or more in Oklahoma and Texas where producers were late getting fall seedings in the ground and rainfall has been light. Crop Progress reported that the SRW-wheat-growing States have better crop conditions this year compared to last year, while crop conditions on the central and southern plains are worse than last year. The percentage of the crop rated poor to very poor this year in Texas, Oklahoma, and Kansas was 53 percent, 30 percent, and 15 percent, respectively. A year ago, the percentages for Texas, Oklahoma, and Kansas were 14 percent, 24 percent, and 8 percent, respectively. Although fall conditions are an indication of early crop stress, there is only a weak correlation between them and final yields.

International Situation and Outlook
4 Wheat Outlook/WHS-07k/Decemberr 13, 2007
Economic Research Service, USDA
World Wheat Production Down Slightly This Month Global wheat production is forecast down 1 million tons this month to 602 million, with slightly lower yields reported for some countries. The biggest decline was for Canada, down 0.55 million tons to 20.1 million as Statistics Canada reported less area harvested than earlier expected and a slight reduction in yield. Projected production for Argentina was reduced 0.5 million tons to 15.0 million as a late frost in key production areas of southern Buenos Aires Province caught a significant amount of wheat during reproduction and reduced yield prospects. However, good growing conditions further north, where wheat is double-cropped, was partly offsetting. EU-27 wheat production forecast for 2007/08 was reduced 0.4 million tons to 120.5 million mostly because of a slightly lower yield reported for France. Production increases of 0.1 million tons each were reported this month for Azerbaijan, Bangladesh, South Africa, and Serbia. Global beginning stocks for 2007/08 were raised slightly, 0.2 million tons to 124.3 million, mostly due to several years of historical revisions for Croatia that reduced consumption and increased stocks. Trade Changes Cause Reduction in Global Disappearance Projected world wheat disappearance for 2007/08 was reduced 1.0 million tons this month to 616.5 million. World wheat disappearance includes the sum of each countries’ total consumption and the difference between global exports and imports summed on a local marketing year. This month’s changes to individual countries projected wheat consumption for 2007/08 included mostly small changes to 12 different countries, with increases more than offsetting declines, summing to an increase of 0.7 million tons. Increased wheat consumption is projected this month for Bangladesh, with increased food aid and production; for Australia with increased wheat feed use; for Egypt based on the pace of imports; for the United States; and several others. The largest drop was for Canada, 0.4 million tons, due to reduced production. The difference between global exports and imports on the world wheat trade year (July-June) can be thought of as exports to countries outside the data base. The data base includes all significant exporting countries but not all importing countries. This results in an “Unaccounted” imports category forecast at about 3 million tons for 2007/08, the level it has been for the previous 4 years. This appropriately is part of global consumption. This month’s changes to global imports are nearly the same for the sum of local marketing years (plus 0.750 million tons) or for the trade year (plus 0.725 million) with increases for Bangladesh, Egypt and several other countries. The unusual changes to this month’s export forecasts are that July-June 2007/08 trade year exports are projected up 1.35 million tons this month while local marketing year exports are forecast down 0.97 million tons. Several countries with local marketing years extending beyond July 1, 2008 are expected to ship more before July 1 and less after. This is because supply competition is expected to
5 Wheat Outlook/WHS-07k/Decemberr 13, 2007
Economic Research Service, USDA
increase and prices are expected to decline as the new crop gets harvested in the Northern Hemisphere. For example, Canada’s local marketing year exports (August-July) are unchanged this month at 14.0 million tons, but the July-June trade year was increased 0.5 million tons to 14.5 million as Canada is expected to ship out as much as possible before July 1, 2008, leaving exports during July 2008 significantly less than the previous year. For Argentina the 2007/08 international trade year exports were unchanged this month at 11.0 million tons, as export registrations indicate a heavy pace of shipments for the next 3 months. However, with the government limiting additional registrations, the December-November local marketing year was reduced 0.5 million tons to 10.0 million as exports from July-November 2008 are expected to be slow. Similarly for Australia, 2007/08 trade year exports are unchanged as Australia is expected to export as much as possible before Northern Hemisphere production increases available supplies and causes prices to decline. However, the October-September local marketing year export forecast was cut 1.0 million tons to 8.0 million as July-October 2008 exports are expected to slow. The U.S. export forecast changes also contribute to the increase in July-June trade compared to the local marketing year. The June-May local marketing year is up 0.68 million tons (25 million bushels) but the July-June projection is up 1.0 million tons this month as the shipment pace during July 2008 is expected to be larger than in July 2007. The Australia and Argentina export changes are critical in driving local marketing year global exports down 0.97 million tons while imports to countries in the database are increasing 0.75 million tons. These trade changes depress implied world wheat consumption 1.72 million tons this month, more than offsetting the 0.7 million ton increase in use forecast for individual countries. Reduced EU-27 exports (down 0.5 million tons to 9.0 million due to the slow pace of export licenses) are the same for the trade year and local marketing year (both are July-June). Small increases in exports forecast for Croatia and Serbia are also the same for both years. Projected Global Ending Stocks Little Changed With world wheat production and total use each down 1 million tons this month, they offset, and projected ending stocks for 2007/08 are up slightly due to the increase in beginning stocks. U.S. Wheat Exports and Sales for 2007/08 Start Very Strong According to U.S. Census data, wheat exports from June-October 2007 were 16.7 million tons, up 7.0 million tons from the previous year. U.S. Export Sales shipments data indicate November 2007 exports of about 2.6 million tons, up 1.0 million compared to November 2006. Moreover, at the end of November 2007, outstanding export sales reached 9.4 million tons, up 5.0 million compared to the

6 Wheat Outlook/WHS-07k/Decemberr 13, 2007
Economic Research Service, USDA
same time a year ago. The June-May 2007/08 export forecast is only 7.2 million tons larger than 2006/07 exports because limited U.S. supplies are expected to put a brake on exports. Sales and shipments during the remaining months of 2007/08 are expected to slow dramatically.

7 Wheat Outlook/WHS-07k/December 13, 2007
Economic Research Service, USDA
2.50
3.50
4.50
5.50
6.50
7.50
8.50
June July Aug. Sept. Oct. Nov. Dec. Jan. Feb. Mar. Apr. May
Market year
2005/06 2006/07 2007/08
Source: USDA, National Agricultural Statistics Service, Agricultural Prices .
Figure 1All wheat average prices received by farmersDollars per bushel
2.50
3.50
4.50
5.50
6.50
7.50
8.50
June July Aug. Sept. Oct. Nov. Dec. Jan. Feb. Mar. Apr. May
Market year
2005/06 2006/07 2007/08
Figure 2Hard red winter wheat average prices received by farmers
Source: USDA, National Agricultural Statistics Service, Agricultural Prices .
Dollars per bushel
3.00
3.504.00
4.50
5.005.50
6.00
6.507.00
7.50
June July Aug. Sept. Oct. Nov. Dec. Jan. Feb. Mar. Apr. May
Market year
2005/06 2006/07 2007/08
Figure 3Hard red spring wheat average prices received by farmers
Source: USDA, National Agricultural Statistics Service, Agricultural Prices .
Dollars per bushel
8 Wheat Outlook/WHS-07k/December 13, 2007
Economic Research Service, USDA
2.00
3.00
4.00
5.00
6.00
7.00
8.00
June July Aug. Sept. Oct. Nov. Dec. Jan. Feb. Mar. Apr. May
Market year
2005/06 2006/07 2007/08
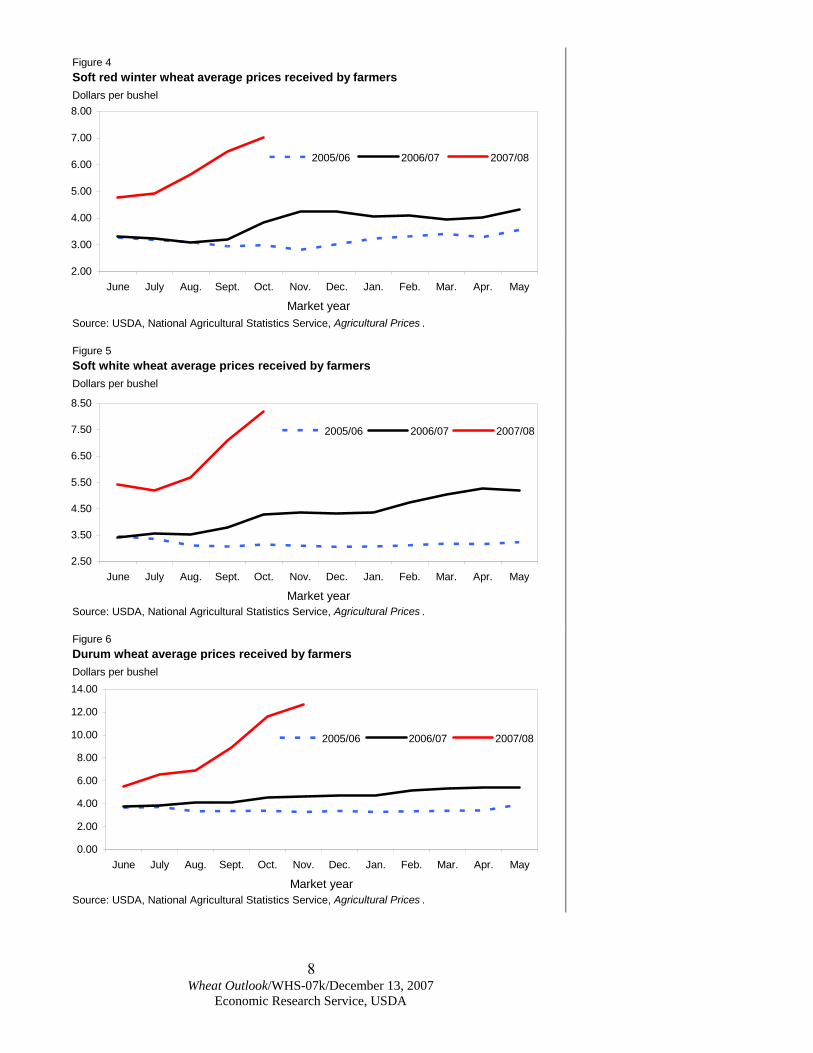
Figure 4Soft red winter wheat average prices received by farmers
Source: USDA, National Agricultural Statistics Service, Agricultural Prices .
Dollars per bushel
2.50
3.50
4.50
5.50
6.50
7.50
8.50
June July Aug. Sept. Oct. Nov. Dec. Jan. Feb. Mar. Apr. May
Market year
2005/06 2006/07 2007/08
Figure 5Soft white wheat average prices received by farmers
Source: USDA, National Agricultural Statistics Service, Agricultural Prices .
Dollars per bushel
0.00
2.00
4.00
6.00
8.00
10.00
12.00
14.00
June July Aug. Sept. Oct. Nov. Dec. Jan. Feb. Mar. Apr. May
Market year
2005/06 2006/07 2007/08
Figure 6Durum wheat average prices received by farmersDollars per bushel
Source: USDA, National Agricultural Statistics Service, Agricultural Prices .
9 Wheat Outlook/WHS-07k/December 13, 2007
Economic Research Service, USDA
-200 -100 0 100 200 300 400
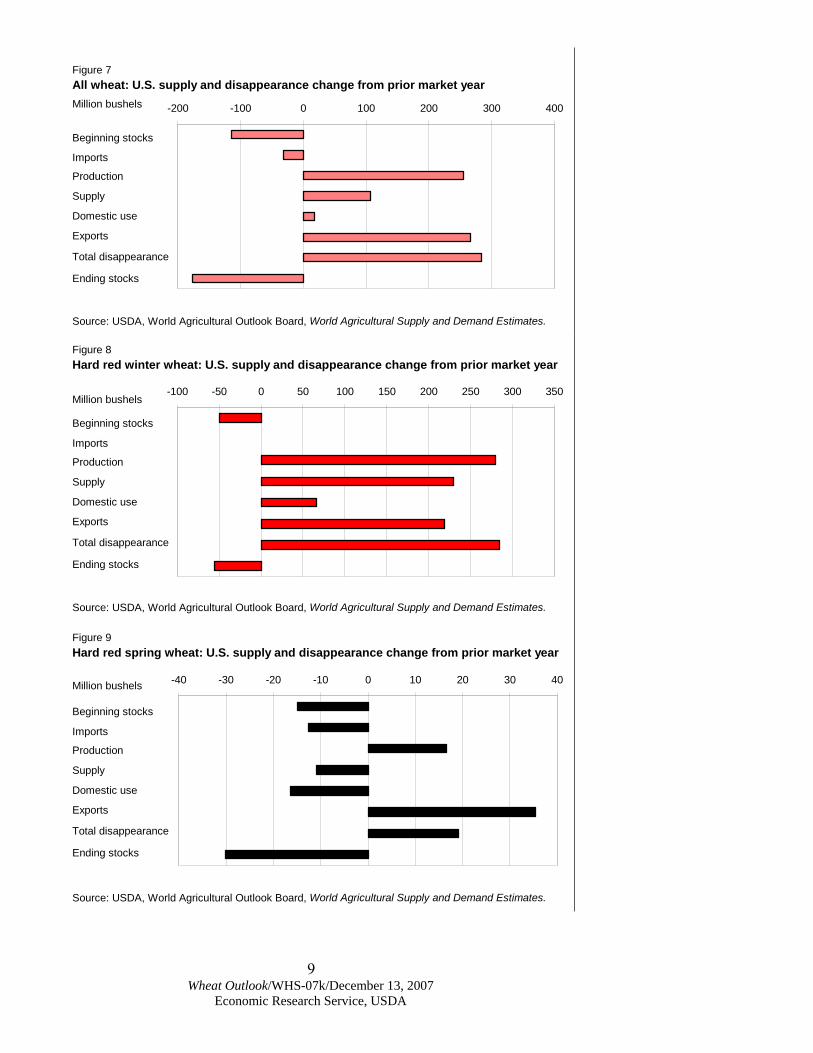
Figure 7All wheat: U.S. supply and disappearance change from prior market year
Beginning stocks
Imports
Production
Supply
Domestic use
Exports
Ending stocks
Total disappearance
Million bushels
Source: USDA, World Agricultural Outlook Board, World Agricultural Supply and Demand Estimates.
-100 -50 0 50 100 150 200 250 300 350
Figure 8Hard red winter wheat: U.S. supply and disappearance change from prior market year
Million bushels
Source: USDA, World Agricultural Outlook Board, World Agricultural Supply and Demand Estimates.
Beginning stocks
Imports
Production
Supply
Domestic use
Exports
Total disappearance
Ending stocks
-40 -30 -20 -10 0 10 20 30 40
Figure 9Hard red spring wheat: U.S. supply and disappearance change from prior market year
Beginning stocks
Imports
Production
Supply
Domestic use
Exports
Ending stocks
Total disappearance
Million bushels
Source: USDA, World Agricultural Outlook Board, World Agricultural Supply and Demand Estimates.
10 Wheat Outlook/WHS-07k/December 13, 2007
Economic Research Service, USDA
-80 -60 -40 -20 0 20 40 60
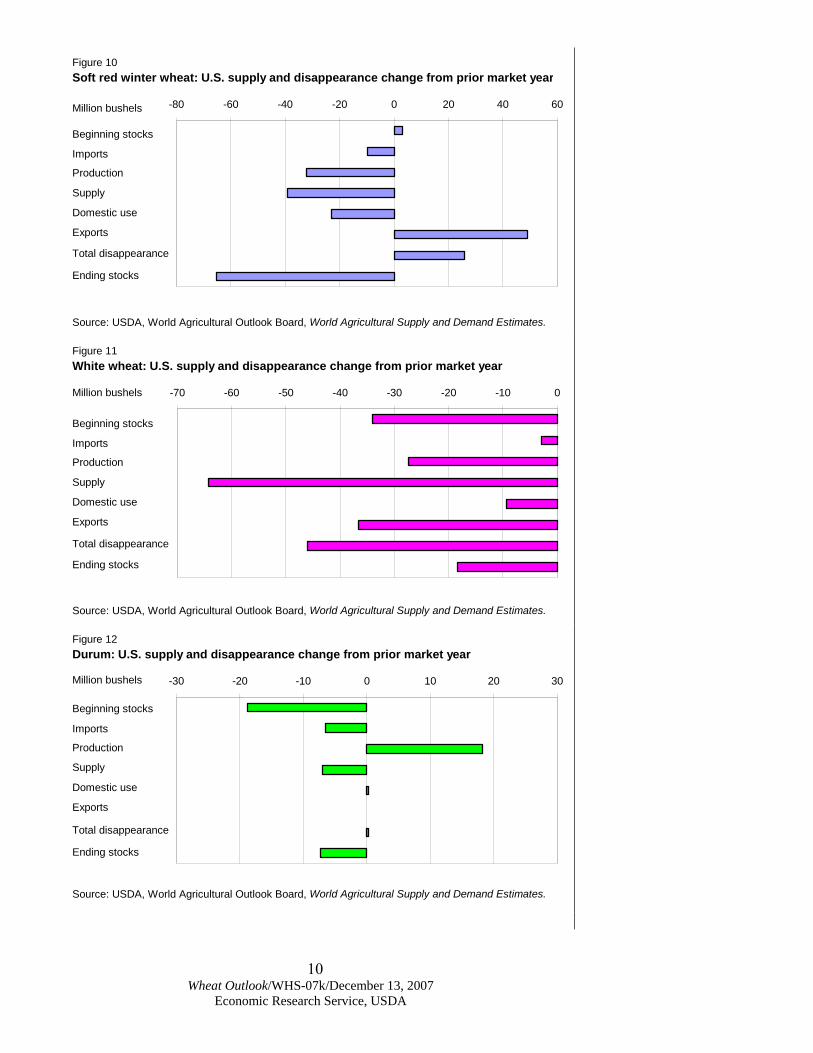
Figure 10Soft red winter wheat: U.S. supply and disappearance change from prior market year
Beginning stocks
Imports
Production
Supply
Domestic use
Exports
Ending stocks
Total disappearance
Million bushels
Source: USDA, World Agricultural Outlook Board, World Agricultural Supply and Demand Estimates.
-70 -60 -50 -40 -30 -20 -10 0
Figure 11White wheat: U.S. supply and disappearance change from prior market year
Beginning stocks
Imports
Production
Supply
Domestic use
Exports
Ending stocks
Total disappearance
Million bushels
Source: USDA, World Agricultural Outlook Board, World Agricultural Supply and Demand Estimates.
-30 -20 -10 0 10 20 30
Figure 12Durum: U.S. supply and disappearance change from prior market year
Beginning stocks
Imports
Production
Supply
Domestic use
Exports
Ending stocks
Total disappearance
Million bushels
Source: USDA, World Agricultural Outlook Board, World Agricultural Supply and Demand Estimates.

For registration and other details:www.usda.gov/oce/forum/
EnergizingRural Americain the Global MarketplaceFebruary 21-22, 2008
Crystal Gateway Marriott HotelArlington, Virginia
USDA’s
Forecasts · Trends · Policies8
11 Wheat Outlook/WHS-07k/December 13, 2007 Economic Research Service, USDA
Contacts and Links
12 Wheat Outlook/WHS-07k/December 13, 2007
Economic Research Service, USDA
Data Monthly tables from Wheat Outlook are available in Excel (.xls) spreadsheets at http://www.ers.usda.gov/briefing/wheat/data.htm. These tables contain the latest data on supply and disappearance, monthly food-use estimates, prices, exports, and imports. Related Websites WASDE http://usda.mannlib.cornell.edu/MannUsda/viewDocumentInfo.do?documentID=1194 Grain Circular, http://www.fas.usda.gov/grain_arc.asp Wheat Briefing Room, http://www.ers.usda.gov/briefing/wheat/
Contact Information Gary Vocke (domestic), (202) 694-5285, [email protected] Edward Allen (international), (202) 694-5288, [email protected] Subscription Information Subscribe to ERS’ e-mail notification service at http://www.ers.usda.gov/updates/ to receive timely notification of newsletter availability. Printed copies can be purchased from the USDA Order Desk by calling 1-800-999-6779 (specify the issue number). To order printed copies of the five field crop newsletters—cotton and wool, feed, rice, oil crops, and wheat—as a series, specify series SUB-COR-4043.
The U.S. Department of Agriculture (USDA) prohibits discrimination in all its programs and activities on the basis of race, color, national origin, age, disability, and, where applicable, sex, marital status, familial status, parental status, religion, sexual orientation, genetic information, political beliefs, reprisal, or because all or a part of an individual's income is derived from any public assistance program. (Not all prohibited bases apply to all programs.) Persons with disabilities who require alternative means for communication of program information (Braille, large print, audiotape, etc.) should contact USDA's TARGET Center at (202) 720-2600 (voice and TDD). To file a complaint of discrimination write to USDA, Director, Office of Civil Rights, 1400 Independence Avenue, S.W., Washington, D.C. 20250-9410 or call (800) 795-3272 (voice) or (202) 720-6382 (TDD). USDA is an equal opportunity provider and employer.
E-mail Notification Readers of ERS outlook reports have two ways they can receive an e-mail notice about release of reports and associated data. • Receive timely notification (soon after the report is posted on the web) via USDA’s Economics, Statistics and Market Information System (which is housed at Cornell University’s Mann Library). Go to http://usda.mannlib.cornell.edu/MannUsda/aboutEmailService.do and follow the instructions to receive e-mail notices about ERS, Agricultural Marketing Service, National Agricultural Statistics Service, and World Agricultural Outlook Board products. • Receive weekly notification (on Friday afternoon) via the ERS website. Go to http://www.ers.usda.gov/Updates/ and follow the instructions to receive notices about ERS outlook reports, Amber Waves magazine, and other reports and data products on specific topics. ERS also offers RSS (really simple syndication) feeds for all ERS products. Go to http://www.ers.usda.gov/rss/ to get started.
13,2277,7197,1987,2837,9295,6795,4401,1181,1201,1511,2181,2371,1722,474
6.20-6.604.263.423.403.403.562.780.520.520.520.520.520.48
2.752.752.752.752.802.802.58
12.022.326.524.223.225.036.1
35.041.043.054.061.066.099.0279.9456.2571.2540.1546.4491.4777.1
2,333.02,048.92,155.02,235.22,352.81,968.92,154.11,175.0908.71,002.81,065.91,158.3850.2962.31,158.01,140.31,152.21,169.21,194.41,118.71,191.8
125.0125.5159.7182.1202.9115.7182.088.081.577.777.679.784.483.4
945.0933.3914.7909.6911.9918.6926.4
2,612.92,505.12,726.12,775.32,899.22,460.42,931.290.0121.981.470.663.077.4107.6
2,066.71,812.02,104.72,158.22,344.81,605.91,947.5456.2571.2540.1546.4491.4777.1876.2
40.538.742.043.244.235.040.2
51.046.850.150.053.145.848.560.457.357.259.762.160.359.4
Million dollarsMillion dollars
Dollars per bushelDollars per bushelDollars per bushel
Million bushelsMillion bushels
Million bushelsMillion bushelsMillion bushelsMillion bushelsMillion bushelsMillion bushels
Million bushelsMillion bushelsMillion bushelsMillion bushels
Bushels per acre
Million acresMillion acres
Market value of productionGovernment payments
Farm price 3/Contract/direct payment rateLoan rate
Stocks-to-use ratio
CCC inventory 2/Ending stocks
Total disapperanceExports 1/Total domestic useFeed and residual useSeed use
Disappearance: Food use
Total supplyImports 1/Production
Supply: Beginning stocks
Yield
Harvested
Area: Planted
2007/082006/072005/062004/052003/042002/032001/02Item and unit
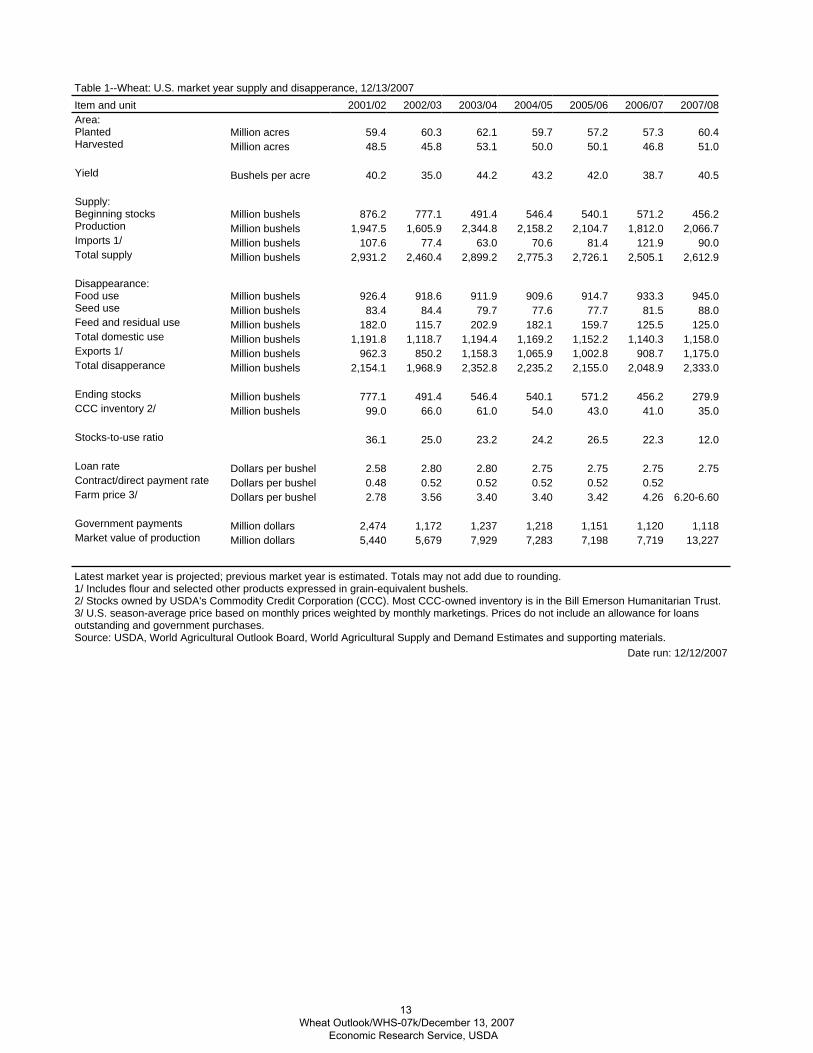
Table 1--Wheat: U.S. market year supply and disapperance, 12/13/2007
Latest market year is projected; previous market year is estimated. Totals may not add due to rounding. 1/ Includes flour and selected other products expressed in grain-equivalent bushels. 2/ Stocks owned by USDA's Commodity Credit Corporation (CCC). Most CCC-owned inventory is in the Bill Emerson Humanitarian Trust. 3/ U.S. season-average price based on monthly prices weighted by monthly marketings. Prices do not include an allowance for loans outstanding and government purchases. Source: USDA, World Agricultural Outlook Board, World Agricultural Supply and Demand Estimates and supporting materials.
Date run: 12/12/2007
13 Wheat Outlook/WHS-07k/December 13, 2007 Economic Research Service, USDA
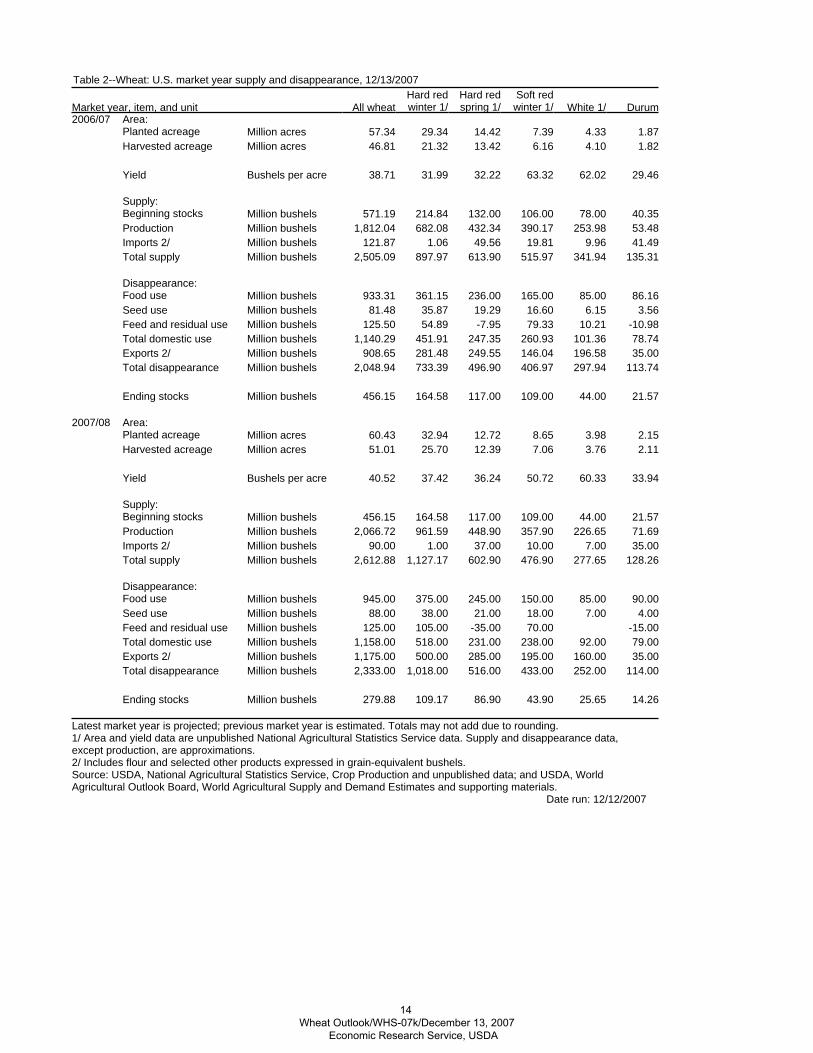
Table 2--Wheat: U.S. market year supply and disappearance, 12/13/2007
Latest market year is projected; previous market year is estimated. Totals may not add due to rounding. 1/ Area and yield data are unpublished National Agricultural Statistics Service data. Supply and disappearance data, except production, are approximations. 2/ Includes flour and selected other products expressed in grain-equivalent bushels. Source: USDA, National Agricultural Statistics Service, Crop Production and unpublished data; and USDA, World Agricultural Outlook Board, World Agricultural Supply and Demand Estimates and supporting materials.
Date run: 12/12/2007
14.2625.6543.9086.90109.17279.88
114.00252.00433.00516.001,018.002,333.0035.00160.00195.00285.00500.001,175.0079.0092.00238.00231.00518.001,158.00
-15.0070.00-35.00105.00125.004.007.0018.0021.0038.0088.00
90.0085.00150.00245.00375.00945.00
128.26277.65476.90602.901,127.172,612.8835.007.0010.0037.001.0090.0071.69226.65357.90448.90961.592,066.7221.5744.00109.00117.00164.58456.15
33.9460.3350.7236.2437.4240.52
2.113.767.0612.3925.7051.012.153.988.6512.7232.9460.43
21.5744.00109.00117.00164.58456.15
113.74297.94406.97496.90733.392,048.9435.00196.58146.04249.55281.48908.6578.74101.36260.93247.35451.911,140.29
-10.9810.2179.33-7.9554.89125.503.566.1516.6019.2935.8781.48
86.1685.00165.00236.00361.15933.31
135.31341.94515.97613.90897.972,505.0941.499.9619.8149.561.06121.8753.48253.98390.17432.34682.081,812.0440.3578.00106.00132.00214.84571.19
29.4662.0263.3232.2231.9938.71
1.824.106.1613.4221.3246.811.874.337.3914.4229.3457.34
Million bushels
Million bushelsMillion bushelsMillion bushelsMillion bushelsMillion bushelsMillion bushels
Million bushelsMillion bushelsMillion bushelsMillion bushels
Bushels per acre
Million acresMillion acres
Million bushels
Million bushelsMillion bushelsMillion bushelsMillion bushelsMillion bushelsMillion bushels
Million bushelsMillion bushelsMillion bushelsMillion bushels
Bushels per acre
Million acresMillion acres
Ending stocks
Total disappearanceExports 2/Total domestic useFeed and residual useSeed use
Disappearance: Food use
Total supplyImports 2/Production
Supply: Beginning stocks
Yield
Harvested acreage
Area: Planted acreage
Ending stocks
Total disappearanceExports 2/Total domestic useFeed and residual useSeed use
Disappearance: Food use
Total supplyImports 2/Production
Supply: Beginning stocks
Yield
Harvested acreage
Area: Planted acreage
2007/08
2006/07DurumWhite 1/
Soft red winter 1/
Hard red spring 1/
Hard red winter 1/All wheatMarket year, item, and unit
14 Wheat Outlook/WHS-07k/December 13, 2007 Economic Research Service, USDA

Table 3--Wheat: U.S. quarterly supply and disappearance (million bushels), 12/13/2007
Latest market year is projected; previous market year is estimated. Totals may not add due to rounding. 1/ Includes flour and selected other products expressed in grain-equivalent bushels. Source: USDA, World Agricultural Outlook Board, World Agricultural Supply and Demand Estimates and supporting materials.
Date run: 12/12/2007
2801,175125889452,613902,0671,71731228322392,553302,067
456909125819332,5051221,812456246-6622234892358572372712241,34631
1,315212-45562421,780291,75121421022332,410261,812
5711,003160789152,726812,105571220-472422699522972252512191,45020
1,429286-61512381,944201,92324426322312,663192,105
5401,066182789102,775712,158540239-31242291,00117984240322181,44818
1,430300-56472361,957191,93828726542272,722172,158
5461,158203809122,899632,345546296-54222261,03717
1,021291322161,533131,520305-62532402,057182,03926531522312,852162,345
491850116849192,460771,606491186-824229922159071901432191,33313
1,320235-75552381,772231,74924018532332,410271,606
777962182839262,9311081,947777231-26262261,23525
1,210225-722211,651281,623288-23522452,185292,15621823832342,849261,947
8761,062300799503,268902,228876235-4252301,36123
1,3382461132281,828211,806293-24502532,378252,35328831812393,198202,228
9501,086279929293,336952,296950239-10282351,44225
1,4172362622231,903191,884290-5552412,465192,44532226962303,272312,296
Mkt. yearJun-Aug
Mkt. yearMar-MayDec-FebSep-NovJun-Aug
Mkt. yearMar-MayDec-FebSep-NovJun-Aug
Mkt. yearMar-MayDec-FebSep-NovJun-Aug
Mkt. yearMar-MayDec-FebSep-NovJun-Aug
Mkt. yearMar-MayDec-FebSep-NovJun-Aug
Mkt. yearMar-MayDec-FebSep-NovJun-Aug
Mkt. yearMar-MayDec-FebSep-NovJun-Aug
Mkt. yearMar-MayDec-FebSep-NovJun-Aug
2007/08
2006/07
2005/06
2004/05
2003/04
2002/03
2001/02
2000/01
1999/00
Ending stocksExports 1/
Feed and residual useSeed useFood useTotal supplyImports 1/ProductionMarket year and quarter
15 Wheat Outlook/WHS-07k/December 13, 2007 Economic Research Service, USDA
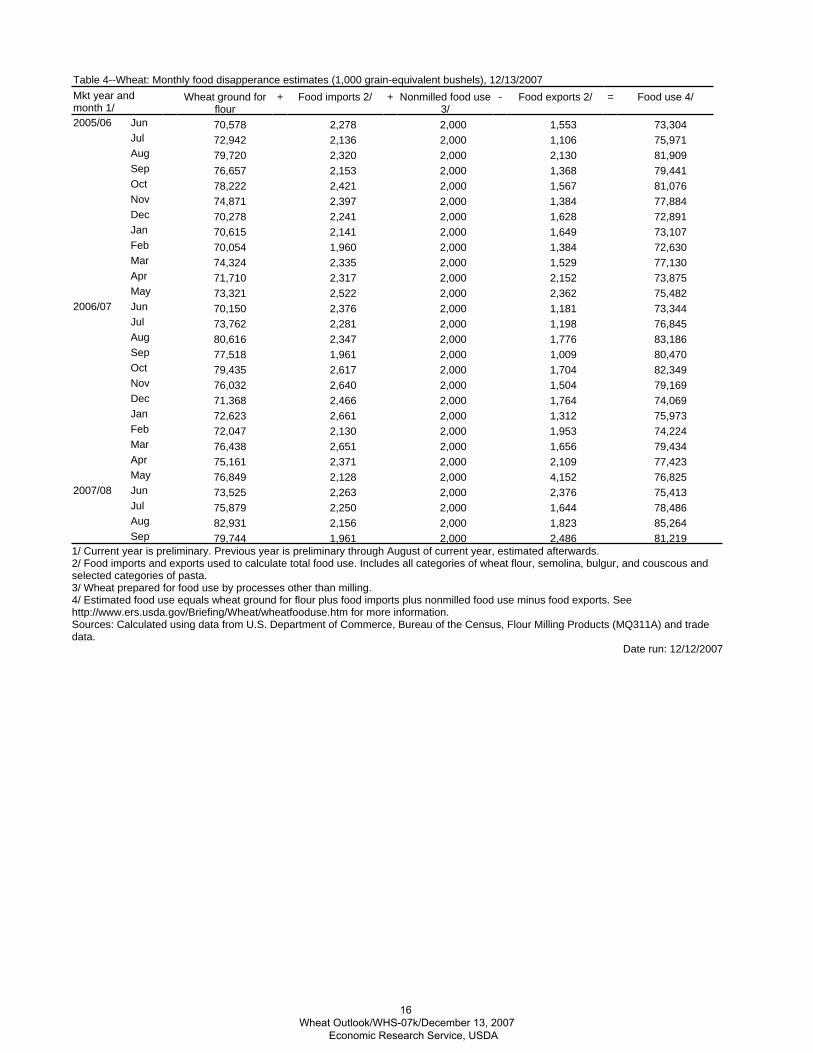
1/ Current year is preliminary. Previous year is preliminary through August of current year, estimated afterwards. 2/ Food imports and exports used to calculate total food use. Includes all categories of wheat flour, semolina, bulgur, and couscous and selected categories of pasta. 3/ Wheat prepared for food use by processes other than milling. 4/ Estimated food use equals wheat ground for flour plus food imports plus nonmilled food use minus food exports. See http://www.ers.usda.gov/Briefing/Wheat/wheatfooduse.htm for more information. Sources: Calculated using data from U.S. Department of Commerce, Bureau of the Census, Flour Milling Products (MQ311A) and trade data.
Table 4--Wheat: Monthly food disapperance estimates (1,000 grain-equivalent bushels), 12/13/2007
Date run: 12/12/2007
81,2192,4862,0001,96179,74485,2641,8232,0002,15682,93178,4861,6442,0002,25075,87975,4132,3762,0002,26373,52576,8254,1522,0002,12876,84977,4232,1092,0002,37175,16179,4341,6562,0002,65176,43874,2241,9532,0002,13072,04775,9731,3122,0002,66172,62374,0691,7642,0002,46671,36879,1691,5042,0002,64076,03282,3491,7042,0002,61779,43580,4701,0092,0001,96177,51883,1861,7762,0002,34780,61676,8451,1982,0002,28173,76273,3441,1812,0002,37670,15075,4822,3622,0002,52273,32173,8752,1522,0002,31771,71077,1301,5292,0002,33574,32472,6301,3842,0001,96070,05473,1071,6492,0002,14170,61572,8911,6282,0002,24170,27877,8841,3842,0002,39774,87181,0761,5672,0002,42178,22279,4411,3682,0002,15376,65781,9092,1302,0002,32079,72075,9711,1062,0002,13672,94273,3041,5532,0002,27870,578
SepAugJulJunMayAprMarFebJanDecNovOctSepAugJulJunMayAprMarFebJanDecNovOctSepAugJulJun
2007/08
2006/07
2005/06
Food use 4/=Food exports 2/-Nonmilled food use 3/
+Food imports 2/+Wheat ground for flour
Mkt year and month 1/
16 Wheat Outlook/WHS-07k/December 13, 2007 Economic Research Service, USDA

Table 5--Wheat: National average price received by farmers (dollars per bushel) 1/, 12/13/2007
1/ Preliminary mid-month, weighted-average price for current month. Source: USDA, National Agricultural Statistics Service, Agricultural Prices.
4.985.394.774.88
4.875.464.874.89
4.735.324.674.75
4.735.164.674.71
4.514.714.534.53
4.484.744.534.52
7.674.4812.704.627.504.677.924.59
7.014.4811.604.557.544.637.654.59
6.304.118.954.076.894.036.754.06
5.534.116.884.095.663.775.643.91
5.444.416.553.835.143.825.173.88
5.174.185.503.815.003.955.033.98
May
April
March
February
January
December
November
October
September
August
July
June
2007/082006/072007/082006/072007/082006/072007/082006/07Other springDurumWinterAll wheatMonth
Table 6--Wheat: National average prices received by farmers by class (dollars per bushel), 12/13/2007
Source: USDA, National Agricultural Statistics Service, Agricultural Prices.
Date run: 12/12/2007
5.204.974.314.69
5.274.854.044.82
5.044.743.944.66
4.754.734.094.71
4.344.544.054.73
4.334.494.264.67
4.374.494.264.83
8.194.306.944.527.013.857.354.86
7.083.786.274.166.513.226.854.43
5.703.545.534.175.653.105.654.28
5.213.555.444.474.913.255.204.43
5.423.405.184.234.773.325.104.27
May
April
March
February
January
December
November
October
September
August
July
June
2007/082006/072007/082006/072007/082006/072007/082006/07
WhiteHard red springSoft red winterHard red winterMonth
17 Wheat Outlook/WHS-07k/December 13, 2007 Economic Research Service, USDA
Date run: 12/12/2007
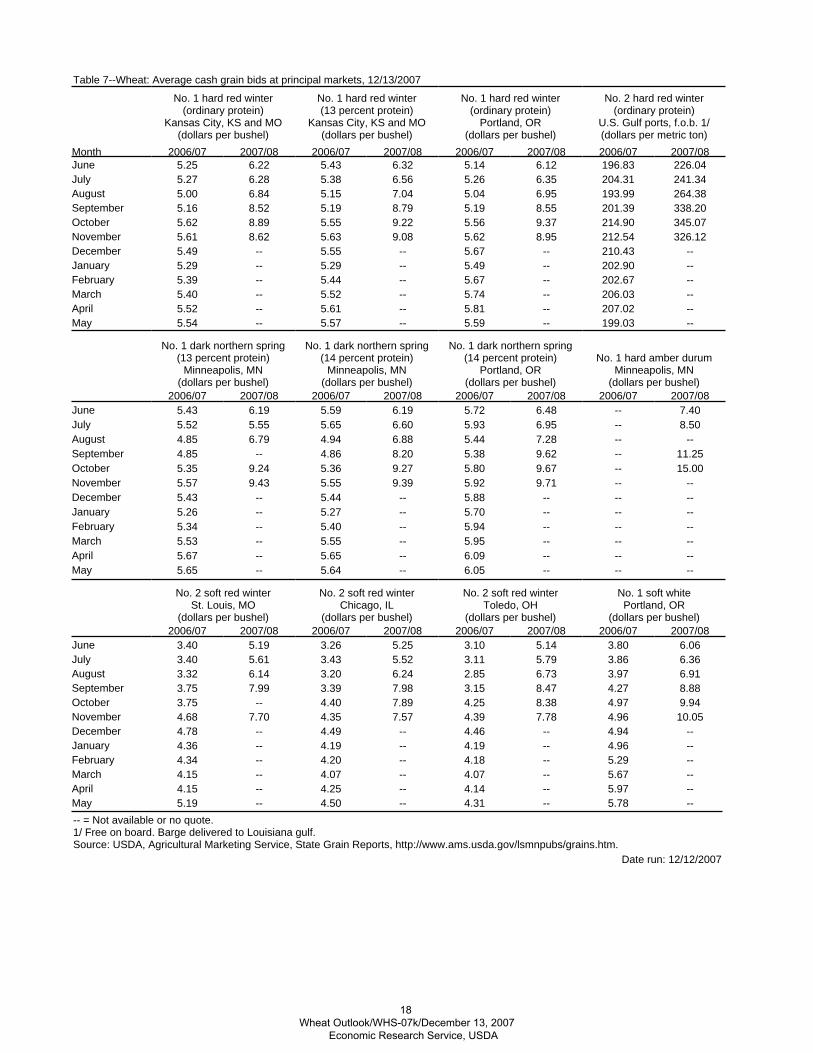
Table 7--Wheat: Average cash grain bids at principal markets, 12/13/2007
-- = Not available or no quote. 1/ Free on board. Barge delivered to Louisiana gulf. Source: USDA, Agricultural Marketing Service, State Grain Reports, http://www.ams.usda.gov/lsmnpubs/grains.htm.
--199.03--5.59--5.57--5.54--207.02--5.81--5.61--5.52--206.03--5.74--5.52--5.40--202.67--5.67--5.44--5.39--202.90--5.49--5.29--5.29--210.43--5.67--5.55--5.49
326.12212.548.955.629.085.638.625.61345.07214.909.375.569.225.558.895.62338.20201.398.555.198.795.198.525.16264.38193.996.955.047.045.156.845.00241.34204.316.355.266.565.386.285.27226.04196.836.125.146.325.436.225.25
MayAprilMarchFebruaryJanuaryDecemberNovemberOctoberSeptemberAugustJulyJune
2007/082006/072007/082006/072007/082006/072007/082006/07
No. 2 hard red winter (ordinary protein)
U.S. Gulf ports, f.o.b. 1/ (dollars per metric ton)
No. 1 hard red winter (ordinary protein)
Portland, OR (dollars per bushel)
No. 1 hard red winter (13 percent protein)
Kansas City, KS and MO (dollars per bushel)
No. 1 hard red winter (ordinary protein)
Kansas City, KS and MO (dollars per bushel)
Month
------6.05--5.64--5.65------6.09--5.65--5.67------5.95--5.55--5.53------5.94--5.40--5.34------5.70--5.27--5.26------5.88--5.44--5.43----9.715.929.395.559.435.57
15.00--9.675.809.275.369.245.3511.25--9.625.388.204.86--4.85
----7.285.446.884.946.794.858.50--6.955.936.605.655.555.527.40--6.485.726.195.596.195.43
MayAprilMarchFebruaryJanuaryDecemberNovemberOctoberSeptemberAugustJulyJune
2007/082006/072007/082006/072007/082006/072007/082006/07
No. 1 hard amber durum Minneapolis, MN
(dollars per bushel)
No. 1 dark northern spring (14 percent protein)
Portland, OR (dollars per bushel)
No. 1 dark northern spring (14 percent protein)
Minneapolis, MN (dollars per bushel)
No. 1 dark northern spring (13 percent protein)
Minneapolis, MN (dollars per bushel)
--5.78--4.31--4.50--5.19--5.97--4.14--4.25--4.15--5.67--4.07--4.07--4.15--5.29--4.18--4.20--4.34--4.96--4.19--4.19--4.36--4.94--4.46--4.49--4.78
10.054.967.784.397.574.357.704.689.944.978.384.257.894.40--3.758.884.278.473.157.983.397.993.756.913.976.732.856.243.206.143.326.363.865.793.115.523.435.613.406.063.805.143.105.253.265.193.40
MayAprilMarchFebruaryJanuaryDecemberNovemberOctoberSeptemberAugustJulyJune
2007/082006/072007/082006/072007/082006/072007/082006/07
No. 1 soft white Portland, OR
(dollars per bushel)
No. 2 soft red winter Toledo, OH
(dollars per bushel)
No. 2 soft red winter Chicago, IL
(dollars per bushel)
No. 2 soft red winter St. Louis, MO
(dollars per bushel)
18 Wheat Outlook/WHS-07k/December 13, 2007 Economic Research Service, USDA
Date run: 12/12/2007
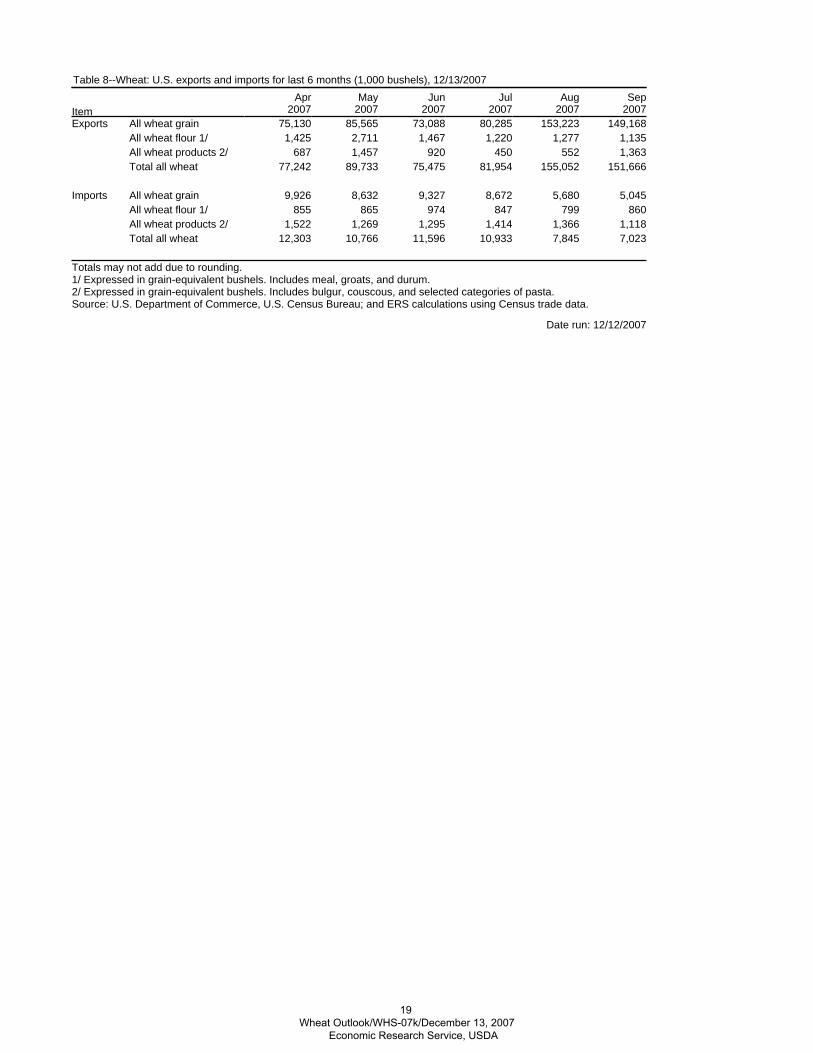
Table 8--Wheat: U.S. exports and imports for last 6 months (1,000 bushels), 12/13/2007
Totals may not add due to rounding. 1/ Expressed in grain-equivalent bushels. Includes meal, groats, and durum. 2/ Expressed in grain-equivalent bushels. Includes bulgur, couscous, and selected categories of pasta. Source: U.S. Department of Commerce, U.S. Census Bureau; and ERS calculations using Census trade data.
7,0237,84510,93311,59610,76612,3031,1181,3661,4141,2951,2691,522
8607998479748658555,0455,6808,6729,3278,6329,926
151,666155,05281,95475,47589,73377,2421,3635524509201,4576871,1351,2771,2201,4672,7111,425
149,168153,22380,28573,08885,56575,130
Total all wheatAll wheat products 2/All wheat flour 1/All wheat grain
Total all wheatAll wheat products 2/All wheat flour 1/All wheat grain
Imports
Exports200720072007200720072007SepAugJulJunMayApr
Item
19 Wheat Outlook/WHS-07k/December 13, 2007 Economic Research Service, USDA
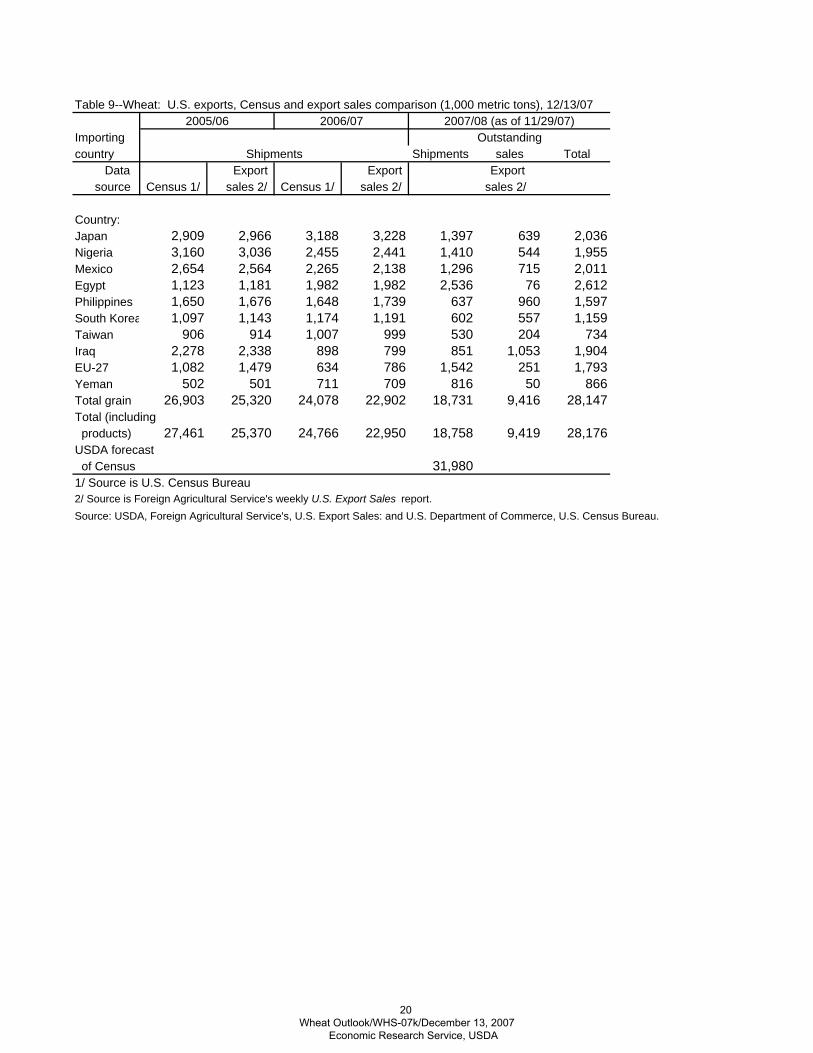
Table 9--Wheat: U.S. exports, Census and export sales comparison (1,000 metric tons), 12/13/07 2005/06 2006/07 2007/08 (as of 11/29/07)
Importing Outstandingcountry Shipments Shipments sales Total Data Export Export Export source Census 1/ sales 2/ Census 1/ sales 2/ sales 2/
Country:Japan 2,909 2,966 3,188 3,228 1,397 639 2,036Nigeria 3,160 3,036 2,455 2,441 1,410 544 1,955Mexico 2,654 2,564 2,265 2,138 1,296 715 2,011Egypt 1,123 1,181 1,982 1,982 2,536 76 2,612Philippines 1,650 1,676 1,648 1,739 637 960 1,597South Korea 1,097 1,143 1,174 1,191 602 557 1,159Taiwan 906 914 1,007 999 530 204 734Iraq 2,278 2,338 898 799 851 1,053 1,904EU-27 1,082 1,479 634 786 1,542 251 1,793Yeman 502 501 711 709 816 50 866Total grain 26,903 25,320 24,078 22,902 18,731 9,416 28,147Total (including products) 27,461 25,370 24,766 22,950 18,758 9,419 28,176USDA forecast of Census 31,9801/ Source is U.S. Census Bureau2/ Source is Foreign Agricultural Service's weekly U.S. Export Sales report.Source: USDA, Foreign Agricultural Service's, U.S. Export Sales: and U.S. Department of Commerce, U.S. Census Bureau.
20 Wheat Outlook/WHS-07k/December 13, 2007 Economic Research Service, USDA