EDInet Marketplace Comprehensive Online Marketplace Platform

Whose Voice Do We Hear in the Marketplace?:
Evidence from Consumer Complaining Behavior∗
Devesh Raval
Federal Trade Commission
October 1, 2018
Abstract
Consumers’ voice has increasingly become a major factor in the marketplace through consumer
complaints, but little is known about who chooses to complain and how complainants compare
to consumers of the product. Any differences in complaint rates across groups can reflect either
different propensities to complain, or different consumer experiences, making it difficult to as-
sess the degree of self-selection. I utilize a set of law enforcement actions to separate these two
explanations by comparing characteristics of complaining consumers to those of victims, and
find much lower complaint rates in heavily minority areas compared to non-minority areas, rel-
ative to their respective victimization rates. I find evidence against information-based accounts
for why victims from minority areas are less likely to complain, and in favor of explanations
related to lower levels of trust or general social capital. I then provide a statistical weighting
approach in order to remedy the problem of self-selection, and apply it to develop an implied
victimization rate using complaints from the Consumer Sentinel database.
∗The views expressed in this article are those of the author. They do not necessarily represent thoseof the Federal Trade Commission or any of its Commissioners. I thank Avi Goldfarb, Yesim Orhun, JanPappalardo, Ted Rosenbaum, Navdeep Sahni, Dave Schmidt, K Sudhir, David Torok, Catherine Tucker,Brett Wendling, and Nathan Wilson for their comments on this paper, as well as Anne Coughlan, Ron Hill,Donald Ngwe, Dina Mayzlin and Debra Ringold for discussing this paper at different conferences. I wouldalso like to thank Jonathan Byars, Jason Chen, and Scott Syms for their excellent research assistance, andMelissa Dickey, Andrew Hudson, Nicole Fleming, Anne Miles, Patti Poss, Rhonda Perkins, and MichaelWaller for helping to obtain the data used in this paper.
1

1 Introduction
Nearly 50 years ago, Hirschman (1970) highlighted the crucial role that consumer “voice”
plays in markets. The Internet has magnified that role through easily accessible user-
generated reviews, which have become a major source of information on the quality of
products and companies. In this paper, I focus on consumer complaints; policymakers now
receive millions of such complaints per year. They use the information in these complaints
to learn about company practices and decide whether a company is violating the law.
Despite the growing power of consumers’ voice, we know very little about whose voice we
hear. Consumers self-select to complain, which could affect both which companies receive
complaints and the assessment of quality provided by the complaints. For example, if the
demographics of consumers that provide complaints are very different from fraud victims,
policymakers may not learn about problems that affect communities that do not complain.
Unfortunately, it is difficult to assess the degree of self-selection in complaining behavior.
Higher rates of complaints for a given set of consumers could reflect either differences in a
consumer’s propensity to vocalize, or in the experience the consumer received. The exist-
ing literature on complaining behavior has, in general, only examined data on complaining
consumers, and so cannot disentangle these two explanations.
I separate these two explanations through a set of nine law enforcement actions (“cases”),
for which I can combine information on affected consumers, whom I will refer to as “victims”,
with complaints on those companies from the Consumer Sentinel Network.1 I can thus
1The Consumer Sentinel database receives complaints reported to federal and state government agen-cies as well as private actors such as the Better Business Bureaus (BBBs). See https://www.ftc.gov/
enforcement/consumer-sentinel-network for more details on the Consumer Sentinel Network.
2

compare how the characteristics of complainants differ from consumers for a given company,
based on zip code demographics obtained from consumers’ addresses. Because the cases I
use vary substantially from each other in size, average amount lost, type of fraud, and the
demographics of victims, any conclusions about self-selection behavior that hold across cases
are likely to hold more generally for fraud related consumer protection matters.
I find that heavily black and Hispanic areas complain substantially less relative to their
rate of victimization after controlling for other demographic chracteristics. I examine the
differences between complaining consumers and victims through a set of mixed logit models.
I find that the complaint rate falls by 61% relative to the victim rate as the percentage of
black residents rises from 0% to 100%, and by 43% as the percentage of Hispanic residents
rises from 0% to 100%. Across cases, I find effects significantly different from zero for 6 of
9 cases for the percentage of black residents and 5 of 9 cases for the percentage of Hispanic
residents. Thus, self-selection in complaining disproportionately reduces the complaint rate
for minority communities compared to non minority communities, relative to their respective
level of victimization.
I then turn to examining why residents of heavily minority areas complain at much lower
rates than other communities, relative to their rate of victimization. The FTC provides
several explanations in a recent report to Congress (Federal Trade Commission, 2016) for
why black and Hispanic communities may complain less:
In the FTC’s workshops and conferences, however, many have observed a gen-
eral reluctance and embarrassment to report fraud. Further, despite the higher
prevalence of fraud, some have stated that African American and Latino con-
3

sumers may distrust the government, may not know where to complain, may
believe their complaints will not make a difference, or may have concerns about
encountering the government because of their immigration status.
I categorize these explanations as based on differences in either information or levels of
social trust. To test explanations due to information differences, I compare cases where con-
sumers lost thousands of dollars to those where consumers lost tens of dollars, as consumers
would likely know they were defrauded and have incentives to find out how to complain
when they lost large amounts of money. Since minority communities complain less than
non-minority communities relative to their rate of victimization for both types of cases, I do
not find support for explanations based on information.
In contrast, quantitative evidence from the General Social Survey (GSS), as well as qual-
itative evidence from sociology and marketing, suggests that minorities have lower levels of
social trust. Lower social trust could reduce complaining because of mistrust of government
specifically, or because a feeling of societal exclusion reduces pro-social activity. I find evi-
dence against mistrust of government, as surveys do not show substantial racial gaps for trust
in government, and non-governmental BBB complaints exhibit similar selection patterns as
government complaints.
I then estimate interaction models in order to examine mechanisms for how alienation
could affect complaining behavior. I find lower selection effects for the percentage of Hispanic
residents in areas with more foreign born residents, or more speakers of languages other
than English. While inconsistent with explanations through language barriers or fears of
immigration enforcement, these findings would be consistent with greater alienation for later
4

generation Hispanics. The complaint to victim ratio falls with an increase in the percentage
of minority residents for both more advantaged and less advantaged areas; thus, explanations
through societal exclusion cannot be narrowly based on the socioeconomic status of minority
residents.
Consumer complaint rates are often used to understand how victimization rates differ
between different communities; with self-selection in complaining, such inferences would
be misleading. Weighting complaints based on the propensity to complain is one way to
adjust for self-selection; communities that are less likely to complain relative to their rate of
victimization would receive greater weight. I use my empirical estimates to construct such
weights, and find that complaint rates from majority black areas should receive about double
the weight of the median zip code in order for their complaint rates to match the level of
victimization.
I then use these weights to construct an implied victimization rate by multiplying 2015
aggregate complaint rates from Consumer Sentinel across US communities by these weights
to reflect the degree of victimization. While the aggregate complaint rate is only slightly
higher in heavily black communities, compared to communities with few blacks, heavily
black areas have more than triple the implied victimization rate. The aggregate complaint
rate is about 50% lower in heavily Hispanic communities than areas with few Hispanics,
while the implied victimization rates in Hispanic areas follow an inverse U shape pattern
with the highest rates in moderately Hispanic communities. My implied victimization rates
are consistent with evidence from victimization surveys that has found much higher rates of
victimization for minorities (Anderson, 2007, 2013).
This paper relates to a large body of work examining consumer complaining behav-
5
ior. While a large body of empirical work has examined how demographics affect com-
plaint behavior, it does not control for victimization (Singh, 1989; Oster, 1980; Garrett and
Toumanoff, 2010; Ayres et al., 2013). Thus, it is unsurprising that Garrett and Toumanoff
(2010) find that the literature is divided on how demographics such as age, income, ed-
ucation, and race affect the likelihood of consumer complaint. Hirschman (1970)’s major
question was how market structure affected the likelihood that consumers used voice, as
opposed to exit; Gans et al. (2017) build a model based on Hirschman’s work that predicts
more complaints in more concentrated markets, and find evidence for the model’s predictions
using tweets to US airlines.
In addition, a more recent literature has examined consumer’s reviews on online plat-
forms. Two recent papers focus on accounting for selection in negative reviews. Nosko and
Tadelis (2015) show that buyers on eBay typically do not post negative reviews, and that
a measure of seller quality based on the fraction of purchases with a review can help to
promote higher quality sellers. Fradkin et al. (2017) show that negative experiences are
underreported on AirBnB, and that either paying consumers to review or having sellers and
buyers simultaneously review can reduce this underreporting.2
The paper proceeds as follows. Section 2 details the legal cases and demographics used in
this paper, while Section 3 shows how the demographics of complaining consumers compare
to victims. Section 4 tests explanations for why victims from heavily minority areas are
less likely to complain than victims from other areas. Section 5 provides a solution to the
problem of self-selection through weighting. Section 6 then concludes.
2In addition, Mayzlin et al. (2014) show evidence of strategic reviewing behavior, as firms place negativereviews of their competitors. Dai et al. (2014) examine how to construct an optimal quality ranking whenreviewers vary in the bias and precision of their reviews. Hu et al. (2008) and Ghose and Ipeirotis (2011)examine how the characteristics of reviews and reviewers affect consumer demand.
6
2 Data
The foundation of this paper is a set of legal cases for which I have data on affected consumers
from consumer databases of the company together with complaints for the same company,
and for which I can match consumers to area demographics at the zip code level. Below, I
detail the Census demographics and legal cases that I use in the analysis.
2.1 Census Demographics
For demographics, I use information at the 5 digit zip code level from the 2008-2012 American
Community Survey (ACS).
I examine several demographic factors that likely proxy for cultural and economic factors
that could affect the likelihood that a consumer complains. I first include ethnic demograph-
ics, including the fraction of the zip code population that is black, that is of Hispanic origin,
and that is Asian. I also include the percentage of the zip code located in an urban area.
Second, I use information on the economic and family situation of the zip code, including
the median household income, median household size, median age, the unemployment rate,
and the fraction of the zip code population that is college educated. These factors could affect
complaining for several reasons. First, filing a complaint takes time, and so consumers with
a higher cost of time – such as those with a higher income, who are employed, or who have
kids – might be less likely to complain. On the other hand, poorer consumers may have more
pressing concerns, such as food, housing, or safety, than consumer fraud. Another reason
for different complaint rates could be knowledge of the appropriate authorities to complain
7

to; college educated consumers might be more likely to be informed about authorities that
receive consumer complaints and seek to remedy problems.3
I exclude zip codes belonging to PO Boxes and Unique Organizations (such as businesses
or universities that have their own zip code) and zip codes with a population of less than
100 in 2010.4 I also exclude zip codes missing the Census demographic variables described
above. This process leaves a set of 28,604 zip codes that I use for my main analyses.
2.2 Legal Cases
I match these zip code level demographics to data from nine legal cases. For each case,
I have data from consumer databases detailing the victims of a case as well as consumer
complaints about the companies involved in the case. In order to obtain these cases, staff
at the Federal Trade Commission undertook a search of recent cases involving violations of
consumer protection laws.5 In order to be included in the paper, a given case had to have
data from a customer database as well as a list of consumer complaints. In order to have
power for statistical analysis, I require that there exist at least 150 consumer complaints
on the company. In addition, the litigation with the company must have been completed
(all defendants either settled, or a final judgment was entered), and there must be no legal
restrictions barring the use of the data. This process led to nine legal cases to use in the
analysis.
Consumer complaints come from the Consumer Sentinel Network, which collects data on
3In Appendix B, I provide greater detail about the distribution of each of these variables.4The Census has created the Zip Code Tabulation Area (ZCTA) in order to connect Census demographics
to zip codes from addresses, because the zip code is not a traditional Census geography. The boundariesof zip codes and ZCTAs do not always perfectly line up, so I exclude zip codes for PO Boxes and UniqueOrganizations in order to reduce differences between the two.
5I am able to access the data used in this paper as part of my duties as an employee of the FTC.
8
consumer complaints from several sources – federal government agencies such as the Federal
Trade Commission (FTC) and Consumer Finance Protection Bureau (CFPB), private actors
such as the Better Business Bureaus (BBBs), and state and local government agencies.6 For
each legal case, I obtain complaints either by direct searches of Consumer Sentinel using
company names, or from the set of complaints used by law enforcement authorities as part
of the case.7 I only include victims and complaints which report a zip code that can be
matched to the set of zip codes I detail in Section 2.1.
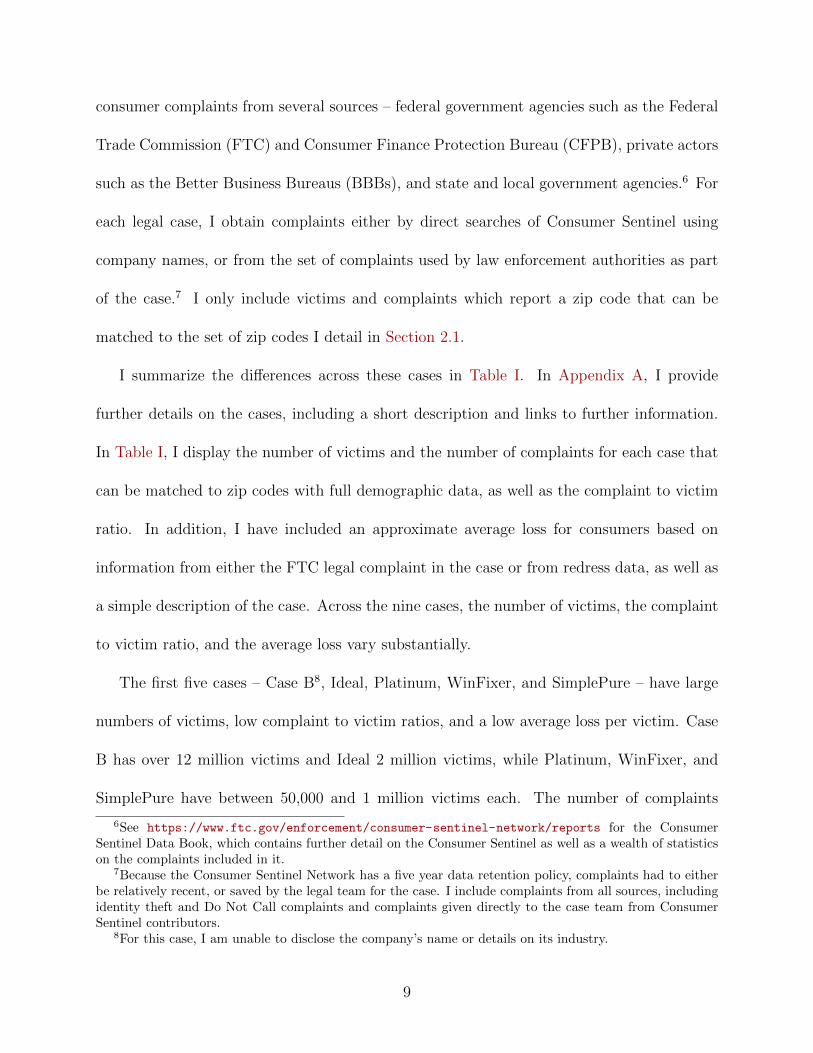
I summarize the differences across these cases in Table I. In Appendix A, I provide
further details on the cases, including a short description and links to further information.
In Table I, I display the number of victims and the number of complaints for each case that
can be matched to zip codes with full demographic data, as well as the complaint to victim
ratio. In addition, I have included an approximate average loss for consumers based on
information from either the FTC legal complaint in the case or from redress data, as well as
a simple description of the case. Across the nine cases, the number of victims, the complaint
to victim ratio, and the average loss vary substantially.
The first five cases – Case B8, Ideal, Platinum, WinFixer, and SimplePure – have large
numbers of victims, low complaint to victim ratios, and a low average loss per victim. Case
B has over 12 million victims and Ideal 2 million victims, while Platinum, WinFixer, and
SimplePure have between 50,000 and 1 million victims each. The number of complaints
6See https://www.ftc.gov/enforcement/consumer-sentinel-network/reports for the ConsumerSentinel Data Book, which contains further detail on the Consumer Sentinel as well as a wealth of statisticson the complaints included in it.
7Because the Consumer Sentinel Network has a five year data retention policy, complaints had to eitherbe relatively recent, or saved by the legal team for the case. I include complaints from all sources, includingidentity theft and Do Not Call complaints and complaints given directly to the case team from ConsumerSentinel contributors.
8For this case, I am unable to disclose the company’s name or details on its industry.
9

ranges from 0.35 and 7.3 complaints per 1,000 victims across cases, while the average victim
loss for these cases ranges roughly between $30 and $110.
The second four cases – AdvStrategy, Guidance, MoneyNow, and PHLG – each have
a much smaller number of victims, a much higher complaint to victim ratio, and a large
average loss per victim. The number of victims across cases ranges between 1,800 and 7,000
victims. The number of complaints ranges between 25 and 150 complaints per 1,000 victims,
while the average loss per victim is about $500 in the PHLG case, and over $2,000 in the
other three cases.
Beyond these massive differences in the number of victims, the complaint to victim ratio,
and average loss per victim, the different cases reflect a wide variety of different alleged
fraudulent activity. The Ideal and Platinum cases are based on defrauding victims who filed
payday loan applications, the WinFixer case is about spyware and computer security scans,
and SimplePure about advertising and purchasing herbal supplements. Guidance, Mon-
eyNow, and AdvStrategy are all cases involving business opportunities or business coaching,
while PHLG involves the money transfer element of imposter scams.
3 Are the Demographics of Complainants and Victims
Different?
In this section, I first show that controls for victimization are necessary because victim
demographics vary substantially across the different cases. I then use the set of legal cases
to show how the demographics of complainants differ from those of victims, and find that
10
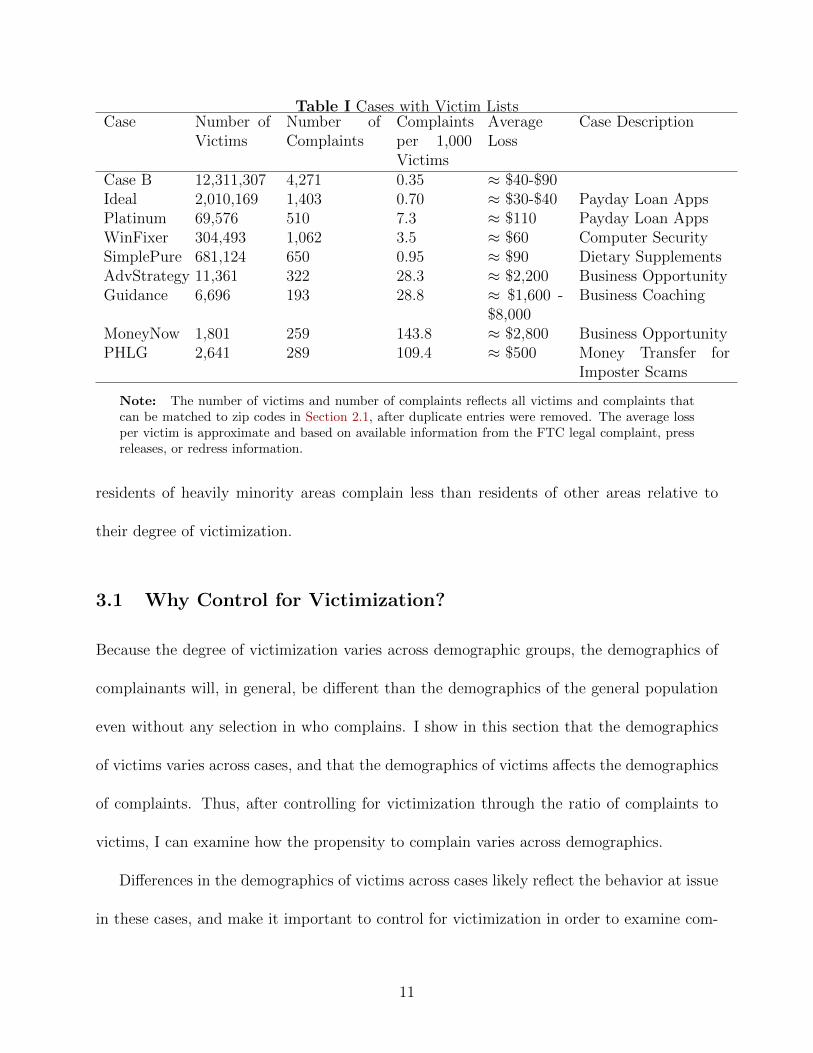
Table I Cases with Victim ListsCase Number of
VictimsNumber ofComplaints
Complaintsper 1,000Victims
AverageLoss
Case Description
Case B 12,311,307 4,271 0.35 ≈ $40-$90Ideal 2,010,169 1,403 0.70 ≈ $30-$40 Payday Loan AppsPlatinum 69,576 510 7.3 ≈ $110 Payday Loan AppsWinFixer 304,493 1,062 3.5 ≈ $60 Computer SecuritySimplePure 681,124 650 0.95 ≈ $90 Dietary SupplementsAdvStrategy 11,361 322 28.3 ≈ $2,200 Business OpportunityGuidance 6,696 193 28.8 ≈ $1,600 -
$8,000Business Coaching
MoneyNow 1,801 259 143.8 ≈ $2,800 Business OpportunityPHLG 2,641 289 109.4 ≈ $500 Money Transfer for
Imposter Scams
Note: The number of victims and number of complaints reflects all victims and complaints thatcan be matched to zip codes in Section 2.1, after duplicate entries were removed. The average lossper victim is approximate and based on available information from the FTC legal complaint, pressreleases, or redress information.
residents of heavily minority areas complain less than residents of other areas relative to
their degree of victimization.
3.1 Why Control for Victimization?
Because the degree of victimization varies across demographic groups, the demographics of
complainants will, in general, be different than the demographics of the general population
even without any selection in who complains. I show in this section that the demographics
of victims varies across cases, and that the demographics of victims affects the demographics
of complaints. Thus, after controlling for victimization through the ratio of complaints to
victims, I can examine how the propensity to complain varies across demographics.
Differences in the demographics of victims across cases likely reflect the behavior at issue
in these cases, and make it important to control for victimization in order to examine com-
11

plaining behavior. For example, victims in the Ideal and Platinum cases applied for payday
loans, victims in the MoneyNow, Guidance, and AdvStrategy cases wanted to create their
own business, victims in the WinFixer case had to have computers in order to have spyware,
and victims in the SimplePure case were interested in purchasing dietary supplements.
In Figure 1, I demonstrate these differences by showing the per capita victim rate from
majority black zip codes across the legal cases. I define the victim rate as the number of
victims in a zip code divided by the 2010 Census population. Since the absolute number
of victims varies widely across cases, I normalize the victim rate in majority black areas
by dividing by the overall average victim rate for the case; in both cases, I weight across
zip codes using population weights. A value of one thus indicates that majority black zip
codes have the same per capita victim rate as the average across all zip codes. Bars in black
represent the normalized victim rate for zip codes with a greater than 50% black population.
Four cases have a substantially larger per capita victim rate from majority black zip codes
relative to national averages. The per capita victim rate in majority black zip codes is 50%
higher than national averages for Case B, 120% higher for PHLG, 162% higher for Ideal,
and 185% higher for Platinum. In the SimplePure, WinFixer, AdvStrategy, and MoneyNow
cases, the per capita victim rate from majority black zip codes is similar to national averages.
The per capita victim rate in majority black zip codes is 22% lower for Guidance.
These differences in victim rates also affect per capita complaint rates. The grey bars in
Figure 1 represent the average normalized complaint rate for zip codes with a greater than
50% black population. I define the complaint rate in the same way as the victim rate. The
complaint rate is the the number of complaints in a zip code divided by the 2010 Census
population; I normalize by dividing by the overall average complaint rate in the case and use
12
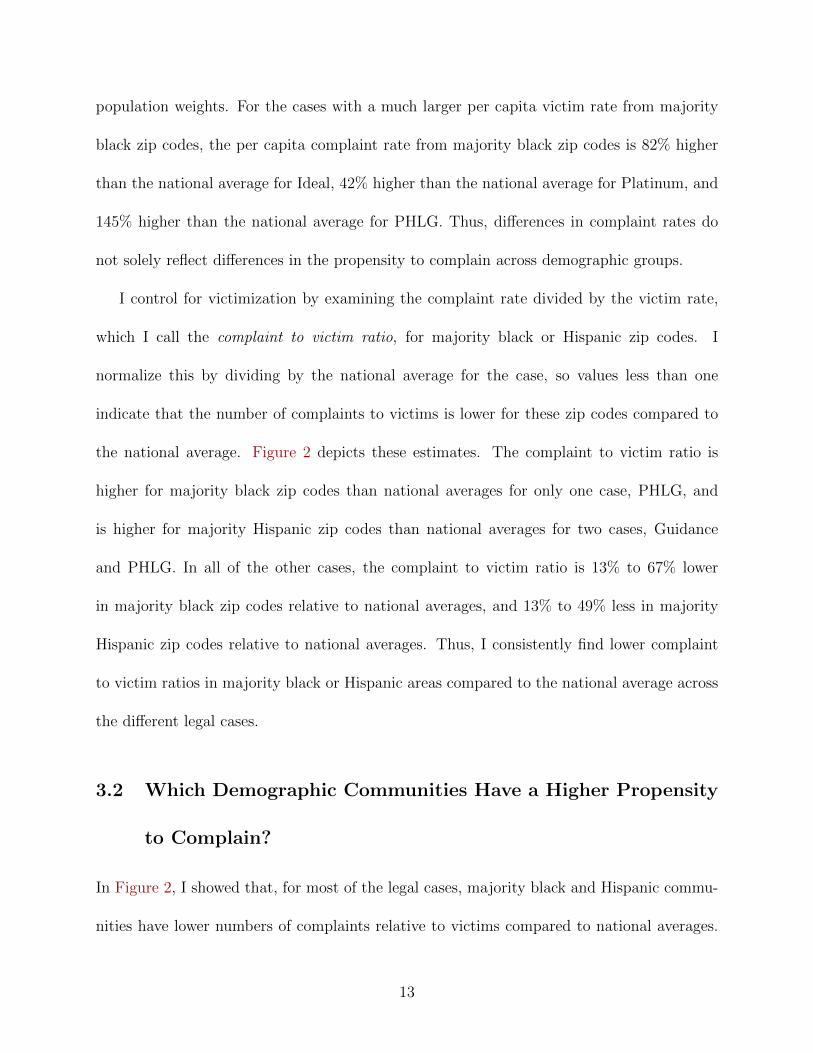
population weights. For the cases with a much larger per capita victim rate from majority
black zip codes, the per capita complaint rate from majority black zip codes is 82% higher
than the national average for Ideal, 42% higher than the national average for Platinum, and
145% higher than the national average for PHLG. Thus, differences in complaint rates do
not solely reflect differences in the propensity to complain across demographic groups.
I control for victimization by examining the complaint rate divided by the victim rate,
which I call the complaint to victim ratio, for majority black or Hispanic zip codes. I
normalize this by dividing by the national average for the case, so values less than one
indicate that the number of complaints to victims is lower for these zip codes compared to
the national average. Figure 2 depicts these estimates. The complaint to victim ratio is
higher for majority black zip codes than national averages for only one case, PHLG, and
is higher for majority Hispanic zip codes than national averages for two cases, Guidance
and PHLG. In all of the other cases, the complaint to victim ratio is 13% to 67% lower
in majority black zip codes relative to national averages, and 13% to 49% less in majority
Hispanic zip codes relative to national averages. Thus, I consistently find lower complaint
to victim ratios in majority black or Hispanic areas compared to the national average across
the different legal cases.
3.2 Which Demographic Communities Have a Higher Propensity
to Complain?
In Figure 2, I showed that, for most of the legal cases, majority black and Hispanic commu-
nities have lower numbers of complaints relative to victims compared to national averages.
13
PHLG
MoneyNow
Guidance
AdvStrategy
SimplePure
WinFixer
Platinum
Ideal
Case B
0 1 2Normalized Rate
Complaint Rate Victim Rate
Figure 1 Victim and Complaint Rate for Majority Black Zip Codes, Relative to NationalAverages, Across Cases
Note: The graph depicts the victim rate (in black) and complaint rate (in grey) for majority blackzip codes, for each of the nine legal cases, relative to the corresponding national average (wherethe national average is the population weighted average across zip codes). The blue vertical lineindicates a value of one, so majority black zip codes have the same complaint or victim rate as thenational average.
14

PHLG
MoneyNow
Guidance
AdvStrategy
SimplePure
WinFixer
Platinum
Ideal
Case B
0.0 0.5 1.0Normalized Rate
Percent Black Percent Hispanic
Figure 2 Complaint to Victim Ratio for Majority Black and Hispanic Zip Codes, Relativeto National Averages, Across Cases
Note: The graph depicts the complaint to victim ratio, the complaint rate divided by the victimrate, from majority black zip codes (in black) and majority Hispanic zip codes (in grey), for each ofthe nine legal cases, relative to the national average in the same case (where the national average isthe population weighted average across zip codes). The blue vertical line indicates a value of one,so majority black or Hispanic zip codes have the same ratio of complaint rate to victim rate as thenational average.
15

However, any differences in complaining behavior could be due to other factors, such as
differences in income and education across communities. Thus, I now examine all of the
demographic characteristics in Section 2.1, and show that heavily black and Hispanic com-
munities continue to have less complaints relative to their victimization rates compared to
non-minority communities, after controlling for other demographic characteristics.
I do so by jointly modeling the per capita complaint rate and per capita victim rate for
each company at the zip code level. I identify differences in complaining behavior across
communities through the differential effect of demographics on the complaint rate relative
to the victim rate. In order to estimate this specification, I first construct a dataset with
two observations for each zip code-company combination, the per capita complaint rate and
victim rate. I include all 28,604 zip codes detailed in Section 2.1 for all nine companies. I
then estimate the following panel logit model:
y∗ijk =∑s
(βjs + γks)Dis + δjk + ηj log(Popi) + ρi + εijk. (1)
In the equation above, i represents zip code, j whether the observation reflects a complaint
rate or victim rate, and k represents company. The dependent variable y∗ijk is a latent variable
for the complaint rate or victim rate. I include all the demographic variables mentioned
in Section 2.1 in Dis. The variables included are the percentage of black residents, the
percentage of Hispanic residents, the percentage of Asian residents, the percentage of urban
residents, the local unemployment rate, the percentage of college graduates, as well as, in
logarithmic form, the median age, median household income, and median household size.
My main goal is to understand how the complaint rate and victim rate vary with de-
16
mographics; βjs allow each demographic variable Dis to separately affect the complaint rate
and the victim rate. Since the complaint to victim ratio is the ratio of the complaint rate
and victim rate, the difference βCs − βV
s indicates how demographics affect the complaint to
victim ratio.9
The effect of demographics can vary by company as well, in order to capture the differ-
ences shown in the previous subsection, through γks. I also allow the complaint rate and
victim rate to differ by company through δjk. Finally, ηj allow the zip code’s population to
affect the complaint rate and the victim rate. I also include zip code random effects in ρi. All
observations are weighted using 2010 Census population weights. The coefficients from this
regression, and all other models estimated in this paper, are detailed in Web Appendix D.10
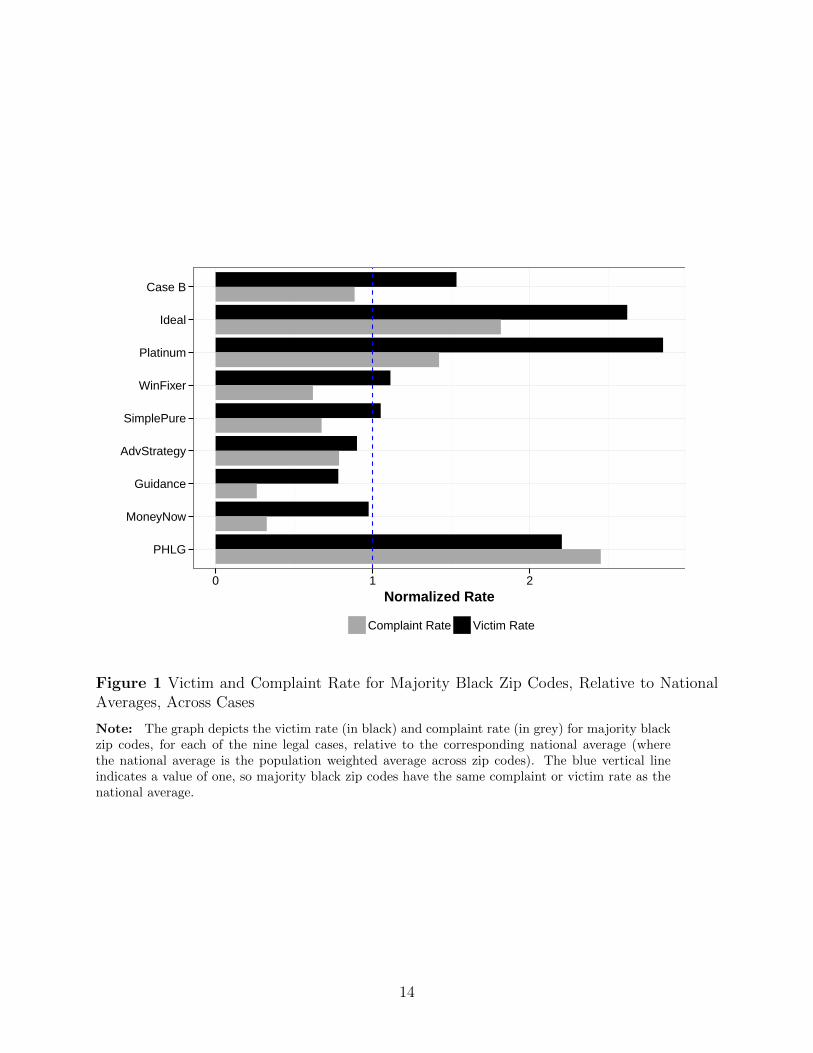
In Figure 3, I depict the estimated percent change in the complaint to victim ratio
from changing each of the demographic factors. The y-axis indexes a change in each of the
demographic factors. For each such factor, I plot the mean effect and the confidence interval
around that mean. A null effect indicates that changing a demographic factor affects the
victim rate and complaint rate symmetrically, after controlling for all other demographic
variables, and so the complaint to victim ratio remains constant.
Residents of heavily minority communities have much lower numbers of complaints rel-
9Formally, for complaint rate rCi and victim rate rVi in zip code i, the change in the complaint to victim
ratiorCirVi
from a change in demographic factor Dis from X to Y is:
rCi (Dis = Y )
rVi (Dis = Y )/rCi (Dis = X)
rVi (Dis = X)=rCi (Dis = Y )
rCi (Dis = X)/rVi (Dis = Y )
rVi (Dis = X)=
exp(βCs (Y −X))
exp(βVs (Y −X))
= exp((βCs − βV
s )(Y −X)).
10I also include a robustness analysis using discretized demographic variables in Web Appendix C. Icontinue to find lower complaint to victim ratios in heavily minority communities compared to non-minoritycommunities using discretized demographic variables, although the effects for the percentage of Hispanicresidents are more nonlinear.
17

●
●
●
●
●
●
●
●
●
1 pp Inc Unemp Rate
100% Inc Median HH Size
0% to 100% Pct Urban
100% Inc Median Age
100% Inc Median HH Income
0% to 100% Pct College
0% to 100% Pct Asian
0% to 100% Pct Hispanic
0% to 100% Pct Black
−40 0 40 80 120Percent Change
Figure 3 Percent Change in Complaint to Victim Ratio by Demographic Factors
Note: The graph depicts the estimated percent change in the complaint to victim ratio (thecomplaint rate divided by the victim rate) for changes in different demographic factors, as well asthe associated 95% confidence interval. The blue, dashed vertical line indicates a value of zero, sochanging the demographic factor does not differentially affect the complaint rate and victim rateand so the complaint to victim ratio is constant.
18

ative to victims. The complaint to victim ratio falls by 61% as the percentage of black
residents in the zip code increases from 0% to 100%, and by 43% as the percentage of
Hispanic residents in the zip code increases from 0% to 100%. The associated confidence
intervals imply selection effects for complaining that are greater than 25%.
I find smaller selection effects for the other demographic variables. The estimates indicate
that the complaint to victim ratio rises by 31% with a 100% increase in median income, falls
by 31% with the percentage of the zip code that is urban rising from 0% to 100%, and rises
by 4% with a 1 percentage point increase in the local unemployment rate. The confidence
intervals for these effects exclude zero. In addition, the complaint to victim ratio falls by
33% with a 100% increase in median household size, rises by 10% as the percent of residents
with a college education increases from 0 to 100%, and falls by 4% with a 100% increase in
the median age, although I cannot reject null effects for these variables.
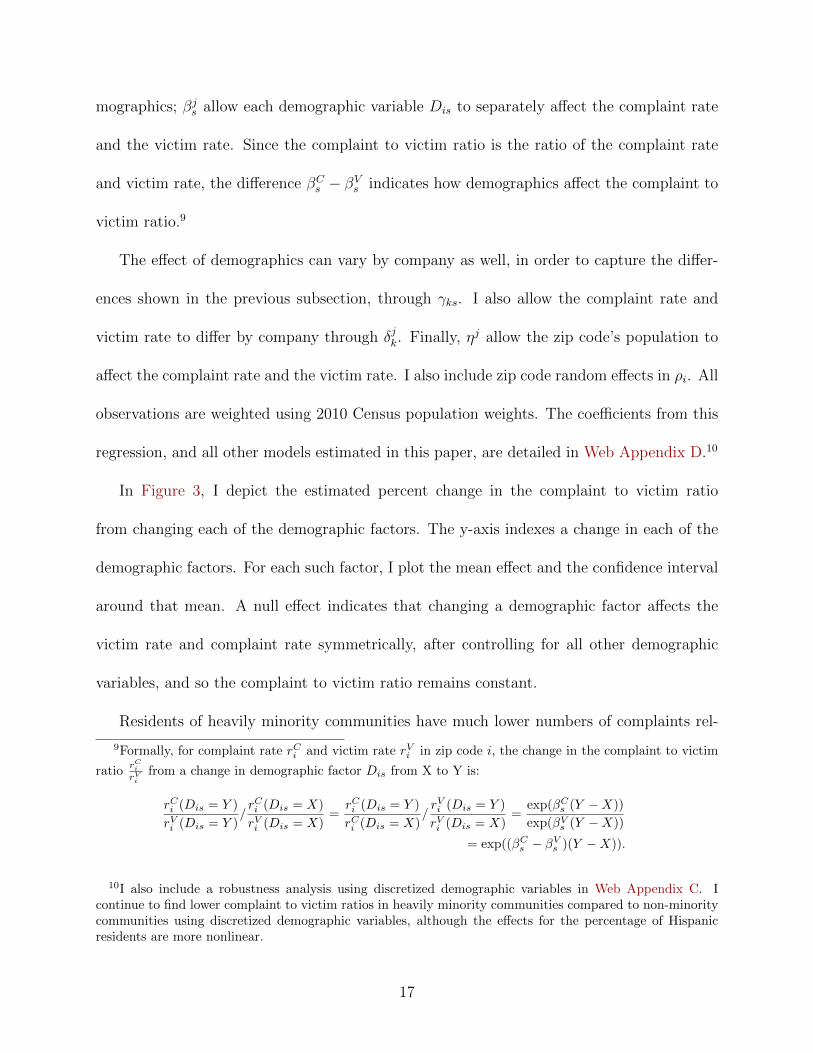
I examine the robustness of the main finding of lower numbers of complaints relative
to victims as the fraction of minority residents rises by estimating equation (1) for each
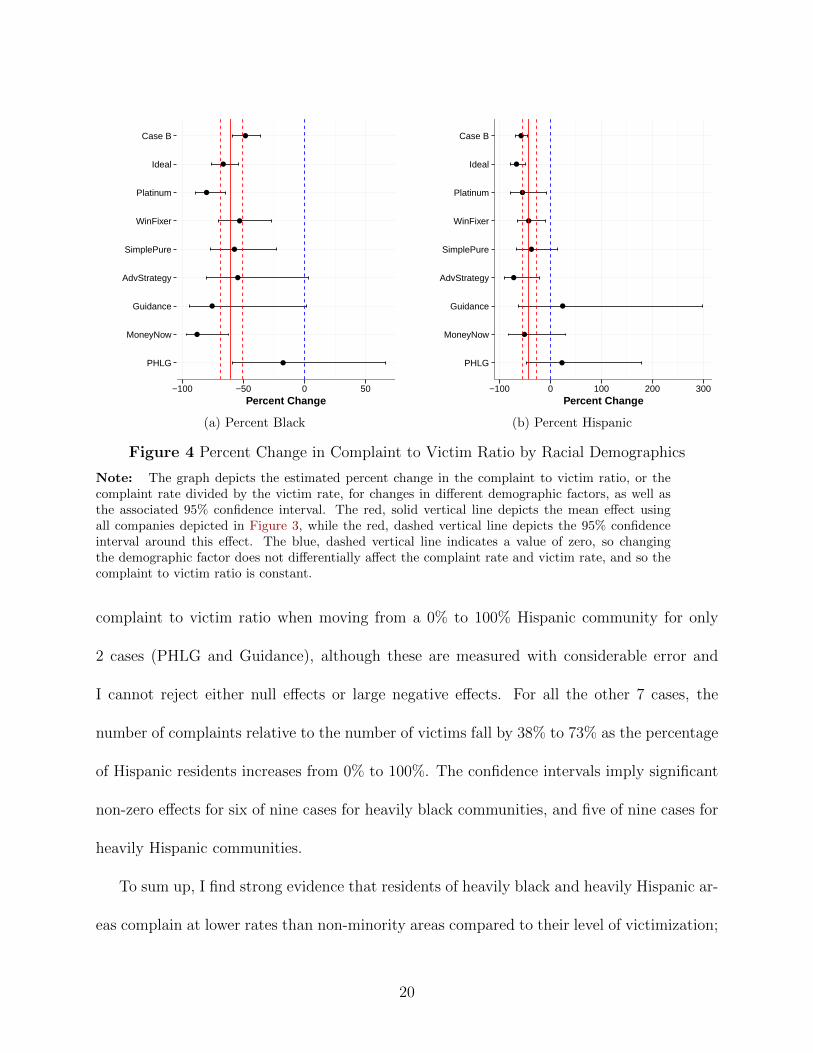
company individually.11 In Figure 4, I depict the effects across cases; the y-axis indexes
different cases, and the red solid and dashed vertical lines depict the estimated effect and
confidence interval using all companies. For the percentage of black residents, I find a small
(18%) and insignificant reduction in the complaint to victim ratio when moving from a 0%
to 100% black community for only one case (PHLG). For all the other 8 cases, the estimates
indicate a 49% to 88% reduction in the number of complaints relative to the number of
victims as the percentage of black residents increases from 0% to 100%.
For the percentage of Hispanic residents, I estimate small (22 to 23%) increases in the
11In these specifications, I exclude random effects.
19
●
●
●
●
●
●
●
●
●
PHLG
MoneyNow
Guidance
AdvStrategy
SimplePure
WinFixer
Platinum
Ideal
Case B
−100 −50 0 50Percent Change
(a) Percent Black
●
●
●
●
●
●
●
●
●
PHLG
MoneyNow
Guidance
AdvStrategy
SimplePure
WinFixer
Platinum
Ideal
Case B
−100 0 100 200 300Percent Change
(b) Percent Hispanic
Figure 4 Percent Change in Complaint to Victim Ratio by Racial Demographics
Note: The graph depicts the estimated percent change in the complaint to victim ratio, or thecomplaint rate divided by the victim rate, for changes in different demographic factors, as well asthe associated 95% confidence interval. The red, solid vertical line depicts the mean effect usingall companies depicted in Figure 3, while the red, dashed vertical line depicts the 95% confidenceinterval around this effect. The blue, dashed vertical line indicates a value of zero, so changingthe demographic factor does not differentially affect the complaint rate and victim rate, and so thecomplaint to victim ratio is constant.
complaint to victim ratio when moving from a 0% to 100% Hispanic community for only
2 cases (PHLG and Guidance), although these are measured with considerable error and
I cannot reject either null effects or large negative effects. For all the other 7 cases, the
number of complaints relative to the number of victims fall by 38% to 73% as the percentage
of Hispanic residents increases from 0% to 100%. The confidence intervals imply significant
non-zero effects for six of nine cases for heavily black communities, and five of nine cases for
heavily Hispanic communities.
To sum up, I find strong evidence that residents of heavily black and heavily Hispanic ar-
eas complain at lower rates than non-minority areas compared to their level of victimization;
20

these effects are consistent across cases and are generally statistically significant.
4 Why Do Victims From Heavily Minority Areas Com-
plain at Lower Rates?
In the previous section, I demonstrated that residents of heavily minority areas have lower
complaint rates than residents of other areas relative to their rate of victimization. In this
section, I examine potential explanations for this finding based on information or social
trust. I do not find evidence for explanations based on differences in information, or based
on mistrust of government. I do find limited evidence that differences in social trust based on
alienation from society could explain a lower propensity to complain for residents of minority
areas.
4.1 Information
Differences in a consumer’s information set can affect complaining behavior in two major
ways. First, consumers may not know that they have been defrauded. Take for example,
the Ideal case, in which Ideal bought payday loan application details and charged consumers
without providing any service. Consumers may not have checked their bank statements and
seen the payment to Ideal Financial, or may not have realized that they never received any
services from Ideal. Second, some consumers may not know who to complain to, or how to
complain. They may thus only complain to the company involved, and not to the BBBs or
consumer protection agencies.
21

I examine both of these explanations by using the variation across cases in the average
amount of loss. I compare the five cases with an average amount of loss between $30 and
$110 – Case B, Ideal, WinFixer, Platinum, and SimplePure – to the three cases with an
average loss above $2,000 – Guidance, AdvStrategy, and MoneyNow.12 All three of the latter
cases were business opportunity or business coaching cases where victims never received the
promised business opportunity. With an average loss an order of magnitude larger than the
first five cases, victims will almost certainly know they were victimized. In addition, given
the large loss they suffered, victims would likely be willing to spend time to research who
they should complain to in order to recoup their losses, if their reason for not complaining
was they did not know who to complain to. With a small loss, it may not be worth the
time or effort to find out who to complain to. As Table I shows, the aggregate complaint to
victim ratios are one to two orders of magnitude higher on average for the large loss cases
than for the small loss cases.
I estimate equation (1) separately for the large loss and small loss cases, and depict the
percent change in the complaint to victim ratio for percent black and percent Hispanic in
the first two rows of Figure 5. Black circles depict the percent change from an increase
in the fraction of black residents from 0% to 100%, and grey triangles the percent change
from an increase in the fraction of Hispanic residents from 0% to 100%. Heavily minority
communities have lower complaint rates, relative to their rate of victimization, for both large
loss and small loss cases. The complaint to victim ratio falls by 52% as the share of black
residents increases from 0% to 100% using the small loss cases, compared to 80% for the
12I exclude the PHLG case, as its loss value was intermediate at about $500, and because 90% of complaintswere to Western Union or MoneyGram (because these companies sent payments in the case) rather than theBBBs or government entities.
22

large loss cases. The complaint to victim ratio falls by 76% as the share of Hispanic residents
increases from 0% to 100% using the small loss cases, compared to 47% for the large loss
cases. Thus, the selection effects are substantial, and statistically significant, for both small
loss and large loss cases for both the percentage of blacks and Hispanics.
4.2 Alienation, Trust, and Social Capital
Another potential explanation for lower complaint rates in heavily minority communities
is that residents of those communities are alienated from mainstream institutions, or from
society more generally. For example, Orlena Blanchard, speaking about her experience in
marketing to black communities at the 2016 FTC Changing Demographics workshop13, noted
that:
[Y]ou’re wondering why you don’t get a lot of reporting from the African Amer-
ican community, or it doesn’t compare in terms of reporting fraud or anything
like that, you have to wonder why. And you have to look very deeply into sort
of the lifestyle and experience and cultural identity as to why ... And thinking
about really trust issues and consideration for government agencies and where
they see themselves in terms of having an equal place in society as citizens. ...
When picking up the phone to report or considering that they have just as much
right to report an issue and feel that they’re going to get an equal response that
any other citizen would get. This is a really important consideration for this
particular group.
13See https://www.ftc.gov/news-events/events-calendar/2016/12/changing-consumer-
demographics for videos and transcripts.
23

●
●
●
●
●
●
BBB, Ideal
Govt, Ideal
BBB
Govt
Large Loss
Small Loss
−75 −50 −25 0Percent Change
● Percent Black Percent Hispanic
Figure 5 Percent Change in Complaint to Victim Ratio by Demographic Factors
Note: The graph depicts the percent change in the complaint to victim ratio for percentage ofblack residents (in black circles) and Hispanic residents (in grey triangles) across different spec-ifications. The first row represents estimates for the small loss cases (combining Case B, Ideal,WinFixer, Platinum and SimplePure), while the second row represents estimates for the large losscases (combining Guidance, AdvStrategy, and MoneyNow). The third row represents estimates us-ing only government complaints, and fourth row only BBB complaints, for all cases except PHLGand WinFixer. The fifth row represents estimates using only government complaints, and sixth rowonly BBB complaints, for the Ideal case. The blue, dashed vertical line indicates a value of zero,so changing the demographic factor does not differentially affect the complaint rate and victim rateand so the complaint to victim ratio is constant.
24

Considerable qualitative and quantitative evidence indicates that members of minority
groups have lower levels of trust than whites. The General Social Survey (GSS) regularly
asks a question on trust: “Generally speaking, would you say that most people can be
trusted or that you can’t be too careful in dealing with people?” This measure has become
a standard measure of trust, and is known to be lower for blacks relative to whites (Alesina
and La Ferrara, 2002; Brehm and Rahn, 1997; Glaeser et al., 2000; Putnam, 2001). In the
first three rows of Table II, I report the proportion of people that say that one “can trust”
by race and ethnicity using data from 2000 and after, as well as related questions that ask
whether people would try to be fair, or try to take advantage (“Fairness”) and whether
people usually try to be helpful, or are mostly looking out for themselves (“Helpfulness”).
For all three questions, there is a substantial racial gap, with blacks and Hispanics having
much lower levels of trust than non-Hispanic whites. For example, 39% of whites say that
one usually can trust people, compared to 16% of blacks and 17% of Hispanics. For fairness,
57% of whites think that people are generally fair and 50% that they are generally helpful,
compared to 33% and 39% for blacks and 36% and 32% for Hispanics. These racial gaps
in trust survive extensive controls; for example, Alesina and La Ferrara (2002) report a 24
to 26 percentage point gap between whites and blacks on trust after controlling for income,
education, sex, age, marital status, and religion, among other covariates.
The qualitative literature in sociology and marketing has also found evidence that mem-
bers of minority groups experience more alienation from society, and have less trust. An-
derson (2000), examining poor black communities in North Philadelphia, contrasts between
“decent” families, who adopt more mainstream values, and “street” families who adopt an
“oppositional culture [that] is a product of alienation”. This alienation may be due to lower
25

Table II Beliefs on Trust from the General Social Survey by Race and Ethnicity
Variable Non-Hispanic White Non-Hispanic Black Hispanic
Trust 0.39 0.16 0.17(0.005) (0.008) (0.009)
Fairness 0.57 0.33 0.39(0.005) (0.011) (0.012)
Helpfulness 0.50 0.36 0.32(0.005) (0.011) (0.012)
Trust in Govt Admins 0.24 0.26 0.31(0.009) (0.019) (0.02)
Trust People in Govt 0.24 0.25 0.30(0.008) (0.018) (0.02)
Note: All variables are from the General Social Survey (GSS). Trust is defined asindividuals saying they “can trust” people for the trust variable, fairness that peopleare generally fair using the fairness variable, and helpfulness that people mostly tryto be helpful using the helpful variable. Trust in government administrators is definedas individuals saying they strongly agree or agree that most government administatorscan be trusted to do what is best for the country using the poleff17 variable, and trustpeople in government is defined as people saying strongly agree or agree that most ofthe time we can trust people in government using the govdook variable. Trust, fairness,and helpfulness are using all GSS years between 2000 and 2016; trust in governmentadministrators is based on the 2006, 2012, and 2016 GSS years and trust people ingovernment is based on the 2004, 2010, and 2014 GSS years. Estimates take intoaccount sample weights, and standard errors are in parentheses.
26

self-efficacy (Bandura, 1977), where minorities do not believe they can succesfully navigate
mainstream institutions, or learned helplessness (Seligman, 1975), in which past negative
experiences have left minorities to conclude that engaging with mainstream institutions is
fruitless. For examples of both of these channels, Bone et al. (2014) report that minori-
ties seeking business financing are less likely than whites to receive information on loan
terms, more likely to be asked for documentation and financial statements, more likely to
see obtaining financing as an uphill journey in which they are in a subservient position, and
more likely to experience rejection negatively if they are primed to think about race. Such
alienation does not have to be associated with members of minority groups; for example,
MacLeod (2018) follows a set of low income white friends who are extremely alienated from
mainstream values and society, and a set of low income black friends who are not. However,
such alienation is likely more prevalent in minority communities.
The lack of trust documented above could also lead minorities to feel that victimization
is “normal” and so their own fault for being too trusting, rather than abnormal and worth
correcting by complaining to the authorities. For example, Anderson (2000) describes the
alienated worldview of the most extreme of street families as:
Highly alienated and embittered, they exude generalized contempt for the wider
scheme of things and for a system they are sure has nothing but contempt for
them. ... For them, people and situations are best approached both as objects
of exploitation and as challenges possibly “having a trick to them”, and in most
situations their goal is to avoid being “caught up in the trick bag.” Theirs is a
cynical outlook, and trust of others is severely lacking, even trust of those they
27

are close to.
I examine multiple different channels through which a lack of trust could affect complaint
rates. First, members of minority groups may mistrust the government in the sense that
government officials will misuse information given to them or will not do the best they can.
Second, they may feel that sending a complaint may not make a difference, either because
it is not possible to improve things or that their complaint will benefit a society which they
feel excluded from. I find evidence against the first explanation of governmental mistrust.
4.2.1 Mistrust of Government
One way a lack of trust could reduce complaint rates from minority areas is that residents
of these areas mistrust the government. The GSS asks multiple questions in particular
years about mistrust of government officials; one question asks whether most government
administrators can be trusted to do what is best for the country, while another asks whether
most of the time we can trust people in government. Blacks and Hispanics are more likely
to express trust in government administrators or trust in people in government. In the last
two rows of Table II, I report the proportion of people that agree or strongly agree to these
questions by race and ethnicity. 26% of blacks and 31% of Hispanics agree or strongly agree
that one can trust government administrators, and 25% of blacks and 30% of Hispanics agree
or strongly agree that one can trust people in government, compared to 24% for whites for
both questions.14 The lack of a racial gap for questions specifically on trust in government
cast some doubt that mistrust of government can explain lower complaint to victim ratios
14Answers to these questions may be influenced by the party in power in Washington, but Alesina andLa Ferrara (2002) report much smaller racial gaps for similar questions on confidence in government entitiesthan they find for trust over a much different sample period.
28
in minority areas.
Another way to test this explanation by examining which organizations complainants
complain to. If mistrust of government is the reason for lower complaint rates relative to
victim rates in minority areas, one would expect less selection in complaining to the non-
governmental BBBs than to government sources.15 I test this proposition using data from
7 cases for which I can identify the source of the complaint for all complaints.16 For these
cases, examining only government or BBB complaints, government complaints are 55% of
complaints for AdvStrategy, 4% for Case B, 59% for Guidance, 54% for Ideal, 85% for
MoneyNow, 46% for Platinum, and 79% for SimplePure.
I then estimate equation (1) separately using only BBB complaint rates or only gov-
ernment complaint rates, after excluding the PHLG and WinFixer cases. In the third and
fourth rows of Figure 5, I depict the change in the complaint to victim ratio for government
complaints compared to BBB complaints. I find similar selection in complaints received by
both groups. The complaint to victim ratio falls by 82% for government complaints, com-
pared to 51% for BBB complaints, as the percent of black residents rises from 0% to 100%,
and falls by 58% for government complaints, compared to 71% for BBB complaints, as the
percentage of Hispanic residents rises from 0% to 100%.
The share of government complaints can be imbalanced across cases – only 4% for Case
B, and 79% for SimplePure, for example, which could affect the estimates detailed above if
the degree of selection in complaining varies across cases. I thus also estimate equation (1)
15Of course, consumers may be mistrustful of authority in general, may believe that the BBBs are agovernment agency, or might correctly realize that information reported to the BBBs could be accessed bylaw enforcement authorities.
16The complaint source was not kept for most WinFixer complaints, while almost all complaints for thePHLG case are not to government or BBB sources.
29
using only Ideal Financial complaints, as this case both had a large number of complaints
and victims and a balanced share of government and BBB complaints. In this specification, I
again use either government complaint rates or BBB complaint rates when estimating equa-
tion (1). These results are depicted in the fifth and sixth rows of Figure 5; I continue to find
substantial selection in complaining for both BBB and government complaints. Using only
Ideal data, the complaint to victim ratio falls by 70% for goverment complaints, compared to
63% for BBB complaints, as the percent of black residents rises from 0% to 100%, and falls
by 58% for government complaints, compared to 74% for BBB complaints, as the percentage
of Hispanic residents rises from 0% to 100%. Thus, for the Ideal case, I cannot reject that
the degree of selection in complaining is the same for government and BBB complaints.
4.2.2 Interactions with Education or Income
A different channel for how lower levels of trust or social capital could affect complaining be-
havior is that residents of minority communities feel excluded from mainstream institutions,
feel that complaints will not benefit their community, or that victimization is normal and so
not worth complaining about. The sociological literature finds that such alienation is more
likely in poorer, less educated communities. For example, Anderson (2000) finds that the
share of alienated “street” families increases as the author ventures to poorer parts of the
black community in Philadelphia. Since poorer, less educated minority areas have a larger
proportion of such alienated residents, we might expect even larger declines in complaint
rates in such localities.
I test this proposition by estimating a set of interaction models. In each model, I interact
the percentage of black residents and percentage of Hispanic residents with a different variable
30
– the (logged) median household income, the percentage of residents in poverty, the share
of college educated graduates, or the average credit score. I examine credit score because
economists have viewed credit score as a measure of social capital (Bricker and Li, 2017).17 I
estimate models with interactions by reestimating equation (1) including both variables and
their interaction as part of the set of demographic variables Dis.
I present these estimates in Figure 6 by reporting the effect of changing the percentage of
black residents, or percentage of Hispanic residents, from 0% to 100% at different values of
the interaction variable. I find that the complaint rate falls relative to the victimization rate
as the percentage of minority residents rises for both low income, low education, and low
credit score areas, as well as for high income, high education, and high credit score areas. In
general, the estimates of interactions are imprecise and I cannot reject the hypothesis that the
selection effects I estimate are the same for both more disadvantaged and less disadvantaged
areas. While effects for Hispanic residents in general indicate less selection in complaining
in more advantaged areas (with the largest effect for college education), selection effects for
black residents sometimes increase when conditioning on a more advantaged area.
The complaint to victim ratio falls by 61% as the percentage of black residents in the zip
code increases from 0% to 100% for a median household income of $30,000, compared to 66%
for a median household income of $100,000. The complaint to victim ratio falls by 49% as
the percentage of Hispanic residents in the zip code increases from 0% to 100% for a median
household income of $30,000, compared to 38% for a median household income of $100,000.
For high poverty areas (30% poverty share), the complaint to victim ratio falls by 55% as
17For estimates with credit scores, I have to exclude 1,399 zip codes where I do not have credit scoreinformation.
31

the percentage of black residents rises from 0% to 100%, and by 45% as the percentage of
Hispanic residents rises from 0% to 100%. For low poverty areas (5% poverty share), the
complaint to victim ratio falls by 70% as the percentage of black residents rises from 0% to
100%, and by 34% as the percentage of Hispanic residents rises from 0% to 100%. For low
credit score areas (an average credit score of 630), the complaint to victim ratio decreases
by 60% as the percentage of black residents rises from 0% to 100%, and by 48% as the
percentage of Hispanic residents rises from 0% to 100%. For medium credit score areas (an
average credit score of 710), the complaint to victim ratio falls by 82% as the percentage of
black residents rises from 0% to 100%, and by 46% as the percentage of Hispanic residents
rises from 0% to 100%.18
The interaction with college education is the only interaction for which the selection effect
is smaller for both the percent of black residents and percentage of Hispanic residents in more
advantaged areas. At a percentage of college educated residents of 10%, the complaint to
victim ratio falls by 66% as the percentage of black residents rises from 0% to 100%, and by
53% as the percentage of Hispanic residents rises from 0% to 100%. For areas with a college
educated percentage of 60%, the complaint to victim ratio falls by 53% as the percentage of
black residents rises from 0% to 100%, and by 23% as the percentage of Hispanic residents
rises from 0% to 100%. The Hispanic selection effect is insignificantly different from zero for
areas with a college educated percentage of 60%, although it is also insignificantly different
from the effect for areas with a college educated percentage of 10%.
18In 2010, about 25% of Americans had a credit score below 650, and 53% had a credit score above 700.See https://www.sec.gov/comments/s7-14-11/s71411-316.pdf.
32

●
●
●
●
●
●
●
●
Avg Credit Score = 710
Avg Credit Score = 630
Pct College = 60%
Pct College = 10%
Pct Poor = 5%
Pct Poor = 30%
Median HH Inc = $100k
Median HH Inc = $30k
−50 0 50Percent Change
● Percent Black Percent Hispanic
Figure 6 Percent Change in Complaint to Victim Ratio by Racial Demographics, withInteractions
Note: The graph depicts the estimated percent change in the complaint to victim ratio, or thecomplaint rate divided by the victim rate, for changes in the percentage of black residents (blackcircles) or Hispanic residents (grey triangles), as well as the associated 95% confidence interval atdifferent levels of a given interaction variables. The blue, dashed vertical line indicates a value ofzero, so changing the demographic factor does not differentially affect the complaint rate and victimrate, and so the complaint to victim ratio is constant.
33

4.2.3 Hispanic Specific Explanations
For Hispanic victims specifically, language barriers or fears of immigration enforcement could
also lead to lower complaint rates. The FTC and other government agencies take complaints
in Spanish both over the phone and online, but Hispanic victims may be unaware of this fact
and so may be less likely to complain. Another specific reason for mistrust of government
could be fear that information provided to law enforcement authorities could be used for
immigration enforcement. For example, Alsan and Yang (2018) find that the takeup of
government programs such as food stamps and the Affordable Care Act decline with increases
in immigration enforcement.
I examine these concerns by interacting the percent of Hispanic residents with the per-
cent of foreign born residents, or with the percentage of residents speaking a language other
than English, with a similar specification to the interaction models described above.19 In
Figure 7, I depict these results. While the standard errors around these effects are somewhat
imprecise, I find results inconsistent with either a language barrier or immigration enforce-
ment explanation; the sign of the selection effect reverses for areas with a high proportion
of foreign born residents, or residents speaking another language. The complaint to victim
ratio falls by 57% as the percentage of Hispanic residents rises from 0% to 100% in areas
that have 10% of the population foreign born, compared to a 52% rise in areas that have
50% foreign born. Similarly, the complaint to victim ratio falls by 45% as the percentage of
Hispanic residents rises from 0% to 100% in areas that have 10% of the population speaking
19These interactions, unfortunately, may suffer from collinearity problems; the percentage of Hispanicresidents is correlated at 0.69 for percentage of foreign born residents and 0.88 for percentage of residentsspeaking another language.
34

●
●
●
●
Pct Foreign Born = 50%
Pct Foreign Born = 10%
Pct Other Lang = 50%
Pct Other Lang = 10%
−50 0 50 100 150Percent Change
Figure 7 Percent Change in the Complaint to Victim Ratio with Hispanic SpecificInteractions
Note: The graph depicts the estimated percent change in the complaint to victim ratio, or thecomplaint rate divided by the victim rate, for changes in the percentage of Hispanic residents, aswell as the associated 95% confidence interval, at different levels of a given interaction variable.The blue, dashed vertical line indicates a value of zero, so changing the demographic factor doesnot differentially affect the complaint rate and victim rate, and so the complaint to victim ratio isconstant.
another language, compared to a 20% rise in areas that have 50% of residents speaking an-
other language. These results could be consistent with an explanation of alienation, if second
or third generation Hispanics are more alienated than first generation Hispanic immigrants.
35

5 How Can One Account for Self-Selection in Com-
plaining?
The evidence above demonstrates that communities with different demographic groups com-
plain at substantially different rates relative to their degree of victimization. This type of
self-selection may distort inferences that policymakers make from complaint data. Take,
for example, a policymaker that wants to know whether victimization rates are higher in
minority communities, and uses average complaint rates as a proxy for victimization.
In Figure 8, I plot how complaint rates vary across communities with different concentra-
tions of blacks and Hispanics using all fraud-related complaints to Consumer Sentinel in 2015;
Raval (2018) provides a more detailed analysis of how aggregate complaint data varies with
demographics, and how this relationship varies by product category and data contributor.20
The black solid and grey dashed lines depict the average complaint rate for communities
defined by their share of population that is black and Hispanic, respectively. The estimates
are based upon a nonparametric loess regression, with the grey area surrounding each graph
representing the 95% confidence interval.
While the average complaint rates are not monotonic, Figure 8 demonstrates that the
average complaint rate tends to be lower in areas with a greater share of Hispanic residents.
After a small rise in complaint rates from areas that are close to 0% Hispanic to areas
that are 15% Hispanic, the complaint rate steadily falls as areas become more Hispanic.
Communities that are close to 100% Hispanic have about half the complaint rate of areas
20This analysis thus excludes identity theft and do not call complaints.
36

1
2
3
4
5
0 25 50 75 100Population Share
Com
plai
nant
s P
er 1
,000
Peo
ple
Percent Black Percent Hispanic
Figure 8 Complaint Rates For Black and Hispanic Communities in 2015
Note: The graph depicts the nonparametric loess regression of the zip code per capita complaintrate on the share of percent black or percent Hispanic in the zip code, based on all 2015 Fraud andOther complaints to Consumer Sentinel. Black solid lines reflect percent black, and grey dashedlines reflect percent Hispanic.
that are 0% Hispanic. For black communities, by contrast, the complaint rate is much more
constant with respect to the share of the population that is black. Communities that are
almost 100% black have only about a 10 percent higher complaint rate than communities
that are 10% black, and a 30 to 40 percent higher complaint rate compared to communities
that are 0% black.
A policymaker might take away from Figure 8 that victimization is lower in heavily
Hispanic areas, and only slightly higher in heavily black areas. However, the previous section
demonstrated that complaint rates can diverge substantially from victimization rates, and
victims in heavily minority areas are much less likely to complain, so one cannot simply take
37

complaints as a proxy for victimization.
One way to account for self-selection in complaints in order to reflect victimization is
through statistical weighting. Such weights would overweight complaints from groups that
complain less than their rate of victimization, relative to national averages. I construct such
weights wi for each zip code i as follows. The per capita victim rate in a given zip code i,
rVi , is equal to the per capita complaint rate in zip code i, rCi , multiplied by the ratio of the
victim rate and the complaint rate:
rVi = rCirVirCi
(2)
Information on per capita complaint rates from aggregate Consumer Sentinel data gives
us rCi . I then estimaterVirCi
, the inverse of the complaint to victim ratio, using estimates of
equation (1). The coefficients on demographics βjs allow me to predict a zip code’s complaint
rate or victim rate solely based on its demographics. Since βVs indicates how a given demo-
graphic variable Dis affects the victim rate, and βCs how a given demographic variable affects
the complaint rate, the difference between the two tells us how the victim to complaint ratio
changes with demographics. Formally, the predicted victim to complaint ratio for zip code i
using the estimates of demographic factors from the regression specification in equation (1)
is:
rVirCi
=exp(
∑s(β
Vs Dis))
exp(∑
s(βCs Dis))
= exp(∑s
(βVs − βC
s )Dis). (3)
I use the expression in equation (3) to create weights, normalizing these weights by
38

0
2000
4000
6000
0 1 2 3 4Weights
Num
ber
of Z
ipco
des
(a) All Zip Codes
0
50
100
0 1 2 3 4Weights
Num
ber
of Z
ipco
des
(b) Majority Black Zip Codes
Figure 9 Distribution of Weights
Note: The graph depicts the distribution of weights calculated using equation (3) with the esti-mates of equation (1) using all 9 cases. Weights are normalized so that the median zip code has aweight of 1.
dividing by the weight for the median zip code. Figure 9 depicts these weights both for all
zip codes, and for majority black zip codes. For all zip codes, 50% of zip codes have a weight
between 0.86 and 1.19. However, the weights have a long right tail of large weights; the 90th
percentile weight is 1.51, 95th percentile weight is 1.82, and 99th percentile weight is 2.41.
The median weight for majority black zip codes is about double the median weight for all
zip codes at 1.97, with 90% of weights for majority black zip codes between 1.45 and 2.54.
Thus, complaints from majority black areas would receive much greater weight under this
weighting scheme.
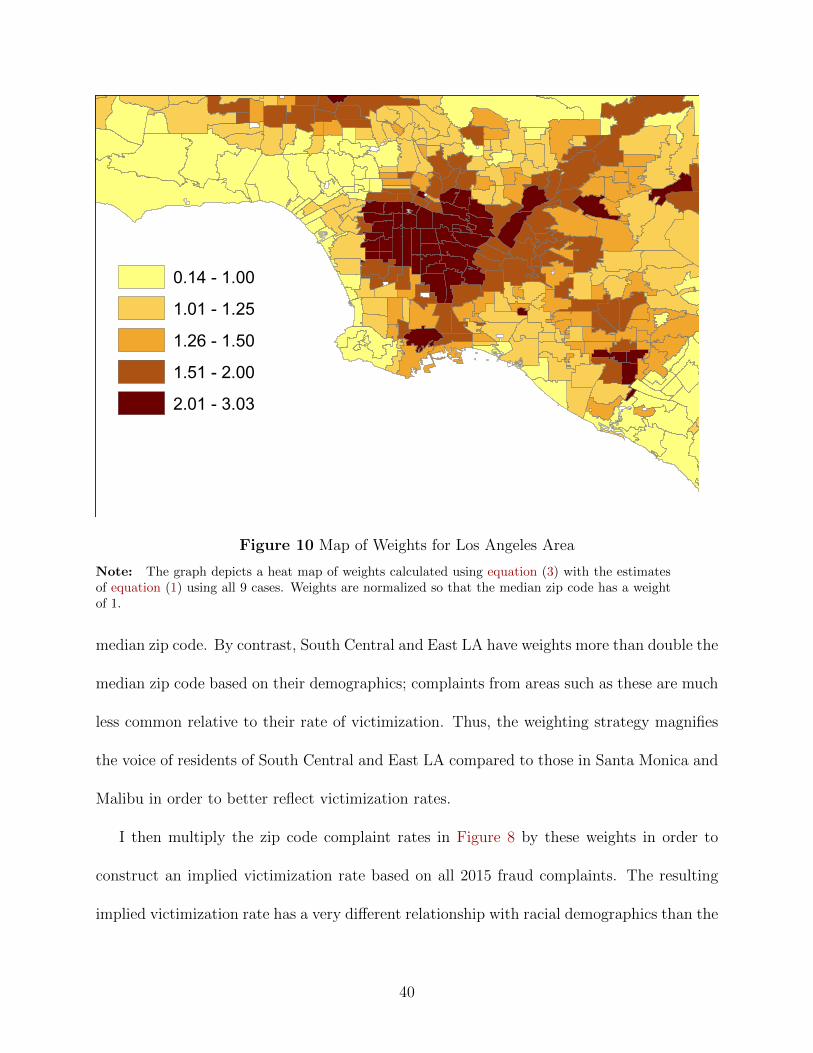
Figure 10 depicts a heat map of these weights for the Los Angeles area. Areas near
the coast, such as Malibu, Santa Monica, and Venice Beach, are weighted less than one, so
zip codes like these complain at higher rates than their rate of victimization relative to the
39
0.14 - 1.001.01 - 1.251.26 - 1.501.51 - 2.002.01 - 3.03
Figure 10 Map of Weights for Los Angeles Area
Note: The graph depicts a heat map of weights calculated using equation (3) with the estimatesof equation (1) using all 9 cases. Weights are normalized so that the median zip code has a weightof 1.
median zip code. By contrast, South Central and East LA have weights more than double the
median zip code based on their demographics; complaints from areas such as these are much
less common relative to their rate of victimization. Thus, the weighting strategy magnifies
the voice of residents of South Central and East LA compared to those in Santa Monica and
Malibu in order to better reflect victimization rates.
I then multiply the zip code complaint rates in Figure 8 by these weights in order to
construct an implied victimization rate based on all 2015 fraud complaints. The resulting
implied victimization rate has a very different relationship with racial demographics than the
40

5.0
7.5
10.0
12.5
0 25 50 75 100Population Share
Impl
ied
Vic
timiz
atio
n R
ate
Percent Black Percent Hispanic
Figure 11 Implied Victimization Rates For Black and Hispanic Communities in 2015
Note: The graph depicts the nonparametric loess regression of the zip code per capita complaintrate multiplied by the weights derived above on the share of percent black or percent Hispanic inthe zip code, based on all 2015 Fraud and Other complaints to Consumer Sentinel. Black solid linesreflect percent black, and grey dashed lines reflect percent Hispanic.
complaint rate. Figure 11 shows how the implied victimization rate varies across different
demographic groups. The implied victimization rate is about 3.5 times as large for areas
that are 100% black compared to areas that are 0% black. The victimization rate has an
inverse U shape with the percent Hispanic of a zip code. Areas with a 25% share of Hispanic
residents to a 50% share of Hispanic residents have close to a 50% higher victimization rate
than areas that are 0% Hispanic, while areas with close to a 100% Hispanic population share
have a 10% higher victimization rate than areas that are 0% Hispanic.
41

6 Conclusion
While consumers self-select into providing complaints, it is typically difficult to separate
whether differences across groups in complaint behavior represent differences in the propen-
sity to complain or the underlying rate of victimization. I have exploited a set of law
enforcement actions for which I have access to databases of victims as well as complaints
for each case, which has allowed me to examine how complaints compare to victimization. I
have found that heavily black and heavily Hispanic communities have much fewer complaints
than non-minority communities compared to their level of victimization.
While my results make clear that selection is a major issue in consumer complaints, it is
far from clear how to account for such selection. A statistical approach to doing so would be
to weight complaints based on how the complaint rate of their community compares to the
degree of victimization; such weights would overweight communities with lower complaint
rates and thus highlight their complaints. I have provided such an approach in this paper,
and have shown how to both construct these weights and how such weights would alter
relationships between complaint rates and the demographic composition of communities.
This weighting strategy could be used to modify complaint data across many settings with
data on both all users of a product and consumers that complain.21
An alternative, complementary approach to doing so would be convince more victims of
fraud from minority communities to complain. However, I have found evidence in this paper
21For example, the CFPB may have information on where consumers of financial services live from con-sumer credit panels as well as zip codes of complaining consumers. Amazon.com and other online retailershave the shipping address of anyone who buys a product from them together with the same information onconsumers that lodge complaints, as well as detailed information on their shopping patterns.
42

that the lower likelihood of complaining for victims from heavily minority areas is likely due
to differences in social trust, rather than information on whether one was defrauded or who
to complain to. Thus, advertising campaigns might increase the probability that victims
complain, but not ameliorate the lower propensity to complain for victims from minority
areas. Instead, government agencies could conduct outreach campaigns in communities
whose residents are less likely to complain when victimized that aim to go beyond simply
providing information on how to complain. Such outreach would have to convince residents
of such areas that their input is valued and would help their communities, which might
require greater engagement with local community organizations.
Finally, this paper has considered the issue of self-selection in the context of complaints
to consumer protection authorities. Future work could examine whether patterns of self-
selection on demographics are similar for online platforms such as Yelp or Amazon. Self-
selection may differ on online platforms because consumers’ alienation or lack of social trust
affects for-profit private companies differently than public entities. In addition, for online
platforms, market actors may influence whose voice we hear, either by promoting reviews
through free products, such as through the Amazon Vine program, by filtering suspicious
reviews, as Yelp does, or by suppressing negative reviews, a practice that Congress recently
banned through the Consumer Review Fairness Act.
43

References
Alesina, Alberto and Eliana La Ferrara, “Who Trusts Others?,” Journal of Public Economics,2002, 85 (2), 207–234.
Alsan, Marcella and Crystal S. Yang, “Fear and the Safety Net: Evidence from Secure Com-munities,” Technical Report 2018.
Anderson, Elijah, Code of the Street: Decency, Violence, and the Moral Life of the Inner City,WW Norton & Company, 2000.
Anderson, Keith B., Consumer Fraud in the United States: The Second FTC Survey, FederalTrade Commission, 2007.
, Consumer Fraud in the United States, 2011: The Third FTC Survey, Federal Trade Commis-sion, 2013.
Ayres, Ian, Jeff Lingwall, and Sonia Steinway, “Skeletons in the Database: An Early Analysisof the CFPB’s Consumer Complaints,” Fordham J. Corp. & Fin. L., 2013, 19, 343.
Bandura, Albert, “Self-Efficacy: Toward a Unifying Theory of Behavioral Change,” Psychologicalreview, 1977, 84 (2), 191.
Bone, Sterling A, Glenn L Christensen, and Jerome D Williams, “Rejected, Shackled,and Alone: the Impact of Systemic Restricted Choice on Minority Consumers’ Construction ofSelf,” Journal of Consumer Research, 2014, 41 (2), 451–474.
Brehm, John and Wendy Rahn, “Individual-level Evidence for the Causes and Consequencesof Social Capital,” American Journal of Political Science, 1997, pp. 999–1023.
Bricker, Jesse and Geng Li, “Credit Scores, Social Capital, and Stock Market Participation,”2017.
Dai, Weijia, Ginger Jin, Jungmin Lee, and Michael Luca, “Optimal Aggregation of Con-sumer Ratings: An Application to Yelp.com,” Technical Report, Harvard Business School 2014.
Federal Trade Commission, “Combating Fraud in African American and Latino Communities:The FTC’s Comprehensive Strategic Plan,” Technical Report 2016.
Fradkin, Andrey, Elena Grewal, and David Holtz, “The Determinants of Online ReviewInformativeness: Evidence from Field Experiments on Airbnb,” Technical Report, Working Paper2017.
Gans, Joshua S, Avi Goldfarb, and Mara Lederman, “Exit, Tweets and Loyalty,” TechnicalReport, National Bureau of Economic Research 2017.
Garrett, Dennis E. and Peter G. Toumanoff, “Are Consumers Disadvantaged or Vulnerable?An Examination of Consumer Complaints to the Better Business Bureau,” Journal of ConsumerAffairs, 2010, 44 (1), 3–23.
44

Ghose, Anindya and Panagiotis G. Ipeirotis, “Estimating the Helpfulness and EconomicImpact of Product Reviews: Mining Text and Reviewer Characteristics,” IEEE Transactions onKnowledge and Data Engineering, 2011, 23 (10), 1498–1512.
Glaeser, Edward L, David I Laibson, Jose A Scheinkman, and Christine L Soutter,“Measuring trust,” The Quarterly Journal of Economics, 2000, 115 (3), 811–846.
Hirschman, Albert O., Exit, Voice, and Loyalty: Responses to Decline in Firms, Organizations,and States, Vol. 25, Harvard University Press, 1970.
Hu, Nan, Ling Liu, and Jie Jennifer Zhang, “Do Online Reviews Affect Product Sales? TheRole of Reviewer Characteristics and Temporal Effects,” Information Technology and Manage-ment, 2008, 9 (3), 201–214.
MacLeod, Jay, Ain’t No Makin’ It: Aspirations and attainment in a Low-Income Neighborhood,Routledge, 2018.
Mayzlin, Dina, Yaniv Dover, and Judith A. Chevalier, “Promotional Reviews: An EmpiricalInvestigation of Online Review Manipulation,” The American Economic Review, 2014, 104 (8),2421–2455.
Nosko, Chris and Steven Tadelis, “The Limits of Reputation in Platform Markets: An Empir-ical Analysis and Field Experiment,” Technical Report, National Bureau of Economic Research2015.
Oster, Sharon, “The Determinants of Consumer Complaints,” The Review of Economics andStatistics, 1980, pp. 603–609.
Putnam, Robert D, Bowling Alone: The Collapse and Revival of American Community, Simonand Schuster, 2001.
Raval, Devesh, “Which Communities Complain to Policymakers? Evidence from ConsumerSentinel,” Technical Report 2018.
Seligman, Martin EP, Helplessness: On Depression, Development, and Death. A Series of Booksin Psychology, New York, NY: WH Freeman/Times Books/Henry Holt & Co, 1975.
Singh, Jagdip, “Determinants of Consumers Decisions to Seek Third Party Redress: An EmpiricalStudy of Dissatisfied Patients,” Journal of Consumer Affairs, 1989, 23 (2), 329–363.
45
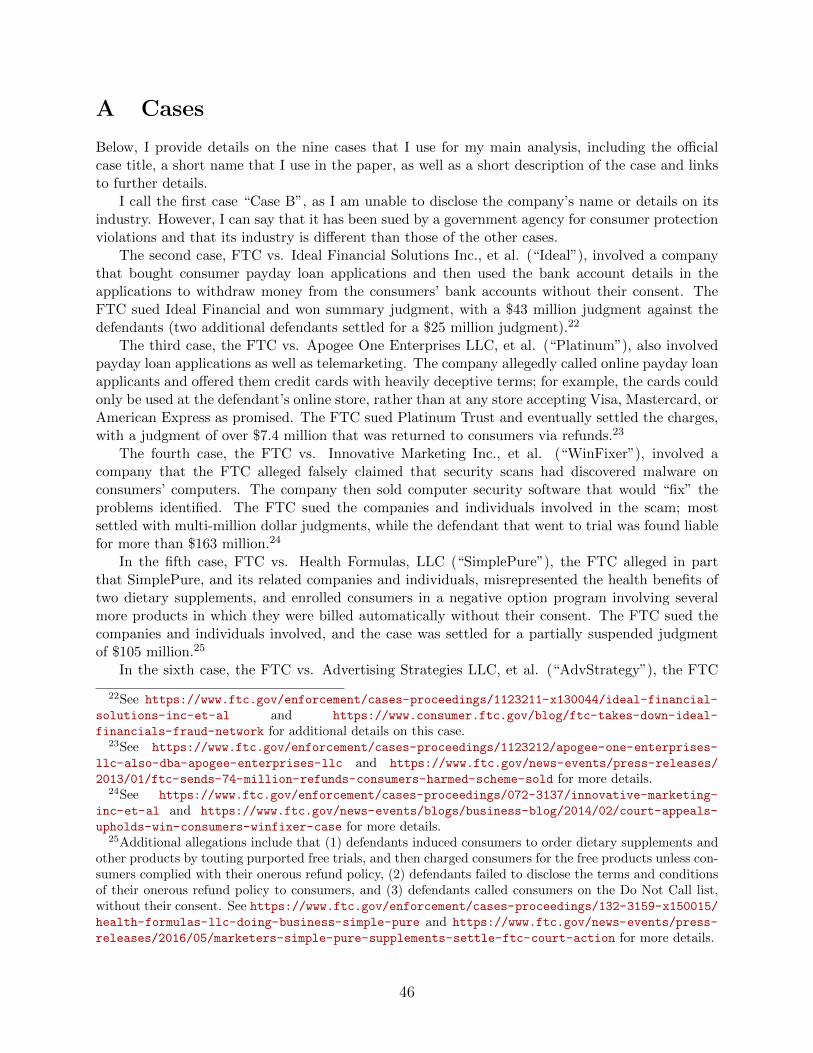
A Cases
Below, I provide details on the nine cases that I use for my main analysis, including the officialcase title, a short name that I use in the paper, as well as a short description of the case and linksto further details.
I call the first case “Case B”, as I am unable to disclose the company’s name or details on itsindustry. However, I can say that it has been sued by a government agency for consumer protectionviolations and that its industry is different than those of the other cases.
The second case, FTC vs. Ideal Financial Solutions Inc., et al. (“Ideal”), involved a companythat bought consumer payday loan applications and then used the bank account details in theapplications to withdraw money from the consumers’ bank accounts without their consent. TheFTC sued Ideal Financial and won summary judgment, with a $43 million judgment against thedefendants (two additional defendants settled for a $25 million judgment).22
The third case, the FTC vs. Apogee One Enterprises LLC, et al. (“Platinum”), also involvedpayday loan applications as well as telemarketing. The company allegedly called online payday loanapplicants and offered them credit cards with heavily deceptive terms; for example, the cards couldonly be used at the defendant’s online store, rather than at any store accepting Visa, Mastercard, orAmerican Express as promised. The FTC sued Platinum Trust and eventually settled the charges,with a judgment of over $7.4 million that was returned to consumers via refunds.23
The fourth case, the FTC vs. Innovative Marketing Inc., et al. (“WinFixer”), involved acompany that the FTC alleged falsely claimed that security scans had discovered malware onconsumers’ computers. The company then sold computer security software that would “fix” theproblems identified. The FTC sued the companies and individuals involved in the scam; mostsettled with multi-million dollar judgments, while the defendant that went to trial was found liablefor more than $163 million.24
In the fifth case, FTC vs. Health Formulas, LLC (“SimplePure”), the FTC alleged in partthat SimplePure, and its related companies and individuals, misrepresented the health benefits oftwo dietary supplements, and enrolled consumers in a negative option program involving severalmore products in which they were billed automatically without their consent. The FTC sued thecompanies and individuals involved, and the case was settled for a partially suspended judgmentof $105 million.25
In the sixth case, the FTC vs. Advertising Strategies LLC, et al. (“AdvStrategy”), the FTC
22See https://www.ftc.gov/enforcement/cases-proceedings/1123211-x130044/ideal-financial-
solutions-inc-et-al and https://www.consumer.ftc.gov/blog/ftc-takes-down-ideal-
financials-fraud-network for additional details on this case.23See https://www.ftc.gov/enforcement/cases-proceedings/1123212/apogee-one-enterprises-
llc-also-dba-apogee-enterprises-llc and https://www.ftc.gov/news-events/press-releases/
2013/01/ftc-sends-74-million-refunds-consumers-harmed-scheme-sold for more details.24See https://www.ftc.gov/enforcement/cases-proceedings/072-3137/innovative-marketing-
inc-et-al and https://www.ftc.gov/news-events/blogs/business-blog/2014/02/court-appeals-
upholds-win-consumers-winfixer-case for more details.25Additional allegations include that (1) defendants induced consumers to order dietary supplements and
other products by touting purported free trials, and then charged consumers for the free products unless con-sumers complied with their onerous refund policy, (2) defendants failed to disclose the terms and conditionsof their onerous refund policy to consumers, and (3) defendants called consumers on the Do Not Call list,without their consent. See https://www.ftc.gov/enforcement/cases-proceedings/132-3159-x150015/health-formulas-llc-doing-business-simple-pure and https://www.ftc.gov/news-events/press-
releases/2016/05/marketers-simple-pure-supplements-settle-ftc-court-action for more details.
46

alleged that a company used telemarketing to sell consumers fake business or investment opportu-nities, using various different purported online investment businesses. The FTC settled the casefor a monetary judgment of $25 million.26
In the seventh case, the FTC vs. Lift International LLC, et al. and the FTC vs. Thrive LearningLLC (“Guidance”), the FTC alleged that a set of companies used deceptive telemarketing to sellconsumers business coaching services. The FTC settled these cases for between $10 million and$30 million for each set of companies involved.27
In the eighth case, the FTC vs. Money Now Funding LLC (“MoneyNow”), the FTC allegedthat a company falsely promised consumers a business opportunity in which they could run abusiness from their home referring local businesses to the defendants’ money lending service. TheFTC either won judgments or settled with defendants for monetary judgments of varying amountsup to $7.2 million.28
Finally, in the ninth case, the FTC vs. PHLG Enterprises LLC (“PHLG”), the FTC alleged thata company served as a middleman to transfer money from consumers to Indian call centers usingWestern Union or MoneyGram cash transfers. The Indian call centers were conducting variousdifferent scams, such as imposter scams impersonating the IRS or government grant authorities.The FTC settled with defendants in this case for a suspended judgment of $1.5 million.29
B Demographics
Table A-1 contains the 1st, 5th, 10th, 25th, 50th, 75th, 90th, 95th, and 99th percentile quantiles ofeach variable across zip codes. The quantiles are estimated after weighting each zip code by its 2010population. All of the ethnic demographics are heavily skewed – half of the American populationlives in zip codes whose population is less than 5 percent black, less than 8 percent Hispanic, andless than 2 percent Asian. On the other hand, majority black and majority Hispanic zip codes eachcomprise more than 5 percent of population weighted zip codes. The measure of urbanization issimilarly skewed; the median zip code is 98% urban, but more than 5% of zip codes are 0% urban.30
The other variables are somewhat less skewed. The median age for the median zip code is 37.5,with the bottom 5 percent of zip codes with a median age below 28 and the top 5 percent of zipcodes with a median age above 47. The median household size is 2.6 for the median zip code,compared to below 2.1 for the bottom 5 percent of zip codes and above 3.5 for the top 5 percent ofzip codes. The unemployment rate for the median zip code is 5.6 percent; the bottom 5 percent ofzip codes have an unemployment rate below 2.7 percent while the top 5 percent of zip codes havean unemployment rate above 10.5 percent. For the median zip code, the median household income
26See https://www.ftc.gov/enforcement/cases-proceedings/162-3154/advertising-strategies-
llc-et-al and https://www.ftc.gov/news-events/press-releases/2017/03/business-
opportunity-scheme-operators-banned-telemarketing for more details.27See https://www.ftc.gov/news-events/press-releases/2017/06/defendants-involved-
selling-business-coaching-programs-settle-ftc for more details.28See https://www.ftc.gov/enforcement/cases-proceedings/122-3216-x130063/money-now-
funding-llc and https://www.ftc.gov/news-events/press-releases/2015/08/ftc-stops-elusive-
business-opportunity-scheme for more details.29See https://www.ftc.gov/enforcement/cases-proceedings/152-3245-x170019/phlg-
enterprises-llc and https://www.ftc.gov/news-events/press-releases/2017/02/ftc-settlement-
puts-stop-money-mule-who-profited-india-based-irs for more details.30Because I exclude PO Boxes, I likely miss some of the population living in rural areas, who are more
likely to use PO Boxes.
47

is 52 thousand dollars; the bottom 5 percent have a median income below 29 thousand dollars andthe top 5 percent have a median income above 100 thousand dollars. Lastly, in the median zipcode about 24 percent of the 25 year old and above population have completed college, comparedto less than 8.6 percent for the bottom 5 percent of zip codes and above 61.2 percent for the top 5percent of zip codes.
Table A-1 Quantiles of Demographic VariablesQuantiles
Variable 1% 5% 10% 25% 50% 75% 90% 95% 99%Percent Black 0 0.1 0.4 1.4 4.7 14.5 34.9 54.6 87.6Percent Hispanic 0 0.7 1.3 3 7.7 20.8 46.9 65.3 90.8Percent Asian 0 0 0.1 0.6 2 5.2 12 19.1 43.7Median Age 23.5 28.3 30.2 33.7 37.5 41.2 44.6 47.1 54.8Household Size 1.8 2.1 2.2 2.4 2.6 2.9 3.2 3.5 4.1Unemployment Rate 1.5 2.7 3.3 4.3 5.6 7.3 9.2 10.5 13.3Percent Urban 0 0 28.1 74.3 98 100 100 100 100Median Household Income(thousands)
23 29 33 41 52 68 88 101 130
Pct College Educated 5.1 8.6 10.9 15.8 24.1 37.4 52.4 61.2 75.5
Note: The 1st, 5th, 10th, 25th, 50th, 75th, 90th, 95th, and 99th percentile quantiles of eachvariable across zip codes are included in the table, where the quantiles are estimated after weightingeach zipcode by its 2010 population.
48