Who’s In, Who’s Out - The Pew Charitable Trusts/media/assets/2016/01/retirement… · ·...
44
A report from Jan 2016 Who’s In, Who’s Out A look at access to employer-based retirement plans and participation in the states
Transcript of Who’s In, Who’s Out - The Pew Charitable Trusts/media/assets/2016/01/retirement… · ·...

A report from Jan 2016
Who’s In, Who’s OutA look at access to employer-based retirement plans and participation in the states


Contents
1 Overview
3 Access and participation nationally and in the states How often workers with access participate 8
9 Factors linked to plan access and participation Employer size 9 Industry 12 Wage and salary income 14 Age 16 Education 18 Race and ethnicity 20
22 Implications for policy
24 Conclusion
25 Appendix A: Summary results
28 Appendix B: Retirement plan access and participation by included characteristics
31 Appendix C: Retirement plan access and participation by gender
32 Appendix D: Population estimates by state

The Pew Charitable TrustsSusan K. Urahn, executive vice president Travis Plunkett, senior director
Project teamJohn Scott Andrew Blevins Theron Guzoto Kevin Whitman
AcknowledgmentsThe report benefited from the insights and expertise of two overall reviewers: Andrew G. Biggs, a resident scholar at the American Enterprise Institute; and Teresa Ghilarducci, professor of economics at The New School. The retirement savings team also thanks several external experts for providing time, knowledge, and expertise during various stages in the preparation of this report, including Courtney Eccles, David C. John, Catherine Singley Harvey, Jules Lichenstein, and Patrick Purcell. Their input does not imply that they, or their organizations, necessarily endorse this report’s findings or conclusions.
The retirement savings team also thanks Pew staff members Diana Elliott and Jerry Lindrew for their thoughtful suggestions. Many thanks also to other current and former colleagues who made this work possible.
Contact: Ken Willis, officer, communications Email: [email protected] Phone: 202-540-6933 Project website: http://www.pewtrusts.org/retirementsavings
Contact: Steven Abbott, officer, government relations Email: [email protected] Phone: 202-540-6647 Project website: http://www.pewtrusts.org/retirementsavings
The Pew Charitable Trusts is driven by the power of knowledge to solve today’s most challenging problems. Pew applies a rigorous, analytical approach to improve public policy, inform the public, and invigorate civic life.

1
OverviewWith the aging of the nation’s population, a continuing decline in the availability of traditional pensions, and concerns about the future of Social Security, many workers in the United States worry that they won’t have enough money set aside for their retirements. The Employee Benefit Research Institute’s 2014 annual Retirement Confidence Survey found that only 22 percent of Americans are very confident that they will have enough money for a comfortable retirement, while 36 percent are somewhat confident. Twenty-four percent are not at all confident.
In addressing these concerns, policymakers have emphasized the need to expand access to what are known as employer-sponsored defined contribution plans, such as 401(k)s. The ability of employees to contribute directly from their paychecks and the use of features such as automatic enrollment make the workplace an effective place to encourage saving.1 These employer-sponsored plans are how Americans now accumulate the vast majority of their private retirement funds, but large gaps in coverage exist.2
Today, only about half of workers participate in a workplace retirement plan, according to an analysis of data compiled by The Pew Charitable Trusts. Overall, 58 percent of workers have access to a plan, while 49 percent participate in one. Looking at the numbers a different way, more than 30 million full-time, full-year private-sector workers ages 18 to 64 lack access to an employer-based retirement plan.3
To help more people save for their later years, lawmakers in Congress have introduced retirement savings initiatives.4 Separately, President Barack Obama unveiled his “myRA” program in 2014 with a similar goal. As of Nov. 4, 2015, people without retirement plans can sign up to save through myRA.5
States are also acting to increase retirement savings. Lawmakers in more than half of the states have introduced measures to either create or study state-sponsored retirement savings plans for employees who don’t have access to such a plan in the workplace. Illinois, for instance, established the Secure Choice Savings Program, which will start enrolling certain workers in new payroll-deduction retirement accounts by 2017. Washington state has created a marketplace in which small employers and the self-employed can shop for retirement plans.
As state and federal lawmakers explore new programs to encourage workers to put aside money for retirement, this report surveys the retirement savings environment in all 50 states and assesses the challenges facing workers and employers. The data show wide differences among the states in both access to and participation in employer-based retirement plans. The numbers highlight variations by employer size and industry type, as well as workers’ income, age, education, race, and ethnicity.6 More detailed information, including state-by-state breakdowns, is available in the report’s online interactive data visualization at http://www.pewtrusts.org/retirementaccess.
Among the key findings:
• Access and participation rates vary widely across the states and regions. For example, 61 percent of workers in Wisconsin participate in an employer-based pension or retirement savings plan compared with 38 percent in Florida. Access and participation are higher in the Midwest, New England, and parts of the Pacific Northwest, and lower in the South and West.
• Access and participation vary based on employer size and industry type. For example, only 22 percent of workers at firms with fewer than 10 employees report having access to a workplace savings plan or pension, compared with 74 percent at firms with 500 or more. Certain industries, such as leisure and hospitality or construction, have much lower levels of access and participation than others. These factors contribute to state and regional differences.

2
• Plan access and participation differ substantially by employee income. Nationally, only 32 percent of workers with wage and salary incomes of less than $25,000 have access to a retirement plan at the workplace; the rate rises to 75 percent for workers with incomes above $100,000. Just 20 percent of those in the lower-income group participate in a plan, compared with 72 percent of more affluent workers.
• Younger workers and workers with less formal education are less likely to have access to a workplace retirement plan.7 Younger workers also are less likely to participate even if they have the option. For some of these workers, other priorities may compete with retirement savings.
• Some of the largest differences are by race and ethnicity. Among Hispanic workers, access to a plan is around 25 percentage points below that for white non-Hispanic workers. Black and Asian workers also report lower rates of access than white workers. This variation is likely due to underlying economic differences such as age, job type, and income, but other factors, such as a lack of comfort with financial institutions, may also play a role.
Because of the differences in retirement plan access and participation across the United States, legislators should consider the unique social and economic features of each state as they try to expand retirement saving through the workplace. For example, certain states have more workers at small businesses or in industries with relatively high turnover. Policymakers will need to balance the goal of increasing retirement savings against the challenges and concerns that such firms face. Other states have higher shares of minority workers who may benefit from targeted outreach materials to expand participation in new or existing plans. Taking these types of characteristics into account can help policymakers improve retirement security while balancing the needs of both workers and employers.
MethodologyThe figures in this report are based on a pooled version of the 2010-14 Minnesota Population Center’s Integrated Public Use Microdata Series (IPUMS) Current Population Survey (CPS), Annual Social and Economic (ASEC) Supplement.8 Unless otherwise noted, “worker” in this report means a full-time, full-year, private-sector wage and salary worker ages 18-64.9
Readers should be aware that estimates of retirement plan access and participation vary across data sources. For example, one study found that among private-sector full-time workers, the reported CPS access rate for 2012 was 15 percentage points lower than that in the Department of Labor’s National Compensation Survey.10 Methodological differences, such as the makeup of the underlying sample or the phrasing of the survey questions, contribute to some of the variation.11 Furthermore, previous research suggests that respondents tend to underreport retirement plan access and participation compared with W-2 tax data.12
There is no single, definitive benchmark figure for retirement plan access and participation. Pew uses the CPS because of the geographic detail it allows us to provide. See the separate Methodology document, available at http://www.pewtrusts.org/retirementaccess, for a full description of the data, its limitations, and our analysis approach.

3
Note: The access rate for all 50 states is 58 percent.
© 2016 The Pew Charitable Trusts
50% and below 51-55% 56-60% 61-65% 66% and above
AZ NM
NDMT
WY
ID
UT
OR
WA
NV
IA
MN
TN
KY
OHPA
IN
LA
MS GA
NC
VA
SC
IL
FL
AL
WI
AK
CA
TX
OK
KS
NE
COMO
AR
NY
ME
WV
SDMI
HI
Access and participation nationally and in the statesFifty-eight percent of workers in the United States reported having access to a workplace retirement plan, while 49 percent reported participating.13 State percentages varied considerably.
Figures 1A and 1B show access to, and participation in, retirement plans among workers in each state.
Figure 1A
Retirement Plan Access Percentages are highest in the Upper Midwest

4
Note: The participation rate for all 50 states is 49 percent.
© 2016 The Pew Charitable Trusts
Figure 1B
Retirement Plan ParticipationA similar pattern to access, with high rates in the Upper Midwest
40% and below 41-45% 46-50% 51-55% 56% and above
AZ NM
NDMT
WY
ID
UT
OR
WA
NV
IA
MN
TN
KY
OHPA
IN
LA
MS GA
NC
VA
SC
IL
FL
AL
WI
AK
CA
TX
OK
KS
NE
COMO
AR
NY
ME
WV
SDMI
HI

5
Figure 2
Access and Participation Rates Across the StatesVaries by more than 20 percentage points
Access and participation rates vary widely (see Figure 2). Florida had the lowest access rate at 46 percent, while Wisconsin had the highest at 70 percent, a difference of more than 20 percentage points. The same states had the lowest and highest participation rates (38 percent in Florida and 61 percent in Wisconsin). Regional differences also were significant, with higher access and participation rates in the Upper Midwest, along with parts of New England and the Pacific Northwest. Access and participation were generally lower in the South and West. Access by region ranged from 54 percent in the South to 65 percent in the Midwest. Participation ranged from 46 percent in the South to 56 percent in the Midwest. Appendix A includes regional figures.
© 2016 The Pew Charitable Trusts
Minimum
Median
Maximum
403020 706050 1009080100
Participation
53
6246 70
Access
38
Florida
Florida Wisconsin
61
Wisconsin
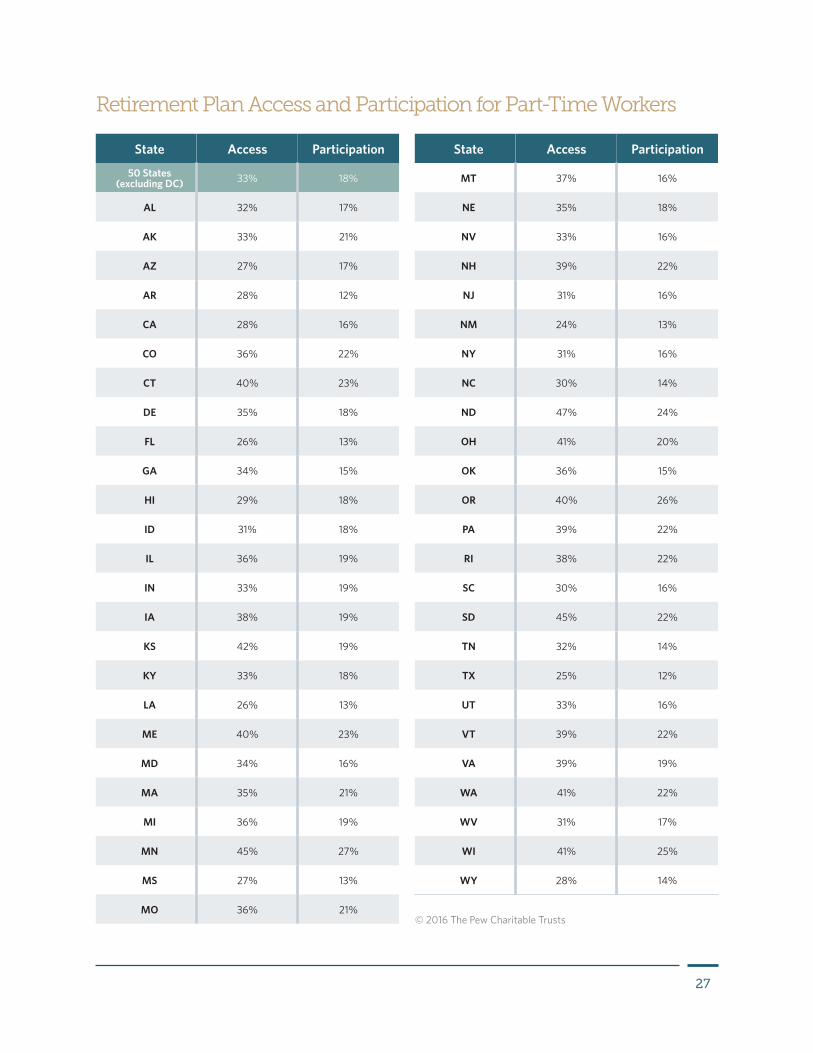
Even in states with high access rates, many workers did not have access to workplace retirement plans. Although a large majority in Wisconsin—70 percent—had access, more than 400,000 workers did not. Moreover, the estimate of the number of workers without access to a workplace retirement plan is conservative, because the analysis focuses only on full-time workers employed throughout the year. About 18 percent of those who are employed work part time; retirement plan access and participation are substantially lower among part-time and seasonal workers.14 Figures 3A and 3B show how access to and participation in retirement plans among part-time workers varies across the states.

6
Figure 3A
Retirement Plan Access for Part-Time WorkersRates are much lower for these employees
30% and below 31-35% 36-40% 41-45% 46% and above
AZ NM
NDMT
WY
ID
UT
OR
WA
NV
IA
MN
TN
KY
OHPA
IN
LA
MS GA
NC
VA
SC
IL
FL
AL
WI
AK
CA
TX
OK
KS
NE
COMO
AR
NY
ME
WV
SDMI
HI
Note: The access rate for part-time workers in all 50 states is 33 percent.
© 2016 The Pew Charitable Trusts
7
Note: The participation rate for part-time workers in all 50 states is 18 percent.
© 2016 The Pew Charitable Trusts
Figure 3B
Retirement Plan Participation for Part-Time WorkersRate is under 25% in most states
15% and below 16-20% 21-25% 26% and above
AZ NM
NDMT
WY
ID
UT
OR
WA
NV
IA
MN
TN
KY
OHPA
IN
LA
MS GA
NC
VA
SC
IL
FL
AL
WI
AK
CA
TX
OK
KS
NE
COMO
AR
NY
ME
WV
SDMI
HI
8
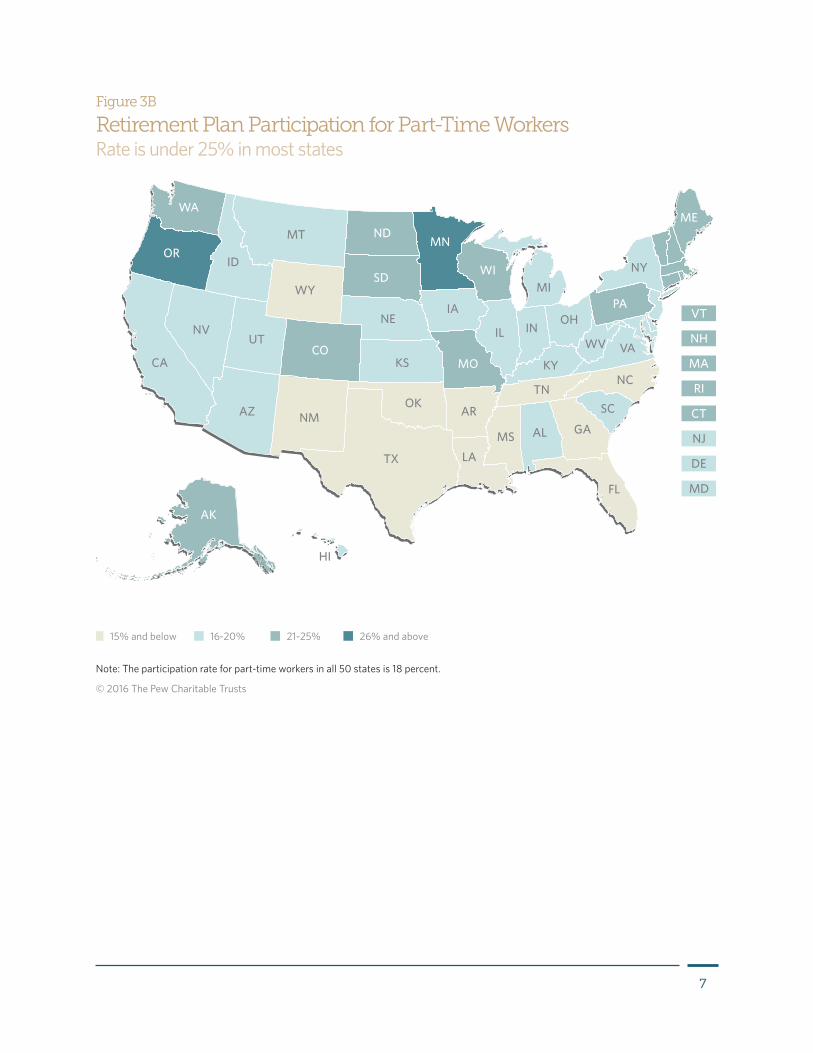
How much workers with access participateThe “take-up rate” represents the percentage of workers who reported having access to a workplace retirement plan and were participating in that plan (see Figure 4). Nevada had the lowest take-up rate at 76 percent, while Indiana had the highest at 90 percent. Several states had rates close to this high.15
Lower take-up rates in some states suggest a need for identifying and removing obstacles to participation among workers who have access to a plan. However, some of these workers—such as those who are younger or have lower incomes—may choose not to participate because of other financial priorities or expectations about their future financial situations.
Figure 4
Take-Up Range Across the StatesLarge majorities of those who have access do participate in plans
© 2016 The Pew Charitable Trusts
Minimum
Median
Maximum
403020 706050 100908010
76
Nevada Indiana
85 90
0
Because many Americans use retirement plan savings for purposes other than retirement, these participation gaps merit broader consideration. Many people withdraw savings before retirement to meet large expenses, such as buying or repairing a house, consolidating bills, or paying educational and medical costs.16 Researchers and policymakers voice concerns about “leakage” from retirement savings through early withdrawals and plan loans. Some have recommended increasing penalties and other disincentives to reduce this drain on savings.

9
Still, having the ability to draw on an account in a time of need could help workers avoid higher-cost approaches to mediating financial shocks, such as expensive forms of borrowing.17 This ability to handle unexpected expenses is a significant concern for many Americans.18 A recent Pew report showed that 60 percent of households experienced a financial shock in the previous 12 months; half of this group reported that the problem made it difficult to make ends meet.19 This is consistent with a Pew analysis of Survey of Consumer Finances data that showed that 55 percent of households were “savings-limited:” They could not replace one month of income with their available cash, checking, and savings accounts.20
Make no mistake. ... The single most important factor in determining whether or not workers across the income spectrum save for retirement is whether or not there is a workplace retirement plan. If increasing retirement and financial security is the goal, increasing the availability of workplace savings is the way to get there.”Scott F. Betts, senior vice president of National Benefits Services LLC, in testimony to the Senate Finance Committee, 2014
Employer sizeSome of the largest differences in retirement plan access and participation are found by employer size. For example, just 22 percent of workers at firms with fewer than 10 employees reported having access to workplace savings plans or pensions. Among workers at firms with 500 or more employees, the rate was 74 percent.25
The concentration of workers in small firms varies widely across the states. Nationwide, 29 percent reported working at firms with fewer than 50 employees. The percentages in individual states ranged from 39 percent in Montana to 23 percent in Minnesota.26 (See Figure 5.)
Factors linked to plan access and participationMany factors are associated with access to and participation in workplace retirement savings plans. Employer and worker characteristics play important roles, with wide variations based on employer size, industry, income, age, education, and race and ethnicity. Those factors then play into wide differences across the states and regions.21
The fact that many workers of differing characteristics do not have access to retirement plans might reflect individual circumstances and preferences. Some might prefer to save in a workplace plan but cannot get a job with an employer that offers one. For others, this may be a lower priority because of their limited ability to save, their stage in life, or other considerations. Therefore, they might be more likely to consider employers without plans.22 Pew does not try to separate out these effects or quantify the role of any particular factor in predicting access or participation.23 However, we do discuss previous research on how these characteristics might affect retirement plan access and participation.24

10
Figure 5
Percentage of Workers Employed at Firms With Fewer Than 50 Employees Employees in Western states are more likely to work in small firms
MontanaIdaho
New MexicoWyoming
HawaiiNew YorkVermont
FloridaNorth Dakota
CaliforniaLouisiana
AlaskaSouth Dakota
MaineOregon
North CarolinaArkansas
South CarolinaNew Jersey
TexasWest Virginia
50 StatesOklahoma
ColoradoAlabama
MarylandUtah
GeorgiaKansas
DelawareVirginiaArizona
KentuckyNebraska
NevadaTennessee
New HampshireMissouri
Rhode IslandMassachusetts
OhioWisconsin
IndianaWashingtonConnecticutMississippi
MichiganIowa
IllinoisPennsylvania
Minnesota
0% 5% 10% 15% 20% 25% 30% 35% 40% 45%
© 2016 The Pew Charitable Trusts

11
Small employers face potential barriers or disincentives to offering retirement plans, including cost, complexity, and concerns about liability. In a Main Street Alliance/American Sustainable Business Council survey from 2013, over half of small-business owners who did not offer plans said cost was the largest obstacle.27 Setting up a retirement plan generally includes both fixed costs and a marginal cost for each employee who participates. Because of their size, small employers face relatively large fixed costs. These financial concerns are consistent over time. The Small Employer Retirement Survey done by the Employee Benefit Research Institute (EBRI) in 2003 measured obstacles to retirement plans among businesses with five to 100 full-time employees.28 Among the financial concerns cited most often for not offering a plan were that business “revenue is too uncertain/too low” and “costs too much to set up and administer.”29 A large percentage said that positive financial changes, such as an “increase in business profits,” would make them more likely to offer a plan.30 A 2005 survey by the National Federation of Independent Businesses found that small businesses are more likely to offer health insurance before offering a retirement savings package.31
Policymakers have pursued initiatives to make providing retirement plans more financially attractive for small employers, such as offering tax credits for startup costs and creating savings vehicles, such as the Simple IRA Plan and the Simplified Employee Pension (SEP) plan, with less burdensome administrative requirements.32 Still, plan adoption at smaller firms is limited, and policymakers continue to explore new initiatives such as multiple employer plans, which allow unrelated businesses to participate in a centrally administered retirement plan. Pew will explore these issues in the coming year when assessing the barriers facing employers in offering retirement plans.
According to the 2001 Small Employer Retirement Survey, employees often want more money devoted to wages, another reason that employers sometimes cite for not offering a retirement plan, particularly among the smallest businesses.33 This notion corresponds with other research that shows much of the difference in retirement plan availability by employer size can be attributed to underlying workforce characteristics, such as lower wages at small firms.34 Future work by Pew’s retirement savings project will explore workers’ preferences and behavior with regard to retirement savings.
Many of the small employers who were contacted [by the Government Accountability Office] said they felt overwhelmed by the number of plan options, plan administration requirements, and fiduciary responsibilities.”Charles A. Jeszeck, GAO director of education, workforce, and income security, in testimony to the Senate Health, Education, Labor, and Pensions Committee, 2013

12
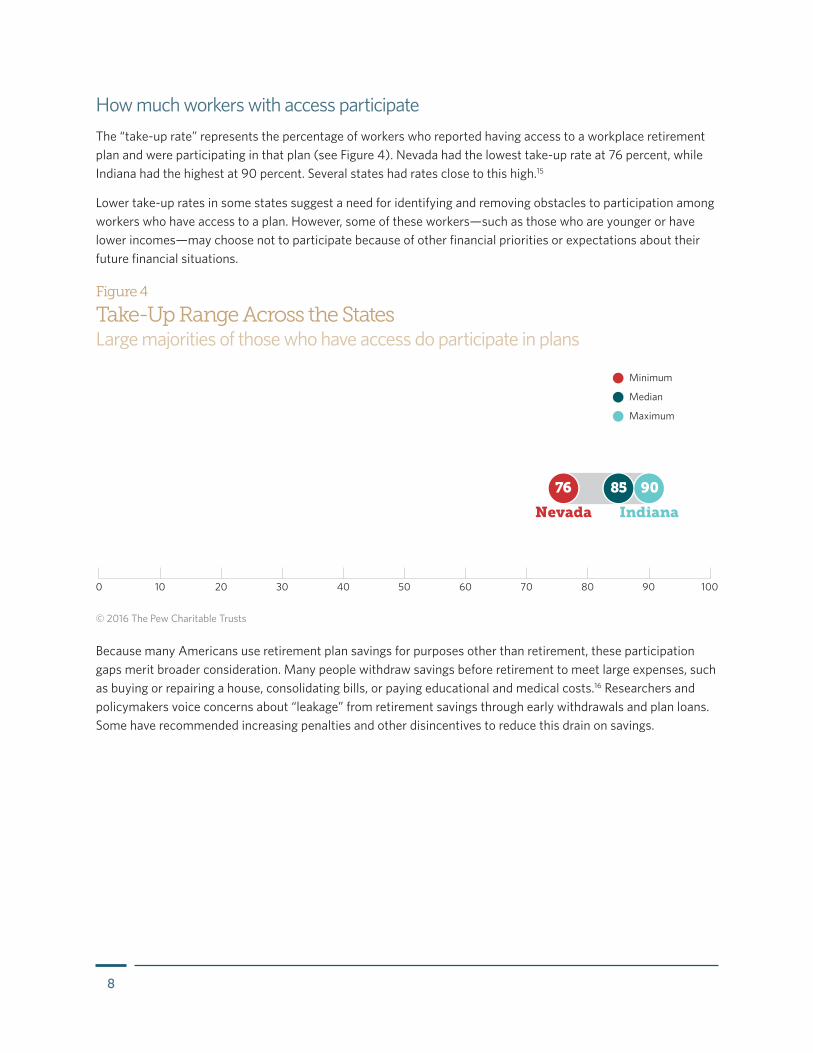
IndustryThe type of industry also can make a big difference in whether employers offer retirement plans. Among the industries that Pew analyzed independently, the manufacturing and financial services sectors were most likely to provide these benefits, with 69 percent and 68 percent of workers, respectively, offered a plan.35 At the lower end were the leisure and hospitality industry at 34 percent and construction at 40 percent.36 These industries also had lower participation rates. Less than a quarter of workers in leisure and hospitality jobs, which include restaurant, hotel, and similar work, reported participating in a plan.37
Here regional differences come into play as well because certain industries, such as leisure and hospitality, are more concentrated in certain areas of the country. Nationwide, about 8 percent of workers had jobs in this industry. They make up 27 percent of the analysis group in Nevada but only 5 percent in Iowa. (See Figure 6.) Regional differences also can provide insight into where workers are more likely to have access to retirement savings options. In Connecticut, 15 percent of workers had jobs in financial services, a field more likely to offer plans. By contrast, that sector accounts for only 5 percent of jobs in Wyoming.
13
Figure 6
Percentage of Workers Employed in the Leisure and Hospitality IndustryNevada and Hawaii have large shares of these employees.
0% 5% 10% 15% 20% 25% 30%
NevadaHawaiiFlorida
New MexicoMontana
Rhode IslandArizona
CaliforniaAlaska
New YorkSouth Carolina
DelawareColorado
WashingtonWyoming
North Carolina50 StatesMaryland
TennesseeNew Jersey
LouisianaMississippi
KentuckyGeorgia
ArkansasOklahoma
OregonTexas
MissouriOhio
North DakotaIllinois
VirginiaIdaho
WisconsinSouth Dakota
KansasIndiana
VermontConnecticut
West VirginiaPennsylvania
MassachusettsMinnesota
UtahAlabamaMichiganNebraska
MaineNew Hampshire
Iowa
© 2016 The Pew Charitable Trusts

14
The type of industry can affect retirement plan access and participation in multiple ways. Some have more lower-wage, part-time, short-term, and seasonal workers, the kind of work for which employer-based plans are less common.38 For example, the leisure and hospitality industry faces high employee turnover, with a separation rate almost double that of total nonfarm employment overall.39 As of January 2014, the median tenure for workers in the leisure and hospitality industry was 2.3 years. In comparison, the median for workers in the manufacturing industry was 5.9 years.40 Federal statistics also show that employees in the leisure and hospitality industry worked about 10 fewer hours per week on average in January 2015 than workers in professional and business services: 26 versus 36 hours, respectively.41
Retirement savings plans often require a minimum number of hours worked before an employee can participate, such as 1,000 hours per year. These rules will limit overall participation in industries with more part-time employees. Even for some long-term full-time workers, the prevalence of short-term and part-time jobs in their fields can reduce access if employers believe there is little need or demand for retirement plans among the majority of their workforce and choose not to make them available.
Additionally, certain industries may face economic challenges that reduce the likelihood that employers will offer retirement plans. Metrics such as profit margins and returns on capital and equity vary substantially across types of businesses.42 Employers that are not profitable overall, or with substantial variation in seasonal profitability, face greater difficulty meeting financial costs or providing the time and effort needed to administer retirement plans for employees.
Certain industries are also more heavily unionized. For example, data from the Bureau of Labor Statistics show that 21 percent of wage and salary workers in the transportation and utilities industry are represented by unions, compared with about 4 percent of those in leisure and hospitality jobs.43 Retirement plan access rates are substantially higher for union workers because collective bargaining efforts usually include retirement benefits.44
Unionization rates differ substantially by state, in part due to the concentration of particular industries. In New York, for example, unions represented 26 percent of wage and salary workers in 2014, compared with 3 percent in South Carolina.45 Research by others suggests that state-level rates of unionization are linked with the share of workers that have access to retirement plans.46
Employee characteristics such as age, education, income, and race—all discussed more fully below—also vary by industry. Workers in leisure and hospitality jobs are generally younger, with a median age of approximately 32, compared with the median age of 42 for all workers.47 Younger or lower-income workers are generally less likely to have access to retirement plans or to participate in one.
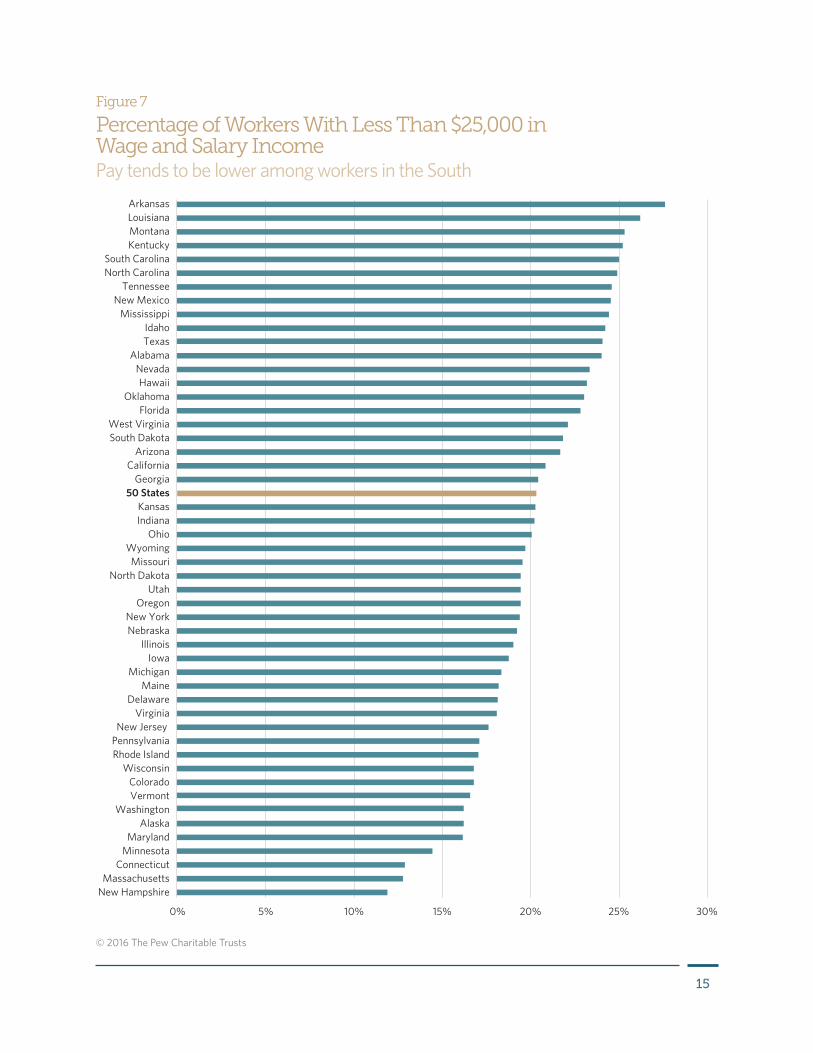
Wage and salary incomeAccess and participation also vary widely in terms of workers’ wage and salary income. Among those earning less than $25,000, about 32 percent reported having access to a retirement plan. Among those earning $100,000 or more, 75 percent said they had access. The gaps widen when participation is considered. Only 20 percent of workers with incomes of less than $25,000 reported participating in an employer-based retirement plan, compared with 72 percent of those with incomes of $100,000 or more—a divide of more than 50 percentage points.
Income levels vary substantially across the United States (see Figure 7). Nationwide, 1 in 5 workers reported an annual wage and salary income of less than $25,000. In Arkansas, 28 percent reported that level of income, compared with just 12 percent in New Hampshire. Lower incomes are more common in the South and Southwest, although the cost of living is generally lower as well.
15
Figure 7
Percentage of Workers With Less Than $25,000 in Wage and Salary IncomePay tends to be lower among workers in the South
0% 5% 10% 15% 20% 25% 30%
ArkansasLouisianaMontanaKentucky
South CarolinaNorth Carolina
TennesseeNew Mexico
MississippiIdahoTexas
AlabamaNevadaHawaii
OklahomaFlorida
West VirginiaSouth Dakota
ArizonaCalifornia
Georgia50 States
KansasIndiana
OhioWyoming
MissouriNorth Dakota
UtahOregon
New YorkNebraska
IllinoisIowa
MichiganMaine
DelawareVirginia
New Jersey PennsylvaniaRhode Island
WisconsinColoradoVermont
WashingtonAlaska
MarylandMinnesota
ConnecticutMassachusetts
New Hampshire
© 2016 The Pew Charitable Trusts

16
Wage and salary income can indicate “job quality.”48 Lower-wage jobs tend to be in sectors where employers are less likely to offer pensions or retirement savings plans.49 For instance, those employed in food services have lower average wages than those employed in finance and are less likely to have access to a workplace retirement plan.50
Income also plays a role in whether workers can participate in a retirement plan. Those with low incomes may need their full pay—or more—to meet their regular expenditures. In a recent Pew survey on family finances, 20 percent of respondents reported spending more than they made in most months.51 In addition, as reported by Pew elsewhere, income in many families can fluctuate widely from year to year. Nearly half of American households have experienced an income drop or gain of more than 25 percent in a two-year period. That can leave many low- to moderate-income workers with insufficient short-term or emergency savings.52 Some of these workers may be unwilling to commit to making contributions to a retirement savings plan when faced with such volatility.53
AgeAccess and participation also differ by age. Some 47 percent of workers ages 18 to 29 reported having access to a plan; that rises to 63 percent among those 45 to 64. Participation rates followed a similar pattern. The gap between access and participation proved largest among the youngest workers, many of whom face savings challenges even when they have access to retirement plans.
The analysis showed that approximately 20 percent of workers nationwide are under 30 (see Figure 8). However, younger workers were more prevalent outside the East Coast. Utah, Alaska, Kansas, Wyoming, and North Dakota had the highest percentages, with about a quarter of their full-time, private-sector workers under age 30. The Northeastern states, including Connecticut, Maine, and New Hampshire, had higher percentages of older workers, ages 45 to 64. In Connecticut, for example, nearly half were in that age bracket, compared with 33 percent in Utah.
I think you go for survival first. So it is going to be the rent or the mortgage. It is going to be the food and the electric bill and things like that. If there is anything left, that goes into savings.”Boston-area member of Pew financial security focus group

17
Figure 8
Percentage of Workers Under Age 30Many Western states have larger concentrations of younger workers
0% 5% 10% 15% 20% 25% 30%
UtahAlaskaKansas
WyomingNorth Dakota
ArkansasMontana
South DakotaNevada
LouisianaTexas
KentuckyNebraskaCalifornia
TennesseeColoradoMaryland
MinnesotaOklahoma
AlabamaHawaii
New MexicoIowa
WashingtonNorth Carolina
New York50 States
IllinoisMissouriArizonaVirginia
OhioRhode IslandPennsylvania
WisconsinSouth Carolina
GeorgiaDelaware
Florida Idaho
IndianaMassachusetts
OregonMississippi
MaineNew Jersey
West VirginiaVermont
New HampshireConnecticut
Michigan
© 2016 The Pew Charitable Trusts
18
Age can be a factor in retirement savings in multiple ways. One is the ability to save. On average, younger workers have less income than older ones; saving for retirement might not be reasonable or rational from a life cycle perspective.54 Debt also may be a concern. Although the share of younger households—those younger than 35—holding debt is lower than that among many older age groups, these households have the highest median dollar amount of unsecured debt.55 Because this debt is likely to have high interest rates, paying it off before saving for retirement might be the best path for some workers. Research from Pew suggests that education debt is a particular concern for millennials: 41 percent of this age group holds this type of debt, and the median amount owed is $20,000.56 Debt could reduce demand for retirement plans among young workers and curtail participation even when offered.
Younger workers also might have different saving priorities.57 For example, some may be more interested in saving for a house, financing education, or building personal liquidity. Data from the Federal Reserve System’s 2013 Survey of Consumer Finances show that among households that reported saving during the past year, the percentage that listed retirement as their top savings goal was far lower among households headed by an individual under age 35 than among older households.58 Older workers with more wealth and income and a clearer focus on retirement might be expected to more frequently seek an employer with a retirement plan and participate when given the opportunity.
EducationLess-educated workers are far less likely to have access to, and participate in, employer-based retirement savings or pension plans. Only 29 percent of workers who did not graduate from high school reported having access to a workplace retirement plan. More than twice as many—69 percent—of those with at least a bachelor’s degree said they did. Broadly speaking, the differences in participation by education level showed a similar pattern.
Overall, 37 percent of full-time private-sector workers had a high school diploma or less education. Among the states, West Virginia had the highest share of workers in this category with 50 percent. In general, states in the South and Southwest had higher percentages of workers with less formal education than elsewhere in the country. (See Figure 9.)
Education can affect retirement plan access and participation in multiple ways. Education typically contributes to

19
Figure 9
Percentage of Workers With a High School Diploma or LessStates such as Minnesota, Colorado, and Massachusetts below national average
West VirginiaLouisianaWyoming
NevadaArkansas
OklahomaTexasOhio
AlabamaTennesseeMississippi
KentuckyIndiana
IdahoNew Mexico
South CarolinaNorth Carolina
PennsylvaniaDelawareVermont
IowaHawaiiMaine
50 StatesArizona
CaliforniaAlaska
South DakotaMontana
Rhode IslandMissouri
FloridaWisconsin
UtahNew York
GeorgiaOregon
New JerseyVirginia
NebraskaIllinois
MarylandMichigan
KansasNew Hampshire
ConnecticutNorth Dakota
WashingtonMassachusetts
ColoradoMinnesota
0% 10% 20% 30% 40% 50% 60%
© 2016 The Pew Charitable Trusts
20
economic outcomes such as job quality and income. For example, the median lifetime earnings for workers with a high school diploma are about $1 million less than for workers with a bachelor’s degree.59 And having limited economic resources can make saving for retirement more difficult. Education influences where an individual can find work, as well as the type of industry and occupation.60
Education also ties into financial literacy and the willingness to join a retirement plan.61 For example, those with higher levels of education or within certain disciplines, such as mathematics or economics, could be more comfortable with savings concepts and the benefits of participation.62 More broadly, many workers may not have a basic understanding of how to prepare for retirement. According to the 2012 Financial Capability Survey conducted by the Financial Industry Regulatory Authority (FINRA) Investor Education Foundation, only 37 percent of respondents had ever attempted to calculate their retirement savings needs. Among those who did not complete high school, the share was just 15 percent.
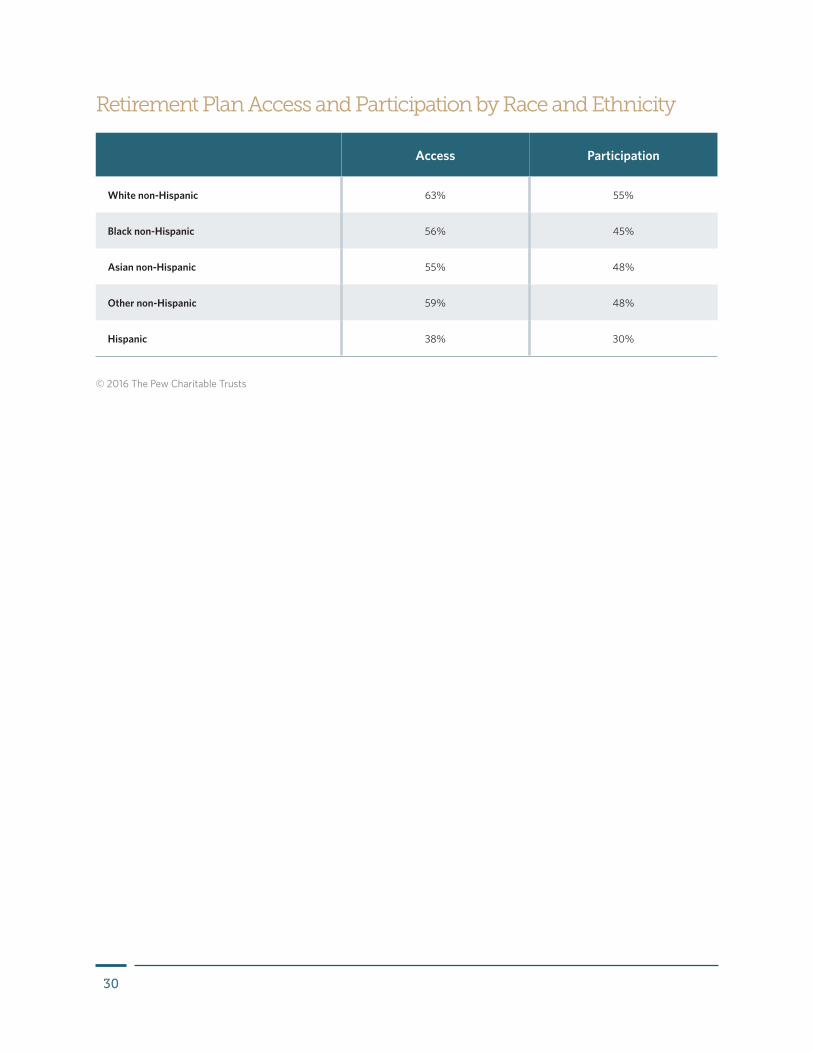
Race and ethnicityRetirement plan access and participation also vary significantly by race and ethnicity. Sixty-three percent of white non-Hispanic workers reported having access to a plan. Black non-Hispanic and Asian non-Hispanic workers had access rates that were 7 or 8 percentage points lower, at 56 percent and 55 percent, respectively. The gap grew larger—to 25 percentage points—when comparing white workers with Hispanic workers. Only 38 percent of Hispanic workers said they had access to an employer-based retirement plan. Participation patterns proved largely consistent with access rates.
Minority populations are not equally distributed across the United States. For example, Hispanics made up 16 percent of workers in the nationwide sample but accounted for more than a third of the full-time private-sector workforce in New Mexico, California, and Texas. (See Figure 10.) By contrast, in states such as Maine and Vermont, Hispanics totaled less than 5 percent of workers. Nationwide, Asians made up about 6 percent of workers in the analysis group, but in Hawaii this group accounted for close to half. Black workers were more heavily concentrated in the South. For instance, 32 percent of workers in Mississippi were black, compared with approximately 10 percent in the U.S. as a whole.
In the context of retirement savings, race and ethnicity can serve as a proxy for economic variables such as

21
Figure 10
Percentage of Workers Who Are HispanicHispanic workers more prevalent in the West
New MexicoCalifornia
TexasArizonaNevadaFlorida
New JerseyColorado
New York50 States
IdahoIllinois
UtahRhode Island
NebraskaMaryland
WashingtonOregon
ConnecticutNorth Carolina
DelawareWyomingOklahoma
HawaiiVirginia
MassachusettsGeorgiaKansas
ArkansasAlaska
WisconsinIndiana
IowaPennsylvania
TennesseeLouisianaKentucky
South CarolinaMinnesota
AlabamaMichigan
South DakotaOhio
MissouriMississippi
MontanaNorth Dakota
New HampshireWest Virginia
VermontMaine
0% 10% 20% 30% 40%5% 15% 25% 35% 45% 50%
© 2016 The Pew Charitable Trusts

22
income, wealth, job type, or industry of employment. Differences in these characteristics by race and ethnicity can be stark. For example, a previous analysis of CPS data found that in 2012, the median income for white non-Hispanic households was $57,009. For black and Hispanic households, the comparable figures were $33,321 and $39,005, respectively.63 Over time, these differences can result in large disparities in wealth by race and ethnicity.64
There are also retirement issues unique to certain groups—particularly African-Americans and Hispanics. … Their relationship with our financial services industry can be characterized as lacking and in need of significantly more attention.”Luis A. Aguilar, commissioner of the Securities and Exchange Commission, statement at the American Retirement Initiative’s winter summit, 2014
In addition to economic considerations, race and ethnicity may affect retirement savings behavior in other ways, such as lower levels of trust and comfort with financial institutions and the investment process in general. For example, a 2008 survey of investors found that black households show substantial interest in steps to boost confidence and education in money matters, such as employer-based one-on-one consultations with financial advisers.65 A greater percentage of black than white households said this type of outreach would encourage them to increase investments in defined contribution plans.66 In addition to a lack of trust in financial institutions, Hispanics have noted factors such as language barriers and problems using nontraditional forms of identification as reasons for staying away from mainstream financial services.67 Additional factors, such as differences in family structure or age distribution by race and ethnicity, also may play a role in retirement saving disparities.68
Implications for policyStates are exploring initiatives to boost both access to retirement savings plans in the workplace and participation in these programs. Policymakers would benefit from considering employer and employee characteristics relevant in their states or jurisdictions in designing legislation and policies.
Because most retirement saving takes place within workplace plans, many efforts to increase savings focus on the types of employers (notably small firms) or the industries that have low rates of offering retirement plans. States with low rates of access may need to balance policy objectives against the concerns of small firms, which often face intense competitive and profitability challenges.
For example, many new retirement savings initiatives set a minimum number of employees for an employer to be included in a mandatory program, typically exempting entrepreneurs and very small enterprises. In Illinois, for instance, the plan applies only to businesses with at least 25 employees.69 Such thresholds, however, could mean that a retirement savings program will miss many workers, particularly in states where higher percentages of employees work in small firms, such as Montana and Wyoming. These types of trade-offs merit additional study. Pew will conduct research analyzing state reform proposals with an emphasis on examining small employers and their reasons for sponsoring or not sponsoring retirement savings plans.

23
Worker characteristics also can affect the design and implementation of policy. For example, policymakers in California and New Mexico could consider strategies that meet the specific needs of their large Hispanic populations. To boost participation, efforts could be made to build greater trust in financial institutions through community outreach or by making sure that Spanish-language educational material is widely available.70 In addition, there may be specific financial considerations for this population that policymakers could address explicitly in program messaging. For example, research suggests that some Hispanics are reluctant to participate in retirement savings programs because of uncertainty about the accessibility of funds if they retire in another country.71 Addressing such concerns could improve participation in existing plans, as well as any new national or state-level programs.
Moreover, relying primarily on automatic plan features to increase savings could fall short under certain scenarios. For example, research from the Employee Benefit Research Institute shows that in an automatic IRA contribution framework, a 3 percent contribution rate—as in the Illinois Secure Choice plans and in legislative proposals in several states—would have only a modest effect on long-term savings adequacy.72 Policymakers might consider using a higher default contribution rate, or a rate that gradually increases over time—known as auto-escalation—unless the employee opts out.
Policymakers and researchers could also consider whether improving financial literacy could encourage more workers to stay in a program or increase their savings levels beyond the program default. Evidence on the effectiveness of financial education in increasing household savings is mixed. Some research shows that providing information through the workplace may prove helpful.73 Additionally, some experts contend that plan sponsors could increase take-up by timing financial education efforts to correspond with specific decision-making opportunities or events, such as initial plan enrollment.74 Other research has found that financial education efforts do not lead to increased household savings.75 In summary, additional research needs to determine when and for whom financial education is effective in changing savings behavior.
Nationwide, policy proposals are aimed at enrolling a large segment of the working population. But even with new state or federal retirement savings initiatives in place, gaps in participation will probably remain. The Federal Reserve Board’s Survey of Household Economics and Decisionmaking asked workers not currently investing in an employer-based retirement savings plan to explain why not. Forty-two percent said their “employer does not offer a plan,” but the second most common response was that they were “unable to afford contributions to a retirement plan” (29 percent).76
Those responses suggest that increased access alone may not lead to increased savings for these workers. Policymakers should consider retirement savings options in the context of the broader financial challenges facing low- to moderate-income households. Providing opportunities for short-term savings or access to saved funds before retirement in some limited way, such as through loans, could encourage greater participation among those who might be reluctant to tie up money in retirement savings accounts.77 Policies that help some low-income households better manage financial shocks also could improve long-term well-being and earning potential. And that could increase the ability of these households to save more for retirement.78

24
Conclusion At a time when most retirement saving takes place in the workplace, more than 30 million full-time private-sector workers do not have access to an employer-based retirement plan. The data analyzed here show substantial differences in access and participation across the states and among workers and employers with differing characteristics.
Many states are considering or implementing reforms to encourage more businesses to offer retirement savings plans and more workers to take part. When designing these programs, policymakers must take into account employer and employee characteristics most relevant to their states or jurisdictions. The online data visualization that complements this report includes detailed information for each state.
As federal and state policymakers continue to explore approaches for improving retirement security, understanding barriers to savings and the potential outcomes associated with new initiatives will be critical. So will understanding the potential impact of these policies on employers and taxpayers. Information gained through continuing research and dialogue among employers, workers, experts, and other stakeholders can help ensure that policies are well designed and effective in helping Americans to meet tomorrow’s retirement challenges.

25
Appendix A: Summary results
State Access Participation
50 States (excluding DC) 58% 49%
AL 58% 49%
AK 62% 53%
AZ 52% 41%
AR 55% 45%
CA 51% 44%
CO 62% 52%
CT 66% 58%
DE 63% 56%
FL 46% 38%
GA 53% 45%
HI 59% 52%
ID 58% 49%
IL 62% 53%
IN 63% 57%
IA 68% 59%
KS 66% 56%
KY 59% 51%
LA 53% 44%
ME 67% 56%
MD 60% 51%
MA 61% 55%
MI 62% 53%
MN 69% 61%
MS 55% 47%
MO 64% 55%
State Access Participation
MT 61% 51%
NE 64% 54%
NV 51% 39%
NH 66% 58%
NJ 53% 47%
NM 49% 41%
NY 55% 49%
NC 58% 49%
ND 68% 59%
OH 65% 55%
OK 60% 50%
OR 64% 55%
PA 65% 56%
RI 64% 56%
SC 57% 48%
SD 67% 56%
TN 59% 49%
TX 50% 42%
UT 59% 50%
VT 66% 56%
VA 63% 55%
WA 67% 56%
WV 62% 53%
WI 70% 61%
WY 63% 53%
Retirement Plan Access and Participation
© 2016 The Pew Charitable Trusts

26
Region Access Participation
Northeast 59% 52%
Midwest 65% 56%
South 54% 46%
West 55% 47%
Retirement Plan Access and Participation by Region
© 2016 The Pew Charitable Trusts
27
State Access Participation
50 States (excluding DC) 33% 18%
AL 32% 17%
AK 33% 21%
AZ 27% 17%
AR 28% 12%
CA 28% 16%
CO 36% 22%
CT 40% 23%
DE 35% 18%
FL 26% 13%
GA 34% 15%
HI 29% 18%
ID 31% 18%
IL 36% 19%
IN 33% 19%
IA 38% 19%
KS 42% 19%
KY 33% 18%
LA 26% 13%
ME 40% 23%
MD 34% 16%
MA 35% 21%
MI 36% 19%
MN 45% 27%
MS 27% 13%
MO 36% 21%
State Access Participation
MT 37% 16%
NE 35% 18%
NV 33% 16%
NH 39% 22%
NJ 31% 16%
NM 24% 13%
NY 31% 16%
NC 30% 14%
ND 47% 24%
OH 41% 20%
OK 36% 15%
OR 40% 26%
PA 39% 22%
RI 38% 22%
SC 30% 16%
SD 45% 22%
TN 32% 14%
TX 25% 12%
UT 33% 16%
VT 39% 22%
VA 39% 19%
WA 41% 22%
WV 31% 17%
WI 41% 25%
WY 28% 14%
Retirement Plan Access and Participation for Part-Time Workers
© 2016 The Pew Charitable Trusts

28
Appendix B: Retirement plan access and participation by included characteristics
Retirement Plan Access and Participation by Employer Size
Access Participation
< 10 employees 22% 19%
10-49 employees 37% 31%
50-99 employees 52% 43%
100-499 employees 63% 53%
500+ employees 74% 64%
Access Participation
Construction 40% 34%
Manufacturing 69% 61%
Wholesale and retail trade 56% 46%
Financial activities 68% 62%
Professional and business 56% 48%
Educational and health services 64% 55%
Leisure and hospitality 34% 23%
Transportation and utilities 61% 54%
Other industries 50% 43%
Retirement Plan Access and Participation by Industry
© 2016 The Pew Charitable Trusts
© 2016 The Pew Charitable Trusts

29
Access Participation
< $25,000 32% 20%
$25,000-$49,999 56% 47%
$50,000-$99,999 71% 65%
$100,000+ 75% 72%
Access Participation
18-29 47% 34%
30-44 58% 49%
45-64 63% 57%
Access Participation
Less than high school 29% 21%
High school diploma or equivalent 51% 42%
Some college or associate’s degree 59% 50%
Bachelor’s degree or higher 69% 62%
Retirement Plan Access and Participation by Wage and Salary Income
Retirement Plan Access and Participation by Age
Retirement Plan Access and Participation by Education
© 2016 The Pew Charitable Trusts
© 2016 The Pew Charitable Trusts
© 2016 The Pew Charitable Trusts
30
Access Participation
White non-Hispanic 63% 55%
Black non-Hispanic 56% 45%
Asian non-Hispanic 55% 48%
Other non-Hispanic 59% 48%
Hispanic 38% 30%
Retirement Plan Access and Participation by Race and Ethnicity
© 2016 The Pew Charitable Trusts
31
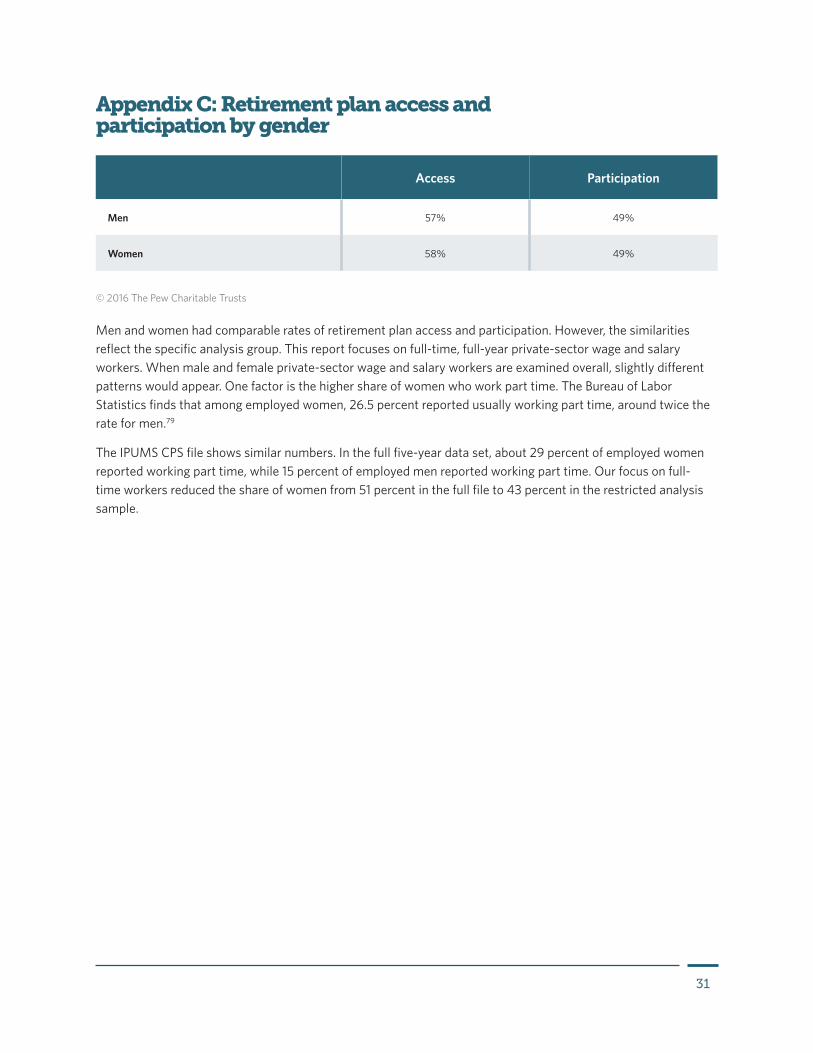
Appendix C: Retirement plan access and participation by gender
Access Participation
Men 57% 49%
Women 58% 49%
Men and women had comparable rates of retirement plan access and participation. However, the similarities reflect the specific analysis group. This report focuses on full-time, full-year private-sector wage and salary workers. When male and female private-sector wage and salary workers are examined overall, slightly different patterns would appear. One factor is the higher share of women who work part time. The Bureau of Labor Statistics finds that among employed women, 26.5 percent reported usually working part time, around twice the rate for men.79
The IPUMS CPS file shows similar numbers. In the full five-year data set, about 29 percent of employed women reported working part time, while 15 percent of employed men reported working part time. Our focus on full-time workers reduced the share of women from 51 percent in the full file to 43 percent in the restricted analysis sample.
© 2016 The Pew Charitable Trusts

32
State Number without access50 States
(excluding DC) 30,000,000
AL 400,000
AK 50,000
AZ 700,000
AR 300,000
CA 4,000,000
CO 400,000
CT 300,000
DE 80,000
FL 2,000,000
GA 1,000,000
HI 100,000
ID 100,000
IL 1,000,000
IN 500,000
IA 200,000
KS 200,000
KY 400,000
LA 400,000
ME 100,000
MD 500,000
MA 600,000
MI 800,000
MN 400,000
MS 200,000
MO 500,000
State Number without access
MT 70,000
NE 100,000
NV 300,000
NH 100,000
NJ 1,000,000
NM 100,000
NY 2,000,000
NC 800,000
ND 50,000
OH 900,000
OK 300,000
OR 200,000
PA 1,000,000
RI 80,000
SC 400,000
SD 60,000
TN 600,000
TX 3,000,000
UT 200,000
VT 50,000
VA 700,000
WA 500,000
WV 100,000
WI 400,000
WY 40,000
Appendix D: Population estimates by state
Estimated Full-Time, Full-Year Private-Sector Wage and Salary Worker Ages 18-64 Population Size in Each State Without Access to an Employer-Based Retirement Plan, Based on the Pooled IPUMS CPS
Note: All population estimates are rounded down.
© 2016 The Pew Charitable Trusts
33
Endnotes1 Melissa A.Z. Knoll, “The Role of Behavioral Economics and Behavioral Decision Making in Americans’ Retirement Savings Decisions,”
Social Security Bulletin 70, no. 4 (2010): 1–23, http://www.ssa.gov/policy/docs/ssb/v70n4/v70n4p1.pdf; Richard H. Thaler and Shlomo Benartzi, “Behavioral Economics and the Retirement Savings Crisis,” Capital Ideas (summer 2013), http://www.chicagobooth.edu/capideas/magazine/summer-2013/retirement-savings?cat=more.
2 See Investment Company Institute, “Quarterly Retirement Market Data,” accessed Nov. 10, 2015, for data on the share of total U.S. retirement assets by different sources, http://www.ici.org/research/stats/retirement. Although assets held in individual retirement accounts (IRAs) are larger than those for defined contribution plans, IRA assets largely come from defined contribution plan rollovers. See Craig Copeland, “Individual Retirement Account Balances, Contributions, and Rollovers, 2011: The EBRI IRA Database,” Employee Benefit Research Institute Issue Brief No. 386 (2013): 1, http://www.ebri.org/pdf/briefspdf/EBRI_IB_05-13.No386.IRAs.pdf.
3 Going forward, references in this report to “workers” refer to full-time, full-year wage and salary workers ages 18 to 64 unless we note otherwise.
4 U.S. Senate news releases, “Hatch Unveils Bill to Overhaul Pension Benefit System, Secure Retirement Savings,” 2013, accessed Sept. 16, 2015, http://www.hatch.senate.gov/public/index.cfm/2013/7/hatch-unveils-bill-to-overhaul-pension-benefit-system-secure-retirement-savings; “Senators Collins, Nelson Introduce Bill to Encourage Retirement Savings,” 2014, accessed Sept. 16, 2015, http://www.aging.senate.gov/press-releases/senate-bill-introduced-to-encourage-retirement-savings; “Sen. Whitehouse and Rep. Neal Introduce Retirement Savings Bill,” 2015, accessed Sept. 16, 2015, http://www.whitehouse.senate.gov/news/release/sen-whitehouse-and-rep-neal-introduce-retirement-savings-bill; “Harkin Unveils Legislation to Address Retirement Crisis, Rebuild Private Pension System,” 2014, accessed Sept. 16, 2015, http://www.help.senate.gov/ranking/newsroom/press/harkin-unveils-legislation-to-address-retirement-crisis-rebuild-private-pension-system.
5 See “myRA/my Retirement Account,” U.S. Department of the Treasury, for a summary of how the myRA program works, https://myra.gov/.
6 Although we do not test the independent effects of any of these factors, research suggests several ways in which they could influence the patterns we find across the states.
7 All of these factors are frequently interrelated.
8 Sarah Flood, Miriam King, Steven Ruggles, and J. Robert Warren, Integrated Public Use Microdata Series, Current Population Survey: Version 4.0, [Machine-readable database], Minneapolis, University of Minnesota, 2015, https://cps.ipums.org/cps/.
9 The majority of our analysis tables focus on workers ages 18-64 in the private sector, working full time for the full year. Consequently, readers should be aware that the included figures are not a complete picture of retirement savings plan coverage at a national, regional, or state level. For example, public-sector workers, who have higher rates of coverage, are not included. We focus on full-time, full-year private-sector wage and salary workers to capture the population of most interest to policymakers in the context of retirement savings plan coverage.
10 Alicia H. Munnell and Dina Bleckman, “Is Pension Coverage a Problem in the Private Sector?” Center for Retirement Research at Boston College Brief 14-7, 2014, 3, http://crr.bc.edu/wp-content/uploads/2014/04/IB_14-7-508.pdf.
11 For instance, the U.S. Bureau of Labor Statistics administers the National Compensation Survey to businesses rather than households.
12 Irena Dushi, Howard M. Iams, and Jules Lichtenstein, “Assessment of Retirement Plan Coverage by Firm Size, Using W-2 Tax Records,” Social Security Bulletin 71, no. 2 (2011): 53–65, http://www.ssa.gov/policy/docs/ssb/v71n2/v71n2p53.pdf; U.S. Government Accountability Office, “Retirement Security: Federal Action Could Help State Efforts to Expand Private Sector Coverage” (2015), 16, http://www.gao.gov/assets/680/672419.pdf.
13 All national and regional figures here and in the appendixes include data only for the 50 states, with the District of Columbia excluded. Modifying the analysis to include the District of Columbia does not alter the rounded results we report.
14 U.S. Bureau of Labor Statistics, “The Employment Situation,” accessed Sept. 16, 2015, http://www.bls.gov/news.release/pdf/empsit.pdf.
15 These figures may not accurately capture the share of workers making an active decision to participate in a workplace plan, because some may not have been eligible to do so. The Current Population Survey Annual Social and Economic Supplement does not specifically ask respondents about eligibility.
16 Aon Hewitt, “Leakage of Participants’ DC Assets: How Loans, Withdrawals, and Cashouts Are Eroding Retirement Income, 2011,” accessed Sept. 16, 2015, http://www.aon.com/attachments/thought-leadership/survey_asset_leakage.pdf; Annika Sundén and Brian Surette, “Household Borrowing from 401(k) Plans,” On Retirement Issues no. 1, Center for Retirement Research at Boston College (2000), http://crr.bc.edu/wp-content/uploads/2000/06/jtf_1.pdf.

34
17 Robert Argento, Victoria L. Bryant, and John Sabelhaus, “Early Withdrawals From Retirement Accounts During the Great Recession,” Finance and Economics Discussion Series, Divisions of Research & Statistics and Monetary Affairs, Federal Reserve Board (2013), http://www.federalreserve.gov/pubs/feds/2013/201322/201322pap.pdf; Ellen Chang, “When Consumers Should Tap Into Their IRA for Additional Money,” MainStreet, May 21, 2015, https://www.mainstreet.com/article/when-consumers-should-tap-into-their-ira-for-additional-money.
18 The Pew Charitable Trusts, “Americans’ Financial Security: Perception and Reality,” 2015, 5–6, http://www.pewtrusts.org/~/media/Assets/2015/02/FSM-Poll-Results-Issue-Brief_ARTFINAL_v3.pdf. For example, the two most frequently cited financial worries among households in a 2015 Pew survey were a lack of savings and not having enough money to cover expenses.
19 Ibid. The report defines economic shocks as events “such as a drop in income, hospital visit, loss of a spouse or partner, or a major car or house repair in the past year.”
20 The Pew Charitable Trusts, “The Precarious State of Family Balance Sheets,” 2015, 1, http://www.pewtrusts.org/~/media/Assets/2015/01/FSM_Balance_Sheet_Report.pdf. In the FINRA Investor Education Foundation’s 2012 Financial Capability Study, around 40 percent of workers were not confident they could “come up with $2,000 if an unexpected need arose within the next month.” In some states, such as Mississippi and Arkansas, this figure was closer to 50 percent. FINRA Investor Education Foundation, National Financial Capability Study, accessed July 15, 2015, http://www.usfinancialcapability.org/.
21 Many of these factors are interrelated, and this brief only broadly illustrates the complex demographic, economic, social, and psychological framework that can influence how workers approach retirement. Additionally, readers should be aware that this analysis studies each variable on its own and that the results would vary if controlling for other factors.
22 Peter Brady and Michael Bogdan, “Who Gets Retirement Plans and Why, 2013,” ICI Research Perspective 20, no. 6 (2014): 6, http://www.ici.org/pdf/per20-06.pdf. In support of this hypothesis, Brady and Bogdan find substantial differences in the employee characteristics between firms that offer retirement plans and firms that do not. Workers at firms without retirement plans are younger, have lower earnings, and are more likely to work part time compared with workers at firms that do offer plans.
23 For a detailed analysis of the share of employers offering retirement plans at the state level, see Teresa Ghilarducci and Joelle Saad-Lessler, “Explaining the Decline in the Offer Rate of Employer Retirement Plans Between 2003 and 2012,” ILR Review 68, no. 4 (2015): 807–832 http://ilr.sagepub.com/content/68/4/807.
24 For research on how various factors influence retirement plan contributions, see Christopher R. Tamborini, Patrick Purcell, and Howard M. Iams, “The Relationship Between Job Characteristics and Retirement Savings in Defined Contribution Plans,” Bureau of Labor Statistics Monthly Labor Review (May 2013): 3–16, http://www.bls.gov/opub/mlr/2013/article/retirement-savings-in- defined-contribution-plans.htm.
25 Other research using administrative data, rather than self-reported information, shows higher rates of access but similar patterns by firm size. Irena Dushi, Howard M. Iams, and Jules Lichtenstein, “Retirement Plan Coverage by Firm Size: An Update,” Social Security Bulletin 75, no. 2 (2015): 45, http://www.ssa.gov/policy/docs/ssb/v75n2/v75n2p41.html. The authors looked at private-sector wage and salary workers ages 21-64 in the 2012 Survey of Income and Program Participation and found access rates of 28 percent for workers at firms with fewer than 10 employees and 73 percent for workers at firms with 50 to 99 employees. The authors also found that retirement plan access for workers at firms with fewer than 10 employees fell significantly from 2006, when it was 34 percent.
26 These results echo findings from other sources. For example, based on data from the Census Bureau’s Statistics of U.S. Businesses, the percentage of workers at establishments with fewer than 10 employees ranges from 8.9 percent for Nevada to 18.9 percent for Montana.
27 Main Street Alliance and American Sustainable Business Council, “Poll Report: Small Business Owners’ Views on Retirement Security,” 2013, http://asbcouncil.org/sites/default/files/library/docs/asbc_retirement_poll_report_june2013.pdf.
28 Along with the Employee Benefit Research Institute, the survey was co-organized by the American Savings Education Council and Mathew Greenwald & Associates.
29 Employee Benefit Research Institute, “Small Employers Without Plans,” Small Employer Retirement Survey, 2003, accessed Sept. 16, 2015, http://www.ebri.org/pdf/surveys/sers/2003/03sersf1.pdf.
30 Employee Benefit Research Institute, “Small Employers Without Plans.”
31 William J. Dennis Jr. (ed.), “Retirement,” NFIB National Small Business Poll, vol. 5, issue 3 (2005): 1, http://411sbfacts.com/files/RetirementpollFINAL%5B1%5D.pdf.
32 U.S. Department of Labor, “Choosing a Retirement Solution for Your Small Business,” accessed Sept. 16, 2015, http://www.dol.gov/ebsa/publications/choosing.html.
33 Employee Benefit Research Institute, “The 2001 Small Employer Retirement Survey (SERS) Summary of Findings,” accessed Sept. 16, 2015, http://www.ebri.org/pdf/surveys/sers/2001/01serses.pdf.

35
34 William E. Even and David A. Macpherson, “Improving Pension Coverage at Small Firms,” in Overcoming Barriers to Entrepreneurship, ed. Diana Furchtgott-Roth (Lanham, MD: Rowman & Littlefield, 2008), http://www.trinity.edu/dmacpher/Pdfs/covg%20and%20firm%20size.pdf.
35 We have collapsed several smaller industry categories that appear in the IPUMS CPS within our “other industry” heading. See the methodology document for details.
36 In the baseline major industry data, agricultural workers had the lowest rates of workplace retirement plan access. However, a small share of workers within our specific analysis group was in this industry, and in our summary measures we have combined the agriculture group with several other industry categories where few workers were represented.
37 The full list of jobs included in leisure and hospitality is: independent artists, performing arts, spectator sports, and related industries; museums, art galleries, historical sites, and similar institutions; bowling centers; other amusement, gambling, and recreation industries; accommodation; traveler accommodation; recreational vehicle parks and camps, and rooming and boarding houses; restaurants and other food services; drinking places, alcoholic beverages.
38 John L. Bishow, “The Relationship Between Access to Benefits and Weekly Work Hours,” U.S. Bureau of Labor Statistics Monthly Labor Review (June 2015), http://www.bls.gov/opub/mlr/2015/article/pdf/the-relationship-between-access-to-benefits-and-weekly-work-hours.pdf.
39 U.S. Bureau of Labor Statistics, “Job Openings and Labor Turnover—September 2015,” news release, http://www.bls.gov/news.release/pdf/jolts.pdf.
40 Bureau of Labor Statistics, economic news release, “Table 5: Median Years of Tenure With Current Employer for Employed Wage and Salary Workers by Industry, Selected Years, 2004-14,”, last modified Sept. 18, 2014, http://www.bls.gov/news.release/tenure.t05.htm.
41 Data for different industries are available in BLS’ “Industries at a Glance,” accessed Sept. 16, 2015, http://www.bls.gov/iag/home.htm.
42 For various measures of economic performance by industry, see “The Least Profitable U.S. Industries,” Sageworks, accessed Sept. 16, 2015, https://www.sageworks.com/pdf/Data_Release__04272015.pdf; and Damodaran Online, “Data: Current,” accessed Sept. 16, 2015, http://pages.stern.nyu.edu/~adamodar/New_Home_Page/datacurrent.html.
43 Bureau of Labor Statistics, economic news release, “Table 3: Union Affiliation of Employed Wage and Salary Workers by Occupation and Industry,” last modified Jan. 23, 2015, http://www.bls.gov/news.release/union2.t03.htm.
44 George I. Long, “Differences Between Union and Nonunion Compensation, 2001-2011,” Bureau of Labor Statistics Monthly Labor Review, April 2013, http://www.bls.gov/opub/mlr/2013/04/art2full.pdf; Government Accountability Office, “Pension Plans: Characteristics of Persons in the Labor Force Without Pension Coverage,” Report to Congressional Requesters, 2000, http://www.gao.gov/assets/230/229464.pdf. Unionization, of course, is not the only explanation for retirement plan access and coverage. For example, the comparable union coverage rate for workers in the “financial activities” industry was 2.4 percent, and workers in this industry have one of the highest access and coverage rates in the IPUMS CPS analysis. As Long notes, “Differences in union and nonunion pay and benefits may reflect factors other than a union presence.”
45 Bureau of Labor Statistics, economic news release, “Table 5: Union Affiliation of Employed Wage and Salary Workers by State,” last modified Jan. 23, 2015, http://www.bls.gov/news.release/union2.t05.htm.
46 Ghilarducci and Saad-Lessler, “Explaining the Decline in the Offer Rate,” 807–832.
47 Bureau of Labor Statistics, “Labor Force Statistics From the Current Population Survey, 18b: Employed Persons by Detailed Industry and Age,” last modified Feb. 12, 2015, http://www.bls.gov/cps/cpsaat18b.htm.
48 Harry J. Holzer et al., “Where Are All the Good Jobs Going? What National and Local Job Quality and Dynamics Mean for U.S. Workers,” Russell Sage Foundation, 2011; Arne Kalleberg, “Good Jobs, Bad Jobs: The Rise of Polarized and Precarious Employment Systems in the United States 1970s to 2000s,” Russell Sage Foundation, 2013. See Holzer et al. for a discussion of job quality and recent trends in this area. Kalleberg also discusses job quality as a function of pay, work conditions, and access to health and retirement benefits.
49 Congressional Budget Office, “The Distribution of Major Tax Expenditures in the Individual Income Tax System,” accessed Sept. 16, 2015, https://www.cbo.gov/sites/default/files/113th-congress-2013-2014/reports/43768_DistributionTaxExpenditures.pdf. Higher average wages in a business may make offering a retirement plan and other benefits more attractive, in part because the associated tax incentives are generally larger for higher earners.
50 Bureau of Labor Statistics, “May 2014 National Industry-Specific Occupational Employment and Wage Estimates,” last modified March 25, 2015, http://www.bls.gov/oes/current/oessrci.htm.
51 The Pew Charitable Trusts, “Survey of American Family Finances, Top-Lines Accompanying ‘Americans’ Financial Security: Perception and Reality,’ ” 2015, 4, http://www.pewtrusts.org/~/media/assets/2015/03/fsm-poll-results-toplines_artfinal_v3.pdf.

36
52 The Pew Charitable Trusts, “The Precarious State of Family Balance Sheets,” 3.
53 Low lifetime earners also may require less in savings to maintain their pre-retirement standard of living because of Social Security’s progressive benefit formula.
54 Scott A. Wolla, “Smoothing the Path: Balancing Debt, Income, and Saving for the Future,” Federal Reserve Bank of St. Louis Page One Economics Newsletter (November 2014): 1–5, https://research.stlouisfed.org/pageone-economics/uploads/newsletter/2014/PageOne1114NEW.pdf; Barry Bosworth, Gary T. Burtless, and C. Eugene Steuerle, “Lifetime Earnings Patterns, The Distribution of Future Social Security Benefits, and the Impact of Pension Reform,” Center for Retirement Research at Boston College, http://www.urban.org/research/publication/lifetime-earnings-patterns-distribution-future-social-security-benefits-and-impact-pension-reform/view/full_report.
55 Marina Vornovytskyy, Alfred Gottschalck, and Adam Smith, “Household Debt in the U.S.: 2000 to 2011” (2013), U.S. Census Bureau, https://www.census.gov/people/wealth/files/Debt%20Highlights%202011.pdf.
56 The Pew Charitable Trusts, “The Complex Story of American Debt,” 2015, 3, http://www.pewtrusts.org/~/media/Assets/2015/07/Reach-of-Debt-Report_ARTFINAL.pdf.
57 Alicia H. Munnell, Annika Sunden, and Catherine Taylor, “What Determines 401(k) Participation and Contributions?” Social Security Bulletin 64, no. 3 (2001/2002): 64–75, http://ssa.gov/policy/docs/ssb/v64n3/v64n3p64.pdf.
58 The authors’ analysis used the Survey Documentation and Analysis (SDA) online tool, available at http://www.federalreserve.gov/econresdata/scf/scfindex.htm; for more detail on savings motives and behavior, see Jing J. Xiao, “Saving Motives and 401(k) Contributions,” Financial Counseling and Planning 8, no. 2 (1997), https://afcpe.org/assets/pdf/vol828.pdf.
59 Anthony P. Carnevale, Stephen J. Rose, and Ban Cheah, “The College Payoff: Education, Occupations, Lifetime Earnings,” Georgetown University Center on Education and the Workforce (2014), accessed Sept. 16, 2015, https://cew.georgetown.edu/wp-content/uploads/2014/11/collegepayoff-complete.pdf. Note that the differences in lifetime earnings cannot be wholly attributed to the degree itself and may in part reflect the underlying capabilities and characteristics of those individuals obtaining additional formal education.
60 Bureau of Labor Statistics, “Educational Attainment for Workers 25 Years and Older by Detailed Occupation,” last modified Dec. 19, 2013, http://www.bls.gov/emp/ep_table_111.htm.
61 Annamaria Lusardi and Olivia S. Mitchell, “How Ordinary Consumers Make Complex Economic Decisions: Financial Literacy and Retirement Readiness,” National Bureau of Economic Research, Working Paper No. 15350 (2009), http://www.nber.org/papers/w15350.pdf; Julie R. Agnew et al., “Do Financial Literacy and Mistrust Affect 401(k) Participation?,” Center for Retirement Research at Boston College Brief, 7–17 (2007), http://crr.bc.edu/wp-content/uploads/2007/11/IB_7-17.pdf.
62 Annamaria Lusardi and Olivia S. Mitchell, “Baby Boomer Retirement Security: The Roles of Planning, Financial Literacy, and Housing Wealth,” National Bureau of Economic Research, Working Paper No. 12585 (2006), http://www.nber.org/papers/w12585.pdf. Previous research has shown that, compared with less educated groups, older workers with a bachelor’s degree or higher are more likely to be able to correctly answer various financial literacy questions, such as how to calculate compound interest, which is a key concept in understanding the benefits of long-term savings.
63 Carmen DeNavas-Walt, Bernadette D. Proctor, and Jessica C. Smith, “Income, Poverty and Health Insurance Coverage in the United States: 2012,” U.S. Census Bureau (2013), https://www.census.gov/prod/2013pubs/p60-245.pdf.
64 Rakesh Kochhar and Richard Fry, “Wealth Inequality Has Widened Along Racial, Ethnic Lines Since End of Great Recession,” Pew Research Center (2014), http://www.pewresearch.org/fact-tank/2014/12/12/racial-wealth-gaps-great-recession/.
65 Ariel Investments LLC/The Charles Schwab Corp., “The Ariel/Schwab Black Investor Survey: Saving and Investing Among Higher Income African-American and White Americans,” 2008, accessed Sept. 16, 2015, https://www.arielinvestments.com/landmark-surveys/.
66 Tristan Mabry, “Black Investors Lack Trust in Brokers, Shy Away From Investing in Stocks,” The Wall Street Journal, May 14, 1999, http://www.wsj.com/articles/SB926636527156960101; U.S. Department of Labor, “Disparities for Women and Minorities in Retirement Savings,” 2010, accessed Sept. 16, 2015, http://www.dol.gov/ebsa/publications/2010ACreport3.html. Other research suggests that historically based trust and comfort issues are an ongoing concern for certain minority populations. In addition, Agnew et al. (2007) find that mistrust is a negative, significant predictor of 401(k) plan participation in an automatic enrollment plan structure but is not significant in a voluntary program (Julie R. Agnew et al., “Do Financial Literacy and Mistrust Affect 401(k) Participation?”). The Federal Deposit Insurance Corp. reported that approximately one-third of those without a bank account reported distrust in or dislike of banks as one reason they were unbanked. (See “2013 FDIC National Survey of Unbanked and Underbanked Households,” 2014, https://www.fdic.gov/householdsurvey/2013report.pdf.)
67 Federal Deposit Insurance Corp., “2013 FDIC National Survey of Unbanked and Underbanked Households.” Alliance for Stabilizing our Communities, “Banking in Color: New Findings on Financial Access for Low- and Moderate Income Communities,” 2014, http://publications.nclr.org/bitstream/handle/123456789/1203/bankingincolor_web.pdf?sequence=1&isAllowed=y.

37
68 For an overview of the effects of children on wealth accumulation, see for example John Karl Scholz and Ananth Seshadri, “Children and Household Wealth,” 2009, http://www.ssc.wisc.edu/~scholz/Research/Children.pdf.
69 Before amendment, the Illinois plan legislation set the threshold at 10 or more employees. Illinois General Assembly, “Bill Status of S.B. 2758,” accessed Sept. 16, 2015, http://www.ilga.gov/legislation/BillStatus.asp?DocTypeID=SB&DocNum=2758&GAID=12&SessionID=85&LegID=78572.
70 National Council of La Raza, “Latino Financial Access and Inclusion in California,” 2013, http://publications.nclr.org/bitstream/handle/123456789/1123/CA_Latino_Financial_Access_ReportWeb.pdf?sequence=1&isAllowed=y.
71 Prudential, “The Hispanic American Financial Experience,” 2014, https://www.prudential.com/media/managed/hispanic_en/prudential_hafe_researchstudy_2014_en.pdf.
72 Jack VanDerhei, “Auto-IRAs: How Much Would They Increase the Probability of ‘Successful’ Retirements and Decrease Retirement Deficits? Preliminary Evidence from EBRI’s Retirement Security Projection Model,” EBRI Notes 36, no. 6 (2015): 11–29, http://www.ebri.org/pdf/notespdf/EBRI_Notes_06_June15_SI-AutoIRAs.pdf
73 William G. Gale, Benjamin H. Harris, and Ruth Levine, “Raising Household Saving: Does Financial Education Work?” Social Security Bulletin. 72 no. 2 (2012): 39–48, http://www.ssa.gov/policy/docs/ssb/v72n2/v72n2p39.pdf; Aimee D. Prawitz and Judith Cohart, “Workplace Financial Education Facilitates Improvement in Personal Financial Behaviors,” Journal of Financial Counseling and Planning. 25, Issue 1 (2014): 5–26, http://afcpe.org/assets/pdf/volume_25_1/04088_pg5-26.pdf.
74 For perspective on the mixed evidence for financial education and the case for “just in time” teaching, see Daniel Fernandes, John G. Lynch Jr., and Richard G. Netemeyer, “Financial Literacy, Financial Education, and Downstream Financial Behaviors,” Management Science, 2013, http://www.researchgate.net/profile/Daniel_Fernandes6/publication/259763070_Financial_Literacy_Financial_Education_and_Downstream_Financial_Behaviors/links/54ad6dc30cf2213c5fe3f890.pdf.
75 Annamaria Lusardi and Olivia S. Mitchell, “The Economic Importance of Financial Literacy: Theory and Evidence,” Journal of Economic Literature 52, no. 1 (2014): 5–44, http://www.umass.edu/preferen/You%20Must%20Read%20This/Financial%20Literacy%20JEP%202014.pdf.
76 Board of Governors of the Federal Reserve System, Report on the Economic Well-Being of U.S. Households in 2014 (2015), 40, http://www.federalreserve.gov/econresdata/2014-report-economic-well-being-us-households-201505.pdf.
77 For example, the Government Accountability Office finds that loan availability` encourages participation in 401(k) plans. See Government Accountability Office, “401(k) Pension Plans: Loan Provisions Enhance Participation but May Affect Income Security for Some,” Report to the Chairman, Senate Special Committee on Aging and Senator Judd Gregg, 1997, http://www.gao.gov/assets/230/224713.pdf. For additional research related to this issue, see John Beshears et al., “Optimal Illiquidity,” National Bureau of Economic Research, 2014, http://eml.berkeley.edu/~webfac/seminars/Optimal_Illiquidity_2014.pdf; and Munnell, Sunden, and Taylor, “What Determines 401(k) Participation and Contributions?” 64–75.
78 Robert Lerman and Signe-Mary McKernan, “The Effects of Holding Assets on Social and Economic Outcomes of Families: A Review of Theory and Evidence,” the Urban Institute, 2008, http://aspe.hhs.gov/hsp/07/poorfinances/Effects/report.pdf.
79 U.S. Bureau of Labor Statistics, “Women in the Labor Force: A Databook,” Report 1040, 2013, accessed Sept. 16, 2015, 74–76 http://www.bls.gov/cps/wlf-databook-2012.pdf.


pewtrusts.org Philadelphia Washington