WHOLE-CANOPY PHOTOSYNTHESIS AND TRANSPIRATION …
261
WHOLE-CANOPY PHOTOSYNTHESIS AND TRANSPIRATION UNDER REGULATED DEFICIT IRRIGATION IN VITIS VINIFERA L. CV. CABERNET SAUVIGNON By JORGE ESTEBAN PEREZ PEÑA A dissertation submitted in partial fulfillment of the requirements for the degree of DOCTOR OF PHILOSOPHY WASHINGTON STATE UNIVERSITY Department of Horticulture and Landscape Architecture DECEMBER 2004 © Copyright by JORGE ESTEBAN PEREZ PEÑA, 2004 All Rights Reserved
Transcript of WHOLE-CANOPY PHOTOSYNTHESIS AND TRANSPIRATION …

WHOLE-CANOPY PHOTOSYNTHESIS AND TRANSPIRATION UNDER
REGULATED DEFICIT IRRIGATION IN VITIS VINIFERA L.
CV. CABERNET SAUVIGNON
By
JORGE ESTEBAN PEREZ PEÑA
A dissertation submitted in partial fulfillment ofthe requirements for the degree of
DOCTOR OF PHILOSOPHY
WASHINGTON STATE UNIVERSITYDepartment of Horticulture and Landscape Architecture
DECEMBER 2004
© Copyright by JORGE ESTEBAN PEREZ PEÑA, 2004All Rights Reserved

© Copyright by JORGE ESTEBAN PEREZ PEÑA, 2004All Rights Reserved

iiii
To the Faculty of Washington State University:
The members of the Committee appointed to examine the dissertation of JORGE
ESTEBAN PEREZ PEÑA find it satisfactory and recommend that it be accepted
Chair

iiiiii
ACKNOWLEDGMENT
I wish to acknowledge the opportunity to study at Washington State University.
Attending classes and studying in another language, and meeting with people from
different countries and cultures was a very nice experience. To the WSU Horticulture
and Landscape Architecture Department and the Instituto Nacional de Tecnología
Agropecuaria (INTA) of Argentina for their financial support, the latter for keeping my job
at Mendoza Experimental Station. Big thanks to my steering committee Julie Tarara,
Markus Keller, Hal Collins, Gerry Edwards and Sara Spayd. Especially I want to thank
Julie for her support, freedom, and her patience correcting my "Spanglish" manuscripts,
and Markus for our viticulture talks and Friday’s wine meetings. Thanks to Ste. Michelle
Wine Estates and Dr. Russell Smithyman for allowing me to conduct this research in
their vineyards. My special thanks to the people who worked with me in the field and lab:
Megan, Heather, Becky, Babette, Pat, John, and Gwen. Special thanks to John
Ferguson for his help in the vineyard, logistics of the set up of the system, programming
and electronics. Also to Bob Wample who encouraged me to come to study in the USA.
To the American Society for Enology and Viticulture, the Washington Association of
Wine Grape Growers and the Washington State Grape Society for the scholarships and
to the funding organizations of this project: American Vineyard Foundation, Viticulture
Consortium, Northwest Center for Small Fruits Research and Ste. Michelle Wine Estates
Distinguished Professorship. Last but not least, very special thanks to my wife Marti who
supported me and waited for me during long days in the field and in the lab.

iviv
WHOLE-CANOPY PHOTOSYNTHESIS AND TRANSPIRATION UNDER REGULATED
DEFICIT IRRIGATION IN VITIS VINIFERA L.
CV. CABERNET SAUVIGNON
Abstract
by Jorge Esteban Perez Peña, Ph.D.Washington State University
December 2004
Chair: Julie M. Tarara
Influences of water deficits in grapevines have been studied worldwide in recent
years because of their influence on wine quality and water savings. To approach these
issues, grape growers have adopted regulated deficit irrigation (RDI) that consists of
applying less water than full vine evapotranspiration (FVET) to limit water use to that
amount just needed to ripen the crop, achieve the fruit characteristics demanded by
winemakers, and end the season with a plant prepared for winter and the following
budbreak. For a better understanding of RDI on vine physiology, whole-canopy gas
exchange rates (CO2 and H2Ov) were measured by a six-chamber, mobile field
laboratory designed, built, and tested in 2001. Measurements were taken in 2002 and
2003 at five times during the season (fruit set, pre- and post-veraison, and pre-and
post-harvest) in a drip irrigated vineyard of cv. Cabernet Sauvignon under three
regimens of RDI: 1) standard deficit (S; replacement of 70% of FVET); 2) early deficit (E;
replacement of 35% of FVET between fruit set and veraison); and 3) late deficit (V;
replacement of 35% of FVET between veraison and harvest). At the same time,
vv
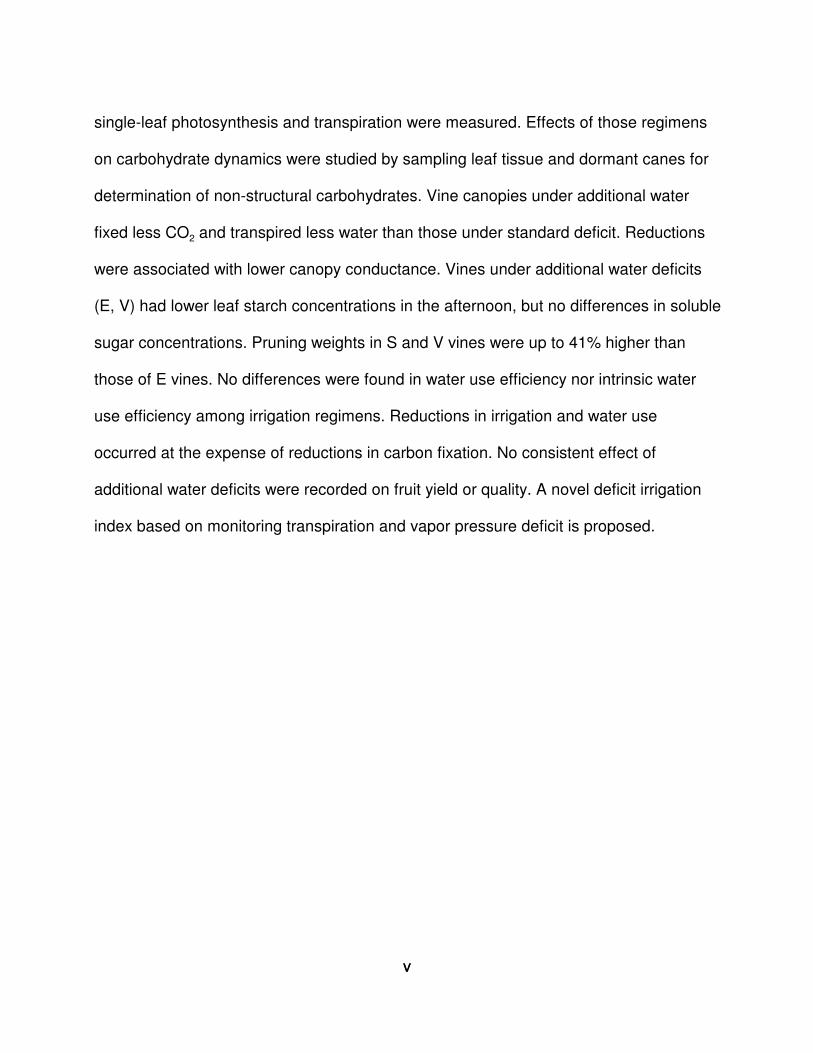
single-leaf photosynthesis and transpiration were measured. Effects of those regimens
on carbohydrate dynamics were studied by sampling leaf tissue and dormant canes for
determination of non-structural carbohydrates. Vine canopies under additional water
fixed less CO2 and transpired less water than those under standard deficit. Reductions
were associated with lower canopy conductance. Vines under additional water deficits
(E, V) had lower leaf starch concentrations in the afternoon, but no differences in soluble
sugar concentrations. Pruning weights in S and V vines were up to 41% higher than
those of E vines. No differences were found in water use efficiency nor intrinsic water
use efficiency among irrigation regimens. Reductions in irrigation and water use
occurred at the expense of reductions in carbon fixation. No consistent effect of
additional water deficits were recorded on fruit yield or quality. A novel deficit irrigation
index based on monitoring transpiration and vapor pressure deficit is proposed.

vivi
TABLE OF CONTENTS
ACKNOWLEDGMENT . . . . . . . . . . . . . . . . . . . . . . . . . . . . . . . . . . . . . . . . . . . . . . . . . iii
ABSTRACT . . . . . . . . . . . . . . . . . . . . . . . . . . . . . . . . . . . . . . . . . . . . . . . . . . . . . . . . . iv
LIST OF ABBREVIATIONS . . . . . . . . . . . . . . . . . . . . . . . . . . . . . . . . . . . . . . . . . . . . . xi
LIST OF TABLES . . . . . . . . . . . . . . . . . . . . . . . . . . . . . . . . . . . . . . . . . . . . . . . . . . . . xvi
LIST OF FIGURES . . . . . . . . . . . . . . . . . . . . . . . . . . . . . . . . . . . . . . . . . . . . . . . . . . . xviii
Dedication . . . . . . . . . . . . . . . . . . . . . . . . . . . . . . . . . . . . . . . . . . . . . . . . . . . . . . . . . xxvi
CHAPTER 1
GENERAL INTRODUCTION . . . . . . . . . . . . . . . . . . . . . . . . . . . . . . . . . . . . . . . 1
References . . . . . . . . . . . . . . . . . . . . . . . . . . . . . . . . . . . . . . . . . . . . . . 21
CHAPTER 2
A PORTABLE WHOLE-CANOPY GAS EXCHANGE SYSTEM
FOR SEVERAL MATURE FIELD-GROWN GRAPEVINES . . . . . . . . . 37
2.1. Abstract . . . . . . . . . . . . . . . . . . . . . . . . . . . . . . . . . . . . . . . . . . . . . 37
2.2. Introduction . . . . . . . . . . . . . . . . . . . . . . . . . . . . . . . . . . . . . . . . . . 38
2.3. Materials and methods . . . . . . . . . . . . . . . . . . . . . . . . . . . . . . . . . . 40
2.3.1. Chamber design . . . . . . . . . . . . . . . . . . . . . . . . . . . . . . . 40
2.3.2. System operation and testing . . . . . . . . . . . . . . . . . . . . . 44
2.4. Results and Discussion . . . . . . . . . . . . . . . . . . . . . . . . . . . . . . . . . 47
2.4.1. Chamber design and operation . . . . . . . . . . . . . . . . . . . . 47
2.4.2. Chamber microclimate . . . . . . . . . . . . . . . . . . . . . . . . . . . 48

viivii
2.4.3. Net gas exchange . . . . . . . . . . . . . . . . . . . . . . . . . . . . . . 51
2.5. Conclusion . . . . . . . . . . . . . . . . . . . . . . . . . . . . . . . . . . . . . . . . . . . 52
2.6. References . . . . . . . . . . . . . . . . . . . . . . . . . . . . . . . . . . . . . . . . . . . 54
CHAPTER 3
GRAPEVINE PHOTOSYNTHESIS AND NON-STRUCTURAL
CARBOHYDRATES UNDER REGULATED DEFICIT IRRIGATION . . . 67
3.1. Abstract . . . . . . . . . . . . . . . . . . . . . . . . . . . . . . . . . . . . . . . . . . . . . 67
3.2. Introduction . . . . . . . . . . . . . . . . . . . . . . . . . . . . . . . . . . . . . . . . . . 68
3.3. Materials and methods . . . . . . . . . . . . . . . . . . . . . . . . . . . . . . . . . . 73
3.3.1. Site and treatments . . . . . . . . . . . . . . . . . . . . . . . . . . . . . 73
3.3.2. Physiological Measurements . . . . . . . . . . . . . . . . . . . . . . 76
3.3.2.1. Whole-canopy net CO2 exchange rate
(NCEWV) . . . . . . . . . . . . . . . . . . . . . . . . . . . . . . . . . . . . . . 76
3.3.2.2. Leaf area estimation . . . . . . . . . . . . . . . . . . . . . . 77
3.3.2.3. Single leaf net CO2 exchange (NCESL) . . . . . . . . 78
3.3.3. Leaf non-structural carbohydrates . . . . . . . . . . . . . . . . . . 78
3.3.3.1. Soluble sugars (ss) and starch extraction . . . . . . 79
3.3.3.2. Soluble sugars (ss) and starch analysis . . . . . . . 80
3.3.4. Statistical analysis . . . . . . . . . . . . . . . . . . . . . . . . . . . . . . 82
3.4. Results . . . . . . . . . . . . . . . . . . . . . . . . . . . . . . . . . . . . . . . . . . . . . . 83
3.4.1. Meteorological and irrigation summary . . . . . . . . . . . . . . . 83
3.4.2. Canopy leaf area . . . . . . . . . . . . . . . . . . . . . . . . . . . . . . . 84

viiiviii
3.4.3. Total daily canopy net CO2 exchange (NCEWV,d,
NCEWL,d) . . . . . . . . . . . . . . . . . . . . . . . . . . . . . . . . . . . . . . . . . . . 84
3.4.4. Diurnal trends in canopy net CO2 exchange rate
(NCEWL) . . . . . . . . . . . . . . . . . . . . . . . . . . . . . . . . . . . . . . . . . . . 86
3.4.5. Single-leaf net CO2 exchange rate (NCESL) and
stomatal conductance (gs) . . . . . . . . . . . . . . . . . . . . . . . . . . . . . 88
3.4.6. Non-structural carbohydrates . . . . . . . . . . . . . . . . . . . . . . 89
3.5. Discussion . . . . . . . . . . . . . . . . . . . . . . . . . . . . . . . . . . . . . . . . . . . 90
3.6. Conclusion . . . . . . . . . . . . . . . . . . . . . . . . . . . . . . . . . . . . . . . . . . . 97
3.7. References . . . . . . . . . . . . . . . . . . . . . . . . . . . . . . . . . . . . . . . . . . . 99
APPENDIX 3 . . . . . . . . . . . . . . . . . . . . . . . . . . . . . . . . . . . . . . . . . . . . 132
CHAPTER 4
GRAPEVINE TRANSPIRATION UNDER REGULATED DEFICIT
IRRIGATION AND ITS RELATION TO NET CO2 EXCHANGE . . . . . 145
4.1. Abstract . . . . . . . . . . . . . . . . . . . . . . . . . . . . . . . . . . . . . . . . . . . . 145
4.2. Introduction . . . . . . . . . . . . . . . . . . . . . . . . . . . . . . . . . . . . . . . . . 146
4.3. Materials and methods . . . . . . . . . . . . . . . . . . . . . . . . . . . . . . . . . 148
4.3.1. Site and treatments . . . . . . . . . . . . . . . . . . . . . . . . . . . . 148
4.3.2. Physiological measurements . . . . . . . . . . . . . . . . . . . . . 149
4.3.3. Statistical analysis . . . . . . . . . . . . . . . . . . . . . . . . . . . . . 152
4.3.4. Proposed water deficit index (DI) for RDI . . . . . . . . . . . . 152
4.4. Results . . . . . . . . . . . . . . . . . . . . . . . . . . . . . . . . . . . . . . . . . . . . . 154

ixix
4.4.1. Meteorological and irrigation summary . . . . . . . . . . . . . . 154
4.4.2. Total daily whole-canopy transpiration (TrWV,d and
TrWL,d) . . . . . . . . . . . . . . . . . . . . . . . . . . . . . . . . . . . . . . . . . . . . 154
4.4.3. Instantaneous transpiration rates: whole-canopy and
single-leaf . . . . . . . . . . . . . . . . . . . . . . . . . . . . . . . . . . . . . . . . . 155
4.4.4.Canopy conductance (gc) and vapor pressure deficits
(VPD and VPDla) . . . . . . . . . . . . . . . . . . . . . . . . . . . . . . . . . . . . 157
4.4.5. Relationships of NCE with other variables, and WUE . . 158
4.4.6. Proposed water deficit index (DI): an example . . . . . . . 159
4.5. Discussion . . . . . . . . . . . . . . . . . . . . . . . . . . . . . . . . . . . . . . . . . . 160
4.6. Conclusion . . . . . . . . . . . . . . . . . . . . . . . . . . . . . . . . . . . . . . . . . . 165
4.7. References . . . . . . . . . . . . . . . . . . . . . . . . . . . . . . . . . . . . . . . . . . 167
APPENDIX 4 . . . . . . . . . . . . . . . . . . . . . . . . . . . . . . . . . . . . . . . . . . . . 200
CHAPTER 5
YIELD, YIELD COMPONENTS, FRUIT COMPOSITION, AND
NON-STRUCTURAL CARBOHYDRATES IN CANES
UNDER REGULATED DEFICIT IRRIGATION . . . . . . . . . . . . . . . . . . 205
5.1. Abstract . . . . . . . . . . . . . . . . . . . . . . . . . . . . . . . . . . . . . . . . . . . . 205
5.2. Introduction . . . . . . . . . . . . . . . . . . . . . . . . . . . . . . . . . . . . . . . . . 205
5.3. Materials and methods . . . . . . . . . . . . . . . . . . . . . . . . . . . . . . . . . 208
5.3.1. Yield, yield components, and pruning weights . . . . . . . . 208
5.3.2. Berry composition . . . . . . . . . . . . . . . . . . . . . . . . . . . . . 209

xx
5.3.3. Non-structural carbohydrates in dormant canes . . . . . . 210
5.3.4. Experimental design and statistical analysis . . . . . . . . . 210
5.4. Results . . . . . . . . . . . . . . . . . . . . . . . . . . . . . . . . . . . . . . . . . . . . . 210
5.4.1. Yield, yield components, pruning weight, and non-
structural carbohydrates . . . . . . . . . . . . . . . . . . . . . . . . . . . . . . 210
5.4.2. Berry composition . . . . . . . . . . . . . . . . . . . . . . . . . . . . . 212
5.5. Discussion . . . . . . . . . . . . . . . . . . . . . . . . . . . . . . . . . . . . . . . . . . 213
5.6. Conclusion . . . . . . . . . . . . . . . . . . . . . . . . . . . . . . . . . . . . . . . . . . 217
5.7. References . . . . . . . . . . . . . . . . . . . . . . . . . . . . . . . . . . . . . . . . . . 219
CHAPTER 6
GENERAL CONCLUSIONS . . . . . . . . . . . . . . . . . . . . . . . . . . . . . . . . . . . . . 229

xixi
LIST OF ABBREVIATIONS
� volumetric soil water content
� micro
�a density of air
A420 absorbance at 420 nm wavelength
A520 absorbance at 520 nm wavelength
A700 absorbance at 700 nm wavelength
Ab basal area of chamber
ABA abscisic acid
ADP adenosine diphosphate
An net photosynthesis
ATP adenosine triphosphate
Aw wall area of chamber
cdeficit irrigation deficit coefficient
cp specific heat of air
CRD completely randomized design
de distance between emitters
DCS days with clear skies
DI whole-canopy proposed deficit index for RDI
DM dry matter
DOM day of measurement
xiixii
DOY day of year, January 1= 1
dr distance between vine rows
DSD daily sum of degrees base 10oC
DW dry weight
DWC days with partially cloudy skies
E early deficit irrigation regimen
ea air vapor pressure
EC enzyme commission number
es saturated vapor pressure of air
es(leaf) saturated vapor pressure at leaf temperature
ET evapotranspiration
ETo reference evapotranspiration (grass reference)
ETR electron transport rate
f emitter flow rate
fa air flow rate
F6P fructose-6-phosphate
FC field capacity
FPR fruit:pruning weight ratio
FVET full vine evapotranspiration
FW fresh weight
G6P glucose-6-phosphate
G6PDH glucose-6-phosphate dehydrogenase

xiiixiii
GDD growing degree days base 10oC
gs stomatal conductance
gc canopy conductance
H heat absorbed
H2Ov water vapor
Kc crop coefficient
LFR leaf area:fruit ratio
LST local standard time
M molecular weight of air
NAD nicotinamide dinucleotide
NCE net CO2 exchange
NCESL single-leaf net CO2 exchange
NCEWL,d whole-canopy net CO2 exchange per unit leaf area per day
NCEW whole-canopy net CO2 exchange rate
NCEWd daily mean of NCER between times at which NCESL,d was calculated
NCEWV,d whole-canopy net CO2 exchange per vine per day
NPQ non-photochemical quenching
NS number of shoots per vine
Pa atmospheric pressure
PAR photosynthetically active radiation
PAW plant available water
PAWS Public Agriculture Weather System

xivxiv
PPFD photosynthetic photon flux density
PPFDd daily photosynthetic photon flux density
PGI phosphoglucoisomerase
PSII photosystem II
PWP permanent wilting point
RDI regulated deficit irrigation
rH resistance to heat transfer
Rubisco ribulose bisphosphate carboxylase oxygenase
RuBP ribulose bisphosphate
ss soluble sugars
S standard deficit irrigation regimen
sd soil depth
SL shoot length
SLA shoot leaf area
SW portion of total soil area wetted
SR ratio between slopes of predicted TRWL and predicted VPD
tir duration of irrigation (h)
TA titratable acidity
Tair air temperature
tDI time of proposed deficit index DI
TDSD mean temperature for the 12 min interval
Tr transpiration rate

xvxv
TrWL whole vine transpiration rate on a leaf area basis
TrWV whole vine transpiration rate on a per vine basis
TrWV,d whole canopy transpiration per vine per day
TrWL,d whole canopy transpiration per unit leaf area per day
tsunrise time of sunrise
tsunset time of sunset
V late deficit irrigation regimen
VLA vine leaf area
VPD air vapor pressure deficit
VPDla leaf to air vapor pressure deficit
WUE water use efficiency
WUEi intrinsic water use efficiency
WUESL single-leaf water use efficiency
WUESL,d single-leaf daily water use efficiency
WUEi,SL single-leaf intrinsic water use efficiency
WUEWL whole canopy water use efficiency per unit leaf area
WUEWL,d whole-canopy daily water use efficiency per unit leaf area
WUEi,WL whole-canopy intrinsic water use efficiency per unit leaf area
WUEWV whole-canopy water use efficiency per vine
WUEWV,d whole-canopy daily water use efficiency per vine

xvixvi
LIST OF TABLES
Table 3.1: Meteorological summary for the experimental site. . . . . . . . . . . . . . . . . . 105
Table 3.2: Effect of RDI regimens on leaf area per vine. . . . . . . . . . . . . . . . . . . . . . 106
Table 3.3: Effect of RDI regimens on net CO2 fixed per vine (NCEWV,d) and perunit leaf area (NCEWL,d) per day in 2003. Data are means of six vinesaveraged across all measurements days. . . . . . . . . . . . . . . . . . . . . . . . . . . . 107
Table 3.4: Effect of RDI regimens on net CO2 fixed per vine per day (NCEWV,d).Data are means of two vines from days with clear skies. . . . . . . . . . . . . . . . 108
Table 3.5: Effect of RDI regimens on net CO2 fixed per unit leaf area per day(NCEWL,d) for 2003. Data are means of two vines from days with clearskies. . . . . . . . . . . . . . . . . . . . . . . . . . . . . . . . . . . . . . . . . . . . . . . . . . . . . . . . 109
Table 3.6: Effect of RDI regimens on total net CO2 fixed per vine (NCEWV,d) andper unit of leaf area (NCEWL,d) per day between fruit set and post-harvest of2003. . . . . . . . . . . . . . . . . . . . . . . . . . . . . . . . . . . . . . . . . . . . . . . . . . . . . . . . 110
Table 3.7: Effect of RDI regimens on daily maximum NCEWL recorded during 24h. Data are means of two vines from days with clear skies. . . . . . . . . . . . . . 111
Table 3.8: Effect of RDI regimens on daily mean NCESL. Data are from days withclear skies of 2003 and are means of 6 to 9 vines. . . . . . . . . . . . . . . . . . . . . 112
Table 3.9: Effect of RDI regimens on leaf carbohydrate export rates (CO2equivalents) and NCESL in 2003. . . . . . . . . . . . . . . . . . . . . . . . . . . . . . . . . . . 113
Table 4.1: Effect of RDI regimens on transpiration per vine (TrWV,d) and per unitleaf area (TrWL,d) per day in 2003. Data are means of six vines averagedacross all measurement days. . . . . . . . . . . . . . . . . . . . . . . . . . . . . . . . . . . . 174
Table 4.2: Effect of RDI regimens on transpiration per vine per day (TrWV,d). Dataare means of two vines from days with clear skies. . . . . . . . . . . . . . . . . . . . . 175
Table 4.3: Effect of RDI regimens on transpiration per unit leaf area (TrWL,d) during24 h for 2003. Data are means of two vines on days with clear skies. . . . . . 176
Table 4.4: Multiple stepwise regression with NCEWV,d as the dependent variableand transpiration (TrWV,d), TrWV,d
2, PPFDd, PPFDd2, DSD, and DSD2 as

xviixvii
independent variables. . . . . . . . . . . . . . . . . . . . . . . . . . . . . . . . . . . . . . . . . . . 177
Table 4.5: Effects of RDI regimens on daily water use efficiency per vine(WUEWV,d) calculated as NCEWV,d/TrWV,d for 2003. Data are from six vinesacross all measurement days. . . . . . . . . . . . . . . . . . . . . . . . . . . . . . . . . . . . . 178
Table 4.6: Effect of RDI regimens on WUEWV,d calculated as NCEWV,d/TrWV,d. Dataare means of two vines from days with clear skies. . . . . . . . . . . . . . . . . . . . 179
Table 4.7: Effect of RDI regimens on daily leaf water use efficiency per unit leafarea (WUESL,d) calculated as the daily average of NCESL/TrSL,d for 2003.Data are means of three vines on days with clear skies. . . . . . . . . . . . . . . . . 180
Table 5.1: Yield, yield components, pruning weight, and non-structuralcarbohydrates in canes of vines cv. Cabernet Sauvignon under standardand additional water deficit within RDI. . . . . . . . . . . . . . . . . . . . . . . . . . . . . . 225
Table 5.2: Fruit composition of vines under standard and under additional waterdeficit within RDI. . . . . . . . . . . . . . . . . . . . . . . . . . . . . . . . . . . . . . . . . . . . . . . 226
xviiixviii
LIST OF FIGURES
Figure 1.1: Diagram of a typical double-sigmoid pattern of growth by a grapeberry, from anthesis to harvest. In some cultivars, berries may shrivelbetween ripeness and harvest, thus lose volume (dashed line; redrawnfrom Coombe and Hale, 1973). . . . . . . . . . . . . . . . . . . . . . . . . . . . . . . . . . . . . . 4
Figure 2.1: Schematic diagram of whole-canopy gas exchange chamber used ontrellised, field-grown grapevines. Arrows denote air flow. . . . . . . . . . . . . . . . . 59
Figure 2.2: Schematic diagrams of the chamber floor (not drawn to scale). A: topview; B: side view; C: details of the air conducting system. . . . . . . . . . . . . . . . 60
Figure 2.3: Schematic diagram of whole-canopy gas exchange system forseveral, field-grown vines. . . . . . . . . . . . . . . . . . . . . . . . . . . . . . . . . . . . . . . . . 61
Figure 2.4: Estimation of the temperature difference between outside and insidethe chambers based on the flow rate through the chamber. Arrow indicatesthe typical daytime ventilation rate. Calculations for DOY 157, under clearskies and 35oC ambient air temperature. Transpiration was assumed todissipate half of the heat absorbed. . . . . . . . . . . . . . . . . . . . . . . . . . . . . . . . . . 62
Figure 2.5: Diurnal pattern of air temperature inside and outside the chamber at 5different heights above ground. Data were collected on DOY 192, 2002.Flow through the chamber was 16 m3 min-1 (about two chamber volumesper minute) . . . . . . . . . . . . . . . . . . . . . . . . . . . . . . . . . . . . . . . . . . . . . . . . . . . . 63
Figure 2.6: Diurnal curve of global irradiance (A), net CO2 exchange rate (B), andtranspiration (C) for an exemplary vine under standard irrigation and for avine under imposed water stress. DOY 218, 2002. . . . . . . . . . . . . . . . . . . . . . 64
Figure 2.7: Apparent light response of photosynthesis for an exemplary vineunder standard irrigation and for a vine under imposed water stress. DOY218, 2002 . . . . . . . . . . . . . . . . . . . . . . . . . . . . . . . . . . . . . . . . . . . . . . . . . . . . . 65
Figure 2.8: View of one gas exchange chamber installed in the vineyard. . . . . . . . . . 66
Figure 3.1: Experimental calendar and irrigation schedule superimposed ontheoretical curve of berry growth. Arrows at top indicate approximateperiods of whole-canopy and single-leaf gas exchange measurements: 1-fruit set, 2-pre-veraison, 3-post-veraison, 4-pre-harvest, 5-post-harvest.Bars at the bottom indicate the duration and scheduling of irrigation

xixxix
regimens. FVET: full vine evapotranspiration; standard deficit = 70% FVET(2002) or 60% FVET (2003); additional deficit = 35% FVET (2002) or 30%FVET (2003). . . . . . . . . . . . . . . . . . . . . . . . . . . . . . . . . . . . . . . . . . . . . . . . . . 114
Figure 3.2: Daily maximum and minimum air temperatures (1.5 m) recorded atthe Alderdale PAWS station (10 km west of site) during 2002 and 2003.Dashed line is 10oC, the conventional “base temperature” for grapevinegrowth and accumulation of GDD. Arrow numbers indicate gas exchangemeasurements: 1-fruit set, 2-pre-veraison, 3-post-veraison, 4-pre-harvest,5-post-harvest. . . . . . . . . . . . . . . . . . . . . . . . . . . . . . . . . . . . . . . . . . . . . . . . . 115
Figure 3.3: A. Growing degree days (GDD; base 10 oC) for 2002 and 2003measured at Alderdale PAWS station (10 km west of site). Mainphenological stages are indicated. Long-term average (1991-2003) is fromPaterson PAWS station (18 km east of site) because Alderdale PAWSstation has not existed long enough to provide a meaningful long-termaverage. B. Difference in accumulated GDD between the two seasons. . . . . 116
Figure 3.4: Accumulated irrigation applied during growing seasons from May toOctober (leaf fall), 2002 and 2003. Main phenological phases areindicated. Asterisks denote beginning of RDI regimens. . . . . . . . . . . . . . . . . 117
Figure 3.5: Aerial photograph of the experimental site on DOY 216, 2003 (pre-veraison). Effects of the early deficit RDI regimen on canopy size can bedistinguished by comparing row thicknesses among irrigation regimens(i.e., early deficit vs. standard RDI or late deficit). . . . . . . . . . . . . . . . . . . . . . 118
Figure 3.6: Whole-canopy net CO2 exchange rate (NCEWL), photosynthetic photonflux density (PPFD) and air temperature (Tair) during fruit set, 2003. Anafternoon depression in NCEWL is evident on DOY 181, after two days ofno irrigation, while on DOY 178 irrigation was being applied. Intermediateresponses were observed on DOY 183, following irrigation(DOY 182), butconfounded by passing cloud. Data points are means of two chambersoperating simultaneously. Daily reference evapotranspiration (grass; ETo)is from the Alderdale PAWS station (10 km west of site). . . . . . . . . . . . . . . . 119
Figure 3.7: Whole-canopy net CO2 exchange rate (NCEWL), photosynthetic photonflux density (PPFD), and air temperature (Tair) during pre-veraison, 2003.Panel B demonstrates a smaller difference in NCEWL between extra waterdeficit (E) and vines under standard RDI regimen (S and V) due to lowerPPFD and lower air temperature. Data points are means of two chambersoperating simultaneously. Daily reference evapotranspiration (grass; ETo)is from the Alderdale PAWS station (10 km west of site). . . . . . . . . . . . . . . . 120

xxxx
Figure 3.8: Whole-canopy net CO2 exchange rate (NCEWL), photosynthetic photonflux density (PPFD), and air temperature (Tair) during post-veraison, 2003.V vines were under extra water deficit, S and E vines were under standardRDI regimen. Data points are means of two chambers operatingsimultaneously. Daily reference evapotranspiration (grass; ETo) andprecipitation (PP) is from the Alderdale PAWS station (10 km west of site). . 121
Figure 3.9: Whole-canopy net CO2 exchange rate (NCEWL), photosynthetic photonflux density (PPFD), and air temperature (Tair) during pre-harvest, 2003. Vwere under extra water deficit, S and E vines were under standard RDIregimen. Data points are means of two chambers operatingsimultaneously. Daily reference evapotranspiration (grass; ETo) is from theAlderdale PAWS station (10 km west of site). . . . . . . . . . . . . . . . . . . . . . . . . 122
Figure 3.10: Whole-canopy net CO2 exchange rate (NCEWL), photosyntheticphoton flux density (PPFD), and air temperature (Tair) during post-harvest,2003. All vines were irrigated at FVET. Data points are means of twochambers operating simultaneously. Daily reference evapotranspiration(grass; ETo) is from the Alderdale PAWS station (10 km west of site). . . . . . 123
Figure 3.11: Effects of RDI regimens on single-leaf net CO2 exchange rate(NCESL; A-C) and stomatal conductance (gs; D-F), 2002. Mean values areper vine ± SE (n=9; at pre-harvest n=6). . . . . . . . . . . . . . . . . . . . . . . . . . . . . 124
Figure 3.12: Effects of RDI regimens on single-leaf net CO2 exchange rate(NCESL; A-E) and stomatal conductance (gs; F-J), 2003. Mean values areper vine ± SE (n=9; at fruit set n=6). . . . . . . . . . . . . . . . . . . . . . . . . . . . . . . . 125
Figure 3.13: Relationship between single-leaf (NCESL) and whole-canopy net CO2exchange rate (NCEWL) in 2003. Values are hourly means per vine ± SE(n=3 to 5 for NCESL and n=8 to 10 for NCEWL). Data are from allphenological stages except pre-harvest because there was no coincidencein time between NCESL and NCEWL measurements. . . . . . . . . . . . . . . . . . . . 126
Figure 3.14: Effects of RDI regimens on average whole-canopy (NCEWL) andsingle-leaf (NCESL) net CO2 exchange rate at coincident DOY and timeduring 2003. Means values are per vine ± SE. . . . . . . . . . . . . . . . . . . . . . . . 127
Figure 3.15: Effects of RDI regimens on leaf soluble sugars concentration(glucose+fructose+sucrose). First (A) and last (B) sample times of the dayduring 2002 on days with clear skies. Sampling times are indicated abovebars. Mean values are per vine ± SE (n=9; pre-harvest n=6). anc: data notcollected. . . . . . . . . . . . . . . . . . . . . . . . . . . . . . . . . . . . . . . . . . . . . . . . . . . . . 128

xxixxi
Figure 3.16: Effects of RDI regimens on leaf starch concentration. First (A) andlast (B) sample times of the day during 2002 on days with clear skies.Sampling times are indicated above bars. Mean values are per vine ± SE(n=9; pre-harvest n=6). Bars with different letters are significantly differentat p�0.05 by Tukey-Kramer. anc: data not collected. . . . . . . . . . . . . . . . . . . . 129
Figure 3.17: Effects of RDI regimens on leaf soluble sugars concentration(glucose+fructose+sucrose). First (A) and last (B) sample times of the dayduring 2003 on days with clear skies. Sampling times are indicated abovebars. Mean values are per vine ± SE (n=3). anc: data not collected. . . . . . . . 130
Figure 3.18: Effects of RDI regimens on leaf starch concentration. First (A) andlast (B) sample times of the day during 2003 on days with clear skies.Sampling times are indicated above bars. Mean values are per vine ± SE(n=3). Bars with different letters are significantly different at p�0.05 byTukey-Kramer. anc: data not collected. . . . . . . . . . . . . . . . . . . . . . . . . . . . . . 131
Figure A3.1: Seasonal (April 1-Oct 31) crop coefficient (Kc) for cv. CabernetSauvignon in south-central Washington plotted against accumulatedgrowing degree days (GDD, base 10oC). Redrawn from Evans et al.(1993). . . . . . . . . . . . . . . . . . . . . . . . . . . . . . . . . . . . . . . . . . . . . . . . . . . . . . . 136
Figure A3.2: Extraction of glucose in relation to number of extractions. Threeextractions were enough to extract more than 95% of glucose present inthe leaf tissue . . . . . . . . . . . . . . . . . . . . . . . . . . . . . . . . . . . . . . . . . . . . . . . . . 137
Figure A3.3: Daily precipitation and accumulated precipitation recorded atAlderdale PAWS station (10 km west of site). Bars represent rain events.PAWS: Public Agriculture Weather System, Washington. . . . . . . . . . . . . . . . 138
Figure A3.4: Daily ETo (grass) recorded at Alderdale PAWS station (10 km westof site) during 2002 and 2003. PAWS: Public Agriculture Weather System,Washington . . . . . . . . . . . . . . . . . . . . . . . . . . . . . . . . . . . . . . . . . . . . . . . . . . 139
Figure A3.5: Cumulative precipitation recorded at Alderdale PAWS station (10 kmwest of site) plus cumulative irrigation applied within the RDI regimens atthe experimental site during 2002 and 2003. PAWS: Public AgricultureWeather System, Washington. . . . . . . . . . . . . . . . . . . . . . . . . . . . . . . . . . . . 140
Figure A3.6: Daily irradiance during growing seasons 2002 and 2003 at theAlderdale PAWS station (10 km west of site). Arrow numbers indicatewhole-canopy gas exchange measurements: 1-fruit set, 2-pre-veraison, 3-post-veraison, 4-pre-harvest, 5-post-harvest. PAWS: Public AgricultureWeather System, Washington. . . . . . . . . . . . . . . . . . . . . . . . . . . . . . . . . . . . 141

xxiixxii
Figure A3.7: Regression model used for vine leaf area estimation in 2002. . . . . . . 142
Figure A3.8: Regression models between shoot length and leaf area per shootduring 2003. SLA: shoot leaf area; SL: shoot length. Maximum shootlengths were around 150 cm, except during the post-harvest phase, wherethey did not exceed 120 cm because of damage during harvest. . . . . . . . . . 143
Figure A3.9: Effects of RDI regimens on leaf solubles sugars (A-C; glucose +fructose + sucrose) and starch (D-F) during 2002. Mean values are pervine ± SE (n=9; pre-harvest n=6). . . . . . . . . . . . . . . . . . . . . . . . . . . . . . . . . . 144
Figure 4.1: Whole-canopy transpiration rate (TrWL), photosynthetic photon fluxdensity (PPFD) and air vapor pressure deficit (VPD) during fruit set, 2003.Data points are means of two chambers operating simultaneously. Dailyreference evapotranspiration (grass; ETo) is from the Alderdale PAWSstation (10 km west of site). . . . . . . . . . . . . . . . . . . . . . . . . . . . . . . . . . . . . . . 181
Figure 4.2: Whole-canopy transpiration rate (TrWL), photosynthetic photon fluxdensity (PPFD), and air vapor pressure deficit (VPD) during pre-veraison,2003. Panel B demonstrates a smaller difference in TrWL between extrawater deficit (E) and vines under standard RDI regimen (S and V) due tolower PPFD and lower air temperature. Data points are means of twochambers operating simultaneously. Daily reference evapotranspiration(grass; ETo) is from the Alderdale PAWS station (10 km west of site). . . . . . 182
Figure 4.3: Whole-canopy transpiration rate (TrWL), photosynthetic photon fluxdensity (PPFD), and air vapor pressure deficit (VPD) during post-veraison,2003. V vines were under extra water deficit, S and E vines were understandard RDI regimen. Data points are means of two chambers operatingsimultaneously. Daily reference evapotranspiration (grass; ETo) andprecipitation (PP) are from the Alderdale PAWS station (10 km west ofsite). . . . . . . . . . . . . . . . . . . . . . . . . . . . . . . . . . . . . . . . . . . . . . . . . . . . . . . . . 183
Figure 4.4: Whole-canopy transpiration rate (TrWL), photosynthetic photon fluxdensity (PPFD), and air vapor pressure deficit (VPD) during pre-harvest,2003. V vines were under extra water deficit, S and E vines were understandard RDI regimen. Data points are means of two chambers operatingsimultaneously. Daily reference evapotranspiration (grass; ETo) is from theAlderdale PAWS station (10 km west of site). . . . . . . . . . . . . . . . . . . . . . . . . 184
Figure 4.5: Whole-canopy transpiration rate (TrWL), photosynthetic photon fluxdensity (PPFD), and air vapor pressure deficit (VPD) during post-harvest,2003. All vines were irrigated at FVET. Data points are means of twochambers operating simultaneously. Daily reference evapotranspiration

xxiiixxiii
(grass; ETo) is from the Alderdale PAWS station (10 km west of site). . . . . . 185
Figure 4.6: Effects of RDI regimens on single-leaf transpiration (TrSL; A-C) andleaf-to-air vapor pressure deficit (VPDla;D-F) at different phenologicalstages and at different times of the day during 2002. Values are means pervines ± SE (n=9; pre-harvest n=6). . . . . . . . . . . . . . . . . . . . . . . . . . . . . . . . . 186
Figure 4.7: Effects of RDI regimens on single-leaf transpiration rate (TrSL; A-E)and leaf-to-air vapor pressure deficit (VPDla; F-J) at different phenologicalstages and at different times of the day during 2003. Values are means ofvines ± SE (n=9; at fruit set n=6). . . . . . . . . . . . . . . . . . . . . . . . . . . . . . . . . . 187
Figure 4.8: Effect of RDI regimens on canopy conductance (gc) on days with clearskies at five phenological stages during growing season 2003. Data pointsare means of two chambers operating simultaneously on days with clearskies. . . . . . . . . . . . . . . . . . . . . . . . . . . . . . . . . . . . . . . . . . . . . . . . . . . . . . . . 188
Figure 4.9: Effect of RDI regimens on the relationship between whole canopytranspiration rate (TrWL)and air vapor pressure deficit (VPD) at fivephenological stages during growing season of 2003. Data points aremeans of two chambers operating simultaneously on days with clear skies. 189
Figure 4.10: Effect of RDI regimens on the relationship between whole-canopytranspiration (TrWL) and canopy conductance (gc) at each phenologicalstage during season 2003. Data are from days with clear skies. Datapoints are means of two chambers operating simultaneously. . . . . . . . . . . . 190
Figure 4.11: Effect of RDI regimens on the relationship between whole-canopynet CO2 exchange rate (NCEWL) and canopy conductance (gc) at fivephenological stages during growing season 2003. Data points are meansof two chambers operating simultaneously on days with clear skies. . . . . . . 191
Figure 4.12: Relationship between stomatal conductance (gs) and leaf net CO2exchange rate (NCESL) in 2002 (A-C) and 2003 (D-H) at differentphenological stages, and under different RDI regimens. Mean values areper vine ± SE (n=9; except at pre-harvest 2002 and at fruit set 2003 whenn=6). . . . . . . . . . . . . . . . . . . . . . . . . . . . . . . . . . . . . . . . . . . . . . . . . . . . . . . . . 192
Figure 4.13: Relationships between whole-canopy net CO2 exchange rate(NCEWL) and gc with photosynthetic photon flux density (PPFD) at pre-veraison, for two vines under standard RDI (A, C) and under additionalwater deficit (B, D). Data represent DOY 218, 2003 from 0000 h to 1200 hrecorded at 12 min intervals. . . . . . . . . . . . . . . . . . . . . . . . . . . . . . . . . . . . . . 193

xxivxxiv
Figure 4.14: A) Relationships in 2003 between A) whole-canopy net CO2exchange rate (NCEWL,d) and transpiration (TrWL,d) per unit leaf area; B)whole-canopy net CO2 exchange rate (NCEWV,d) and transpiration (TrWv,L)per vine; C) single-leaf net CO2 exchange rate (NCESL) and transpiration(TrSL). . . . . . . . . . . . . . . . . . . . . . . . . . . . . . . . . . . . . . . . . . . . . . . . . . . . . . . . 194
Figure 4.15: NCEWL, TrWL, and PPFD on DOY 218, 2003 (pre-veraison) for a vineunder standard RDI (A) and under additional deficit (B). NCEWL and TrWLused for WUEWL calculation at 0800 h and at 1600 h are indicated withdashed and solid lines, respectively. . . . . . . . . . . . . . . . . . . . . . . . . . . . . . . . 195
Figure 4.16: Model derived from data of DOY 218, 2003 of a vine under standardRDI (A) and a vine under additional deficit (B) using a 10th order polynomialfor describing NCEWL, TrWL, VPD, and gc. Sunrise and sunset times areindicated by arrows. tDI indicates the time when slope of VPD exceedsslope of TrWL. . . . . . . . . . . . . . . . . . . . . . . . . . . . . . . . . . . . . . . . . . . . . . . . . . 196
Figure 4.17: VPD and TrWL slopes derived from models using figure 4. data for avine under standard RDI (A) and a vine under additional deficit (B). Sunriseand sunset times are indicated by arrows. tDI indicates the time when slopeof VPD exceeds slope of TrWL. . . . . . . . . . . . . . . . . . . . . . . . . . . . . . . . . . . . . 197
Figure 4.18: Model derived from data of DOY 215, 2003 of a vine under standardRDI (A) and a vine under additional deficit (B) using a 10th order polynomialfor describing NCEWL, TrWL, VPD, and gc. Sunrise and sunset times areindicated by arrows. tDI indicates the time when slope of VPD exceedsslope of TrWL. . . . . . . . . . . . . . . . . . . . . . . . . . . . . . . . . . . . . . . . . . . . . . . . . . 198
Figure 4.19: VPD and TrWL slopes derived from models using figure 4. data for avine under standard RDI (A) and a vine under additional deficit (B). Sunriseand sunset times are indicated by arrows. tDI indicates the time when slopeof VPD exceeds slope of TrWL. . . . . . . . . . . . . . . . . . . . . . . . . . . . . . . . . . . . . 199
Figure A4.1: Experimental calendar and irrigation schedule superimposed ontheoretical curve of berry growth. Arrows at top indicate approximateperiods of whole-canopy and single-leaf gas exchange measurements: 1-fruit set, 2-pre-veraison, 3-post-veraison, 4-pre-harvest, 5-post-harvest.Bars at the bottom indicate the duration and scheduling of irrigationregimens. FVET: full vine evapotranspiration; standard deficit = 70% FVET(2002) or 60% FVET (2003); additional deficit = 35% FVET (2002) or 30%FVET (2003). . . . . . . . . . . . . . . . . . . . . . . . . . . . . . . . . . . . . . . . . . . . . . . . . . 202
Figure A4.2: Average soil water content in the first 1 m depth of soil for 2002 (A)and 2003 (B) for the three irrigation regimens. Arrows 1 indicate when E

xxvxxv
regimen was initiated, arrows 2 indicate when E return to standard RDIand V was initiated, and arrows 3 indicate when all regimens started to beirrigated at FVET. Data provided by R. Smithyman - St. Michelle WineEstates. . . . . . . . . . . . . . . . . . . . . . . . . . . . . . . . . . . . . . . . . . . . . . . . . . . . . . 203
Figure A4.3: Effects of RDI regimens on xylem water potential in 2002 (A) and onleaf water potential in 2003 (B). Data provided by R. Smithyman - St.Michelle Wine Estates. . . . . . . . . . . . . . . . . . . . . . . . . . . . . . . . . . . . . . . . . . 204
Figure 5.1: A) Effects of irrigation regimens on yield recorded from vines locatedat the south end of the plot and measured by the gas exchangechambers(n=6); B) yield recorded from all other sentinel vines in the southend of the plot (n=6); C) Effects of irrigation regimens on yield during fiveseasons on sentinel vines across the 4-ha plot. . . . . . . . . . . . . . . . . . . . . . . 227
Figure 5.2: Relationships between yield and yield components. The correlationswere computed for the 18 experimental vines. (�,�) standard deficit; (�,�) early deficit; ( , ) late deficit. . . . . . . . . . . . . . . . . . . . . . . . . . . . . . . . . . 228

xxvixxvi
Dedication
This dissertation is dedicated both to the memory of my father and to
"The Disappeared" of Argentina.
“From the moment of their abduction, the victims lost all rights. Deprived of all
communication with the outside world, held in unknown places, subjected to barbaric
tortures, kept ignorant of their immediate or ultimate fate, they risked being either thrown
into a river or the sea, weighted down with blocks of cement, or burned to ashes. They
were not mere objects, however, and still possessed all the human attributes: they could
feel pain, could remember a mother, child or spouse, could feel infinite shame at being
raped in public...”
[Ernesto Sábato, 1984, prologue to Nunca Más]

11
CHAPTER 1
GENERAL INTRODUCTION
Washington is the second leading grape producing state in the USA with about
12,000 ha of wine grapes (Vitis vinifera L.) and 10,000 ha of juice grapes (Vitis x
labruscana Bailey). Wine grapes are destined for premium, superpremium and ultra
premium wine. Major red-wine cultivars planted are Cabernet Sauvignon (2448 ha),
Merlot (2420 ha), Syrah (849 ha), and Cabernet Franc (750 ha), while the white-wine
cultivars are Chardonnay (2687 ha), Riesling (890 ha), Sauvignon Blanc (287 ha), and
Gewürztraminer (271 ha; Washington Agricultural Statistics Service, 2002). According to
Winkler’s classification (Winkler et al., 1974) based on heat summation as degree-days
(GDD.; base 10oC), eastern Washington falls in Region II, averaging 1350 GDD for
Prosser (Naor and Wample, 1994). The growing season is short (158 frost free days)
and because of this there are some limits to the amount of photosynthate that can be
produced by a vine; thus, the balance between yield and quality is very important.
Average annual rainfall at Prosser is 198 mm with 75% of the rain events occurring from
October through April. The average cumulative “Class A” unscreened pan evaporation is
1266 mm for April through October (Naor and Wample, 1994) with maximum daily
reference evapotranspiration (grass) during the growing season of about 9 mm d-1
(Evans et al., 1993).
Early frost and cold hardiness are major challenges for Washington grape
growers. The combination of a short growing season, low rainfall, hot summers, and cold

22
winters challenge Washington grape growers in several ways. Because of the large
deficit between evapotranspiration and rainfall, winegrapes can only be commercially
cultivated by applying irrigation. Furrow, sprinkler, and drip methods have been used,
although the trend is towards drip irrigation, which gives grape growers greater flexibility
in irrigation scheduling. However, a major challenge lies in determining the timing and
amount of irrigation to balance canopy productivity with crop load so as to achieve the
fruit characteristics desired by winemakers and reach the end of the growing season
with a plant prepared for the cold winter (i.e., avoiding any delay in the lignification of
canes and replenishment of reserves in the permanent structures of the vine). This
challenge has been approached partly by regulated deficit irrigation (RDI), or deficit
irrigation, a system of managing soil water to impose predetermined periods of plant or
soil water deficit to elicit some desirable plant responses (Behboudian and Singh, 2001).
Localized-pressurized irrigation systems installed in vineyards allow precise control of
the amount of water delivered to the vines and offer the grape grower a tool to manage
not only yield but also crop quality (Williams, 1996). Different methods are used to
quantify the severity of water deficits, from instruments that measure soil moisture or soil
water potential, to instruments that measure variables related to plant water status
(Kramer and Boyer, 1995).
In contrast to other commercially-grown perennial fruit crops (e.g., stone fruits,
apples, pears) where bloom precedes vegetative growth, grapevines produce much
vegetation before bloom and fruit growth (Mullins et al., 1992). The vegetative stage in
grapevines starts with budbreak and is followed by a period of rapid shoot growth

33
(Williams et al., 1994). During budbreak, the permanent structures of the grapevine are
the primary sources of reserve carbohydrate (Williams, 1996). The time at which shoots
stop growing is variable and dependent mainly on environmental conditions, although in
commercial viticulture this usually happens sometime between fruit set (transformation
of flowers into fruits) and harvest. Thus, flower clusters appear and bloom occurs while
shoots are still growing. Reproductive development begins with inflorescence (flower
cluster) initiation in the summer preceding its flowering and fruiting (Pratt, 1971). Within
the compound buds cluster initiation for the next year’s crop begins around anthesis and
is complete prior to veraison (Srinivasan and Mullins, 1981; Williams et al., 1994). It has
been suggested that flower differentiation begins prior to budbreak and continues until
anthesis (flower cap fall). The time between budbreak and anthesis varies with the
cultivar and environmental conditions.
The growth of grape berries follows a double sigmoid pattern with two stages of
rapid growth, phases I and III, separated by a ‘lag phase’ of no or slow growth, phase II
(Figure 1; Coombe, 1960; Harris et al., 1968; Ollat et al., 2002). Phase I starts after
anthesis and is characterized by a short period of cell division accompanied and
followed by a period of cell expansion (Hardie et al., 1996; Harris et al., 1968; Ojeda et
al., 1999; Pratt, 1971). At the end of phase II veraison occurs, a term derived from the
French viticultural language that denotes a change in color of the berry skin. During
veraison the berry softens and its skin changes in red-fruited cultivars from green to red,
while in white-fruited cultivars the berries acquire a more translucent appearance.
Phase III is characterized by rapid cell expansion, sugar accumulation, reduction in

44
anthesis
veraison
Phase I
harvest
Ber
ry v
olum
e
Time
Phase II Phase III
fruitset
ripeness
anthesis
veraison
Phase I
harvest
Ber
ry v
olum
e
Time
Phase II Phase III
fruitset
ripeness
Figure 1: Diagram of a typical double-sigmoid pattern of growth by agrape berry, from anthesis to harvest. In some cultivars, berriesmay shrivel between ripeness and harvest, thus lose volume(dashed line; redrawn from Coombe and Hale, 1973)
organic acids, and accumulation of phenolic compounds and flavors (Coombe and Hale,
1973; Hrazdina et al., 1984; Pirie and Mullins, 1980).
The effects of water deficits imposed through RDI depend on the phenological
stage of the grapevine and the severity of the deficit (Hardie and Considine, 1976;
Williams and Matthews, 1990). Both vegetative and reproductive stages can be affected.
Research suggests that a water deficit applied to winegrapes using RDI is a viable
practice for controlling excessive vigor, reducing disease pressure, and improving wine
quality (Bravdo et al., 1985; Esteban et al., 1999; Matthews and Anderson, 1988; Nadal
and Arola, 1995). By contrast, water applied in excess can produce large canopies.
Excessive shoot growth in grapevines can shade clusters, preventing proper
development of flavor, color, and aroma (Price et al., 1995; Smart et al., 1988; Spayd et

55
al., 2002; Zoecklein et al., 1998). Furthermore large canopies favor development of
diseases (English et al., 1989; Gubler et al., 1987). One of the goals of RDI is canopy
control: reducing shoot growth and leaf area to optimize the balance between crop and
canopy (Behboudian, 1997). However, an excessively limited canopy can result in
insufficient carbohydrate sources for maturing the crop (Kaps and Cahoon, 1992;
Kliewer and Dokoozlian, 2000; Kliewer and Ough, 1970; Koblet et al., 1994), insufficient
reserves for the plant (Candolfi-Vasconcelos and Koblet, 1990; Petrie et al., 2000a), and
can lead to excessive fruit exposure during berry growth (Bergqvist et al., 2001; Price et
al., 1995; Spayd et al., 2002). Water deficits imposed early in the season generally
reduce the rate of shoot growth, total leaf area, and subsequent pruning weights
(Alexander, 1965; Kliewer et al., 1983; Neja et al., 1977; Poni et al., 1993; Reynolds and
Naylor, 1994). Leaf expansion rate apparently is the most sensitive process to water
deficit (Schultz, 2000; Schultz and Matthews, 1993; Winkel and Rambal, 1993), although
the rate of shoot growth has been reported to be even more sensitive (Kliewer et al.,
1983).
The effects of water deficit on the reproductive stage, as with the vegetative
stage, depend on the severity and the timing of the deficit (Alexander, 1965; Hardie and
Considine, 1976; Matthews and Anderson, 1989; McCarthy, 1997; Poni et al., 1993; Van
Zyl, 1984). Yield is reduced by water deficits imposed either before or after veraison,
with greater effect when applied before veraison (Matthews and Anderson, 1989; Van
Zyl, 1984). Reduced yields are explained mainly by fewer berries per cluster, fewer
clusters per vine, and lower weight per berry. For example, severe water deficit applied

66
in young potted vines early in the reproductive stage (leaf water potential at dawn -0.8
MPa; 75% cap-fall) reduced fruit set and produced a loss of whole clusters (Hardie and
Considine, 1976). In field-grown vines, similar responses also were reported (dos
Santos et al., 2003; Matthews and Anderson, 1989). Berry shriveling and smaller berries
at harvest have been observed when water deficits were applied to phases I, II or III.
Generally, water deficits during phase I have been reported to have a greater effect on
final berry size than deficits during phase III (Creasy and Lombard, 1993; Greenspan et
al., 1994; Greenspan et al., 1992; Matthews and Anderson, 1988; McCarthy, 1997). The
observed reduction in final berry size from water deficit during phase I can be explained
mainly by a reduction of the mean size of pericarp cells (Ojeda et al., 2001).
Greater diurnal fluctuations in berry size were observed with water deficits during
phase I than deficits during phase III. This phenomenon has been partly explained by
the characteristics and dynamics of the xylem connection between the berry and the
vine, which apparently functions until around the end of phase II, when xylem peripheral
bundles start to stretch and break, gradually losing part of their function (Creasy et al.,
1993; Düring et al., 1987; Findlay et al., 1987). However, xylem axial bundles apparently
remain functional or at least partially functional for some time after veraison (Düring et
al., 1987; Rogiers et al., 2001). Once the xylem loses its functionality, berries apparently
become hydraulically isolated from shoot water relations (Greenspan et al., 1994). It has
been shown that water enters the berry during phase III mainly through phloem tissue
(Greenspan et al., 1996; Greenspan et al., 1992) but debate about the mechanism of
water transport into the berry during phase III still exists (Coombe and McCarthy, 2000;

77
McCarthy and Coombe, 1999; Picaud et al., 2003; Rogiers et al., 2001). However,
experiments with dye showed that after veraison xylem was intact but flow of water
through the xylem stopped at the base of the berry (M. Keller, unpublished data). In
other work, berry dermal plasticity but not elasticity was shown to differ between before,
and after veraison (Matthews et al., 1987) which may have contributed to the more
dramatically reduced diurnal fluctuations in berry size during phase III (Greenspan et al.,
1996).
Water deficits have been reported to improve grape color and anthocyanin
production in red-fruited varieties (Bravdo et al., 1985; Esteban et al., 2001; Freeman,
1983; Freeman and Kliewer, 1983; Hardie and Considine, 1976; Poni et al., 1993).
Anthocyanin concentrations increase in two ways: directly, as content per unit skin
surface area (Matthews and Anderson, 1988) or per unit skin weight (Ojeda et al.,
2002), and indirectly by the reduction in berry size, resulting in higher skin:juice ratios. It
has been suggested that post-veraison water deficits affect red wine flavonoid
concentrations primarily by reducing berry size and secondarily by modifying flavonoid
biosynthesis (Kennedy et al., 2002; Kennedy et al., 2000).
To better understand the effects of a water deficit imposed by RDI on vine
productivity, its effects on photosynthesis need to be explored. Part of the organic
phosphates that are produced by photosynthesis, photoassimilates, are used by the
source organ while others are exported to sink organs. Sources are plant organs that
are net exporters of a compound (e.g., a leaf is a source for carbohydrates and a root is
a source for nutrients), while sinks are organs that are net importers of a compound

88
(e.g., a root is a sink for carbohydrates and a leaf is a sink for nutrients). Carbon
partitioning is the distribution of photoassimilates within the plant, while carbon allocation
refers to the regulation of the distribution of fixed carbon into the various metabolic
pathways (Taiz and Zeiger, 1998).
Water deficits affect photosynthesis, carbon partitioning and carbon allocation,
and can limit carbohydrates’ availability to fill the fruit in source-limiting situations. But in
contrast with other crops, especially many agronomic crops, where partitioning favors
the harvested organs and harvest index (ratio of dry mass of harvested organs to total
plant dry mass) is intended to be maximized (Gifford et al., 1984), in winegrapes this is
not the case (Behboudian and Singh, 2001). On the contrary, in commercial viticulture it
is the sink size, or number of grape berries per vine, that usually is limited deliberately
by the grower because high yield is not the main objective, but rather a combination of
fruit quality and quantity (Jackson and Lombard, 1993). This is important because the
balance between sources and sinks of photoassimilates within the grapevine modulates
the effects of imposed water deficits (Bravdo et al., 1985; Kliewer et al., 1983; Poni et
al., 1993; Poni et al., 1994) and vice versa (Williams, 1996). The responses at the whole
vine level appear to be based on reallocation of resources within the vine, driven by sink
priority (Edson et al., 1993). Vineyard management practices must influence
photosynthesis and dry matter partitioning in a way that enough carbohydrates are
available for vegetative growth and reproductive development, but also assuring that
enough reserves are retained in permanent tissues for subsequent seasons (Petrie et
al., 2000a). Likewise, excessive vegetative growth that could be detrimental to grape

99
quality or vine cold hardiness must be avoided. Thus a balance between vegetative and
reproductive growth and storage should be achieved. Winter pruning, along with flower
and fruit cluster thinning are among management practices used to limit the size of the
reproductive sink. Management practices used to control source size, mainly the green
canopy, are shoot thinning, summer pruning, fertilization, and irrigation (Mullins et al.,
1992; Williams, 1996).
Drawing conclusions or comparing results from experiments on the effects of
water deficits on photosynthesis should consider deficit timing and severity, vine cultivar
and age, and environmental conditions under which deficits were imposed. Effects of
water deficits on photosynthesis have been studied sometimes in mature leaves and
sometimes in young leaves. Likewise, water deficits have been imposed for long times
and for short times, while some deficits have been severe and some mild (Farquhar et
al., 1989). When water deficits are mild, leaf expansion can be affected without any
inhibition of leaf photosynthesis rate (Hsiao, 1973) and a higher proportion of the carbon
fixed may be directed to the roots. Roots generally grow at lower water potential than
leaves (Boyer, 1988; Hsiao and Xu, 2000; Palliotti and Cartechini, 2000). A reduction in
canopy growth rate caused by mild water deficit reduces the amount of
photosynthetically active radiation (PAR) intercepted and photosynthesis per unit land
area in crops like grapevines that have sparse canopies (Petrie et al., 2003; Poni et al.,
2003). The reduction in growth rate could be interpreted as an adaptive response to limit
transpiring surface area, but strategies of coping with the water deficit have been shown
to vary according to the origin of varieties (Schultz, 2000; Winkel and Rambal, 1993).

1010
More severe water deficits also affect total biomass production due to a reduction in the
rate of photosynthesis (Delgado et al., 1995; Liu et al., 1978).
In general, photosynthesis in grapevines is reduced by water deficits (Escalona et
al., 1999; Flexas et al., 1998; Kriedemann and Smart, 1971; Naor et al., 1994; Poni et
al., 1993), which has been explained by stomatal and non-stomatal factors (Farquhar
and Sharkey, 1982; Jones, 1985; Von Caemmerer and Farquhar, 1981), although the
relative contribution of each factor to that limitation is still debated (Ball et al., 1987; Bota
et al., 2004; Chaves et al., 2002; Downton et al., 1988; Flexas et al., 2002; Medrano et
al., 2002a). Stomatal limitation of photosynthesis is due to stomatal aperture that
changes the partial pressure of CO2 (pCO2) at the sites of carboxylation (Farquhar and
Sharkey, 1982). Non-stomatal or metabolic limitation of photosynthesis is related to
reduction in activity of the enzymes of carbon fixation, reduced electron transport rate,
increased photoprotection mechanisms, increased photoinhibion, and reduced
photophosphorylation. The relative contribution of stomatal and non-stomatal limitation
apparently depends on the rate at which the water deficit is imposed or induced and its
severity. When water deficits were mild and were gradually induced, the reduced rate of
photosynthesis in grapevines primarily was related to reductions in stomatal
conductance (de Souza et al., 2003; Delgado et al., 1995; Escalona et al., 1999; Flexas
et al., 1998; Flexas et al., 1999; Osorio et al., 1995).
Stomata close in response to signals transmitted to the leaf from the roots sensing
drying soil (Davies and Zhang, 1991; Wilkinson and Davies, 1997). Roots respond to
water availability in soil that cause changes in root water status and mechanical
1111
impedance by the soil. Partial dehydration of roots due to a water deficit causes a
reduction in root water potential (Van Zyl, 1987; Williams and Matthews, 1990), an
increase in xylem sap pH, and a stimulation of root abscisic acid (ABA) production
(Davies et al., 2002; Wilkinson and Davies, 1997; Wilkinson and Davies, 2002). All of
these signals are known to decrease stomatal conductance (Correia et al., 1995; Davies
and Zhang, 1991; Hartung et al., 2002; Loveys and Düring, 1984; Sauter et al., 2001;
Stoll et al., 2000; Tardieu and Davies, 1992). In field-grown grapevines under water
deficit it was estimated that more than 80% of the variation in the rate of photosynthesis
was explained by variations in stomatal conductance (Escalona et al., 1999). Gradual
development of water deficit allows the plant to acclimate not only its photosynthetic
machinery (Anderson and Anderson, 1988) but also its morphology (Palliotti and
Cartechini, 2000). Under water deficit, grapevines have been shown to change the angle
between the leaf blade and petiole (Smart, 1974), thus changing leaf orientation and
reducing light interception. This could influence the rate of photosynthesis (Kriedemann
and Smart, 1971), and possibly avoid photoinhibition, the inhibition of the
light-dependent reactions of photosynthesis (Osmond, 1994). Greater numbers and
more uniform development of stomata were observed in vines where water deficit was
gradually induced than when the deficit was achieved quickly (Liu et al., 1978).
When water deficits are severe and imposed quickly, and below a certain leaf
water potential or stomatal conductance, the contribution to the regulation of
photosynthesis by non-stomatal effects apparently increases (Chaves, 1991). Under
severe water deficit there is a reduction in quantum efficiency of photosystem II (PSII)

1212
that could result in photoinhibition (Düring, 1998; Iacono and Sommer, 2000). Electron
transport rate (ETR) was slightly reduced (Bota et al., 2004; de Souza et al., 2003) and
non photochemical quenching (NPQ), the process that lowers the efficiency of PSII
(Osmond, 1994), was increased (Flexas et al., 1998). Reductions in leaf ribulose
bisphosphate (RuBP) regeneration and ribulose bisphosphate carboxylase oxygenase
(Rubisco) activity also were reported to limit the rate of photosynthesis when severe
water deficits were imposed and stomatal conductance was already reduced (Bota et al.,
2004). The reduction in CO2 uptake due to a reduction in stomatal conductance could
lead to an excess of light to the phostosystems. Increased leaf temperature, due to a
reduction in stomatal conductance, may increase photorespiration and also reduce rates
of photosynthesis. However, the photosynthetic apparatus of grapevines apparently is
very resistant to photoinhibition; the photochemical reactions are scarcely affected by
drought (Bota et al., 2004; Chaumont et al., 1997; Flexas et al., 1998; Gamon and
Pearcy, 1990). Moreover, other studies have indicated that even severely-stressed
leaves had a low incidence of photoinhibition, with grapevines having a very effective
safe dissipation of absorbed energy (Medrano et al., 2002b). Although stomatal
limitation seems to be most important, photosynthesis and stomatal aperture have been
reported to be tightly correlated (Correia et al., 1990; Escalona et al., 1999; Flexas et al.,
1999; Flexas et al., 1999; Jacobs et al., 1996; Jarvis and Davies, 1998).
In considering the literature on grapevine irrigation and water deficit, it is worth
noting that the technological and traditional context of the research location influence
how irrigation may have been approached. For example, legal restrictions on irrigation in

1313
some European countries have dictated that much of the research be done with potted
vines, because irrigation may be used only to save field-grown vines in an emergency
when drought is severe (Behboudian and Singh, 2001). In some of the countries where
commercial and profitable viticulture is possible without irrigation, the purpose of
irrigation is to increase profits, yield, and quality by offsetting crop water deficit during
the growing season (Esteban et al., 2002; Medrano et al., 2003). On the other hand, in
regions where commercial viticulture is not possible without irrigation, the purpose of
irrigation is first to make the vineyard economically feasible, and then to influence grape
quality and yield. In places like eastern Washington, where there are no restrictions on
the use of irrigation in viticulture, results from many European studies may not be
directly applicable (Behboudian and Singh, 2001; Reynolds, 2000).
Studies of the effects of water deficits, as well as other environmental factors,
cultural practices, and biotic stresses on photosynthesis in grapevines have been
determined mostly from responses measured at the level of a single leaf. Factors
studied include disease incidence (Orlandini and Giuntoli, 1998; Varadi et al., 1995),
irrigation or water deficit (Delgado et al., 1995; Murillo de Alburquerque and
Carbonneau, 1999; Nadal and Arola, 1995; Naor et al., 1993; Naor and Wample, 1994;
Poni et al., 1993), solar radiation (Osorio et al., 1995; Schubert et al., 1996), leaf age
(Petrie et al., 2000b; Schubert et al., 1996; Schultz et al., 1996), trellis systems or
canopy management (Cavallo et al., 2001; Iacono et al., 1995; Katerji et al., 1994; Poni
et al., 2000), and crop load (Hummel and Ferrere, 1998; Naor et al., 1997; Petrie et al.,
2000a). Single-leaf measurements of photosynthesis are useful in comparing

1414
experimental treatments and provide information that cannot be obtained by other
biological indicators of vine productivity such as dry matter. Leaf-level measurements
are instantaneous and non-destructive, and allow measurement of the total carbon gain
by an individual photosynthetic organ (Long et al., 1996). However, leaf-level
photosynthesis measurements can provide incomplete and potentially misleading
information if extrapolated to quantify photosynthesis or infer differences in crop
productivity at the level of the whole plant (Hsiao and Acevedo, 1974; Poni et al., 1997;
Quereix et al., 2001). In general, single leaf photosynthesis measurements refer to a
small area of the leaf, determined by the size of the leaf chamber. Thus measurements
are not extrapolated from entire leaves but from 2 to 3 cm2 to a whole canopy, which in
commercial viticulture can have more than 6 m2 of leaf area per vine (e.g., Dokoozlian
and Kliewer, 1995; Perez Peña and Tarara, 2004). Scaling-up from single leaf to whole
canopy photosynthesis is not straightforward because the latter includes leaves of
different ages and degree of light exposure, and integrates organs like fruit, shoots, and
trunks (Amthor, 1994; Bugbee, 1992; Buwalda, 1991; Buwalda et al., 1992; Grau, 1995;
Intrieri et al., 1997; Long et al., 1996; Succi and Magnanini, 1994). Estimation of leaf
area distribution and light extinction by the canopy combined with a directional treatment
of incident light are needed to estimate whole canopy photosynthesis from single leaf
measurements (De Pury and Farquhar, 1997). In addition, whole canopies may have
higher apparent values for light compensation and light saturation than do single leaves
(Corelli-Grappadelli and Magnanini, 1993; Francesconi et al., 1997).
To date, one common finding has been a lack of good correlation between single-

1515
leaf and whole-vine measurements, with whole-vine photosynthesis expressed on a leaf
area basis being lower than values from single-leaf measurements (Edson et al., 1993;
Edson et al., 1995a; Edson et al., 1995b; Intrieri et al., 1997; Poni et al., 1997). Single
leaf measurements overestimated whole-plant photosynthesis by as much as 40% in
grapevines and fruit trees (Edson et al., 1993; Intrieri et al., 1997; Katerji et al., 1994).
Differences in crop load affected rates of photosynthesis measured on single leaves, but
not on whole vines (Edson et al., 1993). Trellis type (vertical shoot positioning and Lyre)
affected rates of photosynthesis if they were expressed per unit leaf area (i.e.,
analogous to single-leaf measurements), but not when rates were expressed per vine
(Katerji et al., 1994). One caveat is that whole canopy photosynthesis expressed per unit
leaf area is not strictly a value of net leaf photosynthesis as the measurement also
includes respiration by non-photosynthetic organs.
Contrary to single-leaf photosynthesis measurements, whole-canopy
measurements provide an integrated value of net carbon fixed and water transpired, and
overcome some of the limitations of the single-leaf gas exchange measurement by
integrating the response of the entire canopy (Katerji et al., 1994; Knight, 1992; Ollat
and Tandonnet, 1999; Petrie et al., 2003; Poni et al., 1997). Measurement of
whole-canopy gas exchange facilitates instantaneous estimation of light conversion and
water use efficiencies, and provides a tool for quantitative assessment of the impact of
environmental changes upon biological processes like photosynthesis (Garcia et al.,
1990). The two general approaches to whole-canopy gas exchange measurements are
enclosure (i.e., whole-canopy chambers) and meteorological methods (i.e., flux-gradient

1616
or eddy correlation; Field et al., 1989; Garcia et al., 1990; Long and Hällgren, 1989).
Enclosure methods consist of enclosing a single canopy or groups of plants in chambers
and measuring gas exchange. Meteorological methods estimate photosynthesis by
concurrent measurements of CO2 concentrations and air movements above the crop or
canopies using rapidly responding instruments (Long and Hällgren, 1989). Enclosure
methods offer more accurate estimates of whole-plant gas exchange, are well adapted
to small plot sizes, and cost less than meteorological systems. They allow researchers
to make replicated comparisons of treatment influences on whole-plant CO2 assimilation
throughout the growing season. Enclosure gas exchange systems are powerful tools for
detecting differences related to leaf shape, leaf distribution, sun exposure, crop load,
biotic and abiotic stresses, or cultural practices (Buwalda et al., 1992; Intrieri et al.,
1997; Intrieri et al., 1998; Lakso et al., 1996; Leadley and Drake, 1993; Petrie et al.,
2003; Wheeler, 1992). Although models for estimation of whole-canopy photosynthesis
could be used (Amthor, 1994; De Pury and Farquhar, 1997; Poni et al., 2003; Quereix et
al., 2001; Wermelinger and Baumgärtner, 1991), whole-canopy measurements are still
needed to validate these models (Wünsche and Palmer, 1997). The most realistic
solution to study gas exchange in situ of whole plants with several m2 of leaf area is the
gas exchange chamber technique (Daudet, 1987).
Much work has been done on whole-canopy gas exchange in perennial fruit
crops. Some researchers have enclosed potted plants (Edson et al., 1993; Intrieri et al.,
1997; Miller et al., 1996a; Poni et al., 1997), while others have enclosed field-grown
plants (Daudet, 1987; Heinicke and Childers, 1937; Intrieri et al., 1998; Katerji et al.,

1717
1994; Succi and Magnanini, 1994). Most studies on whole-canopy photosynthesis in
grapevines have used potted vines (Edson et al., 1993; Edson et al., 1995a; Edson et
al., 1995b; Intrieri et al., 1997; Intrieri et al., 1998; Miller et al., 1996a; Miller et al.,
1996b; Poni et al., 1997) with a few exceptions (Intrieri et al., 1997; Intrieri et al., 1998;
Katerji et al., 1994; Ollat and Tandonnet, 1999). Most experiments with potted vines
have used soilless potting media (Flexas et al., 1999; Ojeda et al., 2002; Patakas and
Noitsakis, 2001; Schultz and Matthews, 1993). It has been suggested that the results
obtained on potted plants cannot be transferred directly to the field environment
(Alleweldt, 1984; Flexas et al., 2002). What is important in studies of RDI is that the
restriction in root growth and the greater diurnal fluctuations in root-zone temperatures in
potted vines cause more extreme water deficits than in field grown vines (Chaumont et
al., 1995; Intrieri et al., 1997; Intrieri et al., 1998). Drought conditions in potted plants can
be achieved very quickly (Escalona et al., 1999) whereas under field conditions water
deficits develop more slowly (Flexas et al., 1998; Loveys and Düring, 1984). For
example, stomatal closure occurred around -1.3 MPa leaf water potential in potted vines
and -1.6 MPa in field-grown vines; different hormonal behavior (e.g., abscisic acid
levels) was observed according to the size of the pots (Liu et al., 1978). In potted vines
under laboratory conditions, photosynthesis decreased with increasing water deficit, and
a more rapid decrease in the rate of photosynthesis occurred when the water deficit was
imposed before rather than after veraison (Poni et al., 1993). Elsewhere, no difference in
photosynthesis was observed in potted vines when water deficit was not severe and
when soil moisture was depleted slowly (Düring and Dry, 1995). Water deficit

1818
experiments conducted in pots found in general that non-stomatal inhibition of
photosynthesis is important (Düring, 1998; Liu et al., 1978; Murillo de Alburquerque and
Carbonneau, 1999; Quick et al., 1992; Rodrigues et al., 1993), although stomatal
limitation also was observed (Dry et al., 2000; Düring, 1987; Liu et al., 1978; Quereix et
al., 2001; Rodrigues et al., 1993; Schultz, 2000). By contrast, experiments with field-
grown vines found that a reduction in the rate of photosynthesis primarily was related to
stomatal conductance (Delgado et al., 1995; Escalona et al., 1999; Flexas et al., 1998;
Flexas et al., 1999; Osorio et al., 1995) and less severe reductions in electron transport
rates were observed.
Another factor limiting the application of results from experiments with potted
vines is that most experiments have been done with very young vines and with canopy
arrangements very different from those in a typical vineyard (Buttrose, 1965; Dry et al.,
2000; Düring, 1998; Edson et al., 1993; Edson et al., 1995a; Edson et al., 1995b; Hardie
and Considine, 1976; Miller et al., 1996b; Miller et al., 1996c; Poni et al., 1993), altering
the relation between sources and sinks that one would expect to be found in commercial
vineyards (Dokoozlian and Kliewer, 1995; Esteban et al., 1999; Gladstone and
Dokoozlian, 2003; Intrieri et al., 1997; Mabrouk and Sinoquet, 1998; Schultz, 2000). For
example, the presence of larger sinks in field grown grapevines (roots and permanent
structures) apparently could mitigate any depressing effect fruit removal may have on
leaf CO2 assimilation (Edson et al., 1995b; Petrie et al., 2000b; Williams, 1996).
Although water deficit can reduce rates of photosynthesis on a leaf area basis, situations
of large sources (big canopies) in relation to sinks (fruits) may mitigate the effect of

1919
reductions of whole vine photosynthesis on yield or quality (Kliewer and Dokoozlian,
2000; Poni et al., 1993).
Commercial viticulture in eastern Washington requires irrigation, and the
Washington wine industry uses RDI in vineyards as a standard irrigation practice.
Knowledge of the integrated response of the vine to water deficit will provide valuable
information on the balance between sources and sinks, and its relation to yield, quality,
and vine water use. Whole-canopy photosynthesis rates under various RDI strategies
will provide information that can be developed into guidelines for growers on the size of
canopy required for an expected crop load under RDI. Direct measurements of vine
water use by the canopy gas exchange technique also will suggest how RDI may be
applied to maximize water savings, an economic and political issue in the semi-arid
inland Northwest.
This project was conducted to study net gas exchange (CO2 and water vapor) by
whole canopies of field-grown grapevines, and the dynamics of leaf and cane non-
structural carbohydrates under extra water deficits imposed through RDI during the
berry growth period to modify grape composition and to save irrigation water. To
measure gas exchange, a portable, whole-canopy gas exchange system for several
mature, field-grown grapevines was designed and tested (Chapter 2). The system was
deployed in a commercial vineyard block to investigate the effects on carbon
sequestration (Chapter 3) and vine water use (Chapter 4) of three regimens of RDI that
will be described in detail (Chapter 3). Single-leaf measurements of photosynthesis were
recorded simultaneously with the collection of leaf tissues for correlation between carbon

2020
fixation and non-structural carbohydrates (Chapter 3). Yield, yield components, and
standard indicators of fruit quality were assessed (Chapter 5). These results have the
potential to be used in the development of guidelines for growers on the appropriate
timing and extent of imposed water deficits via RDI to achieve desirable canopy sizes
and ripen crops of high quality fruit demanded by winemakers.

2121
References
Alexander, D. M.; 1965: The effect of high temperature regimes or short periods of waterstress on development of small fruiting Sultana vines. Australian Journal ofAgricultural Research 16, 817-823.
Alleweldt, G.; 1984: The influence of nitrogen fertilization and water supply onphotosynthesis, transpiration and dry matter production in grapevines (Vitisvinifera). Plant Research and Development 20, 45-58.
Amthor, J. S.; 1994: Scaling CO2-photosynthesis relationships from the leaf to thecanopy. Photosynthesis Research 39, 321-350.
Anderson, J. M. and Anderson, B.; 1988: The dynamic photosynthetic membrane andregulation of solar energy conversion. Trends in Biochemical Sciences 13, 351-355.
Ball, J. T.; Woodrow, I. E.; Berry, J. A.; 1987: A model predicting stomatal conductanceand its contribution to the control of photosynthesis under different environmentalconditions. Progress in Photosynthesis Research 4, 221-224.
Behboudian, M. H.; 1997: Deficit irrigation in deciduous orchards. Horticultural Reviews21, 105-129.
Behboudian, M. H. and Singh, Z.; 2001: Water relations and irrigation scheduling ingrapevine. Horticultural Reviews 27, 189-225.
Bergqvist, J.; Dokoozlian, N.; Ebisuda, N.; 2001: Sunlight exposure and temperatureeffects on berry growth and composition of Cabernet Sauvignon and Grenache inthe Central San Joaquin Valley of California. American Journal of Enology andViticulture 52, 1-7.
Bota, J.; Medrano, H.; Flexas, J.; 2004: Is photosynthesis limited by decreased Rubiscoactivity and RuBP content under progressive water stress? New Phytologist 162,671-681.
Boyer, J. S.; 1988: Cell enlargement and growth-induced water potentials. PhysiologiaPlantarum 73, 311-316.
Bravdo, B.; Hepner, Y.; Loinger, C.; Cohen, S.; Tabacman, H.; 1985: Effect of irrigationand crop level on growth, yield and wine quality of Cabernet Sauvignon.American Journal of Enology and Viticulture 36, 132-139.
Bugbee, B.; 1992: Steady-state canopy gas exchange: system design and operation.

2222
HortScience 27, 770-776.
Buttrose, M. S.; 1965: The effect of reducing leaf area on the growth of roots, stems andberries of Gordo grapevines. Vitis 5, 455-464.
Buwalda, J. G.; 1991: A mathematical model of carbon acquisition and utilization bykiwifruit. Ecological Modelling 57, 43-64.
Buwalda, J. G.; Green, T. G. A.; Meekings, J. S. ; Coneybear, D. J.; 1992: Measurementof canopy gas exchange of kiwifruit vines using a suite of whole canopy cuvettes.Environmental and Experimental Botany 32, 439-448.
Candolfi-Vasconcelos, M. C. and Koblet, W.; 1990: Yield, fruit quality, bud fertility andstarch reserves of the wood as a function of leaf removal in Vitis vinifera -Evidence of compensation and stress recovering. Vitis 29, 199-221.
Cavallo, P.; Poni, S.; Rotundo, A.; 2001: Ecophysiology and vine performance of cv."Aglianico" under various training systems. Scientia Horticulturae 87, 21-32.
Chaumont, M.; Morot-Gaudry, J. F.; Foyer, C.; 1995: Effects of photoinhibitory treatmenton CO2 assimilation, the quantum yield of CO2 assimilation, D1 protein, ascorbate,glutathione and xanthophyll contents and the electron transport rate in vineleaves. Plant, Cell and Environment 18, 1358-1366.
Chaumont, M.; Osorio, M. L.; Chaves, M. M.; Vanacker, H.; Morot-Gaudry, J. F.; 1997:The absence of photoinhibition during mid-morning depression of photosynthesisin Vitis vinifera grown in semi-arid and temperate climates. Journal of PlantPhysiology 150, 743-751.
Chaves, M. M.; 1991: Effects of water deficits on carbon assimilation. Journal ofExperimental Botany 42, 1-16.
Chaves, M. M.; Pereira, J. S.; Maroco, J.; Rodrigues, M. L.; Ricardo, C. P. P.; Osorio, M.L.; Carvalho, I.; Faria, T.; Pinheiro, C.; 2002: How plants cope with water stress inthe field. Photosynthesis and growth. Annals of Botany 89, 907-916.
Coombe, B. G.; 1960: Relationships of growth and development to changes in sugars,auxins, and gibberellins in fruit of seeded and seedless varieties of Vitis vinifera.Plant Physiology 35, 241-250.
Coombe, B. G. and Hale, C. R.; 1973: The hormone content of ripening grape berriesand the effects of growth substance treatments. Plant Physiology 51, 629-634.
Coombe, B. G. and McCarthy, M. G.; 2000: Dynamics of grape berry growth and

2323
physiology of ripening. Australian Journal of Wine and Grape Research 6, 131-135.
Corelli-Grappadelli, L. and Magnanini, E.; 1993: A whole tree system for gas exchangestudies. HortScience 28, 41-45.
Correia, M. J.; Chaves, M. M. C.; Pereira, J. S.; 1990: Afternoon depression inphotosynthesis in grapevine leaves - evidence for a high light stress effect.Journal of Experimental Botany 41, 417-426.
Correia, M. J.; Pereira, J. S.; Chaves, M. M.; Rodrigues, M. L.; Pacheco, C. A.; 1995:ABA xylem concentration determine maximum daily leaf conductance of field-grown Vitis vinifera L. plants. Plant, Cell and Environment 18, 511-521.
Creasy, G. L. and Lombard, P. B.; 1993: Vine water stress and peduncle girdling effectson pre- and post-veraison grape berry growth and deformability. AmericanJournal of Enology and Viticulture 44, 193-197.
Creasy, G. L.; Price, S. F.; Lombard, P. B.; 1993: Evidence for xylem discontinuity inPinot noir and Merlot grapes: Dye uptake and mineral composition during berrymaturation. American Journal of Enology and Viticulture 44, 187-192.
Daudet, F. A.; 1987: Un système simple pour la measure in situ des èchanges gazeuxde couverts végétaux de quelques mètres carrés de surface foliare. Agronomie 7,133-139.
Davies, W. J.; Wilkinson, S.; Loveys, B.; 2002: Stomatal control by chemical signallingand the exploitation of this mechanism to increase water use efficiency inagriculture. New Phytologist 153, 449-460.
Davies, W. J. and Zhang, J.; 1991: Root signals and the regulation of growth anddevelopment of plants in drying soil. Annual Review of Plant Physiology and PlantMolecular Biology 42, 55-76.
De Pury, D. G. G. and Farquhar, G. D.; 1997: Simple scaling of photosynthesis fromleaves to canopies without the errors of big-leaf models. Plant, Cell andEnvironment 20, 537-557.
de Souza, C. R.; Maroco, J. P.; dos Santos, T. P.; Rodrigues, M. L.; Lopes, C. P.;Pereira, J. S.; Chaves, M. M.; 2003: Partial rootzone drying: regulation ofstomatal aperture and carbon assimilation in field-grown grapevines (Vitis viniferacv. Moscatel). Functional Plant Biology 30, 653-662.
Delgado, E.; Vadell, J.; Aguilo, F.; Escalona, J. M.; Medrano, H.; 1995: Irrigation and

2424
grapevine photosynthesis, p.693-696. In: Photosynthesis: from Light toBiosphere. P. Mathis (Ed.). Kluwer academic publishers.
Dokoozlian, N. K. and Kliewer, W. M.; 1995: The light environment within grapevinecanopies. I. Description and seasonal changes during fruit development.American Journal of Enology and Viticulture 46, 209-218.
dos Santos, T. P.; Lopes, C.; Rodrigues, M. L.; de Souza, C. R.; Maroco, J.; Pereira, J.S.; Silva, J. R.; Chaves, M. M.; 2003: Partial root zone drying: effects on growthand fruit quality of field-grown grapevines (Vitis vinifera). Functional Plant Biology30, 663-671.
Downton, W. J. S.; Loveys, B. R.; Grant, W. J. R.; 1988: Stomatal closure fully accountsfor the inhibition of photosynthesis by abscisic acid. New Phytologist 108, 263-266.
Dry, P. R.; Loveys, B. R.; Düring, H.; 2000: Partial rootzone drying of grape. I. Transientchanges in shoot growth and gas exchange. Vitis 39, 3-7.
Düring, H.; Lang, A.; Oggionni, F.; 1987: Patterns of water flow in Riesling berries inrelation to development changes in their xylem morphology. Vitis 26, 123-131.
Düring, H.; 1987: Stomatal response to alterations of soil and air humidity in grapevines.Vitis 26, 9-18.
Düring, H.; 1998: Photochemical and non-photochemical responses of glasshouse-grown grape to combined light and water stress. Vitis 37, 1-4.
Düring, H. and Dry, P. R.; 1995: Osmoregulation in water stressed roots: Responses ofleaf conductance and photosynthesis. Vitis 31, 15-17.
Edson, C. E.; Howell, G. S.; Flore, J. A.; 1993: Influence of crop load on photosynthesisand dry matter partitioning of Seyval Grapevines I. Single leaf and whole vineresponse pre- and post-harvest. American Journal of Enology and Viticulture 44,139-147.
Edson, C. E.; Howell, G. S.; Flore, J. A.; 1995a: Influence of crop load onphotosynthesis and dry matter partitioning of Seyval grapevines II. Seasonalchanges in single leaf and whole vine photosynthesis. American Journal ofEnology and Viticulture 46, 469-477.
Edson, C. E.; Howell, G. S.; Flore, J. A.; 1995b: Influence of crop load onphotosynthesis and dry matter partitioning of Seyval Grapevines III. SeasonalChanges in single leaf and whole vine photosynthesis. American Journal of

2525
Enology and Viticulture 46, 478-485.
English, J. T.; Thomas, C. S.; Marois, J. J.; Gubler, W. D.; 1989: Microclimates ofgrapevine canopies associated with leaf removal and control of Botrytis bunch rot.Phytopathology 79, 395-401.
Escalona, J. M.; Flexas, J.; Medrano, H.; 1999: Stomatal and non-stomatal limitations ofphotosynthesis under water stress in field-grown grapevines. Australian Journalof Plant Physiology 26, 421-433.
Esteban, M. A.; Villanueva, M. J.; Lissarrague, J. R.; 1999: Effect of irrigation onchanges in berry composition of Tempranillo during maturation. Sugars, organicacids, and mineral elements. American Journal of Enology and Viticulture 50,418-434.
Esteban, M. A.; Villanueva, M. J.; Lissarrague, J. R.; 2002: Relationship betweendifferent berry components in Tempranillo (Vitis vinifera L) grapes from irrigatedand non-irrigated vines during ripening. Journal of the Science of Food andAgriculture 82, 1136-1146.
Esteban, M. A.; Villanueva, M. J.; Lissarrague, J. R.; 2001: Effect of irrigation onchanges in the anthocyanin composition of the skin of cv. Tempranillo (Vitisvinifera L) grape berries during ripening. Journal of the Science of Food andAgriculture 81, 409-420.
Evans, R. G.; Spayd, S. E.; Wample, R. L.; Kroeger, M. W.; Mahan, M. O.; 1993: Wateruse of Vitis vinifera grapes in Washington. Agricultural Water Management 23,109-124.
Farquhar, G. D. and Sharkey, T.; 1982: Stomatal conductance and photosynthesis.Annual Review of Plant Physiology 33, 317-345.
Farquhar, G. D.; Wong, S. C.; Evans, J. R.; Hubick, K. T.; 1989: Photosynthesis and gasexchange. Seminar series - Society for experimental biology 39, 47-69.
Field, C. B.; Ball, J. T.; Berry, J. A.; 1989: Photosynthesis: principles and fieldtechniques, p. 209-253. In: Plant Physiological Ecology: Field methods andinstrumentation. R. W Pearcy, J. Ehleringer, H. A. Mooney, P. W. Rundel (Eds).Chapman and Hall Ltd., New York.
Findlay, N.; Oliver, K. J.; Nii, N.; Coombe, B. G.; 1987: Solute accumulation by grapepericarp cells. IV. Perfusion of pericarp apoplast via the pedicel and evidence forxylem malfunction in ripening berries. Journal of Experimental Botany 38, 668-679.

2626
Flexas, J.; Bota, J.; Escalona, J. M.; Sampol, B.; Medrano, H.; 2002: Effects of droughton photosynthesis in grapevines under field conditions: an evaluation of stomataland mesophyll limitations. Functional Plant Biology 29, 461-471.
Flexas, J.; Escalona, J. M.; Medrano, H.; 1998: Down-regulation of photosynthesis bydrought under field conditions in grapevine leaves. Australian Journal of PlantPhysiology 25, 893-900.
Flexas, J.; Escalona, J. M.; Medrano, H.; 1999: Water stress induces different levels ofphotosynthesis and electron transport rate regulation in grapevines. Plant, Celland Environment 22, 39-48.
Francesconi, A. H. D.; Lakso, A. N.; Dennings, S. S.; 1997: Light and temperatureeffects on whole-canopy net carbon dioxide exchange rates of apple trees. ActaHorticulturae 451, 287-293.
Freeman, B. M.; 1983: Effects of irrigation and pruning of Shiraz grapevines onsubsequent red wine pigments. American Journal of Enology and Viticulture 34,23-26.
Freeman, B. M. and Kliewer, W. M.; 1983: Effect of irrigation, crop level and potassium on Carignane vines. II. Grape and wine quality. American Journal of Enology andViticulture 34, 197-207.
Gamon, J. A. and Pearcy, R. W.; 1990: Photonhibition in Vitis californica: interactiveeffects of sunlight, temperature and water status. Plant, Cell and Environment 13,267-275.
Garcia, R.; Norman, J. M.; McDermitt, D. K.; 1990: Measurements of canopy gasexchange using an open chamber system. Remote Sensing Reviews 5, 141-162.
Gifford, R. M.; Thorne, J. H.; Hitz, W. D.; Giaquinta, R.; 1984: Crop productivity andphotoassimilate partitioning. Science 225 , 801-808.
Gladstone, E. A. and Dokoozlian, N. K.; 2003: Influence of leaf area density andtrellis/training system on the light microclimate within grapevine canopies. Vitis42, 123-131.
Grau, A.; 1995: A closed chamber technique for field measurements of gas exchange offorage canopies. New Zealand Journal of Agricultural Research 38, 71-77.
Greenspan, M. D.; Schultz, H. R.; Matthews, M. A.; 1996: Field evaluation of watertransport in grape berries during water deficits. Physiologia Plantarum 97, 55-62.

2727
Greenspan, M. D.; Shackel, K. A.; Matthews, M. A.; 1994: Developmental changes inthe diurnal water budget of the grape berry exposed to water deficit. Plant, Celland Environment 17, 811-820.
Greenspan, M. D.; Shackel, K. A.; Matthews, M. A. ; 1992: Developmental control of thediurnal water budget of the grape berry. Quaderno di Viticoltura e di Enologia.Università di Torino 16, 165-168.
Gubler, W. D.; Marois, J. J.; Bledsoe, A. M.; Bettiga, L. J.; 1987: Control of Botrytisbunch rot of grape with canopy management. Plant Disease 71, 599-601.
Hardie, W. J. and Considine, J. A.; 1976: Response of grapes to water-deficit stress inparticular stages of development. American Journal of Enology and Viticulture 27,55-61.
Hardie, W. J.; O'Brien, T. P.; Jaudzems, V. G.; 1996: Morphology, anatomy anddevelopment of the pericarp after anthesis in grape, Vitis vinifera L. AustralianJournal of Grape and Wine Research 2, 97-142.
Harris, J. M.; Kriedemann, P. E.; Possingham, J. V.; 1968: Anatomical aspects of grapeberry development. Vitis 7, 106-119.
Hartung, W.; Sauter, A.; Hose, E.; 2002: Abscisic acid in the xylem: where does it comefrom, where does it go to? Journal of Experimental Botany 53, 27-32.
Heinicke, A. J. and Childers, N. F.; 1937: The daily rate of photosynthesis, during thegrowing season of 1935, of a young apple tree of bearing age. Cornell UniversityAgricultural Experimental Station Memoir 201 , 1-52.
Hrazdina, G.; Parsons, G. F.; Mattick, L. R.; 1984: Physiological and biochemical eventsduring development and maturation of grape berries. American Journal ofEnology and Viticulture 35, 220-227.
Hsiao, T. C.; 1973: Plant responses to water stress. Annual Review of Plant Physiololgy24, 519-570.
Hsiao, T. C. and Acevedo, E.; 1974: Plant responses to water deficits, water-useefficiency, and drought resistance. Agricultural Meteorology 14, 59-84.
Hsiao, T. C. and Xu, L. K.; 2000: Sensitivity of growth of roots versus leaves to waterstress: biophysical analysis and relation to water transport. Journal ofExperimental Botany 51, 1595-1616.
Hummel, A. K. and Ferrere, D. C.; 1998: Interaction of crop level and fruit cluster

2828
exposure on Seyval Blanc fruit composition. Journal of the American Society forHorticultural Science 123, 755-761.
Iacono, F.; Bertamini, M.; Mattivi, F.; Scienza, A.; 1995: Differential effects of canopymanipulation and shading of Vitis vinifera L. cv. Cabernet Sauvignon. Leaf gasexchange, photosynthetic electron transport rate and sugar accumulation inberries. Vitis 4, 201-206.
Iacono, F. and Sommer, K. J.; 2000: Responses of electron transport rate of waterstress-affected grapevines: influence of leaf age. Vitis 39, 137-144.
Intrieri, C.; Poni, S.; Rebucci, B.; Magnanini, E.; 1997: Effects of canopy manipulationson whole-vine photosynthesis: results from pot and field experiments. Vitis 36, 167-173.
Intrieri, C.; Poni, S.; Rebucci, B.; Magnanini, E.; 1998: Row orientation effects on wholecanopy gas exchange of potted and field grown grapevines. Vitis 37, 147-154.
Jackson, D. I. and Lombard, P. B.; 1993: Environmental and management practicesaffecting grape composition and wine quality - A review. American Journal ofEnology and Viticulture 44, 409-430.
Jacobs, C. M. J.; van den Hurk, B. J. J. M.; de Bruin, H. A. R.; 1996: Stomatal behaviourand photosynthetic rate of unstressed grapevines in semi-arid conditions.Agricultural and Forest Meteorology 80, 111-134.
Jarvis, A. J. and Davies, W. J.; 1998: The coupled response of stomatal conductance tophotosynthesis and transpiration. Journal of Experimental Botany 49, 399-406.
Jones, H. G.; 1985: Partitioning stomatal and non-stomatal limitations to photosynthesis.Plant, Cell and Environment 8, 95-104.
Kaps, M. and Cahoon, G. A.; 1992: Growth and fruiting of container-grown Seyval blancgrapevines modified by changes in crop level, leaf number and position, and lightexposure. American Journal of Enology and Viticulture 43, 191-199.
Katerji, N.; Daudet, F. A.; Carbonneau, A.; Ollat, N.; 1994: Etude à l'echelle de la planteentière du fonctionnement hydrique et photosynthètique de la vigne: comparaisondes systèmes de conduite traditionnel et en Lyre. Vitis 33, 197-203.
Kennedy, J. A.; Matthews, M. A.; Waterhouse, A. L.; 2002: Effect of maturity and vinewater status on grape skin and wine flavonoids. American Journal of Enology andViticulture 53, 268-274.

2929
Kennedy, J. A.; Matthews, M. M.; Waterhouse, A. L.; 2000: Changes in grape seedpolyphenols during fruit ripening. Phytochemistry 55, 77-85.
Kliewer, W. M. and Dokoozlian, N. K.; 2000: Leaf area/crop weight ratios of grapevines:influence on fruit composition and wine quality, p.285-295. In: Proceedings of theAmerican Society of Enology and Viticulture Annual Meeting. Seattle, WA.
Kliewer, W. M.; Freeman, B.; Hossom, C.; 1983: Effect of irrigation, crop level andpotassium fertilization on Carignane vines. I. Degree of water stress and effect ongrowth and yield. American Journal of Enology and Viticulture 34, 186-196.
Kliewer, W. M. and Ough, C. S.; 1970: The effect of leaf area and crop level on theconcentration of the amino acids and total nitrogen in Thompson Seedlessgrapes. Vitis 9, 196-206.
Knight, S. L.; 1992: Constructing specialized plant growth chambers for gas exchangeresearch: considerations and concerns. HortScience 27, 767-769.
Koblet, W.; Candolfi-Vasconcelos, M. C.; Zweifel, W.; Howell, G. S.; 1994: Influence ofleaf removal, rootstock, and training system on yield and fruit composition of Pinotnoir grapevines. American Journal of Enology and Viticulture 45, 181-187.
Kramer, P. J. and Boyer, J. S.; 1995: Water relations of plants and soils, AcademicPress, Inc., CA, USA.
Kriedemann, P. E. and Smart, R. E.; 1971: Effects of irradiance, temperature, and leafwater potential on photosynthesis of vine leaves. Photosynthetica 5, 6-15.
Lakso, A. N.; Mattii, G. B.; Nyrop, J. P.; Denning, S. S.; 1996: Influence of European redmite on leaf and whole canopy carbon dioxide exchange, yield, fruit size, qualityand return cropping in 'Starkrimson Delicious' apple trees. Journal of theAmerican Society for Horticultural Science 121, 954-958.
Leadley, P. W. and Drake, B. G.; 1993: Open top chambers for exposing plant canopiesto elevated CO2 concentration and for measuring net gas exchange. Vegetatio104/105, 3-15.
Liu, T. W.; R. Pool; W. Wenkert; P.E. Kriedemann; 1978: Changes in photosynthesis,stomatal resistance and abscisic acid of Vitis labruscana through drought andirrigation cycles. American Journal of Enology and Viticulture 29, 239-246.
Long, S. P.; Farage, P. K.; Garcia, R. L.; 1996: Measurement of leaf and canopyphotosynthetic CO2 exchange in the field. Journal of Experimental Botany 47,1629-1642.

3030
Long, S. P. and Hällgren, J.-E.; 1989: Measurement of CO2 assimilation by plants in thefield and the laboratory, p. 62-94. In: Techniques in Bioproductivity andPhotosynthesis. J. Coombs and D.O. Hall (Eds.). Chapman & Hall, Great Britain.
Loveys, B. R. and Düring, H.; 1984: Diurnal changes in water relations and abscisic acidin field-grown Vitis vinifera cultivars. II. Abscisic acid changes under semi-aridconditions. New Phytologist 97, 37-47.
Mabrouk, H. and Sinoquet, H.; 1998: Indices of light microclimate and canopy structureof grapevines determined by 3D digitising and image analysis, and theirrelationship to grape quality. Australian Journal of Grape and Wine Research 4,12-13.
Matthews, M. A. and Anderson, M. M.; 1988: Fruit ripening in Vitis vinifera L.:Responses to seasonal water deficits. American Journal of Enology andViticulture 39, 313-320.
Matthews, M. A. and Anderson, M. M.; 1989: Reproductive development in grape (Vitisvinifera L.). Responses to seasonal water deficits. American Journal of Enologyand Viticulture 40, 52-60.
Matthews, M. A.; Cheng, G.; Weinbaum, S. A.; 1987: Changes in water potential anddermal extensibility during grape berry development. Journal of the AmericanSociety for Horticultural Science 112, 314-319.
McCarthy, M. G.; 1997: The effects of transient water deficit on berry development of cv.Shiraz (Vitis vinifera L.). Australian Journal of Grape and Wine Research 3, 102-108.
McCarthy, M. G. and Coombe, B. G.; 1999: Is weight loss in ripening grape berries cv.Shiraz caused by impeded phloem transport. Australian Journal of Grape andWine Research 5, 17-21.
Medrano, H.; Escalona, J. M.; Bota, J.; Gulias, J.; Flexas, J.; 2002a: Regulation ofphotosynthesis of C3 plants in response to progressive drought: stomatalconductance as a reference parameter. Annals of Botany 89, 895-905.
Medrano, H.; Bota, J.; Abadía, A.; Sampol, B.; Escalona, J. M.; Flexas, J.; 2002b:Effects of drought on light-energy dissipation mechanisms in high-light-acclimated, field-grown grapevines. Functional Plant Biology 29, 1197-1207.
Medrano, H.; Escalona. J. M.; Cifre, J.; Bota, J.; Flexas, J.; 2003: A ten-year study onthe physiology of two Spanish grapevine cultivars under field conditions: effects ofwater availability from leaf photosynthesis to grape yield and quality. Functional
3131
Plant Biology 30, 607-619.
Miller, D. P.; Howell, G. S.; Flore, J. A.; 1996a: A whole plant open gas exchangesystem for measuring net photosynthesis of potted woody plants. HortScience 31,944-946.
Miller, D. P.; Howell, G. S.; Flore, J. A.; 1996b: Effect of shoot number on pottedgrapevines: II. Dry matter accumulation and partitioning. American Journal ofEnology and Viticulture 47, 251-256.
Miller, D. P.; Howell, G. S.; Flore, J. A.; 1996c: Effect of shoot number on pottedgrapevines: I. Canopy development and Morphology. American Journal ofEnology and Viticulture 47, 244-250.
Mullins, M. G.; Bouquet, A.; Williams, L. E.; 1992: Biology of the Grapevine. PressSyndicate of the University of Cambridge, Cambridge.
Murillo de Alburquerque, R. and Carbonneau, A.; 1999: Trocas gasosas em Vitis viníferasob regime de estresse hidrico. II fotorespiracion e comportammento varietal.Pesquisa Agropecuaria Brasileira 34, 37-43.
Nadal, M. and Arola, L.; 1995: Effects of limited irrigation on the composition of mustand wine of Cabernet Sauvignon under semi-arid conditions. Vitis 34, 151-154.
Naor, A.; Bravdo , B.; Gelobter, J.; 1994: Gas exchange and water relations in field-grown Sauvignon blanc grapevines. American Journal of Enology and Viticulture45, 423-428.
Naor, A.; Bravdo, B.; Hepner, Y.; 1993: Effect of post-veraison irrigation level onSauvignon blanc yield, juice quality and water relations. South African Journal ofEnology and Viticulture 14, 19-25.
Naor, A.; Gal, Y.; Bravdo, B.; 1997: Crop load affects assimilation rate, stomatalconductance, stem water potential and water relations of field grown Sauvignonblanc grapevines. Journal of Experimental Botany 48, 1675-1680.
Naor, A. and Wample, R. L.; 1994: Gas exchange and water relations of field-grownConcord (Vitis labruscana Bailey) grapevines. American Journal of Enology andViticulture 45, 333-337.
Neja, R. A.; Wildman, W. E.; Ayers, R. S.; Kasimatis, A. N.; 1977: Grapevine responseto irrigation and trellis treatments in the Salinas Valley. American Journal ofEnology and Viticulture 28, 16-26.

3232
Ojeda, H.; Anadary, C.; Kraeva, E.; Carbonneau, A.; Deloire, A.; 2002 : Influence of pre-and postveraison water deficit on synthesis and concentration of skin phenoliccompounds during berry growth of Vitis vinifera cv. Shiraz. American Journal ofEnology and Viticulture 53, 261-267.
Ojeda, H.; Deloire, A.; Carbonneau, A.; 2001: Influence of water deficit on grape berrygrowth. Vitis 40, 141-145.
Ojeda, H.; Deloire, A.; Carbonneau, A.; Ageorges, A.; Romieu, C.; 1999: Berrydevelopment of grapevines: relations between growth of berries and their DNAcontent indicate cell multiplication and enlargement. Vitis 38, 145-150.
Ollat, N.; Diakou-Verdin, P.; Carde, J. P.; Barrieu, F.; Gaudillére, J. P.; Moing, A.; 2002:Grape berry development: a review. Journal International de las Sciences de laVigne et du Vin 36, 109-131.
Ollat, N. and Tandonnet, J. P.; 1999: Effects of two levels of water supply on thephotosynthesis and the transpiration of a whole grapevine (Vitis vinifera, c.v.Cabernet Sauvignon). Acta Horticulturae 493, 197-204.
Orlandini, S. and Giuntoli, A.; 1998: Photosynthesis of grapevine leaves infected bydowney mildew. Journal International de Sciences de Vigne et du Vin 32, 121-127.
Osmond, C. B.; 1994: What is photoinhibition? Some insights from comparisons ofshade and sun plants, p. 1-24. In: Photoinhibition of photosynthesis frommolecular mechanisms to the field. N. R. Baker and J. R. Boyer (Eds.). BIOSScientific Publishers Ltd. Oxford, U. K.
Osorio, M. L.; Osorio, J.; Pereira, J. S.; Chaves, M.; 1995: Responses of photosynthesisto water stress under field conditions in grapevines are dependant on irradianceand temperature. Photosynthesis: from Light to Biosphere 4, 669-672.
Palliotti, A. and Cartechini, A.; 2000: Analisi della crescita e delle risposte adattative allacarenza idrica moderata nella Vitis vinifera L. Rivista di Irrigazione e Drenaggio47, 30-36.
Patakas, A. and Noitsakis, B.; 2001: Leaf age effects on solute accumulation in water-stressed plants. Journal of Plant Physiology 158, 63-69.
Perez Peña, J. and Tarara, J.; 2004: A portable whole canopy gas exchange system forseveral mature field-grown grapevines. Vitis 43, 7-14.
Petrie, P.; Trought, M.; Howell, G. S.; 2000a: Growth and dry matter partitioning of Pinot

3333
noir (Vitis vinifera L) in relation to leaf area and crop load. Australian Journal ofGrape and Wine Research 6, 40-45.
Petrie, P. R.; Trought, M. C. T.; Howell, G. S.; 2000b: Influence of leaf aging, leaf areaand crop load on photosynthesis, stomatal conductance and senescence ofgrapevine (Vitis vinifera L. cv. Pinot noir). Vitis 39, 31-36.
Petrie, P. R.; Trought, M. C. T.; Howell, G. S.; Buchan, G. D.; 2003: The effect of leafremoval and canopy height on whole-vine gas exchange and fruit development ofVitis vinifera L. Sauvignon Blanc. Functional Plant Biology 30, 711-717.
Picaud, S.; Becq, F.; Dédaldéchamp, F.; Ageorges, A.; Delrot, S.; 2003: Cloning andexpression of two plasma membrane aquaporins expressed during the ripening ofgrape berry. Functional Plant Biology 30, 621-630.
Pirie, A. J. G. and Mullins, M. G.; 1980: Concentration of phenolics in the skin of grapeberries during fruit development and ripening. American Journal of Enology andViticulture 31, 34-36.
Poni, S.; C. Intrieri; E. Magnanini; 2000: Seasonal growth and gas exchange ofconventionally and minimally pruned Chardonnay canopies. Vitis 39, 13-18.
Poni, S.; Lakso, A. N.; Turner, J. R.; Melious, R. E.; 1993: The effects of pre- and post-veraison water stress on growth and physiology of potted Pinot noir grapevines atvarying crop levels. Vitis 32, 207-214.
Poni, S.; Lakso, A. N.; Turner, J. R.; Melious, R. E.; 1994: Interactions of crop level andlate season water stress on growth and physiology of field-grown Concordgrapevines. American Journal of Enology and Viticulture 45, 252-258.
Poni, S.; Magnanini, E.; Bernizzoni, F.; 2003: Degree of correlation between total lightinterception and whole-canopy net CO2 exchange rate in two grapevine growthsystems. Australian Journal of Grape and Wine Research 9, 2-11.
Poni, S.; Magnanini, E.; Rebucci, B.; 1997: An automated chamber system formeasurements of whole vine gas exchange. HortScience 32, 64-67.
Pratt, C.; 1971: Reproductive anatomy in cultivated grapes - A review. American Journalof Enology and Viticulture 22, 92-109.
Price, S. F.; Breen, P. J.; Valladao, M.; Watson, B. T.; 1995: Cluster sun exposure andquercitin in Pinot noir grapes and wine. American Journal of Enology andViticulture 46, 187-194.

3434
Quereix, A.; Dewar, R. C.; Gaudillere, J. P.; Dayau, S.; Valancogne, C.; 2001: Sinkfeedback regulation of photosynthesis in vines: measurement and a model.Journal of Experimental Botany 52, 2313-2322.
Quick, W. P.; Chaves, M. M.; Wendler, R.; David, M.; Rodrigues. M. L.; Pa, J. A.; 1992:The effect of water stress on photosynthetic carbon metabolism in four speciesgrown under field conditions. Plant, Cell and Environment 15, 25-35.
Reynolds, A. G.; 2000: Impact of trellis/training systems and cultural practices onproduction efficiency, fruit composition, and vine balance, p.309-317. In:Proceedings of the American Society of Enology and Viticulture Annual Meeting.Seattle, WA.
Reynolds, A. G. and Naylor, A. P.; 1994: 'Pinot noir' and 'Riesling' grapevines respond towater stress duration and soil water-holding capacity. HortScience 29, 1505-1510.
Rodrigues, M. L.; Chaves, M. M.; Wendler, R.; David, M. M.; Quick, W. P.; Leeg, R. C.;1993: Osmotic adjustment in water stressed grapevines leaves in relation tocarbon assimilation. Australian Journal of Plant Physiology 20, 309-321.
Rogiers, S. Y.; Smith, J. A.; White, R.; Keller, M.; Holzapfel, B. P.; Virgona, J. M.; 2001:Vascular function in berries of Vitis vinifera (L) cv. Shiraz. Australian Journal ofGrape and Wine Research 7, 46-51.
Sauter, A.; Davies, W. J.; Hartung, W.; 2001: The long-distance abscisic acid signal inthe droughted plant: the fate of the hormone on its way from root to shoot.Journal of Experimental Botany 52, 1991-1997.
Schubert, A.; Restasgno, M.; Lovisolo, C.; 1996: Net photosynthesis of grapevinesleaves of different age exposed to high or low light intensities. Advances inHorticultural Science 10, 163-166.
Schultz, H. R.; 2000: Physiological mechanisms of water use efficiency in grapevinesunder drought conditions. Acta Horticulturae 526, 115-136.
Schultz, H. R.; Kieffer, W.; Gruppe, W.; 1996: Photosynthesis duration, carboxylationand stomatal limitation of sun and shade leaves of different ages in field-growngrapevine (Vitis vinifera L.). Vitis 35, 169-176.
Schultz, H. R. and Matthews, M. A.; 1993: Growth, osmotic adjustment, and cell-wallmechanics of expanding grape leaves during water deficits. Crop Science 33,287-294.
3535
Smart, R. E.; 1974: Aspects of water relations of the grapevine (Vitis vinifera). AmericanJournal of Enology and Viticulture 25, 84-91.
Smart, R. E.; Smith, S. M.; Winchester, R. V.; 1988: Light quality and quantity effects onfruit ripening for Cabernet Sauvignon. American Journal of Enology andViticulture 39, 250-258.
Spayd, S. E.; Tarara, J. M.; Mee, D. L.; Ferguson, J. C.; 2002: Separation of sunlightand temperature effects on the composition of Vitis vinifera cv. Merlot berries.American Journal of Enology and Viticulture 53, 171-182.
Srinivasan, C. and Mullins, M. G.; 1981: Physiology of fowering in the gapevine - Areview. American Journal of Enology and Viticulture 32, 47-63.
Stoll, M.; Loveys, B.; Dry, P.; 2000: Hormonal changes induced by partial rootzonedrying of irrigated grapevine. Journal of Experimental Botany 51, 1627-1634.
Succi, F. and Magnanini, E.; 1994: Daily measurement of CO2 assimilation rate onkiwifruit vine. New Zealand Journal of Crop and Horticultural Science 22, 17-21.
Taiz, L. and Zeiger, E.; 1998: Translocation in the Phloem, p. 251-285. In: PlantPhysiology, 2nd Edition, Sinauer Associates Inc., MA, USA.
Tardieu, F. and Davies, W. J.; 1992: Stomatal response to abscisic acid is a function ofcurrent plant water status. Plant Physiology 98, 540-545.
Van Zyl, J. L.; 1984: Response of Colombar grapevines to irrigation as regards qualityaspects and growth. South African Journal of Enology and Viticulture 5, 19-28.
Van Zyl, J. L.; 1987: Diurnal vatiation in grapevine water stress as a function of changingsoil water status and meteorological conditions. South African Journal of Enologyand Viticulture 8, 45-52.
Varadi, G.; Balo, B.; Boddi, E.; Polyak, D.; 1995: Photosynthetic parameters of virusinfected grapevine leaves. Photosynthesis: from Light to Biosphere 4, 917-920.
Von Caemmerer, S. and Farquhar, G. D.; 1981: Some relationships between thebiochemistry of photosynthesis and the gas exchange of leaves. Planta 153, 376-387.
Wermelinger, B. and Baumgärtner, J.; 1991: A demographic model of assimilation andallocation of carbon and nitrogen in grapevines. Ecological Modelling 53, 1-26.
Wheeler, R. M.; 1992: Gas-exchange measurements using a large, closed plant growth

3636
chamber. HortScience 27, 777-780.
Wilkinson, S. and Davies, W. J.; 1997: Xylem sap pH increase: a drought signalreceived at the apoplastic face of the guard cell that involves the suppression ofsaturable abscisic acid by the epidermal symplast. Plant Physiology 113, 559-573.
Wilkinson, S. and Davies, W. J.; 2002: ABA-based chemical signalling: the coordinationof responses to stress in plants. Plant, Cell and Environment 25, 195-210.
Williams, L. E.; 1996: Grape, p. 851-881. In: Photoassimilates distribution in plants andcrops. Source-sink relationships. E. Zamski and A. Schaffer (Eds.). MarcelDecker, Inc. New York.
Williams, L. E.; Dokoozlian, N. K.; Wample, R.; 1994: Grape, p. 85-133. In: Handbook ofenvironmental physiology of fruit crops, p. 85-133. B. Shaffer and P. C. Anderson(Eds.). CRC Press, Orlando, Fla.
Williams, L. E. and Matthews, M. A.; 1990: Grapevine, p. 1019-1055. In: Irrigation ofagricultural crops. Agronomy monograph 30. B. A. Stewart and D. R. Nielsen(Eds.). American Society of Agronomy, Madison, Wisconsin.
Winkel, T. and Rambal, S.; 1993: Influence of water stress on grapevines growing infield: from leaf to whole-plants response. Australian Journal of Plant Physiology ,143-157.
Winkler, A. J.; Cook, J. A.; Kliewer, W. M.; Lider, L. A.; 1974: General Viticulture.University of California Press, Berkeley.
Wünsche, J. N. and Palmer, J. W.; 1997: Portable through-flow cuvette system formeasuring whole canopy gas exchange of apples trees in the field. HortScience32, 653-658.
Zoecklein, B. W.; Wolf, T. K.; Duncan, S. E.; Mercy, J. E.; Jasinsky, Y.; 1998: Effect offruit zone removal on total glycoconjugates and conjugate fraction concentrationof Riesling and Chardonnay (Vitis vinifera L.) grapes. American Journal ofEnology and Viticulture 49, 259-265.

3737
CHAPTER 2
A PORTABLE WHOLE-CANOPY GAS EXCHANGE SYSTEM
FOR SEVERAL MATURE FIELD-GROWN GRAPEVINES
2.1. Abstract
Six flow-through chambers (8 m3 volume) were built to measure gas exchange
(CO2 and H2O) of whole vines under deficit irrigation regimes that imposed water stress
at different stages of berry development. Chamber design and materials were selected
to minimize environmental effects, and to accommodate the trellis of a mature, field-
grown vine. A framed design allowed the chambers to withstand sustained winds up to
13 m s-1, overcoming one disadvantage of the balloon-type chambers. At mid-canopy
height, 1.6 m, air temperature inside the chamber was no more than 2.5oC higher than
at the same height in the canopy of an unchambered vine. Over 24 h, solar radiation
inside the chamber was 90% of ambient. For vines irrigated according to standard
industry practice, maximum values of net CO2 exchange approached 12 �mol m-2 s-1,
whereas in water-stressed vines the maxima approached only 6.5 �mol m-2 s-1.
Transpiration among water stressed plants was reduced, with maximum rates at
1 mmol m-2 s-1 while vines under standard irrigation were at 2.5 mmol m-2 s-1. Apparent
light saturation for canopy photosynthesis was approximately 1200 �mol m-2 s-1 PPFD
(photosynthetic photon flux density) for vines under standard irrigation, and about
800 �mol m-2 s-1 PPFD for vines under water stress.
3838
2.2. Introduction
Photosynthesis measurements indicate net primary productivity. Most
photosynthesis measurements have been recorded on single leaves and there are
several commercial instruments available. However, in large trellised canopies like
grapevines and some fruit trees, single leaf measurements often provide incomplete and
somewhat misleading data compared to whole plant net primary productivity (Corelli-
Grappadelli and Magnanini, 1993; Long et al., 1996; Poni et al., 1997). The
photosynthetic capacity among leaves in a grapevine canopy differs due to leaf age
(Kriedemann et al., 1970; Schultz, 1993), light exposure (Iacono and Sommer, 1996;
Zufferey et al., 2000) and position on the shoot (Hunter and Visser, 1989; Poni et al.,
1994), crop load (Naor et al., 1997; Petrie et al., 2000), and leaf prehistory during lamina
expansion (Gamon and Pearcy, 1989; Intrieri et al., 1992; Silvestroni et al., 1993;
Schultz et al., 1996). Scaling-up from single leaf measurements to whole canopy
photosynthesis measurements is not straightforward, as the latter is a measurement of
leaves of different age and degree of light exposure, as well as other organs like fruit,
shoots, and trunks (Bugbee, 1992). Estimation of leaf area distribution and light
extinction by the canopy combined with a directional treatment of incident light is needed
to estimate whole canopy photosynthesis from single leaf measurements (De Pury and
Farquhar, 1997; Giaglaras et al., 1995). Transpiration is reduced by the boundary layer
of the leaf and the entire canopy (Wullschleger et al., 1998). Single leaf measurements
can overestimate true whole-plant photosynthesis by as much as 40% in grapevines and
fruit trees (Edson et al., 1995; Katerji et al., 1994; Poni et al., 1997). Spatial and

3939
temporal variation in gas exchange and complex interactions between the plant and the
environment make extrapolations difficult (Buwalda, 1991; Buwalda et al., 1992; Intrieri
et al., 1997; Long et al., 1996; Succi and Magnanini, 1994; Wünsche and Palmer, 1997).
In addition, whole canopies may have higher apparent values for light compensation and
light saturation points than single leaves (Corelli-Grappadelli and Magnanini, 1993;
Francesconi et al., 1997).
Whole canopy enclosure methods are well adapted to small experimental plot
sizes (Steduto et al., 2002) and overcome some limitations of single leaf gas exchange
by integrating the response of the canopy (Buwalda et al., 1992; Daudet, 1987; Garcia
et al., 1990). Good enclosure design minimizes disturbance of the plant’s natural
environment (Garcia et al., 1990). However, even with a highly transparent cover, an
enclosure reduces solar radiation in the chamber as well as gas exchange between the
plant and the atmosphere (Corelli-Grappadelli and Magnanini, 1993; Daudet, 1987;
Mandl et al., 1973). This “chamber effect” must be minimized by sufficient rates of air
exchange and air mixing within the chamber.
Our goal was to construct a gas exchange system that was unattended,
moveable, wind resistant, and, using multiple chambers, capable of simultaneously
recording measurements from several mature, trellised, field-grown grapevines. Each
chamber enclosed a single vine. An open flow-through system was preferable because
of the extended measurement period (>24 h) and the difficulty of establishing a perfect
seal between plant and atmosphere with a large moveable chamber (Brown, 1988;
Wheeler, 1992). Leakage of air from a well-mixed open chamber has little if any effect

4040
on estimated gas exchange, as long as the flow rate of air entering the chamber is
measured accurately (Garcia et al., 1990). The system was autonomous in that it was
powered by a self-contained gas generator. This paper describes the design and
management of a mobile system used to measure net gas exchange of whole field-
grown grape vines (Vitis vinifera L. cv. Cabernet Sauvignon) under various deficit
irrigation regimes in a semi-arid climate. The system can be applied in different areas
where studies on whole canopy physiology are of interest.
2.3. Materials and methods
2.3.1. Chamber design
Six open, whole canopy gas exchange chambers were designed, built and tested
during 2001 and 2002 for use with mature, field-grown grapevines supported by a
multiple-wire trellis. Frequent strong winds (e.g., ≈12.5 m s-1) at the experimental site
required the chambers to be framed, which also simplified installation and repositioning
in the field. Chamber dimensions were determined by the volume of canopy to be
enclosed (maximum canopy height about 2 m, total leaf area about 8 m2), the distance
between rows (2.7 m), the distance between vines (1.8 m), and the trellis structures (3
horizontal wires at 0.80 m, 1.20 m, and 1.60 m). The modular design accommodated the
trellis system without modification, allowing selection of any vine in the vineyard without
disturbing vineyard management operations or the trellis wires (Weinstock et al., 1982).
Chambers were designed as standing cylinders (2.1 m diameter x 2.0 m height)
topped by an open frustum (1.05 m high; Figure 2.1). An ideal shape for a chamber is
spherical to maintain the angle of incidence of the radiation onto the chamber as

4141
perpendicular as possible (Corelli-Grappadelli and Magnanini, 1997), while at the same
time ensuring sufficient air mixing. A cylinder topped by a frustum improves air
circulation by minimizing sharp angles at the outlet and reducing air incursion into the
top of the chamber. The chambers were composed of two halves. Support legs (0.45 m
high) raised the floor of the chamber above the drip irrigation lines and were retractable
to facilitate chamber installation and leveling. Total chamber volume was approximately
8 m3. Although frame members cast shadows on the canopy, the design was structured
to minimize this effect. The ratio between frame area and chamber surface area
(excluding floor) was 0.058. A small surface : volume ratio also reduces errors due to
water adsorption (Knight, 1992), although the chamber cladding had stringent adsorption
specifications. Framing members were lightweight aluminum (3.17 mm thick). A
cylindrical chamber was attained with 4 horizontal rings of flat aluminum (25.4 mm wide;
Figure 2.1) attached to the vertical parts. The basal ring was 50 mm wide and supported
the chamber floor. Angle aluminum (25.4 mm x 25.4 mm) was used for the vertically
oriented structures. To seal the chamber and avoid air leaks, closed-cell, adhesive-
backed PVC foam strips (2.54 mm wide, 12.7 mm thick, 0.192 g cm-3 density) were
attached to the vertical aluminum structure of one of the halves along the contact area
with the other half. U-shaped aluminum clamps were used to join the halves,
compressing the foam strip and sealing the chamber from incursion of outside air. Once
installed in the vineyard, the chambers were secured to trellis posts in adjacent rows by
4 ropes. The chamber floor was 5 cm thick polystyrene foam (Styrofoam® ; Dow,
Midland, MI). A piece of foam was wrapped and tied around the vine trunk to

4242
approximate a circular section and eliminate irregularities that might cause air leaks at
the base of the chamber. A semicircle (0.13 m radius) was cut at the edge of each half
floor, so that when the chamber was closed, the flooring sealed the foam around the
vine (Figure 2.2 A, B).
The chambers were clad in a biaxially oriented polypropylene (RX 140-Propafilm™
- UCB Films Inc, Smyrna, GA), having a nominal thickness of 0.035 mm, thermal
transmission of 70% (2.5 µm – 20 µm), permeability to CO2 of 4 x 10⁻⁹ µmol m-2 s-1 mm-1
(thickness) Pa-1 (gradient), and water absorption <0.005% over 24 h (Garcia et al.,
1990). PropafilmTM has the highest long-wave transmissivity of suitable, commonly
available claddings for gas exchange chambers (Hunt 2003), and is inexpensive. The
absorbance of Propafilm™ between 200 nm and 1100 nm was measured with a
spectrophotometer (DU® 640, Beckman, Fullerton, CA) at 50 nm intervals. Total
radiative absorbance of the polypropylene film was about 0.06 to 0.08 in the visible
range (400-700 nm) and about 0.05 to 0.06 in the near infrared (700-1100 nm). The
cladding did not significantly modify the spectrum of incident solar radiation. Integrated
over 24 h, the maximum reduction in irradiance was 10% for either cloudy or clear skies.
Double sided tape for aluminum and plastic was used to adhere the film to the aluminum
frame (9495 LE, 3M, Minneapolis, MN).
Ambient air was delivered to the chamber by a split capacitor blower
(2.7 x 10⁴ L min-1; Dayton No. 7086-0201, Chicago, IL) with round inlet (0.16 m
diameter) and rectangular outlet (0.14 m x 0.18 m). Galvanized sheet metal pipe was
used for drawing ambient air into the blower and directing it to the chamber. Air intake

4343
was 3.5 m above the ground to minimize fluctuations in ambient CO2. The blower was
connected to a transition duct that converted the rectangular exit to a circular section
(0.20 m diameter) that then branched into two smaller (0.15 m diameter) delivery ducts
beneath the chamber. A butterfly valve inside the 0.20 m diameter pipe was used to vary
manually the flow rate (Figure 2.2 C). Air was distributed inside the chamber by two
plenums (Figure 2.1), one in each half of the chamber, made of 0.15 m diameter, low
density (100 �m thick) polyethylene tubes, with 132 uniformly distributed (19 mm
diameter) perforations. The plenums were inclined approximately 35o. This inclination
was determined after assessing visually the direction of the air streams during a test of
the air circulation pattern inside the chamber by igniting smoke candles (Smoke No. 2B
60 second, Superior Signal Company, Spotswood, NJ) at the inlet pipe of the chamber.
Smoke tests also indicated where in the chambers the air samples should be taken.
Air temperatures at the inlet and outlet of the chamber were measured by
thermocouples (type T, 24 AWG). Inlet thermocouples were located inside the inlet pipe,
after the blower and before the plenum. For the outlet air, shielded thermocouples were
hung 0.5 m below the top of the frustum of the chamber. Shielded thermocouples also
were hung in the canopy at 1.6 m (mean canopy height). Global irradiance was
measured by a pyranometer (LI-200SA, LI-COR, Lincoln, NE) and incident
photosynthetic photon flux density (PPFD) by a quantum sensor (LI-190S-1, LI-COR,
Lincoln, NE), both located outside the chambers.
Air was sampled continuously from 0.75 m below the chamber frustum at a rate
of 15 L min-1 with three, dual-head vacuum pumps (Mod. 400-2901, Barnant Company,

4444
Barrington, IL) and was delivered to the infrared gas analyzer (IRGA, Ciras - DC, PP
Systems, Haverhill, MA) by bi-layer tubing consisting of polyethylene liner and a shell of
ethyl vinyl acetate (6.35 mm I.D., 7.93 mm O. D., Bev-A-Line®, Thermoplastic
Processes Inc., Stirling, NY). Fittings were polypropylene (United States Plastic
Corporation, Lima, OH).
Ambient [CO2] and H2O pressure were measured in air drawn continuously
by a vacuum pump (UN815, KNF Neuberger INC, Trenton, NJ) from the middle of the
vineyard at a height of 3.5 m and at a rate of 15 L min-1. All sampled air was under
positive pressure from the pumps to the IRGA. Concentrations of CO2 and H2O pressure
at the chambers’ outlets were measured by the IRGA. The measurement range was
from 0 to 2000 �mol mol-1 with a precision of 0.2 �mol mol-1 at 300 �mol mol-1 for CO2.
For H2O, its range was 0 to 75 mb with a precision of 0.02 mb at 10 mb. A gas
multiplexer (GHU 161, ADC Bioscientific Ltd., Hoddesdon, England) switched the
sample streams among the 6 chambers. All data were recorded by datalogger (Model
CR7, Campbell Scientific, Logan, UT). The IRGA was zeroed every 30 min and
calibration was checked after each field run using certified gas (359 and 305 ppm of
CO2, Air LiquidTM, Houston, TX) and a humidity calibrator (PP Systems, Haverhill, MA).
2.3.2. System operation and testing
The 6 chambers (Figure 2.3) operated simultaneously, powered by a gasoline
generator (5 kW; Onan Marquis 5000, Cummings, IN). A field trailer housed all
instrumentation (e.g., IRGA, gas multiplexer, air sampling pumps, and datalogger). Air
from one chamber at a time was directed to the IRGA by the gas multiplexer during a
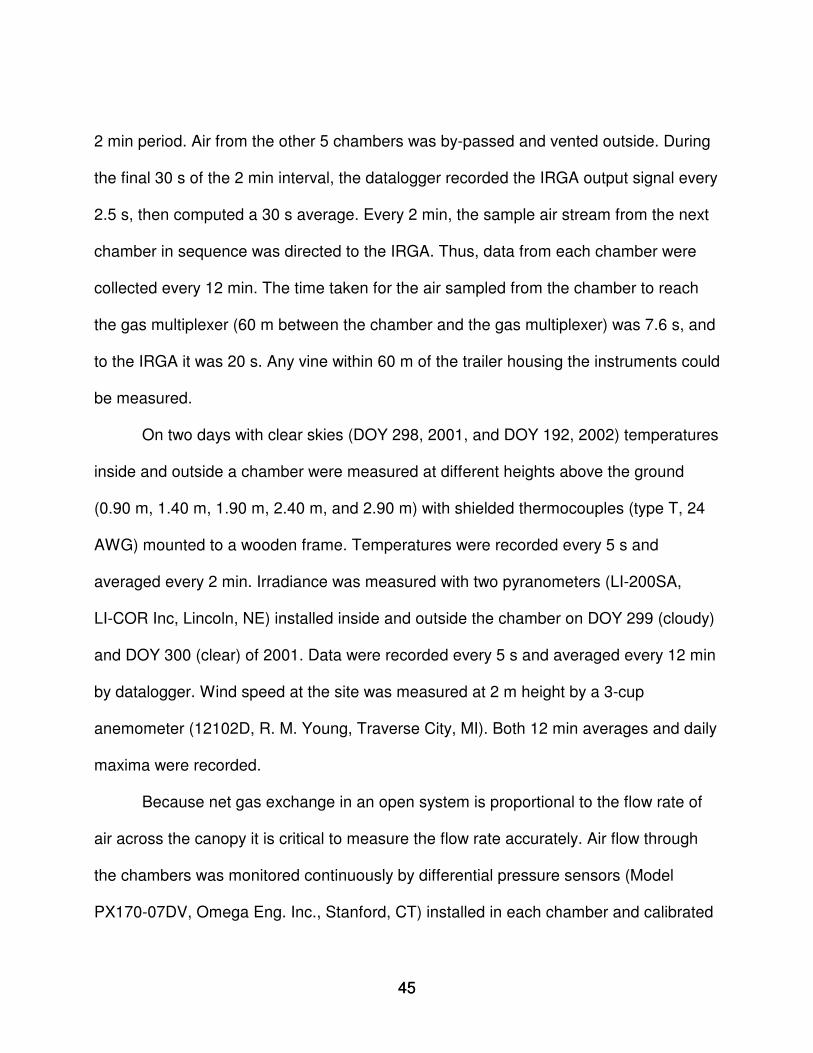
4545
2 min period. Air from the other 5 chambers was by-passed and vented outside. During
the final 30 s of the 2 min interval, the datalogger recorded the IRGA output signal every
2.5 s, then computed a 30 s average. Every 2 min, the sample air stream from the next
chamber in sequence was directed to the IRGA. Thus, data from each chamber were
collected every 12 min. The time taken for the air sampled from the chamber to reach
the gas multiplexer (60 m between the chamber and the gas multiplexer) was 7.6 s, and
to the IRGA it was 20 s. Any vine within 60 m of the trailer housing the instruments could
be measured.
On two days with clear skies (DOY 298, 2001, and DOY 192, 2002) temperatures
inside and outside a chamber were measured at different heights above the ground
(0.90 m, 1.40 m, 1.90 m, 2.40 m, and 2.90 m) with shielded thermocouples (type T, 24
AWG) mounted to a wooden frame. Temperatures were recorded every 5 s and
averaged every 2 min. Irradiance was measured with two pyranometers (LI-200SA,
LI-COR Inc, Lincoln, NE) installed inside and outside the chamber on DOY 299 (cloudy)
and DOY 300 (clear) of 2001. Data were recorded every 5 s and averaged every 12 min
by datalogger. Wind speed at the site was measured at 2 m height by a 3-cup
anemometer (12102D, R. M. Young, Traverse City, MI). Both 12 min averages and daily
maxima were recorded.
Because net gas exchange in an open system is proportional to the flow rate of
air across the canopy it is critical to measure the flow rate accurately. Air flow through
the chambers was monitored continuously by differential pressure sensors (Model
PX170-07DV, Omega Eng. Inc., Stanford, CT) installed in each chamber and calibrated

4646
against the flow as measured by a gas dilution technique (Garcia et al., 1990). Briefly, at
the inlet pipe of the chamber before the blower, 98% pure CO2 was injected with a highly
accurate flowmeter (±5%, FM-1050 Series, Matheson, Montgomeryville, PA) specifically
calibrated for CO2. Before and after the injection point, air was sampled at 15 L min-1.
Post-injection sampling was beyond the blower but ahead of the plenums. This
calibration procedure allowed us to calibrate the blower with the vine enclosed in the
chamber, which is important because the plant can change a calibration curve
performed on an empty chamber (Ham et al., 1993). The flow calibration was re-
checked in all chambers at the end of every 7-day measurement run. Blower speed
(rpm) was measured with a photo-tachometer and stroboscope (Model 4618258, Extech
Instruments, Tampa, FL). With the butterfly valve completely open, flow through the
chamber was about 16 m3 min-1 (maximum flow), resulting in two chamber volumes
being exchanged per minute. With the valve completely closed, flow was about
2.8 m3 min-1 (minimum flow). The flow was kept at maximum during the day and at
minimum during the night.
Net gas exchange rates were calculated from the differences in [CO2] and H2O
pressure between the air exiting and entering the chamber, adjusted for the rate of air
flow across the chamber. The decline in molar [CO2] by photosynthesis is very small
compared to that of H2O addition, so the reduction in [CO2] was not considered in
transpiration calculations (Field et al., 1989). To express net gas exchange rate on the
basis of canopy leaf area, total leaf area per vine was estimated by a 3 step process: (1)
leaf width was regressed against leaf area for a sample of 200 leaves (r2 = 0.96); (2) the

4747
widths of all leaves on a sample of shoots (n = 8) were measured, and individual leaf
areas computed from the relationship established in (1); and (3) leaf area per vine was
calculated from the average leaf area per shoot in the sample and the recorded number
of shoots per vine.
2.4. Results and Discussion
2.4.1. Chamber design and operation
Due to frequent, strong winds at the experimental site, a balloon type chamber
was impractical. The frame and the ropes that attached the chambers to the trellis made
them stable enough to resist sustained winds over 13 m s-1 and higher gusts. A framed
chamber also allowed us to maintain chamber shape and volume regardless of blower
output or wind variation, thereby minimizing temporal variation in the vine boundary layer
and reducing the incidence of air pockets, an advantage over balloon-style enclosures.
Visual examination of smoke infiltration into the chamber showed thorough mixing in
<40 s. The light weight frame allowed two people to move and secure the chamber from
vine to vine in less than 30 min.
Flow rates to the chamber were selected according to three criteria: (1) the
expected acceptable rise in air temperature in the chamber; (2) the acceptable reduction
in [CO2] between inlet and outlet; and (3) the available power for the blowers and
instruments.
Expected �Ta according to flow rate and chamber design can be approximated by
(Garcia et al., 1990):

4848
∆ T H f M c
AA c2 r Aa
a p
b
w a p
H b
= ×× ×�
��
�
�� +
× ×× ×
�
��
�
��
�
�
��
ρ
where H is heat absorbed (W m-2); �Ta is the temperature difference between inside and
outside of the chamber (oC); fa is air flow (mol s-1); M is the molecular weight of air
(29 g mol-1); cp is the specific heat of air (1.01 J g-1 oC-1); Ab is basal area of chamber
(m2); Aw is wall area of chamber (m2); �a is the density of air (1.183 x 10³ g m-3 at 25 oC
and 100 kPa); and rH is resistance to heat transfer for wall surfaces under forced
convection (s m-1). Heat absorbed (H) was calculated following Campbell and Norman
(1998). A rise in temperature of 3 oC (Figure 2.4) was estimated for two chamber
volumes per minute. A reduction in transpiration due to vine water stress would reduce
the fraction of H dissipated by transpiration, consequently increasing the temperature of
the chamber parts and the enclosed vine. For criterion (2), a depletion of
30 �mol mol-1 CO2 between inlet and outlet was avoided, the practical level used in
closed systems (Long and Hällgren, 1989). Criteria (1) and (2) are related as higher flow
through the chamber (i.e., more chamber volumes exchanged per minute) will reduce
the rise in temperature throughout the chamber, but at the same time also will reduce
[CO2] depletion. The depletion must be large enough to be detected by the IRGA, but
not so large that [CO2] is reduced significantly below ambient.
2.4.2. Chamber microclimate
On DOY 192, 2002 (Figure 2.5), maximum temperatures inside the chamber at
the highest and lowest positions were 47.2oC (2.9 m) and 42.5oC (0.9 m). Outside

4949
temperatures at the same positions were 42.5oC and 40oC, respectively. On DOY 298,
2001, also a day with clear skies (data not shown), maximum air temperatures (Ta)
inside the chamber were 19oC at the highest (2.9 m) thermocouple position and 15oC at
the lowest position (0.9 m above ground). Outside temperatures at the same heights
were 15oC and 13.8 oC, respectively. The maximum �Ta consistently occurred at the two
highest measurements positions (2.40 m and 2.90 m above ground) and were under
5oC, regardless of absolute ambient temperatures. At measurement heights
corresponding to the canopy (1.90 m and 1.40 m above ground) and at maximum flow
rates (2 chamber volumes min-1), air exchange was sufficient to keep Ta at canopy
height within 2.5 oC of that in an un-enclosed vine canopy during a warm day (40 oC)
with clear skies.
Higher Ta inside the chamber modifies gas exchange rates in at least two ways:
(1) a direct effect of temperature on photosynthesis and (2) an indirect effect of
temperature on vine physiology by its influence on leaf temperature and the vapor
pressure deficit between leaf and air (VPDla). Temperature effects on photosynthesis in
grapevines have been better established at the single leaf level (Downton et al., 1987;
Gamon and Pearcy, 1990a; Jacobs et al., 1996; Williams et al., 1994). At the whole-
canopy level, the influence of temperature is not as clear as in single leaves, particularly
in this case where the maximum �Ta at canopy height was 2.5-3.0oC. In whole canopies,
leaves are under different levels of irradiance, water status, and temperature, so the
exact chamber effect on whole-canopy photosynthesis is not easy to predict. In single
leaf measurements of Vitis californica, photosynthesis declined severely in high-light

5050
leaves only if Ta exceeded 45oC (Gamon and Pearcy, 1990b). At the same high Ta,
shaded leaves did not show the same degree of reduced photosynthesis.
Air temperature influences physiology indirectly via leaf temperature and stomatal
behavior by way of VPDla (El-Sharkawy et al., 1985; Farquhar and Sharkey, 1982;
Lawson et al., 2002; Schulze, 1986). Assuming the water vapor pressure of the air (ea)
entering the chamber is ambient, and considering a relative humidity (RH) on a summer
day of 0.25, with Ta of 40oC, the air VPD will be 5.53 kPa. An increase in Ta of 3oC due
to the “chamber effect” would increase VPDla to 6.87 kPa, 1.34 kPa higher than for a
non-enclosed vine, if the increase in Ta is accompanied by the same increase in leaf
temperature. Using the Penman-Monteith equation (Monteith and Unsworth, 1990) to
estimate canopy transpiration, an increase in �Ta of 3oC would result in an
approximately 2% increase in transpiration, which we considered a small environmental
modification caused by the chamber.
In Vitis species an increase in VPDla tends to decrease stomatal conductance (gs;
(Düring, 1987; Jacobs et al., 1996; Jarvis and Morison, 1981). In some single-leaf
photosynthesis measurements on Vitis species (Chaves et al., 1987; Downton et al.,
1987) both Ta and VPDla varied simultaneously. This, together with the occurrence of
stomata in patches on grapevine leaves, could make it difficult to interpret data and
scale up from single leaf to whole canopy (Schultz et al., 1996). Jacobs et al. (1996)
used a model that included net photosynthesis (An) and gs to explain that VPDla may
have a larger effect on gs than on An. With increasing VPDla, the difference between
ambient [CO2] and leaf internal [CO2] increases, and under these circumstances net CO2

5151
assimilation in grapes apparently is less affected than is transpiration (Chaves et al.,
1987; Williams et al., 1994). The chamber effect, via an increase in the vine's boundary
layer, results in leaves being less coupled to VPDla, particularly if the ventilation rate
through the chamber is less than that around an un-chambered vine (Jarvis and
McNaughton, 1986; Wullschleger et al., 1998).
2.4.3. Net gas exchange
During mid-season under clear skies at an air exchange rate of two chamber
volumes per minute (16 m3 min-1), the maximum differences in [CO2] and H2O between
air entering and exiting the chamber were around 12 �mol mol-1 and 2.5 mb,
respectively. Other values reported for open-system chambers are between 4.5 and 40
�mol mol-1 [CO2] (Poni et al., 1997, less than 40 �mol mol-1, Miller et al., 1996, between
15 and 35 �mol mol-1, Corelli-Grappadelli and Magnanini, 1993, 30 �mol mol-1, Wünsche
and Palmer, 1997, 4.5 �mol mol-1 [CO2] differential). In this experiment under standard
irrigation, 70% of the calculated vineyard evapotranspiration (ET) was replaced weekly
by drip irrigation. Stressed vines received irrigation equivalent to 35% of ET. Net CO2
exchange was higher for vines under standard irrigation (maximum rate about
12 �mol m-2 s-1) than under water stress (maximum rate about 6.5 �mol m-2 s-1).
Transpiration in both irrigation schemes responded to transient changes in solar
radiation (Figure 2.6). Transpiration was higher in vines under standard irrigation
(maximum about 3 mmol H2O m-2 s-1) than in stressed vines (about 1 mmol H2O m-2 s-1).
Photosynthetic response to PPFD also differed between standard irrigated vines and
stressed vines (Figure 2.7). Apparent light response curves were built combining the
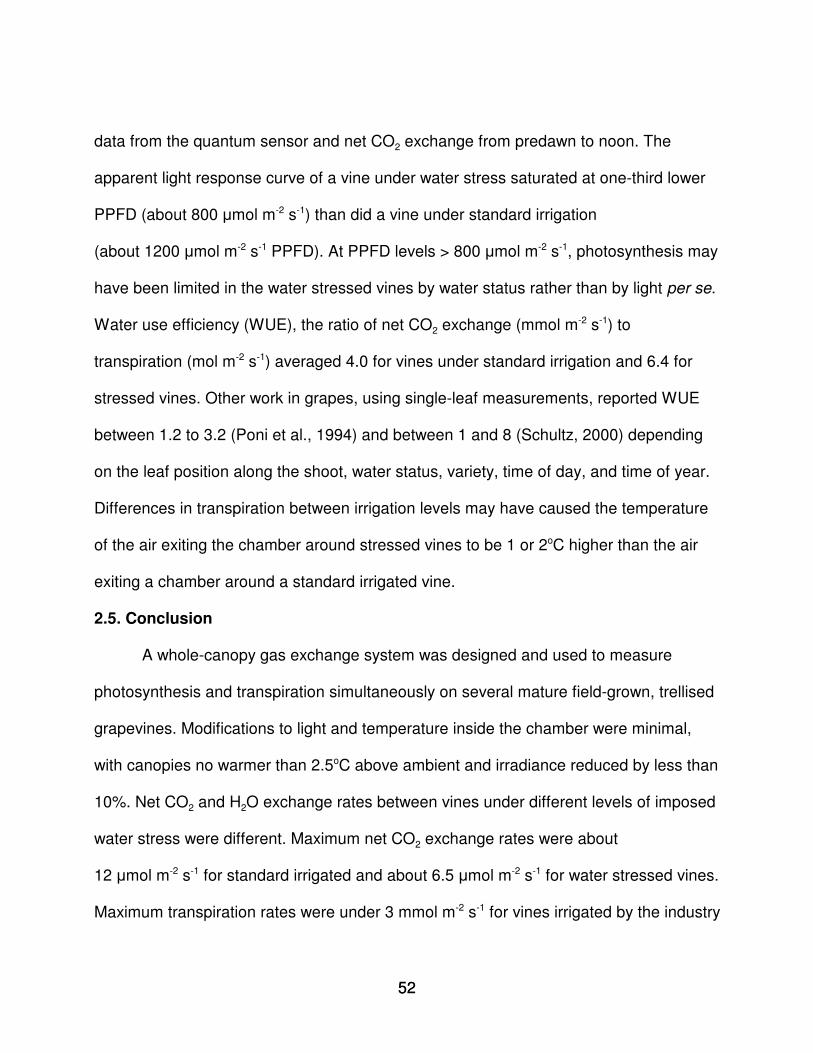
5252
data from the quantum sensor and net CO2 exchange from predawn to noon. The
apparent light response curve of a vine under water stress saturated at one-third lower
PPFD (about 800 �mol m-2 s-1) than did a vine under standard irrigation
(about 1200 �mol m-2 s-1 PPFD). At PPFD levels > 800 �mol m-2 s-1, photosynthesis may
have been limited in the water stressed vines by water status rather than by light per se.
Water use efficiency (WUE), the ratio of net CO2 exchange (mmol m-2 s-1) to
transpiration (mol m-2 s-1) averaged 4.0 for vines under standard irrigation and 6.4 for
stressed vines. Other work in grapes, using single-leaf measurements, reported WUE
between 1.2 to 3.2 (Poni et al., 1994) and between 1 and 8 (Schultz, 2000) depending
on the leaf position along the shoot, water status, variety, time of day, and time of year.
Differences in transpiration between irrigation levels may have caused the temperature
of the air exiting the chamber around stressed vines to be 1 or 2oC higher than the air
exiting a chamber around a standard irrigated vine.
2.5. Conclusion
A whole-canopy gas exchange system was designed and used to measure
photosynthesis and transpiration simultaneously on several mature field-grown, trellised
grapevines. Modifications to light and temperature inside the chamber were minimal,
with canopies no warmer than 2.5oC above ambient and irradiance reduced by less than
10%. Net CO2 and H2O exchange rates between vines under different levels of imposed
water stress were different. Maximum net CO2 exchange rates were about
12 �mol m-2 s-1 for standard irrigated and about 6.5 �mol m-2 s-1 for water stressed vines.
Maximum transpiration rates were under 3 mmol m-2 s-1 for vines irrigated by the industry

5353
standard method, and about 1 mmol m-2 s-1 for vines irrigated at 50% of the standard
amount. Differences in photosynthetic light responses were detected between irrigation
levels. Because the chambers were portable and lightweight, the whole system
(chambers and instrumentation) was quickly and easily assembled in the vineyard in
under 20 man-hours, allowing for measurements during short periods. Moving a
chamber from vine to vine along the same row required less than 1 man-hour. No
modification to the original canopy of the grapevine or the trellis system was required
(i.e., pruning, shoot removal, or cutting wires). The system can control at least 6
chambers depending on available power and labor. The cylindrical design of the
chamber promoted air circulation and rapid mixing of the air inside the chamber, without
formation of air pockets. High rates of air pumping (15 L min-1) made it possible to
choose any vine up to 60 m from the instrument trailer, thereby avoiding edge effects.
Because the aluminum frame improved chamber resistance to wind, the chambers could
be deployed during more days of the year, thus increasing the frequency of
measurements and allowing for sufficient replication. The system designed here proved
to be a suitable research tool for measuring whole-plant gas exchange and for
understanding the effects of different environmental conditions and viticultural practices
on whole vine physiology.

5454
2.6. References
Brown, M. S.; 1988: Design considerations for a system to measure net carbon dioxideexchange in intact plants. International Agrophysics 4, 69-81.
Bugbee, B.; 1992: Steady-state canopy gas exchange: system design and operation.HortScience 27, 770-776.
Buwalda, J. G.; 1991: A mathematical model of carbon acquisition and utilization bykiwifruit. Ecological Modelling 57, 43-64.
Buwalda, J. G.; Green, T. G. A.; Meekings, J. S. ; Coneybear, D. J.; 1992: Measurementof canopy gas exchange of kiwifruit vines using a suite of whole canopy cuvettes.Environmental and Experimental Botany 32, 439-448.
Campbell, G. S. and Norman, J. M.; 1998: Heat and mass transport, p. 77-85. In: Anintroduction to environmental biophysiscs, 2nd Ed. Springr-Verlag New York, Inc.
Chaves, M. M.; Harley, P. C.; Tenhunen, J. D.; Lange, O. L.; 1987: Gas exchangestudies in two Portuguese grapevine cultivars. Physiologia Plantarum 70, 639-647.
Corelli-Grappadelli, L. and Magnanini, E.; 1997: Whole tree gas exchanges: can we do itcheaper? Acta Horticulturae 451, 279-285.
Corelli-Grappadelli, L. and Magnanini, E.; 1993: A whole tree system for gas exchangestudies. HortScience 28, 41-45.
Daudet, F. A.; 1987: Un système simple pour la measure in situ des èchanges gazeuxde couverts végétaux de quelques mètres carrés de surface foliare. Agronomie 7,133-139.
De Pury, D. G. G. and Farquhar, G. D.; 1997: Simple scaling of photosynthesis fromleaves to canopies without the errors of big-leaf models. Plant, Cell andEnvironment 20, 537-557.
Downton, W. J. S.; Grant, W. J. R.; Loveys, B. R.; 1987: Diurnal changes in thephotosynthesis of field-grown grape vines. New Phytologist 105, 71-80.
Düring, H.; 1987: Stomatal response to alterations of soil and air humidity in grapevines.Vitis 26, 9-18.
Edson, C. E.; Howell, G. S.; Flore, J. A.; 1995: Influence of crop load on photosynthesisand dry matter partitioning of Seyval grapevines II. Seasonal changes in single

5555
leaf and whole vine photosynthesis. American Journal of Enology and Viticulture46, 469-477.
El-Sharkawy, M. A.; Cock, J. H.; del Pilar, A.; 1985: Stomatal response to air humidityand its relation to stomatal density in a wide range of warm climate species.Photosynthesis Research 7, 137-149.
Farquhar, G. D. and Sharkey, T.; 1982: Stomatal conductance and photosynthesis.Annual Review of Plant Physiology 33, 317-345.
Field, C. B.; Ball, J. T.; Berry, J. A.; 1989: Photosynthesis: principles and fieldtechniques, p. 209-253. In: Plant Physiological Ecology: Field methods andinstrumentation. R. W Pearcy, J. Ehleringer, H. A. Mooney, P. W. Rundel (Eds).Chapman and Hall Ltd., New York.
Francesconi, A. H. D.; Lakso, A. N.; Dennings, S. S.; 1997: Light and temperatureeffects on whole-canopy net carbon dioxide exchange rates of apple trees. ActaHorticulturae 451, 287-293.
Gamon, J. A. and Pearcy, R. W.; 1989: Leaf movement, stress avoidance andphotosynthesis in Vitis californica. Oecologia 79, 475-481.
Gamon, J. A. and Pearcy, R. W.; 1990a: Photonhibition in Vitis californica: interactiveeffects of sunlight, temperature and water status. Plant, Cell and Environment 13,267-275.
Gamon, J. A. and Pearcy, R. W.; 1990b: Photoinhibition in Vitis californica. The role oftemperature during high-light treatment. Plant Physiology 92, 487-494.
Garcia, R.; Norman, J. M.; McDermitt, D. K.; 1990: Measurements of canopy gasexchange using an open chamber system. Remote Sensing Reviews 5, 141-162.
Giaglaras, P.; Baille, M.; Baille, A.; 1995: Net photosynthesis response to light and airCO2 concentration of Begonia x hiemalis: whole plant measurement andmodelling. Scientiae Horticulturae 63, 83-100.
Ham, J. M.; Owensby, C. E.; Coyne, P. I.; 1993: Technique for measuring air flowcarbon dioxide flux in large, open-top chambers. Journal of Environmental Quality22, 759-766.
Hunt, S.; 2003: Measurements of photosynthesis and respiration in plants. PhysiologiaPlantarum 117, 314-325.
Hunter, J. J. and Visser, J. H.; 1989: The effect of partial defoliation, leaf position and

5656
developmental stage of the vine on leaf chlorophyll concentration in relation to thephotosynthetic activity and light intensity in the canopy of Vitis vinifera L. cv.Cabernet Sauvignon. South African Journal of Enology and Viticulture 10, 67-73.
Iacono, F. and Sommer, K. J.; 1996: Photoinhibition of photosynthesis in Vitis viniferaunder field conditions: Effects of light and leaf position. Australian Journal ofGrape and Wine Research 2, 10-20.
Intrieri, C.; Poni, S.; Rebucci, B.; Magnanini, E.; 1997: Effects of canopy manipulationson whole-vine photosynthesis: results from pot and field experiments. Vitis 36, 167-173.
Intrieri, C.; Poni, S.; Silvestroni, O.; Fillippetti, I.; 1992: Leaf age, leaf position andphotosynthesis in potted grapevines. Advances in Horticutural Science 6, 23-27.
Jacobs, C. M. J.; van den Hurk, B. J. J. M.; de Bruin, H. A. R.; 1996: Stomatal behaviourand photosynthetic rate of unstressed grapevines in semi-arid conditions.Agricultural and Forest Meteorology 80, 111-134.
Jarvis, P. G. and McNaughton, K. G.; 1986: Stomatal control of transpiration: Scaling upfrom leaf to region. Advances in Ecological Research 15, 1-49.
Jarvis, P. G. and Morison, J. I. L.; 1981: The control of transpiration and photosynthesisby the stomata, p. 247-279. In: Stomatal Physiology. P. G. Jarvis and T. A.(Eds.). Mansfield. Cambridge University Press.
Katerji, N.; Daudet, F. A.; Carbonneau, A.; Ollat, N.; 1994: Etude à l'echelle de la planteentière du fonctionnement hydrique et photosynthètique de la vigne: comparaisondes systèmes de conduite traditionnel et en Lyre. Vitis 33, 197-203.
Knight, S. L.; 1992: Constructing specialized plant growth chambers for gas exchangeresearch: considerations and concerns. HortScience 27, 767-769.
Kriedemann, P. E.; Kliewer, W. M.; Harris, J. M.; 1970: Leaf age and photosynthesis inVitis vinifera L. Vitis 9, 97-104.
Lawson, T.; Oxborough, K.; Morison, J. I. L.; Baker, N. R.; 2002: Responses ofphotosynthetic electron transport in stomatal guard cells and mesophyll cells inintact leaves to light, CO2, and humidity. Plant Physiology 128, 52-62.
Long, S. P.; Farage, P. K.; Garcia, R. L.; 1996: Measurement of leaf and canopyphotosynthetic CO2 exchange in the field. Journal of Experimental Botany 47,1629-1642.

5757
Long, S. P. and Hällgren, J.-E.; 1989: Measurement of CO2 assimilation by plants in thefield and the laboratory, p. 62-94. In: Techniques in Bioproductivity andPhotosynthesis. J. Coombs and D.O. Hall (Eds.). Chapman & Hall, Great Britain.
Mandl, R. H.; Weinstein, L. H.; McCune, D. C.; Keveny, M.; 1973: A cylindrical, open-topchamber for the exposure of plants to air pollutants in the field. Journal ofEnvironmental Quality 2, 371-376.
Miller, D. P.; Howell, G. S.; Flore, J. A.; 1996: A whole plant open gas exchange systemfor measuring net photosynthesis of potted woody plants. HortScience 31, 944-946.
Monteith, J. L.; M.H. Unsworth, M. H.; 1990: Principles of environmental physics, seconded., Edward Arnold Pub, London, U. K.
Naor, A.; Gal, Y.; Bravdo, B.; 1997: Crop load affects assimilation rate, stomatalconductance, stem water potential and water relations of field grown Sauvignonblanc grapevines. Journal of Experimental Botany 48, 1675-1680.
Petrie, P. R.; Trought, M. C. T.; Howell, G. S.; 2000: Influence of leaf aging, leaf areaand crop load on photosynthesis, stomatal conductance and senescence ofgrapevine (Vitis vinifera L. cv. Pinot noir). Vitis 39, 31-36.
Poni, S.; Intrieri, C.; Silvestroni, O.; 1994: Interactions of leaf age, fruiting, andexogenous cytokinins in Sangiovese grapevines under non-irrigated conditions. I.Gas exchange. American Journal of Enology and Viticulture 45, 71-78.
Poni, S.; Magnanini, E.; Rebucci, B.; 1997: An automated chamber system formeasurements of whole vine gas exchange. HortScience 32, 64-67.
Schultz, H. R.; 1993: Photosynthesis of sun and shade leaves of field grown grapevines(Vitis vinifera L) in relation to leaf age. Suitability for the plastochron concept forthe expression of physiological age. Vitis 32, 197-205.
Schultz, H. R.; 2000: Physiological mechanisms of water use efficiency in grapevinesunder drought conditions. Acta Horticulturae 526, 115-136.
Schultz, H. R.; Kieffer, W.; Gruppe, W.; 1996: Photosynthesis duration, carboxylationand stomatal limitation of sun and shade leaves of different ages in field-growngrapevine (Vitis vinifera L.). Vitis 35, 169-176.
Schulze, E. D.; 1986: Carbon dioxide and water vapor exchange in response to droughtin the atmosphere and in the soil. Annual Review of Plant Physiology 37, 247-274.

5858
Silvestroni, O.; Poni, S.; Intrieri, C.; Fontana, M.; 1993: Effects of light regimes onchlorophyll concentration and gas-exchange in Vitis vinifera L. In: Proceedings ofthe 3rd Interantional Symposium on Viticulture and Enology in Cool Climates.Geisenheim/Mainz 8-12 June 1992. Die Wein-Wissenschaft. Viticultural andEnological Science, 3/6, 1993: 96-100.
Steduto, P.; Çetinkökü, Ö.; Albrizio, R.; Kanber, R.; 2002: Automated closed-systemcanopy-chamber for continuous field-crop monitoring of CO2 and H2O fluxes.Agricultural and Forest Meteorology 111, 171-186.
Succi, F. and Magnanini, E.; 1994: Daily measurement of CO2 assimilation rate onkiwifruit vine. New Zealand Journal of Crop and Horticultural Science 22, 17-21.
Weinstock, L.; Kender, W. J.; Musselman, R. C.; 1982: Microclimate within open-top airpollution chambers and its relation to grapevine physiology. Journal of theAmerican Society for Horticultural Science 107, 923-929.
Wheeler, R. M.; 1992: Gas-exchange measurements using a large, closed plant growthchamber. HortScience 27, 777-780.
Williams, L. E.; Dokoozlian, N. K.; Wample, R.; 1994: Grape, p. 85-133. In: Handbook ofenvironmental physiology of fruit crops. B. Shaffer and P. C. Anderson (Eds.).CRC Press, Orlando, Florida.
Wullschleger, S. D.; F. C. Meinzer; R. A. Vertessy; 1998: A review of whole-plant wateruse studies in trees. Tree Physiology 18, 499-512.
Wünsche, J. N. and Palmer, J. W.; 1997: Portable through-flow cuvette system formeasuring whole canopy gas exchange of apples trees in the field. HortScience32, 653-658.
Zufferey, V.; Murisier, F.; Schultz, H. R.; 2000: A model analysis of the photosyntheticresponse of Vitis vinifera L. cvs Riesling and Chasselas leaves in the field: I.Interaction of age, light and temperature. Vitis 39, 19-26.

2.10 m
3.50
m
PropafilmTM
Aluminum framePlenum
blower
inlet pipe
1.05
m2.
00 m
0.45
m
0.20 m
3.50
m
2.10 m
3.50
m
PropafilmTM
Aluminum framePlenum
blower
inlet pipe
1.05
m2.
00 m
0.45
m
0.20 m
3.50
m
59
Figure 2.1: Schematic diagram of whole-canopy gas exchange chamber used on trellised, field-grown grapevines. Arrowsdenote air flow.
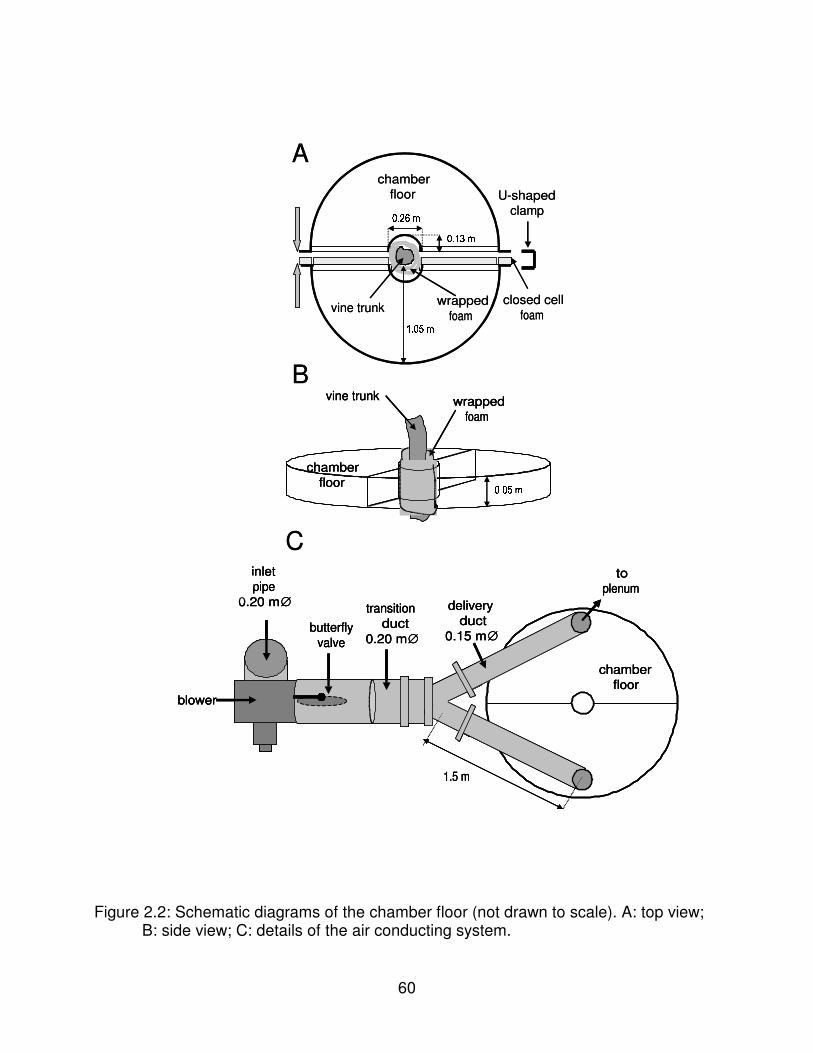
60
chamberfloor
vine trunk wrapped foam
A
vine trunk wrapped foam
chamberfloor
B
��� �������� ���
��� �����
��� �����
U-shaped clamp
closed cell foam
blower
butterflyvalve
chamber floor
delivery duct
0.15 m ∅
inlet pipe
0.20 m ∅ transitionduct
0.20 m ∅
to plenum
1.5 m
C
chamberfloor
vine trunk wrapped foam
A
vine trunk wrapped foam
chamberfloor
vine trunk wrapped foam
chamberfloor
B
��� �������� ���
��� �����
��� �����
U-shaped clamp
closed cell foam
blower
butterflyvalve
chamber floor
delivery duct
0.15 m ∅
inlet pipe
0.20 m ∅ transitionduct
0.20 m ∅
to plenum
1.5 m
blower
butterflyvalve
chamber floor
delivery duct
0.15 m ∅
inlet pipe
0.20 m ∅ transitionduct
0.20 m ∅
to plenum
1.5 m
C
Figure 2.2: Schematic diagrams of the chamber floor (not drawn to scale). A: top view;B: side view; C: details of the air conducting system.

61
to analysis cell of IRGA
vacuum pumps (15 LPM)
ventout
1 2 3 4 5 6
Gas Multiplexer
analysis cell
reference celldatalogger
computer
chamber 1 chamber 2 chamber 3 chamber 4 chamber 5 chamber 6
ambient air
vacuum pump (15 LPM)
IRGA
to analysis cell of IRGA
vacuum pumps (15 LPM)
ventout
1 2 3 4 5 61 2 3 4 5 6
Gas Multiplexer
analysis cellanalysis cell
reference cellreference celldatalogger
computer
chamber 1 chamber 2 chamber 3 chamber 4 chamber 5 chamber 6
ambient air
vacuum pump (15 LPM)
IRGA
Figure 2.3: Schematic diagram of whole-canopy gas exchange system for several, field-grown vines.

62
chamber volume exchanges min-1
0.5 1.0 1.5 2.0 2.5 3.0
tem
pera
ture
diff
eren
ce (i
nsid
e - o
utsi
de) o
C
0
2
4
6
8
10
12
14
Figure 2.4: Estimation of the temperature difference between outside and inside thechambers based on the flow rate through the chamber. Arrow indicates the typicaldaytime ventilation rate. Calculations for DOY 157, under clear skies and 35oCambient air temperature. Transpiration was assumed to dissipate half of the heatabsorbed.

63
20
25
30
35
40
45
50
time of day (h)
0 2 4 6 8 10 12 14 16 18 20 22 0
20
25
30
35
40
45
50
outside Tainside Ta
20
25
30
35
40
45
50
20
25
30
35
40
45
50
tem
pera
ture
(oC
)
20
25
30
35
40
45
50
A
C
D
E
B
2.90 m
2.40 m
1.90 m
1.40 m
0.90 m
Figure 2.5: Diurnal pattern of air temperature inside and outside the chamber at 5different heights above ground. Data were collected on DOY 192, 2002. Flowthrough the chamber was 16 m3 min-1 (about two chamber volumes per minute).

64
�
� ��
�
�
�
�
�
���
���
���standardstressed
Irrad
ianc
e (W
m-2
)
�
�����
�����
�����
�����
�������
� � � � ��� ��� ��� ��� �
����
�
�
�
�
B
C
A
Figure 2.6: Diurnal curve of global irradiance (A), net CO2 exchange rate (B), andtranspiration (C) for an exemplary vine under standard irrigation and for a vineunder imposed water stress. DOY 218, 2002.
65
PPFD (����mol m-2 s-1)
0 200 400 600 800 1000 1200 1400 1600 1800 2000
Net
CO
2 exc
hang
e ( �� ��
mol
m-2
s-1)
-2
0
2
4
6
8
10
12
14 standardstressed
Figure 2.7: Apparent light response of photosynthesis for an exemplary vine understandard irrigation and for a vine under imposed water stress. DOY 218, 2002.

66
Figure 2.8: View of one gas exchange chamber installed in the vineyard.

67
CHAPTER 3
GRAPEVINE PHOTOSYNTHESIS AND NON-STRUCTURAL CARBOHYDRATES
UNDER REGULATED DEFICIT IRRIGATION
3.1. Abstract
In order to improve grape fruit composition to satisfy winemakers and wine
industry demands, and to save water, Washington wine growers have adopted regulated
deficit irrigation (RDI) as a standard management practice in their vineyards. Reduction
in irrigation affects key physiological processes like photosynthesis, and although water
deficit effects on photosynthesis have been widely studied at the single-leaf level, to
better understand these effects on vineyard productivity and fruit quality, whole-canopy
research was conducted during growing seasons of 2002 and 2003. A six-chamber,
mobile field laboratory was used to measure whole-canopy photosynthesis from
field-grown, own-rooted, drip irrigated Vitis vinifera L. cv. Cabernet Sauvignon that were
under three regimes of RDI: 1) standard RDI (70% of full vine evapotranspiration, FVET,
was replaced weekly); 2) early deficit (35% of vine FVET was replaced weekly between
fruit set and veraison); and 3) veraison deficit (35% of vine FVET was replaced weekly
between veraison and harvest). When not under 35% deficit, vines in scenarios #2 and
#3 were irrigated according to standard RDI practice. Whole-canopy measurements
were conducted during 24 h at fruit set, pre- and post-veraison, and pre- and
post-harvest. At the same time and on adjacent vines, single-leaf measurements of
photosynthesis and leaf tissue for non-structural carbohydrate analysis were collected.

68
Large reductions were observed in net CO2 fixation in vines under additional water
deficit with respect to those under standard RDI. In the pre-veraison period, 'early deficit'
vines fixed during 24 h up to �45% less CO2 than did vines under standard RDI, while
during the post-veraison period, vines under additional water defict fixed up to �33%
less CO2. A similar reduction was observed in sunlit, single leaves measured
independently of the whole-canopy chambers, but poor correlation was obtained
between the two types of measurements. Small differences were detected in daily
whole-canopy net CO2 fixation before and after harvest, when daytime temperatures
were lower and day length was shorter. Leaf starch concentration in vines under
additional water deficit was up to 32% lower in 2002 at pre-veraison during the morning
compared to those under standard RDI, while in 2003 leaf starch concentration during
the afternoon was up to 32% lower at pre-veraison and up to 20% lower at post-verasion
in vines under additional water deficit compared to those under standard RDI. Average
water savings were achieved of 40% in the early deficit regimen and of 23% in the late
deficit regimen with respect to standard RDI.
3.2. Introduction
Vineyards in eastern Washington experience hot, dry summers and a ripening
period characterized by warm days and cool nights. However, the growing season is
short and extreme winter temperatures periodically cause significant cold injury to
dormant buds and permanent vine tissues. Thus eastern Washington viticulture
historically was classified as “cool climate,” but more recently the viticulture industry has
recognized that Washington’s unique climatic challenges make it less meaningful to

69
adopt a strict warm- or cool-climate classification. In practical terms, the climate of
eastern Washington demands that vineyard managers create a blend of “cool” and
“warm” climate practices that is appropriate for their sites.
Although developed specifically for California, Winkler’s classification (Winkler et
al., 1974) based on heat summation and expressed as degree-days (D.D., base
temperature 10oC), locates Prosser, in the Yakima Valley, in Region II (1360 D.D.). The
growing season is short (158 frost free days) and hot. August is the warmest month, with
a mean temperature of 22.6oC, mean maximum temperature of 31.7oC, and daily
maximum temperatures often reaching 43oC. January is the coldest month, with a mean
temperature of 2.3oC, mean minimum temperature of -0.7oC, and some daily minimum
temperatures falling below -21oC. Daily differences between mean maximum and mean
minimum temperatures during the months of berry growth (July, August, September) are
on average about 18oC. Average cumulative “Class A” unscreened pan evaporation is
1266 mm for April to October (Naor and Wample, 1994), while maximum daily reference
evapotranspiration is 9 mm day-1 (Evans et al., 1993). Annual rainfall averages
�200 mm, occurring mainly during winter months. There are 15.8 h of daylight on June
21 (DOY 172; U.S. Naval Observatory, www.usno.nav.mil) and total global irradiance
averages 29 MJ m-2 on the same day (1998-2003 mean; Public Agriculture Weather
System).
The combination of a short growing season, low rainfall, hot summers, and cold
winters challenges grape growers in several ways. Due to the large deficit between
evapotranspiration and rain, winegrapes can only be cultivated commercially by applying

70
irrigation. Furrow, sprinkler, and drip irrigation methods have been used, although the
trend is towards drip irrigation. This last method gives grape growers much flexibility in
irrigation scheduling. One of the challenges of the Washington wine industry is to
determine the timing and amount of irrigation applied to balance canopy productivity with
crop load, achieve the fruit characteristics desired by winemakers, and reach the end of
the season with a plant prepared for the cold winter (i.e., avoiding any delay in the
lignification of canes and replenishment of reserves in the permanent structures of the
vine). This challenge has been approached partly by regulated deficit irrigation (RDI), a
practice of managing soil water supply to impose predetermined periods of plant or soil
water deficit to elicit some desirable responses in plants (Behboudian and Singh, 2001).
The effects of water deficits on grapevines have received considerable attention
in the last few years, both in what are called “old” wine countries (e.g., de Souza et al.,
2003; Escalona et al., 2003; Flexas et al., 2002; Flexas et al., 1999; Iacono et al., 1998;
Maroco et al., 2002; Medrano et al., 2003; Palliotti and Cartechini, 2000; Rodrigues et
al., 1993) and “new” wine countries (Dry et al., 2000; Liu et al., 1978; Murillo de
Alburquerque and Carbonneau, 1997; Naor and Wample, 1994). One of the reasons for
this interest is the tremendous influence of water deficits on all plant processes (e.g.,
photosynthesis), and particularly on berry yield and quality.
Much of the vegetative growth in grapevines occurs between budbreak and
anthesis. During this period in irrigated viticulture, if winter rains have filled the soil
profile, vines may be allowed to draw from this reservoir with no supplemental irrigation.
In places where there is too little winter rain, irrigation is applied at the beginning of the

71
growing season in such a way that controlled water deficits are imposed to limit shoot
growth and achieve a canopy area that will ripen the crop. During the berry growth
period (i.e., fruit set to harvest) different effects on berry composition have been
observed whether water deficits were imposed between fruit set and veraison, or
between veraison and harvest (Matthews and Anderson, 1988). Water deficits applied
between fruit set and veraison have caused an irreversible reduction in final berry size
(Matthews and Anderson, 1989; McCarthy, 1997), due mainly to a reduction in mean cell
size (Ojeda et al., 2001), which has been shown to increase the skin:pulp ratio, changing
must composition. Clusters are weak sinks until about fruit set (Hale and Weaver, 1962),
with the fruit cluster becoming a much stronger sink after veraison (Candolfi-
Vasconcelos et al., 1994). Water deficits applied between veraison and harvest have
had less effect on berry size, but still some effect on berry composition, with the effects
being explained primarily by the reduction in berry size, and secondarily by modifying
flavonoid biosynthesis (Kennedy et al., 2002; Ojeda et al., 2002). If an imposed water
deficit during the growth period of the berry reduces photosynthetic rates on a per vine
basis, not only will fewer carbohydrates be available for the different vine sinks (e.g.,
berries), but also a different partitioning pattern of those carbohydrates could occur (e.g.,
proportionally more carbohydrates could be directed to the roots; Palliotti and Cartechini,
2000). The effects of a reduction in photosynthesis on berry size and composition
depend on the magnitude of that photosynthetic reduction, the ratio between the
sources (leaves) and sinks (fruit), and competition among sinks. Because of the different
effects observed between water deficits imposed before and after veraison, and the

72
importance of the source:sink ratio in this response, it is necessary to study and
measure photosynthesis of whole canopies of field-grown vines to better understand the
physiological effects of RDI in vineyards.
Most research in grapevines on the effects of water deficit on photosynthesis has
relied on measurements recorded from single leaves or small areas (2 to 3 cm2) on a
single leaf, a decision determined mainly by the type of instrument used (de Souza et
al., 2003; Escalona et al., 2003). The lack of good correlation between single-leaf and
whole-vine measurements (Edson et al., 1993; Miller et al., 1997; Poni et al., 1997)
suggests that it is inadequate to infer whole-plant responses from measurements of
photosynthesis on single leaves. Other studies of grapevines have measured
whole-canopy photosynthesis, but mainly in relation to training systems and canopy
manipulations (Intrieri et al., 1997; Intrieri et al., 1998; Katerji et al., 1994; Petrie et al.,
2003). The only study of water deficit and photosynthesis on whole canopies in field-
grown vines compared extreme conditions: irrigated vs. non-irrigated (Ollat and
Tandonnet, 1999), which is a logical approach in a non-irrigated viticultural region. In
irrigated viticulture as in eastern Washington, a non-irrigated option usually is not
feasible. With this in mind, a system to measure photosynthesis of whole canopies in the
vineyard (chapter 2, this volume) was used in a deficit-irrigation experiment in which RDI
was applied at different times and intensities, between fruit set and harvest. In eastern
Washington, RDI is a standard practice for growers of premium and ultrapremium
winegrapes. It is applied with the primary goal of improving wine quality.
The objective of this experiment was to determine the effect of water deficits

73
imposed by RDI at different periods during berry growth, on whole-canopy
photosynthesis of field-grown grapevines. To evaluate the suitability of estimating
whole-canopy photosynthesis based on single-leaf measurements, single-leaf
photosynthesis was also measured and compared with whole-canopy results. To
evaluate whether different intensities of RDI affected the primary products of
photosynthesis, leaf non-structural carbohydrates were measured during the berry
growth period and after harvest. A secondary benefit of the study will be to better
understand the consequences of RDI management on aspects of whole vine physiology
related to carbon balance and to support more informed irrigation decisions by vineyard
managers.
3.3. Materials and methods
3.3.1. Site and treatments
The study was conducted within an experiment that had been initiated in 1999 in
a 4-ha block at the Canoe Ridge vineyard of Ste. Michelle Wine Estates (45.88° N,
119.75° W, 125 m above mean sea level, west of Paterson, WA). Vines, Vitis vinifera L.
cv. Cabernet Sauvignon, drip-irrigated and own-rooted, were double-trunked, trained to
a bilateral cordon at 1.06 m on the bottom wire of a two-wire sprawl trellising system,
and spur pruned with 20 to 23 buds per m of row. The vineyard was planted in 1992 on
a uniformly deep (�1 m) Burbank loamy fine sand (sandy-skeletal, mixed mesic Xeric
Torriorthents) at 1.8 m x 2.7 m (vine x row spacing) in a north-south row orientation with
a 14% slope facing south. Soil field capacity was 14.6% by volume and permanent
wilting point was estimated as 7.1% by volume. Soil water content was monitored up to

74
1.0 m depth weekly by neutron probe. The irrigation system had one drip line per row
with three, 1.8-L h-1 pressure compensated emitters for every two vines.
The vineyard was irrigated early in the growing season (ca. April) if winter rains
were insufficient to adequately fill the soil profile to field capacity. Full vine
evapotranspiration (FVET) was calculated from reference evapotranspiration (ETo) using
data collected by the PAWS (Public Agriculture Weather System) weather station at
Alderdale, WA (10 km west of the site), and a crop coefficient for Cabernet Sauvignon
determined in eastern Washington (Evans et al., 1993; see appendix; Figure A3.1).
Water consumption for vines under RDI was estimated as 70% of FVET in 2002 and
60% of FVET in 2003. Between budbreak and fruit set, irrigation was withheld until
shoots were 0.9 to 1.2 m long and the rate of shoot growth was minimal. The target
shoot length was chosen with an expectation that each shoot would ripen an average of
1.5 clusters of approximately 60 to 80 g each, given the suggestion that 7 to 12 cm2 of
leaf area are necessary to ripen 1 g of fruit (Alexander, 1965; Kliewer and Dokoozlian,
2000; Kliewer and Weaver, 1971; May et al., 1969). At fruit set, three irrigation regimens
were imposed: standard RDI (S), early deficit (E) and late deficit (V). From fruit set to
veraison, irrigation was applied within S and V to replenish 70% of FVET weekly (2002;
60% in 2003) with the goal of maintaining soil moisture in the top 1 m at 10% by volume.
In the same period, irrigation in E replenished 35% of FVET weekly (2002; 30% in 2003)
with the goal of maintaining soil moisture at 8.3%. From veraison to harvest, irrigation
was applied in S and E plots to replenish weekly 70% (2002) and 60% (2003) of FVET
with the goal of maintaining soil moisture at 10%, while V plots replenished 35% (2002)

75
Irrigation required = c x FVET +( - )
100 x sddeficit
target actualθ θ(3.1)
Irrigation applied = f x t
d x dir
e r(3.2)
and 30% (2003) of FVET weekly with the goal of maintaining soil moisture at 8.3%. After
harvest, all vines were irrigated to replenish 100% of FVET. The managed soil depth
was 1 m. Irrigation application was calculated from:
where irrigation required is the amount of water to be applied per week (mm), cdeficit is the
deficit coefficient corresponding to the irrigation level, �target and �actual (%) are the desired
and measured volumetric soil water contents, respectively, for a given irrigation level,
and sd (mm) is the soil depth to be managed. The weekly irrigation was applied in three
or four sets.
In 2002, the research department of Ste. Michelle Wine Estates provided data on
total water applied by week for each irrigation level. During 2003, sensors installed in the
drip irrigation lines detected pressure inside the drip line, corresponding to the irrigation
lines being operated. The applied water (mm) was calculated:
where f is emitter flow rate (L h-1), tir is the duration of irrigation (h), de is the distance
between emitters (m), and dr is the distance between rows (m).
76
3.3.2. Physiological Measurements
3.3.2.1. Whole-canopy net CO2 exchange rate (NCEWV)
During 2002 and 2003, whole-canopy net CO2 exchange rates (NCEWV;
�mol vine-1 s-1) were measured during five periods corresponding to different
phenological stages (Figure 3.1): 1) fruit set, before treatment initiation (DOY 183 to
192, 2002, and DOY 177 to 184, 2003); 2) pre-veraison (DOY 217 to 224, 2002, and
DOY 212 to 219, 2003); 3) post-veraison (DOY 234 to 240, 2002, and DOY 233 to 241,
2003); 4) pre-harvest (DOY 255 to 261, 2002, and DOY 254 to 262, 2003); and
5) post-harvest (DOY 278 to 284, 2002, and DOY 274 to 281, 2003). Cumulative net
CO2 exchange (24 h) was expressed both per vine (NCEWV,d; g CO2 vine-1 d-1) and per
unit leaf area (NCEWL,d; g CO2 m-2 d-1). Based on vine spacing, row spacing, and the
anticipated canopy size, chambers of an approximate volume of 8 m3 were used to fully
enclose one vine each (Perez Peña and Tarara, 2004; chapter 2, this volume). Briefly,
each chamber enclosed a vine without any modification of the canopy size, shape, or
the trellis system. Six chambers operated simultaneously. At each sampling day,
chambers were installed by 0800 h on 6 vines (two in each irrigation level), and were
operated for 48 h. Only data recorded continuously during 24-h periods were used
(0000 h to 2400 h). The six chambers were then moved to another six vines, run for 48 h
and the process repeated. Total measurement duration was 7 to 9 days for 18 sample
vines.
The experiment was arranged as a completely randomized design with a
three-way treatment structure: irrigation (3 levels), year (2 levels), and day of

77
measurement (DOM; 3 levels). Repeated measurements were made five times during
the season with two-vine replicates, with the vine as the experimental unit. The first
analysis included data averaged across all measurement days: those with clear skies
(DCS) and those with clouds (DWC). When only DCS data were used, analysis was for
a completely randomized design with two-way treatment structure (irrigation and year).
3.3.2.2. Leaf area estimation
To calculate NCEWL (whole-canopy net CO2 exchange rate on a leaf area basis;
�mol m-2 s-1), total leaf area per vine on each of the 18 sample vines was estimated
twice during 2002 (veraison and pre-harvest) and four times during 2003 (fruit set,
veraison, pre-harvest and post-harvest). In 2002, total leaf area was estimated by a 3-
step process: 1) leaf width was regressed against leaf area for a sample of 200 leaves
from vines near the 18 sample vines; 2) the widths of all leaves on a sample of shoots
(n=8) were measured, and individual leaf areas computed from the relationship
established in #1; and 3) leaf area per vine was calculated from the average leaf area
per shoot in the sample and the number of shoots per vine. In 2003, about fifty shoots
were sampled from adjacent vines and their leaf area measured destructively (LI-3100,
LI-COR, Lincoln, NE). A regression model between shoot length and shoot leaf area
was fitted to the 50-shoot sample. On the 18 experimental vines, shoots were counted
and the lengths of 50% of the shoots were measured. Vine leaf area was estimated
using the length:area regression, the number of shoots per vine, and the length of the
shoots. In 2002, the total canopy leaf area estimated at pre-harvest was used for
calculating NCEWL,d and NCEWL during the post-harvest measurements. In 2003, the total

78
canopy leaf area estimated at veraison was used for calculating NCEWL,d and NCEWL
during the pre- and post-veraison measurements.
3.3.2.3. Single leaf net CO2 exchange (NCESL)
During 2002 and 2003, net CO2 exchange was measured on single leaves.
Between bloom and fruit set 27 uniform vines near the 18 sample vines used for the
whole-canopy measurements were randomly selected (9 vines per irrigation regimen).
On each of these vines, 4 shoots �1 m long (2 on the north cordon and 2 on the south
cordon of the vines) bearing one cluster were labeled. On each shoot, a fully expanded
leaf (located about 6 to 8 leaves from the shoot tip) was selected, labeled, and used for
NCESL measurements during the entire season. Single-leaf net CO2 exchange was
measured in 2002 at three of the phenological stages at which NCEWV was measured:
pre-veraison, post-veraison, and pre-harvest, and all five stages in 2003. Measurements
were recorded four times during the day in 2002 and six times in 2003, from early
morning until afternoon. A portable photosynthesis system (CIRAS-2, PP Systems,
Haverhill, MA) was used. The leaf cuvette (PLC6(U) - PP Systems, Haverhill, MA)
enclosed 2.5 cm2 of leaf area. Air flow through the cuvette was 200 mL min-1, and
reference [CO2] was set at 365 ppm. Zeroing and matching between reference and
analysis cells of the instrument occurred every 30 min. Calibration was checked
between phenological stages with certified gas (359 and 305 �mol mol-1 CO2 with N2 as
balance gas, Air Liquid, Houston, TX) and a humidity calibrator (PP Systems, Haverhill,
MA).
3.3.3. Leaf non-structural carbohydrates

79
At the same time that NCESL measurements were taken, a total of eight leaf discs
(6.3-mm diam.) were collected from the two leaves above and the two leaves below the
leaf used for NCESL measurements on the same shoot. Leaf discs were collected
between veins with a modified commercial hole puncher, to which a 1.5 mL microtube
was attached. When the leaf discs were cut by the puncher, they dropped into the
microtube, which was immediately snap frozen in liquid nitrogen. The samples were then
stored at -80oC until analysis.
3.3.3.1. Soluble sugars (ss) and starch extraction
Leaf discs were counted and weighed. An extraction method (Hendrix, 1993) was
modified by adding a grinding step of the leaf discs. Two 2.5 mm diameter beads
(zirconia/silica, Biospec Products, Bartlesville, OK) were added to the microtube and
snap frozen in liquid nitrogen to facilitate grinding using a bead-beater type homogenizer
(Mini-BeadBeater-8, Biospec Products, Bartlesville, OK) for 45 s. After homogenization,
an aliquot of 1.25 mL of 80% v/v aqueous ethanol was pipetted into the microtubes and
incubated for 15 min at 80oC in a water bath. After incubation, the ethanol was decanted
into a 15 mL centrifuge tube and replaced with another 1.25 mL of 80% v/v ethanol. This
step was repeated one more time, resulting in a total of three extractions, based on
preliminary experiments conducted with one, two, three, and four extractions (see
appendix; Figure A3.2). Three extractions yielded about 95% of the ss in the leaf tissue.
The insoluble fraction remaining in the microtube was frozen at -80oC for later starch
extraction and analysis. For starch extraction, 1 mL of 0.1 M KOH was added to the
insoluble fraction. Microtubes were placed in a 100oC water bath for 1 hour to gelatinize

80
the starch. Then microtubes were cooled to room temperature, and alkali was
neutralized with 75 �L of 1 M acetic acid to a pH of 6.6 to 7.5, checked against paper
type pH indicators. An aliquot of 200 �L of heat tolerant �-amylase (EC 3.2.1.1, Sigma
A3403) was added and microtubes incubated in a water bath at 85oC for 30 min.
Microtubes were then cooled to room temperature and pH was lowered to 5 by adding
100 �L acetic acid, checked against paper type pH indicators. Microtubes were then
mixed by vortex mixer, emptied into 15 mL tubes, and 1 mL of amyloglucosidase was
added (EC 3.2.1.3, Sigma A3042). Tubes were incubated in a water bath at 55oC for
60 min to complete starch hydrolysis. Tubes were then immersed in boiling water for
5 min to stop starch digestion and centrifuged at 3000 x g for 10 min to remove particles
from solution.
3.3.3.2. Soluble sugars (ss) and starch analysis
For the analysis of ss, a sequential enzymatic degradation method (Hendrix,
1993) for determining glucose, fructose, and sucrose was modified because
manufacturing of the reagent used in the original method was discontinued. Thus a
different reagent for glucose determination was used, and the original wavelength at
which samples were read by the spectrophotometer was changed. From the 15 mL
tubes after ss extraction, an aliquot of 0.5 mL was pipetted and mixed with about 10 mg
of activated charcoal (Sigma C3345) in a 0.45 �m cellulose acetate microfilter tube
assembly (Costar 8163-Corning) and centrifuged at 2200 x g for 3 min (Eppendorf
centrifuge 5415 D) to produce a clear extract. An aliquot of 20 �L of the filtered extract
was pipetted into a microplate well and oven-dried at 55oC to concentrate the sample.

81
Once the samples were dried, 20 �L of water were added to each microplate well. An
enzymatic glucose assay kit (G2020, Sigma) was used for the analysis and prepared
according to the manufacturer’s instructions. An aliquot of 100 �L of the prepared
reagent was added to each microplate well to be analyzed. The microplate was then
incubated for 15 min at 37oC and read by a microplate spectrophotometer
(Spectramax® Plus384, Molecular Devices Corp., Sunnyvale, CA) at 340 nm to
determine glucose. To determine fructose, 10 �L of a phosphogluco-isomerase solution
(EC 5.3.1.9, Sigma P5381) was pipetted into the microplate wells with the samples. The
microplate was incubated for another 15 min at 37oC and read again at 340 nm. The
difference between the two readings was proportional to the sample’s fructose
concentration. For sucrose determination, 10 �L of an invertase solution (EC 3.2.1.26,
Sigma I4504) was then pipetted into the wells with the samples, incubated for another
15 min at 37oC, and read again at 340 nm. The difference between the second and third
readings was proportional to the sample’s sucrose concentration.
Ten microplate wells were filled with glucose standards and their readings were
used to build calibration curves from which concentrations of the samples were
calculated. After several analyses using 10 standards, and due to the small variability
among readings, the number of standards was reduced to six wells. The highest and
lowest glucose standard concentrations were 111 �g mL-1 and 0 �g mL-1 respectively.
Another six wells of the microplate were filled with the glucose, fructose, and sucrose
controls, and their concentrations were equivalent to the glucose concentration of the
highest standard used. The controls indicated whether the enzyme preparations were

82
Export rate = NCE(starch ss) (starch ss)
tx FSL,fl
l f
fl
−+ − +
(3.3)
still active (enzyme solutions once prepared could lose some of their activity with
storage time). Glucose, fructose and sucrose concentrations in leaf tissue were summed
and expressed as total soluble sugars.
An aliquot of 20 �L from the supernatant after starch extraction was used for the
starch analysis, following the same procedure used for glucose determination. If the
samples’ concentrations were over those of standards, samples were diluted. The same
standards used in the ss analysis were used for starch determination. Corn starch at
about 111 �g g-1 was used as control; it was digested and analyzed as a sample. Both
ss and starch results were expressed in mg g-1 fresh weight (FW). Based on starch and
ss concentrations, NCESL, and time elapsed between first and last sample of the day,
leaf export rates were calculated by:
where export rates and NCESL,fl (mean of first (NCESL,f) and last (NCESL,l) measurement
of the day) are expressed in �mol m-2 s-1, tfl is the time (h) elapsed between the first and
last sample, and F is a unit conversion factor (2.0568 �mol m-2 s-1 g mg-1 h; see
appendix 3).
3.3.4. Statistical analysis
The data were analyzed using the SAS statistical package (V8(2); SAS Institute,
Cary, NC). Procedure Univariate was used to test for normality and the Brown-Forsythe

83
test for homogeneity of variance. The general linear model procedure (proc GLM) was
used for the analysis of variance (ANOVA). The Tukey-Kramer method at a significance
level of p�0.05 was used for mean comparisons, proc CORR procedure was used for
correlation analysis, and proc REG for regression analysis.
3.4. Results
3.4.1. Meteorological and irrigation summary
Air temperatures (1.5 m) recorded between DOY 91 and DOY 304
(April 1 - October 31) by the Alderdale PAWS station were similar for both growing
seasons (Figure 3.2). In both years maximum temperatures exceeded 40oC only briefly
during July. Differences between daily maximum and minimum temperatures during the
period of berry growth (DOY 175 - DOY 262) were on average about 16oC for both
seasons. Total global irradiance (April 1 - October 31) was 4731 MJ m-2 in 2002 and
4808 MJ m-2 in 2003. The sum of degree days (April 1 - October 31) was higher in 2003
(1857oC) than 2002 (1669oC), due mainly to warmer temperatures in 2003 during
August, September and October (Figure 3.3). Bloom and veraison occurred about one
week earlier in 2003 than 2002. Annual rainfall (January 1 - December 31) was below
average (211 mm; 1991-2003), totaling 160 mm in 2002 and 148 mm in 2003. Although
rainfall during the growing season was similar in both years, more rain was recorded in
the winter prior to the 2003 growing season (Table 3.1). Rainfall was more evenly
distributed in 2002 than in 2003, with no recordable rain in 2003 between the beginning
of June (pre-bloom) and the beginning of August (pre-veraison; see appendix
figure A3.3). Total ETo during the growing season (April 1 - October 31) was similar in

84
both years and above average (Table 3.1). Maximum daily ETo was about 14 mm in
2002 and about 11 mm in 2003, whereas the average maximum daily ETo (April 1-
October 31; 1999 to 2003) is 12.3 mm (see appendix figure A3.4).
Cumulative irrigation applied during the RDI regimens (i.e., post fruit set) was
295 mm for S, 225 mm for V, and 185 mm for E during 2002, and 162 mm for S,
122 mm for V, and 92 mm for E during 2003 (Figure 3.4; see also appendix figure A3.5).
Differences in irrigation applied between years were due to different crop coefficients,
rainfall distribution, and ETo.
3.4.2. Canopy leaf area
Total leaf area per vine was between 6 and 10 m2 (Table 3.2). No differences in
canopy sizes were recorded between years at pre-veraison, while at pre-harvest
canopies were about 27% smaller in 2003 than in 2002. In general, vines under E
tended to have less leaf area per vine than V in both years, but about the same leaf area
as S vines. Canopy differences were evident in aerial photographs of the plots
(Figure 3.5) and also were confirmed by dormant pruning weights (Chapter 5, this
volume).
3.4.3. Total daily canopy net CO2 exchange (NCEWV,d, NCEWL,d)
Because of technical difficulties with the whole-canopy system, data collected
during the fruit set stage of 2002 were not included in the analysis. However, trends will
be discussed for both seasons, and illustrative data presented from the more
comprehensive 2003 field campaign. Although some differences were recorded in leaf
area per vine among the irrigation regimens, these differences were not large enough to
85
change the trends found between treatments in NCEWV,d when NCEWL,d was computed,
so canopy size was not the main determinant of treatment response. Because significant
interactions were found between treatment and phenological stage, irrigation regimens
were compared within stages, using three days’ data per measurement run (Table 3.3).
Significant interactions between treatment and DOM usually were due to the
confounding effects of cloudy skies, rainfall, and concurrent irrigation application.
Between one and four irrigation sets occurred during each of the seven to nine day
measurement runs, thereby superimposing a dry-down and re-wetting cycle on the
general deficit response. Because of the different RDI coefficients in each regimen, not
all plots were irrigated simultaneously. Separate analyses were performed using only
DCS to segregate irrigation effects from those of weather (Tables 3.4 and 3.5).
In both years NCEWV,d was higher at pre- and post-veraison than at pre- and
post-harvest, with no interaction between year and phenological stage (Tables 3.3, 3.4,
and 3.5). Furthermore, in 2003, NCEWV,d was higher around veraison than during the fruit
set stage, although the difference between stages was less dramatic than late in the
season. Across all treatments, NCEWV,d was 39% less at pre-harvest and 47% less at
post-harvest with respect to the pre- and post-veraison stages (Table 3.4). When all
vines were watered identically (fruit-set and post-harvest periods), there were no
differences among regimens in NCEWV,d whether all measurement days were considered
or only those with clear skies (Tables 3.4 and 3.5). A reduction in net CO2 fixation was
observed due to the additional water deficit in E vines before veraison (43% in 2002;
46% in 2003) and in V vines after veraison (33% in 2003), while in 2002 after veraison,

86
NCEWV,d in E vines was lower than in S or V vines. Although V vines were under
additional deficit during the pre-harvest interval, no differences among regimens were
observed, and all vines fixed less CO2 (60% reduction) compared with the
measurements recorded three weeks earlier. At post-veraison, E vines fixed about 29%
less CO2 than S vines in both years, suggesting a delayed recovery by the E vines after
they were returned to standard RDI. Total CO2 potentially fixed was calculated for each
of the RDI regimens during each period when measurements were collected based on
the NCEWV,d values for days with clear skies in 2003 by linear interpolation between
stages (Table 3.6). Because the E regimen lasted longer than V and occurred during the
period of highest net carbon exchange, the season-long reduction in total carbon fixed
was higher for E than for V vines.
3.4.4. Diurnal trends in canopy net CO2 exchange rate (NCEWL)
Irrigation regimens, weather, and timing of irrigation sets all influenced the diurnal
pattern of NCEWL. The NCEWL daily curves varied with photosynthetic photon flux density
(PPFD), temperature, and ETo, and time elapsed between irrigation and measurement
collection. The NCEWL was low throughout the day on DWC, following the PPFD curve at
the beginning and end of the day. At fruit set, when all vines were irrigated equally, vines
in all regimens typically followed the same diurnal pattern and fixed CO2 at similar rates.
Small variations are evident due to slightly different timing of irrigation sets (Figure 3.6).
For example on DOY 178, while irrigation was being applied to all plots, maximum
values of NCEWL were about 9.5 �mol m–2 s–1, between 0900 h and 1500 h (Figure
3.6-A). By DOY 181 (Figure 3.6-B), three days had passed since an irrigation set, and

87
while maximum values of NCEWL approached 8 �mol m–2 s–1 in the morning (ca. 0800 h)
they gradually declined to 4 �mol m–2 s–1 by mid-afternoon (ca. 1400 h). Clouds on DOY
183 (Figure 3.6-C), lower air temperature, and no irrigation of E plots resulted in some
divergence among treatments and a modified sinusoidal pattern of NCEWL during that
day.
At pre-veraison, while E vines were under extra water deficit, NCEWL at midday of
DCS was up to 57% lower than in vines under standard RDI (Figure 3.7-C). Under
clouds, lower temperature, and lower VPD, differences among irrigation regimens were
smaller because S and V vines fixed CO2 at lower rates than on days with clear skies
and/or an irrigation set (Figure 3.7-B).
During the post-veraison measurements one would have expected a reversal of
the E and V NCEWL from the pre-veraison period and this was generally the case on
DCS (Figure 3.8-B). Field scheduling resulted in an irrigation set applied on DOY 239 to
S and V vines, but not to E vines resulting in a convergence of NCEWL between E and V,
although E vines were no longer under additional deficit. Rain (2.3 mm) on DOY 234
resulted in low NCEWL overall and acted as a relief on the V deficit. Maximum NCEWL
recorded during DOY 238 (12 �mol m-2 s-1; Figure 3.8-B) and DOY 240 (14 �mol m-2 s-1;
Figure 3.8-C) were the highest of the season.
At pre-harvest and post-harvest, PPFD, air temperature, and ETo were
considerably lower than previously. The light and temperature dependent responses of
photosynthesis are evident when comparing the pre-harvest period to the preceding set
of measurements. There was a marked deficit effect in V vines on DOY 256
88
(Figure 3.9-A), although this effect was less pronounced during the other two
measurement days because of intermittent clouds (Figure 3.9-B, C). Consequently, the
composite data suggested no difference in NCEWV,d or NCEWL,d between S and V during
this period (Table 3.3). Maximum air temperature was as much as 10 to 12oC lower than
during the post-veraison measurement period. After harvest all vines were irrigated at
FVET, but slightly higher NCEWL during mid-day hours were observed in the S vines
(Figure 3.10-A, B). Cloudy days damped this apparent difference (Figure 3.10-C).
Maximum NCEWL recorded on S vines were not different among the phenological stages
(Table 3.7), while E and V vines only differed from S at the times when they were under
their respective additional deficits.
3.4.5. Single-leaf net CO2 exchange rate (NCESL) and stomatal
conductance (gs)
The effects of additional water deficit on NCESL and gs were evident in both years
and in general confirmed NCEWL results (Figure 3.11 and 3.12). Maximum values of
NCESL were recorded at pre-veraison and post-veraison (�17 �mol m-2 s-1 in 2002;
�15 �mol m-2 s-1 in 2003) with the lowest ones during pre-harvest in both years. Daily
maximum values were usually recorded during mid-morning, with a decline in NCESL
during the afternoon. In both years during pre-veraison, NCESL was lower in the E vines
than in S and V at all measurements during the day. During post-veraison, as with
whole-canopy measurements, E and V vines had similar values of NCESL in 2002, while
in 2003, NCESL was lower in V vines than either S or E. At pre-harvest, NCESL was lower
in V than in S or E, while during post-harvest NCESL was similar in all treatments. Hourly
89
whole-canopy data were used to evaluate the relationship between NCEWL and NCESL.
Although significant, correlation was poor (r2=0.38; Figure 3.13). Except for some lower
NCESL in the additional deficit vines, most NCESL values were generally higher than
those of NCEWL. Less dispersion in the whole canopy data is probably due to more
measurements per vine collected per hour (n=5) than by the single leaf instrument
thereby buffering extreme values in the whole-canopy measurements. Using 2003 data,
means for NCEWL and for NCESL were calculated for days and between times when both
types of measurement were taken simultaneously. Except at fruit set when NCEWL was
higher, NCEWL in general was lower than NCESL (Figure 3.14).
3.4.6. Non-structural carbohydrates
In 2002 there was no clear pattern in soluble sugars among treatments according
to the time of day the samples were collected (see appendix; Figure A3.9). Thus, in
2003 only the leaf samples corresponding to the first and the last sample time of the day
were analyzed, and only for days with clear skies that were preceded by a day with clear
skies. Soluble sugars concentrations during 2002 ranged from �10 to 20 mg g-1 FW,
while starch concentrations ranged from 10 to 35 mg g-1 FW (Figure 3.15). In 2002 no
significant differences in soluble sugars among irrigation regimens were observed at any
phenological stage. Starch concentrations were significantly different among regimens
only in the first sample of the day at pre-veraison, with leaves of E vines having lower
starch concentration than leaves of S or V vines (Figure 3.16). Soluble sugars
concentrations in leaves during 2003 ranged from �6 to 9 mg g-1 FW, while starch
concentrations ranged from �12 to 33 mg g-1 FW. Higher concentrations of soluble

90
sugars were observed in the first sample of the day (Figure 3.17-A) than in the last one
(Figure 3.17-B). As in 2002, no significant differences among regimens were recorded in
soluble sugars at any of the phenological stages. Starch concentrations were not
different among regimens for the first sample of the day (Figure 3.18-A). In the last
sample of the day at pre-veraison and post-veraison, leaves from vines under additional
water deficit had lower starch concentration than those under standard deficit
(Figure 3.18-B). Based on NCESL and leaf non-structural carbohydrates, net export rates
were estimated. No significant differences were found in net export rates among
irrigation regimens (Table 3.9).
3.5. Discussion
Canopies of grapevines under more severe water deficit during berry growth fixed
overall lower amounts of CO2 compared to those under standard RDI, although the
timing and duration of irrigation sets (3 to 4 per week) influenced the day-to-day
dynamics of this difference among irrigation regimens, as did weather. The influence of
additional deficit was most evident during the driest days of the weekly irrigation cycle,
leading to a marked decline in photosynthesis from a mid-morning daily maximum,
although the diurnal curve of NCEWL in all vines varied between the “wet” and “dry” days
of the weekly cycle. Similar patterns in NCEWL have been observed under drying soil
conditions elsewhere (Intrieri et al., 1998; Ollat and Tandonnet, 1999; Poni et al., 2003).
Given a plant available water (PAW) of 27.7 mm (see calculation in appendix 3) and a
daily FVET of about 8 mm at our site, a water deficit could have been generated within
two days, with more than half of the available soil water consumed. Rapid drying and

91
re-wetting at our site was facilitated by the rapid infiltration rate and low water holding
capacity of the sandy soil. For a given soil type, irrigation amount and distribution in time
both can influence the rate and duration of NCEWL recovery due to rewatering.
All vines, whether under standard or under additional water deficit, responded
within a day to irrigation events, via higher NCEWL,d, and the diurnal course of NCEWL
following the diurnal pattern of irradiance. After E vines were again irrigated at standard
RDI, CO2 fixation recovered to about the same levels as before imposition of the
additional deficit. The rapid recovery is an indication that no severe damage to the
photosynthetic machinery had occurred; grapevines have been reported to be quite
resistant to photoinhibition (Chaumont et al., 1997; Flexas et al., 1998; Gamon and
Pearcy, 1990), with photorespiration being indicated as an important process of energy
dissipation (Medrano et al., 2002). The general decline in CO2 fixation of vines in all
irrigation regimens towards the end of the season (pre- and post-harvest) and the
reduction in atmospheric water demand makes it difficult to evaluate the recovery of
vines that were under additional water deficit between veraison and harvest (V vines).
The similarity among CO2 fixation rates after harvest, when all vines were irrigated at
FVET, suggests that the capacity of those canopies to fix CO2 was not permanently
impaired by the degree or timing of the additional deficits that were applied. Within the
standard deficit, maximum CO2 fixation rates were similar across the season, as
previously reported in field grown vines (Ollat and Tandonnet, 1999). Expected
reductions in CO2 fixation rates by canopy aging towards the end of the season
(Bertamini and Nedunchezhian, 2003; Kriedemann et al., 1970; Schultz et al., 1996)

92
may have been compensated by lower evapotranspiration demand that could have
favored higher NCEWL. Canopy size reduction due to normal loss of some leaves by the
post-harvest measurement may also have contributed to reductions in total daily CO2
fixation. For example a reduction in canopy size of 16% in S vines from the post-
veraison to the pre-harvest measurement was accompanied by a reduction of about
35% in NCEWL,d, which indicates that other factors (i.e., lower irradiance, temperature,
canopy age, and day length) apart from canopy size affected NCEWV,d.
Although the additional two water deficits imposed were of similar magnitude
(equal reduction in crop coefficient used and soil moisture targeted), their effects on CO2
fixation and partitioning were considerably different. The large reduction in CO2 fixed,
particularly in E vines, without a consistent effect on yield, berry composition or size in
either of the two years (chapter 5, this volume), must have affected other organs or
reserves of the vine. Reduction in berry size is a common objective of RDI. Elsewhere,
water deficits imposed during the berry growth period have reduced berry size, with
deficits imposed during phases I and II achieving the largest effect (Matthews and
Anderson, 1988; Matthews and Anderson, 1989; McCarthy, 1997). After fruit set, the
berries become a strong carbon sink (Hale and Weaver, 1962), and may compete for
the limited source of carbohydrates that results from imposed water deficit. In the current
work, irrigation applied to the early deficit treatment after bloom and until treatments
started to receive different amounts of water (DOY 192) could have ameliorated the
reduction in berry size that would have been obtained if the deficit in the early treatment
has been prolonged.

93
Based on estimations of total CO2 fixed between fruit set and harvest for S vines
(9.43 kg; Table 3.6), maximum yield recorded in 2003 (4.7 kg vine-1; chapter 5, this
volume), and assuming that berries contain 25% dry matter (Winkler et al., 1974) with
44% carbon content, such yield would have required about 1.95 kg of CO2 to have been
fixed, leaving more than 80% of the estimated total carbon fixed to have been directed
to leaves, canes, trunk, and roots. During the same period E vines fixed 5.81 kg of CO2,
leaving about 40% of the equivalent amount of CO2 fixed by S vines for distribution
among other organs, whereas fixation of CO2 in V vines was only 10% lower than S
vines. By pre-harvest, the fruit already had high levels of soluble solids, and the fruit sink
strength may have declined. This together with the fact that standard RDI vines fixed
after harvest only about 15% of the total CO2 fixed from fruit set to leaf fall, indicates that
root growth and replenishment of reserves could have been severely compromised by
the extra water deficit. Thus, it is reasonable to assume that vines under early additional
deficit directed less carbohydrate to roots and permanent structures, and ended the
season with less root biomass and reserves than those under standard and under late
additional deficit. Roots have been reported to be a low priority sink during fruit ripening
(Candolfi-Vasconcelos et al., 1994) for both growth and replenishment of reserves in
permanent structures that will be used for next years’ budbreak and initial shoot growth
(Quinlan and Weaver, 1970; Stoev and Ivantchev, 1977; Winkler and Williams, 1945). In
grapevines, the ratio between below- and above-ground biomass was reported to be
constant (Buttrose, 1965; Petrie et al., 2000), but with insufficient fruit, excess
carbohydrates were reported to be channelled to roots, increasing that ratio (Bota et al.,

94
2004; Buttrose, 1965).
During pre- and post-veraison afternoons, lower total non-structural
carbohydrates concentrations (starch plus soluble sugars) in vines under additional
water deficit were due to lower leaf starch concentration associated with lower NCESL
(Figure 3.12). Previous research also showed reductions in total non-structural
carbohydrates due to lower NCESL (Chaumont et al., 1994; Chaves, 1991; Rodrigues et
al., 1993), although the magnitude of this reduction depended on the severity of the
water deficit (Patakas et al., 2002; Patakas and Noitsakis, 2001). We did not record in
our single-leaf measurements complete stomatal closure due to additional water deficits
imposed. Allocation between ss and starch in grapevine leaves has been shown to be
affected by water deficits (Patakas, 2000; Quick et al., 1992; Rodrigues et al., 1993).
Although we expected to detect a lower starch concentration in the morning in vines
under additional water deficit, this only happened in 2002. It is possible that due to the
time at which samples were collected (i.e. earliest was 0707 h on DOY 183 at fruit set,
while sunrise was at 0412 h), leaves may have had enough time accumulate some
starch. At the beginning of the day, daily curves of NCEWL were usually similar among
regimens (e.g., Figures 3.7 and 3.8). Thus, there was some time during which leaves
under additional water deficit may have been able to replenish some of the starch
utilized during the night. At the last sampling time, starch concentration was that at the
beginning of the day plus what has been accumulated by CO2 fixation until time of the
sampling. Regardless of irrigation regimen, and although NCESL were lower in the
afternoon, starch concentrations were always higher than in the morning, in agreement

95
with previous reports where daily starch levels displayed an inverse relationship with
CO2 fixation rates (Hunter et al., 1995). The same study also showed that root starch
concentrations increased from morning to afternoon, following the trend observed in
leaves. Our calculations showed that leaves under additional water deficit were able to
export carbohydrates. It has been suggested that water deficit affected source activity
more than phloem translocation (Bota et al., 2004). We do not know the dynamics of
carbohydrate concentration during the night in our experiment.
Single-leaf measurements were able to detect differences among irrigation
regimens, but in general NCESL overestimated NCEWL, supporting the idea that
single-leaf measurements can be misleading if extrapolated to the whole canopy (Edson
et al., 1995; Intrieri et al., 1997; Katerji et al., 1994). Single-leaf measurements provide
little evidence of the relationships between sources and sinks, and vineyard-scale CO2
fixation. Extreme values of NCESL are buffered by the whole canopy because the latter
represents leaves that are under more heterogenous water status conditions (sunlit vs.
shaded, east side vs. west side of the canopy, top vs. bottom of canopy). At relatively
high NCESL, one might expect lower NCEWL, because of numerous shaded leaves
drawing down whole-canopy average. On the contrary, when NCESL are relatively low
(i.e., water deficit), one might expect comparatively higher NCEWL because numerous
leaves are under more favorable water status. To estimate the amount of CO2 fixed by a
vine per day, single-leaf measurements would have to be temporally and spatially
extensive to capture the same information as a whole-canopy measurement. With our
whole-canopy system we were able to collect simultaneously from six vines, 120 data

96
points for CO2 fixation per vine per day, providing information that can not be provided
by single leaf measurements.
In eastern Washington where the period between harvest and leaf fall is short,
water deficits imposed during berry growth could compromise root growth and
replenishment of reserves for the following season. In viticulture regions in lower
latitudes with longer periods and day lengths between harvest and leaf fall imply that a
balance among sources, sinks, and reserves replenishment may not be as critical as in
northern latitudes, especially when additional water deficits are imposed. Although we
observed differences in canopies (e.g., pruning weights), no consistent effect was
observed on yield, berry size or berry composition due to additional water deficit
(chapter 5, this volume). In a separate experiment in the same vineyard, a higher
number of berries per cluster and higher yield were achieved by two manipulations:
applying more irrigation than 70% FVET around bloom and by removing shoot tips
(hedging; R. Smithyman, unpublished data). More irrigation around bloom may have
raised CO2 fixation rates by partly relieving water deficits and increasing stomatal
conductance. Hedging might have reduced transpiring area, improved vine water status
and increased CO2 fixation rates. Moreover, at bloom, flower clusters are a relatively
weak sink (Hale and Weaver, 1962) and by removing the shoot tips, the competition for
photo-assimilates between shoots tips and flower clusters may have been reduced
(Coombe, 1959; Quinlan and Weaver, 1970). It is possible that low fruit set in our
experiment (data not shown) was a consequence of low carbohydrate reserves and low
CO2 fixation rates due to water deficit. Our measurements were conducted during the

97
last two years of a five year experiment. The high leaf area:fruit ratio across all irrigation
regimens (more than 15 cm2 leaf area per g of fruit, chapter 5, this volume) compared to
those cited as optimum for well-watered vines (Kliewer and Dokoozlian, 2000), might
suggest a sink limited situation. For vines under water deficit, optimum leaf area:fruit
ratios may need to be higher to offset lower CO2 fixation rates. Considering that there
was not a consistent effect of additional water deficits on yield or berry composition in
either of the two years (chapter 5, this volume), one of the goals of RDI, water savings,
was achieved. But water savings were achieved at the expense of reduction in CO2
fixation, especially in the early deficit regimen.
3.6. Conclusion
Vines managed by RDI but under additional water deficit during berry growth
fixed less CO2 than vines solely under standard RDI both at the whole canopy and single
leaf levels. Estimated total CO2 fixed during the entire berry growth period was
considerably less in vines under the additional water deficit between fruit set and
veraison, than in those under additional water deficit between veraison and harvest.
Small but significant differences in canopy size were recorded between vines that were
under more severe water deficit after fruit set than those that were under water deficit
after shoot growth had stopped.
Leaves of vines under an additional water deficit had lower starch concentrations
during the afternoon than vines under standard RDI. However, leaf starch concentration
in all vines increased from morning to afternoon, contrary to the trend in CO2 fixation
rates, which in general decreased from morning to afternoon. Although vines under

98
additional water deficit may still accumulate starch in leaves during the afternoon, rates
of starch accumulation were lower as were export rates. Low levels of total daily CO2
fixation were recorded at the end of the season across all irrigation regimens. However,
similar daily maximum values of NCEWL were recorded during the entire season under
standard RDI. Single leaf measurements of net CO2 exchange in general overestimated
those of the whole canopy. A poor correlation between whole-canopy and single-leaf net
CO2 fixation was found, confirming previous research that results from single leaf
measurements have limited usefulness for estimating CO2 fixation of entire plants.
However, single leaf measurements reflected differences among irrigation regimens and
provided information on carbohydrate allocation in the leaf. The absence of severe
symptoms of water deficit, like premature senescence or yellow leaves, indicated that
targeted soil moisture levels were probably low enough to reduce photosynthesis and
growth, but not to reduce berry size or cause leaf abscission. Depending on severity,
water deficits imposed between fruit set and veraison may compromise root growth and
carbohydrate reserves in permanent structures of the vines. The increase observed in
number of berries per cluster and yield by less restrictive irrigation and hedging around
bloom, might suggest that water deficits promote an imbalance between sources and
sinks, particularly if imposed at bloom when flower clusters are relatively weak carbon
sinks.

99
3.7. References
Alexander, D. M.; 1965: The effect of high temperature regimes or short periods of waterstress on development of small fruiting Sultana vines. Australian Journal ofAgricultural Research 16, 817-823.
Behboudian, M. H. and Singh, Z.; 2001: Water relations and irrigation scheduling ingrapevine. Horticultural Reviews 27, 189-225.
Bertamini, M. and Nedunchezhian, N.; 2003: Photosynthetic functioning of individualgrapevine leaves (Vitis vinifera L. cv. Pinot noir) during ontogeny in the field. Vitis42, 13-17.
Bota, J.; Stasyk, O.; Flexas, J.; Medrano, H.; 2004: Effect of water stress on partitioningof 14C-labelled photosynthates in Vitis vinifera. Functional Plant Biology 31, 697-708.
Buttrose, M. S.; 1965: The effect of reducing leaf area on the growth of roots, stems andberries of Gordo grapevines. Vitis 5, 455-464.
Candolfi-Vasconcelos, M. C.; Candolfi, M. P.; Koblet, W.; 1994: Retranslocation ofcarbon reserves from the woody storages tissues into the fruit as a response todefoliation stress during ripening period in Vitis vinifera L. Planta 192, 567-573.
Chaumont, M.; Morot-Gaudry, J. F.; Foyer, C. H.; 1994: Seasonal and diurnal changesin photosynthesis and carbon partitioning in Vitis vinifera leaves in vines with andwithout fruit. Journal of Experimental Botany 45, 1235-1243.
Chaumont, M.; Osorio, M. L.; Chaves, M. M.; Vanacker, H.; Morot-Gaudry, J. F.; 1997:The absence of photoinhibition during mid-morning depression of photosynthesisin Vitis vinifera grown in semi-arid and temperate climates. Journal of PlantPhysiology 150, 743-751.
Chaves, M. M.; 1991: Effects of water deficits on carbon assimilation. Journal ofExperimental Botany 42, 1-16.
Coombe, B. G.; 1959: Fruit set and development in seeded grape varieties as affectedby defoliaton, topping, girdling, and another treatments. American Journal ofEnology and Viticulture 10, 85-100.
de Souza, C. R.; Maroco, J. P.; dos Santos, T. P.; Rodrigues, M. L.; Lopes, C. P.;Pereira, J. S.; Chaves, M. M.; 2003: Partial rootzone drying: regulation ofstomatal aperture and carbon assimilation in field-grown grapevines (Vitis viniferacv. Moscatel). Functional Plant Biology 30, 653-662.

100
Dry, P. R.; Loveys, B. R.; Düring, H.; 2000: Partial rootzone drying of grape. I. Transientchanges in shoot growth and gas exchange. Vitis 39, 3-7.
Edson, C. E.; Howell, G. S.; Flore, J. A.; 1993: Influence of crop load on photosynthesisand dry matter partitioning of Seyval Grapevines I. Single leaf and whole vineresponse pre- and post-harvest. American Journal of Enology and Viticulture 44,139-147.
Edson, C. E.; Howell, G. S.; Flore, J. A.; 1995: Influence of crop load on photosynthesisand dry matter partitioning of Seyval Grapevines III. Seasonal Changes in singleleaf and whole vine photosynthesis. American Journal of Enology and Viticulture 46, 478-485.
Escalona, J. M.; Flexas, J.; Bota, J.; Medrano, H.; 2003: Distribution of photosynthesisand transpiration within grapevine canopies under different drought conditions.Vitis 42, 57-64.
Evans, R. G.; Spayd, S. E.; Wample, R. L.; Kroeger, M. W.; Mahan, M. O.; 1993: Wateruse of Vitis vinifera grapes in Washington. Agricultural Water Management 23,109-124.
Flexas, J.; Bota, J.; Escalona, J. M.; Sampol, B.; Medrano, H.; 2002: Effects of droughton photosynthesis in grapevines under field conditions: an evaluation of stomataland mesophyll limitations. Functional Plant Biology 29, 461-471.
Flexas, J.; Escalona, J. M.; Medrano, H.; 1998: Down-regulation of photosynthesis bydrought under field conditions in grapevine leaves. Australian Journal of PlantPhysiology 25, 893-900.
Flexas, J.; Escalona, J. M.; Medrano, H.; 1999: Water stress induces different levels ofphotosynthesis and electron transport rate regulation in grapevines. Plant, Celland Environment 22, 39-48.
Gamon, J. A. and Pearcy, R. W.; 1990: Photonhibition in Vitis californica: interactiveeffects of sunlight, temperature and water status. Plant, Cell and Environment 13,267-275.
Hale, C. R. and Weaver, R. J.; 1962: The effect of developmental stage on direction oftranslocation of photosynthate in Vitis vinifera. Hilgardia 33, 89-131.
Hendrix, D. L.; 1993: Rapid extraction and analysis of nonstructural carbohydrates inplant tissues. Crop Science 33, 1306-1311.
Hunter, J. J.; Ruffner, H. P.; Volschenk, C. G.; 1995: Starch concentrations in grapevine

101
leaves, berries and roots and the effect of canopy management. South AfricanJournal of Enology and Viticulture 16, 35-39.
Iacono, F.; Buccella, A.; Peterlunger, E.; 1998: Water stress and rootstock influence onleaf gas exchange of grafted and ungrafted grapevines. Scientiae Horticulturae 75, 27-39.
Intrieri, C.; Poni, S.; Rebucci, B.; Magnanini, E.; 1997: Effects of canopy manipulationson whole-vine photosynthesis: results from pot and field experiments. Vitis 36, 167-173.
Intrieri, C.; Poni, S.; Rebucci, B.; Magnanini, E.; 1998: Row orientation effects on wholecanopy gas exchange of potted and field grown grapevines. Vitis 37, 147-154.
Katerji, N.; Daudet, F. A.; Carbonneau, A.; Ollat, N.; 1994: Etude à l'echelle de la planteentière du fonctionnement hydrique et photosynthètique de la vigne: comparaisondes systèmes de conduite traditionnel et en Lyre. Vitis 33, 197-203.
Kennedy, J. A.; Matthews, M. A.; Waterhouse, A. L.; 2002: Effect of maturity and vinewater status on grape skin and wine flavonoids. American Journal of Enology andViticulture 53, 268-274.
Kliewer, W. M. and Dokoozlian, N. K.; 2000: Leaf area/crop weight ratios of grapevines:influence on fruit composition and wine quality, p.285-295. In: Proceedings of theAmerican Society of Enology and Viticulture Annual Meeting. Seattle, WA.
Kliewer, W. M. and Weaver, J.; 1971: Effect of crop level and leaf area on growth,composition, and coloration of 'Tokay' grapes. American Journal of Enology andViticulture 22, 172-177.
Kriedemann, P. E.; Kliewer, W. M.; Harris, J. M.; 1970: Leaf age and photosynthesis inVitis vinifera L. Vitis 9, 97-104.
Liu, T. W.; R. Pool; W. Wenkert; P.E. Kriedemann; 1978: Changes in photosynthesis,stomatal resistance and abscisic acid of Vitis labruscana through drought andirrigation cycles. American Journal of Enology and Viticulture 29, 239-246.
Maroco, J. P.; Rodrigues, M. L.; Lopes, C.; Chaves, M. M.; 2002: Limitations to leafphotosynthesis in field-grown grapevines under drought - metabolic andmodelling approaches. Functional Plant Biology 29, 451-459.
Matthews, M. A. and Anderson, M. M.; 1988: Fruit ripening in Vitis vinifera L.:Responses to seasonal water deficits. American Journal of Enology andViticulture 39, 313-320.
102
Matthews, M. A. and Anderson, M. M.; 1989: Reproductive development in grape (Vitisvinifera L.). Responses to seasonal water deficits. American Journal of Enologyand Viticulture 40, 52-60.
May, P.; Shaulis, N. J.; Antcliff, A. J.; 1969: The effect of controlled defoliation in thesultana vine. American Journal of Enology and Viticulture 20, 237-250.
McCarthy, M. G.; 1997: The effects of transient water deficit on berry development of cv.Shiraz (Vitis vinifera L.). Australian Journal of Grape and Wine Research 3, 102-108.
Medrano, H.; Bota, J.; Abadía, A.; Sampol, B.; Escalona, J. M.; Flexas, J.; 2002: Effectsof drought on light-energy dissipation mechanisms in high-light-acclimated, field-grown grapevines. Functional Plant Biology 29, 1197-1207.
Medrano, H.; Escalona. J. M.; Cifre, J.; Bota, J.; Flexas, J.; 2003: A ten-year study onthe physiology of two Spanish grapevine cultivars under field conditions: effects ofwater availability from leaf photosynthesis to grape yield and quality. FunctionalPlant Biology 30, 607-619.
Miller, D. P.; Howell, G. S.; Flore, J. A.; 1997: Influence of shoot number and crop loadon potted Chambourcin grapevines. II: Whole-vine vs. single-leaf photosynthesis.Vitis 36, 109-114.
Murillo de Alburquerque, R. and Carbonneau, A.; 1997: Trocas gasosas em Vitis viniferasob regime de estresse hídrico. III. Ácido abscísico e comportamento varietal.Pesquisa Agropecuaria Brasileira 32, 579-584.
Naor, A. and Wample, R. L.; 1994: Gas exchange and water relations of field-grownConcord (Vitis labruscana Bailey) grapevines. American Journal of Enology andViticulture 45, 333-337.
Ojeda, H.; Anadary, C.; Kraeva, E.; Carbonneau, A.; Deloire, A.; 2002 : Influence of pre-and postveraison water deficit on synthesis and concentration of skin phenoliccompounds during berry growth of Vitis vinifera cv. Shiraz. American Journal ofEnology and Viticulture 53, 261-267.
Ojeda, H.; Deloire, A.; Carbonneau, A.; 2001: Influence of water deficit on grape berrygrowth. Vitis 40, 141-145.
Ollat, N. and Tandonnet, J. P.; 1999: Effects of two levels of water supply on thephotosynthesis and the transpiration of a whole grapevine (Vitis vinifera, c.v.Cabernet Sauvignon). Acta Horticulturae 493, 197-204.

103
Palliotti, A. and Cartechini, A.; 2000: Analisi della crescita e delle risposte adattative allacarenza idrica moderata nella Vitis vinifera L. Rivista di Irrigazione e Drenaggio47, 30-36.
Patakas, A.; 2000: Changes in the solutes contribution to osmotic potential during leafontogeny in grapevines leaves. American Journal of Enology and Viticulture 51,223-226.
Patakas, A.; Nikolaou, N.; Zioziou, E.; Radoglou, K.; Noitsakis, B.; 2002: The role oforganic solute and ion accumulation in osmotic adjustment in drought-stressedgrapevines. Plant Science 163, 361-367.
Patakas, A. and Noitsakis, B.; 2001: Leaf age effects on solute accumulation in water-stressed plants. Journal of Plant Physiology 158, 63-69.
Perez Peña, J. and Tarara, J.; 2004: A portable whole canopy gas exchange system forseveral mature field-grown grapevines. Vitis 43, 7-14.
Petrie, P.; Trought, M.; Howell, G. S.; 2000: Growth and dry matter partitioning of Pinotnoir (Vitis vinifera L) in relation to leaf area and crop load. Australian Journal ofGrape and Wine Research 6, 40-45.
Petrie, P. R.; Trought, M. C. T.; Howell, G. S.; Buchan, G. D.; 2003: The effect of leafremoval and canopy height on whole-vine gas exchange and fruit development ofVitis vinifera L. Sauvignon Blanc. Functional Plant Biology 30, 711-717.
Poni, S.; Magnanini, E.; Bernizzoni, F.; 2003: Degree of correlation between total lightinterception and whole-canopy net CO2 exchange rate in two grapevine growthsystems. Australian Journal of Grape and Wine Research 9, 2-11.
Poni, S.; Magnanini, E.; Rebucci, B.; 1997: An automated chamber system formeasurements of whole vine gas exchange. HortScience 32, 64-67.
Quick, W. P.; Chaves, M. M.; Wendler, R.; David, M.; Rodrigues. M. L.; Pa, J. A.; 1992:The effect of water stress on photosynthetic carbon metabolism in four speciesgrown under field conditions. Plant, Cell and Environment 15, 25-35.
Quinlan, J. D. and Weaver, R. J.; 1970: Modification of pattern of the photosynthatemovement within and between shoots. Plant Physiology 46, 527-530.
Rodrigues, M. L.; Chaves, M. M.; Wendler, R.; David, M. M.; Quick, W. P.; Leeg, R. C.;1993: Osmotic adjustment in water stressed grapevines leaves in relation tocarbon assimilation. Australian Journal of Plant Physiology 20, 309-321.

104
Schultz, H. R.; Kieffer, W.; Gruppe, W.; 1996: Photosynthesis duration, carboxylationand stomatal limitation of sun and shade leaves of different ages in field-growngrapevine (Vitis vinifera L.). Vitis 35, 169-176.
Stoev, K. and Ivantchev, V.; 1977: Données nouvelles sur le problème de latranslocation descendante et ascendante des produits de la photosynthèse de lavigne. Vitis 16, 253-262.
Winkler, A. J.; Cook, J. A.; Kliewer, W. M.; Lider, L. A.; 1974: General Viticulture.University of California Press, Berkeley.
Winkler, A. J. and Williams, W. O.; 1945: Starch and sugars of Vitis vinifera. PlantPhysiology 20, 412-432.
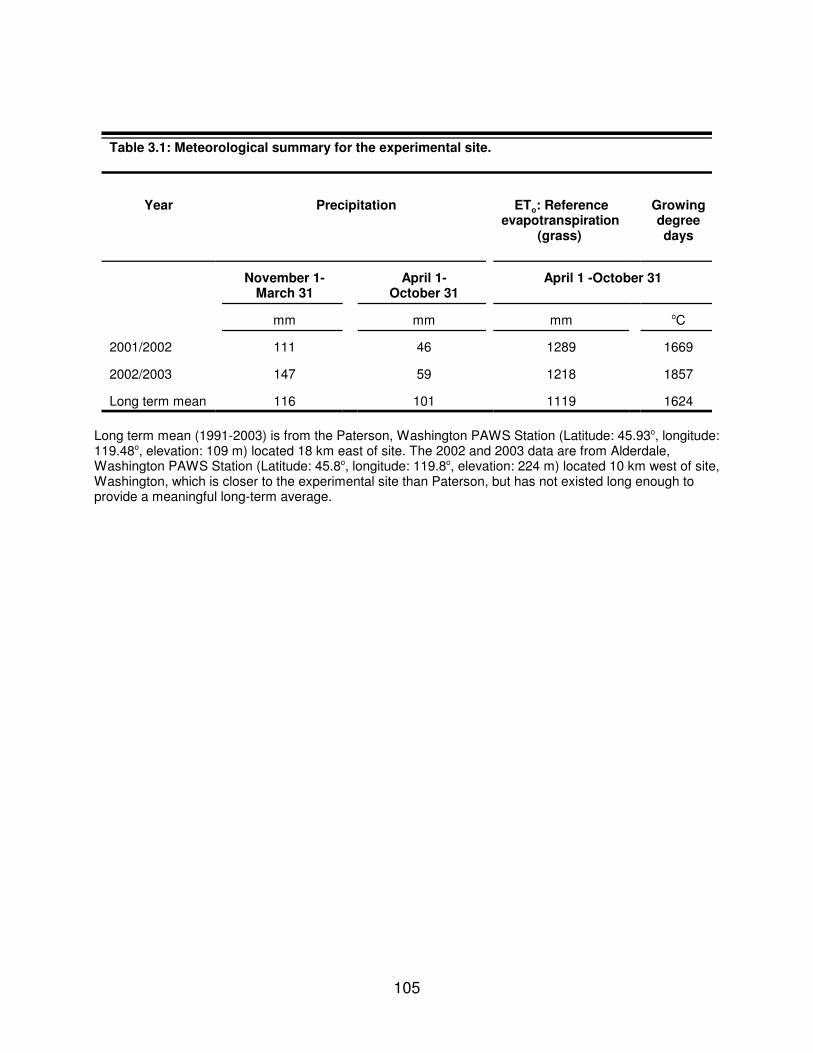
105
Table 3.1: Meteorological summary for the experimental site.
Year Precipitation ETo: Referenceevapotranspiration
(grass)
Growingdegreedays
November 1-March 31
April 1-October 31
April 1 -October 31
mm mm mm oC
2001/2002 111 46 1289 1669
2002/2003 147 59 1218 1857
Long term mean 116 101 1119 1624
Long term mean (1991-2003) is from the Paterson, Washington PAWS Station (Latitude: 45.93o, longitude:119.48o, elevation: 109 m) located 18 km east of site. The 2002 and 2003 data are from Alderdale,Washington PAWS Station (Latitude: 45.8o, longitude: 119.8o, elevation: 224 m) located 10 km west of site,Washington, which is closer to the experimental site than Paterson, but has not existed long enough toprovide a meaningful long-term average.

106
Table 3.2: Effect of RDI regimens on leaf area per vine.
PhenologicalStages
2002Irrigation regimen
2003Irrigation regimen
Year
S E V pvaluey
S E V p valuey pvaluev
--------------- (m2 vine-1) -------------- -------------- (m2 vine-1) --------------
Fruit set z ncu nc nc 8.8 ab 8.2 b 9.6 a 0.009 nc
Veraison 9.3 ab 7.5 b 10.7 a 0.004 8.4 b 8.1 b 9.7 a 0.009 0.306
Pre-harvest 10.1 8.4 10.6 0.155 7.0 b 6.7 b 8.7 a 0.001 0.005
Post-harvest nc nc nc 6.0 b 6.2 b 7.5 a 0.001 nc
Stage (p value) 0.325x 0.378w 0.001x 0.586w
S: standard RDI; E: early deficit (fruit set to veraison); V: late deficit (veraison to harvest). Values withdifferent letters within years and within stages are significantly different at p�0.05 by Tukey-Kramer.z Data were collected before RDI regimens were imposed.y Effect of RDI regimens within year and within stage.x Effect of phenological stage within year.w RDI regimen x stage interaction within years.v Effect of RDI regimens between years.u nc: data not collected.

107
Table 3.3: Effect of RDI regimens on net CO2 fixed per vine (NCEWV,d) and per unit leaf area(NCEWL,d) per day in 2003. Data are means of six vines averaged across allmeasurements days.
PhenologicalStages
Samplingdays
(DOY)
Irrigation regimenp value Day
LengthGlobal
IrradianceS E V
----- g CO2 d-1 vine-1 ---- treat DOM treat*DOM h MJ m-2 d-1
Fruit setz 177-184 101 94 113 0.168 0.001 0.532 15.7 30.6
Pre-veraison 212-219 125 a 67 b 131 a 0.001 0.001 0.048 14.6 21.9
Post-veraison 233-241 127 a 90 b 85 b 0.001 0.001 0.001 13.6 16.5
Pre-harvest 255-262 55 37 33 0.058 0.001 0.146 12.5 18.3
Post-harvest 274-281 51 52 45 0.405 0.082 0.484 11.4 13.7
Stage (p value) 0.001 0.001y 0.068x
PhenologicalStages
Samplingdays
(DOY)
Irrigation regimenp value
S E V
g CO2 d-1 m-2 leaf area treat DOM treat*DOM
Fruit setz 177-184 11.5 11.5 11.7 0.948 0.001 0.730
Pre-veraison 212-219 14.9 a 8.4 b 13.4 a 0.001 0.003 0.151
Post-veraison 233-241 15.3 a 11.0 b 8.8 b 0.001 0.001 0.007
Pre-harvest 255-262 7.8 5.6 3.8 0.075 0.001 0.259
Post-harvest 274-281 8.7 7.1 6.9 0.294 0.174 0.935
Stage (p value) 0.001 0.001y
DOY: day of year; S: standard RDI; E: early deficit (fruit set - veraison); V: late deficit (veraison - harvest);DOM: day of measurement. Values with different letters within phenological stages are significantlydifferent at p�0.05 by Tukey- Kramer.z Data were collected before RDI regimens were imposed.y RDI regimen x phenological stage interaction.x p value for global irradiance across phenological stages.

108
Table 3.4: Effect of RDI regimens on net CO2 fixed per vine per day (NCEWV,d). Dataare means of two vines from days with clear skies.
PhenologicalStages
Samplingday
(DOY)
Irrigation regimenp value Global
Irradiance
2002-2003z
S E V
----- g CO2 d-1 vine-1 ---- treat MJ m-2 d-1
---------------------------------------- 2002 ----------------------------------------
Fruit sety ncx nc nc
Pre-veraison 218 124 a 70 b 131 a 0.015 24.1
Post-veraison 235 117 ab 73 b 135 a 0.028 23.6
Pre-harvest 256 72 72 64 0.905 20.5
Post-harvest 279 48 37 55 0.341 16.0
Stage (p value) 0.001 0.032w
---------------------------------------- 2003 ---------------------------------------- g CO2 d-1 vine-1
Fruit sety 178 111 120 141 0.402 31.4 nc
Pre-veraison 218 140 a 60 b 149 a 0.002 27.5 112 a
Post-veraison 238 145 a 124 a 60 b 0.001 24.2 109 a
Pre-harvest 256 81 66 49 0.197 21.7 67 b
Post-harvest 278 54 59 57 0.462 15.3 52 c
Stage (p value) 0.001 0.001w 0.001
DOY: day of year; S: standard RDI; E: early deficit (fruit set - veraison); V: late deficit (veraison - harvest).Values with different letters within phenological stages are significantly different at p�0.05 by Tukey-Kramer. z Effect of RDI regimens on NCEWV,d across phenological stages with pooled data of 2002 and 2003. Nosignificant interaction was found between year and phenological stage (p�0.4989).y Data were collected before RDI regimens were imposed.x nc: data not collected in 2002.w RDI regimen x phenological stage interaction.

109
Table 3.5: Effect of RDI regimens on net CO2 fixed per unit leaf areaper day (NCEWL,d) for 2003. Data are means of two vines fromdays with clear skies.
PhenologicalStages
Samplingday
(DOY)
Irrigation regimenp value
S E V
---g CO2 d-1 m-2 leaf area -- treat
Fruit setz 178 13.2 14.6 14.8 0.704
Pre-veraison 218 17.1 a 7.4 b 15.7 a 0.015
Post-veraison 238 17.9 a 14.5 a 6.2 b 0.015
Pre-harvest 256 11.7 10 5.5 0.179
Post-harvest 278 9.4 9.0 7.8 0.340
Stage (p value) 0.001 0.001y
DOY: day of year; S: standard RDI; E: early deficit (fruit set - veraison); V: late deficit (veraison - harvest).Values with different letters within phenological stages are significantly different at p�0.05 by Tukey-Kramer. z Data were collected before RDI regimens were imposed.y RDI regimen x phenological stage interaction.

110
Table 3.6: Effect of RDI regimens on total net CO2 fixed per vine (NCEWV,d) and per unit of leafarea (NCEWL,d) per day between fruit set and post-harvest of 2003.
Phase Duration(days)
NCEWV,dz Total NCEWV during phasey vs. S
S E V S E V E V
g CO2 d-1 vine-1 kg CO2 phase-1 vine-1 (% Total) % %
Fruit set toVeraison x
46 126 60 145 5.79 (54) 2.77 (40) 6.68 (71) 48 115
Veraison toharvest w
32 114 95 55 3.64 (34) 3.04 (43) 1.75 (19) 83 48
Harvest topost-harvest v
19 68 63 53 1.29 (12) 1.19 (17) 1.01 (11) 92 79
Total 97 10.73 (100) 7.01 (100) 9.45 (100) 65 88
Phase Duration(days)
NCEWL,dz Total NCEWL during phasey vs. S
g CO2 d-1 m-2 kg CO2 phase-1 m-2 (% Total) % %
Fruit set toVeraison x
46 15 7 15 0.700 (50) 0.344 (37) 0.704 (69) 49 101
Veraison toharvest w
32 11 12 6 0.476 (35) 0.396 (43) 0.188 (19) 83 40
Harvest topost-harvest v
19 14 10 7 0.201 (15) 0.184 (20) 0.127 (12) 91 63
Total 97 1.38 (100) 0.924 (100) 1.02 (100) 6 67 74
S: standard RDI; E: early deficit (fruit set - veraison); V: late deficit (veraison - harvest).z Based on NCEW recorded on days with clear skies of 2003. y Calculated as the product of duration (days) x NCEWV,d (g CO2 d
-1 vine-1 ) or x NCEWL,d (g CO2 d-1 m-2 ).
x Values for S and V are means of NCEWV,d or NCEWL,d between the fruit set and pre-veraisonmeasurements, while for E is the NCEWV,d or NCEWL,d at pre-veraison. w Values for all RDI regimens are means of NCEWV,d or NCEWL,d between the post-veraison and pre-harvestmeasurements.v Values for all RDI regimens are means of NCEWV,d or NCEWL,d between the pre- and post-harvestmeasurements.

111
Table 3.7: Effect of RDI regimens on daily maximum NCEWL recordedduring 24 h. Data are means of two vines from days with clear skies.
PhenologicalStages
Samplingday
(DOY)
Irrigation regimenp value
S E V
--------- �mol m-2 leaf area s-1 ---------
Fruit setz 178 10.1 11.9 aby 10.5 ay 0.365
Pre-veraison 218 12.1 Ax 7.1 c B 11.3 a A 0.022
Post-veraison 238 12.8 A 11.7 ab A 7.7 bc B 0.014
Pre-harvest 256 11.6 12. a 6.9 c 0.323
Post-harvest 278 11.5 9.2 bc 9.7 ab 0.290
Stages (p value) 0.901 0.005 0.006 0.029w
DOY: day of year; S: standard deficit; E: early deficit (fruit set - veraison); V: late deficit (veraison -harvest).z Data were collected before RDI regimens were imposed.y Values with different letters (a, b, c) within columns are significantly different at p�0.05 by Tukey- Kramer.x Values with different letters (A, B, C) within phenological stages are significantly different at p�0.05 byTukey- Kramer.wRDI regimen x phenological stage interaction.
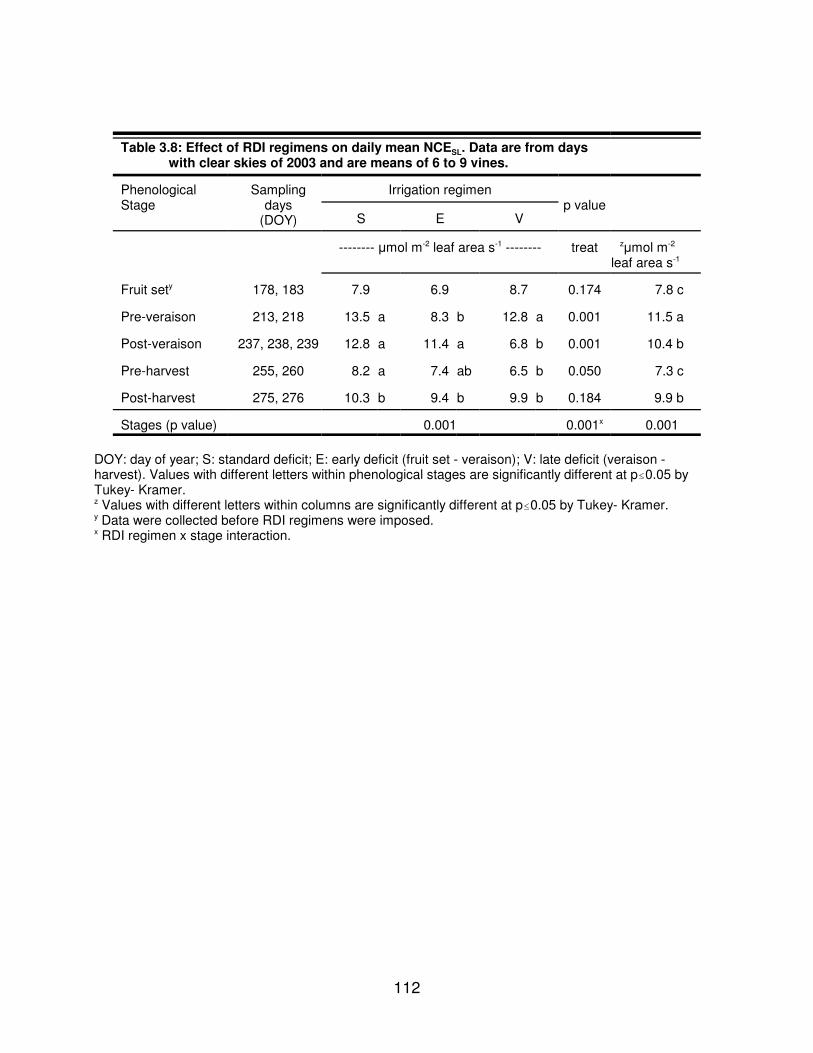
112
Table 3.8: Effect of RDI regimens on daily mean NCESL. Data are from dayswith clear skies of 2003 and are means of 6 to 9 vines.
Phenological Stage
Samplingdays
(DOY)
Irrigation regimenp value
S E V
-------- �mol m-2 leaf area s-1 -------- treat z�mol m-2
leaf area s-1
Fruit sety 178, 183 7.9 6.9 8.7 0.174 7.8 c
Pre-veraison 213, 218 13.5 a 8.3 b 12.8 a 0.001 11.5 a
Post-veraison 237, 238, 239 12.8 a 11.4 a 6.8 b 0.001 10.4 b
Pre-harvest 255, 260 8.2 a 7.4 ab 6.5 b 0.050 7.3 c
Post-harvest 275, 276 10.3 b 9.4 b 9.9 b 0.184 9.9 b
Stages (p value) 0.001 0.001x 0.001
DOY: day of year; S: standard deficit; E: early deficit (fruit set - veraison); V: late deficit (veraison -harvest). Values with different letters within phenological stages are significantly different at p�0.05 byTukey- Kramer.z Values with different letters within columns are significantly different at p�0.05 by Tukey- Kramer.y Data were collected before RDI regimens were imposed.x RDI regimen x stage interaction.

113
Table 3.9: Effect of RDI regimens on leaf carbohydrateexport rates (CO2 equivalents) and NCESL in 2003.
PhenologicalStages
Irrigation regimen
S E V p valuey
�mol m-2 s-1
Fruit setz 3.2 5.0 5.1 0.062
Pre-veraison 9.9 8.5 10.5 0.497
Post-veraison 7.9 11.4 6.1 0.120
Pre-harvest 9.1 10.7 5.3 0.185
Post-harvest ncx ncx ncx
z Data were collected before RDI regimens were imposed.y p value within phenological stagesx nc: data not collected.
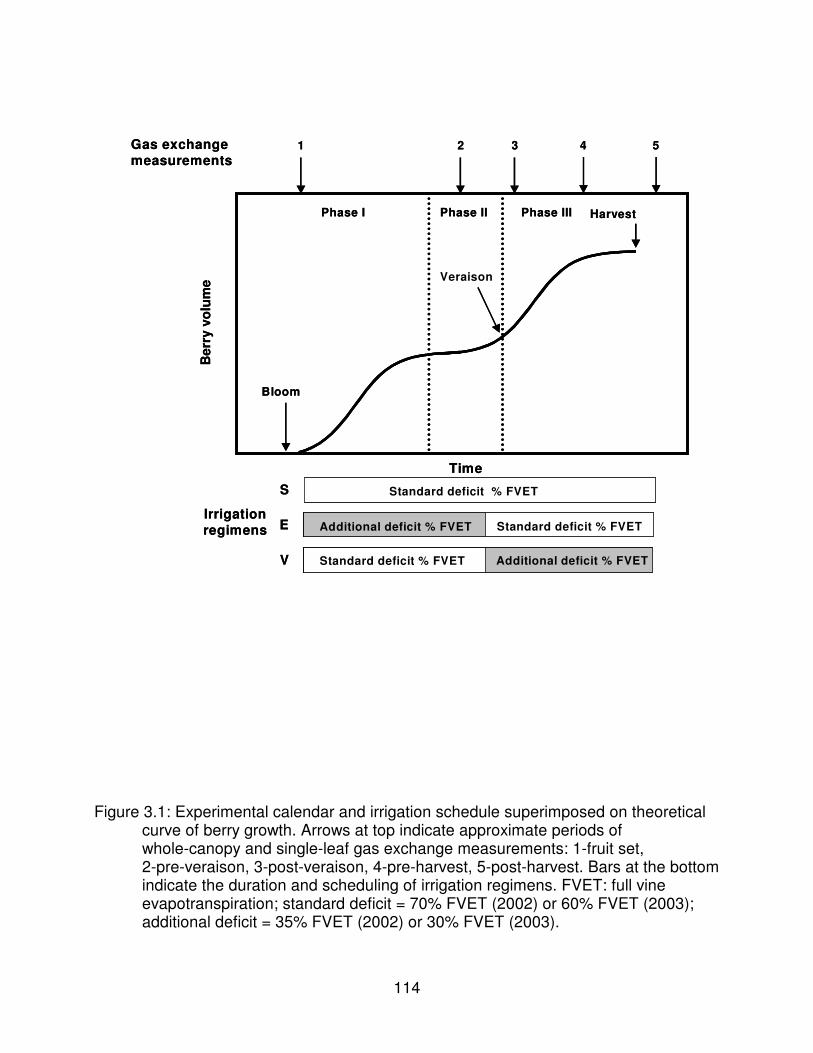
114
Additional deficit % FVET
Additional deficit % FVET
Irrigationregimens
Standard deficit % FVETS
Standard deficit % FVETE
Standard deficit % FVETV
Bloom
Veraison
Phase I HarvestB
erry
vol
ume
Time
Gas exchange measurements
Phase II Phase III
1 2 3 4 5
Additional deficit % FVET
Additional deficit % FVET
Irrigationregimens
Standard deficit % FVETS
Standard deficit % FVETE
Standard deficit % FVETV
Bloom
Veraison
Phase I HarvestB
erry
vol
ume
Time
Gas exchange measurements
Phase II Phase III
1 2 3 4 5
Figure 3.1: Experimental calendar and irrigation schedule superimposed on theoreticalcurve of berry growth. Arrows at top indicate approximate periods ofwhole-canopy and single-leaf gas exchange measurements: 1-fruit set,2-pre-veraison, 3-post-veraison, 4-pre-harvest, 5-post-harvest. Bars at the bottomindicate the duration and scheduling of irrigation regimens. FVET: full vineevapotranspiration; standard deficit = 70% FVET (2002) or 60% FVET (2003);additional deficit = 35% FVET (2002) or 30% FVET (2003).

115
Air
tem
pera
ture
, dai
ly m
axim
um a
nd m
inim
um (o C
)
-10
0
10
20
30
402002
2003
1 2 3 4 5
Day of year
91 121 151 181 211 241 271 301-10
0
10
20
30
40
1 2 3 4 5
Figure 3.2: Daily maximum and minimum air temperatures (1.5 m) recorded at theAlderdale PAWS station (10 km west of site) during 2002 and 2003. Dashed lineis 10oC, the conventional “base temperature” for grapevine growth andaccumulation of GDD. Arrow numbers indicate gas exchange measurements:1-fruit set, 2-pre-veraison, 3-post-veraison, 4-pre-harvest, 5-post-harvest.

116
Acc
umul
ated
GD
D (o C
)
0
200
400
600
800
1000
1200
1400
1600
1800
2000
2002 2003Long term average
bloom 2002
veraison 2002
harvest 2002 2003
fruit set
bloom 2003
veraison 2003
Day of year
91 121 151 181 211 241 271 301
�� ��G
DD
(200
3-20
02; o C
)
-50
0
50
100
150
A
B
Figure 3.3: A. Growing degree days (GDD; base 10 oC) for 2002 and 2003 measured atAlderdale PAWS station (10 km west of site). Main phenological stages areindicated. Long-term average (1991-2003) is from Paterson PAWS station (18 kmeast of site) because Alderdale PAWS station has not existed long enough toprovide a meaningful long-term average. B. Difference in accumulated GDDbetween the two seasons.

117
Acc
umul
ated
irri
gatio
n (m
m)
50
100
150
200
250
300
350
400StandardEarly Late
390 mm
320 mm
280 mm
veraison harvest
bloom
Day of Year
120 140 160 180 200 220 240 260 280 300 320
50
100
150
200
250
300
350
400
224 mm
188 mm
157 mm
veraisonharvest
bloomfruit set
fruit set
ETo cum (May-Oct): 1138 mm
ETo cum (May-Oct): 1090 mm
2002
2003
*
*
Figure 3.4: Accumulated irrigation applied during growing seasons from May to October(leaf fall), 2002 and 2003. Main phenological phases are indicated. Asterisksdenote beginning of RDI regimens.
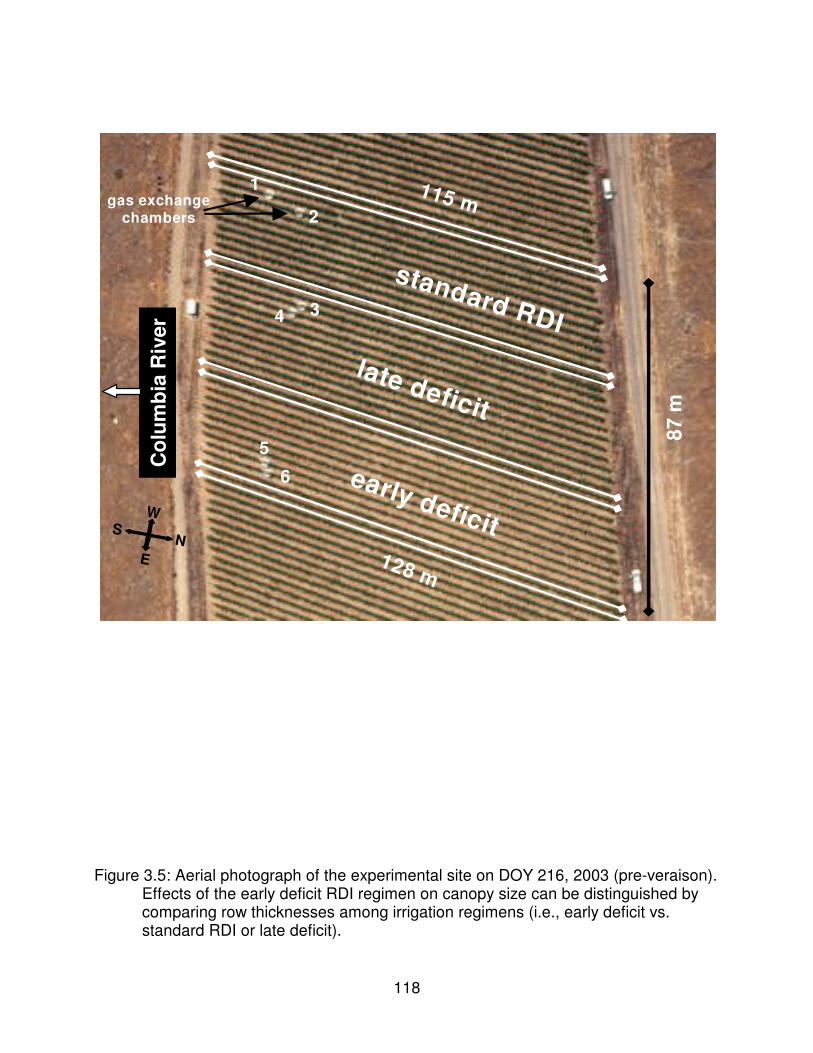
118
standard RDI
late deficit
early deficit
87 m
115 m
128 m
NS
E
W
Col
umbi
a R
iver
gas exchangechambers 2
34
5
1
6
standard RDI
late deficit
early deficit
87 m
115 m
128 m
NS
E
W
Col
umbi
a R
iver
gas exchangechambers 2
34
5
1
6
Figure 3.5: Aerial photograph of the experimental site on DOY 216, 2003 (pre-veraison).Effects of the early deficit RDI regimen on canopy size can be distinguished bycomparing row thicknesses among irrigation regimens (i.e., early deficit vs.standard RDI or late deficit).

119
DOY 178ETo= 7.5 mm
-2
0
2
4
6
8
10
12
14
0
500
1000
1500
2000
15
20
25
30
35
StandardEarlyLatePPFDTair
DOY 181ETo= 11.5 mm
NC
EW
L ( �� ��
mol
m-2
s-1
)
-2
0
2
4
6
8
10
12
14
PP
FD ( �� ��
mol
m-2
s-1
)
0
500
1000
1500
2000
T air (
o C)
15
20
25
30
35
DOY 183ETo= 7.0 mm
Local standard time (h)
0 4 8 12 16 20 0-2
0
2
4
6
8
10
12
14
0
500
1000
1500
2000
15
20
25
30
35
A
B
C
Figure 3.6: Whole-canopy net CO2 exchange rate (NCEWL), photosynthetic photon fluxdensity (PPFD) and air temperature (Tair) during fruit set, 2003. An afternoondepression in NCEWL is evident on DOY 181, after two days of no irrigation, whileon DOY 178 irrigation was being applied. Intermediate responses were observedon DOY 183, following irrigation (DOY 182), but confounded by passing cloud.Data points are means of two chambers operating simultaneously. Dailyreference evapotranspiration (grass; ETo) is from the Alderdale PAWS station (10km west of site).
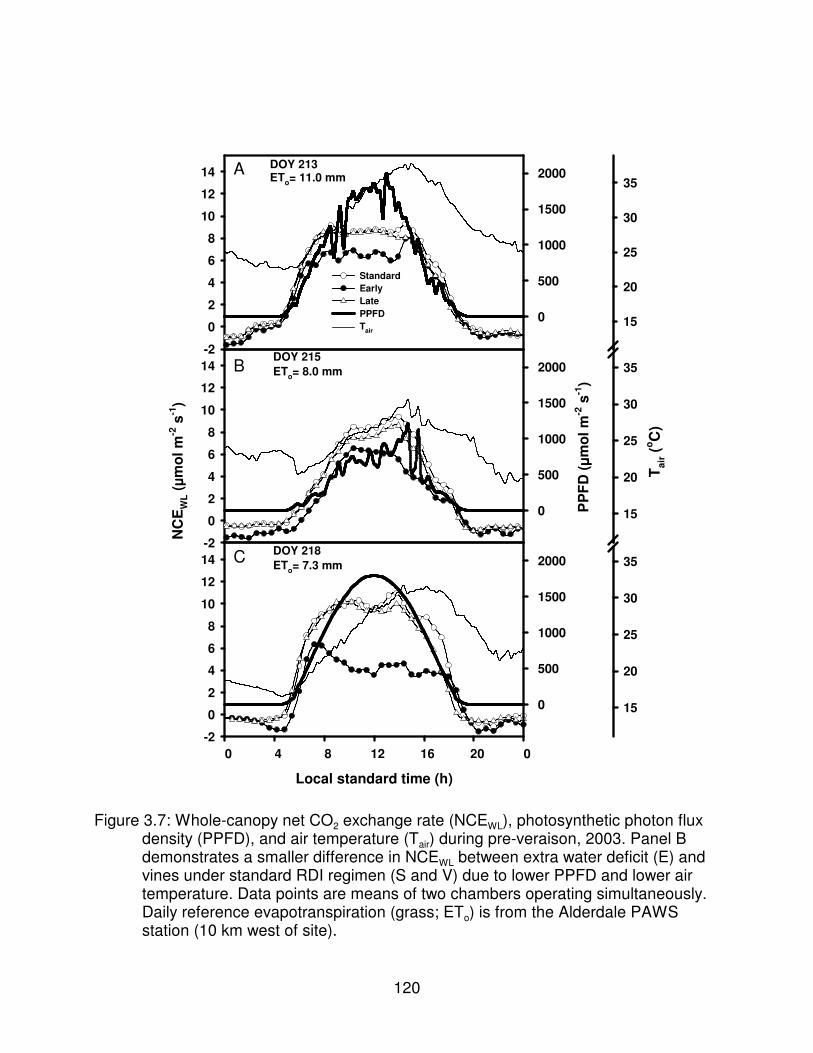
120
DOY 213ETo= 11.0 mm
NC
EW
L ( �� ��
mol
m-2
s-1
)
-2
0
2
4
6
8
10
12
14
PP
FD ( �� ��
mol
m-2
s-1
)
0
500
1000
1500
2000
T air (
o C)
15
20
25
30
35
StandardEarlyLatePPFDTair
DOY 215ETo= 8.0 mm
-2
0
2
4
6
8
10
12
14
0
500
1000
1500
2000
15
20
25
30
35
DOY 218ETo= 7.3 mm
Local standard time (h)
0 4 8 12 16 20 0-2
0
2
4
6
8
10
12
14
0
500
1000
1500
2000
15
20
25
30
35
A
B
C
Figure 3.7: Whole-canopy net CO2 exchange rate (NCEWL), photosynthetic photon fluxdensity (PPFD), and air temperature (Tair) during pre-veraison, 2003. Panel Bdemonstrates a smaller difference in NCEWL between extra water deficit (E) andvines under standard RDI regimen (S and V) due to lower PPFD and lower airtemperature. Data points are means of two chambers operating simultaneously.Daily reference evapotranspiration (grass; ETo) is from the Alderdale PAWSstation (10 km west of site).

121
DOY 234ETo= 3.4 mmPP= 2.3 mm
NC
EW
L ( �� ��
mol
m-2
s-1
)
-2
0
2
4
6
8
10
12
14
PP
FD ( �� ��
mol
m-2
s-1
)
0
500
1000
1500
2000
T air (
o C)
15
20
25
30
35StandardEarlyLatePPFDTair
DOY 238ETo= 8.0 mm
0
500
1000
1500
2000
-2
0
2
4
6
8
10
12
14
15
20
25
30
35
DOY 240ETo= 5.3 mm
Local standard time (h)
0 4 8 12 16 20 0
0
500
1000
1500
2000
-2
0
2
4
6
8
10
12
14
15
20
25
30
35
A
B
C
Figure 3.8: Whole-canopy net CO2 exchange rate (NCEWL), photosynthetic photon fluxdensity (PPFD), and air temperature (Tair) during post-veraison, 2003. V vineswere under extra water deficit, S and E vines were under standard RDI regimen.Data points are means of two chambers operating simultaneously. Dailyreference evapotranspiration (grass; ETo) and precipitation (PP) is from theAlderdale PAWS station (10 km west of site).

122
DOY 256ETo= 3.9 mm
NC
EW
L ( �� ��
mol
m-2
s-1
)
-2
0
2
4
6
8
10
12
14
PP
FD ( �� ��
mol
m-2
s-1
)
0
500
1000
1500
2000
15
20
25
30
35StandardEarlyLatePPFDTair
DOY 259ETo= 5.2 mm
-2
0
2
4
6
8
10
12
14
0
500
1000
1500
2000
T air (
o C)
15
20
25
30
35
DOY 261ETo= 3.3 mm
Local standard time (h)
0 4 8 12 16 20 0-2
0
2
4
6
8
10
12
14
0
500
1000
1500
2000
15
20
25
30
35
A
B
C
Figure 3.9: Whole-canopy net CO2 exchange rate (NCEWL), photosynthetic photon fluxdensity (PPFD), and air temperature (Tair) during pre-harvest, 2003. V were underextra water deficit, S and E vines were under standard RDI regimen. Data pointsare means of two chambers operating simultaneously. Daily referenceevapotranspiration (grass; ETo) is from the Alderdale PAWS station (10 km westof site).

123
DOY 275ETo= 2.9 mm
NC
EW
L ( �� ��
mol
m-2
s-1
)
-2
0
2
4
6
8
10
12
14
PP
FD ( �� ��
mol
m-2
s-1
)
0
500
1000
1500
2000
T air (
o C)
15
20
25
30
35StandardEarlyLatePPFDTair
DOY 278ETo= 2.7 mm
-2
0
2
4
6
8
10
12
14
0
500
1000
1500
2000
15
20
25
30
35
DOY 280ETo= 2.9 mm
Local standard time (h)
0 4 8 12 16 20 0-2
0
2
4
6
8
10
12
14
0
500
1000
1500
2000
15
20
25
30
35
A
B
C
Figure 3.10: Whole-canopy net CO2 exchange rate (NCEWL), photosynthetic photon fluxdensity (PPFD), and air temperature (Tair) during post-harvest, 2003. All vineswere irrigated at FVET. Data points are means of two chambers operatingsimultaneously. Daily reference evapotranspiration (grass; ETo) is from theAlderdale PAWS station (10 km west of site).
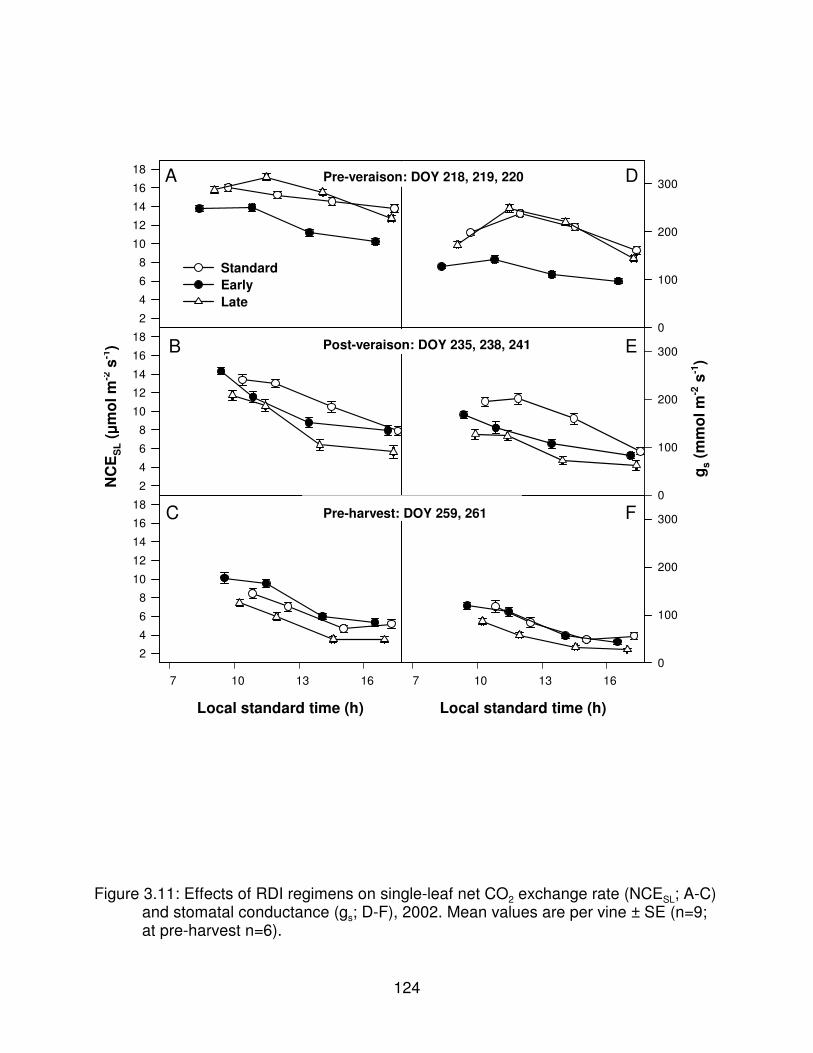
124
2
4
6
8
10
12
14
16
18
StandardEarlyLate
NC
ES
L ( �� ��
mol
m-2
s-1
)
2
4
6
8
10
12
14
16
180
100
200
300
g s (m
mol
m-2
s-1
)
0
100
200
300
Local standard time (h)
7 10 13 16
2
4
6
8
10
12
14
16
18
Local standard time (h)
7 10 13 160
100
200
300
A
B
C
D
E
F
Pre-veraison: DOY 218, 219, 220
Post-veraison: DOY 235, 238, 241
Pre-harvest: DOY 259, 261
Figure 3.11: Effects of RDI regimens on single-leaf net CO2 exchange rate (NCESL; A-C)and stomatal conductance (gs; D-F), 2002. Mean values are per vine ± SE (n=9;at pre-harvest n=6).

125
2
4
6
8
10
12
14
16
18StandardEarlyLate
NC
ES
L ( �� ��
mol
m-2
s-1
)
2
4
6
8
10
12
14
16
180
100
200
300
g s (m
mol
m-2
s-1
)
0
100
200
300
2
4
6
8
10
12
14
16
18
0
100
200
300
2
4
6
8
10
12
14
16
18
0
100
200
300
Local standard time (h)
7 9 11 13 15 17
2
4
6
8
10
12
14
16
18
Local standard time (h)
7 9 11 13 15 170
100
200
300
A
B
C
D
E
F
G
H
I
J
Fruit set: DOY 178, 183
Pre-veraison: DOY 213, 217, 218
Post-veraison: DOY 237, 238, 239
Pre-harvest: DOY 255, 258, 260
Post-harvest: DOY 275, 276, 279
Figure 3.12: Effects of RDI regimens on single-leaf net CO2 exchange rate (NCESL; A-E)and stomatal conductance (gs; F-J), 2003. Mean values are per vine ± SE (n=9; atfruit set n=6).

126
NCESL (����mol m-2 s-1)
0 2 4 6 8 10 12 14 16 18
NC
EW
L ( �� ��
mol
m-2
s-1
)
0
2
4
6
8
10
12
14
16
18
Standard RDIExtra deficit RDI
r2 = 0.38 p<0.001
1:1
Figure 3.13: Relationship between single-leaf (NCESL) and whole-canopy net CO2exchange rate (NCEWL) in 2003. Values are hourly means per vine ± SE (n=3 to5 for NCESL and n=8 to 10 for NCEWL). Data are from all phenological stagesexcept pre-harvest because there was no coincidence in time between NCESLand NCEWL measurements.

127
Irrigation regimens
Standard Early Late
NC
EW
L an
d N
CE
SL
( �� ��m
ol m
-2 s
-1)
4
6
8
10
12
14
4
6
8
10
12
14
Whole-canopySingle-leaf
4
6
8
10
12
14
4
6
8
10
12
14
A
B
C
D
DOY 178
DOY 218
DOY 238
DOY 275
Figure 3.14: Effects of RDI regimens on average whole-canopy (NCEWL) and single-leaf(NCESL) net CO2 exchange rate at coincident DOY and time during 2003. Meansvalues are per vine ± SE.
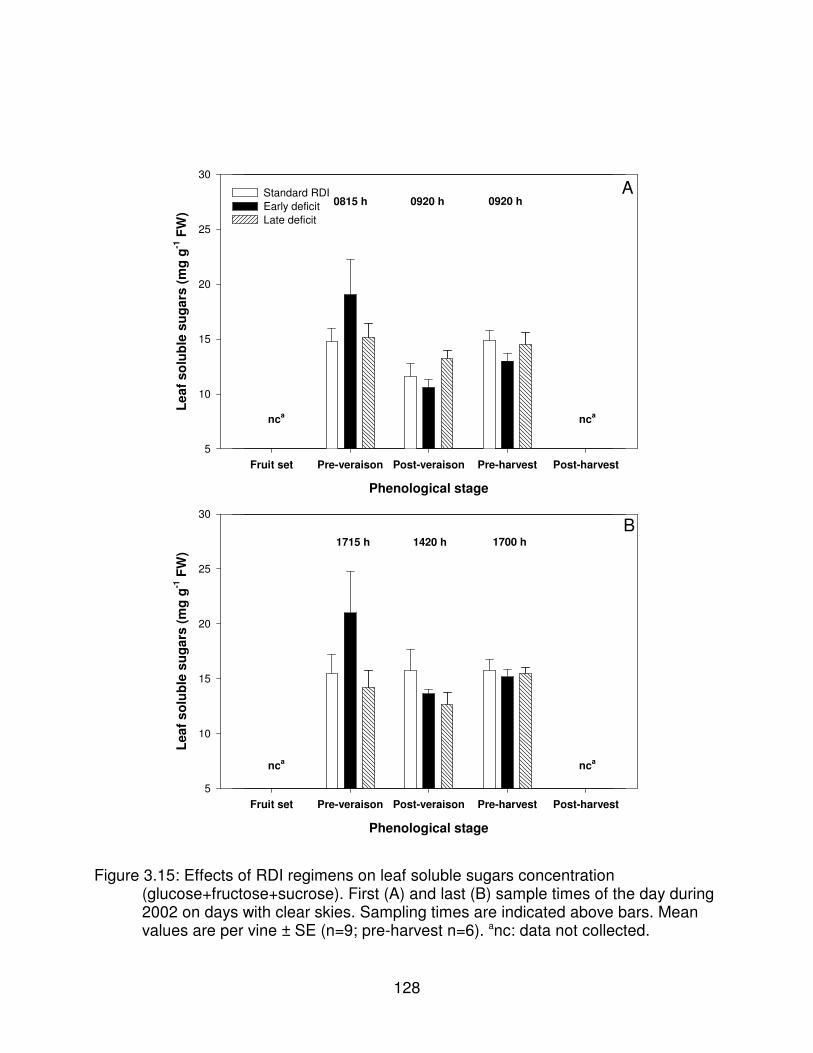
128
1715 h 1420 h 1700 hB
nca
Leaf
sol
uble
sug
ars
(mg
g-1 F
W)
5
10
15
20
25
30
Standard RDIEarly deficitLate deficit
Phenological stage
Fruit set Pre-veraison Post-veraison Pre-harvest Post-harvest
Phenological stage
Fruit set Pre-veraison Post-veraison Pre-harvest Post-harvest
0815 h 0920 h 0920 hA
Leaf
sol
uble
sug
ars
(mg
g-1 F
W)
5
10
15
20
25
30
ncanca
nca
Figure 3.15: Effects of RDI regimens on leaf soluble sugars concentration(glucose+fructose+sucrose). First (A) and last (B) sample times of the day during2002 on days with clear skies. Sampling times are indicated above bars. Meanvalues are per vine ± SE (n=9; pre-harvest n=6). anc: data not collected.

129
B
nca
Leaf
sta
rch
(mg
g-1 F
W)
0
10
20
30
40
Standard RDIEarly deficitLate deficit
Phenological stage
Fruit set Pre-veraison Post-veraison Pre-harvest Post-harvest
Phenological stage
Fruit set Pre-veraison Post-veraison Pre-harvest Post-harvest
ALe
af s
tarc
h (m
g g-1
FW
)
0
10
20
30
40
aa
b
b
ncanca
nca
0815 h 0920 h 0920 h
1715 h 1420 h 1700 h
Figure 3.16: Effects of RDI regimens on leaf starch concentration. First (A) and last (B)sample times of the day during 2002 on days with clear skies. Sampling times areindicated above bars. Mean values are per vine ± SE (n=9; pre-harvest n=6).Bars with different letters are significantly different at p�0.05 by Tukey-Kramer.anc: data not collected.

130
1530 h 1330 h 1230 h 1330 h
B
nca
Leaf
sol
uble
sug
ars
(mg
g-1 F
W)
0
2
4
6
8
10
12
Standard RDIEarly deficitLate deficit
Phenological stage
Fruit set Pre-veraison Post-veraison Pre-harvest Post-harvest
Phenological stage
Fruit set Pre-veraison Post-veraison Pre-harvest Post-harvest
0700 h 0730 h 0700 h 0930 h 0830 hA
Leaf
sol
uble
sug
ars
(mg
g-1 F
W)
0
2
4
6
8
10
12
Figure 3.17: Effects of RDI regimens on leaf soluble sugars concentration(glucose+fructose+sucrose). First (A) and last (B) sample times of the day during2003 on days with clear skies. Sampling times are indicated above bars. Meanvalues are per vine ± SE (n=3). anc: data not collected.
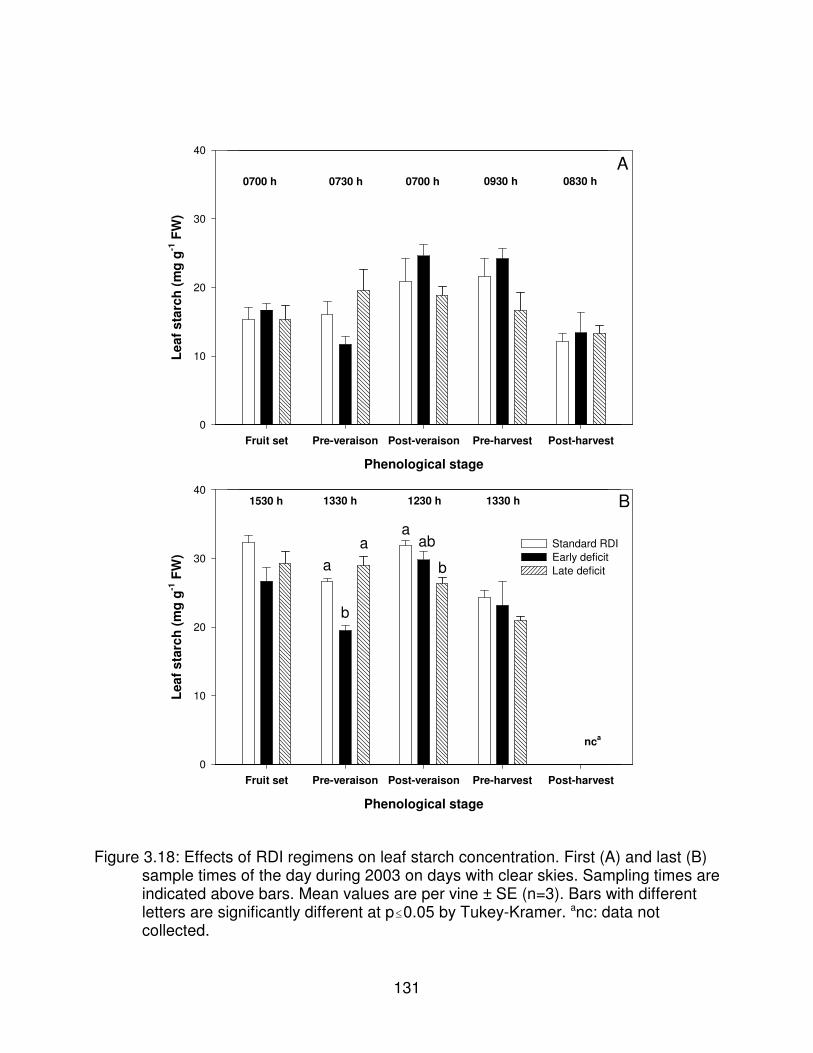
131
1530 h 1330 h 1230 h 1330 h B
nca
Leaf
sta
rch
(mg
g-1 F
W)
0
10
20
30
40
Standard RDIEarly deficitLate deficit
Phenological stage
Fruit set Pre-veraison Post-veraison Pre-harvest Post-harvest
Phenological stage
Fruit set Pre-veraison Post-veraison Pre-harvest Post-harvest
0700 h 0730 h 0700 h 0930 h 0830 hA
Leaf
sta
rch
(mg
g-1 F
W)
0
10
20
30
40
aa
aab
b
b
Figure 3.18: Effects of RDI regimens on leaf starch concentration. First (A) and last (B)sample times of the day during 2003 on days with clear skies. Sampling times areindicated above bars. Mean values are per vine ± SE (n=3). Bars with differentletters are significantly different at p�0.05 by Tukey-Kramer. anc: data notcollected.

132
APPENDIX 3
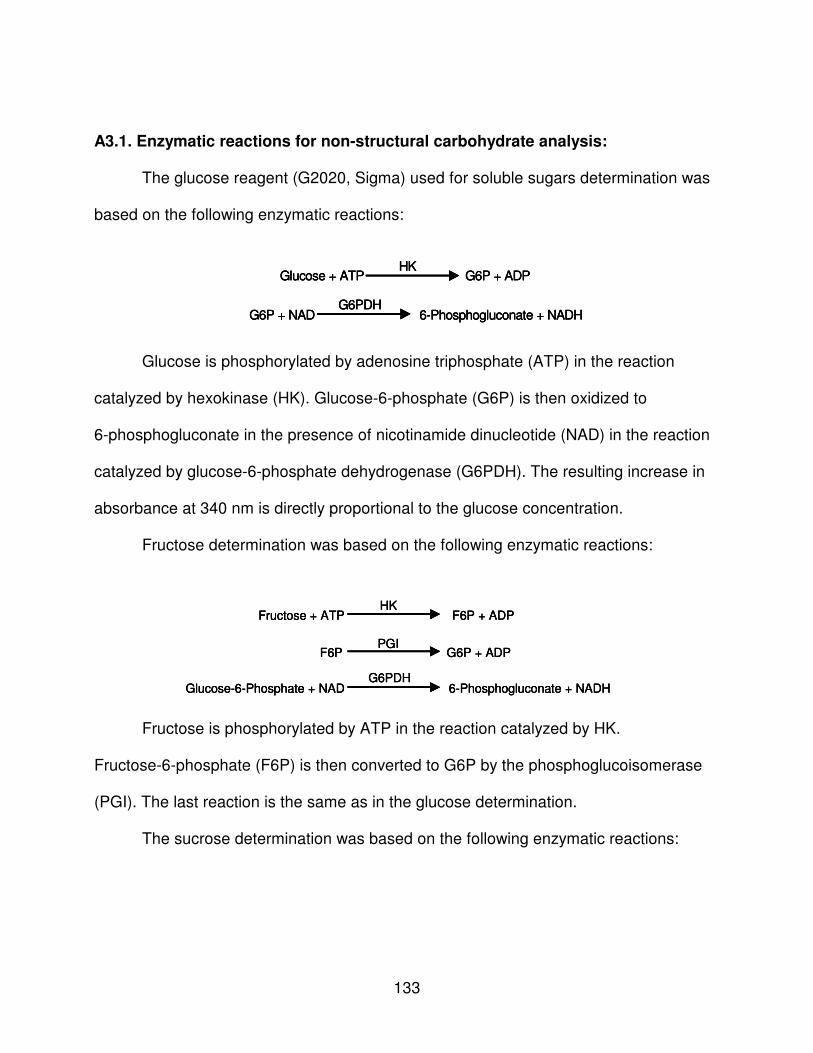
133
G6P + NAD 6-Phosphogluconate + NADHG6PDH
Glucose + ATP G6P + ADPHK
G6P + NAD 6-Phosphogluconate + NADHG6PDH
G6P + NAD 6-Phosphogluconate + NADHG6PDH
Glucose + ATP G6P + ADPHK
Glucose + ATP G6P + ADPHK
Fructose + ATP F6P + ADPHK
F6P G6P + ADPPGI
Glucose-6-Phosphate + NAD 6-Phosphogluconate + NADHG6PDH
Fructose + ATP F6P + ADPHK
Fructose + ATP F6P + ADPHK
F6P G6P + ADPPGI
F6P G6P + ADPPGI
Glucose-6-Phosphate + NAD 6-Phosphogluconate + NADHG6PDH
Glucose-6-Phosphate + NAD 6-Phosphogluconate + NADHG6PDH
A3.1. Enzymatic reactions for non-structural carbohydrate analysis:
The glucose reagent (G2020, Sigma) used for soluble sugars determination was
based on the following enzymatic reactions:
Glucose is phosphorylated by adenosine triphosphate (ATP) in the reaction
catalyzed by hexokinase (HK). Glucose-6-phosphate (G6P) is then oxidized to
6-phosphogluconate in the presence of nicotinamide dinucleotide (NAD) in the reaction
catalyzed by glucose-6-phosphate dehydrogenase (G6PDH). The resulting increase in
absorbance at 340 nm is directly proportional to the glucose concentration.
Fructose determination was based on the following enzymatic reactions:
Fructose is phosphorylated by ATP in the reaction catalyzed by HK.
Fructose-6-phosphate (F6P) is then converted to G6P by the phosphoglucoisomerase
(PGI). The last reaction is the same as in the glucose determination.
The sucrose determination was based on the following enzymatic reactions:

134
Sucrose Glucose + FructoseInvertase
G6P + F6P + 2 NAD 6-Posphogluconate + 2 NADHPGI + G6PDH
Glucose + Fructose + 2 ATP G6P + F6P + 2 ADPHK
Sucrose Glucose + FructoseInvertase
Sucrose Glucose + FructoseInvertase
G6P + F6P + 2 NAD 6-Posphogluconate + 2 NADHPGI + G6PDH
G6P + F6P + 2 NAD 6-Posphogluconate + 2 NADHPGI + G6PDH
Glucose + Fructose + 2 ATP G6P + F6P + 2 ADPHK
Glucose + Fructose + 2 ATP G6P + F6P + 2 ADPHK
Starch + (n-1)H2O n Glucose
Amyloglucosidase+ Amylase
Glucose + ATP G6P + ADPHK
G6P + NAD 6-Phosphogluconate + NADHG6PDH
Starch + (n-1)H2O n Glucose
Amyloglucosidase+ Amylase
Starch + (n-1)H2O n Glucose
Amyloglucosidase+ Amylase
Glucose + ATP G6P + ADPHK
G6P + NAD 6-Phosphogluconate + NADHG6PDH
G6P + NAD 6-Phosphogluconate + NADHG6PDH
F = 44 C
100 DMx
100 CO
27 Cx
1 g FW
50 cmx
10000 cm
1 mx
1 mmol CO
44 mgx
1000 mol
1 mmolx
1 h
3600 s2
2
2
22 µµµµ
Sucrose is cleaved by the invertase into glucose and fructose, then both hexoses
are phosphorylated by ATP and HK. The F6P is converted to G6P in the presence of
PGI, and G6P is oxidized by G6PDH.
Starch determination was based on the following enzymatic reactions:
Starch is first cleaved by amyloglucosidase and amylase into glucose which is
determined as described above.
A3.2. Conversion factor (F) used in equation 3.3
The area of all 8 leaf discs sampled (2.5 cm2) was equal to the area enclosed by
the cuvette used for single-leaf net CO2 exchange measurements. The weight of the 8
leaf discs was about 50 mg with very small variation. To transform non-structural
carbohydrate concentration change (mg g-1 FW h-1) to units of net CO2 exchange
(�mol m2 s-1) the following conversion factor (F) was applied:

135
PAW = ( - ) x sd
100 x %SWFC PWPθ θ
where 44 is % of carbon in dry matter (DM) and 27 is % of C in CO2.
A3.3. Plant available water (PAW):
where �FC and �PWP (%) are the volumetric soil water contents at field capacity (14.6%)
and permanent wilting point (7.1%), respectively, sd is soil depth to be managed (1m
expressed in mm), and %SW is the portion of the total area wetted by drip
emitters (37%).
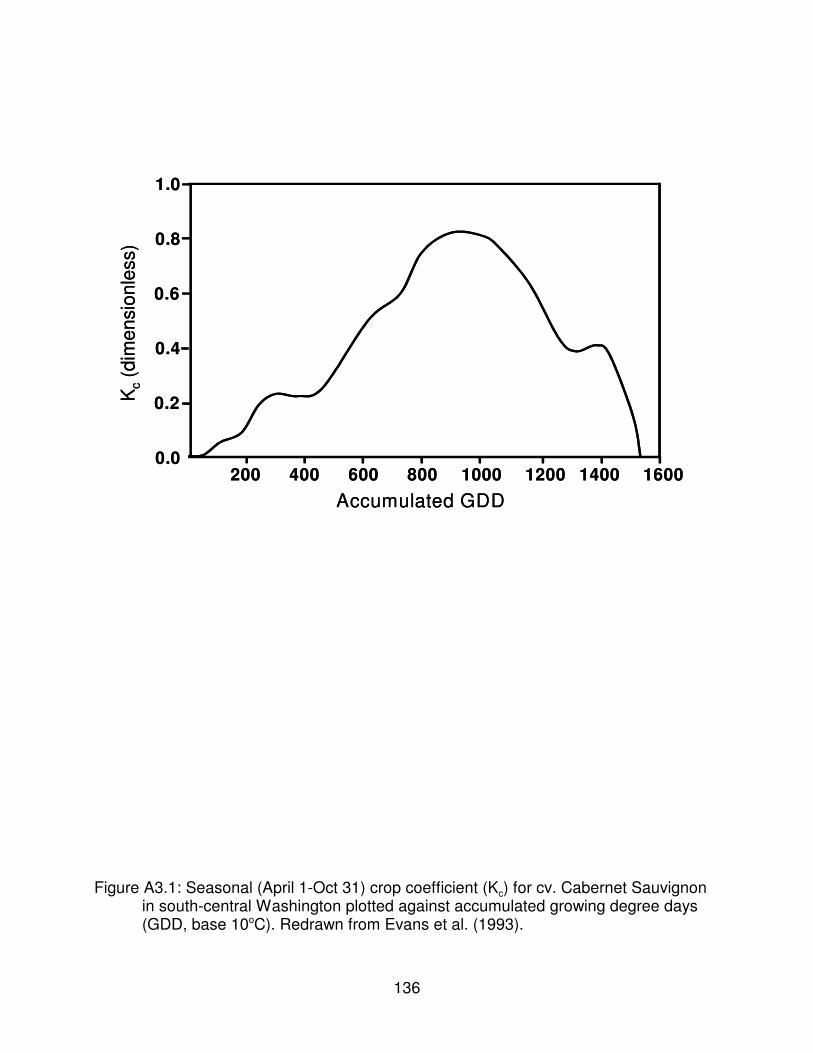
136
Accumulated GDD200 400 600 800 1000 1200 1400 1600
0.0
0.2
0.6
0.4
1.0
0.8
Kc
(dim
ensi
onle
ss)
Accumulated GDD200 400 600 800 1000 1200 1400 1600
0.0
0.2
0.6
0.4
1.0
0.8
Kc
(dim
ensi
onle
ss)
Figure A3.1: Seasonal (April 1-Oct 31) crop coefficient (Kc) for cv. Cabernet Sauvignonin south-central Washington plotted against accumulated growing degree days(GDD, base 10oC). Redrawn from Evans et al. (1993).

137
Number of extractions
0 1 2 3 4
Ext
ract
ed g
luco
se (%
of t
otal
)
0
10
20
30
40
50
60
70
80
90
100
Figure A3.2: Extraction of glucose in relation to number of extractions. Three extractionswere enough to extract more than 95% of glucose present in the leaf tissue.
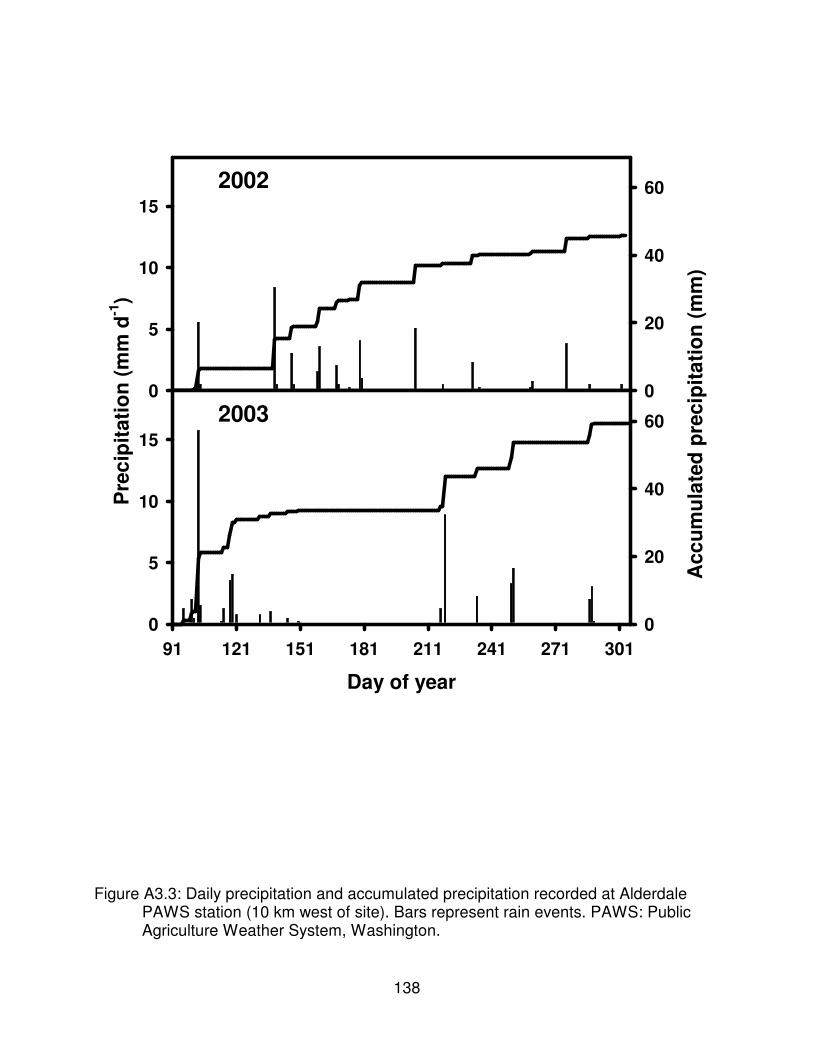
138
Pre
cipi
tatio
n (m
m d
-1)
0
5
10
15
Acc
umul
ated
pre
cipi
tatio
n (m
m)
0
20
40
60
Day of year
91 121 151 181 211 241 271 3010
5
10
15
0
20
40
602003
2002
Figure A3.3: Daily precipitation and accumulated precipitation recorded at AlderdalePAWS station (10 km west of site). Bars represent rain events. PAWS: PublicAgriculture Weather System, Washington.

139
ET o
(mm
d-1
)
0
2
4
6
8
10
12
14
Day of year
91 121 151 181 211 241 271 3010
2
4
6
8
10
12
14 2003
2002
Figure A3.4: Daily ETo (grass) recorded at Alderdale PAWS station (10 km west of site)during 2002 and 2003. PAWS: Public Agriculture Weather System, Washington.

140
Cum
ulat
ive
irri
gatio
n +
prec
ipita
tion
(mm
)
0
100
200
300
400
500
Standard RDIEarly deficitLate deficit
Day of year
1 31 61 91 121 151 181 211 241 271 301 331 3610
100
200
300
400
500 2003
2002
Figure A3.5: Cumulative precipitation recorded at Alderdale PAWS station (10 km westof site) plus cumulative irrigation applied within the RDI regimens at theexperimental site during 2002 and 2003. PAWS: Public Agriculture WeatherSystem, Washington.

141
Irra
dian
ce (M
J m
-2 d-1
)
5
10
15
20
25
30
Day of year
91 101 111 121 131 141 151 161 171 181 191 201 211 221 231 241 251 261 271 281 291 3015
10
15
20
25
30
2002
2003
1 2 3 4 5
1 2 3 4 5
Figure A3.6: Daily irradiance during growing seasons 2002 and 2003 at the AlderdalePAWS station (10 km west of site). Arrow numbers indicate whole-canopy gasexchange measurements: 1-fruit set, 2-pre-veraison, 3-post-veraison, 4-pre-harvest, 5-post-harvest. PAWS: Public Agriculture Weather System, Washington.
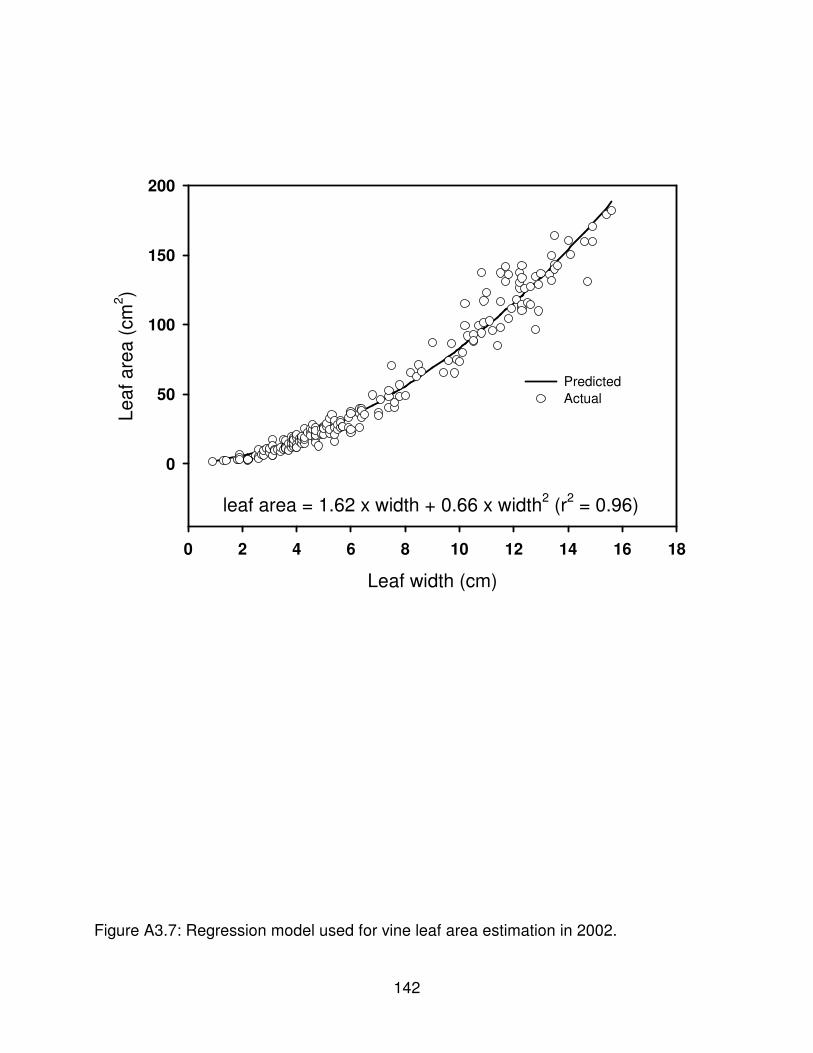
142
Leaf width (cm)
0 2 4 6 8 10 12 14 16 18
Leaf
are
a (c
m2 )
0
50
100
150
200
PredictedActual
leaf area = 1.62 x width + 0.66 x width2 (r2 = 0.96)
Figure A3.7: Regression model used for vine leaf area estimation in 2002.

143
Sho
ot le
af a
rea
(cm
2 )
0
1000
2000
PredictedActual
Shoot length (cm)
0 50 100 150
0
1000
2000
0 50 100 150
fruit set veraison
pre-harvest post-harvest
SLA = 27.89 + 11.20 x SL + 0.038 x SL2
r2 = 0.94 p<0.001
SLA = -152.2 + 15.57 x SL - 0.025 x SL2
r2 = 0.78 p<0.001
SLA = -90.84 + 14.83 x SL - 0.065 x SL2
r2 = 0.88 p<0.001
SLA = -79.91 + 15.82 x SL + 0.006 x SL2
r2 = 0.91 p<0.001
A
C D
B
Figure A3.8: Regression models between shoot length and leaf area per shoot during2003. SLA: shoot leaf area; SL: shoot length. Maximum shoot lengths werearound 150 cm, except during the post-harvest phase, where they did not exceed120 cm because of damage during harvest.
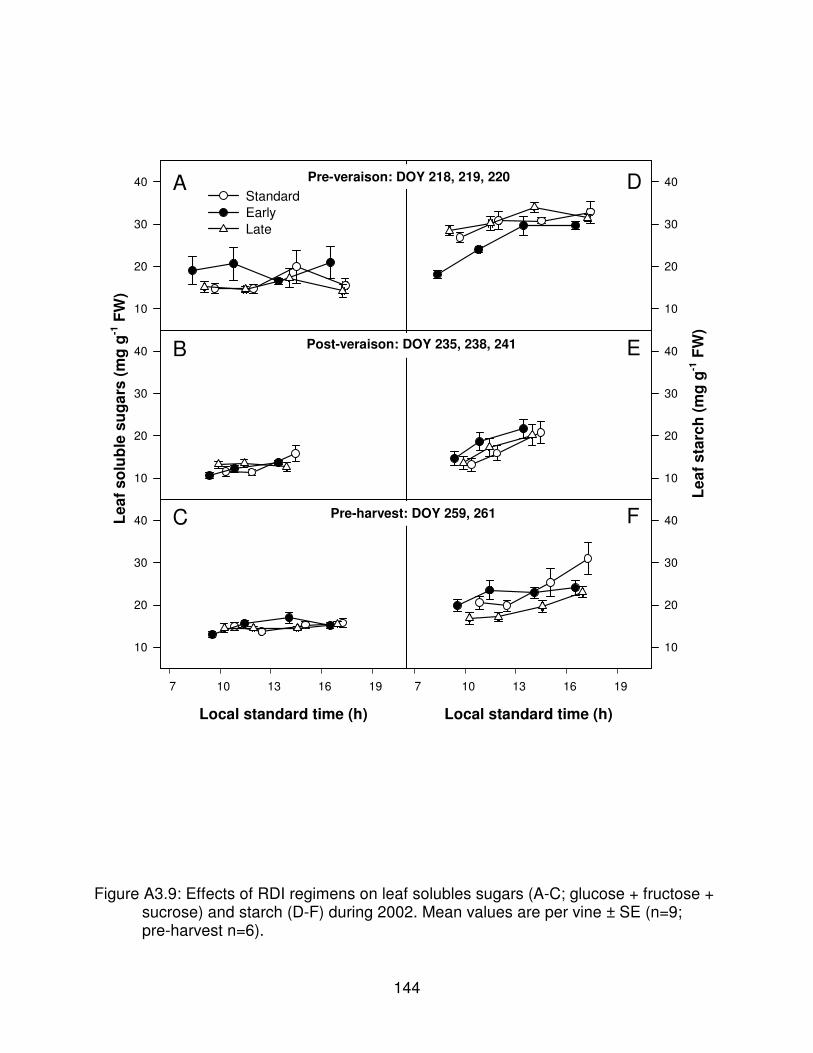
144
Leaf
sol
uble
sug
ars
(mg
g-1 F
W)
10
20
30
40StandardEarlyLate
Leaf
sta
rch
(mg
g-1 F
W)
10
20
30
40
10
20
30
40
Local standard time (h)
7 10 13 16 19
10
20
30
40
10
20
30
40
Local standard time (h)
7 10 13 16 19
10
20
30
40
A
B
C
D
E
F
Pre-veraison: DOY 218, 219, 220
Post-veraison: DOY 235, 238, 241
Pre-harvest: DOY 259, 261
Figure A3.9: Effects of RDI regimens on leaf solubles sugars (A-C; glucose + fructose +sucrose) and starch (D-F) during 2002. Mean values are per vine ± SE (n=9;pre-harvest n=6).

145
CHAPTER 4
GRAPEVINE TRANSPIRATION UNDER REGULATED DEFICIT
IRRIGATION AND ITS RELATION TO NET CO2 EXCHANGE
4.1. Abstract
In an area like eastern Washington, where commercial viticulture depends totally
on irrigation, it is critical to know how much water grapevines transpire and whether it is
possible to conserve water. In general it has been reported that well watered vines have
lower water use efficiencies (WUE) than deficit irrigated vines. For a better
understanding of the relationship between carbon fixation and transpired water, and of
the consequences of imposing water deficits in vineyards, whole-canopy transpiration
needs to be measured. In 2002 and 2003 whole-canopy transpiration was measured by
a six-chamber, mobile field laboratory in field-grown, own-rooted, drip irrigated Vitis
vinifera L. cv. Cabernet Sauvignon vines that were under three regimens of regulated
deficit irrigation (RDI): 1) standard RDI (70% of full vine evapotranspiration, FVET, was
replaced weekly); 2) early deficit (35% of vine FVET was replaced weekly between fruit
set and veraison); and 3) veraison deficit (35% of vine FVET was replaced weekly
between veraison and harvest). Whole-canopy measurements were conducted at fruit
set, pre- and post-veraison, and pre- and post-harvest. Maximum cumulative daily
transpiration was 20 L vine-1 (i.e., 4.1 mm d-1) around veraison. In vines under additional
water deficits daily transpiration was about 50% less than vines under standard deficit.
Variation in net CO2 fixation was mainly explained by canopy conductance at the

146
whole-canopy level and by stomatal conductance at the single-leaf level. No consistent
differences in WUE were observed among RDI regimens. A deficit index that ties
transpiration to CO2 fixation based in the monitoring of air vapor pressure deficit and
transpiration is proposed.
4.2. Introduction
Recent research in vineyard water management may be explained by the
influence of water deficits on grape yield and quality (Araujo et al., 1995; Dry et al.,
2001; Jackson and Lombard, 1993; Roby et al., 2004), and by the desire for
water-saving methods of irrigation (Loveys et al., 1998). Drip irrigation systems and
regulated deficit irrigation (RDI) are among the management practices adopted by
Washington grape growers, where commercial vineyards require irrigation because of
the combination of low annual rainfall during the growing season (e.g., �80 mm,
Prosser, WA) and high evapotranspiration (e.g., >1200 mm). Crop coefficients for
grapevines in this region have been obtained by lysimetry in vineyards maintained at
relatively high soil water contents, and with 100% daily replacement of the water used by
the vines (Evans et al., 1993). Mature vines (Vitis vinifera L.) near Prosser, WA transpire
about 417 mm at yields of 15 Mg ha-1. During the short growing season in this area (158
frost free days), vineyards must be managed to mature fruit, sequester enough
carbohydrate reserves for budbreak and initial shoot growth the following year, and
‘harden off’ the vines before the cold winter. One of the challenges of the Washington
wine industry is to determine the timing and amount of RDI to satisfy both requirements.
Regulated deficit irrigation manages soil water supply to impose predetermined

147
periods of plant or soil water deficit to elicit some desirable responses in plants
(Behboudian and Singh, 2001). Commonly water deficits are imposed by reducing crop
coefficients or soil water content. For example in vineyards managed under RDI,
grapevines are irrigated early in the growing season (ca. April) if winter rains were
insufficient to fill the soil profile to field capacity. Excessive canopy development is
avoided by applying less water than full vine evapotranspiration (FVET) while shoots are
actively growing. Crop load is regulated by pruning and in some cases by cluster
thinning. Also within RDI, additional or more extreme water deficits can be imposed
during the berry growth period to influence yield and grape composition. Reduced yields
due to water deficits have been related to reductions in the degree of initiation of
inflorescence primordia, flower differentiation, maintenance of the reproductive organ,
and to reductions in fruit expansion (Buttrose, 1974; dos Santos et al., 2003; Matthews
and Anderson, 1989; McCarthy, 1997; Poni et al., 1993). Effects of water deficits on
berry composition varied whether deficits were imposed between fruit set and veraison,
or between veraison and harvest (Kennedy et al., 2002; Matthews and Anderson, 1988;
Ojeda et al., 2002), but both have been related to smaller berries (Kennedy et al., 2002;
Matthews and Anderson, 1989; Ojeda et al., 2001) with a concomitant increase in the
skin:pulp ratio in the must (Freeman, 1983; Matthews and Anderson, 1988; Ojeda et al.,
2002). However, changes in anthocyanin concentrations also were reported on the basis
of skin surface area (Esteban et al., 2001; Matthews and Anderson, 1988; Ojeda et al.,
2002; Roby et al., 2004).
More extreme, or additional water deficits applied within RDI will reduce
148
photosynthesis and transpiration, the relative reduction of each influencing water use
efficiency (WUE; ratio of CO2 fixed to H2O transpired). Water deficits imposed on
grapevines have increased (Flexas et al., 1998; Flexas et al., 1999; Iacono et al., 1998),
decreased (Schultz, 2000), or had no effect on WUE (Chaves and Rodrigues, 1987;
Düring, 1987; Medrano et al., 2003). The WUE may vary by time of day and the length
of time during which the water deficit was imposed (de Souza et al., 2003; Downton et
al., 1987). Water use efficiency may increase with water deficits when defined as the
ratio between yield and water applied (dos Santos et al., 2003; du Toit et al., 2003).
In an area like the inland Northwest, USA, where water is limited and commercial
viticulture requires irrigation, it is important to know how much water field-grown
grapevines transpire, and the effects of water deficits on photosynthesis, transpiration,
and WUE. The objective of this experiment was to determine how different timing and
severity of water deficits managed via RDI might reduce vine transpiration and influence
WUE. More severe deficits were imposed during either the early (i.e., fruit set to
veraison) or late (i.e., veraison to harvest) phase of berry growth. The relationship
between transpiration and other physiological variables (e.g., canopy conductance, net
CO2 exchange) was explored as were vine responses to environmental variables (e.g.,
vapor pressure deficit, photosynthetic photon flux density).
4.3. Materials and methods
4.3.1. Site and treatments
The study was conducted during 2002 and 2003 within an experiment that had
been initiated in 1999 in a 4-ha block of Vitis vinifera L., cv. Cabernet Sauvignon, at the

149
Canoe Ridge vineyard of Ste. Michelle Wine Estates (45.88° N, 119.75° W, 125 m
above mean sea level, west of Paterson, WA). Soil, vine spacing, and other vineyard
details are described in chapter 3 (this volume). The vineyard was irrigated once early in
the growing season (ca. April) because winter rains did not fill the soil profile to field
capacity. Between budbreak and fruit set, irrigation was withheld until shoots were 0.9 to
1.2 m long and the rate of shoot growth was minimal. At fruit set, three irrigation
regimens were imposed: standard RDI (S), early deficit (E) and late deficit (V). Full vine
evapotranspiration was calculated from reference evapotranspiration (ETo) using data
collected by the PAWS (Public Agriculture Weather System) weather station at
Alderdale, WA (10 km west of the site) and a crop coefficient for cv. Cabernet
Sauvignon determined in eastern Washington (Evans et al., 1993). Vineyard ET for
standard RDI was estimated as 70% of FVET in 2002 and 60% of FVET in 2003. From
fruit set to veraison, irrigation was applied within S and V to replenish 70% of FVET
weekly (2002; 60% in 2003) with the goal of maintaining soil moisture in the top 1 m at
10% by volume. In the same period, irrigation in E replenished 35% of FVET weekly
(2002; 30% in 2003) with the goal of maintaining soil moisture at 8.3%. From veraison to
harvest, irrigation was applied in S and E plots to replenish weekly 70% (2002) and 60%
(2003) of FVET with the goal of maintaining soil moisture at 10%, while V plots
replenished 35% (2002) and 30% (2003) of FVET weekly with the goal of maintaining
soil moisture at 8.3%. After harvest, all vines were irrigated to replenish 100% of FVET.
4.3.2. Physiological measurements
During 2002 and 2003, whole-canopy transpiration rates (TrWV; mmol m-2 vine-1)
150
were measured during five periods corresponding to different phenological stages
(Appendix figure A4.1): 1) fruit set, before treatment initiation (DOY 183 to 192, 2002,
and DOY 177 to184, 2003); 2) pre-veraison (DOY 217 to 224, 2002, and DOY 212 to
219, 2003); 3) post-veraison (DOY 234 to 240, 2002, and DOY 233 to 241, 2003);
4) pre-harvest (DOY 255 to 261, 2002, and DOY 254 to 262, 2003); and 5) post-harvest
(DOY 278 to 284, 2002, and DOY 274 to 281, 2003). Cumulative transpiration (24 h)
was expressed both per vine (TrWV,d; L H2O d-1 vine-1) and per unit leaf area
(TrWL,d; L H2O d-1 m-2). Leaf area per vine was estimated twice in 2002 and four times in
2003 by indirect protocol (chapter 3, this volume). Six flow-through chambers of an
approximate volume of 8 m3 were used to enclose one vine each to measure
whole-canopy transpiration and net CO2 exchange (Perez Peña and Tarara, 2004).
Details of the gas exchange system are described in chapter 2 (this volume) and details
of whole-canopy measurements are in chapter 3 (this volume). Briefly, two chambers
were run simultaneously in each of the irrigation regimens for 48 h, moved to replicate
vines and the process repeated until a total of 6 vines had been sampled per irrigation
regimen. Data from the central 24 h of the 48-h “run” were used in the analysis. The
system also included global irradiance and photosynthetic photon flux density (PPFD)
sensors that were installed in the vineyard simultaneously with the chambers (described
in chapter 2, this volume). A bulk canopy conductance (gc; Campbell and Norman, 1998)
that includes stomatal (gs) and boundary layer conductances (gb) and is expressed in
mmol m-2 s-1 was calculated as:

151
gTr
VPD Pc
WLa= × (4.1)
VPD e (T ) - es i a= (4.2)
where VPD is vapor pressure deficit of air at the chamber inlet (kPa), and Pa is
atmospheric pressure (kPa). The VPD was calculated as:
where es(Ti) is the saturation vapor pressure (kPa) at the temperature of the air entering
the whole-canopy chamber, and ea is the actual vapor pressure (kPa) of the same air, as
measured by infrared gas analyzer (IRGA; CIRAS - DC, PP Systems, Haverhill, MA). At
the same phenological stages as whole-canopy measurements were conducted,
single-leaf transpiration (TrSL) and stomatal conductance (gs) were measured
simultaneously with single-leaf net CO2 exchange rates (NCESL) on fully expanded
leaves (located about 6 to 8 leaves from the shoot tip) from early morning until late
afternoon, using a portable infrared gas analyzer (IRGA; CIRAS-2, PP Systems,
Haverhill, MA) and leaf cuvette (PLC6(U) - PP Systems). Details of single-leaf
measurements are described in chapter 3 (this volume). Vapor pressure deficit between
leaf and air (VPDla) was calculated from leaf temperature and air water vapor pressure in
the cuvette. Saturation vapor pressure for VPD and VPDla were
calculated according to Buck (1981; see appendix 4).
Whole-canopy daily water use efficiency (WUEWV,d), the ratio between CO2 fixed
and water transpired, was calculated from net CO2 fixed per day per vine (NCEWV,d;
g CO2 vine-1 d-1) and TrWV,d. Whole-canopy daily WUE also was expressed per unit leaf
152
area (WUEWL,d). Leaf-level water use efficiency (WUESL,d) was defined as the ratio
between the daily averages of NCESL and TrSL. Intrinsic WUE (WUEi,WL and WUEi,SL) was
defined as the slope of the relationship between NCEWL and gc (whole-canopy) or NCESL
and gs (single-leaf). The WUEi is used to avoid fluctuations in WUE due to variations in
VPD or VPDla that may change transpiration without changing conductance (Osmond et
al., 1980). Daily sum of degrees (base 10oC; DSD) was calculated as:
where TDSD (oC) is the mean temperature during the 12 min sampling interval and n is
the number of intervals in 24 h. Total PPFD per day (PPFDd; mol m-2 d-1) was also
calculated.
4.3.3. Statistical analysis
Data were analyzed using the SAS statistical package (V8(2); SAS Institute,
Cary, NC). Procedure univariate was used to test for normality and the Brown-Forsythe
test for homogeneity of variance. The general linear model procedure (proc GLM) was
used for the analysis of variance (ANOVA). The Tukey-Kramer method at a significance
level of p�0.05 was used for mean comparisons among irrigation regimens, and the proc
REG procedure was used for simple and multiple regression analysis with the stepwise
option. With the data of all runs of 2003, transpiration was regressed against VPD, gc,
NCE, PPFD, and DSD with simple and multiple stepwise models. Similar relationships
were also explored at the single-leaf level.
4.3.4. Proposed water deficit index (DI) for RDI
DSD (T 10 C)i 1
n
DSDo= −
=Σ (4.3)

153
DI (1 t t
t t) x 100DI sunrise
sunset sunrise
= −−
−(4.4)
An irrigation index based on a plant variable (Tr) and on a meteorological variable
(VPD) is proposed. Both variables should be monitored continuously to calculate their
rates of change during the day. Grower-owned or public weather stations can provide
data for calculation of VPD (i.e., temperature and relative humidity). Transpiration may
be monitored directly by sap flow sensors (Ginestar et al., 1998), or indirectly by diurnal
variation in trunk diameter (Escalona et al., 2002). At the single-leaf level, transpiration
flux is a function of a driving force (VPDla) and a proportionality factor (gs). At the
whole-canopy level, the driving force is considered VPD and the proportionality factor gc
(Equation 4.1). When stomata are completely open, variations in VPD will be paralleled
by variations in transpiration. As stomatal conductance decrease, the stomates exercise
some control over Tr; thus variations in VPD will not be paralleled by variations in Tr.
The time of day at which changes in Tr diverge from changes in VPD (tDI; h) can be
determined graphically, or by a simple program that calculates the ratio between slopes
of both curves (see Appendix 4). Thus DI is calculated by:
where tsunrise and tsunset are local standard times for sunrise and sunset of the
corresponding day. The DI ranges from 0 to 100, with 0 indicating that at all times
between sunrise and sunset, changes in TrWL paralleled changes in VPD. The higher the
DI, the earlier in the morning Tr diverges from VPD, stomatal started to control over
TrWL.

154
4.4. Results
4.4.1. Meteorological and irrigation summary
A climatological summary of the 2002 and 2003 growing seasons was presented
previously (chapter 3, this volume, Table 3.1). Values described here are for the period
April 1 to October 31 (Alderdale PAWS station, 10 km west of site). Briefly, cumulative
growing degree days (GDD) were higher in 2003 (1857oC) than 2002 (1669oC). Rainfall
was 46 mm in 2002 and 59 mm in 2003, while ETo was 1289 mm in 2002 and 1218 in
2003. Maximum daily ETo was 14 mm in 2002 and 11 mm in 2003. The cumulative
irrigation applied after imposition of RDI regimens at fruit set was 295 mm for S, 225 mm
for V, and 185 mm for E during 2002, and 162 mm for S, 122 mm for V, and 92 mm for
E during 2003. The smaller amounts of irrigation applied in 2003 were primarily due to
lower crop coefficients adopted for that year. Soil moisture was kept about targeted
levels within the first meter depth of soil, the managed depth (see appendix 4;
Figure A4.2).
4.4.2. Total daily whole-canopy transpiration (TrWV,d and TrWL,d)
As mentioned in chapter 3 (this volume), because of technical difficulties with the
whole-canopy gas exchange system, illustrative data are presented from the more
comprehensive 2003 field campaign. Measurements at each phenological stage were
conducted during at least 7 days, including days with clear skies (DCS) and those with
clouds (DWC). Because of the weekly irrigation cycle, during each measurement “run”
two to four irrigation sets were delivered that produced some significant interactions
between irrigation treatment and day of measurement (DOM) at pre- and post-veraison

155
(Table 4.1). Thus, data also are presented for DCS to separate the effects of weather
and irrigation frequency.
Maximum TrWV,d occurred around veraison in all plots, with S vines transpiring on
average up to 15 L vine-1 d-1 across all measurement days (Table 4.1). On days with
clear skies, maximum TrWV,d exceeded 20 L vine-1 d-1 in 2003 (Table 4.2), while TrWL,d
exceeded 2 L m-2 d-1 (Table 4.3). Minimum TrWV,d (between �4 and 5 L vine-1 d-1)
occurred in the pre- and post-harvest period, reflecting shorter days and relatively cool
temperatures. At fruit set, before imposition of the additional deficit treatments, there
were no significant differences in TrWV,d among vines. However, vines under more
severe RDI (i.e., E or V) transpired up to 50% less per day than S vines, especially
during the pre- and post-veraison periods. Differences among treatments were less
evident under cloudy skies. Because canopies were of similar size across the irrigation
treatments, trends in TrWL,d were identical to those in TrWV,d. At post-veraison, responses
differed between years. In 2002, vines under additional water deficit (V) transpired more
than vines that had been under additional deficit between fruit set and veraison (E) but
that had been returned to the standard deficit. A similar response was observed in
NCEWV,d (chapter 3, this volume). In 2003, on DCS, vines under additional water deficit
(V) transpired about 57% less than standard RDI vines, whereas vines that had been
under additional water deficit before veraison (E) transpired as much water as S vines.
No differences among regimens were observed in TrWV,d or TrWL,d during the pre- and
post-harvest periods.
4.4.3. Instantaneous transpiration rates: whole-canopy and single-leaf

156
Whole-canopy transpiration rates varied between days with clouds and days with
clear skies at each phenological stage (Figures 4.1, 4.2, 4.3, 4.4, 4.5). Moreover, TrWL
varied by time elapsed since the last irrigation set. Maximum values were above
4 mmol m-2 s-1 at pre- and post-veraison, and generally occurred under higher soil
moisture (i.e., during an irrigation application or immediately after rain; Figures 4.2-A
and 4.3-B). In general TrWL responded rapidly to irrigation. For example between DOY
182 and 183 (before imposition of the irrigation treatments) a total of 10 mm was applied
to S and V plots, but not to E plots, resulting in consistently lower TrWL in E vines that
day (Figure 4.1-C). Similarly on DOY 240 (Figure 4.3-C), the unexpected lower TrWV in E
vines (at this time under standard deficit) was due to an irrigation applied to S and V
vines, but not to E. Daily irrigation variation at other times during the season
(Figure 4.3-C) together with DWC caused significant interactions between treatment and
day of measurement. On DCS, differences between vines under standard RDI and vines
under additional water deficits were apparent at pre-veraison (Figure 4.2-C),
post-verasion (Figure 4.3-B), and pre-harvest (Figure 4.4-A).
Maximum values of TrSL were over 6 mmol m-2 s-1 in 2002 and 2003
(Figures 4.6 and 4.7), and usually higher than those of TrWL. Maximum VPDla reached
about 6 kPa both in 2002 and 2003 before veraison. In general TrSL followed VPDla only
during the first part of the day, diverging in the afternoon, similar to the trend found in the
TrWL data. Differences between S vines and those under additional water deficit that
were observed at the whole-canopy level were also apparent in TrSL measurements. At
fruit set (2003) there were no differences in TrSL among irrigation regimens (Figure

157
4.7-A), but by pre-veraison (2002 and 2003) TrSL were lower in vines under additional
water deficit than in those under standard deficit (Figures 4.6 and 4.7). At post-veraison
there were some differences in the responses between years, reflecting those observed
in TrWL. In 2002, as one might expect, S vines had the highest TrSL, while V vines
transpired the least. Vines under additional deficit between fruit set and veraison but that
had been returned to standard RDI (E), had intermediate values of TrSL. However, in
2003 both S and E vines transpired significantly more than V vines during post-veraison
measurements. In both years, lower values of TrSL were recorded towards the end of the
season (pre- and post-harvest), similar to the trend in TrWL.
4.4.4. Canopy conductance (gc) and vapor pressure deficits (VPD and VPDla)
Applying a more extreme water deficit than standard RDI consistently resulted in
lower gc (Figure 4.8). Although gc recovered overnight, before mid-morning there was a
marked discrepancy between treatments. Maximum gc was �150 mmol m-2 s-1 at
pre-veraison and pre-harvest. Regardless of irrigation regimen, the highest gc were
recorded around mid-morning similar to the trends observed in gs (chapter 3, this
volume), while maximum TrWL usually occurred after midday. In general, VPDla was
higher than VPD because leaf temperature in the cuvette consistently exceeded bulk air
temperature. In 2003, maximum VPD exceeded 4.5 kPa, while VPDla exceeded 6 kPa.
Hysteresis is apparent in the relationship between TrWL and VPD (Figure 4.9) and
its relationship to gc (Figure 4.10). Significantly more water was transpired in the
afternoon than in the morning hours at the same value of gc, a trend consistent across
irrigation treatments and phenological stages. Diurnal hysteresis is due to the two

158
variables that determine Tr changing in opposite directions during the afternoon. At a
given VPD, TrWL in S vines was consistently higher than TrWL in vines under an additional
deficit, especially when ETo was high (pre- and post-veraison). When ET was lower,
differences were not as obvious (pre- and post-harvest). At fruit set, when no additional
deficit was imposed, no differences in Tr were recorded between vines that had been
under additional deficit in previous years and those that had always been under
standard RDI.
4.4.5. Relationships of NCE with other variables, and WUE
Most of the variation in NCEWL was explained by variation in gc (r2�0.86 to 0.96;
p�0.001; Figure 4.11), as was the case at the single-leaf level, where variation in NCESL
was mostly explained by variations in gs (r2�0.76 to 0.93, p<0.001; Figure 4.12). All
irrigation regimens fell on the same regression line, with the additional deficit vines at the
lower end of the scale suggesting that water deficit reduced net carbon fixation through
stomatal limitation. This was confirmed by the apparent response of net CO2 fixation and
canopy conductance to PPFD (Figure 4.13); canopy conductance limited NCEWL in S
vines and those under additional water deficit. However, when atmospheric demand was
low and an irrigation set was applied during the day prior to measurements, NCEWL
reached higher levels and followed more closely the PPFD curve (Figure 3.8-C; chapter
3, this volume). Using 2003 data, NCEWV,d was regressed against TrWV, DSD, and PPFDd
using stepwise procedures. The only variables that remained in the model were TrWV,d
and DSD, while PPFDd was not included (Table 4.4). The slope of the relationship
between NCEWL,d and TrWL,d was similar to that between NCEWV,d and TrWV,d

159
(Figure 4.14), reflecting only small differences in canopy size among irrigation regimens.
All irrigation regimens fall on the regression line, with those under additional water deficit
located on the lower part of the curves. Whether on a per vine or leaf area basis, no
evidence of saturation was observed in the relationship between NCEWV and TrWV or
between NCEWL and TrWL. At the single-leaf level a significant correlation was found
between NCESL and TrSL, but there was some evidence of saturation in NCESL
(Figure 4.14).
No consistent differences were detected in either WUEWV,d, WUEWL,d, or WUESL
between vines under standard water deficit and those under additional water deficit in
2002 or 2003 (Tables 4.5, 4.6 and 4.7). On DCS, the highest WUEW,d were recorded at
pre-veraison in 2002, and after harvest in 2003. Within each phenological stage, no
difference was found in WUEi,WL between vines under standard deficit and those under
additional water deficit (Figure 4.11). Similar results were obtained at the single-leaf
level (Figure 4.12). Figure 4.15 shows an example of WUEWL calculated at different
times of the day (0800 h and 1600 h), that will help to explain in the discussion, a
probable reason of why sometimes WUE found in different irrigation experiments
differed. Across all irrigation regimens, WUE was higher towards the end of the season
due to lower atmospheric demand and lower temperatures.
4.4.6. Proposed water deficit index (DI): an example
Values of of NCEWL, TrWL, VPD, gc on a DCS (DOY 218, 2003) for one vine under
standard deficit and one under additional deficit (Figure 4.15) were fitted to a 10th order
polynomial (Figure 4.16), and used to calculate the slopes of TrWL and VPD
160
(Figure 4.17). The tDI was determined and DI calculated. On DOY 218, tsunrise was 0447 h
and tsunset 1922 h. In the vine under standard deficit, tDI was 1133 h and DI was 53, while
in the vine under additional water deficit, tDI was 0625 h and DI was 88. Values of DI
were also calculated for a DWC (DOY 215, 2003) following the same method described
above for one vine under standard deficit and one under additional deficit (Figures 4.18
and 4.19). In the vine under standard deficit DI was 41 and in that under additional
deficit DI was 71.
4.5. Discussion
Vines under additional water deficit transpired less than those under standard
RDI for the entire berry growth period, at both whole-canopy and single-leaf levels.
Transpiration reflected the irrigation regimen and the timing of irrigation events within the
weekly cycle. Vines responded rapidly to irrigation, increasing TrWV within 24 h of an
irrigation set. The response to soil drying occurred over 2 to 3 days. Some studies report
only crop coefficients or weekly irrigation applied without specifying how the application
was temporally distributed (McCarthy and Coombe, 1985; Schultz, 2000). For a given
amount of irrigation, its distribution during a week can change the response of TrWV and
NCEWV (chapter 3, this volume), as observed in this study. Given sandy soil, low
incidence of weeds, and small surface area wetted by the drip emitters, one would
anticipate very low evaporation from the soil surface. Thus ET was dominated by TrWV.
Whole-canopy transpiration rates recorded in this experiment were comparable to
other results (e.g., 5 mmol m-2 s-1, Katerji et al., 1994; 6.5 mmol m-2 s-1, Ollat and
Tandonnet, 1999). In general, transpiration rates recorded by single-leaf measurements
161
were higher than those measured at the whole-canopy level, confirming the difficulty of
scaling up from single-leaf to whole-canopy transpiration. Moreover, VPDla values were
higher than those of bulk VPD. Whole-canopy measurements integrate sunlit and
shaded leaves, the latter having lower temperatures and TrSL (Schultz, 1993; Schultz et
al., 1996), whereas single-leaf measurements were taken on sun exposed leaves at
higher temperatures and thus higher VPDla. For better estimation of whole-canopy
transpiration with single-leaf measurements, leaves in different canopy positions should
be included in the sample.
Reductions in CO2 fixation in both additional deficits (E and V) were associated
with reductions in stomatal and canopy conductances, confirmed by the close
relationship between NCESL and gs that has been observed elsewhere (Chaumont et al.,
1997; Winkel and Rambal, 1993), and between NCEWL and gc. These results are in
agreement with other of field-grown vines, where stomatal limitation seems to be more
important than non-stomatal limitation of NCE (Escalona et al., 1999; Flexas et al., 2002)
and no evidence of photoinhibition was observed (Chaumont et al., 1997; Chaves, 1991;
Delgado et al., 1995; Escalona et al., 1999; Flexas et al., 1998; Flexas et al., 1999;
Kliewer et al., 1983). The smaller crop coefficients and the lower soil moisture targeted
in vines under water deficit in the current experiment compared to vines under FVET
could have generated hydraulic and chemical root signals, like reduced root water
potential (van Zyl, 1987; Williams and Matthews, 1990), increased xylem sap pH (Davies
et al., 2002; Wilkinson and Davies, 1997; Wilkinson and Davies, 2002) or increased
absicic acid (ABA), all known to decrease stomatal conductance (Correia et al., 1995;

162
Davies and Zhang, 1991; Hartung et al., 2002; Loveys and Düring, 1984; Murillo de
Alburquerque and Carbonneau, 1997; Peterlunger et al., 2000; Sauter et al., 2001; Stoll
et al., 2000). However, direct application of ABA did not inhibited photosynthesis
(Downton et al., 1988; Kriedemann et al., 1975). Reduction of NCE in field-grown
grapevines seems to start with a reduction in stomatal conductance due to lower soil
moisture, and subsequently, as a consequence of a reduction in CO2 concentration
inside the leaf, an acclimation of the photosynthetic machinery to the lower internal CO2
concentration (Chaves et al., 2002; Medrano et al., 2002b). Previous research into the
so-called ‘afternoon depression’ of photosynthesis in grapevines suggested the
possibility of non-stomatal inhibition (Correia et al., 1990; Downton et al., 1987; Düring,
1991), but non-stomatal effects (i.e., light stress, reduction in Calvin cycle enzyme
activity) may appear when water deficits are more severe (Escalona et al., 1999; Flexas
et al., 1998) or rapidly induced (Flexas et al., 1998; Flexas et al., 1999; Flexas et al.,
1999), situations that are common in potted plants, but rare in irrigated field-grown
vines. Although leaf and xylem water potential values may seem very low (R.
Smithyman, unpublished data; see appendix 4, Figure A4.3) we did not record in any of
our single-leaf measurements complete stomatal closure. On the contrary, gs generally
exceeded 50 mmol m-2 s-1.
No consistent differences in WUE were found between vines under standard
deficit with those under additional water deficit as observed elsewhere (Chaves and
Rodrigues, 1987; Medrano et al., 2003), although other literature reports increases in
WUE under additional water deficit (Downton et al., 1987; Ollat and Tandonnet, 1999;

163
Schultz, 2000; Williams et al., 1994), and still others describe increases in WUE with
additional irrigation (Schultz, 2000). Reasons for the inconsistency of the results are
differences in experimental conditions and time at which measurements were taken.
Comparison of transpiration between different experiments is not easy, especially with
large differences between this experiment an others in VPD (Intrieri et al., 1998), light
(Boyer et al., 1997), irrigation (Hepner et al., 1985), and canopy size (Edson et al.,
1993). The time at which measurements are recorded during the day and the variation in
plant-available water during a given measurement period can bias results if plots are not
irrigated simultaneously. For example (Figure 4.15) on DOY 218, 2003, instantaneous
WUE at 0800 h was about 1% higher in S vines than in those under additional deficit,
whereas at 1600 h, vines under the additional deficit had an instantaneous WUE 42%
higher than the S vines. However, integrated over the whole day, there was no
difference on average between irrigation regimens. Measurements recorded only during
the afternoon would have suggested higher WUESL with additional water deficit, while
integrating continuous measurements shows instead that the observed reduction in TrWL
apparently occurred at the expense of CO2 fixed.
Plants under well-watered conditions will have lower WUE than those under some
water deficit, especially under high ET. In this experiment reductions in transpiration
were accompanied by reductions in CO2 fixation. Under standard RDI vines are under
some degree of water deficit, and in this study stomata apparently regulated
transpiration during most of the day. No differences were found in WUEi,W or in WUEi,SL
between vines under standard deficit or under additional water deficit, in agreement with

164
previous research where WUEi,SL differed only between varieties of different geographic
origin, or within a given variety when gs was below 50 mmol m-2 s-1 (de Souza et al.,
2003; Escalona et al., 1999). Others found even higher WUEi,SL in irrigated vines,
explained by higher leaf temperatures in deficit irrigated vines which increased VPDla
and thus transpiration per unit CO2 fixed (Schultz, 2000). The WUEi ties CO2 fixation and
stomatal aperture, while WUE ties CO2 fixation to transpiration. Mesophyll
photosynthesis and stomatal aperture have been reported to be tightly correlated
(Correia et al., 1990; Flexas et al., 1999; Flexas et al., 1999; Jacobs et al., 1996; Jarvis
and Davies, 1998). At the beginning of the day, stomatal aperture has been related to an
increase in turgor pressure due to the accumulation of K ions inside the guard cells,
while later in the day that turgor pressure is maintained by accumulation of sucrose, the
connection between photosynthesis and stomatal conductance, thus transpiration
(Talbott and Zeiger, 1998). Stomatal closure at the end of the day follows sucrose
depletion in the guard cells.
Vines fix CO2 that is used to manufacture organic phosphates, precursors of all
components for growth and development, including sugars and secondary metabolites in
the fruit. The proposed water deficit index (DI) intends to tie irrigation management to
CO2 fixation by detecting the time at which stomata exert control over rates of CO2
fixation, instead of tying irrigation management to Tr or ET. This constitutes an
improvement over crop coefficients or soil moisture content as indices for irrigation
because a variable related to the vine physiology (gc) is included in the index and
because most of the variation in CO2 fixation may be explained by gc. Although leaf or
165
xylem water potential measured at predawn or midday has been used to estimate plant
water status (Williams and Araujo, 2002), the measurement is on a single leaf or at best
a few leaves. At the single-leaf level, some photosynthetic parameters (i.e., electron
transport rate, carboxylation efficiency) were more strongly correlated with stomatal
conductance than with leaf water status (Medrano et al., 2002a; Medrano et al., 2002b).
One of the advantages of DI is that it is not necessary to know the exact amount of
water transpired to calculate and use it. Nonetheless, one still must monitor continuously
TrWV or a surrogate indicator of Tr. It is the time of the day at which the slope of TrWL
becomes smaller than the slope of the VPD curve that is important. Even the simplest
meteorological station provides the necessary data to calculate VPD (i.e., temperature
and relative humidity). Values of DI may be vineyard-specific and may vary within
phenological stage and latitude. The inclusion of daylength as a variable in the
calculation of DI suggests that although tDI - tsunrise could be the same in two different
regions, longer days will result in higher DI. A possible reason is because more time will
pass after tDI in the region with longer days than in that with shorter days. The DI will not
indicate the amount of irrigation to apply like most plant based indices (Jones, 2004), but
either soil moisture could be monitored, soil water balance based on irrigation and
evapotranspiration could be calculated, or fixed irrigation sets could be applied.
4.6. Conclusion
Additional water deficits beyond standard RDI imposed during the berry growth
period reduced grapevine transpiration. Maximum values of transpiration of about
20 L vine-1 d-1 were recorded around veraison. Variation in canopy conductance

166
explained most of the variation in NCEWV. Likewise, variations in gs explained most of the
variation in NCESL, in both vines under RDI and those under additional water deficits.
During most of the measurements, WUE and WUEi did not differ among irrigation
regimens, whether measured at whole-canopy or single-leaf level. Under the water
deficits applied here (0.7 and 0.35 of FVET), light does not seem to limit NCEWV on DCS.
Water savings from the reductions in transpiration were at the expense of reductions in
CO2 fixation. In an area like eastern Washington that has a short growing season and a
short period between harvest and leaf fall to replenish carbohydrate reserves, the water
savings achieved by imposing additional water deficits should take into account this
reduction in CO2 fixation. The proposed water deficit index (DI) for use under RDI, based
on a plant (gc) and a meteorological variable (VPD), ties irrigation management to CO2
fixation, which other indices do not. But the index requires more work and more data
analysis, plus development of site-specific, variety-specific, and season-specific
relationships, as well as other proposed plant based indicators for irrigation.

167
4.7. References
Araujo, F.; Williams, L. E.; Matthews, M. A.; 1995: A comparative study of young"Thopmpson seedles" grapevines (Vitis vinifera L.) under drip and furrowirrigation. II. Growth, water use efficiency. Scientia Horticulturae 60, 251-265.
Behboudian, M. H. and Singh, Z.; 2001: Water relations and irrigation scheduling ingrapevine. Horticultural Reviews 27, 189-225.
Boyer, J. S.; Wong, S. C.; Farquhar, G. D.; 1997: CO2 and water vapor exchange acrossleaf cuticule (epidermis) at various water potentials. Plant Physiology 114, 185-191.
Buck, A. L.; 1981: New equations for computing vapor pressure and enhancementfactors. Journal of Applied Meteorology 20, 1527-1532.
Buttrose, M. S.; 1974: Fruitfulness in grapevines: effects of water stress. Vitis 12, 299-305.
Campbell, G. S. and Norman, J. M.; 1998: Heat and mass transport, p. 77-85. In: Anintroduction to environmental biophysiscs, 2nd Ed. Springer-Verlag New York, Inc.
Chaumont, M.; Osorio, M. L.; Chaves, M. M.; Vanacker, H.; Morot-Gaudry, J. F.; 1997:The absence of photoinhibition during mid-morning depression of photosynthesisin Vitis vinifera grown in semi-arid and temperate climates. Journal of PlantPhysiology 150, 743-751.
Chaves, M. M.; 1991: Effects of water deficits on carbon assimilation. Journal ofExperimental Botany 42, 1-16.
Chaves, M. M.; Pereira, J. S.; Maroco, J.; Rodrigues, M. L.; Ricardo, C. P. P.; Osorio, M.L.; Carvalho, I.; Faria, T.; Pinheiro, C.; 2002: How plants cope with water stress inthe field. Photosynthesis and growth. Annals of Botany 89, 907-916.
Chaves, M. M. and Rodrigues, M. L.; 1987: Photosynthesis and water relations ofgrapevines growing in Portugal - response to environmental factors, p. 379-390.In: Plant response to Stress. John D. Tenhunen, E. M. Catarino, and O. L. Lange(Eds.). Springer-Verlag Berlin Heidelberg.
Correia, M. J.; Chaves, M. M. C.; Pereira, J. S.; 1990: Afternoon depression inphotosynthesis in grapevine leaves - evidence for a high light stress effect.Journal of Experimental Botany 41, 417-426.
Correia, M. J.; Pereira, J. S.; Chaves, M. M.; Rodrigues, M. L.; Pacheco, C. A.; 1995:

168
ABA xylem concentration determine maximum daily leaf conductance of field-grown Vitis vinifera L. plants. Plant, Cell and Environment 18, 511-521.
Davies, W. J.; Wilkinson, S.; Loveys, B.; 2002: Stomatal control by chemical signallingand the exploitation of this mechanism to increase water use efficiency inagriculture. New Phytologist 153, 449-460.
Davies, W. J. and Zhang, J.; 1991: Root signals and the regulation of growth anddevelopment of plants in drying soil. Annual Review of Plant Physiology and PlantMolecular Biology 42, 55-76.
de Souza, C. R.; Maroco, J. P.; dos Santos, T. P.; Rodrigues, M. L.; Lopes, C. P.;Pereira, J. S.; Chaves, M. M.; 2003: Partial rootzone drying: regulation ofstomatal aperture and carbon assimilation in field-grown grapevines (Vitis viniferacv. Moscatel). Functional Plant Biology 30, 653-662.
Delgado, E.; Vadell, J.; Aguilo, F.; Escalona, J. M.; Medrano, H.; 1995: Irrigation andgrapevine photosynthesis, p. 693-696. In: Photosynthesis: from Light toBiosphere. P. Mathis (Ed.). Kluwer Academic Publishers 4.
dos Santos, T. P.; Lopes, C.; Rodrigues, M. L.; de Souza, C. R.; Maroco, J.; Pereira, J.S.; Silva, J. R.; Chaves, M. M.; 2003: Partial root zone drying: effects on growthand fruit quality of field-grown grapevines (Vitis vinifera). Functional Plant Biology30, 663-671.
Downton, W. J. S.; Grant, W. J. R.; Loveys, B. R.; 1987: Diurnal changes in thephotosynthesis of field-grown grape vines. New Phytologist 105, 71-80.
Downton, W. J. S.; Loveys, B. R.; Grant, W. J. R.; 1988: Stomatal closure fully accountsfor the inhibition of photosynthesis by abscisic acid. New Phytologist 108, 263-266.
Dry, P. R.; Loveys, B. R.; McCarthy, M. G.; Stoll, M.; 2001: Strategic irrigationmanagement in australian vineyards. Journal International de Sciences de laVigne et du Vin 35, 129-139.
du Toit, P. G.; Dry, P. R.; Loveys, B. R.; 2003: A preliminary investigation on partialrootzone drying (PRD) effects on grapevine performance, nitrogen assimilationand berry composition. South African Journal of Enology and Viticulture 24, 43-54.
Düring, H.; 1987: Stomatal response to alterations of soil and air humidity in grapevines.Vitis 26, 9-18.

169
Düring, H.; 1991: Determination of the photosynthetic capacity of grapevine leaves. Vitis30, 49-56.
Edson, C. E.; Howell, G. S.; Flore, J. A.; 1993: Influence of crop load on photosynthesisand dry matter partitioning of Seyval Grapevines I. Single leaf and whole vineresponse pre- and post-harvest. American Journal of Enology and Viticulture 44,139-147.
Escalona, J.; Flexas, J.; Medrano, H.; 2002: Drought effects on water flow,photosynthesis and growth of potted grapevines. Vitis 41, 57-62.
Escalona, J. M.; Flexas, J.; Medrano, H.; 1999: Stomatal and non-stomatal limitations ofphotosynthesis under water stress in field-grown grapevines. Australian Journalof Plant Physiology 26, 421-433.
Esteban, M. A.; Villanueva, M. J.; Lissarrague, J. R.; 2001: Effect of irrigation onchanges in the anthocyanin composition of the skin of cv. Tempranillo (Vitisvinifera L) grape berries during ripening. Journal of the Science of Food andAgriculture 81, 409-420.
Evans, R. G.; Spayd, S. E.; Wample, R. L.; Kroeger, M. W.; Mahan, M. O.; 1993: Wateruse of Vitis vinifera grapes in Washington. Agricultural Water Management 23,109-124.
Flexas, J.; Bota, J.; Escalona, J. M.; Sampol, B.; Medrano, H.; 2002: Effects of droughton photosynthesis in grapevines under field conditions: an evaluation of stomataland mesophyll limitations. Functional Plant Biology 29, 461-471.
Flexas, J.; Escalona, J. M.; Medrano, H.; 1998: Down-regulation of photosynthesis bydrought under field conditions in grapevine leaves. Australian Journal of PlantPhysiology 25, 893-900.
Flexas, J.; Escalona, J. M.; Medrano, H.; 1999: Water stress induces different levels ofphotosynthesis and electron transport rate regulation in grapevines. Plant, Celland Environment 22, 39-48.
Freeman, B. M.; 1983: Effects of irrigation and pruning of Shiraz grapevines onsubsequent red wine pigments. American Journal of Enology and Viticulture 34,23-26.
Ginestar, C.; Eastham, J.; Gray, S.; Iland, P.; 1998: Use of Sap Flow sensors toschedule vineyard irrigation. I Effects of Postveraison Water deficits on waterrelations, vine growth, and yield of Shiraz. American Journal of Enology andViticulture 49, 413-420.
170
Hartung, W.; Sauter, A.; Hose, E.; 2002: Abscisic acid in the xylem: where does it comefrom, where does it go to? Journal of Experimental Botany 53, 27-32.
Hepner, Y.; Bravdo, B.; Loinger, C.; Cohen, S.; Tabacman, H.; 1985: Effect of dripirrigation schedules on growth, yield, must composition and wine quality CabernetSauvignon. American Journal of Enology and Viticulture 36, 77-85.
Iacono, F.; Buccella, A.; Peterlunger, E.; 1998: Water stress and rootstock influence onleaf gas exchange of grafted and ungrafted grapevines. Scientiae Horticulturae 75, 27-39.
Intrieri, C.; Poni, S.; Rebucci, B.; Magnanini, E.; 1998: Row orientation effects on wholecanopy gas exchange of potted and field grown grapevines. Vitis 37, 147-154.
Jackson, D. I. and Lombard, P. B.; 1993: Environmental and management practicesaffecting grape composition and wine quality - A review. American Journal ofEnology and Viticulture 44, 409-430.
Jacobs, C. M. J.; van den Hurk, B. J. J. M.; de Bruin, H. A. R.; 1996: Stomatal behaviourand photosynthetic rate of unstressed grapevines in semi-arid conditions.Agricultural and Forest Meteorology 80, 111-134.
Jarvis, A. J. and Davies, W. J.; 1998: The coupled response of stomatal conductance tophotosynthesis and transpiration. Journal of Experimental Botany 49, 399-406.
Jones, H. G.; 2004: Irrigation scheduling: advantages and pitfalls of plant-basedmethods. Journal of Experimental Botany 55, 2427-2436.
Katerji, N.; Daudet, F. A.; Carbonneau, A.; Ollat, N.; 1994: Etude à l'echelle de la planteentière du fonctionnement hydrique et photosynthètique de la vigne: comparaisondes systèmes de conduite traditionnel et en Lyre. Vitis 33, 197-203.
Kennedy, J. A.; Matthews, M. A.; Waterhouse, A. L.; 2002: Effect of maturity and vinewater status on grape skin and wine flavonoids. American Journal of Enology andViticulture 53, 268-274.
Kliewer, W. M.; Freeman, B.; Hossom, C.; 1983: Effect of irrigation, crop level andpotassium fertilization on Carignane vines. I. Degree of water stress and effect ongrowth and yield. American Journal of Enology and Viticulture 34, 186-196.
Kriedemann, P. E.; Loveys, B. R.; Downtown, W. J. S.; 1975: Internal control of stomataphysiology and photosynthesis. II. Photosynthetic response to phaseic acid.Australian Journal of Plant Physiology 2, 553-567.
171
Loveys, B.; Stoll, M.; Dry, P.; McCarthy, M.; 1998: Partial rootzone drying stimulatesstress responses in grapevine to improve water use efficiency while maintainingcrop yield and quality. The Australian Grapegrower and Winemaker 414, 108-113.
Loveys, B. R. and Düring, H.; 1984: Diurnal changes in water relations and abscisic acidin field-grown Vitis vinifera cultivars. II. Abscisic acid changes under semi-aridconditions. New Phytologist 97, 37-47.
Matthews, M. A. and Anderson, M. M.; 1988: Fruit ripening in Vitis vinifera L.:Responses to seasonal water deficits. American Journal of Enology andViticulture 39, 313-320.
Matthews, M. A. and Anderson, M. M.; 1989: Reproductive development in grape (Vitisvinifera L.). Responses to seasonal water deficits. American Journal of Enologyand Viticulture 40, 52-60.
McCarthy, M. G.; 1997: The effects of transient water deficit on berry development of cv.Shiraz (Vitis vinifera L.). Australian Journal of Grape and Wine Research 3, 102-108.
McCarthy, M. G. and Coombe, B. G.; 1985: Water status and winegrape quality. ActaHorticulturae 171, 447-462.
Medrano, H.; Escalona, J. M.; Bota, J.; Gulias, J.; Flexas, J.; 2002a: Regulation ofphotosynthesis of C3 plants in response to progressive drought: stomatalconductance as a reference parameter. Annals of Botany 89, 895-905.
Medrano, H.; Bota, J.; Abadía, A.; Sampol, B.; Escalona, J. M.; Flexas, J.; 2002b:Effects of drought on light-energy dissipation mechanisms in high-light-acclimated, field-grown grapevines. Functional Plant Biology 29, 1197-1207.
Medrano, H.; Escalona. J. M.; Cifre, J.; Bota, J.; Flexas, J.; 2003: A ten-year study onthe physiology of two Spanish grapevine cultivars under field conditions: effects ofwater availability from leaf photosynthesis to grape yield and quality. FunctionalPlant Biology 30, 607-619.
Murillo de Alburquerque, R. and Carbonneau, A.; 1997: Trocas gasosas em Vitis viniferasob regime de estresse hídrico. III. Ácido abscísico e comportamento varietal.Pesquisa Agropecuaria Brasileira 32, 579-584.
Ojeda, H.; Anadary, C.; Kraeva, E.; Carbonneau, A.; Deloire, A.; 2002 : Influence of pre-and postveraison water deficit on synthesis and concentration of skin phenoliccompounds during berry growth of Vitis vinifera cv. Shiraz. American Journal of

172
Enology and Viticulture 53, 261-267.
Ojeda, H.; Deloire, A.; Carbonneau, A.; 2001: Influence of water deficit on grape berrygrowth. Vitis 40, 141-145.
Ollat, N. and Tandonnet, J. P.; 1999: Effects of two levels of water supply on thephotosynthesis and the transpiration of a whole grapevine (Vitis vinifera, c.v.Cabernet Sauvignon). Acta Horticulturae 493, 197-204.
Osmond, C. B.; Björkman, O.; Anderson, D. J.; 1980: Photosynthesis, p. 291-377. In:Physiological processes in plant ecology. Toward a synthesis with Atriplex.Springer-Verlag, New York.
Perez Peña, J. and Tarara, J.; 2004: A portable whole canopy gas exchange system forseveral mature field-grown grapevines. Vitis 43, 7-14.
Peterlunger, E.; Buccella, A.; Iacono, F.; 2000: Physiological changes in grapevineduring adjustment to water stress: ABA, leaf gas exchanges and root hydraulicconductivity. Acta Horticulturae 526, 201-206.
Poni, S.; Lakso, A. N.; Turner, J. R.; Melious, R. E.; 1993: The effects of pre- and post-veraison water stress on growth and physiology of potted Pinot noir grapevines atvarying crop levels. Vitis 32, 207-214.
Roby, G.; Harbertson, J. F.; Adams, D. A.; Matthews, M. A.; 2004: Berry size and vinewater deficits as factors in winegrape composition: anthocyanins and tannins.Australian Journal of Grape and Wine Research 10, 100-107.
Sauter, A.; Davies, W. J.; Hartung, W.; 2001: The long-distance abscisic acid signal inthe droughted plant: the fate of the hormone on its way from root to shoot.Journal of Experimental Botany 52, 1991-1997.
Schultz, H. R.; 1993: Photosynthesis of sun and shade leaves of field grown grapevines(Vitis vinifera L) in relation to leaf age. Suitability for the plastochron concept forthe expression of physiological age. Vitis 32, 197-205.
Schultz, H. R.; 2000: Physiological mechanisms of water use efficiency in grapevinesunder drought conditions. Acta Horticulturae 526, 115-136.
Schultz, H. R.; Kieffer, W.; Gruppe, W.; 1996: Photosynthesis duration, carboxylationand stomatal limitation of sun and shade leaves of different ages in field-growngrapevine (Vitis vinifera L.). Vitis 35, 169-176.
Stoll, M.; Loveys, B.; Dry, P.; 2000: Hormonal changes induced by partial rootzone

173
drying of irrigated grapevine. Journal of Experimental Botany 51, 1627-1634.
Talbott, L. D. and Zeiger, E.; 1998: The role of sucrose in guard cell osmoregulation.Journal of Experimental Botany 49, 329-337.
van Zyl, J. L.; 1987: Diurnal vatiation in grapevine water stress as a function of changingsoil water status and meteorological conditions. South African Journal of Enologyand Viticulture 8, 45-52.
Wilkinson, S. and Davies, W. J.; 1997: Xylem sap pH increase: a drought signalreceived at the apoplastic face of the guard cell that involves the suppression ofsaturable abscisic acid by the epidermal symplast. Plant Physiology 113, 559-573.
Wilkinson, S. and Davies, W. J.; 2002: ABA-based chemical signalling: the coordinationof responses to stress in plants. Plant, Cell and Environment 25, 195-210.
Williams, L. E. and Araujo, F. J.; 2002: Correlations among predawn leaf, midday leaf,and midday stem leaf water potential and their correlations with other measuresof soil and plant water status. Journal of the American Society for HorticulturalScience 127, 448-454.
Williams, L. E.; Dokoozlian, N. K.; Wample, R.; 1994: Grape, p. 85-133. In: Handbook ofenvironmental physiology of fruit crops. B. Shaffer and P. C. Anderson (Eds.).CRC Press, Orlando, Florida.
Williams, L. E. and Matthews, M. A.; 1990: Grapevine, p. 1019-1055. In: Irrigation ofagricultural crops. Agronomy monograph 30. B. A. Stewart and D. R. Nielsen, D.(Eds.). American Society of Agronomy, Madison, Wisconsin.
Winkel, T. and Rambal, S.; 1993: Influence of water stress on grapevines growing infield: from leaf to whole-plants response. Australian Journal of Plant Physiology,143-157.

174
Table 4.1: Effect of RDI regimens on transpiration per vine (TrWV,d) and per unit leaf area (TrWL,d)per day in 2003. Data are means of six vines averaged across all measurement days.
Phenologicalstages
Samplingdays
(DOY)
Irrigation regimensp value Day
lengthGlobal
irradianceS E V
----- L H2O vine-1 d-1 ---- treat DOM treat*DOM h MJ m-2 d-1
Fruit set z 177-184 11.6 11.2 13.7 0.176 0.001 0.182 15.7 30.6
Pre-veraison 212-219 14.1 a 7.7 b 15.6 a 0.001 0.001 0.030 14.6 21.9
Post-veraison 233-241 11.6 a 7.8 b 6.0 b 0.001 0.001 0.001 13.6 16.5
Pre-harvest 255-262 6.9 6.2 5.8 0.178 0.003 0.247 12.5 18.3
Post-harvest 274-281 4.2 4.1 5.2 0.087 0.001 0.341 11.4 13.7
Stage (p value) 0.001 0.001y 0.067x
Phenologicalstages
Samplingdays
(DOY)
Irrigation regimensp value
S E V
- L H2O d-1 m-2 leaf area - treat DOM treat*DOM
Fruit set z 1.3 1.3 1.4 0.734 0.001 0.202
Pre-veraison 1.6 a 0.9 b 1.6 a 0.001 0.001 0.068
Post-veraison 1.4 a 0.9 b 0.6 c 0.001 0.001 0.001
Pre-harvest 0.9 0.8 0.7 0.058 0.026 0.592
Post-harvest 0.7 0.7 0.7 0.862 0.004 0.753
Stage (p value) 0.001 0.001y
DOY: day of year; DOM: day of measurement; S: standard RDI; E: early deficit (fruit set - veraison); V: latedeficit (veraison - harvest). Values with different letters are significant at p�0.05 by Tukey- Kramer withinphenological stages.z Data were collected before irrigation treatment was imposed.y RDI regimen x phenological stage interaction.x p value for global radiation across phenological stages.
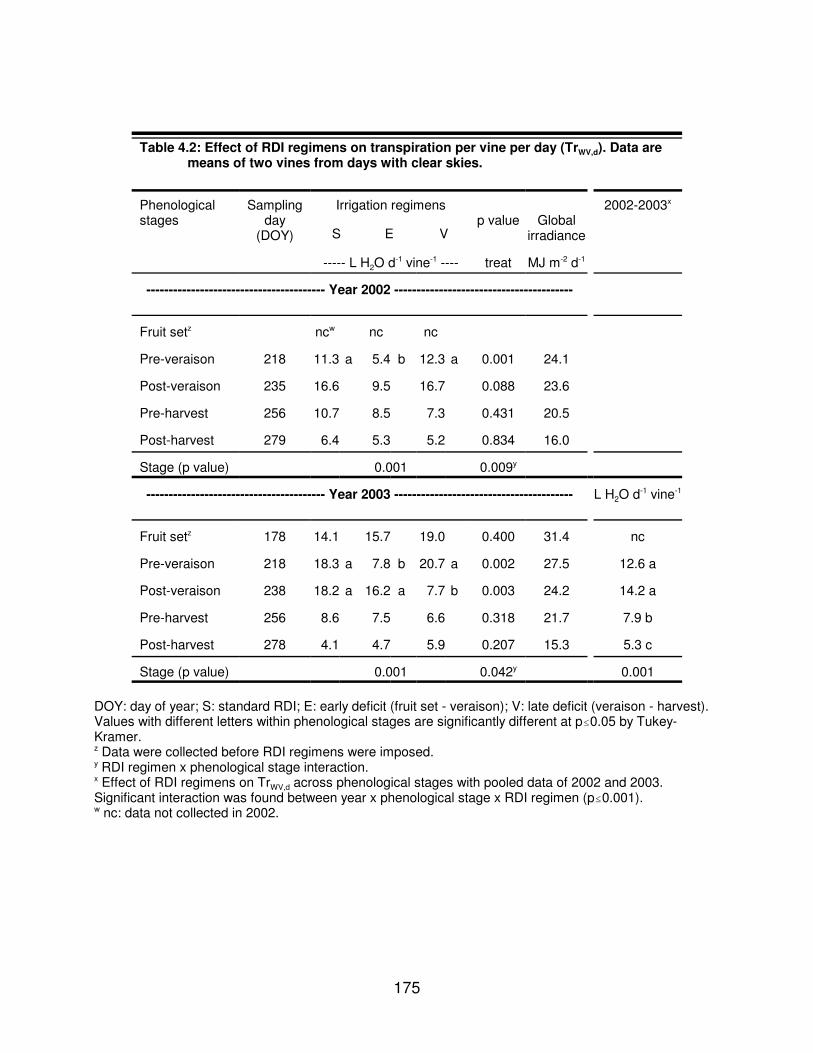
175
Table 4.2: Effect of RDI regimens on transpiration per vine per day (TrWV,d). Data aremeans of two vines from days with clear skies.
Phenologicalstages
Samplingday
(DOY)
Irrigation regimensp value Global
irradiance
2002-2003x
S E V
----- L H2O d-1 vine-1 ---- treat MJ m-2 d-1
---------------------------------------- Year 2002 ----------------------------------------
Fruit setz ncw nc nc
Pre-veraison 218 11.3 a 5.4 b 12.3 a 0.001 24.1
Post-veraison 235 16.6 9.5 16.7 0.088 23.6
Pre-harvest 256 10.7 8.5 7.3 0.431 20.5
Post-harvest 279 6.4 5.3 5.2 0.834 16.0
Stage (p value) 0.001 0.009y
---------------------------------------- Year 2003 ---------------------------------------- L H2O d-1 vine-1
Fruit setz 178 14.1 15.7 19.0 0.400 31.4 nc
Pre-veraison 218 18.3 a 7.8 b 20.7 a 0.002 27.5 12.6 a
Post-veraison 238 18.2 a 16.2 a 7.7 b 0.003 24.2 14.2 a
Pre-harvest 256 8.6 7.5 6.6 0.318 21.7 7.9 b
Post-harvest 278 4.1 4.7 5.9 0.207 15.3 5.3 c
Stage (p value) 0.001 0.042y 0.001
DOY: day of year; S: standard RDI; E: early deficit (fruit set - veraison); V: late deficit (veraison - harvest).Values with different letters within phenological stages are significantly different at p�0.05 by Tukey-Kramer. z Data were collected before RDI regimens were imposed.y RDI regimen x phenological stage interaction.x Effect of RDI regimens on TrWV,d across phenological stages with pooled data of 2002 and 2003.Significant interaction was found between year x phenological stage x RDI regimen (p�0.001).w nc: data not collected in 2002.
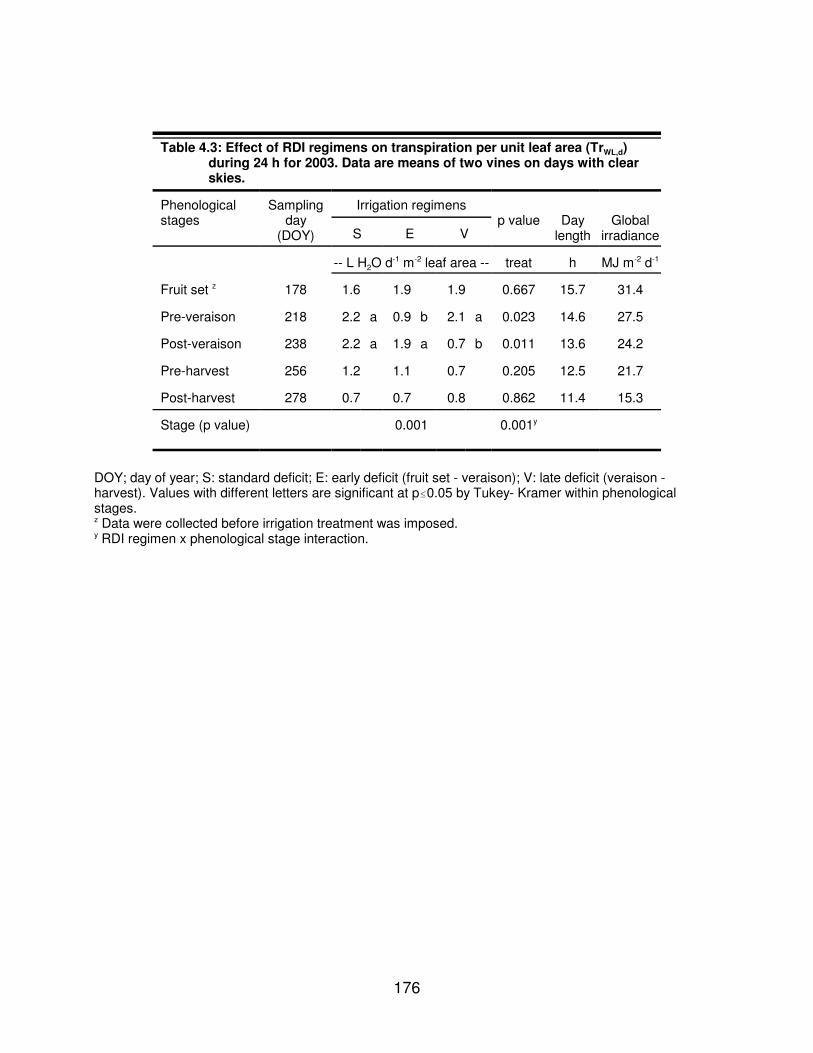
176
Table 4.3: Effect of RDI regimens on transpiration per unit leaf area (TrWL,d)during 24 h for 2003. Data are means of two vines on days with clearskies.
Phenologicalstages
Samplingday
(DOY)
Irrigation regimensp value Day
lengthGlobal
irradianceS E V
-- L H2O d-1 m-2 leaf area -- treat h MJ m-2 d-1
Fruit set z 178 1.6 1.9 1.9 0.667 15.7 31.4
Pre-veraison 218 2.2 a 0.9 b 2.1 a 0.023 14.6 27.5
Post-veraison 238 2.2 a 1.9 a 0.7 b 0.011 13.6 24.2
Pre-harvest 256 1.2 1.1 0.7 0.205 12.5 21.7
Post-harvest 278 0.7 0.7 0.8 0.862 11.4 15.3
Stage (p value) 0.001 0.001y
DOY; day of year; S: standard deficit; E: early deficit (fruit set - veraison); V: late deficit (veraison -harvest). Values with different letters are significant at p�0.05 by Tukey- Kramer within phenologicalstages.z Data were collected before irrigation treatment was imposed.y RDI regimen x phenological stage interaction.
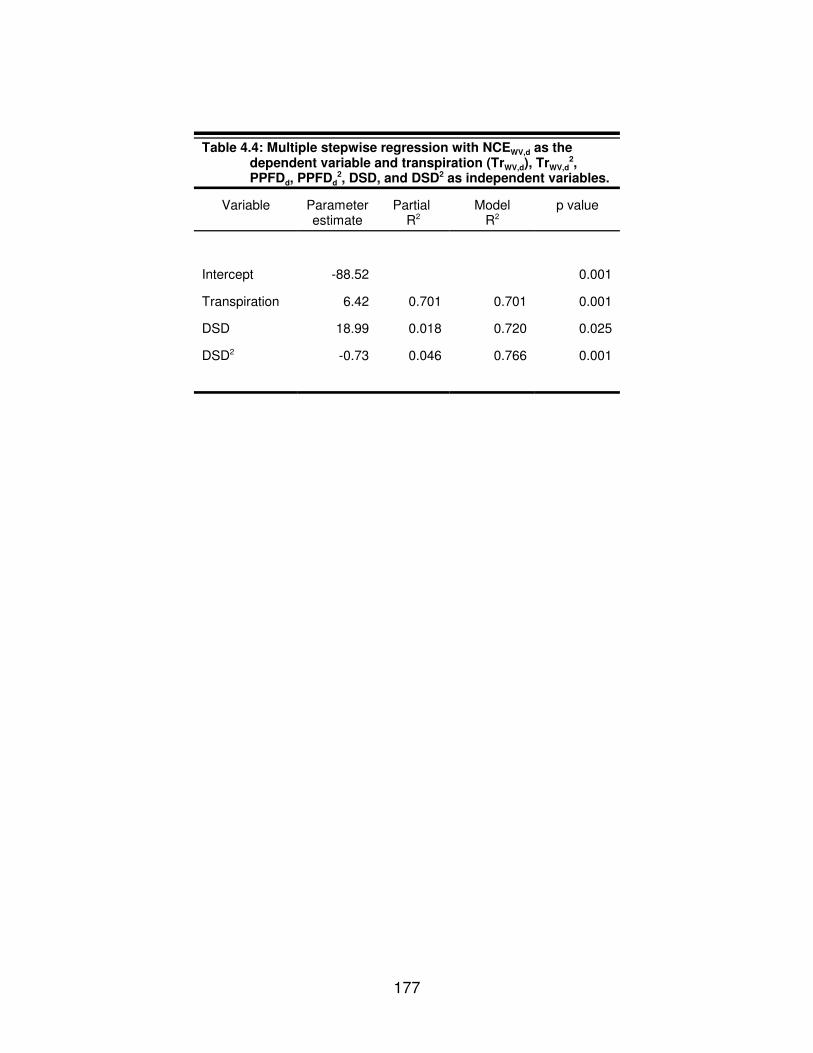
177
Table 4.4: Multiple stepwise regression with NCEWV,d as thedependent variable and transpiration (TrWV,d), TrWV,d
2,PPFDd, PPFDd
2, DSD, and DSD2 as independent variables.
Variable Parameterestimate
Partial R2
ModelR2
p value
Intercept -88.52 0.001
Transpiration 6.42 0.701 0.701 0.001
DSD 18.99 0.018 0.720 0.025
DSD2 -0.73 0.046 0.766 0.001

178
Table 4.5: Effects of RDI regimens on daily water use efficiency per vine (WUEWV,d) calculated asNCEWV,d/TrWV,d for 2003. Data are from six vines across all measurement days.
Phenologicalstages
Samplingdays
(DOY)
Irrigation regimensp value Day
lengthGlobal
irradianceS E V
g CO2/ L H2O vine-1 d-1 treat DOM treat*DOM h MJ m-2 d-1
Fruit set z 177-184 8.7 b 9.1 a 8.3 b 0.009 0.001 0.001 15.7 30.6
Pre-veraison 212-219 9.1 8.9 8.6 0.876 0.083 0.910 14.6 21.9
Post-veraison 233-241 16.7 16.4 16.4 0.918 0.001 0.001 13.6 16.5
Pre-harvest 255-262 7.5 a 5.6 b 5.4 b 0.018 0.001 0.045 12.5 18.3
Post-harvest 274-281 13.7 a 11.0 b 10.8 b 0.022 0.001 0.064 11.4 13.7
Stage (p value) 0.001 0.167y
DOY: day of year; DOM: day of measurement; S: standard deficit; E: early deficit (fruit set - veraison); V:late deficit (veraison - harvest). Values with different letters are significant at p�0.05 by Tukey- Kramerwithin phenological stages.z Data were collected before irrigation treatment was imposed.y RDI regimen x phenological stage interaction.

179
Table 4.6: Effect of RDI regimens on WUEWV,d calculated as NCEWV,d/TrWV,d. Data aremeans of two vines from days with clear skies.
Phenologicalstages
Samplingday
(DOY)
Irrigation regimensp value Global
irradiance
2002-2003x
S E V
-- g CO2/ L H2O vine-1 d-1 -- treat MJ m-2 d-1
---------------------------------------- Year 2002 ----------------------------------------
Fruit setz ncw nc nc
Pre-veraison 218 10.9 12.9 10.6 0.047 24.1
Post-veraison 235 7.1 7.8 8.0 0.726 23.6
Pre-harvest 256 6.6 ba 8.4 ab 8.8 a 0.042 20.5
Post-harvest 279 7.4 b 7.0 b 10.6 a 0.007 16.0
Stage (p value) 0.001 0.009y
---------------------------------------- Year 2003 ---------------------------------------- g CO2/ L H2O vine-1 d-1
Fruit setz 178 8.0 7.6 7.4 0.590 31.4 ncw
Pre-veraison 218 7.6 7.6 7.2 0.530 27.5 9.5
Post-veraison 238 7.9 7.6 7.8 0.761 24.2 7.7
Pre-harvest 256 9.4 8.7 7.4 0.084 21.7 8.2
Post-harvest 278 13.2 12.7 9.7 0.261 15.3 10.1
Stage (p value) 0.002 0.318y 0.001
DOY: day of year; S: standard RDI; E: early deficit (fruit set - veraison); V: late deficit (veraison - harvest).Values with different letters within phenological stages are significantly different at p�0.05 by Tukey-Kramer. z Data were collected before RDI regimens were imposed.y RDI regimen x phenological stage interaction.x Effect of RDI regimens on WUEWV,d across phenological stages with pooled data of 2002 and 2003.Significant interaction was found between year x phenological stage x RDI regimen (p�0.001).w nc: data not collected in 2002.
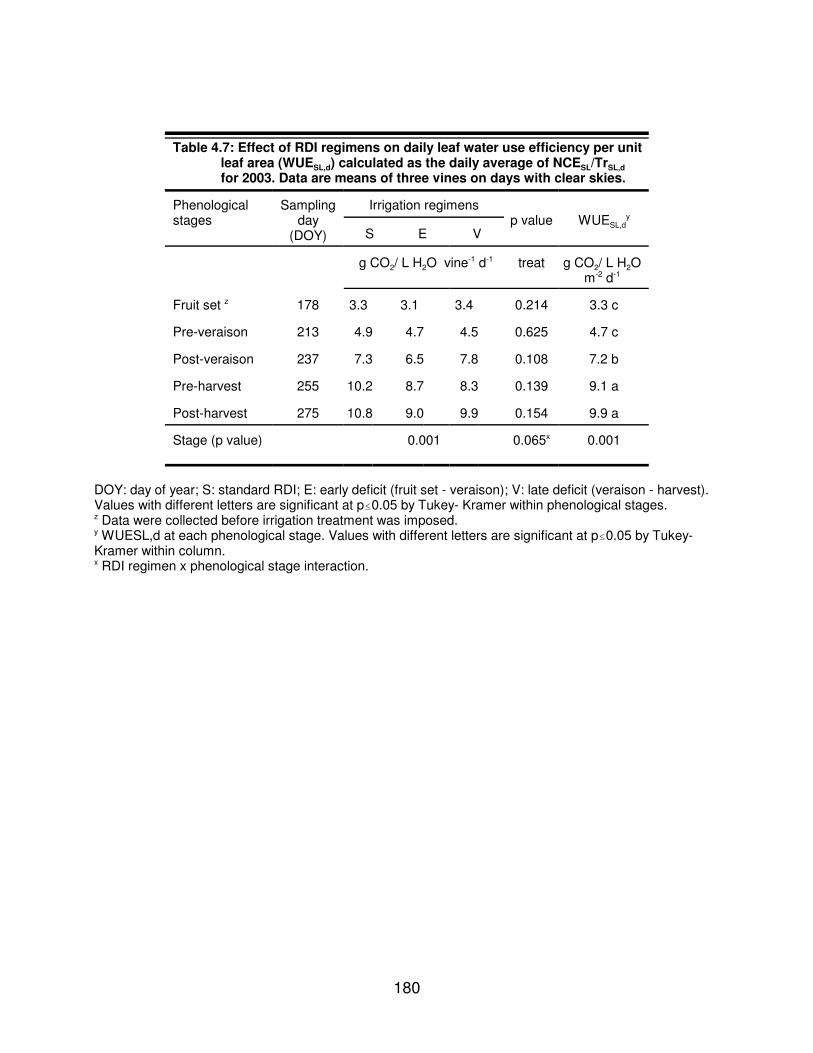
180
Table 4.7: Effect of RDI regimens on daily leaf water use efficiency per unitleaf area (WUESL,d) calculated as the daily average of NCESL/TrSL,dfor 2003. Data are means of three vines on days with clear skies.
Phenologicalstages
Samplingday
(DOY)
Irrigation regimensp value WUESL,d
y
S E V
g CO2/ L H2O vine-1 d-1 treat g CO2/ L H2O m-2 d-1
Fruit set z 178 3.3 3.1 3.4 0.214 3.3 c
Pre-veraison 213 4.9 4.7 4.5 0.625 4.7 c
Post-veraison 237 7.3 6.5 7.8 0.108 7.2 b
Pre-harvest 255 10.2 8.7 8.3 0.139 9.1 a
Post-harvest 275 10.8 9.0 9.9 0.154 9.9 a
Stage (p value) 0.001 0.065x 0.001
DOY: day of year; S: standard RDI; E: early deficit (fruit set - veraison); V: late deficit (veraison - harvest).Values with different letters are significant at p�0.05 by Tukey- Kramer within phenological stages. z Data were collected before irrigation treatment was imposed.y WUESL,d at each phenological stage. Values with different letters are significant at p�0.05 by Tukey-Kramer within column.x RDI regimen x phenological stage interaction.

181
DOY 178ETo= 7.5 mm
-1
0
1
2
3
4
0
500
1000
1500
2000
1
2
3
4
5
6
StandardEarlyLatePPFDVPD
DOY 181ETo= 11.5 mm
TrW
L (m
mol
m-2
s-1
)
-1
0
1
2
3
4
PP
FD ( �� ��
mol
m-2
s-1
)
0
500
1000
1500
2000
VP
D (k
Pa)
1
2
3
4
5
6
DOY 183ETo= 7 mm
Local standard time (h)
0 4 8 12 16 20 0-1
0
1
2
3
4
0
500
1000
1500
2000
1
2
3
4
5
6
A
B
C
Figure 4.1: Whole-canopy transpiration rate (TrWL), photosynthetic photon flux density(PPFD) and air vapor pressure deficit (VPD) during fruit set, 2003. Data pointsare means of two chambers operating simultaneously. Daily referenceevapotranspiration (grass; ETo) is from the Alderdale PAWS station (10 km westof site).

182
DOY 213ETo= 3.4 mm
TrW
L (m
mol
m-2
s-1
)
-1
0
1
2
3
4
PP
FD ( �� ��
mol
m-2
s-1
)
0
500
1000
1500
2000
VP
D (k
Pa)
1
2
3
4
5
6
StandardEarlyLatePPFDVPD
DOY 215ETo= 8 mm
-1
0
1
2
3
4
0
500
1000
1500
2000
1
2
3
4
5
6
DOY 218ETo= 5.3 mm
Local standard time (h)
0 4 8 12 16 20 0-1
0
1
2
3
4
0
500
1000
1500
2000
1
2
3
4
5
6
A
B
C
Figure 4.2: Whole-canopy transpiration rate (TrWL), photosynthetic photon flux density(PPFD), and air vapor pressure deficit (VPD) during pre-veraison, 2003. Panel Bdemonstrates a smaller difference in TrWL between extra water deficit (E) andvines under standard RDI regimen (S and V) due to lower PPFD and lower airtemperature. Data points are means of two chambers operating simultaneously.Daily reference evapotranspiration (grass; ETo) is from the Alderdale PAWSstation (10 km west of site).

183
DOY 234ETo= 3.4 mmPP = 2.3 mm
TrW
L (m
mol
m-2
s-1
)
-1
0
1
2
3
4
PP
FD ( �� ��
mol
m-2
s-1
)
0
500
1000
1500
2000
VP
D (k
Pa)
1
2
3
4
5
6StandardEarlyLatePPFDVPD
DOY 238ETo= 8 mm
0
500
1000
1500
2000
-1
0
1
2
3
4
1
2
3
4
5
6
DOY 240ETo= 5.3 mm
Local standard time (h)
0 4 8 12 16 20 0
0
500
1000
1500
2000
-1
0
1
2
3
4
1
2
3
4
5
6
A
B
C
Figure 4.3: Whole-canopy transpiration rate (TrWL), photosynthetic photon flux density(PPFD), and air vapor pressure deficit (VPD) during post-veraison, 2003. V vineswere under extra water deficit, S and E vines were under standard RDI regimen.Data points are means of two chambers operating simultaneously. Dailyreference evapotranspiration (grass; ETo) and precipitation (PP) are from theAlderdale PAWS station (10 km west of site).

184
DOY 256ETo= 3.9 mm
TrW
L (m
mol
m-2
s-1
)
-1
0
1
2
3
4
PP
FD ( �� ��
mol
m-2
s-1
)
0
500
1000
1500
2000
1
2
3
4
5
6
StandardEarlyLatePPFDVPD
DOY 259ETo= 5.2 mm
-1
0
1
2
3
4
0
500
1000
1500
2000
VP
D (k
Pa)
1
2
3
4
5
6
DOY 261ETo= 3.3 mm
Local standard time (h)
0 4 8 12 16 20 0-1
0
1
2
3
4
0
500
1000
1500
2000
1
2
3
4
5
6
A
B
C
Figure 4.4: Whole-canopy transpiration rate (TrWL), photosynthetic photon flux density(PPFD), and air vapor pressure deficit (VPD) during pre-harvest, 2003. V vineswere under extra water deficit, S and E vines were under standard RDI regimen.Data points are means of two chambers operating simultaneously. Dailyreference evapotranspiration (grass; ETo) is from the Alderdale PAWS station (10km west of site).
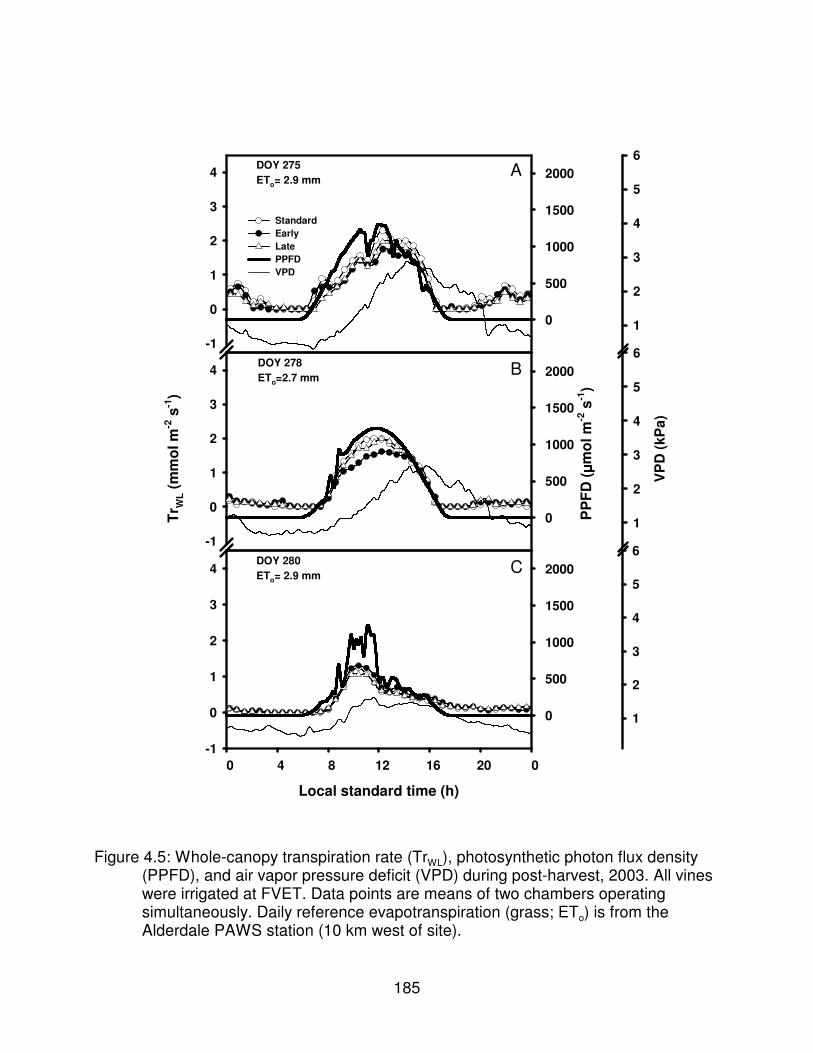
185
DOY 275ETo= 2.9 mm
TrW
L (m
mol
m-2
s-1
)
-1
0
1
2
3
4
PP
FD ( �� ��
mol
m-2
s-1
)
0
500
1000
1500
2000
VP
D (k
Pa)
1
2
3
4
5
6
StandardEarlyLatePPFDVPD
DOY 278ETo=2.7 mm
-1
0
1
2
3
4
0
500
1000
1500
2000
1
2
3
4
5
6
DOY 280ETo= 2.9 mm
Local standard time (h)
0 4 8 12 16 20 0-1
0
1
2
3
4
0
500
1000
1500
2000
1
2
3
4
5
6
A
B
C
Figure 4.5: Whole-canopy transpiration rate (TrWL), photosynthetic photon flux density(PPFD), and air vapor pressure deficit (VPD) during post-harvest, 2003. All vineswere irrigated at FVET. Data points are means of two chambers operatingsimultaneously. Daily reference evapotranspiration (grass; ETo) is from theAlderdale PAWS station (10 km west of site).

186
VP
Dla (k
Pa)
1
2
3
4
5
6Tr
SL (m
mol
m-2
s-1
)
2
4
6
8
StandardEarlyLate
1
2
3
4
5
6
2
4
6
8
Local standard time (h)
7 10 13 16 19
1
2
3
4
5
6
Local standard time (h)
7 10 13 16 19
2
4
6
8
A
B
C
D
E
F
Pre-veraison: DOY 218, 219, 220
Post-veraison: DOY 235, 238, 241
Pre-harvest: DOY 259, 261
Figure 4.6: Effects of RDI regimens on single-leaf transpiration (TrSL; A-C) and leaf-to-airvapor pressure deficit (VPDla;D-F) at different phenological stages and at differenttimes of the day during 2002. Values are means per vines ± SE (n=9; pre-harvestn=6).
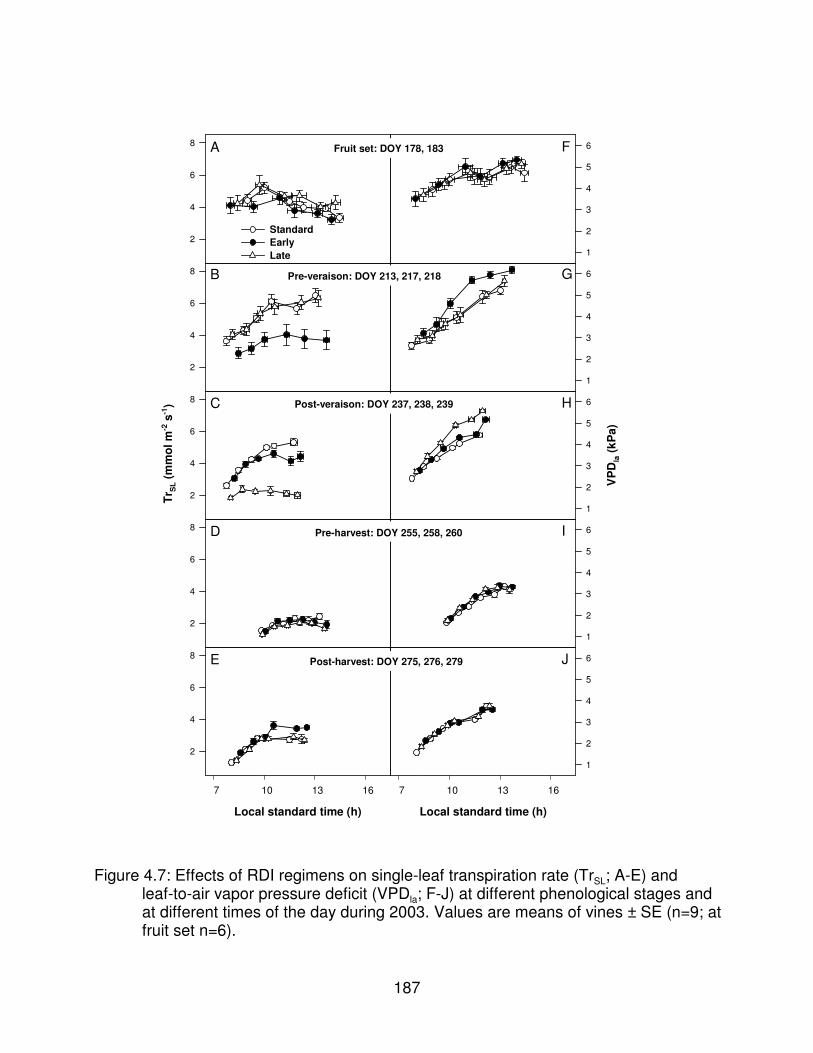
187
VP
Dla (k
Pa)
1
2
3
4
5
6
TrS
L (m
mol
m-2
s-1
)
2
4
6
8
StandardEarlyLate
1
2
3
4
5
6
2
4
6
8
1
2
3
4
5
6
2
4
6
8
1
2
3
4
5
6
2
4
6
8
Local standard time (h)
7 10 13 16
1
2
3
4
5
6
Local standard time (h)
7 10 13 16
2
4
6
8
A
B
C
D
E
F
G
H
I
J
Fruit set: DOY 178, 183
Pre-veraison: DOY 213, 217, 218
Post-veraison: DOY 237, 238, 239
Pre-harvest: DOY 255, 258, 260
Post-harvest: DOY 275, 276, 279
Figure 4.7: Effects of RDI regimens on single-leaf transpiration rate (TrSL; A-E) andleaf-to-air vapor pressure deficit (VPDla; F-J) at different phenological stages andat different times of the day during 2003. Values are means of vines ± SE (n=9; atfruit set n=6).
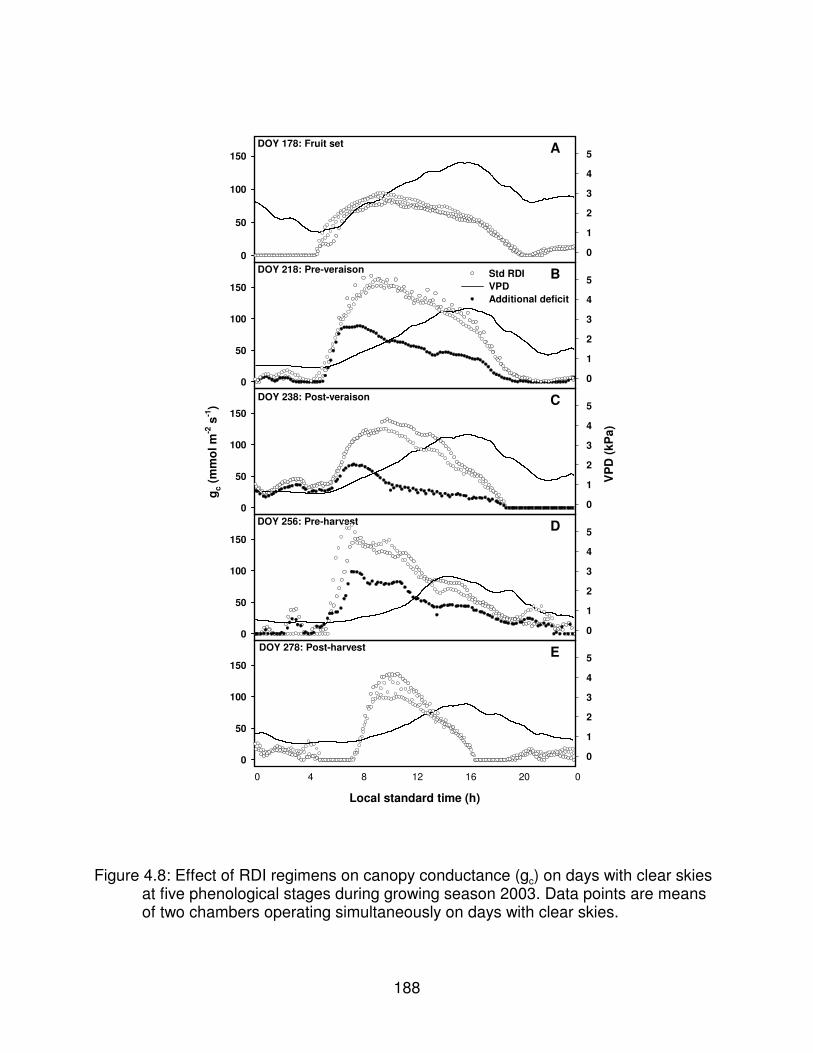
188
0
50
100
150
0
1
2
3
4
5
DOY 278: Post-harvest
DOY 256: Pre-harvest
DOY 238: Post-veraison
DOY 178: Fruit set
DOY 218: Pre-veraison
A
B
C
D
E
0
50
100
150
0
1
2
3
4
5Std RDIVPDAdditional deficit
g c (m
mol
m-2
s-1
)
0
50
100
150
VP
D (k
Pa)
0
1
2
3
4
5
0
50
100
150
0
1
2
3
4
5
Local standard time (h)
0 4 8 12 16 20 0
0
50
100
150
0
1
2
3
4
5
Figure 4.8: Effect of RDI regimens on canopy conductance (gc) on days with clear skiesat five phenological stages during growing season 2003. Data points are meansof two chambers operating simultaneously on days with clear skies.

189
TrW
L (m
mol
m-2
s-1
)
0
1
2
3
4
5
DOY 278: Post-harvest
DOY 256: Pre-harvest
DOY 238: Post-veraison
DOY 178: Fruit set
DOY 218: Pre-veraison
A
B
C
D
E
0
1
2
3
4
5
STD RDI amSTD RDI pm Extra deficit amExtra deficit pm
0
1
2
3
4
5
0
1
2
3
4
5
VPD (kPa)
0 1 2 3 4 5 6
0
1
2
3
4
5
Figure 4.9: Effect of RDI regimens on the relationship between whole canopytranspiration rate (TrWL)and air vapor pressure deficit (VPD) at five phenologicalstages during growing season of 2003. Data points are means of two chambersoperating simultaneously on days with clear skies.

190
TrW
L r
ate
(mm
ol m
-2 s
-1)
0
1
2
3
4
5
DOY 278: Post-harvest
DOY 256: Pre-harvest
DOY 238: Post-veraison
DOY 178: Fruit set
DOY 218: Pre-veraison
A
B
C
D
E
0
1
2
3
4
5
STD RDI amSTD RDI pmExtra deficit amExtra deficit pm
0
1
2
3
4
5
0
1
2
3
4
5
gc (mmol m-2 s-1)
0 50 100 150 2000
1
2
3
4
5
Figure 4.10: Effect of RDI regimens on the relationship between whole-canopytranspiration (TrWL) and canopy conductance (gc) at each phenological stageduring season 2003. Data are from days with clear skies. Data points are meansof two chambers operating simultaneously.

191
Net
CO
2 ex
chan
ge r
ate
( �� ��m
ol m
-2 s
-1)
0
5
10
15
Canopy conductance to H2Ov (mmol m-2 s-1)
0 50 100 150 200
0
5
10
15 DOY 278: Post-harvest
DOY 256: Pre-harvest
DOY 238: Post-veraison
DOY 178: Fruit set
DOY 218: Pre-veraison
A
B
C
D
E
0
5
10
15
gc vs Phm2s gc vs Phm2s gc vs phm2sp
0
5
10
15
0
5
10
15
r2=0.95p<0.001
r2=0.96p<0.001
r2=0.93p<0.001
r2=0.86p<0.001
r2=0.92p<0.001
Figure 4.11: Effect of RDI regimens on the relationship between whole-canopy net CO2exchange rate (NCEWL) and canopy conductance (gc) at five phenological stagesduring growing season 2003. Data points are means of two chambers operatingsimultaneously on days with clear skies.

192
Figure 4.12: Relationship between stomatalconductance (gs) and leaf net CO2exchange rate (NCESL) in 2002 (A-C) and 2003 (D-H) at differentphenological stages, and underdifferent RDI regimens. Mean valuesare per vine ± SE (n=9; except atpre-harvest 2002 and at fruit set2003 when n=6).
NC
ES
L ( �� ��
mol
m-2
s-1
)
2
4
6
8
10
12
14
16
18
Standard deficitExtra deficit
Pre-veraison 2002DOY 218, 219, 220
Post-veraison 2002DOY 235, 238, 241
Pre-harvest 2002DOY 259, 261
2
4
6
8
10
12
14
16
18
gs (mmol m-2 s-1)
50 100 150 200 250 300
2
4
6
8
10
12
14
16
18
B
C
A
r2=0.76p<0.001
r2=0.85p<0.001
r2=0.93p<0.001
NC
ES
L ( �� ��
mol
m-2
s-1
)
2
4
6
8
10
12
14
16
2
4
6
8
10
12
14
16
Standard deficitExtra deficit
2
4
6
8
10
12
14
16
2
4
6
8
10
12
14
16
gs (mmol m-2 s-1)
50 100 150 200 250 300
2
4
6
8
10
12
14
16
D
H
G
F
E
Fruit set 2003DOY 178,183
Pre-veraison 2003DOY 213, 217, 218
Post-veraison 2003DOY 237, 238, 239
Pre-harvest 2003DOY 255, 258, 260
Post-harvest 2003DOY 275, 276, 279
r2= 0.93p<0.001
r2= 0.92p<0.001
r2= 0.93p<0.001
r2= 0.93p<0.001
r2= 0.61p<0.001

193
NC
EW
L ( �� ��
mol
m-2
s-1
)
-2
0
2
4
6
8
10
PPFD (����mol m-2 s-1)
0 500 1000 1500
g c (m
mol
m-2
s-1
)
0
50
100
150
BA
C
PPFD (����mol m-2 s-1)
0 500 1000 1500
D
Figure 4.13: Relationships between whole-canopy net CO2 exchange rate (NCEWL) andgc with photosynthetic photon flux density (PPFD) at pre-veraison, for two vinesunder standard RDI (A, C) and under additional water deficit (B, D). Datarepresent DOY 218, 2003 from 0000 h to 1200 h recorded at 12 min intervals.

194
TrWL (L H2O d-1 m-2 )
0.0 0.5 1.0 1.5 2.0 2.5 3.0
NC
EW
L (g
CO
2 d-1
m-2
)
0
5
10
15
20
25
30Std RDIAdditional deficitPredicted
NCEWL = 2.8 + 6.5 x TrWL
r2=0.64; p<0.001
NCEWV = 21 + 6.7 x TrWV
r2=0.70; p<0.001
A
B
TrWV (L H2O vine-1 d-1 )
0 5 10 15 20 25
NC
EW
V (g
CO
2 vi
ne-1
d-1
)
02040
6080
100120140160180200
C
TrSL (mmol H2O m-2 s-1)
0 1 2 3 4 5 6 7 8
NC
ES
L ( �� ��
mol
CO
2 m
-2 s
-1)
2
4
6
8
10
12
14
16
NCESL = 1.5 + 3.88 x TrSL - 0.32 x TrSL2
r2=0.67; p<0.001
Figure 4.14: A) Relationships in 2003 between A) whole-canopy net CO2 exchange rate(NCEWL,d) and transpiration (TrWL,d) per unit leaf area; B) whole-canopy net CO2exchange rate (NCEWV,d) and transpiration (TrWv,L) per vine; C) single-leaf net CO2exchange rate (NCESL) and transpiration (TrSL).
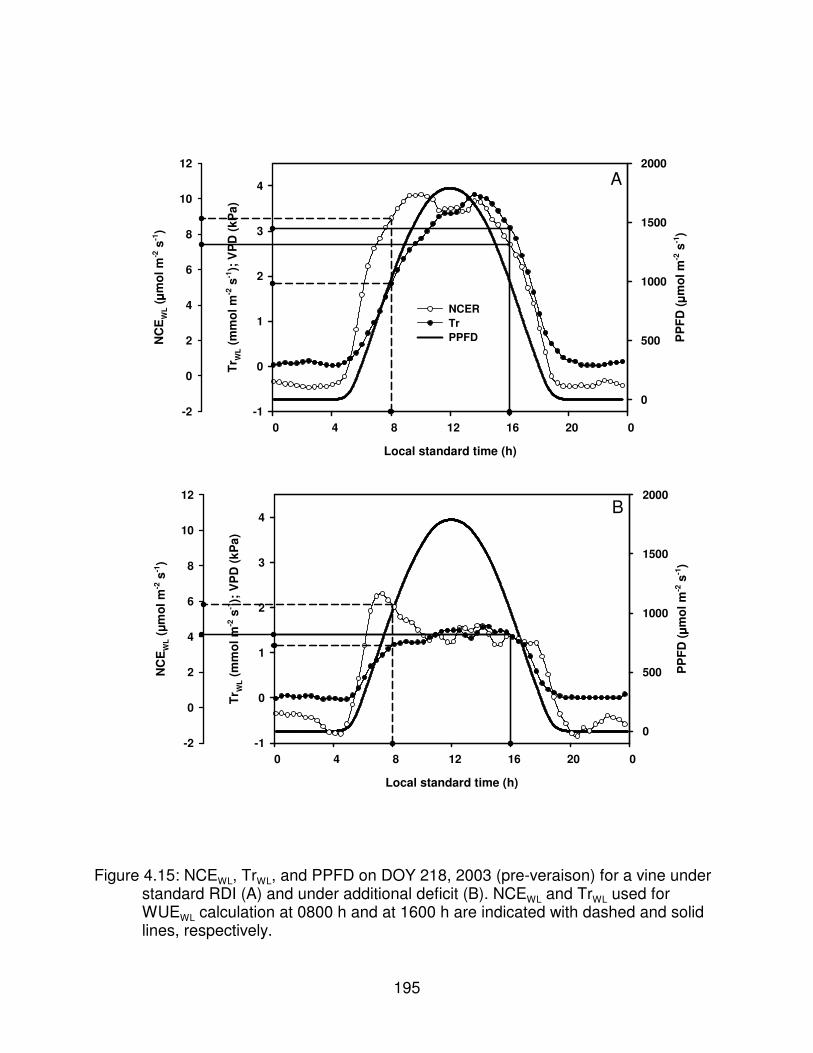
195
Local standard time (h)
0 4 8 12 16 20 0
PP
FD ( �� ��
mol
m-2
s-1
)
0
500
1000
1500
2000
NC
EW
L ( �� ��
mol
m-2
s-1
)
-2
0
2
4
6
8
10
12
TrW
L (m
mol
m-2
s-1
); V
PD
(kP
a)
-1
0
1
2
3
4B
Local standard time (h)
0 4 8 12 16 20 0
NC
EW
L ( �� ��
mol
m-2
s-1
)
-2
0
2
4
6
8
10
12
TrW
L (m
mol
m-2
s-1
); V
PD
(kP
a)
-1
0
1
2
3
4
PP
FD ( �� ��
mol
m-2
s-1
)
0
500
1000
1500
2000
NCERTrPPFD
A
Figure 4.15: NCEWL, TrWL, and PPFD on DOY 218, 2003 (pre-veraison) for a vine understandard RDI (A) and under additional deficit (B). NCEWL and TrWL used forWUEWL calculation at 0800 h and at 1600 h are indicated with dashed and solidlines, respectively.
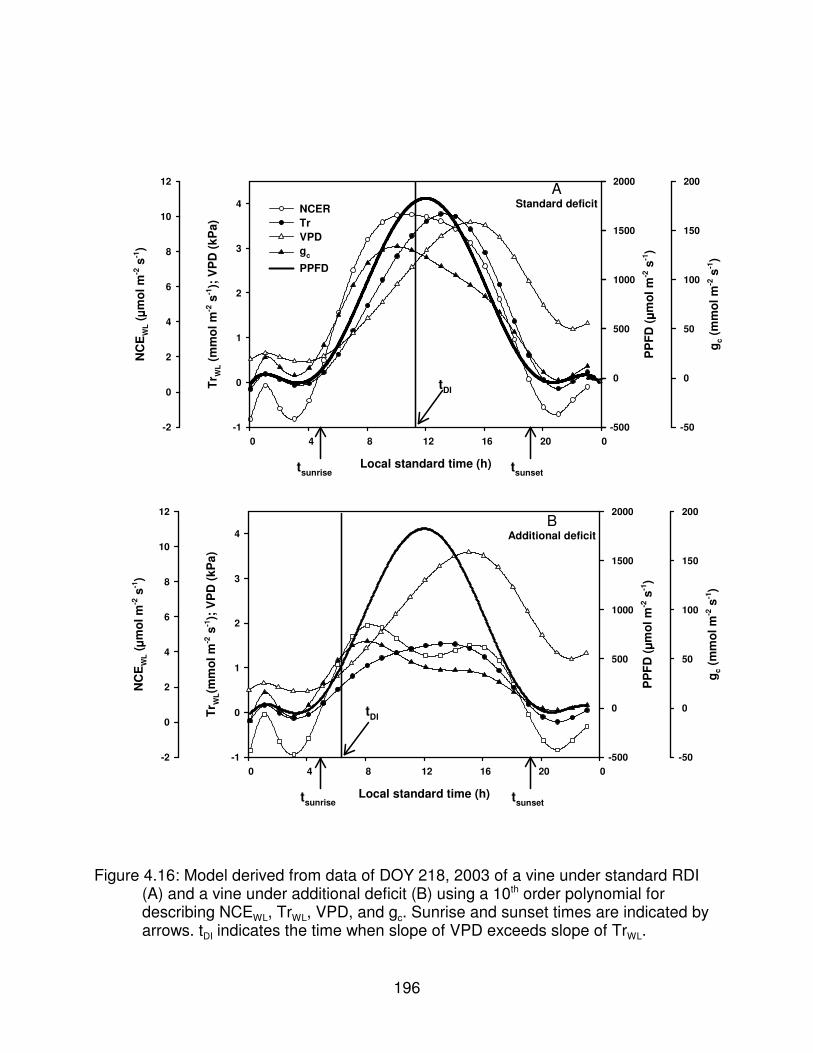
196
Local standard time (h)
0 4 8 12 16 20 0
NC
EW
L ( �� ��
mol
m-2
s-1
)
-2
0
2
4
6
8
10
12
TrW
L (m
mol
m-2
s-1
); V
PD
(kP
a)
-1
0
1
2
3
4
g c (m
mol
m-2
s-1
)
-50
0
50
100
150
200
PP
FD ( �� ��
mol
m-2
s-1
)
-500
0
500
1000
1500
2000
NCERTrVPDgc
PPFD
AStandard deficit
tDI
Local standard time (h)
0 4 8 12 16 20 0
NC
EW
L ( �� ��
mol
m-2
s-1
)
-2
0
2
4
6
8
10
12
TrW
L(m
mol
m-2
s-1
); V
PD
(kP
a)
-1
0
1
2
3
4
g c (m
mol
m-2
s-1
)
-50
0
50
100
150
200
PP
FD ( �� ��
mol
m-2
s-1
)
-500
0
500
1000
1500
2000
tDI
BAdditional deficit
tsunrise tsunset
tsunrise tsunset
Figure 4.16: Model derived from data of DOY 218, 2003 of a vine under standard RDI(A) and a vine under additional deficit (B) using a 10th order polynomial fordescribing NCEWL, TrWL, VPD, and gc. Sunrise and sunset times are indicated byarrows. tDI indicates the time when slope of VPD exceeds slope of TrWL.

197
Local standard time (h)
0 4 8 12 16 20 0
Slo
pes:
Tr W
L (m
mol
m-2
s-2
); V
PD
(kP
a s-1
)
-0.03
-0.02
-0.01
0.00
0.01
0.02
0.03A
Standard deficit
tsunrise tsunset
tDI
Local standard time (h)
0 4 8 12 16 20 0
Slo
pes:
Tr W
L (m
mol
m-2
s-2
); V
PD
(kP
a s-1
)
-0.03
-0.02
-0.01
0.00
0.01
0.02
0.03
Slope VPDSlope TrWL
BAdditional deficit
tsunrise tsunset
tDI
Figure 4.17: VPD and TrWL slopes derived from models using figure 4.16 data for a vineunder standard RDI (A) and a vine under additional deficit (B). Sunrise andsunset times are indicated by arrows. tDI indicates the time when slope of VPDexceeds slope of TrWL.

198
Local standard time (h)
0 4 8 12 16 20 0
NC
ER
( �� ��m
ol m
-2 s
-1)
-2
0
2
4
6
8
10
12
Tr (m
mol
m-2
s-1
); V
PD
(kP
a)
-1
0
1
2
3
4
g c (m
mol
m-2
s-1
)
-50
0
50
100
150
200
PP
FD ( �� ��
mol
m-2
s-1
)
-500
0
500
1000
1500
2000
NCERTrVPDgcPPFD
AStandard deficit
tDI
Local standard time (h)
0 4 8 12 16 20 0
NC
ER
( �� ��m
ol m
-2 s
-1)
-2
0
2
4
6
8
10
12
Tr (m
mol
m-2
s-1
); V
PD
(kP
a)
-1
0
1
2
3
4
g c (m
mol
m-2
s-1
)
-50
0
50
100
150
200
PP
FD ( �� ��
mol
m-2
s-1
)
-500
0
500
1000
1500
2000
tDI
BAdditional deficit
tsunrise tsunset
tsunrise tsunset
Figure 4.18: Model derived from data of DOY 215, 2003 of a vine under standard RDI(A) and a vine under additional deficit (B) using a 10th order polynomial fordescribing NCEWL, TrWL, VPD, and gc. Sunrise and sunset times are indicated byarrows. tDI indicates the time when slope of VPD exceeds slope of TrWL.

199
Local standard time (h)
0 4 8 12 16 20 0
Slo
pes:
Tr W
L (m
mol
m-2
s-2
); V
PD
(kP
a s-1
)
-0.03
-0.02
-0.01
0.00
0.01
0.02
0.03A
Standard deficit
tsunrise tsunset
tDI
Local standard time (h)
0 4 8 12 16 20 0
Slo
pes:
Tr W
L (m
mol
m-2
s-2
); V
PD
(kP
a s-1
)
-0.03
-0.02
-0.01
0.00
0.01
0.02
0.03
Slope VPDSlope TrWL
BAdditional deficit
tsunrise tsunset
tDI
Figure 4.19: VPD and TrWL slopes derived from models using figure 4.18 data for a vineunder standard RDI (A) and a vine under additional deficit (B). Sunrise andsunset times are indicated by arrows. tDI indicates the time when slope of VPDexceeds slope of TrWL.

200
APPENDIX 4

201
e = 101325 exp(13.3185 * y - 1976 * y - 0.6445 * y - 0.1229 * y )s2 3 4
y = 1-TTs
P = 101.3 exp (- A
8200)a
SRTrp Trp
VPDp VPDpWL (tn) WL (tn 1)
(tn) (tn 1)
=−
−−
−
A4.1. Saturation vapor pressure (Buck 1981):
where es is the saturation vapor pressure, and y is:
where Ts (K) is steam temperature and T (K) is temperature of interest.
A4.2. Atmospheric pressure (Campbell and Norman, 1998):
where Pa is atmospheric pressure (kPa) and A is the altitude (m) above sea level.
A4.3. Calculations of tDI
After adjusting a 10th order polynomial to the TrWL and VPD data, the ratios
between those slopes at each sampling time can be calculated:
where SR is the ratio between the calculated slopes of the curves of the predicted TrWL
(TrpWL) and predicted VPD (VPDp) at sampling time n (tn) and previous time (tn-1). The
time in the day at which the SR becomes below 1 is the tDI used in the calculation of the
deficit index DI.

202
Additional deficit % FVET
Additional deficit % FVET
Irrigationregimens
Standard deficit % FVETS
Standard deficit % FVETE
Standard deficit % FVETV
Bloom
Veraison
Phase I HarvestB
erry
vol
ume
Time
Gas exchange measurements
Phase II Phase III
1 2 3 4 5
Additional deficit % FVET
Additional deficit % FVET
Irrigationregimens
Standard deficit % FVETS
Standard deficit % FVETE
Standard deficit % FVETV
Bloom
Veraison
Phase I HarvestB
erry
vol
ume
Time
Gas exchange measurements
Phase II Phase III
1 2 3 4 5
Figure A4.1: Experimental calendar and irrigation schedule superimposed on theoreticalcurve of berry growth. Arrows at top indicate approximate periods ofwhole-canopy and single-leaf gas exchange measurements: 1-fruit set,2-pre-veraison, 3-post-veraison, 4-pre-harvest, 5-post-harvest. Bars at the bottomindicate the duration and scheduling of irrigation regimens. FVET: full vineevapotranspiration; standard deficit = 70% FVET (2002) or 60% FVET (2003);additional deficit = 35% FVET (2002) or 30% FVET (2003).
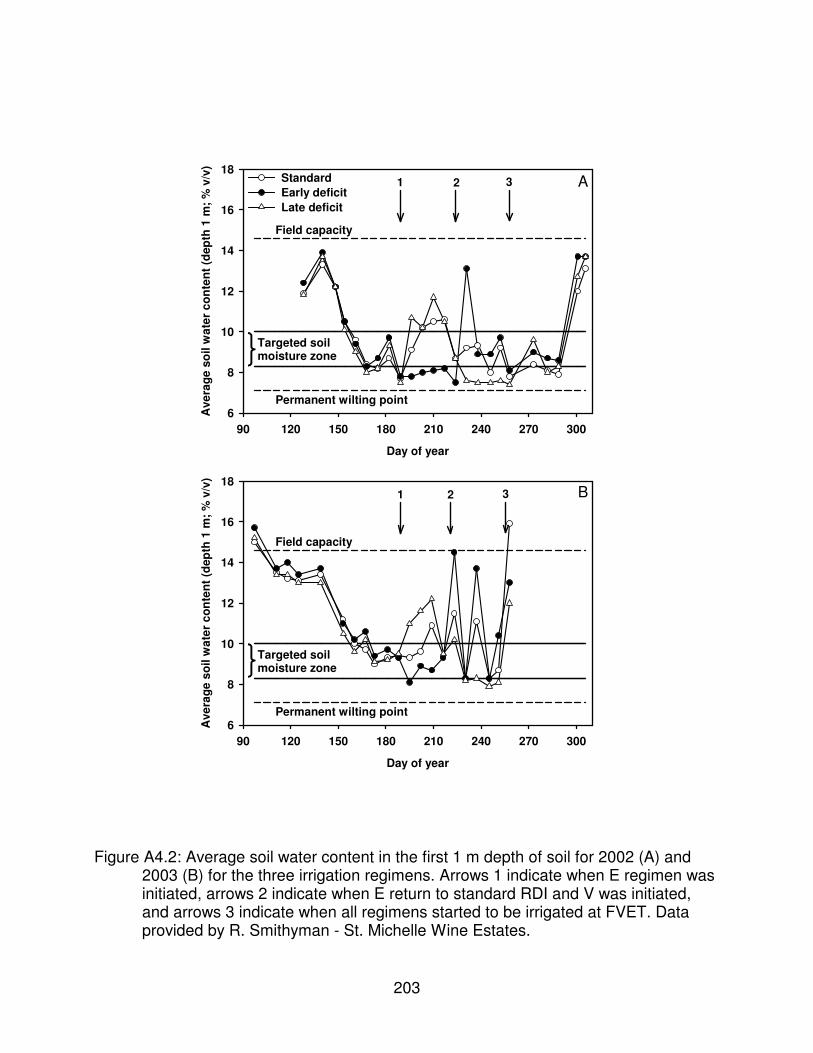
203
Day of year
90 120 150 180 210 240 270 300
Ave
rage
soi
l wat
er c
onte
nt (d
epth
1 m
; % v
/v)
6
8
10
12
14
16
18
StandardEarly deficitLate deficit
Field capacity
Permanent wilting point
Targeted soilmoisture zone
B
Day of year
90 120 150 180 210 240 270 300
Ave
rage
soi
l wat
er c
onte
nt (d
epth
1 m
; % v
/v)
6
8
10
12
14
16
18
Field capacity
Permanent wilting point
Targeted soilmoisture zone
A1 2 3
1 2 3
Figure A4.2: Average soil water content in the first 1 m depth of soil for 2002 (A) and2003 (B) for the three irrigation regimens. Arrows 1 indicate when E regimen wasinitiated, arrows 2 indicate when E return to standard RDI and V was initiated,and arrows 3 indicate when all regimens started to be irrigated at FVET. Dataprovided by R. Smithyman - St. Michelle Wine Estates.

204
Day of year
150 180 210 240 270
Mid
-day
leaf
wat
er p
oten
tial (
MP
a)
-2.4
-2.2
-2.0
-1.8
-1.6
-1.4
-1.2
-1.0
B
Day of year
150 180 210 240 270
Xyl
em w
ater
pot
entia
l (M
Pa)
-2.4
-2.2
-2.0
-1.8
-1.6
-1.4
-1.2
-1.0
Standard RDIEarly deficitLate deficit
A
Figure A4.3: Effects of RDI regimens on xylem water potential in 2002 (A) and on leafwater potential in 2003 (B). Data provided by R. Smithyman - St. Michelle WineEstates.

205
CHAPTER 5
YIELD, YIELD COMPONENTS, FRUIT COMPOSITION, AND
NON-STRUCTURAL CARBOHYDRATES IN CANES
UNDER REGULATED DEFICIT IRRIGATION
5.1. Abstract
Regulated deficit irrigation (RDI) is applied in wine grapes mainly for improving
fruit quality. The effects RDI on yield, fruit composition, and non-structural carbohydrates
in dormant canes were evaluated in 2002 and 2003 on field-grown vines cv. Cabernet
Sauvignon that were irrigated during the period of berry growth according to three
regimens within RDI: 1) standard RDI (70% of full vine evapotranspiration, FVET, was
replaced weekly); 2) early deficit (35% of vine FVET was replaced weekly between fruit
set and veraison); and 3) veraison deficit (35% of vine FVET was replaced weekly
between veraison and harvest). When not under 35% deficit, vines in scenarios #2 and
#3 were irrigated according to standard RDI practice. No consistent effect on yield or
berry quality indicators (Brix, berry weight, or color in the must) were observed among
regimens, nor on soluble sugars or starch concentrations in canes. Lack of effect may
be explained by the low yields (9.8 Mg ha-1) and high leaf area:fruit ratios, suggesting
that all vines were under-cropped. However, vines under the standard and veraison RDI
deficit regimens had 41% higher pruning weights than the early deficit regimen, thus
greater amount of above-ground biomass.
5.2. Introduction
206
Crop yield is generally limited by more than one environmental factor (Gifford et
al., 1984), and water deficit is the one factor that most limits yield (Boyer, 1982). In
winegrapes, it is not usually yield alone but a combination of fruit quality and quantity
that is the main goal for growers (Jackson and Lombard, 1993). Yield reduction due to
deliberate water deficit can be a goal of irrigation management via regulated deficit
irrigation (RDI). Effects of water deficits on grapevine yield and fruit quality have been
widely studied (e.g., dos Santos et al., 2003; Esteban et al., 1999; Hepner et al., 1985;
Kennedy et al., 2002; Roby et al., 2004; Van Zyl, 1984); responses depended on the
severity of the water deficit, its timing during the growing season (Matthews and
Anderson, 1988; McCarthy, 2000; Myburgh, 2003; Naor et al., 1993), and the vine’s
source:sink balance (Bravdo et al., 1985; Hepner and Bravdo, 1985; Kliewer et al., 1983;
Poni et al., 1994).
Research suggests that a water deficit applied to winegrapes using RDI is a
viable practice for controlling excessive vigor, reducing pest populations and disease
pressure, and improving wine quality (Williams, 1996). Water deficits applied early in the
season reduced shoot growth, leaf area, canopy size, and increased the proportion of
sun-exposed clusters (dos Santos et al., 2003; Hepner et al., 1985; Kliewer et al., 1983;
Neja et al., 1977; Poni et al., 1993a). Applied during the berry growth period, water
deficits usually were associated with smaller berries and sometimes lower yields
(Greenspan et al., 1996; Matthews and Anderson, 1989; McCarthy, 1997; Poni et al.,
1993a; Van Zyl, 1984). The reduction in berry weight results in an increase in berry
skin:flesh ratio and a concentration of skin compounds in the must, especially important

207
in red varieties. The reduction varies according to the severity and timing of the water
deficit imposed. Phase I of berry growth has been reported as the phase where the
effect of a water deficit on berry size is greatest (Matthews and Anderson, 1989; Ojeda
et al., 2002). Applied between veraison and harvest, the effect on berry weight is less
pronounced, while sugar accumulation, flavonol, and anthocyanin production can be
affected (Bravdo et al., 1985; Freeman and Kliewer, 1983; Kennedy et al., 2002;
Kennedy et al., 2000; Matthews and Anderson, 1988; Ojeda et al., 2002).
Results from water deficit experiments do not always agree because of
differences in environment, vine management, and plant material. For example, results
vary by use of greenhouses (Correia et al., 1990; Düring, 1998; Rühl and Alleweldt,
1985), potted vines (Hardie and Considine, 1976; Poni et al., 1993b), mature field-grown
vines (Bravdo et al., 1985; McCarthy, 1997), young vines (Buttrose, 1965; Dry et al.,
2000; Düring, 1998; Hardie and Considine, 1976) and different rootstock-scion
combinations (Iacono et al., 1998). Also contributing to the confusion is whether the
experiments were conducted in irrigated or non-irrigated regions. In typically
non-irrigated districts, under severe natural water deficits, irrigation increased yield and
quality (Delgado et al., 1995; Esteban et al., 1999; Nadal and Arola, 1995). In irrigated
districts, irrigation can be managed to increase or decrease yields and quality (Bravdo et
al., 1985; Myburgh, 2003). For example, without irrigation, fruit had lower titratable
acidity, higher pH, and higher sugar concentration than that from well watered vines
(Esteban et al., 1999; Matthews and Anderson, 1988). Conversely, moderate irrigation
was shown to not affect sugar accumulation (dos Santos et al., 2003), but heavy

208
irrigation reduced sugar accumulation and produced low quality wines (Bravdo et al.,
1985; Freeman, 1983).
The primary goal of the research detailed in this volume was to study in
grapevines the response of photosynthesis and transpiration at the whole-canopy level
to additional water deficits imposed within RDI during the period of berry growth, in a
semi-arid climate, where irrigation management is used to control vigor and increase
fruit quality. In this chapter, yield and berry quality parameters are reported for vines
under standard RDI and under additional water deficits between fruit set and harvest.
5.3. Materials and methods
5.3.1. Yield, yield components, and pruning weights
Vitis vinifera L. cv. Cabernet Sauvignon was planted in 1992 at 1.8 m x 2.7 m
(vine x row spacing) in a north-south row orientation, double-trunked, trained to a
bilateral cordon at 1.06 m on the bottom wire of a two-wire sprawl trellising system, and
spur pruned with 20 to 23 buds per m of row. The 18 sample vines measured by
whole-canopy gas exchange system (chapter 3, this volume) were harvested in both
2002 and 2003 on DOY 262. All other sentinel vines in the 4-ha irrigation study were
harvested at the same time by hand. Vines had been irrigated according to three
irrigation regimens (see chapter 3, this volume for details): 1) standard RDI (S, 70% of
full vine evapotranspiration, FVET, was replaced weekly); 2) early deficit (E, 35% of vine
FVET was replaced weekly between fruit set and veraison); and 3) veraison deficit (V,
35% of vine FVET was replaced weekly between veraison and harvest). When not under
35% deficit, vines in scenarios #2 and #3 were irrigated according to standard RDI

209
practice. Yield and number of clusters per vine were recorded. About 200 berries were
collected from each vine to determine mean berry weight, which was then used to
calculate the number of berries per cluster. Pruning weights were collected on DOY 43
in 2003 and 2004. Leaf area:fruit ratio (LFR; cm2 of leaf area g-1 of fruit) and fruit:pruning
weight ratio (FPR; g of fruit g-1 of pruning weight) were calculated (LFR was calculated
using leaf area data collected the previous growing season; chapter 3, this volume).
Yield and yield components also were recorded from sentinel vines across the 4-ha
block (R. Smithyman, unpublished data).
5.3.2. Berry composition
The same 200 berries used to determine mean berry weight were ground whole
in a blender for 45 s and then filtered through paper (no. 588, Schleicher and Schuell,
Keene, NH). Total soluble solids (Brix), pH, titratable acidity (TA), color density and hue
of the filtrate were measured. Brix were measured using an Abbé refractometer (model
10450, American Optical Corp., Buffalo, NY). A pH meter with glass electrode (model
455, Corning, Kennebunk, ME) was used to measure pH. Titratable acidity was
measured by titrating the filtrate with sodium hydroxide (0.097 N) to an end point of pH
8.2 (20oC) and was expressed as g of tartaric acid/100mL. The absorbance of an aliquot
of 5 mL of the filtrate diluted to a volume of 25 mL with acidified ethanol (pH 1.0) was
read by spectrophotometer (DU 600, Beckman, Irvine, CA) at 420 nm (A420), 520 nm
(A520), and 700nm (A700). Color density was calculated as A420 + A520, and color hue as
A420 / A520. The A700 was used as a control for the filtration step. Color density and hue
were expressed as absorbance units per mL of juice.

210
5.3.3. Non-structural carbohydrates in dormant canes
On DOY 43 in both years, cane samples 2 to 5 cm long were collected above the
second node from the base of all shoots of the 18 experimental vines. Cane pieces were
divided into 1-cm long segments, dried until constant weight at 60oC (about 48 h), and
then ground in a mill at 14000 rpm (ZM100, Retsch, Haan, Germany) in two steps, first
with a screen of 1 mm orifices, and then with a screen of 0.08 mm orifices. About 20 mg
per sample of the powder obtained were used. Soluble sugars and starch were
extracted and analyzed by the same method as leaf tissue (chapter 3, this volume).
5.3.4. Experimental design and statistical analysis
The irrigation experiment was in a completely randomized design with a two way
treatment structure (irrigation and year). Data were analyzed using SAS V8(2) (SAS
Institute, Cary, NC). The univariate procedure was used to test for normality and the
Brown-Forsythe test for homogeneity of variance. The general linear model procedure
(GLM) was used for the analysis of variance and the correlation procedure (Proc CORR)
was used for correlation analysis. The Tukey-Kramer method at a significance of p�0.05
was used for mean comparisons.
5.4. Results
5.4.1. Yield, yield components, pruning weight, and non-structural
carbohydrates
Yields of the 18 experimental vines averaged across both years were
4.8 kg vine-1 (9.8 Mg ha-1). In 2002 yields were higher than in 2003 (Table 5.1;
Figure 5.1-A), in agreement with yields recorded across the larger plot (Figure 5.1-B).

211
Berry weight and LFR were similar between the two seasons, but all other yield-related
variables differed between years (Table 5.1). A significant interaction was found
between irrigation regimen and year in FPR. More shoots and clusters per vine were
recorded in 2003, but those clusters were lighter due to fewer berries per cluster than in
2002. The number of flowers per cluster was significantly higher in 2002 than in 2003,
with no significant difference between years in percentage fruit set (M. Keller,
unpublished data). Fewer flowers per cluster in 2003 could have been due to cold
damage to buds during the fall/winter (DOY 304, 2002, -11oC).
Vines under standard deficit had lower yields, lower cluster weights, and fewer
berries per cluster than vines under additional water deficits (Table 5.1). No differences
in number of clusters per shoot nor in berry weight were recorded among irrigation
regimens. Although vines from all irrigation regimens were dormant-pruned to equal
numbers of buds per vine, V vines had more shoots and clusters per vine, which partially
explained the tendency towards higher yields. Across the larger plot that included the 18
experimental vines, no significant differences were found among treatments
(Figure 5.1-B; R. Smithyman, unpublished data). Across the 4-ha experiment, there was
no consistent effect of additional water deficits on yield or on berry weight in the five
years of the study (Figure 5.1-C; M. Keller, unpublished data).
When correlated against its components with data pooled across both years, yield
variation was explained mainly by cluster weight (r2=0.56; p�0.001) and number of
clusters per shoot (r2=0.21; p�0.001), with cluster weight mainly explained by number of
berries per cluster (r2=0.87; p�0.001). In 2002 yield variations were mainly due to cluster

212
weight (Figure 5.2-B), itself due to number of berries per cluster (Figure 5.2-E). In 2003,
yield variations were mainly explained by cluster weight (Figure 5.2-B) and number of
clusters per vine (Figure 5.2-C), the latter being explained by number of clusters per
shoot (Figure 5.2-D). Cluster weights in 2003 were lower than in 2002 due to fewer
berries per cluster which resulted in lower yields in 2003 although there were more
clusters per vine. Because of the lower yields, vines under standard water deficit had
higher LFR and lower FPR than those under additional water deficit. Pruning weights of
S and V vines were 41% higher than those of E vines. No differences among irrigation
regimens were found in non-structural carbohydrates concentrations in dormant canes.
Concentrations of soluble sugars were significantly higher in 2002 than in 2003, but
there were no significant differences in starch concentrations between years.
5.4.2. Berry composition
In both years vines from all irrigation regimens were harvested on the same day
(DOY 262). High levels of soluble solids were achieved across all irrigation regimens
(Table 5.2). Soluble solids was the only measured quality attribute that differed between
years, although not among irrigation regimens within either year. There was a significant
interaction between year and treatment in pH and color density. In 2002 E fruit had
higher pH than S, but not different from V, the latter also similar to S, while in 2003 S
and E had higher pH than V. In 2002 S and V fruit had higher color density than E, with
no differences among regimens in 2003. Vines under additional water deficit between
fruit set and veraison (E) had the highest pH in both years, while those under additional
water deficit between veraison and harvest (V) had the highest TA, although not different

213
from S. The E vines had lower color density in 2002, but no differences were found in
2003 among irrigation regimens. No differences were recorded in color hue. Sensory
evaluation (S. Spayd, unpublished data) identified no differences among wines produced
from grapes harvested in 1999 and 2001 from the same irrigation regimens.
5.5. Discussion
Among the desired effects of imposing RDI in grapevines, water savings and
improvement of fruit quality, together with limited growth and fruit exposure, are among
the most important (Behboudian and Singh, 2001). The latter sometimes is achieved by
a reduction in berry weight that consequently increases the skin:pulp ratio and thus the
concentration of skin compounds in the must. In this experiment the lack of a difference
in berry weight between the standard deficit and the other two regimens, especially in E
vines, contrary to previous results (Hardie and Considine, 1976; Matthews and
Anderson, 1989; Van Zyl, 1984; Williams and Matthews, 1990), could be explained by
the timing of the water deficit. In 2002 full bloom was around DOY 162, while in 2003
bloom was approximately one week earlier (DOY 155). The additional deficit in E plots
began on DOY 192 in both years, 30 d after bloom in 2002 and 37 d after bloom in
2003. All vines continued to be irrigated, but in E vines reduced water amounts were
applied following the corresponding deficit coefficient and soil water content of the
regimen. The periods from fruit set to veraison (DOY 224 in 2002, DOY 217 in 2003)
were about 55 days in both years, thus E vines were under additional deficit for about
32 d in 2002 and about 25 d in 2003. Fruit growth was reported to respond to plant
water status (Matthews and Anderson, 1988; Ojeda et al., 2002), and a large role of

214
shoot transpiration in the pre-veraison water budget of the berry has been indicated
(Creasy and Lombard, 1993; Greenspan et al., 1994). But despite the lower
transpiration rates at single-leaf and whole-canopy level in E vines in the current
experiment, and the low leaf water potential recorded (R. Smithyman, unpublished data.
See Appendix 4), final berry size was similar to that of S vines. It was previously
reported that before veraison, berries that shriveled during the day when leaf water
potentials dropped below -1.4 MPa, regained much of their volume during the night
(Greenspan et al., 1994), and after veraison, berries have been shown to continue
growing despite low and decreasing leaf water potentials (Creasy and Lombard, 1993;
Matthews et al., 1987). It may be possible that although E vines were irrigated with
smaller water amounts, those amounts were sufficient to avoid further reductions in
berry weight that probably already occurred in the other two regimens (S, V). When
irrigation is based in soil water content, and/or ET, effects on plant physiology may be
more difficult to predict than when it is based on sensing plant stress (Jones, 2004).
Water deficit usually reduces yield, but in this experiment vines under standard
deficit (S) tended to have lower yields than vines under additional water deficit (E, V).
The six S vines selected may have had intrinsically lower yields or the south end of the
vineyard, where whole-canopy measurements were recorded, may have been less
representative of the 4-ha vineyard. However, yield recorded across the plot that
included the 18 experimental vines (R. Smithyman, unpublished data) and across the
4-ha block also showed no consistent effects of irrigation regimen on yield.
Reductions in CO2 fixation have been reported to influence yield or quality
215
indicators only when source limitation develops (Poni et al., 1993a). The balance
between sources and sinks can modulate the effect of water deficit on grape quantity
and quality, and some of the compensation processes that occur in vines (i.e., berry
weight and berries per cluster, or cluster weight and clusters per vine) depend on that
balance. The high LFR and low FPR of all the vines of this experiment compared with
those reported in the literature as “optimum” for achieving high levels of soluble solids
and coloration (Kliewer and Dokoozlian, 2000) suggest sink limitation, which could
explain the apparent lack of effect of the irrigation regimens on yield and berry weight
(Candolfi-Vasconcelos et al., 1994; Kliewer and Dokoozlian, 2000; Poni et al., 1993a).
For well-watered vines, 6 to 15 cm2 of leaf area have been reported to be necessary to
ripen 1 g of fruit (Intrieri et al., 1997; Kaps and Cahoon, 1989; Kliewer and Dokoozlian,
2000; Kliewer and Weaver, 1971) and above 8 to 10 cm2 g-1 there was no increase in
berry weight (Kliewer and Dokoozlian, 2000; May et al., 1969). An FPR below 8 was
suggested as “optimal” for wine quality in well-watered vines (Bravdo et al., 1984), but
these figures depended also on variety and trellis systems used (Kliewer and
Dokoozlian, 2000). The fact that the vines in this experiment were all under some
degree of water deficit but were able to ripen the crop may indicate that they were not
overcropped, and it is possible that they could have ripened higher crops.
Reductions in CO2 fixation due to water deficit can reduce carbohydrate reserves
in grapevines (Christensen, 1975; Freeman et al., 1980; Kliewer et al., 1983; Neja et al.,
1977). Lower pruning weights in E vines, with no reduction in cane starch
concentrations, may suggest lower total carbohydrates in the permanent tissues of the

216
vines. Differences between years in soluble sugars concentrations in canes probably
were not related to minimum air temperatures when cane samples were collected,
because in 2003 minimum temperature was -0.9 oC (at 0700 hr), while in 2004 minimum
temperature was -3.3 oC (at 0400 h). Average minimum temperatures from 5 days
previous to sample collection were -1.5oC in 2003 and -2.5oC in 2004.
At fruit set E vines already had smaller canopies (chapter 3, this volume) than S
or V, which could have been a carry-over effect of lower carbohydrate reserves from the
previous year’s deficit. When the additional water deficit was imposed between fruit set
and veraison, shoots were still growing, increasing the difference between E vines and
those under standard deficit. Root growth and permanent vine structures could have
been an alternative vegetative sink for vines under standard deficit (S), which were fixing
larger amounts of CO2 than those under additional deficit. Previous research has shown
that when assimilates are in excess of fruit demand, they may be partitioned to the roots
(Buttrose, 1965), and that vegetative sinks could replace fruit demand for carbohydrates
(Chaumont et al., 1994; Edson et al., 1995; Williams, 1996). In this experiment, we do
not know whether water deficit affected below-ground carbohydrate reserves because
roots were not collected. It would be reasonable to postulate that the observed reduction
in pruning weight could also have been accompanied by a concomitant reduction in root
biomass, although it is also possible that because of the water deficit, roots could have
been favored as a sink for carbohydrates (Hsiao and Acevedo, 1974; Hsiao and Xu,
2000). Decreases in root fresh weight and starch concentrations were observed in
potted Syrah vines under water stress (Smith, 2004); under similar conditions, main

217
roots were shorter and thinner than those of well-watered Syrah vines (Mapfumo et al.,
1994).
Higher Brix in 2003 than in 2002 can be partly explained by lower yields and
higher air temperatures before harvest. The lack of effect of the irrigation regimens on
soluble solids probably was due to relatively low yields, compared to industry averages
(�14 Mg ha-1) and to LFR, an indication of the source:sink balance. Sugar accumulation
was shown to decrease only when LFR was below 6 cm2 g-1 (Intrieri et al., 1997), well
below the values in this experiment. Because additional water deficits did not reduce
berry size, an expected increase in color density due to smaller berries did not occur.
Other studies have shown that red wine flavonoid content increased when water deficits
were applied post-veraison, but those effects were predominantly due to reductions in
berry weight, and secondarily by modifying biosynthesis (Kennedy et al., 2002). When
comparing berries of similar sizes, concentrations of phenolics and anthocyanins were
higher in the skins of berries from vines that had experienced water deficit, suggesting
that a reduction in berry size by water deficit was not the sole cause of more
concentrated musts (Roby et al., 2004).
5.6. Conclusion
Additional water deficit within RDI did not affect yield or berry quality indicators.
Relatively low yields compared to industry averages for cv. Cabernet Sauvignon, and
the timing of the water deficit between fruit set and veraison were the probable causes
of the lack of effect on berry size. High LFR in all vines probably masked the lower CO2
fixation. Although the latter and leaf water potential were reduced in the vines under

218
additional deficit, the high LFR buffered those processes from affecting fruit growth and
ripening. Decisions on irrigation management should take into account LFR to achieve
the desired results of RDI and to understand the physiological effects of this
management practice. It seems possible to achieve more water savings under RDI and
additional deficits without negatively affecting yield and fruit composition.

219
5.7. References
Behboudian, M. H. and Singh, Z.; 2001: Water relations and irrigation scheduling ingrapevine. Horticultural Reviews 27, 189-225.
Boyer, J. S.; 1982: Plant productivity and environment. Science 218, 443-448.
Bravdo, B.; Hepner, Y.; Loinger, C.; Cohen, S.; Tabacman, H.; 1984: Effect of crop levelon growth, yield and wine quality of a high yielding Carignane vineyard. AmericanJournal of Enology and Viticulture 35, 247-252.
Bravdo, B.; Hepner, Y.; Loinger, C.; Cohen, S.; Tabacman, H.; 1985: Effect of irrigationand crop level on growth, yield and wine quality of Cabernet Sauvignon.American Journal of Enology and Viticulture 36, 132-139.
Buttrose, M. S.; 1965: The effect of reducing leaf area on the growth of roots, stems andberries of Gordo grapevines. Vitis 5, 455-464.
Candolfi-Vasconcelos, M. C.; Koblet, W.; Howell, G. S.; Zweifel, W.; 1994: Influence ofdefoliation, rootstock, training system and leaf position on gas exchange of Pinotnoir grapevines. American Journal of Enology and Viticulture 45, 173-180.
Chaumont, M.; Morot-Gaudry, J. F.; Foyer, C. H.; 1994: Seasonal and diurnal changesin photosynthesis and carbon partitioning in Vitis vinifera leaves in vines with andwithout fruit. Journal of Experimental Botany 45, 1235-1243.
Christensen, P.; 1975: Response of Thompon seedless grapevines to the timing ofpreharvest irrigation cut-off. American Journal of Enology and Viticulture 26, 188-194.
Correia, M. J.; Chaves, M. M. C.; Pereira, J. S.; 1990: Afternoon depression inphotosynthesis in grapevine leaves - evidence for a high light stress effect.Journal of Experimental Botany 41, 417-426.
Creasy, G. L. and Lombard, P. B.; 1993: Vine water stress and peduncle girdling effectson pre- and post-veraison grape berry growth and deformability. AmericanJournal of Enology and Viticulture 44, 193-197.
Delgado, E.; Vadell, J.; Aguilo, F.; Escalona, J. M.; Medrano, H.; 1995: Irrigation andgrapevine photosynthesis. In: Photosynthesis: from Light to Biosphere. P. Mathis(ed.). Kluwer academic publishers 4, 693-696.
dos Santos, T. P.; Lopes, C.; Rodrigues, M. L.; de Souza, C. R.; Maroco, J.; Pereira, J.S.; Silva, J. R.; Chaves, M. M.; 2003: Partial root zone drying: effects on growth

220
and fruit quality of field-grown grapevines (Vitis vinifera). Functional Plant Biology30, 663-671.
Dry, P. R.; Loveys, B. R.; Düring, H.; 2000: Partial rootzone drying of grape. I. Transientchanges in shoot growth and gas exchange. Vitis 39, 3-7.
Düring, H.; 1998: Photochemical and non-photochemical responses of glasshouse-grown grape to combined light and water stress. Vitis 37, 1-4.
Edson, C. E.; Howell, G. S.; Flore, J. A.; 1995: Influence of crop load on photosynthesisand dry matter partitioning of Seyval Grapevines III. Seasonal Changes in singleleaf and whole vine photosynthesis. American Journal of Enology and Viticulture 46, 478-485.
Esteban, M. A.; Villanueva, M. J.; Lissarrague, J. R.; 1999: Effect of irrigation onchanges in berry composition of Tempranillo during maturation. Sugars, organicacids, and mineral elements. American Journal of Enology and Viticulture 50,418-434.
Freeman, B. M.; 1983: Effects of irrigation and pruning of Shiraz grapevines onsubsequent red wine pigments. American Journal of Enology and Viticulture 34,23-26.
Freeman, B. M. and Kliewer, W. M.; 1983: Effect of irrigation, crop level and potassium on Carignane vines. II. Grape and wine quality. American Journal of Enology andViticulture 34, 197-207.
Freeman, B. M.; Lee, T. H.; Turkington, C. R.; 1980: Interaccion of irrigation and pruninglevel on grape and wine quality of Shiraz vines. American Journal of Enology andViticulture 31, 124-135.
Gifford, R. M.; Thorne, J. H.; Hitz, W. D.; Giaquinta, R.; 1984: Crop productivity andphotoassimilate partitioning. Science 225 , 801-808.
Greenspan, M. D.; Schultz, H. R.; Matthews, M. A.; 1996: Field evaluation of watertransport in grape berries during water deficits. Physiologia Plantarum 97, 55-62.
Greenspan, M. D.; Shackel, K. A.; Matthews, M. A.; 1994: Developmental changes inthe diurnal water budget of the grape berry exposed to water deficit. Plant, Celland Environment 17, 811-820.
Hardie, W. J. and Considine, J. A.; 1976: Response of grapes to water-deficit stress inparticular stages of development. American Journal of Enology and Viticulture 27,55-61.

221
Hepner, Y. and Bravdo, B.; 1985: Effect of crop level and drip irrigation scheduling onthe potassium status of Cabernet Sauvignon and Carignane vines and itsinfluence on must and wine composition and quality. American Journal of Enologyand Viticulture 36, 140-147.
Hepner, Y.; Bravdo, B.; Loinger, C.; Cohen, S.; Tabacman, H.; 1985: Effect of dripirrigation schedules on growth, yield, must composition and wine quality CabernetSauvignon. American Journal of Enology and Viticulture 36, 77-85.
Hsiao, T. C. and Acevedo, E.; 1974: Plant responses to water deficits, water-useefficiency, and drought resistance. Agricultural Meteorology 14, 59-84.
Hsiao, T. C. and Xu, L. K.; 2000: Sensitivity of growth of roots versus leaves to waterstress: biophysical analysis and relation to water transport. Journal ofExperimental Botany 51, 1595-1616.
Iacono, F.; Buccella, A.; Peterlunger, E.; 1998: Water stress and rootstock influence onleaf gas exchange of grafted and ungrafted grapevines. Scientiae Horticulturae 75, 27-39.
Intrieri, C.; Poni, S.; Rebucci, B.; Magnanini, E.; 1997: Effects of canopy manipulationson whole-vine photosynthesis: results from pot and field experiments. Vitis 36, 167-173.
Jackson, D. I. and Lombard, P. B.; 1993: Environmental and management practicesaffecting grape composition and wine quality - A review. American Journal ofEnology and Viticulture 44, 409-430.
Jones, H. G.; 2004: Irrigation scheduling: advantages and pitfalls of plant-basedmethods. Journal of Experimental Botany 55, 2427-2436.
Kaps, M. and Cahoon, G. A.; 1989: Berry thinning and cluster thinning influencevegetative growth, yield, fruit composition, and net photosynthesis of "Seyvalblanc" grapes. Journal of the American Society for Horticultural Science 114, 20-20.
Kennedy, J. A.; Matthews, M. A.; Waterhouse, A. L.; 2002: Effect of maturity and vinewater status on grape skin and wine flavonoids. American Journal of Enology andViticulture 53, 268-274.
Kennedy, J. A.; Matthews, M. M.; Waterhouse, A. L.; 2000: Changes in grape seedpolyphenols during fruit ripening. Phytochemistry 55, 77-85.
Kliewer, W. M. and Dokoozlian, N. K.; 2000: Leaf area/crop weight ratios of grapevines:

222
influence on fruit composition and wine quality, p.285-295. In: Proceedings of theAmerican Society of Enology and Viticulture 50th Anniversary Annual Meeting.Seattle, WA.
Kliewer, W. M.; Freeman, B.; Hossom, C.; 1983: Effect of irrigation, crop level andpotassium fertilization on Carignane vines. I. Degree of water stress and effect ongrowth and yield. American Journal of Enology and Viticulture 34, 186-196.
Kliewer, W. M. and Weaver, J.; 1971: Effect of crop level and leaf area on growth,composition, and coloration of 'Tokay' grapes. American Journal of Enology andViticulture 22, 172-177.
Mapfumo, E.; Aspinall, D.; Hancock, T. W.; 1994: Growth and development of roots ofgrapevine (Vitis vinifera L.) in relation to water uptake from soil. Annals of Botany74, 75-85.
Matthews, M. A. and Anderson, M. M.; 1988: Fruit ripening in Vitis vinifera L.:Responses to seasonal water deficits. American Journal of Enology andViticulture 39, 313-320.
Matthews, M. A. and Anderson, M. M.; 1989: Reproductive development in grape (Vitisvinifera L.). Responses to seasonal water deficits. American Journal of Enologyand Viticulture 40, 52-60.
Matthews, M. A.; Anderson, M. M.; Schultz, H. R. ; 1987: Phenologic and growthresponses to early an late season water deficits in Cabernet franc. Vitis 26, 147-160.
May, P.; Shaulis, N. J.; Antcliff, A. J.; 1969: The effect of controlled defoliation in thesultana vine. American Journal of Enology and Viticulture 20, 237-250.
McCarthy, M. G.; 1997: The effects of transient water deficit on berry development of cv.Shiraz (Vitis vinifera L.). Australian Journal of Grape and Wine Research 3, 102-108.
McCarthy, M. G.; 2000: Developmental variation in sensitivity of Vitis vinifera L. (Shiraz)berries to soil water deficit. Australian Journal of Wine and Grape Research 6,136-140.
Myburgh, P. A.; 2003: Responses of Vitis vinifera L. cv. Sultanina to water deficits duringvarious pre- and post-harvest phases under semiarid conditions. South AfricanJournal of Enology and Viticulture 24, 25-33.
Nadal, M. and Arola, L.; 1995: Effects of limited irrigation on the composition of must

223
and wine of Cabernet Sauvignon under semi-arid conditions. Vitis 34, 151-154.
Naor, A.; Bravdo, B.; Hepner, Y.; 1993: Effect of post-veraison irrigation level onSauvignon blanc yield, juice quality and water relations. South African Journal ofEnology and Viticulture 14, 19-25.
Neja, R. A.; Wildman, W. E.; Ayers, R. S.; Kasimatis, A. N.; 1977: Grapevine responseto irrigation and trellis treatments in the Salinas Valley. American Journal ofEnology and Viticulture 28, 16-26.
Ojeda, H.; Anadary, C.; Kraeva, E.; Carbonneau, A.; Deloire, A.; 2002 : Influence of pre-and postveraison water deficit on synthesis and concentration of skin phenoliccompounds during berry growth of Vitis vinifera cv. Shiraz. American Journal ofEnology and Viticulture 53, 261-267.
Poni, S.; Lakso, A. N.; Turner, J. R.; Melious, R. E.; 1993a: The effects of pre- and post-veraison water stress on growth and physiology of potted Pinot noir grapevines atvarying crop levels. Vitis 32, 207-214.
Poni, S.; Lakso, A. N.; Turner, J. R.; Melious, R. E.; 1994: Interactions of crop level andlate season water stress on growth and physiology of field-grown Concordgrapevines. American Journal of Enology and Viticulture 45, 252-258.
Poni, S.; Marchiol, L.; Intrieri, C.; Zerbi, G.; 1993b: Gas exchange response ofgrapevines leaves under fluctuating light. Vitis 32, 137-143.
Roby, G.; Harbertson, J. F.; Adams, D. A.; Matthews, M. A.; 2004: Berry size and vinewater deficits as factors in winegrape composition: anthocyanins and tannins.Australian Journal of Grape and Wine Research 10, 100-107.
Rühl, E. and Alleweldt, G.; 1985: Investigations into the influence of the time of irrigationon yield and quality of grape-vines. Acta Horticulturae 171, 457-462.
Smith, J. P.; 2004: Investigations into the mechanisms underlying grapevine rootstockeffects on scion vigor and yield. Ph.D. Thesis, Charles Sturt University, WaggaWagga, NSW, Australia.
Van Zyl, J. L.; 1984: Response of Colombar grapevines to irrigation as regards qualityaspects and growth. South African Journal of Enology and Viticulture 5, 19-28.
Williams, L. E.; 1996: Grape, p. 851-881. In: Photoassimilates distribution in plants andcrops. Source-sink relationships. E. Zamski and A. A. Schaffer (Eds.). MarcelDecker, Inc. New York.

224
Williams, L. E. and Matthews, M. A.; 1990: Grapevine, p. 1019-1055. In: Irrigation ofagricultural crops. Agronomy monograph 30. B. A. Stewart and D. R. Nielsen(Eds.). American Society of Agronomy, Madison, Wisconsin.

225
Table 5.1: Yield, yield components, pruning weight, and non-structural carbohydrates in canes ofvines cv. Cabernet Sauvignon under standard and additional water deficit within RDI.
Irrigation regimens Year p values
Variables S E V 2002 2003 treat year treat*year
Yield (kg vine-1) 3.8 c 4.9 b 5.6 a 5.4 4.2 0.001 0.001 0.245
No. shoots vine-1 69 b 70 b 84 a 62 87 0.001 0.001 0.129
No. of clusters vine-1 93 b 97 ab 109 a 93 109 0.026 0.005 0.076
No. clusters shoot-1 1.4 1.4 1.4 1.4 1.2 0.731 0.003 0.163
Cluster weight (g) 41 b 52 a 51 a 58 38 0.001 0.001 0.135
Berries cluster-1 43 b 55 a 55 a 59 41 0.002 0.001 0.257
Berry weight (g) 0.95 0.94 0.97 0.98 0.93 0.779 0.124 0.962
Leaf area / fruit weight z
(cm2 g-1)23.3 a 15.1 b 18.9 b 18.0 20.4 0.001 0.059 0.688
Pruning weight (kg vine-1)
1.1 a 0.8 b 1.1 a 1.12 0.93 0.001 0.001 0.534
Fruit weight/pruning weight 3.3 c 6.5 a 4.8 b 4.9 4.8 0.001 0.691 0.021
Starch (mg g-1 DW) 100 105 105 107 99 0.825 0.252 0.823
Sol. sugars (mg g-1 DW) 13 13 15 18 10 0.140 0.001 0.269
Values with different letters within rows are significantly different at p�0.05 by Tukey-Kramer.z Leaf area data are presented in chapter 3, this volume.

226
Table 5.2: Fruit composition of vines under standard and under additional water deficit withinRDI.
Irrigation regimens Year p values
Variable S E V 2002 2003 treat year treat*year
Brix 26.4 26.0 26.1 25.6 26.8 0.274 0.001 0.369
pH 3.71 b 3.81 a 3.70 b 3.7 3.7 0.002 0.140 0.017
TA z 0.59 ab 0.54 b 0.64 a 0.60 0.58 0.001 0.248 0.057
Color density y 16.0 14.9 15.1 15.1 15.6 0.134 0.395 0.020
Color hue y 0.20 0.20 0.20 0.20 0.20 0.697 0.104 0.337
Values with different letters within rows are significantly different at p�0.05 by Tukey-Kramer.z Expressed as g of tartaric acid per 100 mL of juice.y Expressed as absorbance units per mL of juice.
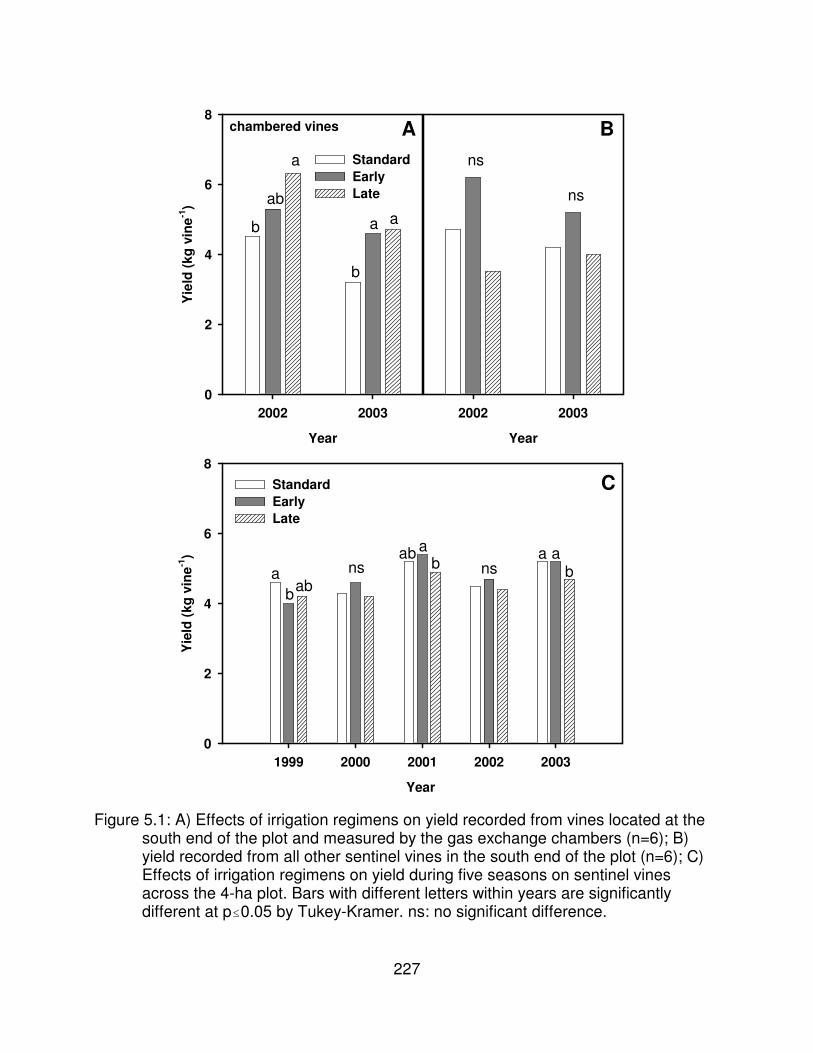
227
Year
2002 2003
Year
2002 2003
Yie
ld (k
g vi
ne-1
)
0
2
4
6
8
StandardEarlyLate
chambered vines A B
Year
1999 2000 2001 2002 2003
Yie
ld (k
g vi
ne-1
)
0
2
4
6
8StandardEarlyLate
C
b
ab
a
aa
b
ns
ns
nsaabb
ab
abns
a ab
Figure 5.1: A) Effects of irrigation regimens on yield recorded from vines located at thesouth end of the plot and measured by the gas exchange chambers (n=6); B)yield recorded from all other sentinel vines in the south end of the plot (n=6); C)Effects of irrigation regimens on yield during five seasons on sentinel vinesacross the 4-ha plot. Bars with different letters within years are significantlydifferent at p�0.05 by Tukey-Kramer. ns: no significant difference.

228
Number of shoots per vine
40 50 60 70 80 90 100
Yie
ld (k
g vi
ne-1
)
2
3
4
5
6
7
8
Number of clusters per vine
60 80 100 120 140
Yie
ld (k
g vi
ne-1
)
2
3
4
5
6
7
8
Number of clusters per shoot
1.0 1.5 2.0
Cluster weight (g)
30 40 50 60 70 80
Number of berries per cluster
40 60 80 100
Yie
ld (k
g vi
ne-1
)
2
3
4
5
6
7
8
Berry weight (g)
0.85 0.90 0.95 1.00
2002r2=0.19p=0.060
2002r2=0.40p=0.004
2002r2=0.18p=0.071
2002r2=0.22p=0.045
2002r2=0.005p=0.78
2002R2=0.06p=0.320
A B
D
FE
C
2003r2=0.14p=0.152
2003r2=0.34p=0.016
2003r2=0.62p=0.001
2003r2=0.17p=0.105
2003r2=0.32p=0.021
2003r2=0.03p=0.472
Figure 5.2: Relationships between yield and yield components. The correlations werecomputed for the 18 experimental vines. (�,�) standard deficit; (�, �) earlydeficit; ( , ) late deficit. Open symbols 2002, closed symbols 2003.
229
CHAPTER 6
GENERAL CONCLUSIONS
Previous research has shown that water deficits imposed on wine grapes
influence fruit yield and quality. Water deficits occur in vineyards all around the world. In
regions where profitable viticulture depends on irrigation, the timing and amount of water
applied are among the most important vineyard management decisions. They determine
not only grape quality and quantity, but also the condition in which vines will entre
dormancy and initiate the following growing season. Particularly in eastern Washington,
because of the short growing season, the challenge of growers is to produce grapes with
the fruit characteristics demanded by winemakers and end the growing season with
vineyards prepared to withstand cold winters. To face this challenge, growers of
premium and ultra premium grapes have adopted regulated deficit irrigation (RDI) as
their standard irrigation practice. In the search for higher quality and water savings,
additional water deficits have been imposed on vines that were already under some
degree of water deficit during the berry growth period. Although it is known that water
deficits affect yield and quality, it is still debated how to manage those deficits to achieve
the desired goals of fruit quality and yield. Only by understanding the physiology affected
by water deficits will this be possible.
The physiological process responsible for yield and quality is photosynthesis, thus
it is reasonable to study vine photosynthesis under water deficit. Water deficit affects the
whole vine, the response being an integration of the responses of all the organs that
230
constitute the vine. For this investigation, a whole-canopy gas exchange system was
designed, built, tested, and used. In an RDI experiment initiated in 1999 in a commercial
vineyard, whole-canopy photosynthesis and transpiration were measured during two
growing seasons, 2002 and 2003. Three irrigation regimens were imposed within RDI:
vines under the standard RDI regimen were irrigated during the berry growth period at
about 60 to 70% of FVET. Vines under an early additional water deficit were irrigated
between fruit set and veraison at about 30 to 35% of full vine evapotranspiration
(FVET), while vines under a late additional water deficit were irrigated between veraison
and harvest at about 30 to 35% of FVET. After harvest all vines were irrigated at FVET.
At the same phenological stages that whole-canopy measurements were taken,
single-leaf measurements of photosynthesis and transpiration were also recorded,
together with leaf tissue samples for non-structural carbohydrate analysis.
Additional water deficits induced significant reductions in photosynthesis and
transpiration that were associated mainly with reductions in canopy conductance. Lower
instantaneous photosynthetic rates during for example the so-called “afternoon
depression of photosynthesis” also were related to reduction in canopy conductance.
Vine photosynthesis and transpiration responded rapidly to irrigation events, probably
enhanced in this experiment by the sandy soil and the small soil volume wetted by the
drip irrigation system. Considering the entire period between fruit set and leaf fall, the
total amount of CO2 fixed was considerably reduced by the early additional water deficit,
with only small difference between the standard and the late deficit regimens.
Differences in carbon fixation were reflected in the lower pruning weights of the vines

231
under early additional deficit, suggesting that those vines ended the growing season with
lower levels of carbohydrate reserves than those from the other two irrigation regimens.
Because average yields were low (9.8 Mg ha-1), it is possible that low reserves were not
problematic for ripening the fruit or for initial growth the following spring. Originally this
experiment set a target crop level of 14.8 Mg ha-1.
Contrary to what was expected, no consistent effects on yield or quality were
detected due to additional water deficits imposed during the berry growth period. After
fruit set, when the early deficit was imposed, the clusters were a stronger sink then
during bloom. Although the early deficit induced large reductions in CO2 fixation and
transpiration, reductions apparently were not severe enough to affect berry size.
Alternatively, the early deficit was applied after the main burst of cell division. After fruit
set, the number of berries per vine is determined, clusters increase in sink strength, and
the sink strength of other organs may decline, leaving them more susceptible to water
deficit (e.g., shoots and roots). The high leaf area:fruit ratio of the experimental vines
may have buffered the impact of extra deficits on berry size and fruit ripening. Although
there were large reductions in CO2 fixation and transpiration relative to standard RDI
vines, absolute amounts of carbon fixed were sufficient to ripen the fruit in all irrigation
regimens at these low yields. Non-structural carbohydrates in the leaves were in general
similar among irrigation regimens, except for starch concentration in the afternoon in
those vines under additional water deficit at times of high evapotranspiration (pre- and
post-veraison). Despite those lower starch concentrations, starch was always higher
during the afternoon than during the morning, indicating that even vines under additional
232
water deficits accumulated starch in leaves during the day.
Also contrary to what was expected, vines under additional water deficit were not
more efficient in water use than those under standard deficit, unless one computes
water use efficiency as the ratio of yield per unit water transpired. Reductions in
transpiration were paralleled by reductions in photosynthesis in all irrigation regimens.
Intrinsic water use efficiencies (carbon fixed per unit canopy conductance) were similar
among irrigation regimens, indicating a tight relationship between conductance and
photosynthesis. Thus under deficit irrigation, savings in irrigation water are achieved at
the expense of photosynthesis, the consequences of which depend on yield and
geography. This could be of less concern in regions with longer growing seasons, but of
more concern in eastern Washington, where because of the short growing season there
is less time available to ripen the fruit and replenish reserves in the vine.
Photosynthesis measurements from single leaves detected differences among
irrigation regimens, but were not well-correlated with whole canopy measurements.
Single-leaf measurements are useful to study the response to water deficits of leaves at
different locations within the canopy, rather than the integrated canopy response.
However, for application to management practices, results from whole-canopy
measurements are much more representative and closely related to real vineyard
situations. More experiments that study the response to management practices in field
grown vines should be undertaken. Whole-canopy chambers and their operation are not
much more expensive than those for single leaf measurements, especially considering
the usefulness of information provided by them on vineyard responses.

233
Those growers already applying or planning to adopt RDI with additional deficits
should be aware of the reduction in CO2 fixation that will be imposed in their vines.
Moreover, growers should consider the modulating effect that the source:sink balance
(e.g., canopy:fruit) can have on the response of the vine, and determine in their
vineyards which balance will achieve the desired effect of a certain practice like RDI.
The results of this study should be shown to those who govern water allocation issues,
which sometimes take into account only crop yield. Under this scenario, vineyards under
water deficits may appear to have very high water use efficiencies. If water policy
considers only yield, mis-informed policies could remove water allocations from
vineyards in absence of enough information about the long term effects of RDI on vines.
Future research based on RDI that includes variation in source:sink balance
would provide insight for more informed decisions with respect to water management: 1)
Whole-canopy photosynthesis and transpiration of vines under different irrigation
regimens from before bloom until fruit set when number of berries per vine is
determined, with treatments such as increasing irrigation amounts and or frequencies; 2)
Whole-canopy photosynthesis and transpiration of vines under different irrigation
regimens from before bloom until fruit set, with the addition of treatments like hedging or
removing shoot tips to eliminate competition with clusters; 3) Whole-canopy
photosynthesis and transpiration of vines under different irrigation regimens in which a
high number of buds have been left at winter pruning, or even under minimal pruning, to
indicate the maximum number of viable flowers and berries that a vine can support in an
area like eastern Washington; 4) Include in the studies total biomass of the plant (i.e.,

234
cordon, trunk, and roots); 5) Use of this information to develop irrigation indices or
validate the deficit index proposed in this volume, tying irrigation to vine physiology; and
6) Use of decision criteria for RDI that are primarily based on plant water indicators and
follow variables like soil water content or ET as complementary information.