
WHOLE BUILDING VENTILATION OF HIGH RISE … · WHOLE BUILDING VENTILATION OF HIGH RISE CONDOMINIUM...
24
1 WHOLE BUILDING VENTILATION OF HIGH RISE CONDOMINIUM WITH ELEVATED RADON FROM CONCRETE Bill Brodhead WPB Enterprises, Inc., 2844 Slifer Valley Rd., Riegelsville, PA USA [email protected] www.wpb-radon.com Tom Hatton Clean Vapor, LLC, 3 Maple Street, Andover, NJ 07821 thatton@cleanvapor.com www.cleanvapor.com ABSTRACT The authors designed and installed a whole building ventilation system for a 100 unit five story high rise condominium building that had elevated radon levels on every floor. The building had two levels of ventilated garages under part of the building. Each floor was constructed with post stressed concrete floors and ceilings. Previous diagnostics revealed the low ventilation rate and high radon emanation rate from the concrete was the primary reason for the elevated radon. The radon reduction in the bedrooms of one unit was pre-tested with the bedroom doors closed, the HVAC air handler off and outdoor air introduced into only the main living area of the unit to determine if single point ventilation would treat an entire condominium. The installed whole building ventilation system routed conditioned air from the roof to a single location in each unit of the building. Post mitigation radon measurements indicated that the system is successfully reducing the radon levels below the guideline.
Transcript of WHOLE BUILDING VENTILATION OF HIGH RISE … · WHOLE BUILDING VENTILATION OF HIGH RISE CONDOMINIUM...

1
WHOLE BUILDING VENTILATION OF HIGH RISE CONDOMINIUM
WITH ELEVATED RADON FROM CONCRETE
Bill Brodhead
WPB Enterprises, Inc., 2844 Slifer Valley Rd., Riegelsville, PA USA [email protected] www.wpb-radon.com
Tom Hatton
Clean Vapor, LLC, 3 Maple Street, Andover, NJ 07821 [email protected] www.cleanvapor.com
ABSTRACT The authors designed and installed a whole building ventilation system for a 100 unit five story high rise condominium building that had elevated radon levels on every floor. The building had two levels of ventilated garages under part of the building. Each floor was constructed with post stressed concrete floors and ceilings. Previous diagnostics revealed the low ventilation rate and high radon emanation rate from the concrete was the primary reason for the elevated radon. The radon reduction in the bedrooms of one unit was pre-tested with the bedroom doors closed, the HVAC air handler off and outdoor air introduced into only the main living area of the unit to determine if single point ventilation would treat an entire condominium. The installed whole building ventilation system routed conditioned air from the roof to a single location in each unit of the building. Post mitigation radon measurements indicated that the system is successfully reducing the radon levels below the guideline.

2
1.0 GENERAL BUILDING INFORMATION
The building described in this paper is five stories tall with 100 condominium units. Most of the
building has ground contact. A portion of the building has a two story garage that is connected
below grade to an adjoining eight story 110 condominium unit building that is not part of this
project. The building was constructed between 2001 and 2002. In a previously published paper
in 2008 Brodhead described elevated radon levels in different units on every floor of both
buildings that was caused by the low ventilation rate of the condominium units and radon
emanation coming from the concrete. The building was initially having condensation problems
on the windows caused by low ventilation rates. The units were all constructed with concrete
floors and ceilings. All of the units have exterior and interior metal stud framed walls that are
covered with drywall. There are drywall covered suspending ceilings in most of the units. Units
that are adjacent to stairwells and utility rooms have additional concrete exposure from the
concrete walls that surround these rooms. There are multiple concrete beams throughout the
building supporting the concrete slabs. The flooring material is a combination of carpet, wood,
vinyl and tile floors. Eleven different units were measured with closed house conditions in 2007.
The radon levels varied from 5.9 pCi/L to 13.2 pCi/l (218 to 481 Bq/m3).
In the Fall of 2007 WPB made a diagnostic study of the radon emanation rate coming from the
concrete and the air change per hour (ACH) ventilation rate.1 The ventilation rates were
determined to be as low as 0.05 air changes per hour (ACH). The radon emanation from the
concrete of both buildings was measured using a direct flux test of the concrete by sealing E-
Perms in an accumulator. This method determined the radon emanation rate to range from about
30 to 50 pCi/ft2/hour (200 to 332 Bq/m
2/min). This emanation and ventilation rate was
determined to be the cause of the elevated radon levels.
The building was not designed with any common mechanical exhaust or ventilation fans since
there are no common bathrooms or laundry rooms that would require this type of ventilation.
Each individual condo unit has bathroom exhaust fans and a dryer exhaust. The range hoods are
re-circulating. All units have operable windows and most units have one or more glass doors
leading to an outside patio. Heating and air conditioning in each unit is provided by a heat pump
with the compressor on the roof. The air handling components of these units are located totally
inside the condo unit. No condo unit shares an HVAC system. The hallways are also
conditioned by their own heat pumps with no introduction of outside air.
2.0 VENTILATION DISTRIBUTION TEST
The HVAC operation in the condo units is predominately for cooling and humidity control. The
location of the building in a mid-Atlantic state, air tight construction and size of the condo units
minimizes the need for supplemental heat. There are significant periods during the heating
season when the air handler does not need to operate. The Condo Association and engineering
company hired by the association questioned whether introduction of outdoor air in a single
3
location in the building when the air handler was not operating would provide adequate radon
reduction throughout the condo unit since the source was in each room.
WPB was hired by the condo association to perform a ventilation test in order to determine both
if single location outdoor ventilation would reduce the radon levels in the adjoining bedrooms
when the bedroom doors are closed and the air handler is off and to confirm the amount of
ventilation needed. Note that when the air handler is operating there will likely be no
differentiation in radon levels when the bedroom doors are closed.
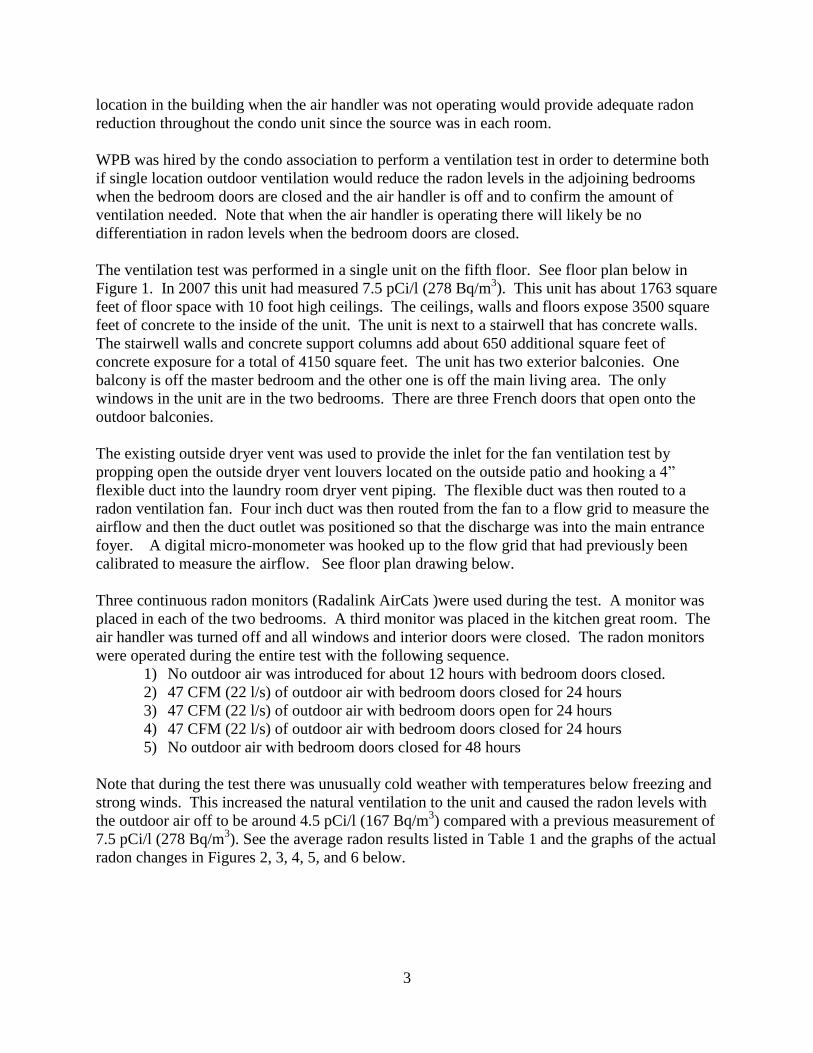
The ventilation test was performed in a single unit on the fifth floor. See floor plan below in
Figure 1. In 2007 this unit had measured 7.5 pCi/l (278 Bq/m3). This unit has about 1763 square
feet of floor space with 10 foot high ceilings. The ceilings, walls and floors expose 3500 square
feet of concrete to the inside of the unit. The unit is next to a stairwell that has concrete walls.
The stairwell walls and concrete support columns add about 650 additional square feet of
concrete exposure for a total of 4150 square feet. The unit has two exterior balconies. One
balcony is off the master bedroom and the other one is off the main living area. The only
windows in the unit are in the two bedrooms. There are three French doors that open onto the
outdoor balconies.
The existing outside dryer vent was used to provide the inlet for the fan ventilation test by
propping open the outside dryer vent louvers located on the outside patio and hooking a 4”
flexible duct into the laundry room dryer vent piping. The flexible duct was then routed to a
radon ventilation fan. Four inch duct was then routed from the fan to a flow grid to measure the
airflow and then the duct outlet was positioned so that the discharge was into the main entrance
foyer. A digital micro-monometer was hooked up to the flow grid that had previously been
calibrated to measure the airflow. See floor plan drawing below.
Three continuous radon monitors (Radalink AirCats )were used during the test. A monitor was
placed in each of the two bedrooms. A third monitor was placed in the kitchen great room. The
air handler was turned off and all windows and interior doors were closed. The radon monitors
were operated during the entire test with the following sequence.
1) No outdoor air was introduced for about 12 hours with bedroom doors closed.
2) 47 CFM (22 l/s) of outdoor air with bedroom doors closed for 24 hours
3) 47 CFM (22 l/s) of outdoor air with bedroom doors open for 24 hours
4) 47 CFM (22 l/s) of outdoor air with bedroom doors closed for 24 hours
5) No outdoor air with bedroom doors closed for 48 hours
Note that during the test there was unusually cold weather with temperatures below freezing and
strong winds. This increased the natural ventilation to the unit and caused the radon levels with
the outdoor air off to be around 4.5 pCi/l (167 Bq/m3) compared with a previous measurement of
7.5 pCi/l (278 Bq/m3). See the average radon results listed in Table 1 and the graphs of the actual
radon changes in Figures 2, 3, 4, 5, and 6 below.

4
Set up Kitchen
pCi/L
Kitchen
reduction
Master
pCi/L
Master
reduction
Guest
pCi/L
Guest
reduction
Fan off -
doors closed 3.4
5.1
4.8
Fan on -
doors closed 1.0 - 75% 2.7 - 45% 3.1
Fan on -
doors open 1.8 - 54% 1.9 - 61% 2.1
Fan on -
doors closed 1.0 - 75% 2.4 - 51% 3.0
Fan off -
doors closed 4.5
4.7
4.7
Note that the radon levels in the bedrooms and the kitchen are almost the same when the
bedroom doors are left open. This indicates the ventilation system discharge into the main living
area does not need any additional forced circulation when these doors are open.
When the bedroom doors are closed the kitchen radon levels decrease from 1.8 pCi/L to 1.0
pCi/L (67 to 37 Bq/m3) while the bedroom radon levels increase from an average of 2.0 pCi/L to
an average of 2.8 pCi/L(74 to 104 Bq/m3). The radon levels in the bedroom are still below the
EPA guideline at this ventilation rate into the building (0.26 ACH). The master bedroom door
had a larger gap under the door than the guest bedroom. This is the likely cause of the guest
bedroom having a higher radon level when the doors were closed than the master bedroom.
If the induced mechanical ventilation rate is 0.3 ACH and the natural ventilation rate is only 0.03
ACH during mild weather conditions, the total ventilation will be 97 CFM (46 l/s) which will
likely reduce the average radon in the bedrooms down to 2.2 pCi/L (81 Bq/m3) when the
bedroom doors are closed and 1.5 pCi/L (56 Bq/m3) when the bedroom doors are open.
See Figure 2 through 6 below for actual recorded data.
Table 1 Radon levels during each testing phase

5
Figure 1 Unit 504 Floor Plan & Ventilation Test
10' 0"
3/16" = 1' 0"
Ha
llwa
y
WH
Outside
balcony
Bedroom
Bedroom
Connect
to Dryer
vent
Prop open
Dryer
exhaust
Seal
Hallway fan
opening
KitchenCloset
Bathroom
Study
2' - 4"
PVC
2 ft & 4 ft
of 4" PVCFlow grid
Micro-monometer
between PVC pipes
4" flexible
ductRadon
Fan
Damper
CRM
CRM
CRM
4" flexible
duct
Place nylon
stocking on
exhaust to
catch any lint
Note: Adjoining
concrete walls

6
0.0
1.0
2.0
3.0
4.0
5.0
6.0
7.0
8.0
nn
Unit 504 Kitchen Ventilation test 11/18-24/08
47 CFM OA 0.16 ACH
Ventilation fan off
Ventilation fan on
Wed Thurs Fri Sat
pCi/l
nn nn Sun Mon nn nn nn
Ventilation fan off
Bedroom doors open
Bedroom doors closed
Bedroom doors closed
Note: 0.3 ACH = 88 CFM 0.021 CFM /ft2 concrete
31.3 CFM OA
0.1 ACH
78.3 CFM OA
0.26 ACH
Concrete emanation
58 pCi/ft2/hr
4125 ft2 Concrete 1763 ft2
17630 ft3
Figure 2 Kitchen results

7
0.0
1.0
2.0
3.0
4.0
5.0
6.0
7.0
8.0
nn
Unit 504 Guest Bedroom
Ventilation Test 11/18 - 24/08
47 CFM OA Note: 0.3 ACH = 88 CFM
Bedroom doors open
Ventilation fan off
Ventilation fan on
Wed Thurs Fri Sat
pCi/l
nn nn Sun Mon nn nn nn
Ventilation fan off
Bedroom doors closed
Bedroom doors closed
Figure 3 Guest Bedroom results

8
0.0
1.0
2.0
3.0
4.0
5.0
6.0
7.0
8.0
nn
Unit 504 Master Bedroom Ventilation Test 11/18-24/08
47 CFM OA Note: 0.3 ACH = 88 CFM
Ventilation fan off
Ventilation fan on
Wed Thurs Fri Sat
pCi/l
nn nn Sun Mon nn nn nn
Ventilation fan off
Bedroom doors open
Bedroom doors closed
Bedroom doors closed
Figure 4 Master Bedroom results

9
0.0
1.0
2.0
3.0
4.0
5.0
6.0
7.0
8.0
nn
Unit 504 Guest & Kitchen
Ventilation Test 11/18-24/08
47 CFM OA
Ventilation fan off
Ventilation fan on
Wed Thurs Fri Sat
pCi/l
nn nn Sun Mon nn nn nn
Ventilation fan off
Bedroom doors open
Bedroom doors closed
Bedroom doors closed
Figure 5 Guest Bedroom & Kitchen results

10
0.0
1.0
2.0
3.0
4.0
5.0
6.0
7.0
8.0
nn
Unit 504 Master & Kitchen Ventilation Test 11/18-24/08
47 CFM OA
Ventilation fan off
Ventilation fan on
Wed Thurs Fri Sat
pCi/l
nn nn Sun Mon nn nn nn
Ventilation fan off
Bedroom doors open
Bedroom doors closed
Bedroom doors closed
Figure 6 Master Bedroom & Kitchen results

11
4.0 DETERMINING THE EFFECT OF INTRODUCING OUTDOOR AIR
If one assumes the radon emanation rate is consistent and uniform throughout each condo unit
then the variation in radon levels will be directly related to the amount of outdoor ventilation
taking place. The amount of ventilation added by the test fan can be carefully measured. The
radon reduction in effect is the inverse of the ventilation increase.
I-Rn = Initial radon N-Rn = New radon level with added ventilation I-Vn = Initial natural ventilation in CFM F-Vn = Fan Forced Ventilation N-Vn = New ventilation rate (Initial + Fan forced ventilation)
N-Rn = I-Rn X (I-Vn ÷ N-Vn)
The one variable that is not measured in the above calculation is the initial natural ventilation.
Previous radon measurements made in main living area of the test unit measured 7.5 pCi/l (278
Bq/m3). The initial radon measurements made during this ventilation test measured 3.5 pCi/l
(130 Bq/m3). This means the natural ventilation rate was about 2 times higher during the
ventilation test. This is likely due to the cold windy weather happening during the ventilation
test. See table 5 below that lists the outdoor high and low temperature swing during the
ventilation test. The reduction in radon that can be achieved with outdoor air requires
determining the natural ventilation rate by modifying the above formula.
I-Vn = F-Vn X N-Rn ÷ ( I-Rn - N-Rn )
In the graph of the kitchen radon variation in Figure 2 above, the average of the final radon
levels was used because of a longer measurement period. The radon levels averaged about 4.5
pCi/l (167 Bq/m3) without the fan operating. When the fan was supplying 47 CFM (22 l/s) of
outdoor air and all the bedroom doors were open the radon levels dropped to 1.8 pCi/l (67
Bq/m3). Using the above Formula 2 the following initial natural ventilation rate is determined.
31.3 CFM = 47 X 1.8 ÷ (4.5 – 1.8 )
Once we have determined the ventilation rate necessary to produce a radon level in the building
we can use the following formula to determine natural ventilation rate that was occurring when a
previously higher or lower radon concentration was happening in the unit. It is important to
determine this ventilation rate because it indicates the minimum natural ventilation rate of the
unit and this ventilation rate is added to the fan forced introduction of outdoor air to predict the
final radon levels within the dwelling during mild or windy cold weather.
Formula 1 Calculating New Radon level based on ventilation change
Formula 2 Calculating Initial Natural Ventilation Rate

12
I-Vn = N-Vn X (N-Rn ÷ I-Rn)
Formula 3 can be used to determine that the ventilation rate when the radon levels were at 7.5
pCi/l (278 Bq/m3) was about 18.8 CFM.
18.8 CFM = 78.3 X ( 1.8 ÷ 7.5 )
Or the ventilation rate without the fan running can also be used to determine the ventilation rate
when the radon levels were at 7.5 pCi/L (278 Bq/m3).
18.8 CFM = 31.33 X ( 4.5 ÷ 7.5 )
Note to obtain a more representative radon measurement of the effects of induced ventilation into
a single room for this type of building it is important to have the air handler operating or to leave
all the bedroom doors open. See the radon level variation that happens when the bedroom doors
are closed in the figures and graphs above. The bedroom doors do not have to be left open when
no additional outdoor air is being introduced.
5.0 CALCULATING THE CONCRETE RADON EMANATION RATE
If the ventilation rate of the unit is known and the radon is coming from the concrete the
emanation rate of the concrete can be determined if the square footage of concrete is known.
Unit 504 has 1763 square feet of floor area. Since there is concrete floors and ceilings this
equals 3,526 ft2. The unit however is adjacent to the stair well. The concrete columns and
stairwell concrete walls is assumed to equal about 600 ft2 for a total exposure of 4126 ft
2. If we
use the 78.3 CFM air exchange rate that was maintaining 1.8 pCi/l (67 Bq/m3) we can determine
the emanation rate from the concrete is 58.0 pCi/ft2/hour by the following formula.
pCi/ft2/hr = (N-Vn X 28.3 X 60 X N-Rn) ÷ ft
2 of concrete
58.0 pCi/ft2/hr = ( 78.3 X 28.3 X 60 X 1.8 ) ÷ 4126
Previous radon flux measurements of bare concrete on the 3rd
, 4th
and 5th
floor of the building in
the Fall of 2007 found a range of 32 pCi/ft2/hr to 49 pCi/ft2/hr. This calculated radon emanation
rate of 58 pCi/ft2/hour is 30% to 50% higher. The concrete emanation rate for three other units
in the building and the adjoining building also had emanation rates around 60 pCi/ft2/hour using
the ventilation measurements to determine the emanation. Unit 408 had emanation rates that
were a third less at 39 pCi/ft2/hour. See the results in Table 3 below.
Formula 4 Calculating the Concrete Emanation Rate
Formula 3 Determining the ventilation rate when other radon levels were measured

13
6.0 DETERMINING THE NECESSARY VENTILATION RATE
Necessary ventilation is typically determined using units of air changes per hour (ACH). Some
of the condos in the building had additional exposure to concrete walls that adjoined the
stairwells. There were also a number of condo units on the first floor that had living space on the
two floors. The following formulas were used for determining the necessary ventilation for each
unit.
ACH = Ventilation rate in CFM X 60 ÷ Volume
Therefore when the radon levels were 7.5 pCi/l (278 Bq/m3) in the kitchen and the air handler
was likely operating, the ACH was around 0.06 ACH based on the calculated outdoor air
ventilation of 18.8 CFM (8.5 l/s) .
0.06 ACH = 18.8 X 60 ÷ 17630
When the radon levels were 4.5 pCi/l (167 Bq/m3) in the kitchen and bedrooms, the natural ACH
was around 0.1 ACH based on the calculated natural outdoor ventilation of 31.3 CFM (15 l/s).
0.1 ACH = 31.3 X 60 ÷ 17,630
When the ventilation fan was adding 47 CFM (22 l/s) and the bedroom doors were open, the
radon levels in the kitchen dropped to around 1.8 pCi/l (67 Bq/m3) and the bedrooms dropped to
about 2.1 pCi/l (163 Bq/m3). The ACH rate with the ventilation fan was 0.26 ACH..
0.26 ACH = 78.3 X 60 ÷ 17630
If the new additional outdoor air ventilation is sized for 0.3 ACH the fan forced outdoor air
ventilation rate would be 88 CFM (42 l/s).
0.3 X 17630 ÷ 60 = 88 CFM
In addition to the fan forced ventilation one can assume a natural ventilation rate during mild
weather of at least 0.05 ACH or 15 CFM (7 l/s). This will give a new total ventilation rate in
unit 504 of 103 CFM (49 l/s) during mild weather. Using the Formula 1 above, the radon levels
in Unit 504 would be expected to be 1.4 pCi/L (52 Bq/m3) with the bedroom doors open or the
air handler operating. The radon levels would be lower during any weather patterns or occupant
activity that increased this minimal natural ventilation rate.
1.4 pCi/L = 4.5 X (31.3 ÷ 103)
Formula 5 Determining the ACH rate based on CFM ventilation
14
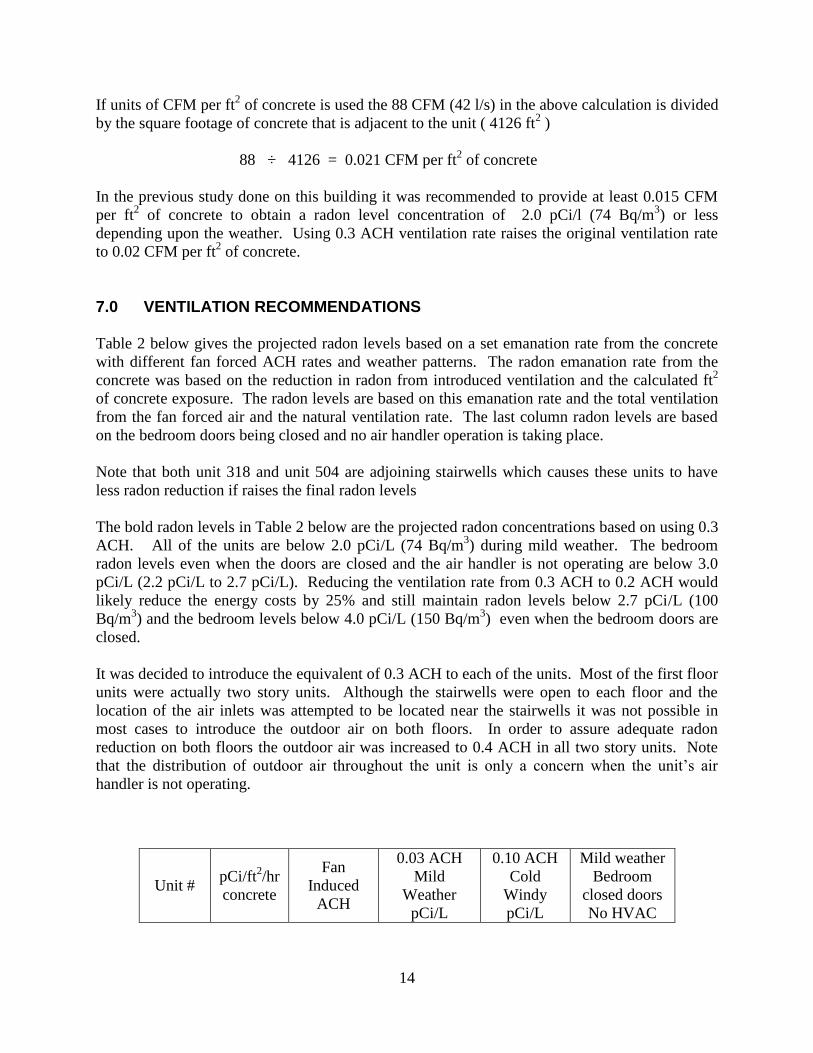
If units of CFM per ft2 of concrete is used the 88 CFM (42 l/s) in the above calculation is divided
by the square footage of concrete that is adjacent to the unit ( 4126 ft2 )
88 ÷ 4126 = 0.021 CFM per ft2 of concrete
In the previous study done on this building it was recommended to provide at least 0.015 CFM
per ft2 of concrete to obtain a radon level concentration of 2.0 pCi/l (74 Bq/m
3) or less
depending upon the weather. Using 0.3 ACH ventilation rate raises the original ventilation rate
to 0.02 CFM per ft2 of concrete.
7.0 VENTILATION RECOMMENDATIONS
Table 2 below gives the projected radon levels based on a set emanation rate from the concrete
with different fan forced ACH rates and weather patterns. The radon emanation rate from the
concrete was based on the reduction in radon from introduced ventilation and the calculated ft2
of concrete exposure. The radon levels are based on this emanation rate and the total ventilation
from the fan forced air and the natural ventilation rate. The last column radon levels are based
on the bedroom doors being closed and no air handler operation is taking place.
Note that both unit 318 and unit 504 are adjoining stairwells which causes these units to have
less radon reduction if raises the final radon levels
The bold radon levels in Table 2 below are the projected radon concentrations based on using 0.3
ACH. All of the units are below 2.0 pCi/L (74 Bq/m3) during mild weather. The bedroom
radon levels even when the doors are closed and the air handler is not operating are below 3.0
pCi/L (2.2 pCi/L to 2.7 pCi/L). Reducing the ventilation rate from 0.3 ACH to 0.2 ACH would
likely reduce the energy costs by 25% and still maintain radon levels below 2.7 pCi/L (100
Bq/m3) and the bedroom levels below 4.0 pCi/L (150 Bq/m
3) even when the bedroom doors are
closed.
It was decided to introduce the equivalent of 0.3 ACH to each of the units. Most of the first floor
units were actually two story units. Although the stairwells were open to each floor and the
location of the air inlets was attempted to be located near the stairwells it was not possible in
most cases to introduce the outdoor air on both floors. In order to assure adequate radon
reduction on both floors the outdoor air was increased to 0.4 ACH in all two story units. Note
that the distribution of outdoor air throughout the unit is only a concern when the unit’s air
handler is not operating.
Unit # pCi/ft
2/hr
concrete
Fan
Induced
ACH
0.03 ACH
Mild
Weather
pCi/L
0.10 ACH
Cold
Windy
pCi/L
Mild weather
Bedroom
closed doors
No HVAC

15
L-504 0.20 2.1 1.6 3.1
L-504 58.0 0.25 1.7 1.4 2.6
L-504 0.30 1.5 1.2 2.2
E-619 0.20 2.4 1.8 3.6
E-619 59.0 0.25 2.0 1.6 3.0
E-619 0.30 1.7 1.4 2.5
E-511 0.20 2.6 2.0 3.8
E-511 60.0 0.25 2.1 1.6 3.0
E-511 0.30 1.8 1.5 2.7
L-408 0.20 1.4 1.1 2.1
L-408 39.0 0.25 1.2 0.9 1.7
L-408 0.30 1.0 0.8 1.5
L-318 0.20 2.6 2.0 3.8
L-318 61.0 0.25 2.1 1.7 3.1
L-318 0.30 1.8 1.5 2.7
8.0 WHOLE BUILDING VENTILATION VERSUS INDIVIDUAL ERV’S
A number of options were explored to deliver conditioned air to all 100 resident units and the
hallways. First consideration was installing individual Energy Recovery Ventilator (ERV) units.
This option had been chosen on an adjacent similar building. The ERV’s installed in the adjacent
building were effective in reducing radon concentrations to below 4.0 pCi/l, however, there were
several negative issues including increased interior humidity and odor transfer from outdoors.
The Condo association had concerns with individual ERV’s about protecting the exterior
styrofoam/stucco layer from water damage from the 200 necessary exterior penetrations
necessary for ERV installation. The pros and cons of installing individual ERV’s versus a
central conditioned ventilation system (CCVS) are listed below.
After considering the pros and cons of both approaches the building condo association decided to
have a central conditioned ventilation system (CCVS) installed. This required installing one or
more air handlers on the roof that would condition 100% outdoor air. Two deliver systems were
considered. The first option was to deliver the necessary air directly to each unit using a ducted
system. A less costly second option was to supply all of the necessary conditioned air to the
hallways. This air would be distributed to the hallways in multiple locations on each floor at
timed intervals. Bathroom blowers in each unit would simultaneously be activated in the
exhaust mode. Passive transfer grills would be installed between each unit and the hallway to
Table 2 Radon levels depending on ACH

16
allow the hallway conditioned air to pass into each unit from the depressurization created by the
bathroom exhaust fans. This concept was rejected for several reasons.
1) There was concern that there would be large variation in the hallway ventilation to the
units because of greater or lesser negative pressure in the units.
2) Maintaining consistent exhaust airflow from bathroom fans would be difficult
3) Bathroom fan noise would be too great and occupants would request turning them off
4) There would be a large ongoing expense to maintain the bathroom fan motors
5) Noise transfer from the hallways through the passive vents would not be acceptable.
After considering the pros and cons of both approaches the building condo association decided to
have a central conditioned ventilation system (CCVS) installed. The cost to have a central
conditioned system with ducted air to each unit was similar to the cost of having individual
HRV/ERV’s installed.
Concerns and Advantages for individual HRV/ERV versus whole building CCVS
1) 0.3 ACH for the units in this building requires airflow from 50 CFM to 110 CFM
depending on the unit size. CCVS allows easier individual adjustment of the
necessary ventilation. Obtaining the necessary airflow to achieve 0.3 ACH would
require some units to have oversized HRV/ERV’s that would then be damped down
to obtain the necessary airflow. This increases the electrical cost, system noise and
system intrusion in the unit.
2) HRV/ERV’s do not typically transfer humidity. HRV/ERV’s will contribute
humidity to the unit while a CCVS will reduce indoor humidity. This became a factor
in the decision process since the building had experienced interior condensation
problems.
3) HRV/ERV’s require penetrations of the exterior shell of the building at inaccessible
locations that could create a potential for water leakage and building warrantee issues.
4) Maintaining adequate distance between intakes and exhaust vents for HRV/ERV’s
would be difficult.
5) Each of the units has an outdoor patio deck that is often used for smoking. These
fumes could be brought back into an adjoining unit whose intake is too close to the
adjoining patio.
6) HRV/ERV’s located on lower floors could draw in dumpster orders, vehicle exhaust,
and street level restaurant exhaust.
7) HRV/ERV’s recover heat better than they recover cooling. In this climate and with
this type of air tight construction there is mostly a cooling/ dehumidification
requirement and very little heating requirement
8) Individual HRV/ERV units must be installed inside the unit in a location where it can
be serviced. This may take up closet space within the unit. The HRV/ERV requires
ductwork to the outside that is drywalled and finished to match the interior décor.
CCVS only requires a grill adjacent to the hallway to be installed.
9) Each HRV/ERV installation requires an electrical inspection.
10) Higher maintenance cost to change HRV/ERV filters twice a year in each unit which
requires visiting all 100 units versus servicing two roof top CCVS units.
11) The occupants of the building could interfere with ERV/HRV operation.

17
12) CCVS installation would be quieter operation for the occupants than the ERV/HRV.
13) If individual HRV/ERV dual motors fail it requires 100 replacements which may be
difficult to access and replace any finish covering.
9.0 IS SUPPLEMENTAL HEAT REQUIRED? During the study the temperature in the kitchen of unit 504 did not drop below 71 degrees (21.7
c) while 47 CFM (22 l/s) of outdoor air was being introduced when the outdoor temperatures
were below freezing each night setting record lows for the area. See Table 3 and Figure 7. Note
that there was no supplemental heat or occupancy induced heat or lighting that would add
additional source of heat during the test. Note that the total CFM of outdoor air during the test
was 47 CFM (22 l/s) induced and 31 CFM (15 l/s) natural for a total of 78 CFM (37 l/s) of
outdoor air. The proposed airflow of 88 CFM (22 l/s) plus a natural ventilation of 31CFM (15
l/s) would give a total of 119 CFM (56 l/s) which is about 50% greater.
Note that the indoor kitchen temperature on Wednesday only dropped to 71 degrees (21.6 c)
even though the outdoor temperatures had dropped to a low of 18 degrees (-7.7 c). Note that
there was no supplemental heat, or lights left on or occupancy during this period to contribute
additional heat from occupancy or from cooking or cleaning. The rise in temperature each day
was from the solar gain into the unit. The guest bedroom climbed to 80 degrees during 5 of the 6
afternoons from solar gain. The master bedroom climbed to 91 degrees (32.7 c) during 2 of the
afternoons and was above 80 degrees (26.7 c) every day.
Date Tues Wed Thurs Fri Sat Sun Mon
High 43° 45° 61° 44° 45° 53° 47°
Low 24° 18° 26° 21° 13° 29° 30°
Table 3 Outdoor temperatures in F during the ventilation test

18
Providing outdoor air that is not conditioned when the outdoor temperature is below 68 degrees
would actually lower the occupancy cooling cost assuming the outdoor air did not significantly
raise the humidity.
It was recommended to install supplemental heat in the air handler that is set to activate only
when the outdoor temperatures reaches a pre-determined level and to have the capacity to adjust
this activation temperature and the temperature of the air that is provided during cold weather. It
may in fact not be necessary to add any supplemental heat.
0.0
10.0
20.0
30.0
40.0
50.0
60.0
70.0
80.0
nn
Unit 504 Kitchen Temperature and Humidity Ventilation Test 11/18-24/08
47 CFM OA added
Ventilation fan off
Ventilation fan on
Wed
Thurs
Fri Sat
F Temp
nn nn Sun Mon
nn nn nn
Ventilation fan off
Bedroom doors open
Bedroom doors closed
Bedroom doors closed
Relative Humidity
Note that proposed 0.3 ACH would add 88 CFM OA
Figure 7 Kitchen temperature & relative humidity

19
10.0 BUILDING VENTILATION STANDARDS
ASHRAE, the American Society of Heating, Refrigerating and Air-Conditioning Engineers has
been updating ventilation guidelines for commercial buildings for 100 years. The society
however has not directed much attention to residential dwellings. Residential ventilation was
traditionally not a major concern because it was felt that between operable windows and
envelope leakage, occupants were getting adequate air. The latest standard developed by
ASHRAE for ventilation of residential buildings is Standard 62.2-2003. This standard makes the
target ventilation rate comprise a sum of the ventilation necessary to dilute background sources
and sources attributable to occupancy. To find the total amount of outside air needed add 3
cfm/100 ft2 (15 l/s/100 sq.m.) to 7.5 cfm/person (3.5 l/s/person). Thus the air change rate
requirement varies by the size of the house and the occupancy. If one assumes two persons for a
single bedroom unit and four persons for a two bedroom unit then the total ventilation rate might
be the following listed in Table 4 below.
Single bedroom Two bedroom
1000 ft2 45 CFM / 0.3 ACH 60 CFM / 0.4 ACH
1500 ft2 75 CFM / 0.33 ACH
2000 ft2 90 CFM / 0.3 ACH
12.0 CONSTRUCTING A DESIGN AND INSTALLATION TEAM
A team was establishing early in the process that consisted of the following groups.
1) Building Association and point of contact person
2) Radon and ventilation consultant
3) HVAC Engineering company and point of contact person
4) General Contractor consultant
5) HVAC sub-contractor consultant
6) Electrical sub-contractor consultant
7) Building Association attorney
There were competing objectives among this group. On one side of the project is the group
responsible for putting the project together. On the other side is the occupants who will be
enduring the installation and performance of the system. Along with all of this are the issues of
installation cost, and ongoing system energy and maintenance costs.
Table 4 ASHRAE current total ventilation recommendations

20
As-built building plans which were not available for this project and caused extra design work.
Legal issues prevented obtaining plans from the normal sources: builder, architect, sub-
contractor, or office where the permits were filed.
A Request for Proposal (RFP) was distributed to HVAC engineering companies that had
experience designing systems for similar buildings located in the same climate. The HVAC
company was requested to consider all the issues of temperature, humidity, noise, installation
issues, maintenance expense, and time table objectives of the project. The initial engineering
company selected for this project had to withdraw because their insurance company would not
cover the liability of the project.
This project required extensive on-site review of duct sizing and routing because of the limited
availability of duct runs down through the building and in particular the allowable duct runs
above the drop ceiling down the hallways. The hallway duct runs were difficult because the
building association requested that the drop ceiling not be lowered in the hallways. There were
biweekly meetings throughout the design and installation process to discuss concerns and share
preliminary information.
The building owner selected Clean Vapor LLC as the commercial mitigation contractor based on
cost, their previous experience with similar commercial building ventilation installations, their
availability to complete the project on time, their references, and their willingness to work
towards all the installation objectives.
A project management schedule listing all the functions and task times through completion of the
project was used. The site manager was onsite every day work took place in the building. Extra
effort was provided by the selected mitigation contractor to minimize system installation dust
and debris and minimize installation impact on the building occupants. The Building
Association POC informed residents by email weekly of all project time tables and potential
impacts. Residents were given advanced notifications of X-rays, utility shut off’s and items that
require residents to evacuate their units. A project Health and Safety Plan (HASP) was
developed and implemented by the Site Safety Officer.
13.0 INSTALLATION OF SUPPLEMENTAL VENTILATION SYSTEM
The central conditioned ventilation system (CCVS) for the building was designed by a
professional engineering company. On each floor of the building there are two storage rooms
near the center of the building and a storage room on each of the outer wings of the building that
lined up with each other from floor to floor. In addition there was a drop ceiling on each floor
above the hallway with about 8 inches of space.
The two roof top units selected to provide conditioned pressurized air to the building are 20 Ton
AAON package units rated at 3500 cfm with 100% outside air. Weight 2900 lbs. During the
cooling season the unit is delivering 65 degree air at 50% relative humidity (rh). During the
heating season the unit will deliver 70 to 75 degree air at approximately 20% rh. On humid days

21
during the cooling season each unit is producing condensation at a rate of ½ gallon per minute.
An additional drain to the storm sewer was installed to accommodate the condensate discharge.
A fully ducted system was installed. The two main vertical ducts extend from the roof top units
down to the first floor. The main trunks that run down through the building required cutting
through the concrete floors that had post tension stressed steel reinforcing cables. In order to
avoid cutting any of these cables an X-ray scan of each slab penetration was performed.
On each floor horizontal duct runs were routed from the main trunk above the drop ceiling along
the entire hallway. In most cases an individual duct run from the hallway was routed through the
common wall, to supply a louvered grill installed in the foyer of each resident unit. As per fire
code requirements fire dampers were installed in the main trunk at each floor and in the duct that
passed through the individual unit walls. An airflow damper was also installed in each unit to
facilitate manual system balancing.
Each of the floors had four equally spaced ceiling mounted supply diffusers installed in hallways
and an additional diffuser installed in the central elevator area. This was to maintain comfort and
provide adequate hallway ventilation. The original hallway air conditioning and heating units
were removed and donated to Habitat for Humanity.
As part of start up, an independent Test and Balance Company conducted the testing and
balancing to meet the design airflow specifications.
14.0 RADON REDUCTION FROM VENTILATION SYSTEM INSTALLATION
After the central ventilation system was installed and balanced all of the units were tested with
individual radon charcoal detectors. It appeared that the necessary closed house conditions were
maintained by almost all of the occupants.
Units Tested Average Post Mitigation
Radon Level
1st Floor Quad units 2.1
1st Floor units 1.2
1st Floor without Quad
units 0.8
3rd
Floor units 0.8
4th
Floor units 0.8
5th
Floor units 0.7
Hallways 0.6
Table 5 Post mitigation average per area

22
unit Pre-Mitg Post Mitg
118 9.0 0.8
145 Quad 5.9 2.7
312 16.3 1.3
318 13.2 0.8
322 10.6 0.5
410 10.0 0.3
428 9.5 0.8
500 5.1 1.3
504 7.5 0.8
Hallway 112 9.3 0.8
Hallway 313 5.5 0.3
Hallway 413 4.9 0.5
Hallway 506 6.6 0.7
After the CCV was completed 91of the 100 units tested below1.5 pCi/l (56 Bq/m3). The
average radon levels for each floor of the building are displayed in table 5 above. There are 12
two story units that are grouped into four units that are referred to as “Quad” units. See the first
floor building layout in Figure 7 below. These units had the greatest distance from the roof top
central ventilation air handlers. Four of the twelve Quad units had radon reductions between 2.0
pCi/l. and 3.0 pCi/l (74 to 111 Bq/m3). The average of the Quad units and the average of the
first floor without the Quad units is displayed in Table 5 above. Note that the average radon
levels for all the floors including the hallway measurements and excluding the Quad units is
between 0.6 and 0.8 pCi/l (22 to 30 Bq/m3). Table 6 above compares the radon measurements
that were obtained before the ventilation system was installed with the post mitigation radon
results for these same units.
Overall the radon levels were dramatically reduced below the guideline, the indoor air quality
was significantly improved, window condensation problems were eliminated, disruption to the
occupants during construction and with operation of the system was minimized.
Table 6 Post mitigation versus Pre-Mitigation levels

23
101
1st & 2nd Floor
Final Test Results
103
100 102
105 107 109
111
112113
114 115
117116
119
129
131
133
135
127
130
132
134
137
139141
142
143145
144
122 120
126124
136
110
118
1.9 1.1
1.8 1.6
1.1 0.7 1.4
1.40.3
0.80.8
0.3
1.1
0.81.4
1.6
1.0
0.8
0.3
1.51.9
1.8
1.2
0.5
0.3
0.3
1.0
128
1.2
0.5
0.91.1
0.3
1.8
2.7
1.62.6
1.8
2.0
6.3
5.9
9.3
9.0
2.8
2.7
0.8
0.6
0.3
2007 Pre-Mitigation
Results
June – July 2009
Post-Mitigation Results
2.3
2.0
1.7
1st
Quad
Unit
2nd
Quad
Units
3rd
Quad
Units
Figure 8 First Floor Final Radon Measurements

24
References Brodhead B. Elevated radon levels in high rise condominium from concrete emanation,
Proceedings of AARST International Radon Conference; 2008
Burkhart, J.F. and Carnley, R.E. Using a model to estimate the ffects of ventilation and exhaust
appliances on the accuracy of a 48 hour radon test. Proceedings of AARST International Radon
Conference; 2000
Lane-Smith, D.R,, Residential Radon levels in Hong Kong. Proceedings of AARST
International Radon Conference; 1997
Leonard, B.E. Ventilation rate and source emanation rates by measurement of induced radon
time-dependent behavior. Proceedings of AARST International Radon Conference; 1994


