Whole-Brain Profiling of Cells and Circuits in Mammals by ...
19
Review Whole-Brain Profiling of Cells and Circuits in Mammals by Tissue Clearing and Light-Sheet Microscopy Hiroki R. Ueda, 1,2, * Hans-Ulrich Dodt, 3,4 Pavel Osten, 5 Michael N. Economo, 6 Jayaram Chandrashekar, 7 and Philipp J. Keller 7 1 Department of Systems Pharmacology, The University of Tokyo, Tokyo 113-0033, Japan 2 Laboratory for Synthetic Biology, RIKEN BDR, Suita, Osaka 565-0871, Japan 3 Department of Bioelectronics, FKE, Vienna University of Technology-TU Wien, Vienna, Austria 4 Section of Bioelectronics, Center for Brain Research, Medical University of Vienna, Vienna, Austria 5 Cold Spring Harbor Laboratories, Cold Spring Harbor, NY 11724, USA 6 Department of Biomedical Engineering, Boston University, Boston, MA, USA 7 Janelia Research Campus, Howard Hughes Medical Institute, Ashburn, VA, USA *Correspondence: [email protected] https://doi.org/10.1016/j.neuron.2020.03.004 Tissueclearingandlight-sheetmicroscopyhavea100-year-plushistory,yetthesefieldshavebeencombinedonly recentlytofacilitatenovelexperimentsandmeasurementsinneuroscience.Sincetissue-clearingmethodswerefirst combinedwithmodernizedlight-sheetmicroscopyadecadeago,theperformanceofbothtechnologieshasrapidly improved,broadeningtheirapplications.Here,wereviewthestateoftheartoftissue-clearingmethodsandlight-sheet microscopy and discuss applications of these techniques in profiling cells and circuits in mice. We examine outstandingchallengesandfutureopportunitiesforexpandingthesetechniquestoachievebrain-wideprofilingof cellsandcircuitsinprimatesandhumans.Suchintegrationwillhelpprovideasystems-levelunderstandingofthephys- iologyandpathologyofourcentralnervoussystem. The beginning of the 20th century saw the birth of two technolo- gies: tissue clearing and light-sheet microscopy. The earliest report on tissue clearing of opaque biomedical samples, which appeared in 1911 in Leipzig, was by the German anatomist Wal- ter Spalteholz. He tried to make human hearts transparent to study their vascular system (Spalteholz, 1911). Using hydropho- bic tissue-clearing reagents (Wintergr€ uno ¨ l) such as methyl salicylate and benzyl benzoate on dehydrated specimens, he succeeded in visualizing macroscopic structures in transparent samples for the first time. However, without a technology like light-sheet microscopy, it was not possible to quantify his find- ings. So even this key advance brought only some qualitative insights into human anatomy. Not far from Leipzig, Austrian chemist Richard A. Zsigmondy and German physicist Henry Sie- dentopf, working in Jena, developed the first light-sheet micro- scope, the Ultramicroscope (Siedentopf and Zsigmondy, 1902). Unlike Spalteholz, Zsigmondy was looking for very small things (Ultramikronen), colloidal particles in solution, which he tried to quantify. In principle, it would have been possible to inte- grate these two technologies more than 100 years ago, but at that time, it would not have led far. Light sheets traversing cleared specimens might create optical sections if one looks at the specimen at the correct angle, but these images still had to be recorded. Most importantly, a three-dimensional (3D) model of the specimen must be reconstructed digitally. Without con- current inventions of electronic cameras and computers, even a hypothetical encounter of Spalteholz and Zsigmondy would not have produced the same impact that these methods have recently achieved. Approximately 90 years after these seminal works, the first relevant step toward integration of tissue clearing and light-sheet microscopy was made by Arno Voie and colleagues (Voie et al., 1993). They designed a modern version of light-sheet micro- scopy (orthogonal-plane fluorescence optical sectioning micro- scopy [OPFOS]), based on lasers and digital camera technology. After clearing the bony structure of the inner ear using EDTA and Spalteholz’s hydrophobic tissue-clearing reagents (methyl salic- ylate and benzyl benzoate), Voie and colleagues performed the first fluorescence optical imaging of a tissue-cleared biological specimen, an excised guinea-pig cochlea labeled with fluores- cein (Voie et al., 1993). They recorded the images with a charge-coupled device (CCD) camera and successfully recon- structed the spiral in the inner ear with rudimentary homemade 3D reconstruction software. The approach unfortunately re- mained largely unnoticed by the broader scientific community for nearly two decades. Light-sheet microscopy rapidly gained momentum in biological imaging in the early 21st century, with applications in diverse fields including microbial oceanography, developmental biology, and neuroscience (Dodt et al., 2007; Fuchs et al., 2002; Holekamp et al., 2008; Huisken et al., 2004). In particular, the work by Ernst Stelzer and colleagues sparked a renewed interest in light-sheet microscopy (Huisken et al., 2004). They reconstructed largely transparent living biological samples, including Medaka fish embryos. Despite the success of this approach for developmental biology, it remained restricted to naturally transparent samples. The first use of light-sheet imaging on neural tissues artificially rendered trans- parent was made by Hans-Ulrich Dodt and colleagues (Dodt ll Neuron 106, May 6, 2020 ª 2020 Elsevier Inc. 369
Transcript of Whole-Brain Profiling of Cells and Circuits in Mammals by ...
ll
Review
Whole-Brain Profiling of Cells and Circuitsin Mammals by Tissue Clearingand Light-Sheet MicroscopyHiroki R. Ueda,1,2,* Hans-Ulrich Dodt,3,4 Pavel Osten,5 Michael N. Economo,6 Jayaram Chandrashekar,7
and Philipp J. Keller71Department of Systems Pharmacology, The University of Tokyo, Tokyo 113-0033, Japan2Laboratory for Synthetic Biology, RIKEN BDR, Suita, Osaka 565-0871, Japan3Department of Bioelectronics, FKE, Vienna University of Technology-TU Wien, Vienna, Austria4Section of Bioelectronics, Center for Brain Research, Medical University of Vienna, Vienna, Austria5Cold Spring Harbor Laboratories, Cold Spring Harbor, NY 11724, USA6Department of Biomedical Engineering, Boston University, Boston, MA, USA7Janelia Research Campus, Howard Hughes Medical Institute, Ashburn, VA, USA*Correspondence: [email protected]://doi.org/10.1016/j.neuron.2020.03.004
Tissueclearingandlight-sheetmicroscopyhavea100-year-plushistory,yetthesefieldshavebeencombinedonlyrecentlytofacilitatenovelexperimentsandmeasurementsinneuroscience.Sincetissue-clearingmethodswerefirstcombinedwithmodernizedlight-sheetmicroscopyadecadeago,theperformanceofbothtechnologieshasrapidlyimproved,broadeningtheirapplications.Here,wereviewthestateoftheartoftissue-clearingmethodsandlight-sheetmicroscopy and discuss applications of these techniques in profiling cells and circuits in mice. We examineoutstandingchallengesandfutureopportunitiesforexpandingthesetechniquestoachievebrain-wideprofilingofcellsandcircuitsinprimatesandhumans.Suchintegrationwillhelpprovideasystems-levelunderstandingofthephys-iologyandpathologyofourcentralnervoussystem.
The beginning of the 20th century saw the birth of two technolo-
gies: tissue clearing and light-sheet microscopy. The earliest
report on tissue clearing of opaque biomedical samples, which
appeared in 1911 in Leipzig, was by the German anatomist Wal-
ter Spalteholz. He tried to make human hearts transparent to
study their vascular system (Spalteholz, 1911). Using hydropho-
bic tissue-clearing reagents (Wintergr€unol) such as methyl
salicylate and benzyl benzoate on dehydrated specimens, he
succeeded in visualizing macroscopic structures in transparent
samples for the first time. However, without a technology like
light-sheet microscopy, it was not possible to quantify his find-
ings. So even this key advance brought only some qualitative
insights into human anatomy. Not far from Leipzig, Austrian
chemist Richard A. Zsigmondy and German physicist Henry Sie-
dentopf, working in Jena, developed the first light-sheet micro-
scope, the Ultramicroscope (Siedentopf and Zsigmondy,
1902). Unlike Spalteholz, Zsigmondy was looking for very small
things (Ultramikronen), colloidal particles in solution, which he
tried to quantify. In principle, it would have been possible to inte-
grate these two technologies more than 100 years ago, but at
that time, it would not have led far. Light sheets traversing
cleared specimens might create optical sections if one looks at
the specimen at the correct angle, but these images still had to
be recorded. Most importantly, a three-dimensional (3D) model
of the specimen must be reconstructed digitally. Without con-
current inventions of electronic cameras and computers, even
a hypothetical encounter of Spalteholz and Zsigmondy would
not have produced the same impact that these methods have
recently achieved.
Approximately 90 years after these seminal works, the first
relevant step toward integration of tissue clearing and light-sheet
microscopy was made by Arno Voie and colleagues (Voie et al.,
1993). They designed a modern version of light-sheet micro-
scopy (orthogonal-plane fluorescence optical sectioning micro-
scopy [OPFOS]), based on lasers and digital camera technology.
After clearing the bony structure of the inner ear using EDTA and
Spalteholz’s hydrophobic tissue-clearing reagents (methyl salic-
ylate and benzyl benzoate), Voie and colleagues performed the
first fluorescence optical imaging of a tissue-cleared biological
specimen, an excised guinea-pig cochlea labeled with fluores-
cein (Voie et al., 1993). They recorded the images with a
charge-coupled device (CCD) camera and successfully recon-
structed the spiral in the inner ear with rudimentary homemade
3D reconstruction software. The approach unfortunately re-
mained largely unnoticed by the broader scientific community
for nearly two decades. Light-sheet microscopy rapidly gained
momentum in biological imaging in the early 21st century, with
applications in diverse fields including microbial oceanography,
developmental biology, and neuroscience (Dodt et al., 2007;
Fuchs et al., 2002; Holekamp et al., 2008; Huisken et al., 2004).
In particular, the work by Ernst Stelzer and colleagues sparked
a renewed interest in light-sheet microscopy (Huisken et al.,
2004). They reconstructed largely transparent living biological
samples, including Medaka fish embryos. Despite the success
of this approach for developmental biology, it remained
restricted to naturally transparent samples. The first use of
light-sheet imaging on neural tissues artificially rendered trans-
parent was made by Hans-Ulrich Dodt and colleagues (Dodt
Neuron 106, May 6, 2020 ª 2020 Elsevier Inc. 369

llReview
et al., 2007). They took advantage of hydrophobic tissue-
clearing reagents, benzyl alcohol and benzyl benzoate (BABB),
that were originally developed by Andrew Murray and Marc
Kirschner around 1989 and first applied to fluorescent-
and peroxidase-based whole-mount immunocytochemistry of
Xenopus oocytes and embryos (Dent et al., 1989). Combining
this clearingmethodwith ultramicroscopy and image processing
enabled the visualization of neuronal networks at the resolution
of neural dendrites in whole mouse brains (Dodt et al., 2007). A
different set of organic solvents—DBE (dibenzyl ether) and/or
THF (tetrahydrofuran) and dichloromethane (DCM)—were com-
bined in 3D imaging of solvent-cleared organs (3DISCO) to better
preserve the fluorescence of GFP during the clearing process
(Becker et al., 2012, 2014; Ert€urk et al., 2012, 2014). Since
then, various other hydrophobic tissue-clearing reagents with
different attributes have been developed to support various ap-
plications, including ultimate DISCO (uDISCO) (Pan et al., 2016),
immunolabeling-enabled DISCO (iDISCO) (Belle et al., 2014; Re-
nier et al., 2014), iDISCO+ (Renier et al., 2016), FluoClearBABB
(Schwarz et al., 2015), ethyl cinnamate (ECi) (Klingberg
et al., 2017), free-of-acrylamide SDS-based tissue clearing
(FASTClear) (Perbellini et al., 2017), polyethylene glycol (PEG)-
associated solvent system (PEGASOS) (Jing et al., 2018), vari-
able domain of heavy chain antibodies (nanobodies) DISCO
(vDISCO) (Cai et al., 2018), multiscale architectonic staining of
human cortex (MASH) (Hildebrand et al., 2018), and stabilized
DISCO (sDISCO) (Hahn et al., 2019).
Clearingmethods that use water-soluble reagents (hydrophilic
tissue-clearing methods) are better at preserving the fluores-
cence of fluorescent proteins and are less toxic compared with
approaches that use organic reagents. Pioneering works on hy-
drophilic tissue-clearing methods were conducted by Russian
physicist Valery V. Tuchin and colleagues (V.V. Bakutkin et al.,
1995, Int. Soc. Optic. Photon., conference; Tuchin, 2007). They
found that aqueous solutions of various hydrophilic chemicals
had high refractive indices (RIs), a property believed to be impor-
tant for tissue clarity. The RI of a certain material is defined as the
ratio of the speed of light in a vacuum to that in the material.
These high-RI solutions included X-ray contrast agents (Trazo-
graph), a series of alcohols (polyethylene glycol, glycerol, and
propylene glycol), sugars (glucose and dextran), and dimethyl
sulfoxide (DMSO) (V.V. Bakutkin et al., 1995, Int. Soc. Optic.
Photon., conference; A.N. Bashkatov et al., 1999, Int. Soc. Optic.
Photon., conference; V.V. Tuchin et al., 1999, Proc. SPIE, confer-
ence; Tuchin et al., 1997, 2002; Xu et al., 2003; Zimnyakov et al.,
1996, Int. Soc. Optic. Photon., conference). Around the same
time, Chance and colleagues discovered the RI matching effect
of a series of sugars (mannitol, fructose, sucrose, and glucose)
and alcohols (propanediol and methanol) (Chance et al., 1995;
Liu et al., 1996). A different cocktail—FocusClear, which con-
tains another X-ray contrast agent (diatrizoate acid) and a
detergent (Tween 20)—was used by Chiang and colleagues for
whole-brain imaging of cockroach using a confocal microscope
(Chiang et al., 2001). In 2011, Atsushi Miyawaki and colleagues
developed the hydrophilic tissue-clearing method Scale, which
hyperhydrates and delipidatesmouse brains with urea-based re-
agents and a detergent, respectively, resulting in semi-trans-
parent mouse brains (Hama et al., 2011). This clearing approach
370 Neuron 106, May 6, 2020
substantially enhanced the effective imaging depth of two-
photon microscopy in adult brain tissue but provided insufficient
clearing for effective light-sheet microscopy. This problem
was then addressed in 2014 by Hiroki Ueda and colleagues,
who developed clear, unobstructed brain/body imaging cock-
tails and computational analysis (CUBIC), an efficient hydrophilic
tissue-clearing method (Susaki et al., 2014). They used a sys-
tematic chemical screening strategy and found a series of amino
alcohols, which can be used to delipidate and decolorize
mammalian brains. CUBIC protocols for whole-body clearing
also seem to permit light-sheet imaging of heart, lung, liver, kid-
ney, pancreas, and other organs (Susaki et al., 2014, 2015; Tai-
naka et al., 2014), although whole-body imaging still has not
been rigorously demonstrated because of the lack of an objec-
tive definition of whole-body imaging. One of the possible defini-
tions for whole-body or -organ imaging would be the successful
detection of cells or cellular nuclei in a whole body or a whole
organ with more than a certain level of accuracy (e.g., 95% ac-
curacy).
Further chemical screening and profiling led to the develop-
ment of a series of CUBIC reagents (CUBIC-L or CUBIC-HL for
delipidation, CUBIC-R+ for RI matching, CUBIC-B for decalcifi-
cation of bone, CUBIC-P for decolorization, and CUBIC-X for
tissue expansion) (Kubota et al., 2017; Murakami et al., 2018;
Tainaka et al., 2018). Parallel efforts revealed the chemical prin-
ciples of each tissue-clearing process (Susaki and Ueda, 2016;
Tainaka et al., 2016, 2018). CUBIC-based clearing was extended
to the fruit fly D. melanogaster. With this approach (FlyClear),
endogenous fluorescence in whole undissected animals was
preserved across developmental stages from larva to adult fly
(Pende et al., 2018). In addition to these CUBIC-related reagents,
other hydrophilic tissue-clearing reagents with different pur-
poses have been independently developed, including thiodie-
thanol (TDE) immersion (Aoyagi et al., 2015; Costantini et al.,
2015; Hasegawa et al., 2016; Staudt et al., 2007); see deep brain
(SeeDB) (Ke et al., 2013); ScaleS (sorbitol-based scale) (Hama
et al., 2015); FRUIT (a cocktail of fructose and urea) (Hou et al.,
2015); urea-based amino-sugar mixture (UBasM) (Chen et al.,
2017); clearing-enhanced 3D (Ce3D) (Li et al., 2017); see deep
brain 2 (SeeDB2) (Ke et al., 2016); ClearT (formamide) /ClearT2
(a cocktail of formamide and polyethylene glycol) (Kuwajima
et al., 2013); Warner’s method (Warner et al., 2014); ClearSee
(Kurihara et al., 2015); rapid clearingmethod based on triethanol-
amine and formamide (RTF) (Yu et al., 2018); illuminate cleared
organs to identify target molecules (LUCID) (Mizutani et al.,
2018); a series of sugars, sorbitol (Hirshburg et al., 2007) and su-
crose (Chance et al., 1995; Tsai et al., 2009); and a series of X-ray
contrast, Histodenz in refractive index matched solution (RIMS)
protocol (Yang et al., 2014) and iodixanol in system-wide control
of interaction time and kinetics of chemicals (SWITCH) protocol
(Murray et al., 2015).
In parallel with the development of hydrophobic and hydro-
philic tissue-clearing methods, a hydrogel-based tissue-clearing
method called clear lipid-exchanged acrylamide-hybridized rigid
imaging/immunostaining/in situ-hybridization-compatible tissue
hydrogel (CLARITY) was also developed in 2013 by Karl
Deisseroth and Kwanghun Chung. In this process, lipids are
removed by perfusion of sodium dodecyl sulfate (SDS), a strong

llReview
detergent, and tissue is subsequently transformed into a clear
acrylamide gel retaining biological elements (Chung et al.,
2013). CLARITY employs an electrophoresis step to accelerate
tissue clearing and is therefore more complex than many other
hydrophobic and hydrophilic tissue-clearing methods that rely
on passive diffusion. Following SDS perfusion, proteins and nu-
cleic acids are retained, presumably because of their stabiliza-
tion by the exogenous acrylamide gel. Using CLARITY, it may
be possible to visualize endogenous fluorescent proteins and
to label epitopes with fluorescent antibodies (Chung et al.,
2013). Although reliable fluorescence preservation and immuno-
labeling remain challenging, intact CLARITY-processed brains
have been successfully imaged at high resolution (numerical
aperture [NA] = 1.0) with light-sheet microscopy (Tomer et al.,
2014). Raju Tomer and colleagues developed the passive
CLARITY technique (PACT) by decreasing gel density to improve
tissue permeability and probe penetration (Tomer et al., 2014).
Viviana Gradinaru and colleagues combined PACT with PARS
(perfusion-assisted agent release in situ) to render rodent bodies
transparent (Treweek et al., 2015; Yang et al., 2014). Other vari-
ations of CLARITY have been applied to bones (Greenbaum
et al., 2017a) and for the detection of RNA (Greenbaum et al.,
2017b; Yang et al., 2014). Sensitive methods for fluorescence
in situ hybridization have been used to effectively visualize single
RNA molecules within tissue (Shah et al., 2016).
Hydrogel-based methods have been further exploited to
achieve super-resolution imaging. Expansion microscopy,
developed by Ed Boyden and colleagues, uses a swellable hy-
drogel to isotropically expand tissues. Expanded structures
within tissuemay enable imaging at an effective resolution higher
than that achievable using conventional microscopy (Chen et al.,
2015). Kwanghun Chung and colleagues developed another hy-
drogel-based expansion microscopy method, magnified anal-
ysis of proteome (MAP), in which they omitted the protein diges-
tion process to preserve proteins in the expanded brain (Ku et al.,
2016), and recently introduced stabilization under harsh condi-
tions via intramolecular epoxide linkages to prevent degradation
(SHIELD), in which they used polyepoxy chemicals to protect
florescence, antigenicity, transcripts, and tissue architecture
(Park et al., 2018). Similar to hydrophobic and hydrophilic tis-
sue-clearing methods, variations of hydrogel-based tissue-
clearing reagents with different purposes have been developed,
including optimized CLARITY (Lee et al., 2014), CLARITY-TDE
(Costantini et al., 2015), plant-enzyme-assisted (PEA)-CLARITY
(Palmer et al., 2015), simplified CLARITY (Lai et al., 2016), active
clarity technique-pressure related efficient and stable transfer of
macromolecules into organs (ACT-PREST) (Lee et al., 2016), and
fast free-of-acrylamide clearing tissue (FACT) (Xu et al., 2017)
Since the earliest combined use of hydrophobic (Dodt et al.,
2007), hydrophilic (Susaki et al., 2014), or hydrogel-based (Tomer
et al., 2014) tissue-clearing methods and modernized light-sheet
microscopy, the performance of tissue-clearing approaches and
light-sheet microscopy has been continuously improved, broad-
ening their utility (Ariel, 2017; Azaripour et al., 2016; Chakraborty
et al., 2019; Fu et al., 2016; Gradinaru et al., 2018; Horl et al.,
2018;Migliori et al., 2018;Richardsonand Lichtman, 2015; Silves-
tri et al., 2016; Susaki and Ueda, 2016; Tainaka et al., 2016; Voigt
et al., 2019) (Figure 1). Indeed, with advanced tissue-labeling
and -staining techniques, tissue-clearing methods, and light-
sheetmicroscopy, whole-brain profiling of cells can be performed
comprehensively and efficiently (Belle et al., 2014; Murakami
et al., 2018; Renier et al., 2014, 2016; Susaki et al., 2014; Ye
et al., 2016). Integration of tissue-clearing and light-sheet micro-
scopy also promises to transform methods for interrogating the
structure and connectivity of neural circuits spanning the brain
(Ogawa and Watabe-Uchida, 2018; Economo et al., 2016, 2018;
Winnubst et al., 2019).
The Present State of the Art and Challenges in TissueClearingTissue-clearingmethods provide a powerful approach for optical
imaging deep within biological specimens. Methods for tissue
clearing are under active development so that they may be
applied to larger samples and to improve their compatibility
with an expanded set of techniques for labeling and visualizing
structural and biochemical features of tissues. The physical
and chemical principles that underlie tissue-clearing processes
are also of great interest (Figure 2), and enhanced understanding
of these processes continues to drive the development of new
tissue-clearing methods.
Improvements in tissue-clearing methods have relied both on
identification and application of more effective tissue-clearing
chemicals (Pan et al., 2016; Tainaka et al., 2014, 2018) and on
enhanced fixation procedures that permit the use of harsher re-
agents and procedures (e.g., strong detergents and high tem-
perature) (Murray et al., 2015; Park et al., 2018; Yang et al.,
2014). The identified potent tissue-clearing chemicals or condi-
tions have been applied not only to entire bodies of rodents
(Pan et al., 2016; Tainaka et al., 2014; Yang et al., 2014) but
also to entire human organs, including a lymph node (Nojima
et al., 2017), a kidney (Tainaka et al., 2018; Zhao et al., 2019),
an eyeball, and even a human brain (Zhao et al., 2019).
Tissue-clearing methods, whether hydrophobic, hydrophilic,
or hydrogel based, attempt to minimize light scattering—espe-
cially Mie scattering (Tuchin, 2015)—caused by mismatches in
the RIs of different components of biological materials (e.g.,
lipids and proteins) with the RI of the medium (e.g., water)
(Figure 2A, light scattering). Among biological materials, water
usually exhibits the lowest RI (�1.33), dried lipids exhibit inter-
mediate RIs (1.46–1.48) (Kienle et al., 2014; Pusterla et al.,
2017), dried proteins and DNA exhibit higher RIs (1.540–1.598
for dried proteins, Bashkatov et al., 2018; �1.58 for dried DNA,
Inagaki et al., 1974), and hydroxyapatite (HAp) extracted from
bone tissue exhibits the highest RI (1.600–1.604) (Antonio,
1949; Ascenzi and Fabry, 1959). In addition to reducing light
scattering caused by inhomogeneity of RIs, tissue-clearing
methods minimize light absorption caused by pigments such
as heme (Figure 2A, light absorption).
Practically, most tissue-clearing methods aim to preserve pro-
teins and/or nucleic acids while removing other components of
tissue. Effective tissue-clearing methods usually achieve the
following five chemical processes: (1) removing lipids (delipida-
tion) and (2) removing HAp (decalcification) to reduce the inho-
mogeneity of RIs in biological samples; (3) removing pigments
(decolorization) to reduce light absorption; (4) embedding in a
hydrophobic solvent or aqueous medium with an RI matching
Neuron 106, May 6, 2020 371

Hydrophobic reagents Hydrophilic reagents Hydrogel-based
1914
1989
1990s
2012
2011
2010
2007
2013
2014
2015
2016
2017
2018
Spalteholtz’ s reagent
BABB for frog
BABB for whole mouse brain
Medical applicationsby Tuchin’ s group
FocusClearTM
SeeDB
SeeDB2 LUCID
ScaleCUBIC
CUBIC-L/R
UBasM
Ce3D
RTF
CUBIC-X
SUT
CUBIC-HL
CUBIC-P
CUBIC-B
ClearSee
CLARITY
PACT/PARS/RIMS
PACT-deCalePACTExM
SWITCH MAP
Bone-CLARITY(modified PACT-deCal)
1st Scale
ScaleS
FLUIT TDE immersion
ClearT
3DISCO
iDISCO
uDISCO
vDISCO
PEGASOS
FluoClearBABB
ECi
DehydrationDelipidation DecolorizationDecalcificationRI matchingHydrationSwelling
(including some ExM protocols)
EtOH / HexaneBenzyl alcohol / Benzyl benzoate
Tetrahydrofuran / DichloromethaneDibenzylether
MeOH / DichloromethaneDibenzylether
EtOHECi (Ethyl cinnamate)
tert-Butanol / DichloromethaneBenzyl alcohol / Benzyl benzoate / Diphenyl ether
tert-ButanolBenzyl alcohol / Benzyl benzoate
EDTAQuadroltert-Butanol / DichloromethaneBenzyl alcohol / Benzyl benzoate / Diphenyl ether
EDTAQuadroltert-Butanol / PEGBenzyl benzoate / PEG
Diatrizoate
Triton X-100UreaGlycerol
PEG / Formamide
Fructose
2,2'-thiodiethanol
Triton X-100 / QuadrolQuadrolUreaSucrose / Triethanolamine
DeoxycholateUreaXylitol
Triton X-100UreaGlycerol / Sorbitol / DMSO
UreaFructose
SaponinIohexol (HistodenzTM)
2,2'-thiodiethanol / Glycerol
Triton X-100 / N-ButhyldiethanolamineN-ButhyldiethanolamineAntipyrine / Nicotinamide or N-methylnicotinamide
Triton X-100 / Meglumine (N-methyl-D-glucamine)UreaSucrose / 1,3-Dimethyl-2-imidazolidinone / Meglumine (N-methyl-D-glucamine)
Triton X-100N-methylacetamide / HistodenzTM
Triethanolamine / Formamide
1,3-bis(aminomethyl)cyclohexane / Sodium dodecylbenzenesulfonate
EDTA / Imidazole
Triton X-100 / N-ButhyldiethanolamineN-Buthyldiethanolamine / 1-Methylimidazole
AntipyrineImidazole
SDSDiatrizoate / Glycerol
SDSHistodenzTM / Sorbitol
SDSQuadrolEDTAHistodenzTM / Sorbitol
SDSDiatrizoate / IodixanolMeglumine (N-methyl-D-glucamine)
SDS / Triton X-100Urea
Benzyl alcohol / Methyl salicylate
Sugars, Alcohols, DMSO, 2,4,6-triiodobenzene acid etc.
sDISCO
Dibenzyl ether
TetrahydrofuranPropyl gallate (stabilizer)
Figure 1. Timeline of Advances in Tissue-Clearing Methods
llReview
the remaining components of the tissue; and (5) sometimes ex-
panding biological samples and thus contributing to RI matching
(Figure 2B, RI matching). The RIs of RI-matching media differ
across hydrophilic (1.52 for CUBIC-R+), hydrogel-based (1.45–
1.49 for RIMS), and hydrophobic (1.56 for 3DISCO) methods,
likely reflecting commensurate sample expansion and shrinkage
(Kubota et al., 2017; Tainaka et al., 2016, 2018).
The optimal RIs of different tissue-clearing methods have
been explained by considering a physical property of natural bio-
logical tissue (Murakami et al., 2018). As predicted from a
pioneering study on cross-linked gels of extracted natural poly-
mers such as DNA (polynucleotide), protein (polypeptide), and
agarose (polysaccharide) by Amiya and Tanaka (1987), a recent
372 Neuron 106, May 6, 2020
study has revealed that fixed and delipi-
dated natural organs behave as an elec-
trolyte polymer gel even without exoge-
nous polymers (Murakami et al., 2018). If
a biological tissue acts as a polymer gel,
the average RI (Rp) of the biological tissue
(polymer gel) could be described by the
average RI (Rm) and volume Vm of its com-
ponents (monomer) according to the Lor-
entz-Lorenz equation (Figure 2C, light
scattering) (Lorenz, 1880; Lorentz, 1880),
where the average RI of biological tissue
Rp is an increasing function of Rm/Vm.
Therefore, the expansion and shrinkage
of biological tissues lead to the decrease
and increase of the average RIs, respec-
tively, which should be matched by RI-
matching media (Figure 2B, RI matching).
As described earlier, the average RI of
biological tissues can be matched by an
RI-matchingmedium. However, a remain-
ing issue in delipidated, decalcificated,
and decolorized biological samples (i.e.,
cross-linked gels of natural polymers
such as proteins and nucleic acids) is the
localized deviation of theRIs of thesepoly-
mers from the average RI of the sample
(and hence from the RI-matching me-
dium). One possible solution to address
thisRI-deviation problemwouldbeRImix-
ing to dissolve such light-scattering mate-
rials (i.e., materials of deviation of RIs from
the average RI) into the RI-matching me-
dium, because light scattering (Mie scat-
tering) depends not only on RI mismatch
but also on the size of the light-scattering
materials (Figure 2B, RI mixing). If the
effective size of the light-scattering mate-
rials (e.g., proteins with a micrometer-
scale structure) could become sufficiently
smaller than the wavelength of visible lights (0.38–0.75 mm) by
dissolving them into the medium, the RIs of materials can
bemixedwith those ofmediumand/or other dissolved light-scat-
tering materials nearby within the wavelength of visible lights.
Hence, this RI-mixing processwould effectively cancel out RI de-
viation of different light-scattering materials. Importantly, pur-
suits of RI-matching reagents have already identified a couple
of chemicals that might have this RI-mixing property. For
example, chemical screening of more than 1,600 hydrophilic
chemicals identified effective RI-matching reagents (Tainaka
et al., 2018), some of which (e.g., imidazole and antipyrine) also
exhibit strong interaction with cross-linked natural polymers
such as a gelatin gel (Murakami et al., 2018). Interestingly, known

Lorentz-Lorenz Equation (1880)
Salf-free amineHigh LogP
Ca2+ chelationPO4
3- ProtonationHis competition
e.g. N-AlkylimidazolAromatic
amideHyperhydration
e.g. Imidazole, Antipyrine
Light Scattering Light Absorption
V V
RmRmRp
Delipidation DecolorizationDecalcification ExpansionRI-matching
Polymer Refractive Index (Rp)
Monomer Volume (V)
Monomer RefractiveIndex (Rm)
Protein(globin)
ProxymalHistidine
Matching of Different RIsMinimizes Light Scattering
Materials of Different RIs(Refractive Indices)
Homogenize Different RIs
C Chemical Principles of Tissue Clearing
A Physical Principles of Tissue Clearing
Light Scattering
B Adjustable RI matching (average of RI) and RI mixing (deviation of RI)RI matching
noitubirtsiD
RI HighLow
Expansion ShrinkageNormal
“Average” RI depends on tissue volume, which should be matched with medium’s RI
Removal of PigmentsMinimizes Light Absorption
Various Pigments(e.g. Heme)
RemovePigments
Light Absorption
RI mixing
RI “deviation” could be minimized by dissolving into RI-matching medium
Dis
tribu
tion
RI
Mie scattering depends on RI mismatch
Mie scattering depends on
size of material
1-mehylimidazole
ΔRI↑
ΔRI↓ Size↓
Size↑
Figure 2. Physical and Chemical Principlesof Tissue Clearing(A) Classical physical principles of tissue clearingproposed in 1911 by Spalteholz. Light scatteringcan be minimized by homogenization of RIs ofmaterials, whereas light absorption can be mini-mized by removing pigments.(B) Adjustable RI matching (matching the tissue-size-dependent average RI of biological sampleswith RI-matching medium) and RI mixing (dissolv-ing light-scattering materials into RI-matchingmedium to minimize RI deviation) proposed in thisreview. The average RI of biological samples de-pends on the size of tissues, which often expandsin hydrophilic and hydrogel-based tissue-clearingmethods, shrinks in hydrophobic tissue-clearingmethods, and should be matched by RI-matchingmedium, because Mie scattering depends on theRI mismatch between those of light-scatteringmaterials and medium. For the adjustable setpointof average RI, see also the Lorentz-Lorenz equa-tion in (C). The RI-deviation problem could besolved by RI mixing by dissolving light-scatteringmaterials (i.e., materials of deviation of RIs from theaverage RI) into RI-matching medium, becauselight scattering or Mie scattering depends also onthe size of the light-scattering materials.(C) Chemical principles of tissue clearing. Delipi-dation, decalcification, and expansion processescontribute to the composite RI of biological sam-ples (calculated by the Lorentz-Lorenz equation),which should bematched by RI-matchingmedium.Decolorization of heme can be achieved bycompetitive binding of 1-methylimidazole or otheramines to iron-containing heme instead of histidinein globin. Each tissue-clearing chemical process isassociated with the characteristic chemical natureof the tissue-clearing chemicals.
llReview
RI-matching reagents (e.g., DMSO) can interact strongly with
cross-linked natural polymers even without water, implying that
this RI-mixing concept might be applicable to hydrophobic
reagents. A unified understanding of the physical properties of
biological materials and chemical properties of RI-matching
and RI-mixing reagents will lead to the efficient engineering of
average and deviation of RIs (RI engineering) in biological tissues
to achieve optimal transparency of larger samples. In addition,
the RI-mixing concept built upon Mie scattering theory and our
model of RI matching through the Lorentz-Lorenz equation,
both of which are proposed in this review, might represent sub-
stantial conceptual advancements in the physical principles of
tissue clearing since Spalteholz first proposed the RI-matching
concept in 1911.
In addition to physical principles of RI
matching and RI mixing in biological tis-
sues, chemical understanding of other tis-
sue-clearing processes such as delipida-
tion, decolorization, and decalcification
have advanced (Figure 2C, light scat-
tering). Delipidation removes lipids to
reduce the inhomogeneity of RIs in biolog-
ical samples and allows other reagents
to diffuse deep into biological samples.
Therefore, delipidation has already
become a common component of hydrophobic, hydrophilic,
andhydrogel-based tissue-clearingmethods. In hydrophobic tis-
sue-clearing methods such as BABB, 3DISCO, uDISCO,
iDISCO+, and sDISCO, polar solvents including THF (3DISCO)
(Becker et al., 2012, 2014; Ert€urk et al., 2012, 2014; Hahn et al.,
2019) and alcohols such as ethanol (BABB) (Dent et al., 1989),
tert-butanol (FluoBABB and uDISCO) (Pan et al., 2016; Schwarz
et al., 2015), and methanol (iDISCO+) (Belle et al., 2014; Renier
et al., 2014, 2016) are used as the first step to remove water
and partially remove lipids from biological samples. As a second
step, hexane (BABB) (Dent et al., 1989) and DCM (3DISCO,
uDISCO, and iDISCO+) (Becker et al., 2012, 2014; Ert€urk et al.,
2012, 2014) are used to extensively remove lipids. In hydrophilic
tissue-clearing methods, the nonionic detergent Triton X-100
Neuron 106, May 6, 2020 373

llReview
(Scale and CUBIC-1) (Hama et al., 2011; Susaki et al., 2014;
Susaki and Ueda, 2016) and amino alcohols, including Quadrol
(CUBIC-1) (Susaki et al., 2014; Susaki and Ueda, 2016), trietha-
nolamine (CUBIC-2) (Susaki et al., 2014; Susaki and Ueda,
2016), and N-butyldiethanolamine (CUBIC-L) (Kubota et al.,
2017; Tainaka et al., 2018), are used as potent delipidation chem-
icals. In hydrogel-based tissue-clearing methods such as
CLARITY and PACT, the ionic detergent SDS (Chung et al.,
2013; Treweek et al., 2015; Yang et al., 2014) is mostly used for
delipidation. Improved delipidation procedures have led to the
development of more efficient tissue-clearing protocols. The
ionic detergent sodium dodecylbenzenesulfonate (CUBIC-HL)
(Tainaka et al., 2018), non-ionic detergent 3-[(3-cholamido-
propyl)dimethylammonio]-1-propanesulfonate (CHAPS) (Zhao
et al., 2019), aliphatic amines suchas1,3-bis(aminomethyl)cyclo-
hexane (CUBIC-HL) (Tainaka et al., 2018), and hexanediol (Inoue
et al., 2019; Tainaka et al., 2018) were shown to be effective re-
agents for delipidation of human tissue. Because there is a
trade-off between the strength of tissue clearing, especially deli-
pidation, and the preservation ofmolecular and cellular organiza-
tion in tissues,weshould carefully choose the stringencyof tissue
clearing according to the required transparency for the imagingof
the samples.
Decolorization removes pigments to reduce light absorption in
biological samples. Heme in red blood cells can be eluted by
amino alcohols such asQuadrol in mild chemical conditions (Tai-
naka et al., 2014). The hypothesis for decolorization of hemewas
proposed such that a basic nitrogen in amino alcohols may
competitively bind to iron-containing heme instead of histidine
in globin (Figure 2C, light absorption) (Tainaka et al., 2014,
2016). This competitive binding hypothesis was strongly sup-
ported by the identification of a more potent decolorization com-
pound, 1-methylimidazole, from more than 1,600 chemicals
(Tainaka et al., 2018), which almost completely mimics the func-
tional residue of histidine. In addition, SDS inCLARITY and PACT
successfully decolorizes heme, likely as a result of the denatur-
ation of the heme-hemoglobin holoenzyme by SDS (Epp et al.,
2015; Lee et al., 2014; Treweek et al., 2015).
Decalcification removes calcium phosphate to reduce light
scattering in biological samples containing bone. The inorganic
bonemineral, HAp, was used for chemical screening of 1,600 re-
agents by measuring the optical density 600 (OD600) of a chem-
ically treated HAp suspension. In addition to EDTA, which has
been known as a strong calcium chelator, potent decalcifica-
tion-enhancing compounds were identified. Imidazole was
found to facilitate EDTA-based decalcification, perhaps because
of the protonation of phosphate ions (Tainaka et al., 2018). This
enhanced decalcification may be the result of both chelation of
calcium ions by EDTA and protonation of phosphate ions by
imidazole (Tainaka et al., 2018).
In addition to the empirical findings of efficient tissue-clearing
reagents and/or conditions, a more unified understanding of tis-
sue-clearing chemistry has been gradually obtained by chemical
profiling of potent reagents (Tainaka et al., 2014, 2018). In partic-
ular, the chemical profiling of more than 1,600 chemicals has
been conducted for delipidation, decolorization, decalcification,
tissue expansion, and RI matching (Murakami et al., 2018; Sus-
aki and Ueda, 2016; Tainaka et al., 2016, 2018). Based on these
374 Neuron 106, May 6, 2020
screens, we have hypothesized that delipidation is enhanced by
salt-free amines with high logP (octanol-water partition coeffi-
cient). Similarly, decolorization appears to be associated with
competitive binding to iron-containing heme against histidine
by N-alkylimidazole and decalcification as a result of chelation
of Ca2+ by EDTA and protonating of PO42� by an organic base.
Tissue expansion is facilitated by hyperhydration and RI match-
ing by electron enrichment of an RI-matching medium by an
aromatic amide (Figure 2C, light scattering and light absorption)
(Murakami et al., 2018; Tainaka et al., 2018). Altogether, our
advancing understanding of the principles underlying tissue
clearing provide a foundation for new approaches suitable for
specific biological applications.
Another important challenge in tissue clearing is labeling of tis-
sues with antibody. Since the 1980s, tissue clearing followed by
whole-mount antibody staining was attempted for comprehen-
sive imaging of whole organs and body, especially for nervous
systems of insects and shrimp and the Xenopus embryo (Beltz
and Kravitz, 1983; Bishop and O’Shea, 1982; Dent et al.,
1989). Recently, tissue clearing and staining was applied to 3D
observation of murine and human embryos (Belle et al., 2017;
Hsueh et al., 2017; Renier et al., 2014), various animal organs
and bodies (Cai et al., 2018; Chung et al., 2013; Coutu et al.,
2018; Gleave et al., 2013; Hama et al., 2015; Hasegawa
et al., 2019; Kubota et al., 2017; Kumar et al., 2010; Renier
et al., 2016; Sillitoe and Hawkes, 2002; Susaki et al., 2014; Tai-
naka et al., 2014; Yang et al., 2014), and pathological samples
of human tissues (Chung et al., 2013; Hildebrand et al., 2018;
Lai et al., 2018; Liu et al., 2016; Nojima et al., 2017; Tanaka
et al., 2017; Zhao et al., 2019). To improve the penetration speed
of antibodies in a large tissue sample, several approaches have
been adopted. First, stringent permeabilization by several
methods has been attempted to increase the pore size of fixed
specimens and hence enhance the penetration of antibodies.
These methods include (1) delipidation (Chung et al., 2013;
Duve et al., 1983; Hama et al., 2015; Lai et al., 2018; Susaki
et al., 2014; Yang et al., 2014; Zhao et al., 2019); (2) dehydration
(Belle et al., 2014; Dent et al., 1989; Duve et al., 1983; Gleave
et al., 2013; Renier et al., 2014, 2016; Sillitoe and Hawkes,
2002; Zhao et al., 2019); (3) weaker fixation (Gleave et al.,
2013); and (4) partial protein digestion with proteases (Gleave
et al., 2013; Kumar et al., 2010; Sillitoe and Hawkes, 2002). Sec-
ond, weakening non-specific interactions between antibodies
and fixed tissues using chemicals such as urea (Hama et al.,
2015) or SDS (Murray et al., 2015) has been also attempted to
inhibit trapping of antibodies and hence accelerate the diffusion
of antibodies deep into the tissues. Third, active transports by
electrophoresis (Kim et al., 2015a; Lee et al., 2016; Wang
et al., 2018) or pressurization such as trans-cardinal perfusion
(Cai et al., 2018; Yang et al., 2014) were also tested on tissue
samples to enhance the penetration of antibodies. Finally,
increasing the amounts of antibodies by their iterative supplies
(Chung et al., 2013; Lai et al., 2018) or reducing the size of anti-
bodies by using nanobodies (Cai et al., 2019) was also effective
to increase the penetration rate of antibodies. At present, these
attempts to increase the penetration rate of antibody can suc-
cessfully label relatively small and thin tissues, partially
dissected tissues, or embryonic tissues with the lesser
1903 1993 2002 2004 2007 2008 2010 2011 2012 2013 2014 2015 2016
First light-sheet microscope: Ultramicroscopy(Siedentopf and Zsigmondy 1903)
Modern laser-light sheet microscopy: OPFOS(Voie 1993)
First application in microbial oceanography(Fuchs ‘02)
First application in developmental biology(Huisken ‘04)
First application in functional neuroscience(Holekamp ‘08, see also Ahrens ’13,
Panier ‘13, Wolf ’15)
Structured illuminationlight-sheet microscopy
(Breuninger ‘07, see also Keller ’10,Mertz and Kim ’10)
Two-photon light-sheet microscopy(Palero ‘10, see also Truong ’11, Mahou ‘14)
Isotropic multi-view light-sheet microscopy(Wu ‘13, see also Chhetri ‘15)
Extended depth-of-fieldlight-sheet microscopy
(Olarte ‘15, see also Tomer ‘15, Quirin ’16)
Scanned light-sheet microscopy(Keller ‘08)
Single-lens light-sheet microscopy(Dunsby ‘08, see also Bouchard ’15)
First application in tissue clearing(Dodt ‘07)
Light-sheet based fluorescence correlation spectroscopy(Wohland ‘10, see also Capoulade ’11)
Bessel beam light-sheet microscopy(Fahrbach ‘10, see also Planchon ’11)
Hyperspectral light-sheet microscopy(Jahr ’15)
Inverted light-sheet microscopy(Wu ‘11, see also McGorty ‘15, Strnad ’15)
Superresolution light-sheet microscopy(Cella Zanacchi ‘11, see also Friedrich ’11,
Gao ‘12, Galland ’15, Hoyer ‘16)
Spatiotemporally sample-adaptivelight-sheet microscopy
(Royer ‘16, see also McDole ’18)
Confocal light-sheet microscopy(Fahrbach ‘12, Silvestri ’12, Baumgart ‘12,
see also Yang ‘15, de Medeiros ’15)
Light-sheet microscopy with adaptive optics(Jorand ‘12, see also Wilding ‘16, Liu ’18)
Multi-view light-sheet microscopy(Tomer ‘12, Krzic ’12, see also Swoger ‘07,
Schmid ‘13, Lemon ’15)
Airy beam light-sheet microscopy(Vettenburg ‘14)
Lattice light-sheet microscopy(Chen ‘14)
Aspheric light-sheet microscopy(Saghafi ‘14)
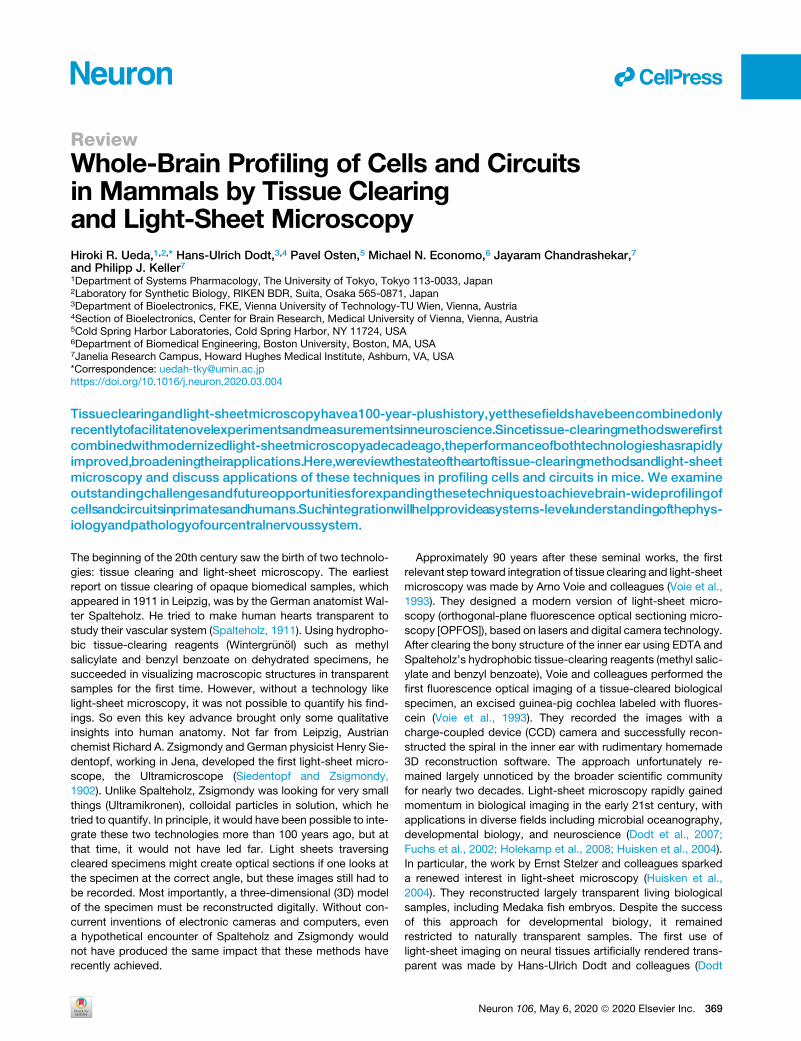
Figure 3. Timeline of Advances in Light-Sheet Microscopy
llReview
extracellular matrix. These attempts can also successfully stain
an adult mouse brain or a dissected human specimen with rela-
tively sparse epitopes such as c-Fos, amyloid plaques, or a mi-
croglia marker (Belle et al., 2014; Liebmann et al., 2016; Renier
et al., 2014, 2016; Zhao et al., 2019). However, homogeneous
antibody staining of adult mouse brains against high-density epi-
topes such as NeuN and neurofilament has not yet been
adequately demonstrated and therefore remains a challenge in
tissue clearing.
The Present State of the Art and Challenges in Light-Sheet Fluorescence MicroscopyLight-sheet fluorescence microscopy is a powerful technique for
rapid and minimally phototoxic volumetric imaging of biological
specimens. The high imaging speed, high signal-to-noise ratio,
and high light efficiency of this method are the direct result of
the central design principle in light-sheet imaging: a thin volume
section of the specimen is selectively illuminated by a sheet of
laser light, and fluorescence emitted fromwithin this volume sec-
tion is imaged onto a camera positioned at a right angle to the
light sheet. The illuminated volume section and the detection
focal plane are coplanar; thus, (1) no out-of-focus regions are
exposed to laser light and (2) an image of the entire thin volume
section can be acquired simultaneously. The first feature en-
sures that the specimen’s photon budget is used efficiently
and dramatically reduces photo-bleaching and photo-toxic ef-
fects compared with conventional and confocal fluorescence
microscopy. The second feature provides high imaging speeds
limited only by camera performance. This design facilitates rapid
3D imaging simply by moving the light sheet and detection focal
plane through the specimen and acquiring a series of images
across the volume. Because of these strengths, light-sheet mi-
croscopy has foundwidespread use throughout the life sciences
over the course of the past decade and is employed routinely in
the fields of developmental biology (Huisken et al., 2004; Keller
et al., 2008; McDole et al., 2018; Rozbicki et al., 2015), cell
biology (Chen et al., 2014; Liu et al., 2018; Nixon-Abell et al.,
2016; Reichmann et al., 2018; Valm et al., 2017), and neurosci-
ence (Ahrens et al., 2013; Chhetri et al., 2015; Dodt et al.,
2007; Holekamp et al., 2008; Kawashima et al., 2016; Lemon
et al., 2015; Panier et al., 2013; Wolf et al., 2015; Wan
et al., 2019).
Although even the most basic implementations of light-sheet
microscopy already offer key benefits, advances in microscope
design have added strengths and synergies (Figure 3). These im-
provements have allowed microscopists to address many
commonly encountered challenges in biomedical imaging,
including fundamental limitations in spatial resolution, limitations
in image quality arising from light scattering and aberrations, and
limitations in the rapid imaging of large specimens.
Light scattering is a common problem in biological specimens
with limited transparency, which includes most living, multi-
cellular organisms. By introducing structured illumination (Breu-
ninger et al., 2007; Keller et al., 2010) or line-confocal detection
(Baumgart and Kubitscheck, 2012; de Medeiros et al., 2015;
Fahrbach and Rohrbach, 2012; Silvestri et al., 2012) in light-
sheet microscopy, the contribution of scattered light to image
formation can be greatly reduced, thus improving contrast and
resolution in deeper regions of the specimen. A complementary
strategy for improving depth penetration (and reducing scat-
tering in biological tissues) involves the use of longer-wavelength
light for fluorescence excitation and relies on the principle of
multi-photon excitation to allow a molecule to enter an excited
state through concurrent absorption of multiple lower-energy
photons. The use of this concept in light-sheet microscopy
was first demonstrated for static light sheets (Palero et al.,
2010) and then improved through integration in beam-scanning
light-sheet microscopes (Mahou et al., 2014; Truong et al.,
Neuron 106, May 6, 2020 375

llReview
2011). However, even with structured illumination, confocal
detection, and multi-photon excitation, many biological speci-
mens are too large to be imaged in high resolution in their en-
tirety, primarily because of light scattering and absorption. To
address this issue, light-sheet microscopy has been enhanced
by multi-view imaging capabilities (Krzic et al., 2012; Lemon
et al., 2015; Pende et al., 2018; Schmid et al., 2013; Swoger
et al., 2007; Tomer et al., 2012). In such implementations, the
specimen is illuminated by more than one light sheet (typically
two light sheets from opposite directions) (Huisken and Stainier,
2007) and imaged by more than one camera (typically two cam-
eras from opposing views), which improves physical coverage of
large specimens without compromising temporal resolution or
temporal continuity across the volume. Finally, scaling up light-
sheet imaging to very large transparent specimens is feasible
through the use of modified objective arrangements, as well as
tiling strategies, in which sample translation can help overcome
the limited field of view of the camera, and detection optics (Horl
et al., 2018; Migliori et al., 2018; Voigt et al., 2019).
Improvements in spatial resolution have become possible by
using beam shaping to create thinner light sheets (Chen et al.,
2014; Fahrbach and Rohrbach, 2010; Pende et al., 2018;
Planchon et al., 2011; Saghafi et al., 2014; Sheppard, 2013;
Vettenburg et al., 2014), as well as by using orthogonal multi-
view imaging (Chhetri et al., 2015;Wu et al., 2013). In conventional
light-sheet microscopes, axial resolution is typically substantially
lower than lateral resolution—often by up to a factor of 5–10when
imaging a large field of view. Because axial resolution in the
detection system can only be increased up to a limit imposed
by the numerical aperture of the detection objective, one option
for improving overall system resolution is the reduction of light-
sheet thickness. Light sheets constructed from Bessel beams
and optical lattices (Chen et al., 2014; Fahrbach and Rohrbach,
2010; Planchon et al., 2011) can be made thin enough to improve
overall axial resolution to around 300–400 nm, which is compara-
ble to the lateral resolution limit. However, the field of view of such
microscopes is typically limited to around 100 mmalong the illumi-
nation axis; thus, other solutions are needed for rapid, high-reso-
lution imaging of larger specimens. By acquiring orthogonal views
of a sample, followed by registration and multi-view deconvolu-
tion of these multiple views, images with near-isotropic spatial
resolution on the order of 300–400 nm can be obtained without
the need for constructing thin light sheets (and thus without the
need to limit imaging to a small field of view) (Chhetri et al.,
2015; Wu et al., 2013). In addition, complementary efforts are un-
der way to investigate the design of light sheets that maintain a
narrow beam waist over long spatial distances (Pende et al.,
2018; Saghafi et al., 2014). Alternatively, the relationship between
size of field of view and light-sheet-waist thickness can be de-
coupled by tiling or scanning the light-sheet waist across the field
of view (Dean et al., 2015; Fu et al., 2016) or translating the sample
relative to the light-sheet waist (Migliori et al., 2018), which pro-
vides more uniform illumination across the field of view.
Although the techniques described earlier offer high system
resolution, the effective spatial resolution in a real biological sam-
ple can be substantially lower as a result of optical aberrations.
Unfortunately, most biological specimens, even those that are
relatively transparent, introduce significant aberrations that alter
376 Neuron 106, May 6, 2020
the path and shape of the light sheet and distort the shape of
the detection focal plane. When limiting the observation to suffi-
ciently small regions in the sample, thus ensuring that wavefront
errors are relatively uniform across the small field of view, light-
sheet microscopy can be combined with adaptive optics to effi-
ciently compensate for most, if not all, of these distortions (Jorand
et al., 2012; Liu et al., 2018; Wilding et al., 2016). However, con-
ventional adaptive optics are typically unsuited to light-sheet
applications that require rapid live imaging of large, optically het-
erogeneous specimens with a field of view exceeding 100 mm. In
this latter scenario, geometrical mismatches between light sheets
and detection focal planes can be rapidly mapped across the
specimen (and over time) by real-time image processing and
approximately corrected for through optical defocus and light-
sheet tip and tilt manipulations (McDole et al., 2018; Royer
et al., 2016). With this complementary approach, diffraction-
limited performance of the light-sheet microscope can be at least
partially recovered in specimens as large and complex as
zebrafish, fruit fly, or mouse embryos, which typically provides a
2- to 5-fold improvement in spatial resolution.
Temporal resolution in light-sheet microscopy is generally
limited by camera speed. To preserve the high frame rates
offered, for example, by state-of-the-art scientific complemen-
tary metal–oxide–semiconductor (sCMOS) cameras in a volu-
metric imaging setting, the microscope’s detection objective
can be moved in synchrony with the light sheet by fast piezo po-
sitioners (Ahrens et al., 2013; Lemon et al., 2015). For example,
high-performance piezos are capable of moving detection ob-
jectives at rates of several tens to hundreds of hertz for travel
ranges of up to several hundred micrometers (Greer and Holy,
2019; Piezosystems_Jena, 2019; Wan et al., 2019). The advan-
tage of this approach is that it ensures optimal image quality
by always acquiring images at the native focal plane of the objec-
tive; however, the cost of a good piezo is not insignificant. Less
expensive alternative solutions include the use of remote
focusing with electric tunable lenses (Fahrbach et al., 2013) or
extended depth-of-field detection (Olarte et al., 2015; Quirin
et al., 2016; Tomer et al., 2015). The reduced cost and ability
to keep the objective stationary come at the expense of a reduc-
tion in resolution and image quality, which result from imaging
away from the native focal plane and, in the latter case, from
the use of an elongated detection point-spread function.
Research in recent years has also produced a range of useful,
alternative designs of light-sheet microscopy, such as imple-
mentations that are compatible with biological preparations on
coverslips and other horizontal surfaces (McGorty et al., 2015;
Strnad et al., 2016; Wu et al., 2011) or designs that use a single
objective for illumination and detection (Bouchard et al., 2015;
Dunsby, 2008). The latter concept sacrifices some optical perfor-
mance by reducing the effective numerical aperture and
acquiring images away from the native focal plane, but it also en-
ables light-sheet imaging of samples with limited optical access
and supports applications that constrain the placement and
orientation of microscope optics.
Whole-Brain Profiling of CellsDevelopments in microscopy have helped to bring about a
method-driven renaissance in neuroanatomy that is distinguished

llReview
by a focus on large-scale projects generating unprecedented
amounts of anatomical data. Quantitative, whole-brain profiling
of the spatial distribution of cells, their molecular features, and
their connectivity represents a powerful application of modern-
ized tissue-clearing and light-sheet microscopy in neuroscience.
Comprehensively mapping the distributions of neuronal and glial
types across the brain allows brain regions to be delineated with
unprecedented precision and their components to be defined,
leading to an enhanced understanding of brain structure and facil-
itating comparisons across individuals and across species.
Until recent advances in genetic labeling, tissue processing,
and lightmicroscopy, comprehensivelymapping cells throughout
the brain has only been possible in simple organisms, such as the
nematode Caenorhabditis elegans (White et al., 1986). The size
and complexity of the mammalian brain present barriers to prog-
ress in understanding the organization of the nervous system of
higher organisms. Accordingly, the classical anatomical literature
of the mammalian brain has been piecemeal, with a given study
typically examining only one or a few brain regions and one or a
few cell types at a time, typically in the male brain. For example,
theuseof classical stereologicalmethodshas led toquantification
of interneuron distribution in sensory cortices (Gonchar et al.,
2008; Pfeffer et al., 2013; Pronneke et al., 2015; Rudy et al.,
2011; Xuet al., 2010), but this approachhasproven tobe too labo-
rious to be applied to whole-brain cell-type analyses (Glaser and
Glaser, 2000; Schmitz and Hof, 2005; Williams and Rakic, 1988).
A simple method, called isotropic fractionator, was developed
for counting cell nuclei in suspension by flow cytometry after tis-
sue dissociation and was successfully applied to comparative
studies of neuronal and glial cell counts in the mouse brain and
across a range of species (Herculano-Houzel et al., 2015a,
2015b, 2013; Kverkova et al., 2018; Marhounova et al., 2019;
Olkowicz et al., 2016). However, because the mammalian brain
comprises many brain areas (e.g., mouse brain has >400 unique
areas) that would need to be precisely dissected, this method is
not appropriate for comprehensive analyses or easily adaptable
for analysis of specific cell types.
Automated block-face imaging methods combining top-view
light microscopy and integrated tissue sectioning enable high-
quality, high-resolution brain-wide imaging. This approach sub-
stantially improved upon histological methods in which thin
tissue sections aremanually cut, mounted on slides, and imaged
individually. The enhanced throughput of automated block-face
imaging represents a critical factor for large-scale neuroanatom-
ical projects. Imaging in a block-face configuration also provides
enhanced reliability and minimal distortion, producing complete
datasets that may be registered to standardized anatomical
reference atlases—critical for integrating anatomical data from
multiple experiments. Several block-face imaging methods
have been developed. Serial two-photon tomography (STPT)
takes advantage of two-photon excitation to provide optical
sectioning in standard paraformaldehyde-fixed tissues. STPT
can be used to generate a series of two-dimensional images
spanning all regions of the brain (Kim et al., 2017; Osten and
Margrie, 2013; Ragan et al., 2012) or full 3D image volumes span-
ning the brain (Economo et al., 2016). Knife-edge scanning
microscopy (KESM) (Mayerich et al., 2008) and micro-optical
sectioning tomography (fluorescence micro-optical sectioning
tomography [fMOST]) (Gong et al., 2016; Li et al., 2010; Zheng
et al., 2013) can also generate complete, 3Dwhole-brain imagine
volumes using micron-scale sectioning and single-photon imag-
ing of resin-embedded tissue. Block-face serial microscopy to-
mography (FAST) (Seiriki et al., 2017) uses a spinning-disk
confocal microscope to achieve high imaging rates in a block-
face configuration.
One application of these methods is brain-wide mapping of
genetically defined cell types. For example, Osten and col-
leagues developed an automated, quantitative brain-wide cell
profiling platform (qBrain) that can be used to map the brain-
wide distribution of genetically defined cell types across regions
in the mouse brain. qBrain combines recombinase-based
knockin driver mouse lines that label genetically defined cell
types (Huang, 2014; Huang and Zeng, 2013; Madisen et al.,
2012), automated brain imaging at single-cell resolution by
STPT, and computational analyses that include cell detection
by convolutional neural networks (Kim et al., 2015b, 2017; Ragan
et al., 2012). The application of this platform to cell-type anatomy
has immediately demonstrated the power of unbiased, whole-
brain anatomical mapping in uncovering novel principles of
mammalian brain organization. First a comparison of quantita-
tive distribution of three major inhibitory neuron cell types, those
expressing somatostatin (SST), parvalbumin (PV), and vasoac-
tive intestinal peptide (VIP), across the mouse brain isocortex
revealed hierarchical organization of the neocortex, because
sensory-motor areas were found to be dominated by output-
modulating PV-positive interneurons, whereas association areas
were composed of large numbers of input-modulating SST-pos-
itive interneurons. Another perhaps even more surprising finding
from this study was the identification of nine brain regions with
different distributions of these cell types between male and fe-
male mouse brains, with eight regions containing more VIP+ or
SST+ neurons in the female brain despite the female brain being
smaller overall than the male brain. Most regions with sexually
dimorphic cell-type distributions were from the structures of
the vomeronasal system, which regulate reproductive and social
behaviors. This finding provides direct, quantitative evidence
that anatomical differences underlie sexually dimorphic behav-
iors (Bayless and Shah, 2016; Simerly, 2002). Given the unex-
pected results derived from analyses of only 3 cell types using
STPT, it seems likely that further quantitative atlasing of cell-
type distributions will provide additional insights into how the
cellular composition of different brain areas may contribute to
their functions.
Block-face imaging methods remain attractive because of
their high resolution and compatibility with large tissue samples.
However, due to many of the technological advances reviewed
here, large-volume imaging using tissue clearing and light-sheet
microscopy are closing the gap and provide several key advan-
tages over block-face methods. Block-face imaging requires
specialized instruments that may not be readily accessible to
many researchers, while light-sheet microscopes are becoming
increasingly common fixtures in microscope facilities. Further-
more, light-sheet imaging can achieve acquisition rates for volu-
metric data that are several orders of magnitude faster than
block-face imaging methods. Still, to realize whole-organ cell
profiling, clearing methods must achieve high transparency of
Neuron 106, May 6, 2020 377

A
B
C
D
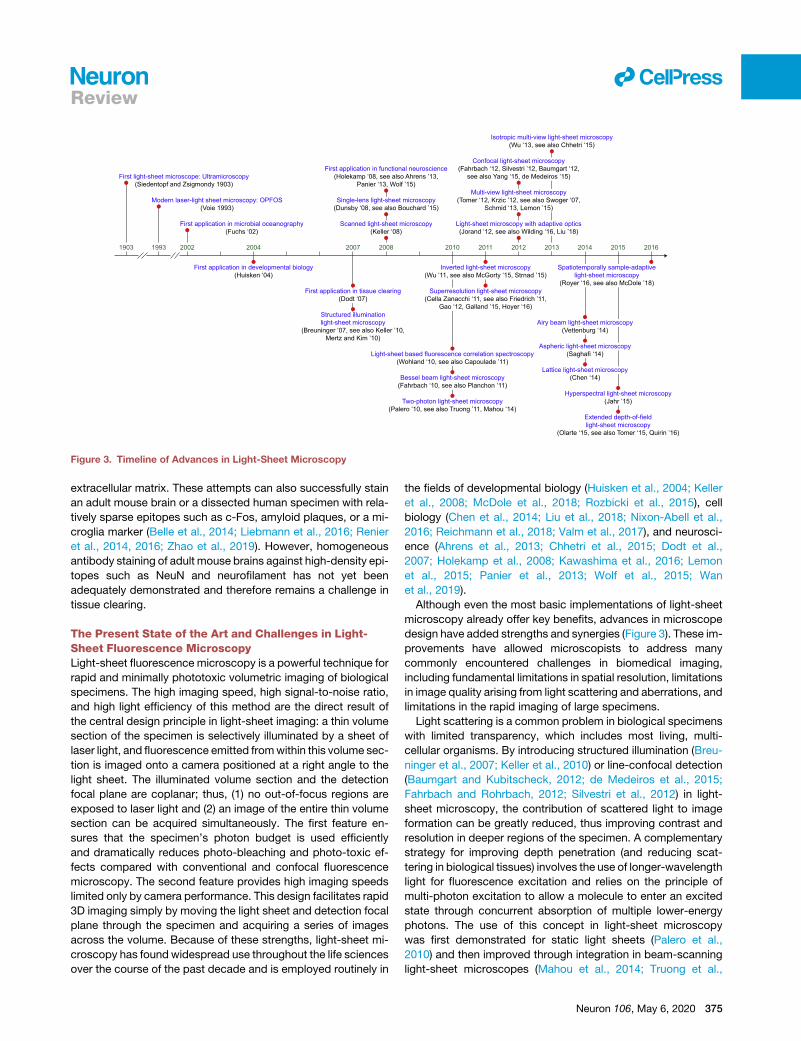
Figure 4. Whole-Brain Profiling of Cells by Light-Sheet Fluorescent Microscopy(A) Volume-rendered and single-plane images of a brain transduced with AAV-PHP.eB:NSE-H2B-mCherry (mCherry, green) and counterstained by RD2 (red),which is cleared by CUBIC-L/R+. Overlapped signals are shown in yellow. A volume-rendered image is shown in the center. Single-plane and magnified imagesare shown for cerebral cortex, hippocampus, olfactory bulb, and striatum. Both horizontal (x-y) and coronal (x-z) views are also shown. Scale bars, 200 mm (single-plane image) and 25 mm (magnified image).(B) 3D and cross-section images of the positive-cell-number ratio map of whole mouse brain infected by AAV-PHP.eB (NSE-H2B-mCherry). Voxel size, 80 mm.Scale bars, 2 mm and 50 mm.
(legend continued on next page)
ll
378 Neuron 106, May 6, 2020
Review
llReview
samples so that the light sheet is not degraded by tissue-
induced scattering, aberration, and absorption. In addition,
light-sheet imaging methods must maintain consistent quality
across large fields of view. Increasingly, these constraints can
be met by state-of-the-art tissue-clearing methods and light-
sheet fluorescent microscopy. As a result, this approach is
becoming an appealing strategy for whole-brain profiling of cells
in intact mammalian brains (Liebmann et al., 2016; Murakami
et al., 2018; Renier et al., 2014, 2016; Susaki et al., 2014,
2015; Sylwestrak et al., 2016; Tatsuki et al., 2016; Tomer et al.,
2014). For example, a tissue-clearing and expansion method,
CUBIC-X, in combination with custom-made light-sheet fluores-
cent microscopy with a 103 objective lens (NA = 0.6, working
distance = 8 mm), allowed 1.3 million images covering the entire
mouse brain to be successfully obtained.
Whole-brain datasets generated by these instruments range
from�100 GB to�30 TB of data per single mouse brain, neces-
sitating the development of new computational tools for ana-
lyses. 3D reconstructions, anatomical registration, and signal
detection and quantification, for example, have been demon-
strated using supervised machine learning algorithms trained
on expert-annotated ground truth data (Hawrylycz et al., 2011;
Kim et al., 2015b; Kuan et al., 2015; Ng et al., 2007; Ragan
et al., 2012). In datasets collected using CUBIC-X, GPU-based
image analysis was used to extract the 3D coordinates of all cells
in the adult mouse brain. Leveraging existing anatomical seg-
mentations of the mouse brain (Dong, 2008; Lein et al., 2007),
this approach yielded a whole-brain atlas with single-cell resolu-
tion (CUBIC-Atlas) (Murakami et al., 2018). Further development
of the cell detection algorithm improved the accuracy and speed
of this analysis pipeline so that more than 90% of cells in the
mouse brain could be identified in several hours (up to 2 TB/h)
(Matsumoto et al., 2019). Using this cell-nucleus detection algo-
rithm, the updated CUBIC-Atlas 1.2 of 8-week-old C57BL/6J
mouse brain was constructed that contains the spatial coordi-
nates and brain regions associated with more than 108 cells
(Matsumoto et al., 2019). The improved throughput offered by
these protocols allows the analysis of numerous (>100) samples,
providing a highly versatile platform for biomedical research,
including comparative analyses across a range of mammalian
and vertebrate species, and opening a new and exciting frontier
in neuroanatomy (Figure 4).
The molecular features of cells in the brain—their transcrip-
tomes and proteomes—provide information extending beyond
their morphology—both about their type and about the cellular
processes related to function. Classic approaches for immuno-
fluorescence and fluorescence in situ hybridization for labeling
proteins and mRNAs, respectively, have been most frequently
applied within thin tissue sections through which fluorophore-
conjugated macromolecules can quickly diffuse. In addition to
reducing the scattering and absorption of light, processes
such as delipidation and hydrogel embedding increase the
(C) Average cell number of all anatomical regions in three 8-week-oldC57BL/6Nmolfactory areas; HPF, hippocampal formation; CNU, cerebral nuclei; HY, hypothalventricular system.(D) Positive-cell-number ratio of each anatomical region in mouse brain infectedMatsumoto et al. (2019).
diffusivity of proteins and oligonucleotides within tissue. There-
fore, there is a natural synergy between techniques for clearing
tissue samples and for labeling the mRNAs and proteins within
them. Nevertheless, devising methods that permit the penetra-
tion of antibodies (for immunofluorescence) and oligonucleo-
tides (for in situ hybridization) into tissue samples as large as
intact organs has remained challenging. Penetration of macro-
molecules into tissues cleared using various clearing tech-
niques has been demonstrated, for example, by CLARITY
(Chung et al., 2013), iDISCO+ (Renier et al., 2016), vDISCO
(Cai et al., 2018), CUBIC-L/R+, and CUBIC-X (Matsumoto
et al., 2019; Murakami et al., 2018). Nevertheless, uniformly
staining thick samples—particularly intact, adult mammalian
brains—may require protocol and/or probe optimization to
effectively label different molecular targets. In addition, molec-
ular labeling may be time consuming, requiring several weeks
or months for probes to thoroughly penetrate large samples
even following delipidation and/or hydrogel embedding. Active
processes, such as stochastic electrotransport, may accelerate
macromolecule diffusion (Kim et al., 2015a; Lee et al., 2016).
Ongoing methodological development aims to increase the
speed, reliability, and set of molecular targets that may be
labeled in cleared tissue.
One powerful application of whole-brain tissue clearing and
molecular labeling is efficient, brain-wide identification of cells
expressing immediate early genes (IEGs). The expression of
IEGs such as c-fos, Arc, Egr-1, FosB, and Npas4 marks tran-
scriptionally activated neurons and that can be used as an indi-
rect measure of cells that have been recently active. Whole-brain
mapping of IEG-expressing neurons using tissue clearing and
light-sheet imaging has been demonstrated using iDisco+ (Re-
nier et al., 2016) to delineate the brain-wide set of neural circuits
engaged by parenting behavior. Identifying neural circuits using
this approach allows the neural circuits engaged by neural pro-
cesses to be mapped efficiently and comprehensively across
the brain.
Whole-Brain Profiling of CircuitsThe recent proliferation of neuroanatomical methods has also
enabled whole-brain profiling of connectivity in the brain. Con-
nectivity determines how information flows through neural cir-
cuits, giving rise to the diversity of mammalian behaviors from
the simple startle response of defensive behaviors to the
complex neuronal computations during cognitive and emotive
processing. Mesoscale connectivity, which describes the
long-range projections of neural populations, controls which
brain areas are connected (Mitra, 2014). At the microscale,
mapping the brain-wide connectivity of single neurons provides
a fine-scale description of how signals are routed between
brain areas. Mapping connectivity using light microscopy at
both the mesoscale and the microscale involves more stringent
requirements for resolution and contrast than mapping cells,
ouse brains. Only the edge regions (i.e., having no child region) are shown. OLF,amus; MB, midbrain; P, pons; MY, medulla; CB, cerebellum; FT, fiber tract; VS,
by AAV-PHP.eB (NSE-H2B-mCherry). The data and figure are adopted from
Neuron 106, May 6, 2020 379

Source region
A B
C D E
Source region
A
C D
B
E
Source region
A
C D
B
E
Anterograde tracing Single-cell reconstruction Connectivity structureA
B
Target regionsTarget regions Target regions
Figure 5. Whole-Brain Profiling of CircuitsSingle-neuron reconstruction reveals structuredconnectivity patterns.(A) Left, anterograde tracing of a population ofneurons in a source brain region can reveal regionsof the brain to which the source connects (i.e.,regions A, B, and D, but not C and E). Middle,single-cell axonal reconstruction reveals whereindividual neurons connect. Right, from single-neuron reconstructions, classes of neurons withsimilar connectivity can be identified and struc-tured patterns of connectivity across a populationcan be determined.(B) Top left, single-neuron reconstructions of pro-jection neurons in the subiculum (boxed region).Top right, axonal reconstructions reveal distinctbrain-wide patterns of connectivity (color coded)(Cembrowski et al., 2018; Winnubst et al., 2019).Bottom left, single-neuron reconstructions ofpyramidal tract neurons in themotor cortex (boxedregion). Bottom right, axonal reconstructionsreveal two distinct types of pyramidal tract neu-rons based on their brain-wide connectivity (green,magenta) (Economo et al., 2018).
llReview
because axonal processes with diameters much smaller than
neuronal somata must be detected with high fidelity. Therefore,
block-face imaging methods have remained the dominant
approach and have been deployed successfully for mapping
connectivity. At the mesoscale, STPT has been used to map
the long-range connectivity of thalamic projections, connec-
tions between the cortex and the striatum, and perhaps most
notably, region-to-region connectivity as part of the Allen
Institute for Brain Science Mouse Connectivity Project. This
project has assayed the brain-wide projections of genetically
identified populations of cells in hundreds of brain regions (Oh
et al., 2014).
Althoughmapping mesoscale connectivity effectively identifies
the set of brain regions to which a neural population projects,
microscale connectivity controls how those connections are
structured at the cellular level. This information is crucial for iden-
tifying cell types and defining how information is represented and
communicated between brain areas (Figure 5). To determine
long-range connectivity in the brain with single-neuron resolution,
Economo and colleagues extended STPT to full, volumetric imag-
ing of the mouse brain by increasing the acquisition rate by
20-fold and combining it with tissue clearing (Economo et al.,
2016) and sparse neuronal labeling. In doing so, they were able
to reconstruct the axonal projections of single neurons in their
380 Neuron 106, May 6, 2020
entirety. Using whole-brain imaging to
determine axonal connectivity increased
the efficiency of this process by several or-
ders of magnitude compared with existing
histological approaches (Economo et al.,
2019). Efficient, single-neuron reconstruc-
tion has also been demonstrated using
fMOST (Li et al., 2018). These methods
have enabled the brain-wide projections
of more than 1,000 neurons to be recon-
structed in their entirety (Winnubst et al.,
2019). Mapping connectivity at the micro-
scale has been instrumental for revealing the heterogeneity of
projection neurons and the structure of the projection pathways
they comprise in motor (Economo et al., 2018), somatosensory
(Hooks et al., 2018), and visual (Han et al., 2018) cortices; hippo-
campus (Cembrowski et al., 2018); and claustrum (Wang et al.,
2019). Despite the success of projects using block-face imaging
tomap long-range connectivity in the brain, instruments designed
for this purpose are not widely available to most researchers.
Advances in light-sheet microscopy (Chhetri et al., 2015; Keller
and Dodt, 2012; Verveer et al., 2007) promise to substantially
reduce the time necessary for brain-wide imaging with sufficient
resolution to resolve and reconstruct axons, increasing the effi-
ciency of this process and enabling comprehensive atlasing of
long-range connectivity patterns in the mammalian brain (Econ-
omo et al., 2019).
Future PerspectiveSeamless integration of tissue-clearing methods and light-sheet
microscopy will continue to enable key applications in neurosci-
ence, including whole-brain profiling of cells and circuits in
rodents. In the near future, improvement of clearing, staining, im-
aging, and image informaticswill expand the spectrumof applica-
tions to whole-brain profiling of cells in primates and humans, one
of the grand challenges in neuroscience. Isotropic imaging of

llReview
cleared and 5-fold expanded entire mouse brains at 1.3 3 1.3 3
1.3 mm resolution gives rise to�2.5 TB of data per brain (�0.5 TB
3 5-fold volume expansion) and is estimated to be sufficient for
extracting cell-nucleus information and constructing 3D single-
cell-resolution whole-brain atlases. Because marmoset brains
(�7.6 g) and human brains (�1,330 g) are approximately 15-
and 2,660-fold larger, respectively, than mouse brains (�0.5 g)
(Stephan et al., 1981), whole-brain profiling of marmoset and hu-
man brains will give rise to �38 TB and 6.65 PB of data, respec-
tively, and provide single-cell-resolution whole-brain atlases
comprising �1.5 3 109 and �2.7 3 1011 cells, respectively. To
achieve whole-brain profiling of cells in primates and humans,
several remaining issues need to be addressed. One of the re-
maining issues toward this goal is more stringent delipidation.
Although the chemistry of the delipidation process in tissue
clearing has been greatly advanced by chemical screening and
profiling (Inoue et al., 2019; Tainaka et al., 2018; Zhao et al.,
2019) and by developing stringent fixation protocols (Park et al.,
2018), delipidation of the lipid-rich brains of marmosets and hu-
mans may require improvements in delipidation chemistry, in
particular for the white matter of the brain. Another remaining
issue is auto-fluorescence, in particular human brain specimens.
Because the human brain is usually fixed in formaldehyde for a
long period, there is a need for minimizing auto-fluorescence
arising from long-term fixation. The third issue on the path toward
whole-brain profiling of cells in such large brains is the need for
development of optimal microscopy for marmoset and human
brains. Because amarmoset brain is 15 times larger than amouse
brain, the development of new, large-aperture opticswith the long
working distance required to cover the entire marmoset brain will
be necessary. As far as human brains are concerned, an imaging
strategy based on physical sectioning of the brain will likely pre-
sent the most promising approach. Even in this case, advance-
ments in microscopy will be essential for rapid, high-resolution
imaging of the resulting thick slices (e.g., �5 mm thickness) with
a cross-section area of�100 cm2. Especially for such large tissue
samples that may even comprise human tumors (Dodt et al.,
2015), light sheets with an extended Rayleigh range (Saghafi
et al., 2014) could be particularly helpful. In addition, more power-
ful image informatics are needed to accurately and rapidly extract
information from terabyte- and petabyte-scale datasets. Although
these challenges may seem daunting at present, we believe that
they will likely be solved in the near future, enabling the construc-
tion of 3D single-cell-resolution whole-brain atlases that serve as
a foundation upon which to integrate additional information, such
as cell types, cell states (e.g., c-Fos expression), and cellular con-
nectivity.
In the realm of structural connectivity, whole-brain profiling of
circuits at the single-neuron level presents another grand chal-
lenge for mammalian neuroscience. As discussed earlier, a
recent study characterized the long-range axonal projections
of more than 1,000 neurons from a few key areas in the mouse
brain (Winnubst et al., 2019). However, a detailed brain-wide
classification of neurons into morphological cell types in the
mouse brain would likely require a sampling of at least 100,000
neurons (�0.1% of all cells in the mouse brain, because it is esti-
mated that there are�1,000 brain regions in themouse brain and
likely more than 10 cell types per region) (Winnubst et al., 2019).
Furthermore, a more complete description of neuronal cell types
would require establishing correspondences of morphology,
gene expression, and function at the single-neuron level. Faster
imaging afforded by novel light-sheet approaches, together with
increased throughput in the reconstruction process (a 10- to
20-fold improvement over the current state of the art) because
of further automation, could make this goal achievable in a few
years. Obtaining such comprehensive information on the struc-
tural organization of the brain will provide foundational informa-
tion necessary for functional insights into the mammalian brain
in health and disease.
ACKNOWLEDGMENTS
We thank E.A. Susaki for helping to construct Figure 1 for advanced tissue-clearing methods, K. Matsumoto for helping to construct Figure 4 and JohanWinnubst for help with renderings in Figure 5. We also gratefully acknowledgegrant support from Brain/MINDS JP20dm0207049, Science and TechnologyPlatform Program for Advanced Biological Medicine JP20am0401011,AMED-CREST JP20gm0610006 (AMED/MEXT) (to H.R.U.), Grant-in-Aid forScientific Research (S) JP25221004 (JSPS KAKENHI) (to H.R.U.), and HFSPResearch Grant Program (HFSP RGP0019/2018) (to H.R.U.) as well as fundingfrom the Austrian Science Fund (FWF) and the Vienna Science Fund (WWTF)(to H.-U.D.), the Howard Hughes Medical Institute (to P.J.K., M.N.E., andJ.C.), and NIMH U01 MH105971 and U01 MH114824 (to P.O.).
AUTHOR CONTRIBUTIONS
H.R.U., H.-U.D., and P.J.K. wrote the introduction section; H.R.U. wrote thetissue-clearing section; P.J.K. and H.-U.D. wrote the light-sheet microscopysection; P.O., M.N.E., and H.R.U. wrote the whole-brain cell profiling section;M.N.E. and J.C. wrote the whole-brain circuit profiling section; and H.R.U. andP.J.K. wrote the future perspective section. All authors discussed and com-mented on the manuscript text.
DECLARATION OF INTERESTS
H.R.U. is a co-inventor on patent applications covering the CUBIC reagentsand a cofounder of CUBICStars Inc. P.J.K. is a co-inventor on patents and pat-ent applications covering multi-view and adaptive light-sheet microscopy.P.O. is a cofounder of Certerra Inc. and Certego Therapeutics Inc.
REFERENCES
Ahrens, M.B., Orger, M.B., Robson, D.N., Li, J.M., and Keller, P.J. (2013).Whole-brain functional imaging at cellular resolution using light-sheet micro-scopy. Nat. Methods 10, 413–420.
Amiya, T., and Tanaka, T. (1987). Phase transitions in crosslinked gels ofnatural polymers. Macromolecules 20, 1162–1164.
Antonio, A. (1949). Quantitative researches on the optical properties of humanbone. Nature 163, 604.
Aoyagi, Y., Kawakami, R., Osanai, H., Hibi, T., and Nemoto, T. (2015). A rapidoptical clearing protocol using 2,20-thiodiethanol for microscopic observationof fixed mouse brain. PLoS ONE 10, e0116280.
Ariel, P. (2017). A beginner’s guide to tissue clearing. Int. J. Biochem. Cell Biol.84, 35–39.
Ascenzi, A., and Fabry, C. (1959). Technique for dissection and measurementof refractive index of osteones. J. Biophys. Biochem. Cytol. 6, 139–142.
Azaripour, A., Lagerweij, T., Scharfbillig, C., Jadczak, A.E., Willershausen, B.,and Van Noorden, C.J. (2016). A survey of clearing techniques for 3D imagingof tissues with special reference to connective tissue. Prog. Histochem.Cytochem. 51, 9–23.
Bashkatov, A.N., Berezin, K.V., Dvoretskiy, K.N., Chernavina, M.L., Genina,E.A., Genin, V.D., Kochubey, V.I., Lazareva, E.N., Pravdin, A.B., Shvachkina,
Neuron 106, May 6, 2020 381

llReview
M.E., et al. (2018). Measurement of tissue optical properties in the context oftissue optical clearing. J. Biomed. Opt. 23, 1–31.
Baumgart, E., and Kubitscheck, U. (2012). Scanned light sheet microscopywith confocal slit detection. Opt. Express 20, 21805–21814.
Bayless, D.W., and Shah, N.M. (2016). Genetic dissection of neural circuits un-derlying sexually dimorphic social behaviours. Philos. Trans. R. Soc. Lond. BBiol. Sci. 371, 20150109.
Becker, K., J€ahrling, N., Saghafi, S., Weiler, R., and Dodt, H.U. (2012). Chem-ical clearing and dehydration of GFP expressing mouse brains. PLoS ONE 7,e33916.
Becker, K., Hahn, C.M., Saghafi, S., J€ahrling, N., Wanis, M., and Dodt, H.U.(2014). Reduction of photo bleaching and long term archiving of chemicallycleared GFP-expressing mouse brains. PLoS ONE 9, e114149.
Belle, M., Godefroy, D., Dominici, C., Heitz-Marchaland, C., Zelina, P., Hellal,F., Bradke, F., and Chedotal, A. (2014). A simple method for 3D analysis of im-munolabeled axonal tracts in a transparent nervous system. Cell Rep. 9,1191–1201.
Belle, M., Godefroy, D., Couly, G., Malone, S.A., Collier, F., Giacobini, P., andChedotal, A. (2017). Tridimensional Visualization and Analysis of Early HumanDevelopment. Cell 169, 161–173.
Beltz, B.S., and Kravitz, E.A. (1983). Mapping of serotonin-like immunoreac-tivity in the lobster nervous system. J. Neurosci. 3, 585–602.
Bishop, C.A., and O’Shea, M. (1982). Neuropeptide proctolin (H-Arg-Try-Leu-Pro-Thr-OH): immunocytochemical mapping of neurons in the central nervoussystem of the cockroach. J. Comp. Neurol. 207, 223–238.
Bouchard, M.B., Voleti, V., Mendes, C.S., Lacefield, C., Grueber, W.B., Mann,R.S., Bruno, R.M., and Hillman, E.M. (2015). Swept confocally-aligned planarexcitation (SCAPE) microscopy for high speed volumetric imaging of behavingorganisms. Nat. Photonics 9, 113–119.
Breuninger, T., Greger, K., and Stelzer, E.H. (2007). Lateral modulation boostsimage quality in single plane illumination fluorescence microscopy. Opt. Lett.32, 1938–1940.
Cai, R., Pan, C., Ghasemigharagoz, A., Todorov, M.I., Forstera, B., Zhao,S., Bhatia, H.S., Mrowka, L., Theodorou, D., et al. (2018). PanopticvDISCO imaging reveals neuronal connectivity, remote trauma effectsand meningeal vessels in intact transparent mice. bioRxiv. https://doi.org/10.1101/374785.
Cai, R., Pan, C., Ghasemigharagoz, A., Todorov, M.I., Forstera, B., Zhao, S.,Bhatia, H.S., Parra-Damas, A., Mrowka, L., Theodorou, D., et al. (2019).Panoptic imaging of transparent mice reveals whole-body neuronal projec-tions and skull-meninges connections. Nat. Neurosci. 22, 317–327.
Cembrowski, M.S., Phillips, M.G., DiLisio, S.F., Shields, B.C., Winnubst, J.,Chandrashekar, J., Bas, E., and Spruston, N. (2018). Dissociable Structuraland Functional Hippocampal Outputs via Distinct Subiculum Cell Classes.Cell 173, 1280–1292.e18.
Chakraborty, T., Driscoll, M., Murphy, M., Roudot, P., Chang, B.-J., Vora, S.,Wong,W.M., Nielson, C., Zhang, H., Zhemkov, V., et al. (2019). Light-sheet mi-croscopy with isotropic, sub-micron resolution and solvent-independentlarge-scale imaging. bioRxiv. https://doi.org/10.1101/605493.
Chance, B., Liu, H., Kitai, T., and Zhang, Y. (1995). Effects of solutes on opticalproperties of biological materials: models, cells, and tissues. Anal. Biochem.227, 351–362.
Chen, B.C., Legant, W.R., Wang, K., Shao, L., Milkie, D.E., Davidson, M.W.,Janetopoulos, C., Wu, X.S., Hammer, J.A., 3rd, Liu, Z., et al. (2014). Latticelight-sheet microscopy: imaging molecules to embryos at high spatiotemporalresolution. Science 346, 1257998.
Chen, F., Tillberg, P.W., and Boyden, E.S. (2015). Optical imaging. Expansionmicroscopy. Science 347, 543–548.
Chen, L., Li, G., Li, Y., Li, Y., Zhu, H., Tang, L., French, P., McGinty, J., andRuan, S. (2017). UbasM: An effective balanced optical clearing method forintact biomedical imaging. Sci. Rep. 7, 12218.
382 Neuron 106, May 6, 2020
Chhetri, R.K., Amat, F., Wan, Y., Hockendorf, B., Lemon,W.C., and Keller, P.J.(2015). Whole-animal functional and developmental imaging with isotropicspatial resolution. Nat. Methods 12, 1171–1178.
Chiang, A.S., Liu, Y.C., Chiu, S.L., Hu, S.H., Huang, C.Y., and Hsieh, C.H.(2001). Three-dimensional mapping of brain neuropils in the cockroach, Dip-loptera punctata. J. Comp. Neurol. 440, 1–11.
Chung, K., Wallace, J., Kim, S.Y., Kalyanasundaram, S., Andalman, A.S., Da-vidson, T.J., Mirzabekov, J.J., Zalocusky, K.A., Mattis, J., Denisin, A.K., et al.(2013). Structural and molecular interrogation of intact biological systems. Na-ture 497, 332–337.
Costantini, I., Ghobril, J.P., Di Giovanna, A.P., Allegra Mascaro, A.L., Silvestri,L., M€ullenbroich, M.C., Onofri, L., Conti, V., Vanzi, F., Sacconi, L., et al. (2015).A versatile clearing agent for multi-modal brain imaging. Sci. Rep. 5, 9808.
Coutu, D.L., Kokkaliaris, K.D., Kunz, L., and Schroeder, T. (2018). Multicolorquantitative confocal imaging cytometry. Nat. Methods 15, 39–46.
de Medeiros, G., Norlin, N., Gunther, S., Albert, M., Panavaite, L., Fiuza, U.M.,Peri, F., Hiiragi, T., Krzic, U., and Hufnagel, L. (2015). Confocal multiview light-sheet microscopy. Nat. Commun. 6, 8881.
Dean, K.M., Roudot, P., Welf, E.S., Danuser, G., and Fiolka, R. (2015). Decon-volution-free subcellular imaging with axially swept light sheet microscopy.Biophys. J. 108, 2807–2815.
Dent, J.A., Polson, A.G., and Klymkowsky,M.W. (1989). A whole-mount immu-nocytochemical analysis of the expression of the intermediate filament proteinvimentin in Xenopus. Development 105, 61–74.
Dodt, H.U., Leischner, U., Schierloh, A., J€ahrling, N., Mauch, C.P., Deininger,K., Deussing, J.M., Eder, M., Zieglg€ansberger, W., and Becker, K. (2007). Ul-tramicroscopy: three-dimensional visualization of neuronal networks in thewhole mouse brain. Nat. Methods 4, 331–336.
Dodt, H.U., Saghafi, S., Becker, K., J€ahrling, N., Hahn, C., Pende, M., Wanis,M., and Niendorf, A. (2015). Ultramicroscopy: development and outlook. Neu-rophotonics 2, 041407.
Dong, H.W. (2008). Allen Reference Atlas. A Digital Color Brain Atlas of theC57BL/6J Male Mouse (John Wiley & Sons).
Dunsby, C. (2008). Optically sectioned imaging by oblique plane microscopy.Opt. Express 16, 20306–20316.
Duve, H., Thorpe, A., and Strausfeld, N.J. (1983). Cobalt-immunocytochemicalidentification of peptidergic neurons in Calliphora innervating central and pe-ripheral targets. J. Neurocytol. 12, 847–861.
Economo, M.N., Clack, N.G., Lavis, L.D., Gerfen, C.R., Svoboda, K., Myers,E.W., and Chandrashekar, J. (2016). A platform for brain-wide imaging andreconstruction of individual neurons. eLife 5, e10566.
Economo, M.N., Viswanathan, S., Tasic, B., Bas, E., Winnubst, J., Menon, V.,Graybuck, L.T., Nguyen, T.N., Smith, K.A., Yao, Z., et al. (2018). Distinct de-scending motor cortex pathways and their roles in movement. Nature563, 79–84.
Economo, M.N., Winnubst, J., Bas, E., Ferreira, T.A., and Chandrashekar, J.(2019). Single-neuron axonal reconstruction: The search for a wiring diagramof the brain. J. Comp. Neurol. 527, 2190–2199.
Epp, J.R., Niibori, Y., Liz Hsiang, H.L., Mercaldo, V., Deisseroth, K., Josselyn,S.A., and Frankland, P.W. (2015). Optimization of CLARITY for ClearingWhole-Brain and Other Intact Organs. eNeuro 2, ENEURO.0022-15.2015.
Ert€urk, A., Becker, K., J€ahrling, N., Mauch, C.P., Hojer, C.D., Egen, J.G., Hellal,F., Bradke, F., Sheng,M., andDodt, H.U. (2012). Three-dimensional imaging ofsolvent-cleared organs using 3DISCO. Nat. Protoc. 7, 1983–1995.
Ert€urk, A., Lafkas, D., and Chalouni, C. (2014). Imaging cleared intact biologicalsystems at a cellular level by 3DISCO. J. Vis. Exp. 89, e51382.
Fahrbach, F.O., and Rohrbach, A. (2010). A line scanned light-sheet micro-scope with phase shaped self-reconstructing beams. Opt. Express 18,24229–24244.
Fahrbach, F.O., and Rohrbach, A. (2012). Propagation stability of self-recon-structing Bessel beams enables contrast-enhanced imaging in thick media.Nat. Commun. 3, 632.

llReview
Fahrbach, F.O., Voigt, F.F., Schmid, B., Helmchen, F., and Huisken, J. (2013).Rapid 3D light-sheet microscopy with a tunable lens. Opt. Express 21,21010–21026.
Fu, Q., Martin, B.L., Matus, D.Q., and Gao, L. (2016). Imaging multicellularspecimens with real-time optimized tiling light-sheet selective plane illumina-tion microscopy. Nat. Commun. 7, 11088.
Fuchs, E., Jaffe, J., Long, R., and Azam, F. (2002). Thin laser light sheet micro-scope for microbial oceanography. Opt. Express 10, 145–154.
Glaser, J.R., and Glaser, E.M. (2000). Stereology, morphometry, andmapping:the whole is greater than the sum of its parts. J. Chem. Neuroanat. 20,115–126.
Gleave, J.A., Lerch, J.P., Henkelman, R.M., and Nieman, B.J. (2013). Amethodfor 3D immunostaining and optical imaging of the mouse brain demonstratedin neural progenitor cells. PLoS ONE 8, e72039.
Gonchar, Y., Wang, Q., and Burkhalter, A. (2008). Multiple distinct subtypes ofGABAergic neurons in mouse visual cortex identified by triple immunostaining.Front. Neuroanat. 1, 3.
Gong, H., Xu, D., Yuan, J., Li, X., Guo, C., Peng, J., Li, Y., Schwarz, L.A., Li, A.,Hu, B., et al. (2016). High-throughput dual-colour precision imaging for brain-wide connectome with cytoarchitectonic landmarks at the cellular level. Nat.Commun. 7, 12142.
Gradinaru, V., Treweek, J., Overton, K., and Deisseroth, K. (2018). Hydrogel-tissue chemistry: Principles and applications. Annu. Rev. Biophys. 47,355–376.
Greenbaum, A., Chan, K.Y., Dobreva, T., Brown, D., Balani, D.H., Boyce, R.,Kronenberg, H.M., McBride, H.J., and Gradinaru, V. (2017a). Bone CLARITY:Clearing, imaging, and computational analysis of osteoprogenitors withinintact bone marrow. Sci. Transl. Med. 9, eaah6518.
Greenbaum, A., Jang, M.J., Challis, C., and Gradinaru, V. (2017b). Q&A: Howcan advances in tissue clearing and optogenetics contribute to our under-standing of normal and diseased biology? BMC Biol. 15, 87.
Greer, C.J., and Holy, T.E. (2019). Fast objective coupled planar illuminationmicroscopy. Nat. Commun. 10, 4483.
Hahn, C., Becker, K., Saghafi, S., Pende, M., Avdiba�si�c, A., Foroughipour, M.,Heinz, D.E., Wotjak, C.T., and Dodt, H.-U. (2019). High-resolution imaging offluorescent whole mouse brains using stabilised organic media (sDISCO).J. Biophotonics 12, e201800368.
Hama, H., Kurokawa, H., Kawano, H., Ando, R., Shimogori, T., Noda, H., Fu-kami, K., Sakaue-Sawano, A., and Miyawaki, A. (2011). Scale: a chemicalapproach for fluorescence imaging and reconstruction of transparent mousebrain. Nat. Neurosci. 14, 1481–1488.
Hama, H., Hioki, H., Namiki, K., Hoshida, T., Kurokawa, H., Ishidate, F., Ka-neko, T., Akagi, T., Saito, T., Saido, T., andMiyawaki, A. (2015). ScaleS: an op-tical clearing palette for biological imaging. Nat. Neurosci. 18, 1518–1529.
Han, Y., Kebschull, J.M., Campbell, R.A.A., Cowan, D., Imhof, F., Zador, A.M.,and Mrsic-Flogel, T.D. (2018). The logic of single-cell projections from visualcortex. Nature 556, 51–56.
Hasegawa, J., Sakamoto, Y., Nakagami, S., Aida, M., Sawa, S., and Matsu-naga, S. (2016). Three-dimensional imaging of plant organs using a simpleand rapid transparency technique. Plant Cell Physiol. 57, 462–472.
Hasegawa, S., Susaki, E.A., Tanaka, T., Komaba, H., Wada, T., Fukagawa, M.,Ueda, H.R., and Nangaku, M. (2019). Comprehensive three-dimensional anal-ysis (CUBIC-kidney) visualizes abnormal renal sympathetic nerves afterischemia/reperfusion injury. Kidney Int. 96, 129–138.
Hawrylycz, M., Baldock, R.A., Burger, A., Hashikawa, T., Johnson, G.A., Mar-tone, M., Ng, L., Lau, C., Larson, S.D., Nissanov, J., et al. (2011). Digital atlas-ing and standardization in the mouse brain. PLoS Comput. Biol. 7, e1001065.
Herculano-Houzel, S., Watson, C., and Paxinos, G. (2013). Distribution of neu-rons in functional areas of the mouse cerebral cortex reveals quantitativelydifferent cortical zones. Front. Neuroanat. 7, 35.
Herculano-Houzel, S., Catania, K., Manger, P.R., and Kaas, J.H. (2015a).Mammalian Brains Are Made of These: A Dataset of the Numbers and Den-
sities of Neuronal and Nonneuronal Cells in the Brain of Glires, Primates, Scan-dentia, Eulipotyphlans, Afrotherians and Artiodactyls, and Their Relationshipwith Body Mass. Brain Behav. Evol. 86, 145–163.
Herculano-Houzel, S., von Bartheld, C.S., Miller, D.J., and Kaas, J.H. (2015b).How to count cells: the advantages and disadvantages of the isotropic frac-tionator compared with stereology. Cell Tissue Res. 360, 29–42.
Hildebrand, S., Schueth, A., Herrler, A., Galuske, R., and Roebroeck, A. (2018).Scalable cytoarchitectonic characterization of large intact human neocortexsamples. bioRxiv. https://doi.org/10.1101/274985.
Hirshburg, J., Choi, B., Nelson, J.S., and Yeh, A.T. (2007). Correlation betweencollagen solubility and skin optical clearing using sugars. Lasers Surg. Med.39, 140–144.
Holekamp, T.F., Turaga, D., and Holy, T.E. (2008). Fast three-dimensional fluo-rescence imaging of activity in neural populations by objective-coupled planarillumination microscopy. Neuron 57, 661–672.
Hooks, B.M., Papale, A.E., Paletzki, R.F., Feroze, M.W., Eastwood, B.S.,Couey, J.J., Winnubst, J., Chandrashekar, J., and Gerfen, C.R. (2018). Topo-graphic precision in sensory and motor corticostriatal projections variesacross cell type and cortical area. Nat. Commun. 9, 3549.
Horl, D., Rojas Rusak, F., Preusser, F., Tillberg, P., Randel, N., Chhetri, R.K.,Cardona, A., Keller, P.J., Harz, H., Leonhardt, H., et al. (2018). BigStitcher: Re-constructing high-resolution image datasets of cleared and expanded sam-ples. bioRxiv. https://doi.org/10.1101/343954.
Hou, B., Zhang, D., Zhao, S., Wei, M., Yang, Z., Wang, S., Wang, J., Zhang, X.,Liu, B., Fan, L., et al. (2015). Scalable and DiI-compatible optical clearance ofthe mammalian brain. Front. Neuroanat. 9, 19.
Hsueh, B., Burns, V.M., Pauerstein, P., Holzem, K., Ye, L., Engberg, K., Wang,A.C., Gu, X., Chakravarthy, H., Arda, H.E., et al. (2017). Pathways to clinicalCLARITY: volumetric analysis of irregular, soft, and heterogeneous tissues indevelopment and disease. Sci. Rep. 7, 5899.
Huang, Z.J. (2014). Toward a genetic dissection of cortical circuits in themouse. Neuron 83, 1284–1302.
Huang, Z.J., and Zeng, H. (2013). Genetic approaches to neural circuits in themouse. Annu. Rev. Neurosci. 36, 183–215.
Huisken, J., and Stainier, D.Y. (2007). Even fluorescence excitation by multidi-rectional selective plane illumination microscopy (mSPIM). Opt. Lett. 32,2608–2610.
Huisken, J., Swoger, J., Del Bene, F., Wittbrodt, J., and Stelzer, E.H. (2004).Optical sectioning deep inside live embryos by selective plane illumination mi-croscopy. Science 305, 1007–1009.
Inagaki, T., Hamm, R.N., Arakawa, E.T., and Painter, L.R. (1974). Optical anddielectric properties of DNA in the extreme ultraviolet. J. Chem. Phys. 61,4246–4250.
Inoue, M., Saito, R., Kakita, A., and Tainaka, K. (2019). Rapid chemical clearingof white matter in the post-mortem human brain by 1,2-hexanediol delipida-tion. Bioorg. Med. Chem. Lett. 29, 1886–1890.
Jing, D., Zhang, S., Luo, W., Gao, X., Men, Y., Ma, C., Liu, X., Yi, Y., Bugde, A.,Zhou, B.O., et al. (2018). Tissue clearing of both hard and soft tissue organswith the PEGASOS method. Cell Res. 28, 803–818.
Jorand, R., Le Corre, G., Andilla, J., Maandhui, A., Frongia, C., Lobjois, V., Du-commun, B., and Lorenzo, C. (2012). Deep and clear optical imaging of thickinhomogeneous samples. PLoS ONE 7, e35795.
Kawashima, T., Zwart, M.F., Yang, C.T., Mensh, B.D., and Ahrens,M.B. (2016).The Serotonergic System Tracks the Outcomes of Actions to Mediate Short-Term Motor Learning. Cell 167, 933–946.e20.
Ke, M.-T., Fujimoto, S., and Imai, T. (2013). SeeDB: a simple and morphology-preserving optical clearing agent for neuronal circuit reconstruction. Nat. Neu-rosci. 16, 1154–1161.
Ke, M.-T., Nakai, Y., Fujimoto, S., Takayama, R., Yoshida, S., Kitajima, T.S.,Sato, M., and Imai, T. (2016). Super-resolution mapping of neuronal circuitrywith an index-optimized clearing agent. Cell Rep. 14, 2718–2732.
Neuron 106, May 6, 2020 383

llReview
Keller, P.J., and Dodt, H.U. (2012). Light sheet microscopy of living or clearedspecimens. Curr. Opin. Neurobiol. 22, 138–143.
Keller, P.J., Schmidt, A.D., Wittbrodt, J., and Stelzer, E.H.K. (2008). Recon-struction of zebrafish early embryonic development by scanned light sheet mi-croscopy. Science 322, 1065–1069.
Keller, P.J., Schmidt, A.D., Santella, A., Khairy, K., Bao, Z., Wittbrodt, J., andStelzer, E.H.K. (2010). Fast, high-contrast imaging of animal development withscanned light sheet-based structured-illumination microscopy. Nat. Methods7, 637–642.
Kienle, D.F., de Souza, J.V., Watkins, E.B., and Kuhl, T.L. (2014). Thicknessand refractive index of DPPC andDPPEmonolayers bymultiple-beam interfer-ometry. Anal. Bioanal. Chem. 406, 4725–4733.
Kim, S.Y., Cho, J.H., Murray, E., Bakh, N., Choi, H., Ohn, K., Ruelas, L., Hub-bert, A., McCue, M., Vassallo, S.L., et al. (2015a). Stochastic electrotransportselectively enhances the transport of highly electromobile molecules. Proc.Natl. Acad. Sci. USA 112, E6274–E6283.
Kim, Y., Venkataraju, K.U., Pradhan, K., Mende, C., Taranda, J., Turaga, S.C.,Arganda-Carreras, I., Ng, L., Hawrylycz, M.J., Rockland, K.S., et al. (2015b).Mapping social behavior-induced brain activation at cellular resolution in themouse. Cell Rep. 10, 292–305.
Kim, Y., Yang, G.R., Pradhan, K., Venkataraju, K.U., Bota, M., Garcia Del Mo-lino, L.C., Fitzgerald, G., Ram, K., He, M., Levine, J.M., et al. (2017). Brain-wideMaps Reveal Stereotyped Cell-Type-Based Cortical Architecture and Subcor-tical Sexual Dimorphism. Cell 171, 456–469.
Klingberg, A., Hasenberg, A., Ludwig-Portugall, I., Medyukhina, A., M€ann, L.,Brenzel, A., Engel, D.R., Figge, M.T., Kurts, C., and Gunzer, M. (2017). Fullyautomated evaluation of total glomerular number and capillary tuft size innephritic kidneys using lightsheet microscopy. J. Am. Soc. Nephrol. 28,452–459.
Krzic, U., Gunther, S., Saunders, T.E., Streichan, S.J., and Hufnagel, L. (2012).Multiview light-sheet microscope for rapid in toto imaging. Nat. Methods 9,730–733.
Ku, T., Swaney, J., Park, J.Y., Albanese, A., Murray, E., Cho, J.H., Park, Y.G.,Mangena, V., Chen, J., and Chung, K. (2016). Multiplexed and scalable super-resolution imaging of three-dimensional protein localization in size-adjustabletissues. Nat. Biotechnol. 34, 973–981.
Kuan, L., Li, Y., Lau, C., Feng, D., Bernard, A., Sunkin, S.M., Zeng, H., Dang, C.,Hawrylycz, M., and Ng, L. (2015). Neuroinformatics of the allen mouse brainconnectivity atlas. Methods 73, 4–17.
Kubota, S.I., Takahashi, K., Nishida, J., Morishita, Y., Ehata, S., Tainaka, K.,Miyazono, K., and Ueda, H.R. (2017). Whole-body profiling of cancer metas-tasis with single-cell resolution. Cell Rep. 20, 236–250.
Kumar, V., Scandella, E., Danuser, R., Onder, L., Nitschke, M., Fukui, Y., Halin,C., Ludewig, B., and Stein, J.V. (2010). Global lymphoid tissue remodeling dur-ing a viral infection is orchestrated by a B cell-lymphotoxin-dependentpathway. Blood 115, 4725–4733.
Kurihara, D., Mizuta, Y., Sato, Y., and Higashiyama, T. (2015). ClearSee: arapid optical clearing reagent for whole-plant fluorescence imaging. Develop-ment 142, 4168–4179.
Kuwajima, T., Sitko, A.A., Bhansali, P., Jurgens, C., Guido, W., and Mason, C.(2013). ClearT: a detergent- and solvent-free clearing method for neuronal andnon-neuronal tissue. Development 140, 1364–1368.
Kverkova, K., B�elıkova, T., Olkowicz, S., Pavelkova, Z., O’Riain, M.J.,�Sumbera, R., Burda, H., Bennett, N.C., and N�emec, P. (2018). Sociality doesnot drive the evolution of large brains in eusocial African mole-rats. Sci. Rep.8, 9203.
Lai, H.M., Liu, A.K.L., Ng,W.-L., DeFelice, J., Lee,W.S., Li, H., Li, W., Ng, H.M.,Chang, R.C.-C., Lin, B., et al. (2016). Rationalisation and validation of an acryl-amide-free procedure in three-dimensional histological imaging. PLoS ONE11, e0158628.
Lai, H.M., Liu, A.K.L., Ng, H.H.M., Goldfinger, M.H., Chau, T.W., DeFelice, J.,Tilley, B.S., Wong, W.M., Wu, W., and Gentleman, S.M. (2018). Next genera-tion histology methods for three-dimensional imaging of fresh and archival hu-man brain tissues. Nat. Commun. 9, 1066.
384 Neuron 106, May 6, 2020
Lee, H., Park, J.H., Seo, I., Park, S.H., and Kim, S. (2014). Improved applicationof the electrophoretic tissue clearing technology, CLARITY, to intact solid or-gans including brain, pancreas, liver, kidney, lung, and intestine. BMC Dev.Biol. 14, 48.
Lee, E., Choi, J., Jo, Y., Kim, J.Y., Jang, Y.J., Lee, H.M., Kim, S.Y., Lee, H.-J.,Cho, K., Jung, N., et al. (2016). ACT-PRESTO: Rapid and consistent tissueclearing and labeling method for 3-dimensional (3D) imaging. Sci. Rep.6, 18631.
Lein, E.S., Hawrylycz, M.J., Ao, N., Ayres, M., Bensinger, A., Bernard, A., Boe,A.F., Boguski, M.S., Brockway, K.S., Byrnes, E.J., et al. (2007). Genome-wideatlas of gene expression in the adult mouse brain. Nature 445, 168–176.
Lemon,W.C., Pulver, S.R., Hockendorf, B., McDole, K., Branson, K., Freeman,J., and Keller, P.J. (2015). Whole-central nervous system functional imaging inlarval Drosophila. Nat. Commun. 6, 7924.
Li, A., Gong, H., Zhang, B., Wang, Q., Yan, C., Wu, J., Liu, Q., Zeng, S., andLuo, Q. (2010). Micro-optical sectioning tomography to obtain a high-resolu-tion atlas of the mouse brain. Science 330, 1404–1408.
Li, W., Germain, R.N., and Gerner, M.Y. (2017). Multiplex, quantitative cellularanalysis in large tissue volumes with clearing-enhanced 3D microscopy(Ce3D). Proc. Natl. Acad. Sci. USA 114, E7321–E7330.
Li, X., Yu, B., Sun, Q., Zhang, Y., Ren, M., Zhang, X., Li, A., Yuan, J., Madisen,L., Luo, Q., et al. (2018). Generation of a whole-brain atlas for the cholinergicsystem and mesoscopic projectome analysis of basal forebrain cholinergicneurons. Proc. Natl. Acad. Sci. USA 115, 415–420.
Liebmann, T., Renier, N., Bettayeb, K., Greengard, P., Tessier-Lavigne, M.,and Flajolet, M. (2016). Three-dimensional study of Alzheimer’s disease hall-marks using the idisco clearing method. Cell Rep. 16, 1138–1152.
Liu, H., Beauvoit, B., Kimura, M., and Chance, B. (1996). Dependence of tissueoptical properties on solute-induced changes in refractive index and osmolar-ity. J. Biomed. Opt. 1, 200–211.
Liu, A.K.L., Hurry, M.E., Ng, O.T.-W., DeFelice, J., Lai, H.M., Pearce, R.K.,Wong, G.T.C., Chang, R.C.C., and Gentleman, S.M. (2016). Bringing CLARITYto the human brain: visualization of Lewy pathology in three dimensions. Neu-ropathol. Appl. Neurobiol. 42, 573–587.
Liu, T.L., Upadhyayula, S., Milkie, D.E., Singh, V., Wang, K., Swinburne, I.A.,Mosaliganti, K.R., Collins, Z.M., Hiscock, T.W., Shea, J., et al. (2018).Observing the cell in its native state: Imaging subcellular dynamics in multicel-lular organisms. Science 360, eaaq1392.
Lorentz, H.A. (1880). Ueber die Beziehung zwischen der Fortpflanzungsgesch-windigkeit des Lichtes und der Korperdichte. Ann. Phys. 245, 641–665.
Lorenz, L. (1880). Uber die Refractionsconstante. Ann. Phys. 247, 70–103.
Madisen, L., Mao, T., Koch, H., Zhuo, J.M., Berenyi, A., Fujisawa, S., Hsu,Y.W., Garcia, A.J., 3rd, Gu, X., Zanella, S., et al. (2012). A toolbox of Cre-dependent optogenetic transgenic mice for light-induced activation andsilencing. Nat. Neurosci. 15, 793–802.
Mahou, P., Vermot, J., Beaurepaire, E., and Supatto,W. (2014). Multicolor two-photon light-sheet microscopy. Nat. Methods 11, 600–601.
Marhounova, L., Kotrschal, A., Kverkova, K., Kolm, N., and N�emec, P. (2019).Artificial selection on brain size leads to matching changes in overall number ofneurons. Evolution 73, 2003–2012.
Matsumoto, K., Mitani, T.T., Horiguchi, S.A., Kaneshiro, J., Murakami, T.C.,Mano, T., Fujishima, H., Konno, A., Watanabe, T.M., Hirai, H., and Ueda,H.R. (2019). Advanced CUBIC tissue clearing for whole-organ cell profiling.Nat. Protoc. 14, 3506–3537.
Mayerich, D., Abbott, L., and McCormick, B. (2008). Knife-edge scanning mi-croscopy for imaging and reconstruction of three-dimensional anatomicalstructures of the mouse brain. J. Microsc. 231, 134–143.
McDole, K., Guignard, L., Amat, F., Berger, A., Malandain, G., Royer, L.A., Tur-aga, S.C., Branson, K., and Keller, P.J. (2018). In Toto Imaging and Recon-struction of Post-Implantation Mouse Development at the Single-Cell Level.Cell 175, 859–876.e33.

llReview
McGorty, R., Liu, H., Kamiyama, D., Dong, Z., Guo, S., and Huang, B. (2015).Open-top selective plane illumination microscope for conventionally mountedspecimens. Opt. Express 23, 16142–16153.
Migliori, B., Datta, M.S., Dupre, C., Apak, M.C., Asano, S., Gao, R., Boyden,E.S., Hermanson, O., Yuste, R., and Tomer, R. (2018). Light sheet theta micro-scopy for rapid high-resolution imaging of large biological samples. BMC Biol.16, 57.
Mitra, P.P. (2014). The circuit architecture of whole brains at the mesoscopicscale. Neuron 83, 1273–1283.
Mizutani, H., Ono, S., Ushiku, T., Kudo, Y., Ikemura, M., Kageyama, N., Yama-michi, N., Fujishiro, M., Someya, T., Fukayama,M., et al. (2018). Transparency-enhancing technology allows three-dimensional assessment of gastrointes-tinal mucosa: A porcine model. Pathol. Int. 68, 102–108.
Murakami, T.C., Mano, T., Saikawa, S., Horiguchi, S.A., Shigeta, D., Baba, K.,Sekiya, H., Shimizu, Y., Tanaka, K.F., Kiyonari, H., et al. (2018). A three-dimen-sional single-cell-resolution whole-brain atlas using CUBIC-X expansion mi-croscopy and tissue clearing. Nat. Neurosci. 21, 625–637.
Murray, E., Cho, J.H., Goodwin, D., Ku, T., Swaney, J., Kim, S.Y., Choi, H.,Park, Y.G., Park, J.Y., Hubbert, A., et al. (2015). Simple, Scalable ProteomicImaging for High-Dimensional Profiling of Intact Systems. Cell 163,1500–1514.
Ng, L., Pathak, S.D., Kuan, C., Lau, C., Dong, H., Sodt, A., Dang, C., Avants, B.,Yushkevich, P., Gee, J.C., et al. (2007). Neuroinformatics for genome-wide 3Dgene expression mapping in the mouse brain. IEEE/ACM Trans. Comput. Biol.Bioinformatics 4, 382–393.
Nixon-Abell, J., Obara, C.J., Weigel, A.V., Li, D., Legant, W.R., Xu, C.S., Pa-solli, H.A., Harvey, K., Hess, H.F., Betzig, E., et al. (2016). Increased spatiotem-poral resolution reveals highly dynamic dense tubular matrices in the periph-eral ER. Science 354, aaf3928.
Nojima, S., Susaki, E.A., Yoshida, K., Takemoto, H., Tsujimura, N., Iijima, S.,Takachi, K., Nakahara, Y., Tahara, S., Ohshima, K., et al. (2017). CUBIC pathol-ogy: three-dimensional imaging for pathological diagnosis. Sci. Rep. 7, 9269.
Ogawa, S.K., and Watabe-Uchida, M. (2018). Organization of dopamine andserotonin system: Anatomical and functional mapping of monosynaptic inputsusing rabies virus. Pharmacol. Biochem. Behav. 174, 9–22.
Oh, S.W., Harris, J.A., Ng, L., Winslow, B., Cain, N., Mihalas, S., Wang, Q., Lau,C., Kuan, L., Henry, A.M., et al. (2014). A mesoscale connectome of the mousebrain. Nature 508, 207–214.
Olarte, O.E., Andilla, J., Artigas, D., and Loza-Alvarez, P. (2015). Decoupledillumination detection in light sheet microscopy for fast volumetric imaging.Optica 2, 702–705.
Olkowicz, S., Kocourek, M., Lu�can, R.K., Porte�s, M., Fitch, W.T., Herculano-Houzel, S., and N�emec, P. (2016). Birds have primate-like numbers of neuronsin the forebrain. Proc. Natl. Acad. Sci. USA 113, 7255–7260.
Osten, P., and Margrie, T.W. (2013). Mapping brain circuitry with a light micro-scope. Nat. Methods 10, 515–523.
Palero, J., Santos, S.I., Artigas, D., and Loza-Alvarez, P. (2010). A simple scan-less two-photon fluorescence microscope using selective plane illumination.Opt. Express 18, 8491–8498.
Palmer, W.M., Martin, A.P., Flynn, J.R., Reed, S.L., White, R.G., Furbank, R.T.,and Grof, C.P.L. (2015). PEA-CLARITY: 3D molecular imaging of whole plantorgans. Sci. Rep. 5, 13492.
Pan, C., Cai, R., Quacquarelli, F.P., Ghasemigharagoz, A., Lourbopoulos, A.,Matryba, P., Plesnila, N., Dichgans, M., Hellal, F., and Ert€urk, A. (2016).Shrinkage-mediated imaging of entire organs and organisms using uDISCO.Nat. Methods 13, 859–867.
Panier, T., Romano, S.A., Olive, R., Pietri, T., Sumbre, G., Candelier, R., andDebregeas, G. (2013). Fast functional imaging of multiple brain regions in intactzebrafish larvae using selective plane illumination microscopy. Front. NeuralCircuits 7, 65.
Park, Y.-G., Sohn, C.H., Chen, R., McCue, M., Yun, D.H., Drummond, G.T., Ku,T., Evans, N.B., Oak, H.C., Trieu, W., et al. (2018). Protection of tissue physi-
cochemical properties using polyfunctional crosslinkers. Nat. Biotechnol.37, 73–83.
Pende, M., Becker, K., Wanis, M., Saghafi, S., Kaur, R., Hahn, C., Pende, N.,Foroughipour, M., Hummel, T., and Dodt, H.-U. (2018). High-resolution ultra-microscopy of the developing and adult nervous system in optically clearedDrosophila melanogaster. Nat. Commun. 9, 4731.
Perbellini, F., Liu, A.K.L., Watson, S.A., Bardi, I., Rothery, S.M., and Terrac-ciano, C.M. (2017). Free-of-Acrylamide SDS-based Tissue Clearing (FAST-Clear) for three dimensional visualization of myocardial tissue. Sci. Rep.7, 5188.
Pfeffer, C.K., Xue, M., He, M., Huang, Z.J., and Scanziani, M. (2013). Inhibitionof inhibition in visual cortex: the logic of connections between molecularlydistinct interneurons. Nat. Neurosci. 16, 1068–1076.
Piezosystems_Jena. (2019). nanoX 200/400 and nanoSX 400/800. https://www.piezosystem.com/products/piezo_actuators/nanox/.
Planchon, T.A., Gao, L., Milkie, D.E., Davidson, M.W., Galbraith, J.A., Gal-braith, C.G., and Betzig, E. (2011). Rapid three-dimensional isotropic imagingof living cells using Bessel beam plane illumination. Nat. Methods 8, 417–423.
Pronneke, A., Scheuer, B., Wagener, R.J., Mock, M., Witte, M., and Staiger,J.F. (2015). Characterizing VIP Neurons in the Barrel Cortex of VIPcre/tdTo-mato Mice Reveals Layer-Specific Differences. Cereb. Cortex 25, 4854–4868.
Pusterla, J.M., Malfatti-Gasperini, A.A., Puentes-Martinez, X.E., Cavalcanti,L.P., and Oliveira, R.G. (2017). Refractive index and thickness determinationin Langmuir monolayers of myelin lipids. Biochim. Biophys. Acta Biomembr.1859, 924–930.
Quirin, S., Vladimirov, N., Yang, C.-T., Peterka, D.S., Yuste, R., and Ahrens,M.B. (2016). Calcium imaging of neural circuits with extended depth-of-fieldlight-sheet microscopy. Opt. Lett. 41, 855–858.
Ragan, T., Kadiri, L.R., Venkataraju, K.U., Bahlmann, K., Sutin, J., Taranda, J.,Arganda-Carreras, I., Kim, Y., Seung, H.S., and Osten, P. (2012). Serial two-photon tomography for automated ex vivomouse brain imaging. Nat. Methods9, 255–258.
Reichmann, J., Nijmeijer, B., Hossain, M.J., Eguren, M., Schneider, I., Politi,A.Z., Roberti, M.J., Hufnagel, L., Hiiragi, T., and Ellenberg, J. (2018). Dual-spin-dle formation in zygotes keeps parental genomes apart in early mammalianembryos. Science 361, 189–193.
Renier, N., Wu, Z., Simon, D.J., Yang, J., Ariel, P., and Tessier-Lavigne, M.(2014). iDISCO: a simple, rapid method to immunolabel large tissue samplesfor volume imaging. Cell 159, 896–910.
Renier, N., Adams, E.L., Kirst, C., Wu, Z., Azevedo, R., Kohl, J., Autry, A.E., Ka-diri, L., Umadevi Venkataraju, K., Zhou, Y., et al. (2016). Mapping of brain ac-tivity by automated volume analysis of immediate early genes. Cell 165,1789–1802.
Richardson, D.S., and Lichtman, J.W. (2015). Clarifying Tissue Clearing. Cell162, 246–257.
Royer, L.A., Lemon, W.C., Chhetri, R.K., Wan, Y., Coleman, M., Myers, E.W.,and Keller, P.J. (2016). Adaptive light-sheet microscopy for long-term, high-resolution imaging in living organisms. Nat. Biotechnol. 34, 1267–1278.
Rozbicki, E., Chuai, M., Karjalainen, A.I., Song, F., Sang, H.M., Martin, R.,Knolker, H.J., MacDonald, M.P., and Weijer, C.J. (2015). Myosin-II-mediatedcell shape changes and cell intercalation contribute to primitive streak forma-tion. Nat. Cell Biol. 17, 397–408.
Rudy, B., Fishell, G., Lee, S., and Hjerling-Leffler, J. (2011). Three groups of in-terneurons account for nearly 100% of neocortical GABAergic neurons. Dev.Neurobiol. 71, 45–61.
Saghafi, S., Becker, K., Hahn, C., and Dodt, H.U. (2014). 3D-ultramicroscopyutilizing aspheric optics. J. Biophotonics 7, 117–125.
Schmid, B., Shah, G., Scherf, N., Weber, M., Thierbach, K., Campos, C.P.,Roeder, I., Aanstad, P., and Huisken, J. (2013). High-speed panoramic light-sheet microscopy reveals global endodermal cell dynamics. Nat. Commun.4, 2207.
Neuron 106, May 6, 2020 385

llReview
Schmitz, C., and Hof, P.R. (2005). Design-based stereology in neuroscience.Neuroscience 130, 813–831.
Schwarz, M.K., Scherbarth, A., Sprengel, R., Engelhardt, J., Theer, P., and Gi-ese, G. (2015). Fluorescent-protein stabilization and high-resolution imaging ofcleared, intact mouse brains. PLoS ONE 10, e0124650.
Seiriki, K., Kasai, A., Hashimoto, T., Schulze, W., Niu, M., Yamaguchi, S., Na-kazawa, T., Inoue, K.I., Uezono, S., Takada, M., et al. (2017). High-Speed andScalable Whole-Brain Imaging in Rodents and Primates. Neuron 94, 1085–1100.e6.
Shah, S., Lubeck, E., Schwarzkopf, M., He, T.F., Greenbaum, A., Sohn, C.H.,Lignell, A., Choi, H.M., Gradinaru, V., Pierce, N.A., and Cai, L. (2016). Single-molecule RNA detection at depth by hybridization chain reaction and tissuehydrogel embedding and clearing. Development 143, 2862–2867.
Sheppard, C.J.R. (2013). Pupil filters for generation of light sheets. Opt. Ex-press 21, 6339–6345.
Siedentopf, H., and Zsigmondy, R. (1902). Uber Sichtbarmachung und Gro-ßenbestimmung ultramikoskopischer Teilchen, mit besonderer Anwendungauf Goldrubingl€aser. Ann. Phys. 315, 1–39.
Sillitoe, R.V., and Hawkes, R. (2002). Whole-mount immunohistochemistry: ahigh-throughput screen for patterning defects in the mouse cerebellum.J. Histochem. Cytochem. 50, 235–244.
Silvestri, L., Bria, A., Sacconi, L., Iannello, G., and Pavone, F.S. (2012).Confocal light sheet microscopy: micron-scale neuroanatomy of the entiremouse brain. Opt. Express 20, 20582–20598.
Silvestri, L., Costantini, I., Sacconi, L., and Pavone, F.S. (2016). Clearing offixed tissue: a review from a microscopist’s perspective. J. Biomed. Opt. 21,081205.
Simerly, R.B. (2002). Wired for reproduction: organization and development ofsexually dimorphic circuits in the mammalian forebrain. Annu. Rev. Neurosci.25, 507–536.
Spalteholz, W. (1911). Uber das Durchsichtigmachen von menschlichen undtierischen Pr€aparaten (S. Hirzel).
Staudt, T., Lang, M.C., Medda, R., Engelhardt, J., and Hell, S.W. (2007). 2,20-thiodiethanol: a newwater solublemountingmedium for high resolution opticalmicroscopy. Microsc. Res. Tech. 70, 1–9.
Stephan, H., Frahm, H., and Baron, G. (1981). New and revised data on vol-umes of brain structures in insectivores and primates. Folia Primatol. (Basel)35, 1–29.
Strnad, P., Gunther, S., Reichmann, J., Krzic, U., Balazs, B., de Medeiros, G.,Norlin, N., Hiiragi, T., Hufnagel, L., and Ellenberg, J. (2016). Inverted light-sheetmicroscope for imaging mouse pre-implantation development. Nat. Methods13, 139–142.
Susaki, E.A., and Ueda, H.R. (2016). Whole-body and Whole-Organ Clearingand Imaging Techniques with Single-Cell Resolution: Toward Organism-LevelSystems Biology in Mammals. Cell Chem. Biol. 23, 137–157.
Susaki, E.A., Tainaka, K., Perrin, D., Kishino, F., Tawara, T., Watanabe, T.M.,Yokoyama, C., Onoe, H., Eguchi, M., Yamaguchi, S., et al. (2014). Whole-brainimaging with single-cell resolution using chemical cocktails and computationalanalysis. Cell 157, 726–739.
Susaki, E.A., Tainaka, K., Perrin, D., Yukinaga, H., Kuno, A., and Ueda, H.R.(2015). Advanced CUBIC protocols for whole-brain and whole-body clearingand imaging. Nat. Protoc. 10, 1709–1727.
Swoger, J., Verveer, P., Greger, K., Huisken, J., and Stelzer, E.H. (2007). Multi-view image fusion improves resolution in three-dimensional microscopy. Opt.Express 15, 8029–8042.
Sylwestrak, E.L., Rajasethupathy, P., Wright, M.A., Jaffe, A., and Deisseroth,K. (2016). Multiplexed Intact-Tissue Transcriptional Analysis at Cellular Reso-lution. Cell 164, 792–804.
Tainaka, K., Kubota, S.I., Suyama, T.Q., Susaki, E.A., Perrin, D., Ukai-Tade-numa, M., Ukai, H., and Ueda, H.R. (2014). Whole-body imaging with single-cell resolution by tissue decolorization. Cell 159, 911–924.
386 Neuron 106, May 6, 2020
Tainaka, K., Kuno, A., Kubota, S.I., Murakami, T., and Ueda, H.R. (2016).Chemical Principles in Tissue Clearing and Staining Protocols for Whole-Body Cell Profiling. Annu. Rev. Cell Dev. Biol. 32, 713–741.
Tainaka, K., Murakami, T.C., Susaki, E.A., Shimizu, C., Saito, R., Takahashi, K.,Hayashi-Takagi, A., Sekiya, H., Arima, Y., Nojima, S., et al. (2018). ChemicalLandscape for Tissue Clearing Based on Hydrophilic Reagents. Cell Rep.24, 2196–2210.e9.
Tanaka, N., Kanatani, S., Tomer, R., Sahlgren, C., Kronqvist, P., Kaczynska,D., Louhivuori, L., Kis, L., Lindh, C., Mitura, P., et al. (2017). Whole-tissue bi-opsy phenotyping of three-dimensional tumours reveals patterns of cancerheterogeneity. Nat. Biomed. Eng. 1, 796–806.
Tatsuki, F., Sunagawa, G.A., Shi, S., Susaki, E.A., Yukinaga, H., Perrin, D., Su-miyama, K., Ukai-Tadenuma,M., Fujishima, H., Ohno, R., et al. (2016). Involve-ment of Ca(2+)-Dependent Hyperpolarization in Sleep Duration in Mammals.Neuron 90, 70–85.
Tomer, R., Khairy, K., Amat, F., and Keller, P.J. (2012). Quantitative high-speedimaging of entire developing embryos with simultaneous multiview light-sheetmicroscopy. Nat. Methods 9, 755–763.
Tomer, R., Ye, L., Hsueh, B., and Deisseroth, K. (2014). Advanced CLARITY forrapid and high-resolution imaging of intact tissues. Nat. Protoc. 9, 1682–1697.
Tomer, R., Lovett-Barron, M., Kauvar, I., Andalman, A., Burns, V.M., Sankaran,S., Grosenick, L., Broxton, M., Yang, S., and Deisseroth, K. (2015). SPED LightSheetMicroscopy: FastMapping of Biological SystemStructure and Function.Cell 163, 1796–1806.
Treweek, J.B., Chan, K.Y., Flytzanis, N.C., Yang, B., Deverman, B.E., Green-baum, A., Lignell, A., Xiao, C., Cai, L., Ladinsky, M.S., et al. (2015). Whole-body tissue stabilization and selective extractions via tissue-hydrogel hybridsfor high-resolution intact circuit mapping and phenotyping. Nat. Protoc. 10,1860–1896.
Truong, T.V., Supatto, W., Koos, D.S., Choi, J.M., and Fraser, S.E. (2011).Deep and fast live imaging with two-photon scanned light-sheet microscopy.Nat. Methods 8, 757–760.
Tsai, P.S., Kaufhold, J.P., Blinder, P., Friedman, B., Drew, P.J., Karten, H.J.,Lyden, P.D., and Kleinfeld, D. (2009). Correlations of neuronal and microvas-cular densities in murine cortex revealed by direct counting and colocalizationof nuclei and vessels. J. Neurosci. 29, 14553–14570.
Tuchin, V. (2007). Tissue Optics: Light Scattering Methods and Instruments forMedical Diagnosis, Second Edition (SPIE Press).
Tuchin, V.V. (2015). Tissue optics and photonics: light-tissue interaction.J. Biomed. Photonics Eng. 1, 98–134.
Tuchin, V.V., Maksimova, I.L., Zimnyakov, D.A., Kon, I.L., Mavlyutov, A.H., andMishin, A.A. (1997). Light propagation in tissues with controlled optical proper-ties. J. Biomed. Opt. 2, 401–417.
Tuchin, V.V., Xu, X., and Wang, R.K. (2002). Dynamic optical coherence to-mography in studies of optical clearing, sedimentation, and aggregation ofimmersed blood. Appl. Opt. 41, 258–271.
Valm, A.M., Cohen, S., Legant, W.R., Melunis, J., Hershberg, U., Wait, E., Co-hen, A.R., Davidson, M.W., Betzig, E., and Lippincott-Schwartz, J. (2017).Applying systems-level spectral imaging and analysis to reveal the organelleinteractome. Nature 546, 162–167.
Verveer, P.J., Swoger, J., Pampaloni, F., Greger, K., Marcello, M., and Stelzer,E.H. (2007). High-resolution three-dimensional imaging of large specimenswith light sheet-based microscopy. Nat. Methods 4, 311–313.
Vettenburg, T., Dalgarno, H.I., Nylk, J., Coll-Llado, C., Ferrier, D.E., �Ci�zmar, T.,Gunn-Moore, F.J., and Dholakia, K. (2014). Light-sheet microscopy using anAiry beam. Nat. Methods 11, 541–544.
Voie, A.H., Burns, D.H., and Spelman, F.A. (1993). Orthogonal-plane fluores-cence optical sectioning: three-dimensional imaging of macroscopic biolog-ical specimens. J. Microsc. 170, 229–236.
Voigt, F.F., Kirschenbaum, D., Platonova, E., Pages, S., Campbell, R.A.A.,Kastli, R., Schaettin, M., Egolf, L., van der Bourg, A., Bethge, P., et al.(2019). The mesoSPIM initiative: open-source light-sheet microscopes for im-aging cleared tissue. Nat. Methods 16, 1105–1108.
llReview
Wan, Y., Wei, Z., Looger, L.L., Koyama, M., Druckmann, S., and Keller, P.J.(2019). Single-Cell Reconstruction of Emerging Population Activity in an EntireDeveloping Circuit. Cell 179, 355–372.
Wang, Z., Zhang, J., Fan, G., Zhao, H., Wang, X., Zhang, J., Zhang, P., andWang,W. (2018). Imaging transparent intact cardiac tissue with single-cell res-olution. Biomed. Opt. Express 9, 423–436.
Wang, Y., Xie, P., Gong, H., Zhou, Z., Kuang, X., Wang, Y., Li, A.-a., Li, Y., Liu,L., Veldman, M.B., et al. (2019). Complete single neuron reconstruction revealsmorphological diversity in molecularly defined claustral and cortical neurontypes. bioRxiv. https://doi.org/10.1101/675280.
Warner, C.A., Biedrzycki, M.L., Jacobs, S.S., Wisser, R.J., Caplan, J.L., andSherrier, D.J. (2014). An optical clearing technique for plant tissues allowingdeep imaging and compatible with fluorescence microscopy. Plant Physiol.166, 1684–1687.
White, J.G., Southgate, E., Thomson, J.N., and Brenner, S. (1986). The struc-ture of the nervous system of the nematode Caenorhabditis elegans. Philos.Trans. R. Soc. Lond. B Biol. Sci. 314, 1–340.
Wilding, D., Pozzi, P., Soloviev, O., Vdovin, G., and Verhaegen, M. (2016).Adaptive illumination based on direct wavefront sensing in a light-sheet fluo-rescence microscope. Opt. Express 24, 24896–24906.
Williams, R.W., and Rakic, P. (1988). Three-dimensional counting: an accurateand direct method to estimate numbers of cells in sectionedmaterial. J. Comp.Neurol. 278, 344–352.
Winnubst, J., Bas, E., Ferreira, T.A., Wu, Z., Economo,M.N., Edson, P., Arthur,B.J., Bruns, C., Rokicki, K., Schauder, D., et al. (2019). Reconstruction of 1,000projection neurons reveals new cell types and organization of long-range con-nectivity in the mouse brain. Cell 179, 268–281.e13.
Wolf, S., Supatto, W., Debregeas, G., Mahou, P., Kruglik, S.G., Sintes, J.M.,Beaurepaire, E., and Candelier, R. (2015). Whole-brain functional imagingwith two-photon light-sheet microscopy. Nat. Methods 12, 379–380.
Wu, Y., Ghitani, A., Christensen, R., Santella, A., Du, Z., Rondeau, G., Bao, Z.,Colon-Ramos, D., and Shroff, H. (2011). Inverted selective plane illuminationmicroscopy (iSPIM) enables coupled cell identity lineaging and neurodevelop-
mental imaging in Caenorhabditis elegans. Proc. Natl. Acad. Sci. USA 108,17708–17713.
Wu, Y., Wawrzusin, P., Senseney, J., Fischer, R.S., Christensen, R., Santella,A., York, A.G., Winter, P.W., Waterman, C.M., Bao, Z., et al. (2013). Spatiallyisotropic four-dimensional imaging with dual-view plane illumination micro-scopy. Nat. Biotechnol. 31, 1032–1038.
Xu, X., Wang, R.K., Elder, J.B., and Tuchin, V.V. (2003). Effect of dextran-induced changes in refractive index and aggregation on optical properties ofwhole blood. Phys. Med. Biol. 48, 1205–1221.
Xu, X., Roby, K.D., and Callaway, E.M. (2010). Immunochemical characteriza-tion of inhibitory mouse cortical neurons: three chemically distinct classes ofinhibitory cells. J. Comp. Neurol. 518, 389–404.
Xu, N., Tamadon, A., Liu, Y., Ma, T., Leak, R.K., Chen, J., Gao, Y., and Feng, Y.(2017). Fast free-of-acrylamide clearing tissue (FACT)-an optimized new pro-tocol for rapid, high-resolution imaging of three-dimensional brain tissue.Sci. Rep. 7, 9895.
Yang, B., Treweek, J.B., Kulkarni, R.P., Deverman, B.E., Chen, C.K., Lubeck,E., Shah, S., Cai, L., and Gradinaru, V. (2014). Single-cell phenotyping withintransparent intact tissue through whole-body clearing. Cell 158, 945–958.
Ye, L., Allen, W.E., Thompson, K.R., Tian, Q., Hsueh, B., Ramakrishnan, C.,Wang, A.C., Jennings, J.H., Adhikari, A., Halpern, C.H., et al. (2016). Wiringand Molecular Features of Prefrontal Ensembles Representing Distinct Expe-riences. Cell 165, 1776–1788.
Yu, T., Zhu, J., Li, Y., Ma, Y., Wang, J., Cheng, X., Jin, S., Sun, Q., Li, X., Gong,H., et al. (2018). RTF: a rapid and versatile tissue optical clearing method. Sci.Rep. 8, 1964.
Zhao, S., Todorov, M.I., Cai, R., Steinke, H., Kemter, E., Wolf, E., Lipfert, J.,Bechmann, I., and Ert€urk, A. (2019). Cellular and Molecular Probing of IntactTransparent Human Organs. bioRxiv. https://doi.org/10.1101/643908.
Zheng, T., Yang, Z., Li, A., Lv, X., Zhou, Z., Wang, X., Qi, X., Li, S., Luo, Q.,Gong, H., and Zeng, S. (2013). Visualization of brain circuits using two-photon fluorescence micro-optical sectioning tomography. Opt. Express 21,9839–9850.
Neuron 106, May 6, 2020 387