WHOI-73-31 PERFORMANCE ANALYSIS OF WOODS HOLE
47
... .. -- - -lr -lr --.o .. :._ .... .. -c .. c - .. WHOI-73-31 PERFORMANCE ANALYSIS OF WOODS HOLE TAUT MOORINGS By R. G. Walden and N. N. Panicker WOODS HOLE OCEANOGRAPHIC INSTITUTION Woods Hole, Massachusetts 02543 June 1973 TECHNICAL REPORT Prepared for the Office of NavaZ Research under Contract N00014-66-C024lj NR 083-004. Reproduction in whoZe or in part is permitted for any purpose of the united States Government. In aiting this manuscript in a the reference shouZd be foZZowed by the phrase: UNPUBLISHED MANUSCRIPT. Approved for pubZia distribution un- Umited. Approved for Distribution Earl Chairman Department of Ocean Engineering
Transcript of WHOI-73-31 PERFORMANCE ANALYSIS OF WOODS HOLE

~,
...
.. ----lr -lr -~ --.o O~LI'I
~ .. ~ ~-c :._ .... .. ~ -c .. c -..
WHOI-73-31
PERFORMANCE ANALYSIS OF WOODS HOLE TAUT MOORINGS
By
R. G. Walden and N. N. Panicker
WOODS HOLE OCEANOGRAPHIC INSTITUTION Woods Hole, Massachusetts 02543
June 1973
TECHNICAL REPORT Prepared for the Office of NavaZ Research under Contract N00014-66-C024lj NR 083-004.
Reproduction in whoZe or in part is permitted for any purpose of the united States Government. In aiting this manuscript in a bibZiography~ the reference shouZd be foZZowed by the phrase: UNPUBLISHED MANUSCRIPT.
Approved for pubZia reZease~ distribution unUmited.
Approved for Distribution ..;..~.;....~.....::..a.'g~~---,1~--------Earl L~ Chairman Department of Ocean Engineering

ABSTRACT '
The Woods Hole Oceanographic Institution has been using deepsea moored buoys for acquiring serial observations of ocean currents, temperature .and other data for over twelve years. A brief description of the deep-sea mooring program is given. The mooring statistics and performance are described. Mooring failures of 1970 and 1971 have been categorized and statistics on the modes and causes of failures are presented. The reliabilities of different types of moorings are computed and compared. The role of radio telemetry for the real-time measurement of mooring line tension and its use in checking the mooring status are discussed. Examples of potential design data like .tension and .currents recorded by moorings that failed are provided. Finally, recommendations for research and development needed to improve mooring reliability are given.

.-Table of Contents
•
1. Introduction
1.1 Data Base
1.2 Mooring Types
2. Recovery Statistics
3. Causes of Mooring Failures
4. Telemetry
5. Conclusion
5.1 Summary
5.2 Recommendation for Research and Development
References
Appendix - Tabular of Description of Moorings and Performance
Page 1
1
1
5
15
18
26
26
27
28
30-47

•
..
List of Figures
Fig. 1 Mooring Locations ·
Fig. 2 North Atlantic Hoorings
Fig. 3 Typical Surface Buoy Mooring
Fig. 4 Typical Intermediate Buoy Mooring
Fig. 5 Typical Bottom Buoy Mooring
Fig. 6 Moorings/Year
Fig. 7 Sensor Exposure - Recovery Data
Fig. 8 Duration of Different Types of W.H.O.I. Moorings
Fig. 9 Deployments, Partial Losses and Losses by Mooring Types
Fig. 10 Component Failures
Fig. 11 Causes of Mooring Failures
Fig. 12 Breakdown of Mooring Failure Causes
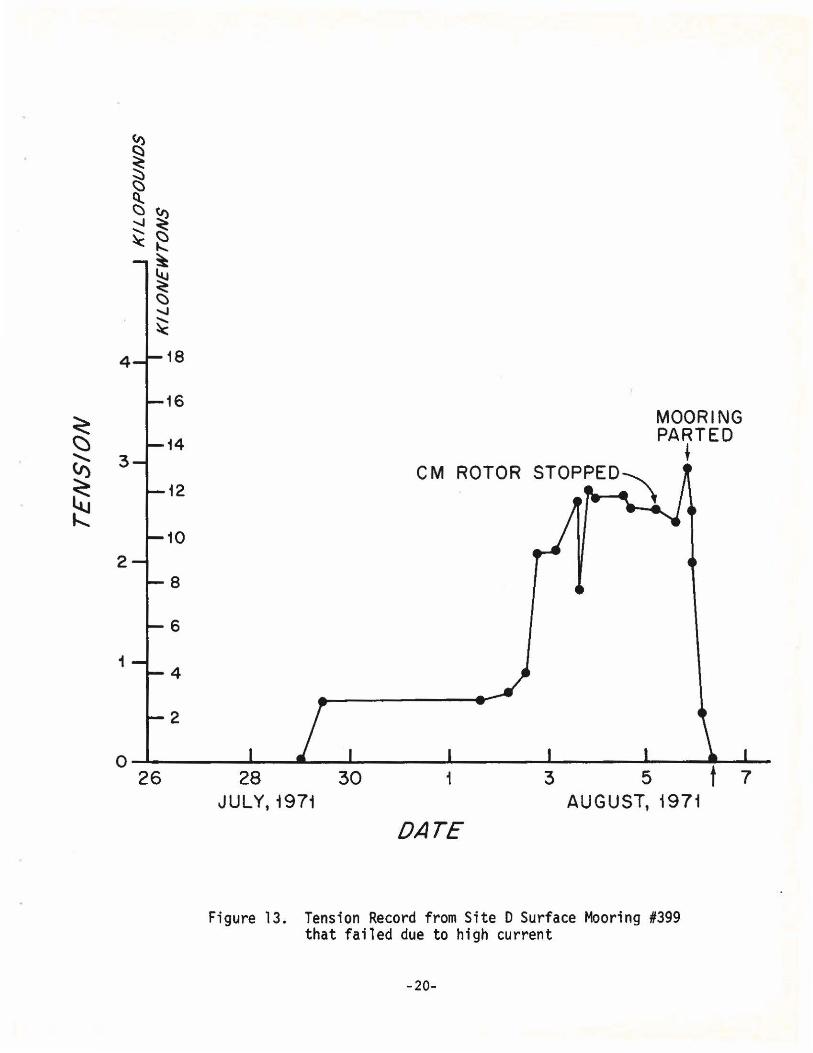
Fig. 13 Tension Record from Site D Surface Mooring #399 that failed due to high current
Fig. 14 Inclination and Tension Record from Site L Mooring #357 showing Intermediate Mooring Stability
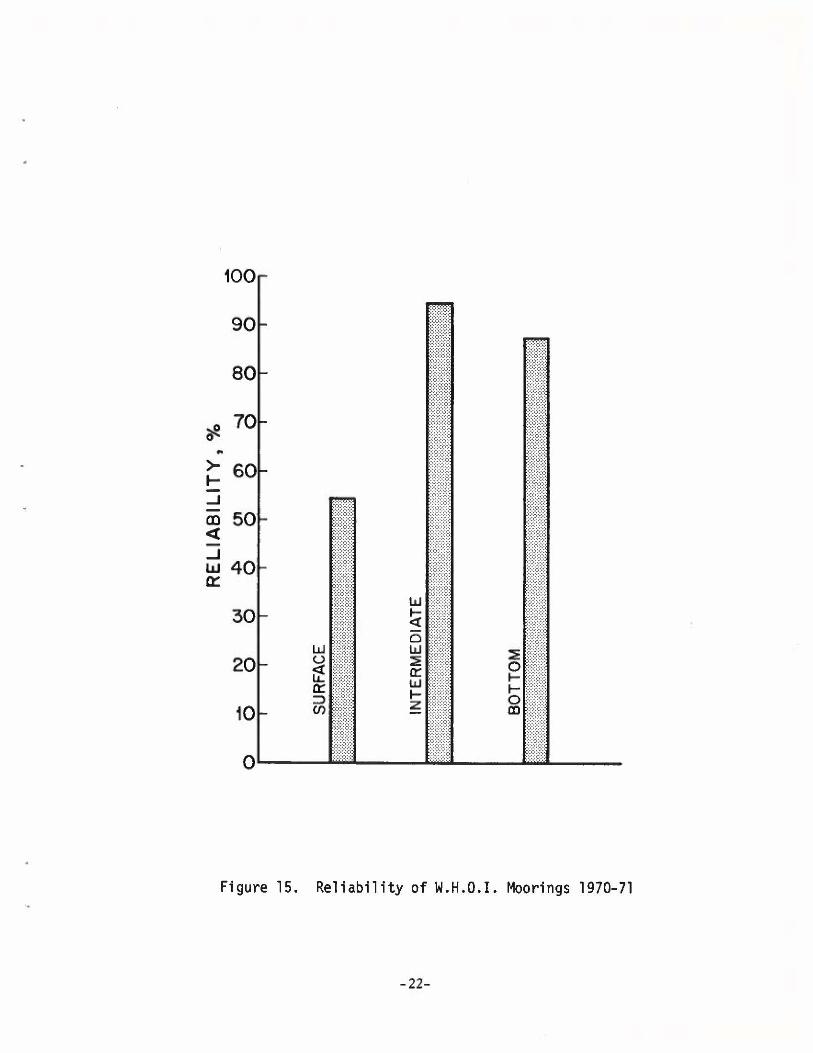
Fig. 15 Reliability of W.H.O.I. Moorings 1970-71
Fig. 16 Current Meter Record from Site D Surface Hooring #317 from depths of 13m, 53m and 105m
Fig. 17 Typical Lengths of Time for Deployment and Retrieval of W.H.O.I. Moorings at Site D
Fig. 18 Tension Measured on Mooring #355 at Site L
Page
2
3
4
6
7
8
9
11
13
14
16
17
20
21
22
23
24
25

1. Introduction
The moored array program at the Woods Hole Oceanographic Institution has set a total .a£ .. 4.6.0 . .deep .ocean .moorings since 1960. These moorings have contained recording and telemetering instruments to Eeasure current speed and direction, temperature, mooring tension, hydrostatic pressure (depth), acceleration in the horizontal and vertical planes, mooring inclination and rotation and certain meteorological parameters. Current speed and direction have been the parameters most frequently measured and recorded. This study considers in detail those moorings set or retrieved during the years 1970 and 1971 and attempts to categorize the causes of failures and to present statistics on individual component failures. In this two-year period 102 moorings were deployed, each engineered on an individual basis. Extensive documentation exists on their design, deployment and retrieval permitting a rational assessment of their performance. Through these statistics, reliability data have been obtained free from speculative and subjective inputs. The objective of the study was to provide information which can be used as a guide to define future engineering research and development efforts required to improve the reliability of the mooring types analyzed.
1.1 Data Base
Moorings set in the years 1970-1971 have been chosed to provide the data base for this study. The rationale behind this choice was based upon the establishment of an engineering program prior to these years to upgrade their performance and the introduction of a more complete documentation procedure of each mooring design, deployment and retrieval.
These years reflect the results of several basic engineering improvements such as the use of torque-balanced wire rope and improved hardware; see Berteaux and Walden (1) for details. A brief description of these moorings and their performance is given in tabular form in Appendix I.
Figures 1 and 2 show the geographical distribution by type of the moorings set in this period. Thirty-five (35) surface, 19 intermediate depth and 48 bottom moorings are shown. Most of the moorings were set in the North Atlantic Ocean on the 70th meridian West. However, 4 moorings were set in the Kuroshio Current off Japan, 5 near the Ryukyu Islands, 2 off South America and one (1) in the midNorth Atlantic.
1.2 Mooring Trpes
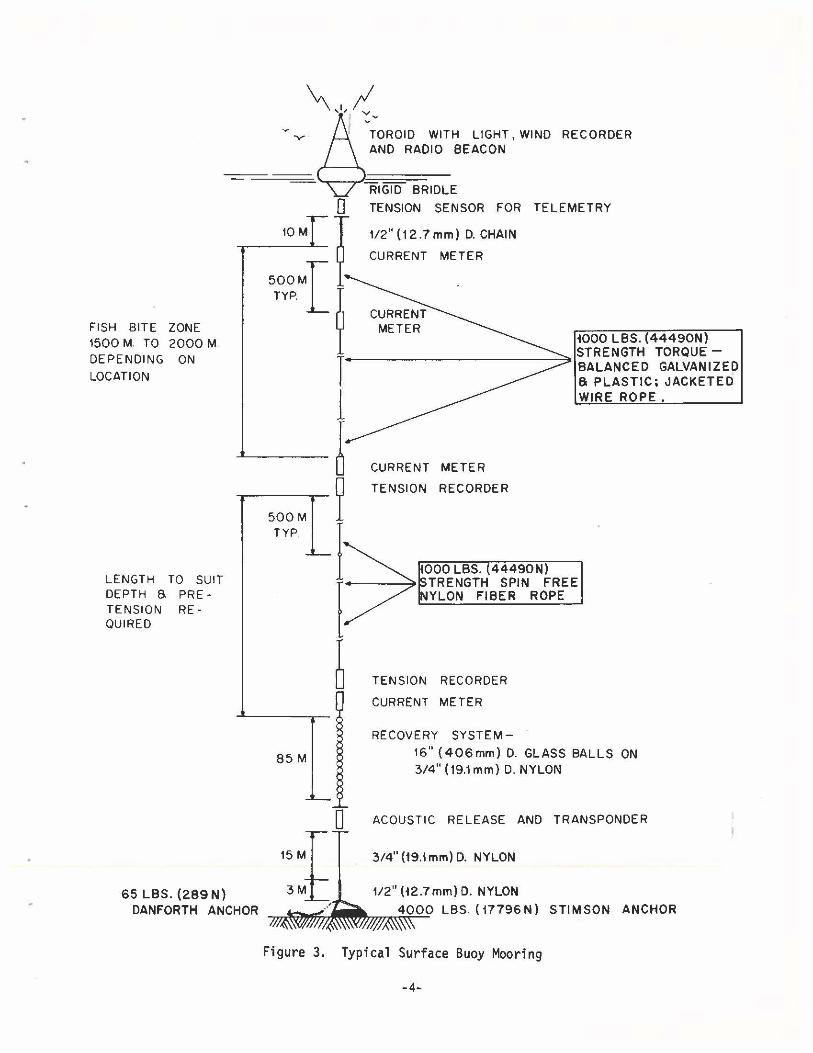
The moorings used at W.H.O.I. are single, series-connected taut structures composed of various materials and components. Three basic types of moorings are used, surface, sub-surface or intermediate, and bottom. Figure 3 shows schematically a typical surface mooring. The
-1-

I N I
goo
.) .1
. 1 • 3 •• 1
KEY e Bottom mooring
• Intermediate
• Surface
MOORING LOCATIONS 1970-1971
Figure 1. Mooring Locations
~· <#A -f;;,i
[.1 .......
soo
r-
-~
60°

~
m& ®
@
c:.:J .· ··' f. ... . "' . • KEY ~-
0 Bottom mooring
l::J. lnterrned iate
D Surface
NORTH ATLANTIC MOORINGS 1970-1971
Figure 2. North Atlantic Moorings
-3-
~ '\\ D
/ .
FISH BITE ZONE 1500 M. TO 2000 M DEPENDING ON
LOCATION
TOROID WITH LIGHT, WIND RECORDER AND RADIO BEACON
RIGID BRIDLE
TENSION SENSOR FOR TELEMETRY
112" ( 12.7 mm) D. CHAIN
CURRENT METER
....L.._ ____ f WIRE ROPE .
0 CURRENT METER
LENGTH TO SUIT DEPTH 6. PRE-TENSION RE-QUI RED
65 LBS. (289 N) DANFORTH ANCHOR
0 TENSION RECORDER
500M 1 TYP -~ 1
I________, 000 LBS. (44490N) TRENGTH SPIN FREE YLON FIBER ROPE
~ 85 M
0 15Mr
TENSION RECORDER
CURRENT METER
RECOVERY SYSTEM-
16" ( 406 mm) D. GLASS BALLS ON 3/4" (19.1 mm) D. NYLON
ACOUSTIC RELEASE AND TRANSPONDER
3/4" (19.t mm) D. NYLON
3Mt 112" (i2.7 mm) D. NYLON
~~~~mW~4~0\0::...=0 LBS. ( 17796 N) STIMSON ANCHOR
Figure 3. Typical Surface Buoy Mooring
-4-
mooring consists of a 2.5 meter toroidal shaped surface float having 22,200 newtons buoyancy. The float contains a navigation light, occasionally a windspeed and direction recorder and a beacon transmitter which is time code modulated by the output of a tension sensor located on the bottom of the rigid bridle. Attached to this tension sensor are 10 meters of chain and 2000 meters of torque-balanced wire rope to prevent damage from fishbite. The remainder of the mooring consists of non-rotating nylon rope. Recording instruments are connected into the mooring line at various depths. An acoustically operated anchor release is attached above the anchor to reduce the tension and loads during the recovery operation. A back-up recovery system, as described by Berteaux and Heinmiller (2) is attached to each mooring just above the acoustic release. It consists of a number of 40 em. diameter hollow glass spheres attached to the mooring line to provide sufficient buoyancy to raise to the surface the remains of a failed mooring. Each sphere has a buoyancy of 212 newtons. The anchor is a specially designed iron clump which has relatively high holding power at large angles from the horizontal.
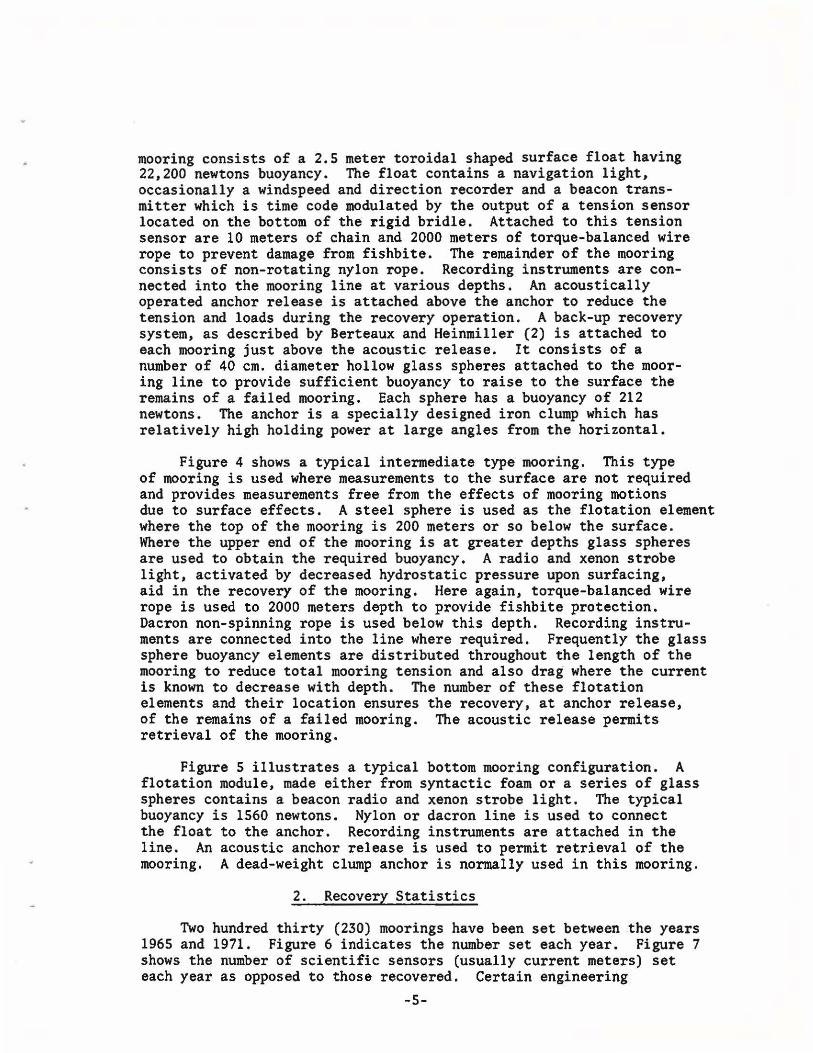
Figure 4 shows a typical intermediate type mooring. This type of mooring is used where measurements to the surface are not required and provides measurements free from the effects of mooring motions due to surface effects. A steel sphere is used as the flotation element where the top of the mooring is 200 meters or so below the surface. Where the upper end of the mooring is at greater depths glass spheres are used to obtain the required buoyancy. A radio and xenon strobe light, activated by decreased hydrostatic pressure upon surfacing, aid in the recovery of the mooring. Here again, torque-balanced wire rope is used to 2000 meters depth to provide fishbite protection. Dacron non-spinning rope is used below this depth. Recording instruments are connected into the line where required. Frequently the glass sphere buoyancy elements are distributed throughout the length of the mooring to reduce total mooring tension and also drag where the current is known to decrease with depth. The number of these flotation elements and their location ensures the recovery, at anchor release, of the remains of a failed mooring. The acoustic release permits retrieval of the mooring.
Figure 5 illustrates a typical bottom mooring configuration. A flotation module, made either from syntactic foam or a series of glass spheres contains a beacon radio and xenon strobe light. The typical buoyancy is 1560 newtons. Nylon or dacron line is used to connect the float to the anchor. Recording instruments are attached in the line. An acoustic anchor release is used to permit retrieval of the mooring. A dead-weight clump anchor is normally used in this mooring.
2. Recovery Statistics
Two hundred thirty (230) moorings have been set between the years 1965 and 1971. Figure 6 indicates the number set each year. Figure 7 shows the number of scientific sensors (usually current meters) set each year as opposed to those recovered. Certain engineering
-5-

~--- ~-.. SEA SURFACE-......._
~ Ct~~~----~~ ~~-- ----~ ~
SEA BOT
2000M
IOOOM TYP.
TOTAL LENTGH TO SUIT DEPTH
20M~ 10Mt=
I I
9
!
RADIO BEACON 8 STROBE LIGHT PACKAGE
112" (12.7 mm)O. CHAIN
181 16" (406mm) 0. GLASS BALLS (IN PLASTIC CONTAINERS
BOLTED TO CHAIN)
CURRENT METER
3/8"(9.5mm)O. SINGLE BRAID DACRON
INCLINOMETER
181!6"(406 mm) 0. GLASS BALLS
CURRENT METER
318" (9.5mm)D. SINGLE BRAID DACRON
( 71 16"(406mm)0. GLASS BALLS
CURRENT METER
9/!6" ( 14.3 mm) 0. PLAITED NYLON
16116" I 406 mm l 0. GLASS BALLS
TENSION RECORDER
ACOUSTIC RELEASE
3/4" ( 19.1 mm) D. PLAITED NYLON
112" ( 12.7 mm) 0. CHAIN
Figure 4. Typical Intermediate Buoy Mooring
-6-

,.
25M OR LESS
15M OR LESS
SEA BOTTOM
RADIO BEACON
- -
STROBE LIGHT
3501bs. (i557 N) BUOYANCY GLASS SPHERE MODULE
CURRENT METER
9/t6" ( i4.3 mm) D. PLAITED NYLON
ACOUSTIC RELEASE
3/411 ( i9. i mm) D. PLAI TEO NYLON
t12·(~2 .7mm) 0. CHAIN
Figure 5. Typical Bottom Buoy Mooring
-7-

so~
fl) 501-(!) z ~40~ 0 :t u.. 30~ 0
ffi 20~ Q)
:IE :::> 10 1-z
18
I
53 49
42 .' ,.
27
I
71
Figure 6. Moorings/Year
-8-

•
(I) 0:: 0 (/)
z l&J Cl)
lL. 0 a:: UJ CD :t ::> z
200 ,.
150 i-
100 1-
50 r-
0
SENSORS
~118
!.'!! 68
:
52 .. -
r 33
. :
1965 66
RECOVERED
-
:
:
: •,
:
:
67
i64
104 ,....- 95
90 :
:
:
68 YEAR
~ t48
r--132 :133
~ !!:!' t24 :
: :':::
:
:
:
:
::::' ./ M~ =~== . : :~::
69 70
Figure 7. Sensor Exposure - Recovery Data
-9-
r--17 10':' JQ
:
:
::::
::::
::::
:
: : :
:
:
~t
71
1 3
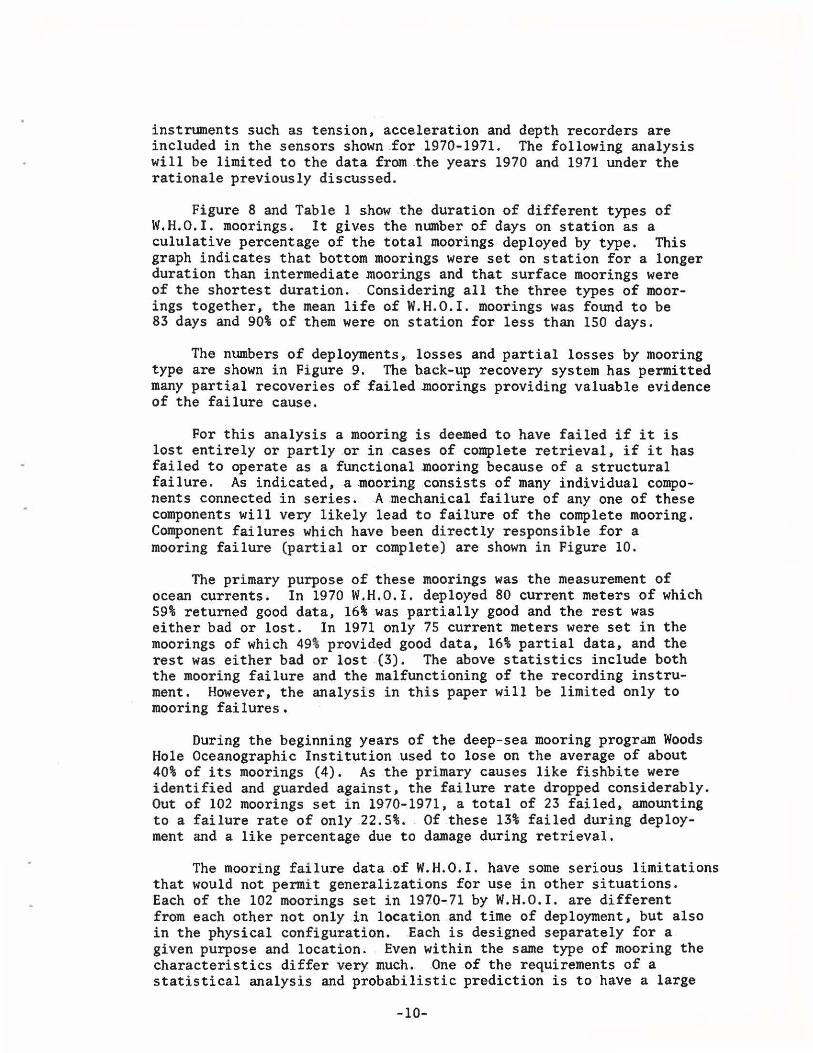
instruments such as tension, acceleration and depth recorders are included in the sensors shown .for 1970-1971. The following analysis will be limited to the data from .the years 1970 and 1971 under the rationale previously discussed.
Figure 8 and Table 1 show the duration of different types of W.H.O.I. moorings. It gives the number of days on station as a cululative percentage of the total moorings deployed by type. This graph indicates that bottom moorings were set on station for a longer duration than intermediate moorings and that surface moorings were of the shortest duration. Considering all the three types of moorings together, the mean life of W.H.O.I. moorings was found to be 83 days and 90% of them were on station for less than 150 days.
The numbers of deployments, losses and partial losses by mooring type are shown in Figure 9. The back-up recovery system has permitted many partial recoveries of failed moorings providing valuable evidence of the failure cause .
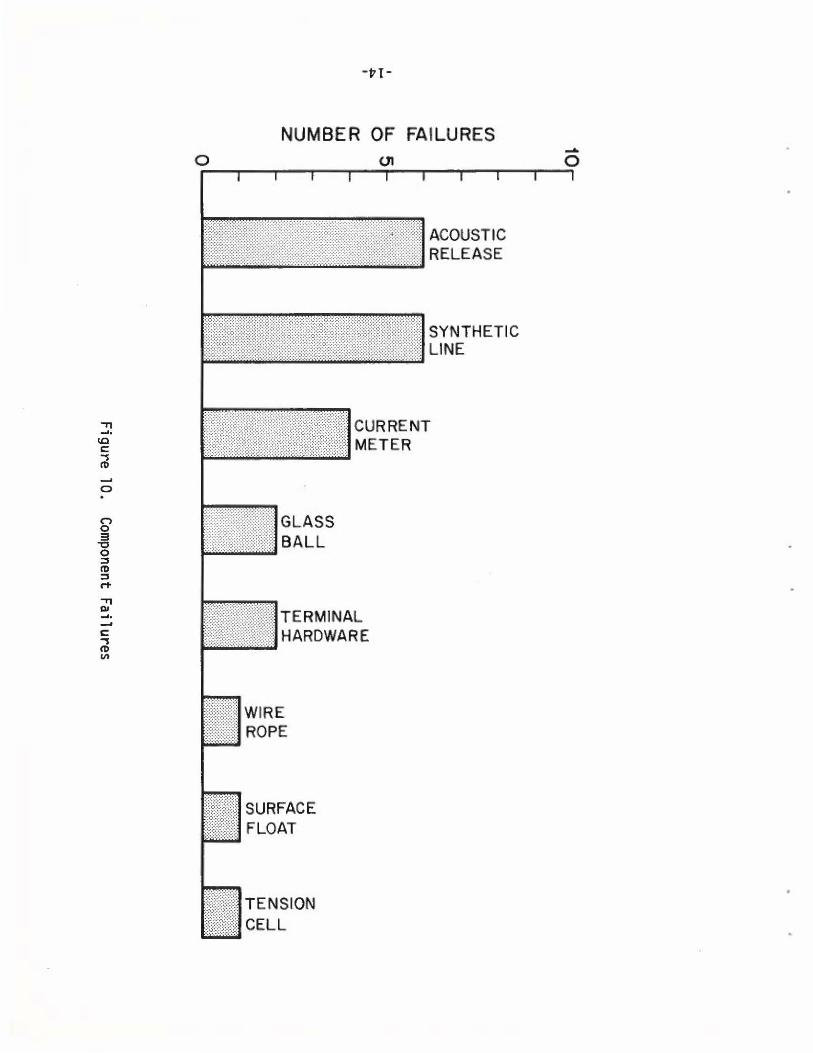
For this analysis a mooring is deemed to have failed if it is lost entirely or partly .or in .cases of complete retrieval, if it has failed to operate as a functional mooring because of a structural failure. As indicated, a mooring consists of many individual components connected in series. A mechanical failure of any one of these components will very likely lead to failure of the complete mooring. Component failures which have been directly responsible for a mooring failure (partial or complete) are shown in Figure 10.
The primary purpose of these moorings was the measurement of ocean currents. In 1970 W.H.O.I. deployed 80 current meters of which 59% returned good data, 16% was partially good and the rest was either bad or lost. In 1971 only 75 current meters were set in the moorings of which 49% provided good data, 16% partial data, and the rest was either bad or lost (3). The above statistics include both the mooring failure and the malfunctioning of the recording instrument. However, the analysis in this paper will be limited only to mooring failures.
During the beginning years of the deep-sea mooring program Woods Hole Oceanographic Institution used to lose on the average of about 40% of its moorings (4). As the primary causes like fishbite were identified and guarded against, the failure rate dropped considerably. Out of 102 moorings set in 1970-1971, a total of 23 failed, amounting to a failure rate of only 22.5%. Of these 13% failed during deployment and a like percentage due to damage during retrieval.
The mooring failure data .of W.H.O.I. have some serious limitations that would not permit generalizations for use in other situations. Each of the 102 moorings set in 197.0-71 by W.H.O.I. are different from each other not only in location and time of deployment, but also in the physical configuration. Each is designed separately for a given purpose and location. Even within the same type of mooring the characteristics differ very much. .One of the requirements of a statistical analysis and probabilistic prediction is to have a large
- 10-

.·· .·· .... ·· ••. ·i
. •••• • •• • I
/
I I
I /
•• 'I :· I
_: I .' I
.: I : I __ ._....J
I .: I •• • •
I.··· , .. ~·
/--- _,
I I
/ /
I
--SURFACE MOORING
---- INTERMEDIATE
• • • • • · • • BOTTOM MOORING
20 40 60 80 100 120 140 160 180 200 NUMBER OF DAYS ON STATION
Figure 8. Duration of Different Types of W.H.O.I. Moorings
- 11-

Surface Moorings Intermediate Moorings Bottom Moorings
Days less than No. of moorings % of total No. of Moorings % of total No. of Moorings % of total
10 5 14.3 7 14.9 3 15.8
20 5 14.3 8 17.0 3 15.8
30 7 20.0 8 17.0 3 15.8
40 9 25.7 17 36.2 3 15.8
50 14 40.0 20 42.5 5 26.3
60 21 60.0 20 42.5 6 31.6
70 22 62.9 22 46.8 6 31.6
80 22 62.9 22 46.8 6 31.6
90 23 65.7 22 46.8 7 36.9
100 27 77.1 24 51.1 10 52.6
110 30 85.7 27 57.4 13 68.5
120 31 88.5 29 61.6 13 68.5
130 31 88.5 37 78.6 13 68.5
140 32 91.5 38 80.7 15 79.0
150 33 94.2 43 91.5 19 100.0
160 33 94.2 43 91.5
170 33 94.2 46 97.9
180 35 100.0 46 97.9
190 46 97.9
200 46 97.9
210 47 100.0
Table 1. Cumulative number of days on station of WHOI moorings
-12-

35
'"''~~~ ''''''" ,,,,,,, ~~~~~~~ 9 ,,, ,,,, "'''''' ,,,,,,, ,,,,,,,
SURFACE
~LOSSES 49
,~~~ PARTIAL
19
INTERMEDIATE BOTTOM
Figure 9. Deployments, Partial Losses and Losses by Maori ng Types
., .... 10 s::: ~ _. 0 . ('") 0 3
""0 0 ::I Ill ::I c-t ., Cl .... _. s::: .., Ill
"'
· PT-
NUMBER OF FAILURES ~
0 ~ 0 I I I t I I i I I I I
lt lltlllJit1!111111111111 ~~~~~~~
~lllll!:llllllllltlllllill ~~~THETIC
~~~~~~~~~~"i ~~~~~NT
IIIJfiJIJ ~;~~s
~~~~~ ~~~~:AAR\
[f~·jj~~1111~j[~J! ~6~i -~~,~~~~~CE
111~~~cloN

number of samples from an .identical population. Therefore, it appears that the data at hand does .not .lend itself to such an analysis. The number of moorings set and the .number .of failures have been such that the requirements of homogeneity. .and stationarity are lacking from any statistical population that .could .be meaningfully grouped for study. The process under study is remarkably nonstationary because of abrupt changes in techniques and technology of taut-line mooring. These improvements in technology were .usually made as an attempt to prevent types of failures just previously observed. This feedback relationship brings in an element of deterministic dependence, usually negative, in the process. Geography, seasonal effects, type of mooring and technology affect the process very distinctly. For a meaningful prediction using the theory of probability, one needs samples from a population describing an identifiable process; a prediction based on a tabulation of single events may not be physically meaningful even if pedagogically tolerated. Therefore, rigorous statistical analysis and probabilistic prediction are not attempted in this study.
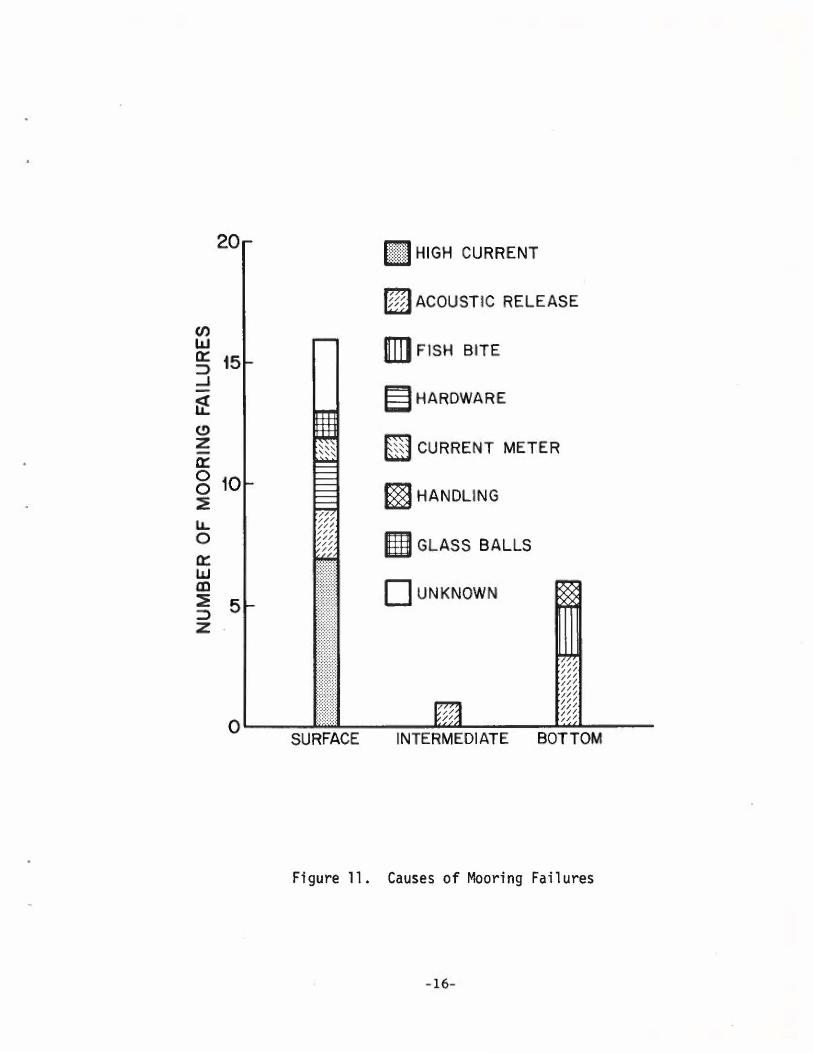
3. Causes of Mooring Failures
The causes of failures for a particular type of mooring are shown in Figure 11. Seven mooring failures which were definitely associated with high currents were found to occur on surface moorings. The two authenticated fishbite .failures of bottom moorings occurred in the Gulf Stream while the mooring was on the surface in the process of being deployed. The deployments took place at night and sharks were observed in the vicinity, probably attracted to the area by the ship's lights.
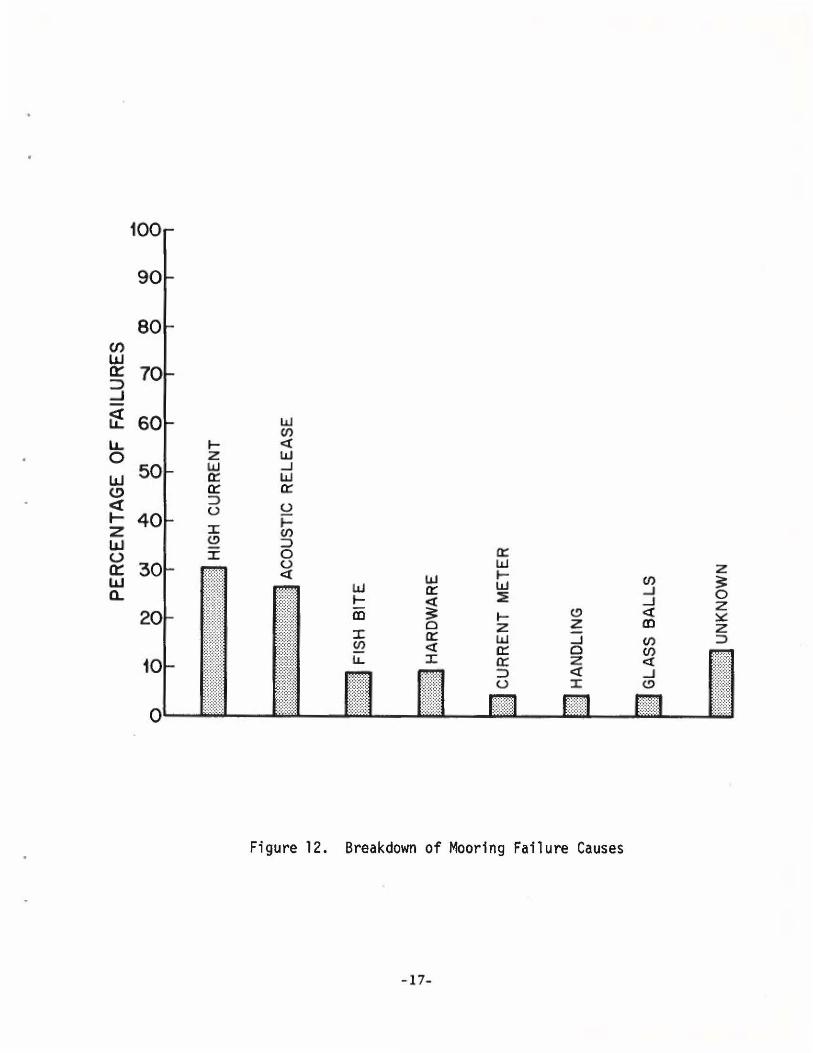
Figure 12 shows the percentage of all types of mooring failures due to various causes. The major .cause of failures has been due to high mooring stresses caused .by .the incursion of high currents into the area. While the reliability of .operation of our acoustic anchor release has improved markedly, .it can be seen that at least during those two years, problems involving .this critical component existed. Failures due to hardware were .found,. only in surface moorings, where excitation from surface waves caused shackled connections in the wire rope portion of the mooring .to foul or cock resulting in bending moments of the swaged fittings with resulting failure.
The largest single cause .of mooring failure during this twoyear period can be seen .in .Figure .12 as the occurrence of strong ocean currents. High currents caused about 30% of all the mooring failures. The current meters on these failed moorings recorded currents as high as 1.5 meters per second. In one such record (Mooring #402), a current speed .of greater than a meter per second persisted for about 2 days .and .the mooring failed 3 days later. The cage of one of the current meter.s parted and the surface float was picked up 110 kilometers away .from .the place where it was set. The excessive tensile stress developed on .the current meter cage because of the high drag on the surface float, the mooring line and other
-15-
20 [mJ] HIGH CURRENT
U?U ACOUSTIC RELEASE
(/)
mJ FISH w BITE a.: 15 ::::> ...J
E3HARDWARE at <!) MU CURRENT METER z 0:: 0 10 0 l§mHANDU NG :E I!.. 0 liJ GLASS BALLS a:: w en OuNKNOWN ::!: 5 :::> z
o~----~~------~~------~------suRFAcE INTERMEDIATE BOTTOM
Figure 11. Causes of Mooring Failures
- 16-
(I) w a:: 3 -~ w
(f)
l1.. t- <(
0 z w w ...J
UJ 0::: w (.!) 0::: 0:: <{ ::>
(.) ..... (.)
t; z :c IJJ (!)· :;)
(,) :I: 0 0::
0:: (.) l.&J z <( w 1- (/) 3: UJ w 0:: w ..J n. I- <( ~ ....J 0 z tD ·~ 1- (!) <(
~ 0 z z m z :X: a:: w ...J (/) ::::> (/) <( a:: 0 (/)
LL.. J: a:: z <( :::> <( ...J (.) X <!)
0 : '
Figure 12. Breakdown of Mooring Failure Causes
- 17-

components, was believed to be the ~echanism of failure. Table 2 gives values of peak current speeds .obtained from three surface moorings that failed on account .of .strong currents. Figure 13 shows the tension history on one of these moorings. Intermediate moorings do not normally experience such .extremes of hydrodynamic forces. This may be seen for example .in .Figure 14 where the tension record and inclinometer record from an intermediate mooring are shown.
In line with the above facts, W.H.O.I. has a high success rate with subsurface moorings, but with surface moorings at high current areas the success rate has .been .low. The reliabilities of the three types of moorings are compared in Figure 15. Reliability here was computed as a ratio of the number of successful moorings to the total number of moorings of the same type for 1970-71. Intermediate moorings had a reliability of 94.7% and bottom moorings 87.1%. With a reliability of 54.3%, the surface moorings were found to be the least reliable of the three. It was also found that there is a greater likelihood of failure of components .near the surface than at great depths. An analysis shows that .20 .. 8% .of all failures occured at the surface and another 12.5% at .depths less than 10 meters below the surface. As a matter .of .fact, 45.8% of all failures occurred at components at depths less .than 35 meters. This may be due to the prevalence of high currents near .the surface. Current meter records from three different depths obtained from a typical mooring are shown in Figure 16. It may also .be .seen from Figure 17 that both the deployment and retrieval .times .are .the .highest for the surface mooring suggesting a greater chance of .failure for surface moorings during deployment and retrieval also.
4. Telemetry
The present scientific program at .Woods Hole does not require real-time data such as might be provided by radio telemetry from surface buoys. In fact the amount of data collected from a typical surface mooring would probably be prohibitive in quantity for anything but satellite relay ... In .addition many of our moorings have no surface expression, their sensors and flotation located many hundreds of meters below the surface. However, H. F. telemetry is routinely used on each surface mooring to monitor the mooring tension at the buoy. A small transmitter, also used as a radio beacon for locating the float for retrieval, is time-code modulated by a tension cell to which is attached to the mooring line and components. Through the use of this technique it is possible to determine, at the laboratory in Woods Hole, the mooring status. For instance, a normal tension reading of ~. 7000 newtons indicates that the mooring is intact and probably on station;. variations around this mean over a short time interval reflect the .state of the sea; high readings are associated with increased mooring drag due to high currents or wind; and obviously little or .no .tension .indicates a parted mooring. FiiUX~ 18 shows the variations .in .tensions received by telemetry over 2 months for a mooring which eventually parted due to the incursion
-18-

Depth of current Peak current, em/sec meter from
sea surface, Mooring # Location m 2 hour average 5 sec. average
402 Site D 10 115. 1 143. 5 (39N-70W)
396 Site D 10 118.1 134.0
399 Site D 11 113. 1 125.5
399 Site D 1013 42 . 7 50 . 0
Table 2. Values of peak current speeds from moorings that failed
on account of high current
-19-
16
14
12
10
2 8
6
1 4
2
26 28 30 JULY, i971
MOORING PARTED
~ CM ROTOR STOPPED~
1 3 5 7 AUGUST, 1971
DATE
Figure 13. Tension Record from Site 0 Surface Mooring #399 that failed due to high current
-20-
~ .. )-
1-...J CD <(
...J w a::
IJJ u it £r . : :::> :: Cl)
:
. ::
Figure 15. Reliability of W.H.O.I. Moorings 1970-71
-22-

13M
I
~ 53M I
105M
~:=t'YMrrrr ·~ ---~~tc~~:::~ ~ 0 Jo ~t\,.J.~J.o... J\~ A 0 w
07 12 17 22 27 01 06 11 16 21 26 01 .. OCT NOV DEC
D 120r ··o~ ~80~ 80~ ~ 0
I ~ e 40 40 ~
~ 0 0 ~
l::r:rrL~oNt:~~~='IA~r:-·.v~:::l 0
07 12 17 22 27 01 06 11 16 21 26 01 ° OCT NOV DEC
D 69 69 69 D ~8o 80~ ~ ~
~ 40 40 ! ~ 0 0 ~
l::~;.r~~-:~:::1 0
07 12 17 22 27 01 06 11 16 21 26 01 ° OCT NOV DEC
,... 69 69 69 n ~ 80 80 ~
~ •o •o! ~ 0 0 ~
Figure 16. Current Meter Record from Site D Surface Mooring #317 from depths of 13m, 53m, and 105m

110 ~
100 l-
90 1-
80 1-
(/) 70 1-
UJ ~ :::> 60 1-z ~ 50 1-.. UJ :E
40 1-t-
30 1-
20 ~
iO -0
_J
ct > UJ -a: ..... w et:
t-:'y
z UJ
1- ~ z >-
"" 9 :E a.. : .. >- w 0 ...J 0 ..J <(
·m: a.. > ~~ w w 0 -et:
..... w tr 0: :
I ht tii:. I :::
;:;:;
. :: .. .. ::;:; :
1- _J
z <( :;: [
!It > : : f;::
IJJ {t ~::: ~ w :::: ·
II II :::t: .. r:::: >- a: f{
0 I- 1:': ..J .. w . :
[J:il.[ a.. a: :::::: . w .:::: 0 :y ::[?=' :
:::1:'
.
:p :::::: II mt~ '1. ::::: ·:::: ·. ::~~~~~ m::::, ;:;::
BOTTOM INTERMEDIATE SURFACE
Figure 17. Typical Lengths of Time for Deployment and Retrieval of W.H.O.I. Moorings at SiteD
-24-

I N t/1 I
16 (f) z
- TELEMETERED TENSION VALUES (SURFACE)
x TENSION REPORTED BY R/V KNORR
0 VALUE OBTAINED FROM TENSION RECORDER (5300m)
MOORING PARTED......_ X
X
0
g14 3:. lLI z 0 __J
~
z z 0 -(f) z LLJ ...-
- I - II-
I o I
_II I II III l Il----~I-I-~/0 0
L I 0-0-0-0 0 0 0 0
0 1 I I I I I I I I I I I I I I I I I I I I 1 I I I ! I I I I Jl I
... •• ..,. 15 17 19 21 23 25 27 29 31 2 4 6 8 10 12 14 16 18 20 22 24 26 28 30 2 4 6 8 10
OCTOBER '70 NOVEMBER '70 DECEMBER 170
Figure 18. Tension Measured on Mooring #355 at Site L

failures. The causes of 13.1% .of the failures could not be identified, because the moorings or failed components were lost.
During the first several years of the deep-sea mooring program of the Woods Hole Oceanographic .Institution the loss rate of moorings averaged about 40%. As the .primary causes like fishbite were identified and eliminated at least partly, the failure rate decreased. For the two-year period of 1970 and 1971 the failure rate dropped to 23 out of 102 or about 22.5%. More .recently there has been a dramatic improvement in the reliability of acoustic releases, a primary cause of failure in 1970 and 1971. Therefore the failure rate is expected to drop considerably hereon .
As the oceanographic .data .collected by W.H.O.I. are usually from deep below the surface and the .amount of data is prohibitively large, telemetry is not normally resorted to especially because real-time availability of oceanographic data is not crucial for the current scientific programs. However, real~time measurement of mooring line tension is done on each surface ~ooring, which allows continuous monitoring of the mooring status.
5.2 Recommendations for Research and Development
The study has shown that .insofar .as surface moorings are concerned, high currents contributed to the largest number of failures. Increases in mooring stress values due to large hydrodynamic loadings caused tensile and fatigue .failures in certain of the mooring components. The combination of strong current .and .high sea state create a particularly unfavorable condition .of .large dynamic stresses superimposed upon high static stresses. In most instances we conclude that sufficient data on worst-case or ~eak current conditions are not available to the design engineer. Not only are surface wind, wave and current data required but .a reasonable estimate of a worst-case currents as a function of .depth .is .also necessary for the design. Given this data, the mooring design engineer can determine the resulting mooring response and ~rovide .the required component safety factors. Criteria for both .operational and survival conditions, based upon more realistic environmental inputs, can avoid the expense of overdesign and yet minimize .the chances .of catastrophic structural failures. We urge the .cataloging .and .archiving of this worst-case data by an organization such as the NODC.
The need to determine .the .actual .static and dynamic response of moorings to such conditions .remains .obvious. This should involve a mutually interacting process of computer simulation and actual measurements. Through .a process of progressive iteration of analysis procedures and matching of .input .and .response data, improvements in mooring design and prediction may be arrived at.
The vulnerability. .to .environmental forces and unsuitability for sensor location of our present surface following buoys suggests
-27-

alternate arrangements .of buoy.ancy. providing better sensor stability . Efforts should be pursued .to .develop .buoy forms and mooring configurations to meet the requtrements of structural integrity and dynamic stability.
We continue to .experience .incidents of fishbite attack on our moorings. While the use .of .wire .rope in the upper 2000 meters has prevented mooring loss from .this .cause, damage to the jacket and to instruments (current .meter rotors). has been noted . Forthermore the synthetic portions of a mooring .have proven to be vulnerable in two cases where nylon line was bitten .through during the launch process while still on the surface .. _ .Experiments and testing of suitable armoring materials should continue to be pursued.
Failure of acoustic anchor releases to function accounted for a significant number of failures on all types of moorings . Recent improvements in our check-.out procedures, preventive maintenance and instrument documentation records .has dramatically decreased malfunctions of this critical component .. _ .In addition each release is lowered from the ship in deep water .and acoustically checked out prior to deployment on a mooring. For these reasons no additional development work is recommended at this time on this component .
. Failures .of hardware such as .terminations, shackles and instrument bales occurred mostly. on .surface .moorings. Fatigue, sometimes associated with corrosion -was .the most .common cause. Shackles which could cock in .their terminations .created a severe enough bending moment at times to .part .the .wire rope termination. Such failures have been corrected through .the choice of more suitable materials, sacrificial anodes and modifications of terminations and connections. However, our experience indicates .that these areas requi re constant vigilance through inspection and testing procedures.
Deployment and retrieval .of moorings still remain potential sources of problems. Efforts should therefore be put into the development of alternative methods .of .deployment and retrieval for better efficiency and reliability. Perhaps permanent or longer-term moorings where the data may be retri eved without the necessity of mooring recovery may be worthy of further effort.
In summary, this study has identified problem areas including specific components used in the Woods Hole taut-moorings, surface, intermediate and bottom, for the years 1970 and 1971 . Recommendations for improved performance have been made.
References
(1) BERTEAUX, H. O. and WALDEN, R. G. (1970) An Engineering Program to Improve the Reliability of Deep-Sea Moorings. Preprints of the 6th Annual Converence of Marine Technology Society, Washington, D.C.
- 28-

(2) BERTEAUX, H.O. and HEINMILLER, R.H. (1969) Back-up Recovery Systems of Deep-Sea Moorings. Reference No. 69-7 (Unpublished Manuscript). Woods Hole Oceanographic Institution.
(3) MOLLER) D.M. (1972) Current Meter History of Failures. Personal Communication.
(4) STIMSON) P.B. and PRINDLE, .B. (1972). Armoring of Synthetic Fiber Deep-Sea Mooring Lines against Fishbite. Reference No. 72-75 (Unpublished Manuscript), Woods Hole Oceanographic Institution.
~29-

Appendix I
Tabular Description of the Moorings and Performance
- 30-

Mooring No. 310 316
Mooring Type Subsurface Surface
Location 39N - 70W 39N - 70W D D
317 'lR
Surface Surface
39N - 70\~ 39N - 70W D D
Surface
34N - 70W L
Surface
39N - 70W D
Water Depth, m 2683 2692 2681 2545 5370 2690
Float Depth, m 70 0 0 0 o 0
Deployment Date 8/11/69 10/4/69 10/6/ 69 10/ 6/69 10/ 10/69 1/4/70
Retrieval Date 1/4/70 1/4/70 1/5/70 1/6/ 70 3/3/ 70 2/28/70
Days on Station 147 93 92 93 145 55
Mooring Material ylon- Dacron Wire-Nylon Nylon Nylon ~ire-Nylon Wire-Nylon
Flotation Type D. R.E. Sphere Jumbo Toroid Toroid Toroid Toroid
Retrieval Status Complete Complete Complete Partial Partial Partial
Depth of Failure, n.a . n. a . n.a. 548 <1000 19 m
Cause of Failure
Fishbite Evidence
Acoustic Release Operation
Current Meters
Telemetering Tensiometer
Other Instruments
Light Status
Radio Status
Hardware
Remarks
n.a.
Many
OK
4
n.a.
Moderate
OJC
1 Rotor Loose
yes
Tensiometer
n .a.
Severe
OK
5
Acoustic Unknown Release, Nylon Parted
Severe
No
5 1 vane gone
No
OK
1 Lost
yes, lost
2 Tensiometers
~igh Current (2 knots -1 m/sec)
No
4 3 lost
yes
~ot working Not known Not known Not known
~ntenna gone OK OK to 11/17 OK /69
~orne corrosion
Mooring moved 118 m
31
Hauled with anchor
CM Bale parted (303)
Mooring ~oroid & top parted 11/ ~M only re -
21/ 69 overed

Mooring No . 344 345 346 347 348 349
Mooring Type Surface Intermediate Bottom Bottom Bet tom Bottom
Location 34N - 70W 39N - 70W 39.5N - 71W 40N - 70.5W 40N - 71W 40N - 71W L D
Water Depth, m 5365 2527 2263 876 977 943
Float Depth, m 0 1492 2155 766 964 843
Deployment Date 8/14/70 8/18/70 8/18/70 8/19/70 8/19/70 8/19/70
Retrieval Date 10/9/70 10/6/70 12/ll/70 10/4/70 10/6/70 10/6/70
Days on Station 56 49 ll6 46 48 48
Mooring Material Wire-Nylon Dacron - Nylon Nylon Nylon Nylon Nylon
Flotation Type Toro'id Glass Balls Syntactic Syntactic ~lass Balls Glass Balls Foam Foam
Retrieval Status Complete Complete Complete Complete Complete Complete
Depth of Failure, n.a . n.a. n.a. n.a. n.a. n.a. m
Cause of Failure n.a. n.a. n.a. n.a . n.a. n .a.
Fishbite Evidence Severe
Acoustic Release OK OK OK OK OK OK Operation
Current Meters 1 2 & Dummy 1 1 2 3
Telemetering Yes Tensiometer Plug Broken
Other Instruments 2 Tension 1 Depth Rec. Rec. 1 Inclino-
meter 1 Tension
Rec.
Light Status OK Not known None Not working OK OK
Radio Status OK OK Unknown OK OK OK
Hardware Toroid Release Release leaked Shackle thimble
Corroded corroded
Remarks
35


Mooring No.
Mooring Type
Location
Water Depth, m
Float Depth, m
Deployment Date
Retrieval Date
Days on Station
Mooring Material
Flotation Type
Retrieval Status
Depth of Failure, m
Cause of Failure
Fishbite Evidence
Acoustic Release Operation
Current Meters
Tel emetering Tensiometer
Other Instruments
Light Status
Radio Status
Hardw.1.re
Remarks
356
Surface
34N - 70W L
5374
0
12/8/70
n.a.
n.a.
Wire-Nylon
Toroid
Lost
Unknown
Unknown
Not known
1 Lost
yes
2 Tension Rec.
Worked 21 Days
High tension after launch
357 3SR
Intermediate Intermediate
359
Bottom Intermediate
Bottom
37N - 72W 36.5N - 71W 38N - 69.5W L
34N - 70W 39N - 70W D
4425 2680 3528
2044 1454 3310
12/9/70 12/11/70 12/12/70
5/6/71 4/27/71 4/30/71
148 137 139
Dacron-Nylor Dacron - Nylon Nylon
Glass Balls Glass Balls Syntactic Foam
Complete Complete Complete
n.a. n.a. n .a.
n.a. n.a.
OK OK
3 3 & 1 Dummy
1 Depth Rec 1 Depth Rec. 1 Inclino- 1 Inclino-
meter 1 Tension Rec.
None
meter 1 Tension Rec.
None
n.a.
OK
1
None
4230 3950
3668 3737
12/13/70 12/14/70
5/3/71 12/14/71
141 Less than 1
Dacron Nylon
Glass Balls Syntactic Foam
Complete Partial
n.a. 0
n.a.
OK
2
None
Fishbite
Catastrophic
Unknown Lost
1
OK
OK !Not known Not working Not working OK
37
Release lost when line bitten

Mooring No. 368 <t7n ~71
Mooring Type Bottom Bottom Bottom Bottom Bottom Surface
Location 38N - 69 . 5W 23N - 66.5h 22N - 67W 21N - 68W 00 - 1601\' OIN - 160W
Water Depth, m 3955 5817 5402 5325 183 4441
Float Depth, m 3735 5601 5186 5294 132 0 Deployment Date 12/16/70 l/21/71 1/22/71 1/24/71 4/8/71 4/ 13/71 Retrieval Date 5/8/71 5/23/71 5/23/71 S/22/71 Lost 9/22/71 Days on Station 143 122 121 128 n.a. 182 Mooring Material Nylon Nylon Nylon Nylon Nylon Wire-Nylon Flotation Type it;1ass Balls Glass Balls Glass Balls Glass Balls Glass Balls Toroid
Lost Retrieval Status Complete Complete Complete Complete Lost Partial Depth of Failure, n. a . n.a . n . a . n.a. 181 10 m
Cause of Failure n.a. n .a. n.a. n.a. Acoustic Lower bale Release pn top CM
parted Fishbi te Evidence
Acoustic Release OK OK OK OK No OK Operation
Current Meters 1 2 2 1 1 3 1 flooded Lost 1 Lost
Telemetering Tensiometer
Other Instruments
Light Status OK OK Unknown OK None Lost Radio Status OK OK OK OK None None Hardware Corroded Corroded Slightly CM bale Shackles Shackle at Corroded broken
buoy bale
Remarks CM rotor fouled
39

Moorinst No. 374
Mooring Type Surface Surface Inter- Surface Surface Surface mediate
Location 00 - !SOW OlS - lSOW OlN - !SOW 39N - 70W 39N - 70W 39N - 70W D D D
Water Depth, m 4451 4657 4431 2665 2665 2662
Float Depth, m 0 0 3666 0 0 0
Deployment Date 4/16/71 4/18/71 4/25/71 4/27/71 4/27/71 4/28/71
Retrieval Date 4/23/71 9/20/71 Lost S/24/71 S/24/71 7/28/71
Days on Station 7 155 n.a. 27 27 91
Mooring Material Wire-Nylon Wire-Nylon Nylon Wire-Nylon Wire-Nylon Wire-Nylon
Flotation Type Toro·id Toroid Lost
Glass Balls Toroid Toroid Toroid
Retrieval Status Partial Complete Lost Complete Complete Complete Depth of Failure, 1000
m n.a. 4430 n.a. n.a. n.a.
Cause of Failure Wire rope Acoustic Release
Fishbite Evidence Severe at 500 m
Acoustic Release OK OK No OK OK OK Operation
Current Meters 4 2 1 4 3 5 3 lost Lost 1 Dummy Telemetering yes yes yes Tensiometer
Other Instruments 1 Wave Rec. 1 Temp. Rec. 1 Temp. Rec.
Light Status Lost Unknown None Unknown Unknown OK Radio Status None None None ox Not working Not working Hardware Wire parted
2 bands near termina broken on tion toroid
Remarks
40

~1ooring No. 380 381 382 383 3&4
Mooring Type Surface Surface Inter- Bottom Bottom Bottom mediate
Location 37N - 70W 34N - 70W 36N - 70W 40N - 40 . 5W 33N - 137E 33N - 135E L J
Water Depth, m 4160 5375 4445 4803 3578 1211 Float Depth, m 0 0 2059 4516 3395 1031 Deployment Date 4/30/71 5/4/71 5/6/71 5/9/71 6/18/71 6/19/71 Retrieval Date 5/2/71 11/4/71 8/1/71 8/8/71 10/4/71 10/3/71 Days on Station 2 '1.84 87 91 108 106 Mooring Material Wire - Nylon Wire-Nylon Dacron- Nylon
Nylon Nylon Nylon
Flotation Type 3 m disc Toroid Glass Balls Glass Balls lGlass Balls Glass Balls Retrieval Status Complete Complete Complete Complete Complete Complete Depth of Failure, n.a. n.a. n .a. n.a. n.a. n.a. m
Cause of Failure n.a. n.a. n.a .. n.a. n.a. n.a. Fishbite Evidence Minor
Acoustic Release OK OK OK OK OK OK Operation
Current Meters 3 1 & Dummy 3 1 1 1 Rotor broke
Telemetering Tensiometer
yes yes
Other Instruments 3 Tension 2 Tension 1 Depth Rec., 3 Rec. Rec. Tensacs, 1 Inclino-2 lnclino- meter meters, 2 Depth Rec.
Light Status Unknown Not working None OK OK OK Radio Status Not working Not working OK OK OK OK Hardware CM damaged
1 GB broken at launch. Rotor broken
Remarks Wire damaged Swordfish at block attack on
~M
41

Moorin" Nn
Mooring TYPe
Location
Water Depth, m
Float Depth, m
Deployment Date
Retrieval Date
Days on Station
Mooring Material
Flotation Type
Retrieval Status
Depth of Failure,m
Cause of Failure
Fishbite Evidence
Acoustic Release Operation
Current Meters
Telemetering Tensiometer
Other Instruments
Light Status
Radio Status
Hardware
Remarks
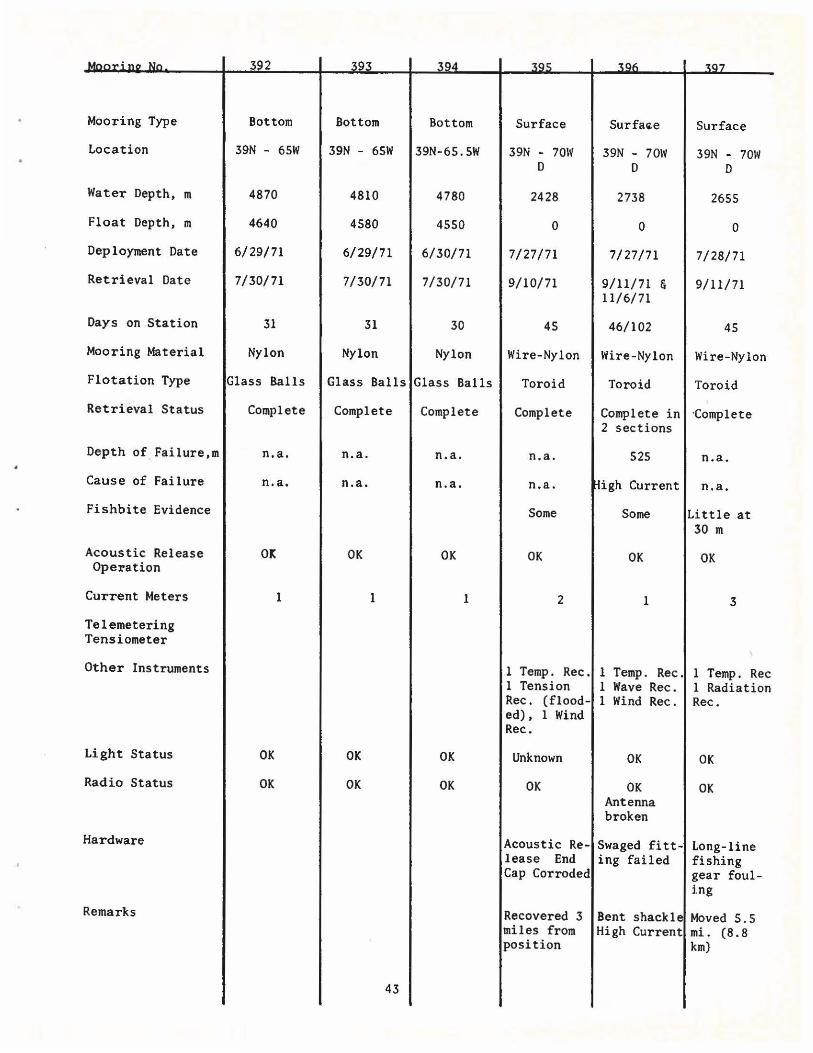
392
Bottom
39N - 65W
4870
4640
6/29/71
7/30/71
31
Nylon
393 394
Bottom Bottom
39N - 6SW 39N~6S.SW
4810
4580
6/29/71
7/30/71
31
Nylon
4780
4550
6/30/71
7/30/71
30
Nylon
Glass Balls Glass Balls Glass Balls
Complete Complete Complete
n.a. n.a. n.a.
n.a. n.a. n.a.
Ole OK OK
1 1 1
OK OK OK
OK OK OK
43
395
Surface
39N ~ 70l~ D
Surfa~e
39N - 70\~ D
Surface
39N ~ 70W D
2428 2738 2655
0 0 0
7/27/71 7/27/71 7/28/71
9/10/71 9/11/71 & 9/11/71 11/6/71
45 46/102 45
Wire-Nylon Wire-Nylon Wire-Nylon
Toroid
Complete
n.a .
n.a.
Some
OK
2
1 Temp. Rec. 1 Tension Rec. (flooded), 1 Wind Rec.
Unknown
OK
Toroid Toroid
Complete in ·Complete 2 sections
525 n.a .
~igh Current n.a.
Some
OK
1
Little at 30 m
OK
3
1 Temp. Rec. 1 Temp. Rec 1 Wave Rec. 1 Radiation 1 Wind Rec. Rec.
OK
OK Antenna broken
OK
OK
Acoustic Re- Swaged fittlease End ing failed Cap Corroded
Long-line fishing gear fouling
Recovered 3 miles from position
Bent shackle Moved 5.5 High Current mi. (8.8
km)

Mooring No. 410 411 412 413 414
Mooring Type Inter- Inter- Inter- Bottom Bottom Bottom mediate mediate mediate
Location 28.5N- 69.SW 28N - ?OW 28N - ?OW 28N - ?OW 28N - ?OW 23N - 69W MODE MODE MODE MODI;
Water Depth, m 5460 5427 5455 5460 5460 5454 Float Depth , m 1484 1456 1482 5422 5400 5325 Deployment Date 10/31/71 10/31/71 10/31/71 10/31/71 10/31/71 11/20/71 Retrieval Date 2/9/72 2/7/72 2/7/72 11/2/71 11/2/71 S/4/72 Days on Station 102 100 100 2 2 166 Mooring Material ~ire-Dacron Wire-Dacr on Wire-Dacron Nylon Nylon Nylon Flotation Type Glass Balls Glass Balls Glass Balls Glass Balls Glass Balls Glass Balls Retrieval Status Complete Complete Complete Complete Complete Complete Depth of Failure, 1r n. a . n.a.
• n.a . n .a. n.a . n.a.
Cause of Failure n.a. n.a. n.a. n . a . n.a. n . a. Fishbi te Evidence none slight none
Acoustic Release OK OK OK OK OK OK Operation
Current ~feters 2 2 2 1 Telemetering Tensiometer
Other Instruments 1 Inclino- 1 ·Depth Rec meter 1 Inclino-
meter
Light Status OK OK OK Unknown Unknown OK Radio Status OK OK
on OK None
side None OK
Hardware Corrosion Some on release corrosion on hardware acoustic re-lease - no grease
• Remarks
46

•
..
Mo.orin~ No.
Mooring Type
Location
Water Depth, m
Float Depth, m
Deployment Date
Retrieval Date
Days on Station
Mooring ~faterial
Flotation Type
Retrieval Status
Depth of Failure, m
Cause of Failure
Fishbite Evidence
Acoustic Release Operation
Current Meters
Telemetering Tensiometer
Other Instruments
Light Status
Radio Status
Hardware
Remarks
416
Bottom
23N - 69W
5392
5261
10/20/71
5/4/72
166
.:117
Bottom
.41$1
Intermediate
23N - 69W 39N - 70W 0
5378
5249
11/21/71
S/4/72
165
2660
488
12/10/71
12/20/71
10
.410
Intermediate
39N - 70W D
2654
477
12/11/71
12/20/71
9
Surface
39N - 70W D
2654
0
12/12/71
3/13/72
32
d ?1
Intermediate
36N - 70W J
4440
1289
12/13/71
3/14/72
91
Nylon Nylon Wire-Nylon Wire-Nylon Wire-Nylon Dacron-Nylo~
Glass Balls Glass Balls Glass Balls Glass Balls Toroid ~lass Balls
Complete Complete
n.a . n.a.
n.a. n.a.
OK OK
1 1
OK Unknown
OK OK
No corrosio~ CM rotor AR grease stuck OK (corrosion)
47
Complete Complete Complete Complete
n.a. n.a. n.a. n.a.
n.a. n.a. n .a. n.a.
slight
OK OK OK OK
3 3 5 2
yes
2 Temp. Rec 2 Temp. Rec. 1 Tension 1 Depth Rec Rec.
OK
OK
Extra acoustic release at top
OK
OK
Extra Acoustic Release at top
Not working
Not working
Rotor out of top CM
OK
OK

Woods Hole Oceanographic Institution Distribution List
Library 1 Marine Physical Laboratory
.- Scripps Inst. of Oceanography San Diego, CA 92152
· Library Rosensteil School of Marine
and Atmospheric Science University of Miami 10 Rickenbacker Causeway Miami, FL 33146
Library Dept. of Oceanography and
Meteorology Texas A & M University College Station, TX 77843
Library, School of Science Oregon State University Corvallis, OR 97331
1
1
1
Library 1 Arctic Research Laboratory
• Point Barrow, AK 99723
Fisheries-Oceanography Library 1 - 151 Oceanography Teaching Building
University of Washington Seattle, WA 98105
Library 1 Institute of Marine Science University of Alaska College, AK 99701
Library 1 Dept. of Geography Florida Atlantic Univ. Boca Raton, FL 33432
Pell Marine Science Librarv 1 Graduate School of Oceanography University of Rhode Island Kingston, RI 02881
Library Institute of Geophysics University of Hawaii
• Honolulu, HI 96822
1
Marine Resources Reference Center 1 • Massachusetts Institute of Technology
Cambridge, MA 02139
Chairman 1 Dept. of Earth & Planetary Sciences Massachusetts Institute of Technology Cambridge, MA 02139
Lindgren Librarv 1 Massachusetts Institute of Technology Cambridge, MA 02139
Library 1 Chesapeake Bay Institute Johns Hopkins University Baltimore, MD 21218
Chairman 1 Division of Applied Physics & Eng. Harvard University Cambridge, ~tA 02138
Hancock Library of Bio. & Ocean. Alan Hancock Laboratory University of Southern California Los Angeles, CA 90007
Pearse Memorial Library 1 Duke University Marine Laboratory Beaufort, NC 28516
Library 1 Dept. of Oceanography Florida State University Tallahassee, FL 32306
Library 1
1
Lamont-Doherty Geological Observatory Palisades, NY 10964
Library 1 Physical Oceanographic Lab. Nova University 8000 N. Ocean Drive Dania, FL 33304
Library: Docs/Repts/Trans Section 1 Scripps Inst. of Oceanography P.O. Box 109 La Jolla, CA 92037
Library Skidaway Institute of 55 West Bluff Road Savannah, GA 31406
1 Oceanography
University Library 1 Texas A & M University College Station, TX 77843
Dr. H. Burr Steinbach 1 Director of Science Harbor Branch Foundation Laboratory North Old Dixie Highway RFD 1, Box 196 Fort Pierce, FL 33450
•
MANDATORY DISTRIBUTION LIST FOR UNCLASSIFIED· TECHNICAL REPORTS, REPRINTS, & FINAL REPORTS
PUBLISHED BY OCEANOGRAPHIC CONTRACTORS OF THE OCEAN SCIENCE & TECHNOLOGY DIVISION
OF THE OFFICE OF NAVAL RESEARCH (REVISED .OCTOBER, 1972)
1
12
3
1
l
Director of Defense Research and Engineering
Office of the Secretary of Defense Washington, D. c. 20301 ATTN: Office, Assistant Director
(Research)
Defense Documentation Center Cameron Station Alexandria, Virginia 22314
Office of Naval Research Department of the Navy Arlington, Virginia 22217 ATTN: Ocean Science & Technology
Division , Code 480 ATTN: Naval Applications & Analysis
Division, Code 460 ATTN : Earth Sciences Division, Code 410
1 Office of Naval Research Branch Office 495 Summer Street Boston, Massachusetts 02210
1 LCDR David Cacchione, (USN) ONR Representative Woods Hole Oceanographic Institution Woods Hole, Massachusetts 02543
Director Naval Research Laboratory Washington, D. C. 20390
6 ATTN: Library, Code 2029 (ONRL) 6 ATTN : Library, Code 2000
1 1
1
Commander Naval Oceanographic Office Washington, D. C. 20390 ATTN : Code 1640 (Library) ATTN: Code 70
Director National Oceanographic Data
Center National Oceanic & Atmospheric
Administration Bldg. 160 Washington Navy Yard Rockville, Maryland 20852

• •
r----Woods Hole Ocunogrophtc Institution I WHOI-73-31
PERFO-CE NfAI. YSIS OF 110()1)5 HOLE T~
I MOORINGS. ly R. G. Wolden ond H. H. P1nlcker. Z9 poges 1nd 18 figures. June 1973. Controct No. 1100014-66-C0241 ; NR 013-004.
I I I I I I I I
Th lloods Hale Oceonographlc lnstltu~lon hos been using deeP-.. 1 oooored buoys for 1cqulrlng serhl observ1tl011s of ocean currents. tetnperature ond other dati for over twelve yoars. A brief description of tht deep-sea 1110oting progra01 Is given. The MOOring s totlstlcs and perfonn~nce 1re described. Mooring failures of 1970 1nd 1971 h1vt been Cltegorhed and statistics on the omdes and causes of fallur.s 1re presented. The rellabilltles of di fferent types of 1110rings are COIIPIIted and •-red. The role of radio ttl-try for th<! real-t iOit ,.1su,.....t of 1110oring Hnt t<!Osllll'l ond i ts use In checki ng the moring stotus are d i scussed. hl""les of potential design dati l i kt tension ond c urrents recorded by 0100rings thot railed lrt provided. f i nally, reco....endatlons for reseorch and developonent needed to hoprove .oaring relhbll i ty 1re given .
L r----
lloods Hole Octift09rtphic lnst l tut i OII I WHOI-73-31
PERFO-CE NfAI. YSIS OF WOODS HOLE T~
I MOORINGS. 8y R. G. Wilden and N. H. Pinl cker. 29 pages and 18 f i gures. June 1973. Contrac t No. N00014-66-C0241; NR 083-004.
I I I I
The lloods Hol t Octlnographic Institution his been using detp-su 11100red buoys for 1cqul ring .. rial observations of ocean currents , tuperoture and other data for over twelve ytlrs . A brief description of tht deep-se a moor ing program Is given. The moor i ng Uoth t ics and perfol'lllilnce 1re described. Mooring failu res of 1970 ond 1971 hove been Cltegor l zed and statistics on the modes ond Cluses of flilures ore presented. The rtlhblllties of d i fferent t ypes of moor ings are cooopute<l ind COOIPired. The rol e of radio tel e~~~ttry for the real -tiM llltasure~~~tnt of moor i ng l ine tension and Its use In Cl1Kki n9 the mooring s ta tus art dlscuued. £umples of potentlil design dato like tension and c urrents recorded by 11100rings thot foiled ore provi ded. Finally, rec-dations for reseorch and develoPNnt needed to !""rove mooring reliabil i ty are given.
L
1. MOorings
2. Buoys
3. Reliability
I. Wa l den . R. G.
II. Ponlcker, N. N,
Ill. N00014-66-C0241 ; NR 083-004
T~h cord a UNCI.ASS!FI£0
1. MOorings
2. Buoys
3. Reliabili ty
I. ll&lden , R. G.
II . P•r.icker, ~1. t!.
Ill. N00014-66-C0241: NR 083 ·00~
Thh ('.O rd h Ul.tuSil rJ £~
--, I I I I I I I I
_j
--,
4
r----Woods Hole Oceanographic Institution I IIHOI-73-31
PERFO-CE ANAlYSIS OF WOODS HOLE TAUT
I MOORING$. 8y R. G. Walden and N. N. Ponlcter. 29 pages and 18 fi gures. J une 1973 . Contract No. K00014-66-C0241 ; HR 013-004.
I I I I I I I
I
The lloods Hole Oceanogrop/llc Institution hos been using deep-sea moored buoys for acquiring serhl observati ons of ocean currents, ttOiptroture and other data for over twelve yeo rs. A brief description Of the deep-sea 0100ring progrom is given. The morlng statistics ond perfo.....,nce are described. Mooring flilures of 1970 ond 1971 hove been cotegeriZed and statistics on the 1110des ond couses of hilures are presented. The rel loblltties of diffe rent types of moorings are COIIPIIted and cooop&red. The role of rad io teltilltry for the re&l-th • • asurtllll!nt of 11100r ing l ine tension and Its use In checking the mooring status are discussed. Exomples of potenthl design dota lite tension and currents recorded by 110orings that f&iltd .,.. provided. Finally, rec01110tndotlons for research and development needed to Improve mooring relhblllty ore given .
L r----
lloods Hole Octanogrop/lic Institution
I lltOI-73-31
PERFO-CE ANALYSIS Of WOODS HOlE TAUT
I MOORINGS. Sy R. G. Wilden and N. H. Ponicker.
I 29 poges ond 18 figures . June 1973 . Contract No. N00014-66-C0241 ; NR 083-004.
I I I I I I I I I
The lloods MOle Oceanognphic Ins t i tution hu been using detp- sea .oared buoys for acqui ring srriil obse-rvat ions of oc.et~n currents, t81Ptrature and othtr dot& for over twelve years . A brief descript ion of t he dttp- seo mooring progra01 i s given. The mooring statistics and perfo1'111lnce ore desc ribed. Mooring failures of 1970 and 1g71 hove been c1tegorhed ond stotlstics on the modes and couses of failures ore presented. The relllbl HtiB of di ffertnt types of 11100rlngs ere COIIPIIted 1nd Coq>ired. The rolt of rtdlo teleMtry for the re•l·th e ~~tosu,......,t of 11100rln9 line tension 1nd I t s use tn checking the 1010rlng s tltus •re discussed. ExaMPles of potential design dati like tension ond currents recorded by morings that fail ed ore provided . i' i nally, rec..,..datlons for resurch ond development needed t o Improve mooring relhbllity ore given.
_j L
..
1. Moorings
2. Buoys
3. Rel i abi lity
I. Wal den , R. G.
II. Pantcker, N. N.
Ill. N00014-66-C0241; NR 083-004
This card is LIICLASSIFIED
1. MOorings
2. Buoys
3. Rell&bi 11 ty
I. \/olden, R. G •
II. Panicker , N. N.
Ill. N00014-66-C0241 ; NR 083-004
This card is UNCLASSIFIED
--, I I l l I I I
_j
I
I I I I I I l
_j

..
..
UNCLASSIFIED Security Clas'Sification.
DOCUMENT CONTROL DATA · R&D (Security .;;eeait/earion ol tltlo , body ot abe/tact end /ndcx/nl anrwtallon m11al bl!' entered "'*'•n the Oftte/1 trtpott ia clesai!Jed)
1 QqlGINA TIN G ACTI\fiTY (Corpor.tfo Dut.~or) 2 a. RI::PORT SEC URI TV CLASSIFICATION
Woods Hole Oceanographic Institution Woods Hole, Massachusetts 02543
3 . REPORT TITLE
UNCLASSIFIED 'lb GROUP
PERFORMANCE ANALYSIS OF WOODS HOLE TAUT MOORINGS
4 · OESCRI PTIVE N07 ES (TYfH ol report and lnelue/va det .. )
Technical Report s. AUTHOR(SJ (l.aat n~~me. lint name, initial)
R. G. Walden and N. N. Panicker
fS. RE PO RT DATE
June 1973 8a. CONTRACT OR GRANT NO.
N00014-66-C0241; NR 083-004 b. PRO.JEC T NO.
e .
d .
7a. 'FOTA L NO. 01'" PAGIEI
29
WHOI-73-31
lb. OTHIER IIIIIIJPOI'IT NO(S) (Anyothernumbera lhelmeybeaaelaned lhl• report)
rl 10. A VAIL A81L.ITY /LIMITATION NOTICES
Approved for public release, distribution unlimited.
11 . SUPPLEMENTARY NOTES \2. SPONSOAING MIL.IT~RY ACTIVITY
Office of Naval Research Ocean Science & Technology Division Arlinaton Vil"ninit~ 222'LI
13. ABSTRACT
DO
The Woods Hole Oceanographic Institution has been using deep-sea moored buoys for acquiring serial observations of ocean currents, temperature and other data for over twelve years. A brief description of the deep-sea mooring program is given. The mooring statistics and performance are described. Mooring failures of 1970 and 1971 have been categorized and statistics on the modes and causes of failures are presented. The reliabilities of different types of moorings are computed and compared. The role of radio telemetry for the real-time measurement of mooring line tension and its use in checking the mooring status are discussed. Examples of potential design data like tension and currents recorded by moorings that failed are provided. Finally, recommendations for research and development needed to improve mooring reliability are given.
1473 F ORM I J A N 6 ..
!INC! ASSIFIED Security Classification
/