Who You Train Matters - Documents & Reports - … You Train Matters: Identifying Complementary...
42
Policy Research Working Paper 6157 Who You Train Matters Identifying Complementary Effects of Financial Education on Migrant Households Yoko Doi David McKenzie Bilal Zia e World Bank Development Research Group Finance and Private Sector Development Team & East Asia and Pacific Region Financial and Private Sector Department August 2012 Impact Evaluation Series No. 65 WPS6157 Public Disclosure Authorized Public Disclosure Authorized Public Disclosure Authorized Public Disclosure Authorized Public Disclosure Authorized Public Disclosure Authorized Public Disclosure Authorized Public Disclosure Authorized
Transcript of Who You Train Matters - Documents & Reports - … You Train Matters: Identifying Complementary...

Policy Research Working Paper 6157
Who You Train Matters
Identifying Complementary Effects of FinancialEducation on Migrant Households
Yoko DoiDavid McKenzie
Bilal Zia
The World BankDevelopment Research GroupFinance and Private Sector Development Team &East Asia and Pacific RegionFinancial and Private Sector DepartmentAugust 2012
Impact Evaluation Series No. 65
WPS6157P
ublic
Dis
clos
ure
Aut
horiz
edP
ublic
Dis
clos
ure
Aut
horiz
edP
ublic
Dis
clos
ure
Aut
horiz
edP
ublic
Dis
clos
ure
Aut
horiz
edP
ublic
Dis
clos
ure
Aut
horiz
edP
ublic
Dis
clos
ure
Aut
horiz
edP
ublic
Dis
clos
ure
Aut
horiz
edP
ublic
Dis
clos
ure
Aut
horiz
ed

Produced by the Research Support Team
Abstract
The Impact Evaluation Series has been established in recognition of the importance of impact evaluation studies for World Bank operations and for development in general. The series serves as a vehicle for the dissemination of findings of those studies. Papers in this series are part of the Bank’s Policy Research Working Paper Series. The papers carry the names of the authors and should be cited accordingly. The findings, interpretations, and conclusions expressed in this paper are entirely those of the authors. They do not necessarily represent the views of the International Bank for Reconstruction and Development/World Bank and its affiliated organizations, or those of the Executive Directors of the World Bank or the governments they represent.
Policy Research Working Paper 6157
There has long been a concern among policymakers that too much of remittances are consumed and too little saved, limiting the development impact of migration. Financial literacy programs have become an increasingly popular way to try and address this issue, but to date there is no evidence that they are effective in inducing savings among remittance-receiving households, nor is it clear whether such programs are best targeted at the migrant, the remittance receiver, or both. The authors conducted a randomized experiment in Indonesia which allocated migrants and their families to a control group, a migrant-only training group, a family member-only training group, and a training group in which both the
This paper is a product of the Finance and Private Sector Development Team, Development Research Group; and Financial and Private Sector Department, East Asia and Pacific Region. It is part of a larger effort by the World Bank to provide open access to its research and make a contribution to development policy discussions around the world. Policy Research Working Papers are also posted on the Web at http://econ.worldbank.org. The authors may be contacted at [email protected], [email protected], and [email protected].
migrant and a family member were trained. Three rounds of follow-up surveys are then used to measure impacts on the financial knowledge, behaviors, and remittance and savings outcomes of the remaining household. They find that training both the migrant and the family member together has large and significant impacts on knowledge, behaviors, and savings. Training the family member alone has some positive, but smaller effects, whilst training only the migrant leads to no impacts on the remaining family members. The results show that financial education can have large effects when provided at a teachable moment, but that this impact varies greatly with who receives training

Who You Train Matters: Identifying Complementary Effects of Financial Education on Migrant Households
Yoko Doi
David McKenzie
Bilal Zia*
JEL Codes: F24, O12, C93.
Keywords: Financial literacy; Remittances; Migration.
Sector Board: FSE
* All authors are at the World Bank. McKenzie is additionally affiliated with BREAD, CEPR, CREAM and IZA. The authors thank Dean Yang and participants at the Fifth Migration and Development conference for helpful comments; Christian Salas Pauliac for excellent research assistance; and Chitra Buchori, Elisabeth Dwi Nurani, Cynthia Clarita Kusharto, and Mia Amalia for their help and dedication throughout the implementation process. The umbrella project for this paper could not have been possible without the guidance of P. S. Srinivas, Lead Financial Economist, Tunc Uyanik, Director, and Hormoz Aghdaey, Lead Financial Sector Specialist, of Financial and Private Sector Development, East Asia & the Pacific Region, as well as Stefan G. Koeberle, Country Director for the World Bank in Indonesia. We are especially grateful to the pilot program’s implementing partners, the Regional Economic Development Institute (REDI) and the migrant workers’ recruiting agencies (PPTKIS) in Malang, and support from the Government of Indonesia, especially from Pak Erlangga Mantik and Pak Bobby Hamzar Rafinus from the Office of the Coordinating Ministry for Economic Affairs; Pak Jumhur Hidayat and Ibu Lisna Y. Poeloengan from the National Board for the Placement and Protection of Indonesian Overseas Workers (BNP2TKI); and Pak Djaka Ritamtama and Teddy Priambodo from the Manpower and Transmigration Office (Disnakertrans) of Malang District. Financial assistance from the Gender Action Plan (GAP) and the Dutch Government through Trust Fund for Investment Climate and Multi-Donor Facility for Trade and Investment Climate (MDFTIC) is gratefully acknowledged.

2
1. Introduction
Officially recorded remittance flows to developing countries are estimated to have
reached $351 billion in 2011 (Mohapatra et al., 2011), more than three times the total official
development assistance going to developing countries.1 However, policymakers and much of the
migration literature have long worried that the majority of remittances are used for consumption
purposes, not savings or investment, reducing their long-term development potential (e.g.
Chandavarkar, 1980; Connell, 1980; Durand and Massey, 1992; and IADB, 2004). While there
are studies which show positive impacts of remittances on education and investment (e,g, Cox-
Edwards and Ureta, 2003; Woodruff and Zenteno, 2007; and Yang, 2008), recent work by
Ashraf et al. (2011) has shown remittance receivers are likely to save less than their remittance
senders desire, while insights from behavioral economics suggest that many people in general
may save less than rational financial planning would predict (Benton et al., 2007).
One of the main policy responses to try and increase savings from remittances and
improve financial management among remittance receivers has been the introduction of financial
literacy programs for migrants and/or their families. For example, the Government of the
Philippines launched a financial literacy campaign based on the concern that migrant families
enjoy substantial consumption gains while their family members are abroad, but then have
nothing left when the migrants return.2 New Zealand’s aid agency is funding financial education
for seasonal workers from the Pacific Islands in New Zealand 3 , and the Inter-American
Development Bank has conducted financial education programs for remittance receivers in
Guatemala and Nicaragua. 4 The global financial education program of Microfinance
Opportunities/Freedom from Hunger/Citi Foundation now has a specialized curriculum directed
at remittance receivers, aimed at helping them better use the money they receive.5
However, while there is a strong association between financial literacy and levels of
savings in both developed (Lusardi, 2008) and developing countries (Cole et al., 2011), the
limited evidence on the causal impacts of general financial literacy programs in developing
1 Total Official Development Assistance to developing nations is estimated at $90 billion for 2010
http://stats.oecd.org/Index.aspx?DatasetCode=ODA_RECIP [accessed 20 April, 2012]. 2 http://jedayang.com/2011/08/24/financial-literacy-campaign-and-the-philippine-government/ [accessed 20 April,
2012] 3 http://www.aid.govt.nz/media-and-publications/development-stories/february-2012/vakameasina-training-
extended-rse-employees [accessed 20 April, 2012] 4 http://www.thedialogue.org/projects#Transnational_Families [accessed 20 April, 2012]. 5 http://www.globalfinancialeducation.org/future.html#remittance [accessed 20 April, 2012]. Our modules, though
closely related to the MFO content, is not entirely a derivative since the MFO module on remittances was not yet available at the time of our study.

3
countries has shown relatively limited effects. For example, Cole et al. (2011) find that a
financial literacy program for households in Indonesia has little impact on their propensity to
open savings accounts. However, one important recommendation from financial literacy experts
is that financial education should be delivered at “teachable moments”, when the information is
most applicable to a person’s life (GAO, 2004). One of the few research studies to examine such
a case is Bertrand and Morse (2011), who found that offering information and making interest
rate costs more understandable right at the moment U.S. borrowers are deciding on payday loans
can have large effects. Offering financial literacy training to migrants and/or their family
members right before the migrant member leaves potentially offers another such moment, since
this is precisely the time when migrants and family members have to decide the method of
remitting, amounts and frequency of remittances, and how to manage the new and relatively
large inflows of income.
This paper provides the first experimental evidence on whether financial literacy
programs work to improve financial knowledge and financial management, and thereby increase
savings in migrant-sending households. Our context is a pilot program on financial literacy for
overseas migrant workers and their families developed as a partnership between the Government
of Indonesia and the World Bank and implemented in Greater Malang area and Blitar District of
East Java Province. The training program emphasized financial planning and management,
savings, debt management, sending and receiving remittances, and understanding migrant
insurance. One key policy question is whether such information is best delivered to the migrant
worker his or her self, to someone in their remaining household, or to both. Our experiment
directly tests this by means of three treatment groups: a group in which only the migrant worker
receives training, a group in which the main remittance receiver or decision-maker in the
remaining household receives training, and a group in which both receive training.
We conduct three rounds of follow-up surveys and find that training the family member,
and training both the family member and the migrant result in increases in financial knowledge,
with evidence this impact is greater when both the migrant and their family member are trained.
Training results in no increase in the amount or frequency of remittances, but when offered to
both the migrant and the family, leads to more financial planning and budgeting, and to more
saving. The effect sizes are reasonably large: we find households in which both the migrant and
their family member were trained are 19 percentage points more likely to be aware of financial
terms, 12.5 percentage points more likely to have saved in a bank account, and have twice the
savings out of remittances as the control group. There are smaller and less significant impacts on

4
savings when only the family member is trained, and small and insignificant impacts on the
knowledge, behaviors, and outcomes of family members when only their migrant worker is
trained.
This paper relates to two main literatures. First, there is a nascent literature that has
examined the impacts of financial education in developing countries. Examples include Cole et
al. (2011) who look at savings account take-up in Indonesia, Hastings and Tejeda-Ashton (2008)
who examine selection of retirement funds in a hypothetical scenario, and Gine et al. (2011) and
Cai (2012) who both examine the decision of farmers to purchase weather insurance, and the
interaction of financial education with social networks. Two parallel and complementary studies
also look at financial literacy and remittances. Gibson et al (2012) study the impact of teaching
migrants in New Zealand and Australia about the different methods available for remitting and
the costs of each, finding an increase in financial knowledge and information seeking behavior,
reduced risk of switching to costlier remittance products, but no change in either the frequency or
level of remittances. Seshan and Yang (2012) provide a savings-oriented financial literacy
workshop to Indian male migrant workers in Qatar. They find some changes in financial
practices in their full sample, but no significant impacts on savings levels or remittances.
However, when they split their sample by baseline savings levels, training raises the migrant’s
savings levels in the low baseline savings group. Our work complements and builds on these
studies, by focusing on outcomes for household members left behind in the developing country,
implementing multiple surveys for more statistical power, and by examining how the impacts of
the course vary with who is trained.
Secondly, our paper contributes to a new experimental literature on policies to enhance
the development impact of migration, which are summarized in McKenzie (2012). Recently
Ashraf et al. (2011) and Chin (2011) have both found increases in savings among migrants in
response to direct efforts to provide greater access to savings accounts, which complements our
finding that families are saving less than may be optimum for them. Our paper shows that
offering financial education to migrants and their families offers another way to get more savings
out of the same levels of remittances.
The remainder of the paper is structured as follows: Section 2 provides the Indonesian
context, the sample used in our experiment, the content of the financial literacy training program,
and the experimental design. Section 3 provides our results on the impacts of the financial
literacy program on the knowledge, financial behaviors, and remittance and savings outcomes for
migrant families. Finally, Section 4 concludes.

5
2. Background, Sample, and the Financial Literacy Intervention
2.1. Background and Context
Formal, government-administered placement of labor migrants from Indonesia began in
1969 and in the 1970s a regulated private sector for migration recruitment and placement was
authorized and developed. Hugo (2009) estimates that Indonesia is the second largest source
country for labor migration in Asia after the Philippines, with an estimated 2.7 million
Indonesians working abroad with official permission, and many more irregular migrants. The
majority (78% in 2007) of migrant workers from Indonesia are female, primarily working as
domestic workers, nannies and aged care workers in Hong Kong SAR, China; Malaysia;
Singapore; and the Middle East (Hugo, 2007; IOM, 2010). Official remittances received from
migrants have grown from US$5.4 billion in 2005 to US$7.3 billion in 2010.
Indonesian overseas migrant workers, known locally as Tenaga Kerja Indonesia (TKIs),
apply for jobs with privately owned recruitment agencies, which are registered and licensed by
the government, and locally known as PPTKIS.6 These agencies not only recruit migrants for
jobs abroad, but are responsible for preparing workers for these jobs abroad, and arranging their
travel. It is mandatory under the Migrant Worker Placement and Protection Law for all such
workers to undertake job and language training (Ignacio and Mejia, 2009). Typically individuals
recruited to work abroad come and attend training sessions of several months with the
recruitment agency where they learn occupation-specific skills for working abroad (e.g. domestic
workers learn about the use of modern household appliances and overseas standards for room
cleaning), as well as receive a general pre-departure briefing covering issues such as safety and
cultural differences abroad. The recruitment agencies are also responsible for enrolling the
workers in a mandatory insurance program (which migrants pay Rp 400,000 for as part of their
placement fee), which covers migrants in the event of accidents, illness, unpaid wages or
premature contract termination by the employer, or death while abroad.
The migrants and their families typically come from rural areas and have relatively low
levels of education, and limited use and knowledge of formal financial services. A diagnostic
study found respondents reporting that very little of the money received as remittances is saved
or invested (World Bank, 2010a, 2010b). To address such knowledge constraints, the World
6 PPTKIS = Perusahaan Penempatan Tenaga Kerja Indonesia Swasta (Privately-owned Indonesian Manpower
Placement Company).

6
Bank, in partnership with the Government of Indonesia, initiated the “Pilot Program on Financial
Literacy Education for Migrant workers and their Families” with the aim of identifying effective
ways of improving the financial literacy of migrant worker households.
2.2 The Study Sample and Randomization Details
The first step in designing this pilot was a diagnostic study (World Bank, 2010a) which
gathered information on where there was a high concentration of migrant worker households and
PPTKIS. Based on this assessment, East Java province was identified as an area with high
numbers of both migrants and PPTKIS, and within East Java, the Greater Malang and
neighboring Blitar districts as an area where there were sufficient PPTKIS to partner with. We
then collaborated with Malang’s Manpower and Transmigration Office and 11 PPTKIS based in
Greater Malang to obtain a sample of migrant workers and their families for this pilot.
Recruitment was on a rolling basis, with the project team periodically contacting the 11
PPTKISs to obtain lists of workers originating in the Greater Malang and Blitar districts who
were recruited by these companies to work abroad. We set a target sample size of 400
households, and continued to collect workers in batches from these recruiting agencies until this
target had been met.
Almost all (96%) of the migrants are female, with median age of 29. They are typically
the daughter (41%), spouse (30%), or sibling (10%) of the household head. Education levels
vary, with 26 percent having completed at most primary schooling, 45 percent secondary
schooling, 28 percent senior high school, and only 1 percent a higher degree. The main
occupation for migrant work abroad is as a housemaid (80%), with Hong Kong SAR, China,
Taiwan, and Malaysia the main destination countries.
As batches of worker names were received from the PPTKIS, they were entered by
project staff onto an Excel worksheet in the order listed by the PPTKIS, and a random number
generator used to assign individuals to treatment status. Since batches of workers were often not
of size divisible by four, and were of varying numbers, and that the only information available on
the workers was basic data supplied by the PPTKIS, we did not stratify the randomization. The
sample of 400 migrant workers was randomly assigned into one of the following groups:
• Treatment A: Financial literacy training is provided to the migrant worker only
• Treatment B: Financial literacy training is provided to the migrant worker’s
household member only
7
• Treatment C: Financial literacy training is provided to both the migrant worker and
household member
• Group D: Control group with no financial literacy training provided
Out of the sample of 400 migrant workers, this random assignment resulted in 101
migrant households being assigned to treatment A, 97 to treatment B, 98 to treatment C, and 104
to control.
The motivation for these different assignments was that it was ex ante unclear who
should be the focus of the training. Pre-departure training in a number of countries often focuses
just on the migrants. Training migrants is convenient because they are already gathered in one
place for job training, and offers the possibility of allowing them to better budget and save
abroad, and hence send more remittances back. However, it may have limited impacts on the
ability of remaining household members to manage the money they are receiving. In contrast,
training remaining household members offers the possibility of teaching those receiving
remittances how to better manage money, but requires more effort in getting family members to
come to a training location and may have limited impact if the migrant controls how any money
sent back is used. The question then arises whether there are complementarities from training
both the migrant and her family member together. Our randomization allows us to test between
these competing ideas for whom to train.
2.3 Baseline Survey
The baseline surveys were conducted on a rolling basis from February to June 2010 to
coincide with the training cycle. The baseline survey was directed at the family member of the
migrant who would be responsible for receiving remittances and for household decision-making
in their absence. In cases where the family member attended training, interviews were done at
the training location prior to the commencement of training. For the control group, migrant-
training only group, and cases in the other treatments where the family member was invited but
did not show up for training, interviews were done at the dwelling of the household.
In cases where the primary remittance receiver was too old, sick, unable to leave his or
her job, or otherwise reluctant to travel, in some cases another household member came to attend
the training session – who was then the baseline respondent. The result is that there are some
differences in baseline individual characteristics of the respondents by treatment status, with the
respondents from the family training treatment groups being slightly younger and more likely to
be male than in the migrant-only or the control group. Nevertheless, reported household level

8
outcomes are similar across the different treatment groups (see Appendix Table A1). The follow-
up surveys (described below) put in place strict protocols to ensure consistency in which
household member was interviewed, ensuring the main remittance receiver responsible for
household financial decision-making in the migrant’s absence was interviewed. Table 1 shows
the balance across treatment groups in the individual characteristics of the respondents at the
time of the follow-ups.
Household respondents in the study are on average 41 years old at baseline, with 33
percent female, and 85 percent married. They are typically the spouse, parent, or sibling of the
migrant. Education levels are lower than the migrant’s levels on average: 14% have not
completed primary school, 36% have only completed primary schooling, 28% secondary
schooling, 19% senior high school, and 3 percent have a higher degree. Average household
income is approximately US$150 per month.
Only half of all households report having any savings at baseline, and only 3 percent
record income and expenditure. Despite 92 percent of respondents saying they discuss financial
issues with family, only 40 percent had heard of the term financial budgeting, only 39 percent
knew what an exchange rate was, and only 29 percent had heard of the TKI insurance that all
legally registered migrant workers must have. These baseline levels suggest potential scope for
financial literacy training to build knowledge and develop savings behaviors.
2.4 The Financial Literacy Intervention
Training was generally conducted at the Singosari Training Center in Malang, which is a
complex managed by the Malang’s Manpower & Transmigration Office. Aside from classrooms,
workshops, meeting halls and dining halls, it also rents out rooms. Training sessions were also
conducted directly at the offices of the PPTKIS when an individual PPTKIS had sufficient
workers about to embark. These locations were very convenient for the migrant workers, since
they typically live in facilities run by the PPTKIS for two to six months prior to departure, and
the PPTKIS arranged transportation from their locations to the Training Center. Family members
typically lived further away. The Regional Economic Development Institute (REDI) coordinated
with the PPTKIS to invite family members to this training, and family members were provided
with a transportation allowance and one night’s accommodation in order to facilitate their access
to these training sessions.
Financial literacy training sessions for migrants and for their family members were
conducted separately. The training sessions for the migrant workers lasted two full days of 9

9
hours per day (see Appendix 1), while the training session for families lasted two half-days of 4
hours each day. The training for migrant workers covered six core modules: financial
management, which included making a financial plan, budgeting, and the importance of
discussing and agreeing with family the use of money prior to departure; understanding banking
services, including how to use bank accounts, ATMs and other products; savings, including both
the importance of savings and different savings options; debt management, including sources of
loan options and calculating interest rates; sending remittances, including formal ways to remit,
and understanding exchange rates; and understanding insurance, with particular emphasis on the
TKI insurance. The training for family members covered five modules in a compressed version
of the migrant’s course: financial planning and management, savings, debt management, sending
and receiving remittances, and understanding insurance. Appendix 1 provides more details of the
content.
The training methodology was designed to be participative, interactive, and applied.
Participants were regularly encouraged to interact through discussion modules, group games and
assignments, and sessions designed to share experiences and exchange of thoughts. The
emphasis was on practical application to the daily lives of migrants and their families, and
specific examples of how to fill in a bank form, how to prepare a financial plan and budget, and
how to use an ATM machine were covered. In addition to the course, participants received comic
books and folding brochures to reinforce content in a fun way (Appendix Figure 1 gives one
example of part of the comic book, warning that once you have money it is important to
distinguish between needs and wants). Finally, each participant received a take-home financial
book with sample budgeting templates.
2.5 Take-up
Attendance rates for the financial literacy training were high, which is likely due to the
training invitations coming to the migrants from the PPTKIS and to the assistance with
transportation. In the migrant-only training, 81.2 percent of those invited attended. In the family-
member-only training, 76.5 percent of those households who were invited had a family member
attend. In the migrant and family joint training, 65.0 percent of invited households had both the
migrant and family member attend, a further 9.3 percent had just the migrant attend, and 16.5
percent had just the family member attend, so that in 91 percent of cases the household had
someone attend.

10
We examine the correlates of attendance of the migrant and of the family member and
find few predictors of who takes up the training. Migrant attendance is unrelated to baseline
household income, or to the education, baseline knowledge of financial terms, or baseline
numeracy of the survey respondent. Attendance by a family member is also unrelated to baseline
financial knowledge, education, or numeracy, but is higher among households with higher
baseline income – perhaps reflecting the impact of travel costs on poorer households attending.
2.6 Follow-up Surveys and Attrition
Three rounds of follow-up surveys were conducted via in-person interviews. The first
follow-up survey took place in March 2011 and interviewed 392 of the 400 households (98%).
At this time, 83 percent of households reported the migrant to be abroad, and 9 percent to have
had the migrant return, with the mean and median time abroad being 9 months. A second follow-
up survey took place in September 2011, and successfully re-interviewed 376 of the 400
households (94%), at which time 79 percent of households still reported having a migrant
abroad, with median time abroad of 15 months. The third and final follow-up survey took place
in January 2012 and interviewed 365 households (91%), at which time 77 percent of households
still had a migrant abroad, with median time abroad of 19 months.
The follow-up surveys were aimed at the family member in charge of receiving
remittances and making financial decisions in the household, and effort was made to re-interview
the same member each follow-up round. In the few cases where this was not possible, we control
for a change in the identity of the respondent in the regressions. The surveys collected
information on financial knowledge, behaviors, and outcomes of the household. An important
caveat is that we do not re-interview the migrant workers, since the feasibility and cost of
interviewing them while abroad did not make this possible. Our focus is thus on outcomes for the
remaining household members.
Table 2 tests whether attrition rates at baseline and at each follow-up survey vary by
treatment status. We regress a dummy variable for being present in the survey round on
treatment assignment, and report both the coefficients, as well as p-values for test of equality
across the different treatments. The last column looks at being present in any of the follow-up
rounds. The regression coefficients are small, and we cannot reject the null hypothesis of
equality of attrition rates across treatments for any of the survey rounds. Given the low level of
attrition and that it is unrelated to treatment status, we therefore ignore attrition in our analysis.

11
A key issue in analyzing any intervention using survey data is the extent to which the
treatment changes self-reporting of outcomes holding actual outcomes constant. For example, if
respondents try and give socially-desirable outcomes, they may say they have saved after the
training, even if they have not, because the training emphasized savings as a desirable activity.
We use two main approaches to help mitigate this problem and ensure that any effects measured
are likely to be genuine. First, since much of our analysis involves a comparison across
treatments, this form of potential bias is likely to be lower since we can effectively difference out
the common effect of treatment on self-reporting. Second, we trace out the causal chain from
knowledge, to behaviors and then outcomes and look for consistency in impact throughout this
chain.
3. Analysis
To analyze the impact of financial literacy training on different outcomes of interest, we
estimate the following regression equation:
𝑂𝑢𝑡𝑐𝑜𝑚𝑒𝑖,𝑡 = 𝑎 + 𝑏 ∗ 𝑇𝐴𝑖 + 𝑐 ∗ 𝑇𝐵𝑖 + 𝑑 ∗ 𝑇𝐶𝑖 + 𝑒 ∗ 𝑂𝑢𝑡𝑐𝑜𝑚𝑒𝑖,0 + 𝑓 ∗ 𝑅𝑜𝑢𝑛𝑑𝑡 + 𝜀𝑖,𝑠 (1)
Where TAi, TBi and TCi are dummy variables indicating assignment to treatment A (Migrant
Only), B (Family Only), and C (Migrant and Family), respectively. To increase power we pool
together the three follow-up rounds (McKenzie, 2011).7 Survey Round indicators are included in
the regressions. Robust (White-corrected) standard errors, clustered at the individual level, are
reported in parentheses under the coefficients in the tables. Since the regressions are based on
original assignment to treatment, all coefficients are estimating intention to treat (ITT) effects.
The ITT estimate is the relevant measure to focus on for overall policy impacts.8
The pooled sample takes into account all available data and we analyze an unbalanced
panel with 394 clusters.9 Since our surveys contain a number of questions related to financial
knowledge, behaviors, and outcomes, we follow Kling et al. (2007) in creating aggregate
indicators for different families of outcomes. For binary variables, this aggregate outcome is
simply the average of the individual questions, while for continuous outcomes it is the average z-
score (obtained by subtracting the mean of each variable and dividing it by its standard
deviation). Appendix Tables A2-A4 present impacts on the individual questions which make up
these aggregates. 7 Appendix Tables A5 and A6 show round-by-round results. 8 The take-up of treatment was fairly high, as analyzed in the previous section, and our results are robust when estimating Treatment on Treated (TOT) effects. 9 We have re-run our entire analysis using a balanced panel across all waves and the results are robust.

12
3.1 Impact on Financial Knowledge
We start the analysis by presenting treatment effects on financial knowledge. Following
the methodology in Carpena et al. (2011), we categorize financial knowledge into three distinct
components: financial awareness, applied financial knowledge, and financial numeracy skills.
Financial awareness refers to understanding of basic financial concepts such as an interest
rate, exchange rate, transaction fees, savings accounts, budgeting, and insurance. It is measured
by asking respondents whether they have heard of each of 12 different financial terms (listed in
Appendix Table A2), with the control group on average knowing 39.7 percent of these terms.
Applied financial knowledge is assessed through five questions where respondents are
asked to offer financial advice under hypothetical situations. For instance, respondents are asked
whether it is possible for someone with only Rp 10,000 to open a bank account; to distinguish
whether borrowing money to finance a TV purchase is an income-producing use of a loan or not;
and to suggest an appropriate financial product for someone who is worried about meeting
expenses if they get sick. The control group on average knew 31.8 percent of the correct
responses.
Finally, financial numeracy skills are measured through three questions that require
mathematical calculations or comparing percentages with lump sum values. These questions are
similar to those introduced by Lusardi and Mitchel (2006) for respondents in developed
countries, and have been extensively adapted and used in the developing country literature as
well.10 On average the control group only got 15 percent of these questions right.
Table 3 shows the impacts on these aggregate measures, and appendix tables A2-A4
show the impacts on the individual components of these aggregates. Column 1 shows that
assigning both the migrant and the family to training leads to a significant 19.2 percentage point
increase in awareness of basic financial concepts, assigning just the family member to training
leads to a significant 12.3 percentage point increase in financial awareness, while assigning only
the migrant worker to financial literacy training does not have any significant impact on financial
awareness of the main remittance receiver who remains in the home country. The foot of Table 3
tests for a difference in effect between treatments – we can reject that the migrant-only training
has the same effect as either of the treatments which train the family member, while the
difference between family-only and migrant-plus-family training has a p-value of 0.075.
10 See for example, Cole, et. al (2011), and Klapper and Lusardi (2011).

13
Columns 2 and 3 show the impacts on applied financial knowledge and on financial
numeracy skills. Training only the migrant has a small and insignificant effect on both outcomes;
the effect sizes are a larger for the family only treatment, but remain statistically insignificant.
However, the migrant-plus-family treatments has a significant impact on applied financial
knowledge, although the point estimates of 5 percentage points is smaller than the impact on
financial awareness. The impacts on financial numeracy skills are similar in magnitudes, but
insignificant for all three treatment groups.
Overall, these results are consistent with the findings in Carpena, et. al. (2011), who
likewise find that financial literacy training is a strong tool in making individuals more
financially aware, and has some impact on improving their applied financial knowledge, but is
relatively ineffective in making them better at numeracy and tasks involving computational
skills.
3.2 Impact on Knowledge of Insurance and Remittance Costs
Next we focus specifically on migration-specific financial knowledge related to
remittance transactions and the migrant insurance. Here we start in Table 4 by looking at impacts
on individual outcomes in columns 1 through 6, and then at an aggregate outcome measure in
column 7. Column 1 shows a very strong treatment effect on household awareness about the
mandatory migrant insurance. Fewer than 10 percent of respondents in the control group were
aware of this insurance. This awareness increased by 25.6 percentage points in households where
both migrants and family members were treated, a fairly substantial impact. These effects are
smaller, but also positive and significant for training the migrant only (a 5.7 percentage point
increase) or the family member only (a 13.5 percentage point increase).
The remaining columns of Table 4 examine whether households understand the various
components that make up the cost of a remittance transfer. Column 2 looks at whether
households know it is cheaper to send one large transaction (of Rp 2 million) than to send two
smaller transactions (each of Rp 1 million) adding up to the same total. This is cheaper because
of the fixed fee component of a remittance transfer. Knowledge of this is high, with 81 percent of
the control group getting the correct answer, and the training has no additional impact. Columns
3 through 6 look at whether households know whether a remittance transfer involves a fixed fee
on the sender, a fixed fee for the recipient, an exchange rate commission, and/or an interest rate.
Column 7 combines these to look at whether they correctly identify all the relevant costs. We see
that households assigned to the migrant-plus-family treatment have significantly higher

14
knowledge on these cost components, and overall are 7.9 percentage points more likely to
correctly identify the costs of a remittance transaction. The effect size is about half (4.6
percentage points) for the family-only training, and insignificant for the migrant-only training.
Despite these differences in magnitude, we cannot reject equality of impacts across the various
treatments.
3.3 Impact on Real Outcomes: Remittances
There are two main channels through which financial literacy training might be expected
to impact on real outcomes for remaining household members: it may affect how much money
they receive in remittances, and it may affect how households use the money that they do
receive.
We start first with remittance behavior. Higher financial literacy may change the extent to
which remittance transfers take place through the formal financial system. However, in the case
of our Indonesian sample, almost all remittances occur through formal channels, and thus
column 1 of Table 5 shows no impact on greater formality given this starting point. This is
consistent with separate survey evidence from the Bank of Indonesia which has found most
remittance transactions tend to occur through formal channels.
Financial literacy training may also change the frequency and amount remitted. Migrants
may send more remittances if financial literacy training enables them to manage their money
abroad better and have more savings, or if they feel that financial literacy training has improved
their receiving household’s financial management. A better understanding of the costs of
remitting may reduce the frequency of remitting if migrants bundle transactions into fewer,
larger, transfers in order to reduce transaction fees, or may increase the frequency of remitting if
financially informed migrants are able to seek out cheaper methods for sending small
transactions (Gibson et al, 2006; Aycinena et al, 2011).
Table 5 shows that financial literacy training had no significant impacts on the likelihood
or frequency of remitting, or on the amount of remittances received. Moreover, the point
estimates on the amount received are negative, suggesting that, if anything, households which
took part in training received fewer remittances. These results are consistent with those of
Gibson et al. (2012), who survey migrants and also find no impact of financial training on the
amount of remittances sent. However, it might still be the case that the existing levels of
remittances are used differently by recipient households. We now turn to these compositional

15
measures and first examine impacts on budgeting and financial planning at the household level,
followed by impacts on savings and loan behavior.
3.4 Impact on Real Outcomes: Budgeting and Financial Planning
One of the key components of the financial literacy training for both migrants and
households was the importance of maintaining financial records, budgeting, and setting financial
goals. In Table 6, we examine impacts on these outcomes and find that the migrant-plus-family
training results in a 9 percentage point significant increase in the likelihood of preparing cash
records, positive but non-significant impacts on the likelihood of having financial goals, and a
significant impact on the aggregate measure of budgeting and financial planning. Effect sizes are
about half as large when only the family is assigned to training, and we can reject at the 10
percent levels equality of the two treatments for the aggregate measure. Training only the
migrant has no impact on any of the outcomes, and we can reject equality with the migrant-plus-
family effect for the aggregate measure at the 5 percent level.
3.5 Impact on Real Outcomes: Savings and Loans
Finally, we examine impacts on savings and loan behavior in Table 7. In contrast to much
of the existing financial literacy literature (e.g. Cole et al, 2011), which typically finds impacts of
financial literacy training on knowledge, but not on ultimate outcomes, we find strong and
statistically significant impacts of financial literacy training given to both the migrant and her
family on savings behaviors and outcomes. Column 1 shows households in this treatment group
were 10.2 percentage points more likely to have savings in a bank account, almost doubling the
control group mean. These households are 10 percentage points more likely to have saved in the
past six months (column 2), and 11.5 percentage points more likely to say they will save in the
next two months (column 3). They are more likely to save the remittances they receive (columns
6 and 7), almost doubling the amount saved compared to the control group. As a result total log
savings are significantly higher, and aggregating the savings indicators together in column 8, we
see a strong and statistically significant effect on the family of savings outcomes. Consistent with
this higher savings, in column 9 we find that this treatment group is 8.9 percentage points less
likely to have taken out a loan in the past six months.
The effect on overall savings outcomes of training both the migrant and their family
member is significantly different from training either the migrant or the family member alone.
Indeed, the impacts on all savings measures are insignificant and smaller in magnitude for the

16
family-only training than the effects of the migrant-plus-family training. The impact of training
the migrant alone on each savings outcome is likewise always statistically insignificant.
4. Discussion and Conclusions
We have found that training both the migrant worker and their family member entrusted
with receiving remittances and making household decisions on finances resulted in increased
financial awareness and applied financial knowledge for these remaining household members.
Training does not change either the frequency or amount of remittances received, but does
change how households use this money. They are more likely to keep financial records, and as a
result of these knowledge and behavior changes, accumulate more savings and rely less on loans.
Training only the remaining family member has significantly smaller effects on knowledge, and
result in less impact on savings, while training only the migrant does not have any significant
impacts on the financial knowledge or savings outcomes of remaining family members.
The impacts we find are much stronger than has been found in two other recent
randomized evaluations of financial literacy training related to savings or remittances in
developing countries. Cole et al. (2011) found no significant average impact of financial literacy
training on the likelihood of households opening a bank account in Indonesia, while Gibson et al.
(2012) find that financial literacy training for migrants in the destination country lead to changes
in financial knowledge, but no change in remitting behaviors. Seshan and Yang (2012) obtains
results someway between those studies and ours, with no significant effects on savings and
remittances in the full sample, but some impacts in a sub-sample of individuals with low baseline
savings. Our results therefore raise the question of why effects are stronger in our context, and
why they vary by treatment status.
A first potential explanation is differences in the intensity of the training. The training
sessions in both Cole et al. (2011) and Gibson et al. (2012) were both approximately 2 hours in
duration, while Seshan and Yang (2012) had 5 hours, compared to 18 hours for our migrant
training and 8 hours for the family member training. Certainly more hours offers more time for
learning to take place, but the fact that our migrant training session was more than twice as long
as the family member only training, yet resulted in no discernible changes for the family left
behind suggests the intensity of the training cannot be the only explanation.
A second potential explanation lies in the timing of the training sessions. Our training
sessions were timed at a moment where households were about to experience a large increase in
the amount of financing coming into the household, and thus occurred at a “teachable moment”,
17
where households potentially had both the interest to learn about money management and the
opportunity soon after to put what was learned into practice. In contrast, Gibson et al. (2012)
worked with a sample of migrants already at destination, who may have already had time to
establish routines and remitting behaviors11, while Cole et al. (2011) worked with a general
population who may have found it harder to put savings behaviors into practice given limited
incomes and no change in the finances they had available. Given that international migration
offers the possibility for households to dramatically increase their incomes, timing financial
literacy training to occur right before this migration occurs and remittance flows start coming
likely represents such a moment.
Finally, our results suggest that there may be important complementarities occurring,
since effects are strongest when both the migrant and their family member are trained. Since
Indonesian migrants are going abroad on temporary contracts, the savings decisions of household
members left behind affect both the remaining household members and the migrant. It may be
that both the desire to change savings behaviors and the ability to put this new knowledge into
effect is much greater when both the remittance sender and the receiver have this training. One
contextual issue to note is that our migrants are almost all female, and it may be that due to
gender roles they are less able to use their training to change the behavior of remaining
household members than is the case when the migrants are male and the remaining household
member is their wife, as is the case for Seshan and Yang (2012).
An important caveat to our results is that we only measure outcomes for the remaining
household, not for the migrant herself. Nevertheless, the lack of a change in either the frequency
of remitting or amount of remittances received means that any gains realized by the migrant are
not resulting in higher incomes for their sending family over a two year period. Since much of
the existing policy focus in this area has been on providing financial education for migrants-
either in pre-departure seminars or whilst they are abroad – our results suggest that policymakers
aiming to enhance the developmental impact of remittances in sending countries should also
focus on reaching the families of migrants with financial literacy training.
11 Although Seshan and Yang (2012)’s results do suggest it may be possible to change the routines of a subset of migrants who have been abroad for some time.

18
References
Ashraf, Nava, Diego Aycinena, Claudia Martinez and Dean Yang. 2011 “Remittances and the Problem of Control: A Field Experiment Among Migrants from El Salvador”, Mimeo. University of Michigan.
Aycinena, Diego, Claudia Martinez and Dean Yang. 2011 “The impact of remittance fees on remittance flows: Evidence from a field experiment among Salvadorean migrants”, Mimeo. University of Michigan.
Benton, Marques, Stephen Meier, Charles Sprenger 2007. “Overborrowing and undersaving: lessons and policy implications from behavioral research”, Federal Reserve Bank of Boston Paper 07-04.
Bertrand, Marianne and Adair Morse 2011. “Information disclosure, cognitive biases, and payday borrowing”, Journal of Finance, 66(6): 1865-93.
Cai, Jing 2012 “Social networks, and the decision to insure: Evidence from randomized experiments in China”, Mimeo. UC Berkeley.
Carpena, Fenella, Shawn Cole, Jeremy Shapiro and Bilal Zia. 2011. “Unpacking the causal chain of financial literacy”, World Bank Policy Research Working Paper no. 5798.
Chandavarkar, AG 1980 “Use of migrants’ remittances in labor-exporting countries”, Finance and Development 17(2): 36-9.
Chin, Aimee, Leonie Karkoviata, and Nathaniel Wilcox, “Impact of Bank Accounts on Migrant Savings and Remittances: Evidence from a Field Experiment,” mimeo, University of Houston, 2010.
Clemens, Michael A., Claudio E. Montenegro, and Lant Pritchett. 2009. “The Place Premium: Wage Differences for Identical Workers Across the U.S. Border.” Center for Global Development Working Paper 148.
Connell, John 1980. “Remittances and rural development: migration, dependency and inequality in the South Pacific.”, Occasional Paper no. 22, Australian National University Development Studies Centre.
Cole, Shawn, Thomas Sampson and Bilal Zia 2011. “Prices or Knowledge: Prices or Knowledge? What Drives Demand for Financial Services in Emerging Markets?”, Journal of Finance 66(6): 1933-67.
Cox Edwards, Alejandra and Manuelita Ureta 2003. “International migration, remittances and schooling: evidence from El Salvador”, Journal of Development Economics, 72, 2: 429-61.
Durand, Jorge and Douglas Massey 1992. “Mexican migration to the United States: A critical review”, Latin American Research Review 27: 3-42.
Gibson, John, David J. McKenzie, and Halahingano Rohorua 2006. “How cost elastic are remittances? Evidence from Tongan migrants in New Zealand” Pacific Economic Bulletin 21(1): 112-28.
Gibson, John, David McKenzie, and Bilal Zia. 2012. “The Impact of Financial Literacy Training for Migrants.”
Gine, Xavier, Dean Karlan and Muthoni Ngatia 2011. “Social networks, financial literacy, and index insurance”, Mimeo. World Bank.
Government Accountability Office 2004 “The Federal Government’s role in improving financial literacy: highlights of a GAO Forum”, http://www.gao.gov/new.items/d0593sp.pdf [accessed April 20, 2012].

19
Hastings, Justine and Lydia Tejeda-Ashton 2008. Financial literacy, information, and demand elasticity: Survey and experimental evidence from Mexico. NBER working paper no. 14538.
Hugo, Graeme 2007. “Indonesia’s Labor looks abroad”, Migration Information Source Country Profile http://www.migrationinformation.org/Profiles/display.cfm?ID=594 [accessed 9 May, 2012].
Hugo, Graeme 2009. “Labour Migration for Development: Best Practices in Asia and the Pacific”, ILO Asian Regional Programme on Governance of Labour Migration Working Paper no. 17.
Ignacio, Emilyzen and Yesenia Mejia 2009. “Managing labour migration: The case of the Filipino and Indonesian domestic helper market in Hong Kong”, ILO Asian Regional Programme on Governance of Labour Migration Working Paper no. 23.
Inter-American Development Bank (IADB) 2004. Sending Money Home: Remittance to Latin America and the Caribbean. http://idbdocs.iadb.org/wsdocs/getdocument.aspx?docnum=547263
International Organization for Migration (IOM) Labour Migration from Indonesia: An overview of Indonesian migration to selected destinations in Asia and the Middle East. IOM: Jakarta. http://www.iom.int/jahia/webdav/shared/shared/mainsite/published_docs/Final-LM-Report-English.pdf [accessed 20 April 2012].
Lusardi, Anna Maria 2008. “Household Saving Behavior: The Role of Financial Literacy, Information, and Financial Education Programs”, NBER Working Paper no. 13824.
McKenzie, David 2011. “Beyond baseline and follow-up: The case for more T in experiments”, Journal of Development Economics, forthcoming
McKenzie, David 2012. “Learning about migration through experiments”, CReAM Working Paper no. 07/12.
Mohapatra, Sanket , Dilip Ratha and Ani Silwal 2011. “Outlook for Remittance Flows 2012-14”, Migration and Development Brief No. 17, World Bank: Washington D.C.
Seshan, Ganesh and Dean Yang 2012. “Transnational household finance: A field experiment on the cross-border impacts of financial education for migrant workers”, Mimeo. University of Michigan.
Woodruff, Christopher, and Rene M. Zenteno 2007. Migration networks and microenterprises in Mexico, Journal of Development Economics, 82(2): 509-28.
World Bank 2006. Global Economic Prospects 2006: Economic Implications of Remittances and Migration. World Bank: Washington, D.C.
World Bank 2010a. Enhancing Access to Finance for Migrant Workers in Indonesia: Evidence from a survey of three provinces. World Bank, Jakarta.
World Bank 2010b. Improving Access to Financial Services in Indonesia. World Bank, Jakarta. Yang, Dean. 2008. “International Migration, Remittances, and Household Investment: Evidence
from Philippine Migrants’ Exchange Rate Shocks.” The Economic Journal, 118: 591-630.

20
Online Appendix 1: Training Details and Curriculum
ITEMS TRAINING FOR MIGRANT WORKERS TRAINING FOR FAMILIES Core Materials financial management
understanding banking services savings loan management sending and receiving remittances understanding insurance
financial management
savings loan management sending and receiving remittances understanding insurance
Duration 2 days @ 9 hours = 18 hours Day 1 & 2: 08.00 – 17.00 (1 hour lunch
break)
2 days @ 4 hours = 8 hours Day 1: 13.00 – 17.00 Day 2: 08.00 – 12.00
Handouts Comic book, my financial book, brochure Comic book, my financial book, brochure Training venue Manpower & Transmigration Office’s
Training Center in Malang PPTKIS in Malang
Manpower & Transmigration Office’s Training Center in Malang
Training team 4 trainers from Redi 4 trainers from Redi Transport to training venue
Transport from PPTKIS to the training venue is provided by the respective PPTKIS
Transport from the village to training venue is reimbursed
Every participant is provided a room for 1 night; lunch & dinner for day 1; breakfast & lunch for day 2
Training Modules for Migrant Workers (content is similar for the family members)
SESSION DESCRIPTION
Opening Day 1 This session is the opening session of the entire training’s series. This session emphasizes an ice-breaker activity, and is an introduction session between the trainers with the participants.
Objective:
1. Participants know each other and can follow the training conveniently
2. Participants know the purpose of financial literacy training
3. Participants agree on the training schedule and rules
Duration:
45 minutes
Game/Exercise:
1. Game: to get to know one another & break the ice as well
2. Active participation: expectations
21
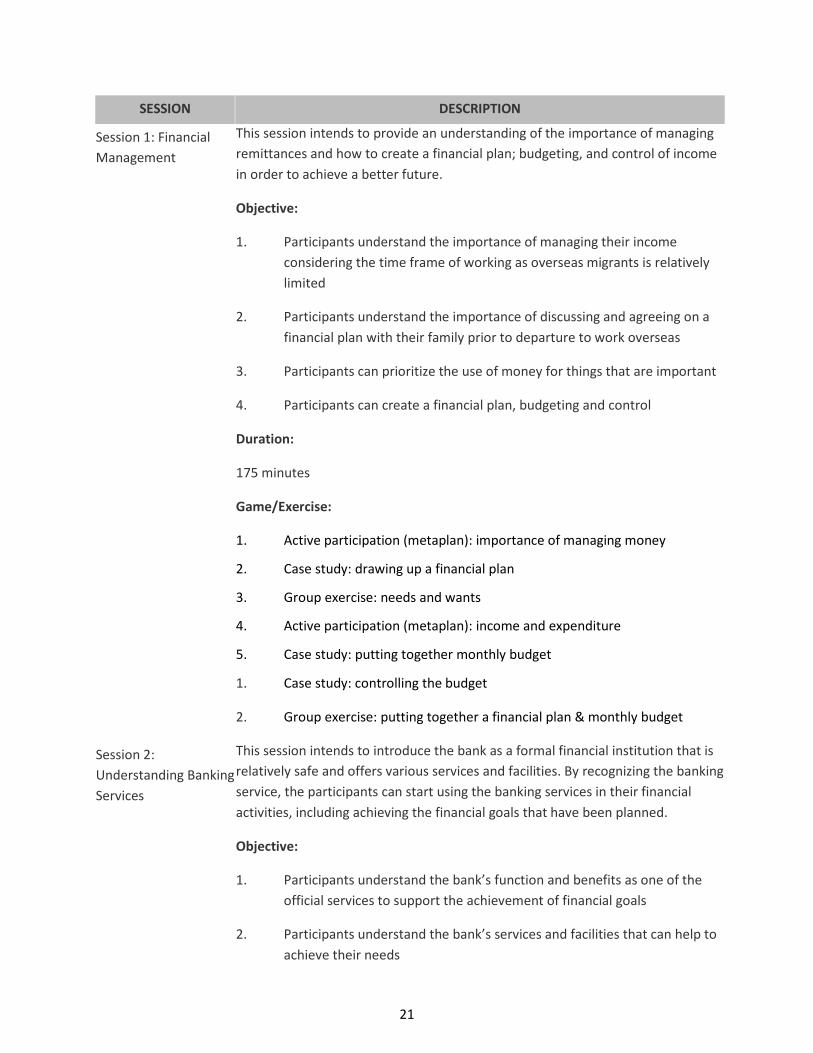
SESSION DESCRIPTION
Session 1: Financial Management
This session intends to provide an understanding of the importance of managing remittances and how to create a financial plan; budgeting, and control of income in order to achieve a better future.
Objective:
1. Participants understand the importance of managing their income considering the time frame of working as overseas migrants is relatively limited
2. Participants understand the importance of discussing and agreeing on a financial plan with their family prior to departure to work overseas
3. Participants can prioritize the use of money for things that are important
4. Participants can create a financial plan, budgeting and control
Duration:
175 minutes
Game/Exercise:
1. Active participation (metaplan): importance of managing money
2. Case study: drawing up a financial plan
3. Group exercise: needs and wants
4. Active participation (metaplan): income and expenditure
5. Case study: putting together monthly budget
1. Case study: controlling the budget
2. Group exercise: putting together a financial plan & monthly budget
Session 2: Understanding Banking Services
This session intends to introduce the bank as a formal financial institution that is relatively safe and offers various services and facilities. By recognizing the banking service, the participants can start using the banking services in their financial activities, including achieving the financial goals that have been planned.
Objective:
1. Participants understand the bank’s function and benefits as one of the official services to support the achievement of financial goals
2. Participants understand the bank’s services and facilities that can help to achieve their needs

22
SESSION DESCRIPTION
3. Participants are aware of the existence of ATMs and how use it safely
4. Participants can choose the bank that is suitable with their needs, either in home countries or overseas
Duration:
75 minutes
Game/Exercise:
1. Simulation: using ATM
2. Group exercise: choosing banks in destination country
Session 3: Savings This session intends to provide an understanding on the importance of saving in the early migration phase, in order to achieve financial goals, while providing information on options for where to save based on their individual needs.
Objective:
1. Participants understand the importance of having saving as part of their efforts to achieve the financial goals
2. Participants learn various saving options, the type of savings and savings products
3. Participants are aware of the existence and function of saving for overseas migrant workers
4. Participants learn to know how to save in the bank while working overseas
5. Participants understand the basic principles of investment
Duration:
85 minutes
Game/Exercise:
6. Active participation (metaplan): institutions offering savings services
7. Case study: choosing savings product
8. Group exercise: savings for rainy days
Closing Day 1 This session is the end of first day training; therefore this session is intended to review the participants’ understanding of the entire training materials that deliver

23
SESSION DESCRIPTION
in the first day.
Objective:
1. Participants remember the key messages that delivered in the first day training
Duration:
10 minutes
Game/Exercise:
1. Game: how well do I understand Day 1 sessions?
Opening Day 2 This session is an opening session of the second day of training and intends to remind participants, in advance, of the training flow and agreed rules.
Objective:
2. Participants can follow the training comfortably
3. Participants recall the key messages of the material delivered in the first day of the training
4. Participants agree on the training schedule
Duration:
30 minutes
Game/Exercise:
5. Game: decoding pictures into a message
Session 4: Loan Management
This session intends to provide basic knowledge related with loans, as well as providing information on sources of loans that are considered safe. It expects the loan can be managed wisely and supports the financial plan that has been made.
Objective:
1. Participant can plan their loan in early phase, so that it can support the achievement of the financial goals and does not interfere with other needs
2. Participants know the right timing to borrow
3. Participants learn basic knowledge in borrowing

24
SESSION DESCRIPTION
4. Participants learn the sources of loan options that suit their needs
5. Participants understand how to calculate loan interest
6. Participants are aware of special loans for TKIs
Duration:
95 minutes
Game/Exercise:
7. Active participation (metaplan): institutions to get a loan
8. Case study: calculating loan’s interest
9. Group exercise: choosing loan products
Session 5: Sending Remittance
This session aims to provide information on various choices of sending money that are available and step-by-step information on how to send money through formal institutions. It is expected the participants are able to send money safely, cheaply and quickly that can then support the achievement of financial goals.
Objective:
1. Participants have the basic information on sending and receiving money, so that the money can be used optimally to achieve the financial goals
2. Participants know the formal services to send money and realize the danger of using the informal services.
3. Participants learn various ways to send and receive remittance and acknowledge the advantages and disadvantages from each method.
4. Participants learn the steps to send money through formal services
5. Participants have the ability to fill out remittance form correctly
6. Participants understand the basic principles of exchange rate between different currencies.
Duration:
105 minutes
Game/Exercise:
1. Active participation (metaplan): formal & non-formal remittance service providers

25
SESSION DESCRIPTION
2. Group exercise: comparing formal & non-formal remittance providers
3. Active participation(metaplan): sending remittances
4. Active participation(metaplan): receiving remittances
5. Active participation: comparing options in sending remittances
6. Individual exercise: filling out the remittance form
7. Active participation: understanding exchange rate & its application
Session 6: Understanding Insurance
This session intends to provide basic understanding of insurance and awareness and ablility to utilize TKI insurance
Objective:
1. Participants understand the importance of having insurance, in order to reduce the financial risks that may appear in the process of achieving financial goals
2. Participants understand the basic principles of insurance
3. Participants understand that any migrants who leave as legal workers are insured through TKI insurance
4. Participants understand the basic principles and how to execute claims from TKI insurance
Duration:
75 minutes
Game/Exercise:
1. Group exercise: claiming TKI insurance
Closing Day 2 This session closes the entire of training session, thus this session is intended to review the participants’ understanding and learning to practice the material that has been delivered in the training sessions.
Objective:
1. Participants have ideas and able to create their own financial management plan
2. Participants remember the key messages of training materials
Duration:

26
SESSION DESCRIPTION
60 minutes
Game/Exercise:
1. Individual exercise: formulate my financial plan
2. Individual exercise: formulate my monthly budget
3. Game: how well do I understand Day 2 sessions?

27
Appendix Figure 1: Example of comic book material to discuss importance of distinguishing between needs and wants

(1) (2) (3) (4)
Migrant-Only
Training (A)
Family-Only
Training (B)
Migrant and
Family
Training (C)
Control Group
(D)
Follow-up 1:
Respondent is Female 0.34 0.31 0.31 0.36 0.612 0.509 0.924 0.952 0.484 0.45 0.815
Respondent Age 43.33 41.99 41.45 43.68 0.434 0.236 0.868 0.75 0.316 0.171 0.457
Migrant is his/her Spouse 0.17 0.16 0.15 0.24 0.9 0.668 0.236 0.739 0.205 0.111 0.421
Migrant is his/her Parent 0.36 0.36 0.39 0.31 0.968 0.673 0.427 0.684 0.424 0.227 0.667
Follow-up 2:
Respondent is Female 0.36 0.36 0.37 0.38 0.99 0.934 0.796 0.945 0.807 0.864 0.994
Respondent Age 44.66 44.06 42.59 45.83 0.731 0.227 0.502 0.422 0.343 0.081 * 0.355
Migrant is his/her Spouse 0.18 0.17 0.17 0.25 0.927 0.877 0.193 0.949 0.167 0.154 0.444
Migrant is his/her Parent 0.36 0.35 0.32 0.29 0.889 0.581 0.332 0.681 0.41 0.688 0.763
Follow-up 3:
Respondent is Female 0.38 0.35 0.38 0.38 0.762 0.985 0.909 0.78 0.678 0.895 0.979
Table 1: Summary Statistics and Tests of Randomization
P-value
A = C
P-value
A = B
P-value
A = D
P-value
B = C
P-value
C = D
P-value
B = D
P-value
A = B = C = D
(5) (6) (7) (8) (9) (10) (11)
Respondent is Female 0.38 0.35 0.38 0.38 0.762 0.985 0.909 0.78 0.678 0.895 0.979
Respondent Age 45.87 44.42 42.69 45.97 0.428 0.082 * 0.957 0.356 0.399 0.073 * 0.238
Migrant is his/her Spouse 0.17 0.17 0.17 0.23 1 0.978 0.323 0.978 0.323 0.317 0.704
Migrant is his/her Parent 0.33 0.35 0.28 0.3 0.759 0.477 0.595 0.311 0.403 0.854 0.723
This table presents demographic summary statistics for respondents in all follow-up survey rounds by treatment status -- Columns (1) - (4); as well as p-values for equality of means tests across
treatments -- Columns (5) - (11). Statistically significant p-values are highlighted by: * (10% significance level), ** (5% significance level), and *** (1% significance level).

(1) (2) (3) (4) (5)
Present in
Baseline
Present in
Follow-up 1
Present in
Follow-up 2
Present in
Follow-up 3
Present in Any
Follow-up
Round
Migrant-Only Training (A) -0.012 0.009 0.047 0.046 0.019
(0.034) (0.022) (0.034) (0.042) (0.019)
Family-Only Training (B) -0.034 0.019 0.046 0.074* 0.019
(0.037) (0.019) (0.034) (0.040) (0.019)
Migrant and Family Training (C) -0.045 0.008 0.014 0.032 0.019
(0.039) (0.022) (0.038) (0.044) (0.019)
Sample Size 400 400 400 400 400
Mean of Dependent Variable in Control Group 0.942 0.971 0.913 0.875 0.971
Test: A-B = 0 (p-value) 0.562 0.579 0.965 0.422 0.983
Test: A-C = 0 (p-value) 0.400 0.968 0.322 0.735 0.977
Test: B-C = 0 (p-value) 0.792 0.557 0.345 0.261 0.994
Test: A = B = C = 0 (p-value) 0.679 0.783 0.564 0.490 1.000
Table 2: Atrittion Analysis
Test: A = B = C = 0 (p-value) 0.679 0.783 0.564 0.490 1.000
This table presents attrition analysis for each survey round (baseline and three follow-ups) in Columns (1)-(4), and overall attrition in Column (5). Standard errors in
parentheses, clustered at the individual level. The bottom half of the table presents p-values for equality of coefficient tests. Statistically significant coefficients are
highlighted by: * (10% significance level), ** (5% significance level), and *** (1% significance level).

(1) (2) (3)
Financial
Awareness
Applied
Financial
Knowledge
Financial
Numeracy Skills
Migrant-Only Training (A) 0.039 0.009 0.016
(0.038) (0.018) (0.026)
Family-Only Training (B) 0.123*** 0.026 0.037
(0.037) (0.018) (0.025)
Migrant and Family Training (C) 0.192*** 0.049** 0.042
(0.038) (0.020) (0.027)
R-squared 0.054 0.192 0.018
Sample Size 1132 1133 1133
Number of Clusters 394 394 394
Mean of Dependent Variable in Control Group 0.397 0.318 0.391
Test: A-B = 0 (p-value) 0.032 0.332 0.448
Test: A-C = 0 (p-value) 0.000 0.041 0.382
Table 3: Impact on Financial Knowledge
Test: A-C = 0 (p-value) 0.000 0.041 0.382
Test: B-C = 0 (p-value) 0.075 0.247 0.867
Test: A = B = C = 0 (p-value) 0.000 0.071 0.353
This table presents pooled regression analysis across three follow-up survey rounds for aggregated measures of Financial
Awareness, Applied Financial Knowledge, and Financial Numeracy Skills in Columns (1), (2), and (3), respectively. Individual
components of these aggregate measures are presented separately in Appendix Tables A2, A3, and A4. Separate regression
analysis by follow-up survey round is presented in Appendix Table A5. All regressions include survey round dummies. Standard
errors in parentheses, clustered at the individual level. The bottom half of the table presents p-values for equality of coefficient
tests. Statistically significant coefficients are highlighted by: * (10% significance level), ** (5% significance level), and *** (1%
significance level).

(1) (2) (3) (4) (5) (6) (7)
Knowledge of
Migrant
Insurance
Prefers to Send
One Large
Remittance
Fixed Fee on
Sender: Correct
Fixed Fee on
Recipient:
Correct
Exchange Rate
Commission:
Correct
Interest Rate:
Correct
Knowledge of
Remittance
Costs:
Aggregated
Migrant-Only Training (A) 0.057* 0.031 0.058 0.057 0.048** -0.001 0.039
(0.032) (0.034) (0.045) (0.045) (0.022) (0.039) (0.026)
Family-Only Training (B) 0.135*** 0.030 0.087* 0.035 0.025 0.050 0.046*
(0.036) (0.036) (0.045) (0.046) (0.021) (0.040) (0.026)
Migrant and Family Training (C) 0.256*** 0.029 0.125*** 0.069 0.047* 0.123*** 0.079***
(0.046) (0.035) (0.047) (0.047) (0.024) (0.043) (0.028)
R-squared 0.067 0.018 0.040 0.059 0.012 0.090 0.077
Sample Size 1059 1133 1133 1133 1133 1133 1133
Number of Clusters 384 394 394 394 394 394 394
Mean of Dependent Variable in Control Group 0.097 0.808 0.564 0.509 0.049 0.300 0.446
Test: A-B = 0 (p-value) 0.046 0.973 0.514 0.623 0.320 0.200 0.801
Table 4: Impact on Knowledge of Insurance and Remittance Costs
Test: A-C = 0 (p-value) 0.000 0.968 0.144 0.790 0.949 0.004 0.140
Test: B-C = 0 (p-value) 0.019 0.996 0.401 0.466 0.387 0.091 0.219
Test: A = B = C = 0 (p-value) 0.000 0.799 0.054 0.459 0.102 0.013 0.041
This table presents pooled regression analysis across three follow-up survey rounds for measures of knowledge of the insurance product for migrants and remittance costs. Column 7 is an aggregate
measure of Columns (2)-(6). Separate regression analysis by follow-up survey round is presented in Appendix Table A6. All regressions include survey round dummies. Standard errors in parentheses,
clustered at the individual level. The bottom half of the table presents p-values for equality of coefficient tests. Statistically significant coefficients are highlighted by: * (10% significance level), ** (5%
significance level), and *** (1% significance level).

(1) (2) (3) (4) (5)
Receives
Remittance
through Informal
Channels
Has Received
Remittance
Remittance
Frequency
Remittance: Log
(Amount)
Remittance: Level
(USD)
Migrant-Only Training (A) -0.010 0.000 -0.497 -0.188 -130.906
(0.009) (0.053) (0.690) (0.871) (88.315)
Family-Only Training (B) -0.010 -0.069 -0.989 -1.221 -127.331
(0.009) (0.055) (0.678) (0.908) (90.874)
Migrant and Family Training (C) -0.014 -0.030 -0.772 -0.517 -58.785
(0.008) (0.056) (0.690) (0.922) (92.528)
R-squared 0.005 0.073 0.042 0.080 0.103
Sample Size 1131 1132 1131 1131 1130
Number of Clusters 394 394 394 394 394
Mean of Dependent Variable in Control Group 0.014 0.582 3.268 9.501 599.797
Test: A-B = 0 (p-value) 0.986 0.196 0.409 0.239 0.966
Table 5: Impact on Remittance Behavior
Test: A-B = 0 (p-value) 0.986 0.196 0.409 0.239 0.966
Test: A-C = 0 (p-value) 0.319 0.578 0.652 0.712 0.402
Test: B-C = 0 (p-value) 0.316 0.491 0.716 0.448 0.439
Test: A = B = C = 0 (p-value) 0.196 0.540 0.508 0.547 0.410
This table presents pooled regression analysis across three follow-up survey rounds for measures of remittance behavior. All regressions include survey round dummies. Standard errors
in parentheses, clustered at the individual level. The bottom half of the table presents p-values for equality of coefficient tests. Statistically significant coefficients are highlighted by: *
(10% significance level), ** (5% significance level), and *** (1% significance level).

(1) (2) (3) (4) (5)
Had a Financial
Goal in the last
6 Months
Plans to Have a
Financial Goal in
the next 2
Months
Discusses
Budgetting
Matters with
Migrant
Prepares Cash
Records
Budgeting and
Financial
Planning:
Aggregated
Migrant-Only Training (A) 0.044 -0.023 -0.040 0.014 -0.001
(0.047) (0.034) (0.040) (0.024) (0.025)
Family-Only Training (B) 0.052 0.033 -0.016 0.047* 0.029
(0.045) (0.037) (0.040) (0.027) (0.026)
Migrant and Family Training (C) 0.055 0.060 0.025 0.091*** 0.058**
(0.048) (0.039) (0.040) (0.030) (0.026)
R-squared 0.064 0.096 0.005 0.015 0.025
Sample Size 1133 1133 1133 1133 1133
Number of Clusters 394 394 394 394 394
Mean of Dependent Variable in Control Group 0.526 0.226 0.767 0.059 0.395
Test: A-B = 0 (p-value) 0.855 0.107 0.561 0.221 0.248
Table 6: Impact on Budgeting and Financial Planning
Test: A-B = 0 (p-value) 0.855 0.107 0.561 0.221 0.248
Test: A-C = 0 (p-value) 0.821 0.024 0.108 0.011 0.030
Test: B-C = 0 (p-value) 0.956 0.498 0.306 0.171 0.298
Test: A = B = C = 0 (p-value) 0.594 0.112 0.432 0.015 0.093
This table presents pooled regression analysis across three follow-up survey rounds for measures of financial planning behavior. Column (5) is an aggregate measure of
Columns (1) - (4). Separate regression analysis by follow-up survey round is presented in Appendix Table A6. All regressions include survey round dummies. Standard
errors in parentheses, clustered at the individual level. The bottom half of the table presents p-values for equality of coefficient tests. Statistically significant coefficients
are highlighted by: * (10% significance level), ** (5% significance level), and *** (1% significance level).

(1) (2) (3) (4) (5) (6) (7) (8) (9)
Has Savings in
Bank Account
Has Saved in
last 6 Months
Will Save in
next 2 Months
Saving in last 6
Months:
Level (USD)
Saving in last 6
Months:
Log (Amount)
Remittances
used to Save:
Level (USD)
Remittances
used to Save:
Log (Amount)
Savings
Outcomes:
Aggregated
Has Taken Loan
in last 6
Months
Migrant-Only Training (A) 0.054 -0.005 0.006 13.757 0.436 33.272 0.716 0.048 -0.061
(0.056) (0.045) (0.045) (15.147) (1.056) (31.946) (0.581) (0.074) (0.044)
Family-Only Training (B) 0.038 -0.021 0.026 11.141 1.286 36.415 0.438 0.037 0.043
(0.055) (0.046) (0.045) (15.022) (1.116) (36.226) (0.551) (0.074) (0.047)
Migrant and Family Training (C) 0.102* 0.101** 0.115** 15.983 2.253** 74.324** 1.496** 0.186** -0.089**
(0.056) (0.050) (0.050) (14.512) (1.016) (37.006) (0.641) (0.075) (0.045)
R-squared 0.015 0.019 0.034 0.006 0.014 0.023 0.009 0.013 0.015
Sample Size 1133 1133 1133 1133 1133 1133 1133 1133 1133
Number of Clusters 394 394 394 394 394 394 394 394 394
Mean of Dependent Variable in Control Group 0.397 0.324 0.369 59.303 6.566 75.246 1.894 -0.015 0.331
Test: A-B = 0 (p-value) 0.775 0.723 0.641 0.856 0.427 0.939 0.644 0.891 0.025
Test: A-C = 0 (p-value) 0.410 0.029 0.025 0.873 0.062 0.328 0.254 0.071 0.515
Table 7: Impact on Savings and Loans
Test: A-C = 0 (p-value) 0.410 0.029 0.025 0.873 0.062 0.328 0.254 0.071 0.515
Test: B-C = 0 (p-value) 0.259 0.013 0.068 0.714 0.347 0.403 0.109 0.052 0.005
Test: A = B = C = 0 (p-value) 0.337 0.065 0.085 0.721 0.113 0.214 0.130 0.078 0.021
This table presents pooled regression analysis across three follow-up survey rounds for measures of savings and loans. Column (8) is a z-score of Columns 1,2,3,4, and 6. Separate regression analysis by follow-up survey round is
presented in Appendix Table A6. All regressions include survey round dummies. Standard errors in parentheses, clustered at the individual level. The bottom half of the table presents p-values for equality of coefficient tests.
Statistically significant coefficients are highlighted by: * (10% significance level), ** (5% significance level), and *** (1% significance level).

(1) (2) (3) (4)
Migrant-Only
Training (A)
Family-Only
Training (B)
Migrant and
Family Training
(C)
Control Group
(D)
Has a Business0.57 0.63 0.61 0.58
0.429 0.586 0.969 0.807 0.448 0.61 0.822
Average Monthly Income (USD) 167.94 144.26 135.6 158.69 0.414 0.264 0.784 0.656 0.604 0.406 0.642
Average Monthly Consumption (USD) 133.21 158.99 140.32 137.67 0.139 0.628 0.778 0.291 0.249 0.868 0.525
Records Income and Expenditures0.04 0.02 0.04 0.02
0.478 0.906 0.389 0.417 0.902 0.335 0.697
Has Savings 0.44 0.53 0.51 0.5 0.18 0.333 0.358 0.713 0.65 0.94 0.576
Has Had a Savings Account 0.54 0.58 0.55 0.52 0.661 0.958 0.718 0.706 0.428 0.684 0.888
Has Received Remittance 0.38 0.33 0.34 0.38 0.469 0.643 0.985 0.797 0.477 0.654 0.859
Discusses Financial Issues with Family 0.87 0.95 0.96 0.89 0.077 * 0.035 ** 0.612 0.722 0.191 0.098 * 0.09 *
F-Test for Joint Significance (Probit/Multi-Logit) 0.258 0.477 0.917 0.961 0.603 0.615 0.864
P-value C=DP-value
A=B=C=D
Appendix Table A1 - Test of Randomization for Baseline Household Outcomes
P-value A=B P-value A=C P-value A=D P-value B=C P-value B=D
(10) (11)(5) (6) (7) (8) (9)
This table presents demographic summary statistics for respondents at baseline by treatment status -- Columns (1) - (4); as well as p-values for equality of means tests across treatments -- Columns (5) - (11). Statistically significant p-values are highlighted by: *
(10% significance level), ** (5% significance level), and *** (1% significance level).

(1) (2) (3) (4) (5) (6) (7) (8) (9) (10) (11) (12)
Financial
Budget
Savings
Account Interest Rate ATM Debit Card
Bank
Transfer
Transaction
Fees Pawnshop
Foreign
Currency Exchange Rate Insurance TKI insurance
Migrant-Only Training (A) 0.034 0.053 0.046 -0.001 0.054 0.022 0.094* 0.006 0.014 0.046 0.039 0.067*
(0.047) (0.051) (0.052) (0.054) (0.033) (0.052) (0.053) (0.042) (0.053) (0.049) (0.050) (0.040)
Family-Only Training (B) 0.202*** 0.128*** 0.102** 0.135** 0.053 0.075 0.120** 0.038 0.124** 0.087* 0.166*** 0.248***
(0.048) (0.047) (0.049) (0.053) (0.033) (0.050) (0.051) (0.041) (0.051) (0.047) (0.050) (0.045)
Migrant and Family Training (C) 0.300*** 0.178*** 0.181*** 0.164*** 0.077** 0.206*** 0.230*** 0.077** 0.188*** 0.150*** 0.260*** 0.291***
(0.048) (0.047) (0.050) (0.053) (0.033) (0.050) (0.053) (0.039) (0.051) (0.050) (0.052) (0.047)
Follow-up 2 Indicator 0.013 0.126*** 0.130*** 0.002 0.073*** 0.044 0.001 0.084*** 0.027 0.078*** -0.023 0.112***
(0.029) (0.032) (0.032) (0.030) (0.025) (0.031) (0.030) (0.029) (0.032) (0.029) (0.033) (0.029)
Follow-up 3 Indicator 0.010 0.053* 0.076** -0.042 -0.001 0.043 0.041 0.064** 0.035 0.097*** -0.002 0.122***
(0.030) (0.031) (0.033) (0.031) (0.022) (0.031) (0.032) (0.028) (0.034) (0.032) (0.032) (0.027)
Constant 0.231*** 0.524*** 0.447*** 0.511*** 0.077*** 0.520*** 0.355*** 0.713*** 0.385*** 0.214*** 0.371*** 0.106***
(0.036) (0.038) (0.039) (0.041) (0.024) (0.038) (0.040) (0.033) (0.041) (0.035) (0.039) (0.029)
R-squared 0.070 0.034 0.030 0.028 0.016 0.031 0.029 0.016 0.027 0.025 0.045 0.082
Sample Size 1133 1132 1132 1132 1132 1132 1132 1132 1132 1132 1132 1132
Number of Clusters 394 394 394 394 394 394 394 394 394 394 394 394
Mean of Dependent Variable in Control Group 0.230 0.577 0.510 0.493 0.101 0.542 0.364 0.755 0.399 0.262 0.357 0.175
Test: A-B = 0 (p-value) 0.001 0.121 0.271 0.012 0.988 0.309 0.619 0.450 0.037 0.409 0.012 0.000
Test: A-C = 0 (p-value) 0.000 0.011 0.010 0.003 0.503 0.000 0.011 0.074 0.001 0.048 0.000 0.000
Test: B-C = 0 (p-value) 0.051 0.268 0.110 0.593 0.493 0.008 0.036 0.311 0.200 0.211 0.071 0.419
Test: A = B = C = 0 (p-value) 0.000 0.001 0.003 0.001 0.094 0.000 0.000 0.172 0.000 0.021 0.000 0.000
Appendix Table A2: Individual Financial Awareness Indicators
This table presents pooled regression analysis across three follow-up survey rounds for Individual components of the aggregate measure "Financial Awareness", presented in Table 3. All regressions include survey round dummies. Standard errors in
parentheses, clustered at the individual level. The bottom half of the table presents p-values for equality of coefficient tests. Statistically significant coefficients are highlighted by: * (10% significance level), ** (5% significance level), and *** (1%
significance level). significance level).

(1) (2) (3) (4) (5)
Can Open
Account With
Rp. 10
Using Loan to
Buy TV is
Unproductive
Suggests Health
Insurance
Suggests
Making Budget
Suggests
Applying for
Loan
Migrant-Only Training (A) 0.000 -0.012 0.014 0.020 0.023
(0.032) (0.034) (0.017) (0.036) (0.043)
Family-Only Training (B) 0.028 0.010 0.015 0.036 0.044
(0.036) (0.033) (0.017) (0.036) (0.041)
Migrant and Family Training (C) 0.052 0.008 0.081*** 0.030 0.075*
(0.034) (0.033) (0.026) (0.038) (0.042)
R-squared 0.034 0.016 0.021 0.228 0.142
Sample Size 1133 1133 1133 1133 1129
Number of Clusters 394 394 394 394 394
Mean of Dependent Variable in Control Group 0.132 0.854 0.035 0.261 0.308
Appendix Table A3: Individual Applied Financial Knowledge Indicators
Test: A-B = 0 (p-value) 0.411 0.474 0.945 0.660 0.611
Test: A-C = 0 (p-value) 0.107 0.518 0.012 0.792 0.213
Test: B-C = 0 (p-value) 0.498 0.948 0.015 0.883 0.436
Test: A = B = C = 0 (p-value) 0.340 0.889 0.025 0.769 0.325
This table presents pooled regression analysis across three follow-up survey rounds for Individual components of the aggregate measure "Applied Financial Knowledge",
presented in Table 3. All regressions include survey round dummies. Standard errors in parentheses, clustered at the individual level. The bottom half of the table
presents p-values for equality of coefficient tests. Statistically significant coefficients are highlighted by: * (10% significance level), ** (5% significance level), and *** (1%
significance level).

(1) (2) (3)
Cheaper Loan
Option: Correct
Annual Fee:
Correct
Income
Calculation:
Correct
Migrant-Only Training (A) 0.018 0.003 0.028
(0.041) (0.042) (0.034)
Family-Only Training (B) 0.039 0.062 0.010
(0.042) (0.039) (0.033)
Migrant and Family Training (C) 0.016 0.019 0.090**
(0.043) (0.041) (0.036)
R-squared 0.021 0.009 0.044
Sample Size 1133 1133 1133
Number of Clusters 394 394 394
Mean of Dependent Variable in Control Group 0.317 0.704 0.153
Test: A-B = 0 (p-value) 0.615 0.151 0.623
Test: A-C = 0 (p-value) 0.961 0.707 0.109
Appendix Table A4: Individual Financial Numeracy Skills Indicators
Test: A-C = 0 (p-value) 0.961 0.707 0.109
Test: B-C = 0 (p-value) 0.596 0.286 0.036
Test: A = B = C = 0 (p-value) 0.829 0.369 0.077
This table presents pooled regression analysis across three follow-up survey rounds for Individual components of the aggregate
measure "Financial Numeracy Skills", presented in Table 3. All regressions include survey round dummies. Standard errors in
parentheses, clustered at the individual level. The bottom half of the table presents p-values for equality of coefficient tests.
Statistically significant coefficients are highlighted by: * (10% significance level), ** (5% significance level), and *** (1%
significance level).

(1) (2) (3) (4) (5) (6) (7) (8) (9)
Financial
Awareness
Round 1
Financial
Awareness
Round 2
Financial
Awareness
Round 3
Applied
Financial
Knowledge
Round 1
Applied
Financial
Knowledge
Round 2
Applied
Financial
Knowledge
Round 3
Financial
Numeracy
Skills
Round 1
Financial
Numeracy
Skills
Round 2
Financial
Numeracy
Skills
Round 3
Migrant-Only Training (A) -0.007 0.040 0.088* 0.007 -0.009 0.030 0.031 -0.027 0.044
(0.046) (0.049) (0.050) (0.031) (0.022) (0.024) (0.040) (0.038) (0.039)
Family-Only Training (B) 0.112** 0.120** 0.138*** 0.024 0.046* 0.008 0.102*** -0.032 0.037
(0.046) (0.050) (0.051) (0.031) (0.027) (0.021) (0.038) (0.038) (0.038)
Migrant and Family Training (C) 0.200*** 0.187*** 0.187*** 0.080** 0.040 0.025 0.108** -0.015 0.026
(0.047) (0.049) (0.050) (0.033) (0.028) (0.023) (0.042) (0.039) (0.040)
R-squared 0.063 0.044 0.060 0.019 0.021 0.021 0.025 0.004 0.027
Sample Size 392 375 365 392 376 365 392 376 365
Number of Clusters 392 375 365 392 376 365 392 376 365
Mean of Dependent Variable in Control Group 0.384 0.419 0.389 0.434 0.263 0.246 0.383 0.446 0.344
Test: A-B = 0 (p-value) 0.013 0.115 0.334 0.576 0.038 0.363 0.087 0.897 0.849
Test: A-C = 0 (p-value) 0.000 0.003 0.050 0.027 0.084 0.860 0.088 0.765 0.648
Appendix Table A5: Aggregate Measures by Follow-up Round
Test: A-C = 0 (p-value) 0.000 0.003 0.050 0.027 0.084 0.860 0.088 0.765 0.648
Test: B-C = 0 (p-value) 0.070 0.177 0.329 0.093 0.829 0.441 0.876 0.674 0.774
Test: A = B = C = 0 (p-value) 0.000 0.001 0.002 0.077 0.099 0.547 0.014 0.842 0.690
This table presents regression analysis for aggregatedmeasures of Financial Awareness, Applied Financial Knowledge, and Financial Numeracy Skills, by follow-up survey round. Standard errors in parentheses. The bottom half of
the table presents p-values for equality of coefficient tests. Statistically significant coefficients are highlighted by: * (10% significance level), ** (5% significance level), and *** (1% significance level).

(1) (2) (3) (4) (5) (6) (7) (8) (9)
Knowledge of
Remittance
Costs
Round 1
Knowledge of
Remittance
Costs
Round 2
Knowledge of
Remittance
Costs
Round 3
Budgeting and
Financial
Planning
Round 1
Budgeting and
Financial
Planning
Round 2
Budgeting and
Financial
Planning
Round 3
Savings
Outcomes
Round 1
Savings
Outcomes
Round 2
Savings
Outcomes
Round 3
Migrant-Only Training (A) -0.008 0.036 0.094** -0.011 0.001 0.008 -0.027 0.022 0.155
(0.035) (0.038) (0.042) (0.038) (0.036) (0.033) (0.093) (0.103) (0.096)
Family-Only Training (B) 0.041 0.042 0.055 0.028 0.017 0.043 -0.022 0.116 0.022
(0.035) (0.038) (0.042) (0.039) (0.038) (0.033) (0.093) (0.104) (0.101)
Migrant and Family Training (C) 0.047 0.106*** 0.086** 0.046 0.064* 0.065* 0.144 0.259** 0.158
(0.037) (0.038) (0.042) (0.041) (0.038) (0.034) (0.091) (0.106) (0.098)
R-squared 0.009 0.023 0.039 0.007 0.010 0.012 0.012 0.020 0.013
Sample Size 392 376 365 392 376 365 392 376 365
Number of Clusters 392 376 365 392 376 365 392 376 365
Mean of Dependent Variable in Control Group 0.382 0.455 0.508 0.433 0.350 0.398 -0.010 -0.016 -0.020
Test: A-B = 0 (p-value) 0.171 0.877 0.332 0.294 0.662 0.326 0.957 0.380 0.189
Appendix Table A6: Aggregate Measures by Follow-up Round
Test: A-B = 0 (p-value) 0.171 0.877 0.332 0.294 0.662 0.326 0.957 0.380 0.189
Test: A-C = 0 (p-value) 0.139 0.058 0.841 0.146 0.099 0.123 0.057 0.030 0.976
Test: B-C = 0 (p-value) 0.858 0.085 0.440 0.663 0.239 0.545 0.065 0.189 0.188
Test: A = B = C = 0 (p-value) 0.315 0.044 0.119 0.451 0.315 0.210 0.174 0.070 0.224
This table presents regression analysis for aggregate measures of Knowledge of Remittance Costs, Budgeting and Financial Planning, and Savings Outcomes, by follow-up survey round. Standard errors in parentheses. The bottom half
of the table presents p-values for equality of coefficient tests. Statistically significant coefficients are highlighted by: * (10% significance level), ** (5% significance level), and *** (1% significance level).