Whitemont services offer
23
Services Financiers Whitemont inc. - Financial Services Firm 1 / 23 FINANCIAL SERVICES FIRM & Mr. Denis Pap, Registered Investment Advisor
-
Upload
denis-pap -
Category
Economy & Finance
-
view
198 -
download
0
Transcript of Whitemont services offer

Services Financiers Whitemont inc. - Financial Services Firm 1 / 23
FINANCIAL SERVICES FIRM
&
Mr. Denis Pap, Registered Investment Advisor

Services Financiers Whitemont inc. - Financial Services Firm 2 / 23
FINANCIAL SERVICES FIRMwww.whitemont.com
Whitemont Financial Services Inc. is an independent financial services firm founded and directed by actuarial school graduates. Our team members include Masters of Business Administration (MBA) program graduates, Financial Planners, Actuarial Science program graduates, Chartered Administrators and selfemployed representatives.
PEAK FINANCIAL GROUPwww.peakgroup.com
Peak Financial Group is the largest independent broker in Quebec, managing assets exceeding 7 billion dollars and serving over 150 000 customers across Canada.
Partners

Services Financiers Whitemont inc. - Financial Services Firm 3 / 23
Independance
Being independent gives us access to the best products available on the market through various financial institutions. Without any household products, we don’t have any incentive to sell one product more than the other. This way, we avoid conflicts of interest ;
Our products selection comprises mutual funds, segregated funds, guaranteed income certificates (GICs), stocks, bonds, exchange traded funds (ETFs) etc…
Here are some of the financial institutions we work with :

Services Financiers Whitemont inc. - Financial Services Firm 4 / 23
Our expertise
Our mission : Help our clients achieve their financial goals by offering them our expertise. Our skills and knowhow are put at their service to innovate, reinvent and
revolutionize the way financial management is handled.
Finance (Personal loans and mortgage loans)
Insurance, risk management & estate
Investments Taxrelated matters
Retirement Legal aspects
THESE SERVICES ARE OFFERED IN COLLABORATION WITHWHITEMONT FINANCIAL SERVICES INC., A FINANCIAL SERVICES FIRM COMPOSED OF ACTUARIAL SCIENCE GRADUATES SPECIALIZED IN FINANCIAL PLANNING.
Mr. Denis Pap
REGISTERED INVESTMENT ADVISOR

Services Financiers Whitemont inc. - Financial Services Firm 5 / 23
Our investment philosophy

Services Financiers Whitemont inc. - Financial Services Firm 6 / 23
Principle # 1 : Mainly invest in equities and bonds
Principle # 2 : Chosen investment tool : Mutual funds
Principle # 3 : Diversify through severalmutual funds and several managers
Principle # 4 : Invest worldwide
Principle # 5 : Evaluate the management team rather than the fund itself
Principle # 6 : Use a strict selection process to select management teams
Principle # 7 : Minimize the risk on return ratio based on the investment horizon
Principle # 8 : Create portfolios using management styles adapted to the investment objective
Principle # 9 : Use a strict process to build portfolios
Principle # 10 : Set up a followup process of the portfolios
Principle # 11 : Used strategy : "Buy & Hold" (Do not try to predict the markets)
11 basic principles
Objective :That the Whitemont Financial Services Portfolios outperform their respective benchmarks
Services Financiers Whitemont inc. - Financial Services Firm 7 / 23
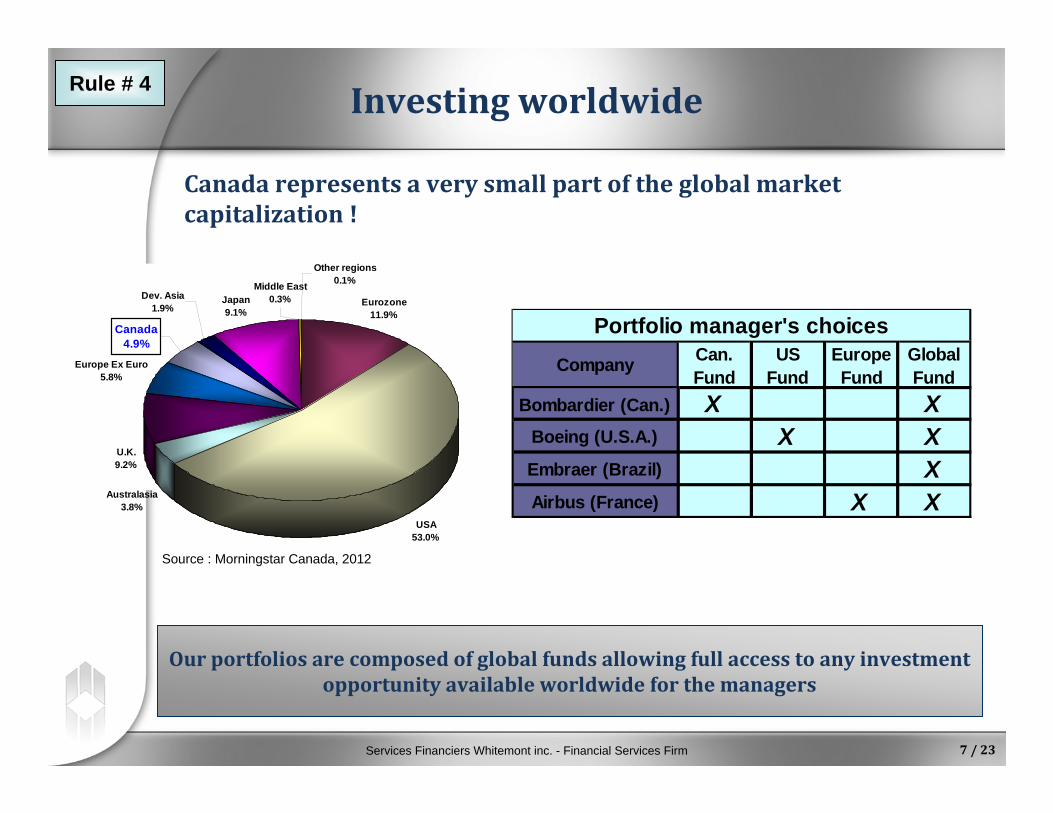
Eurozone11.9%
USA53.0%
Australasia3.8%
U.K.9.2%
Europe Ex Euro5.8%
Dev. Asia1.9%
Japan9.1%
Canada4.9%
Middle East0.3%
Other regions0.1%
Source : Morningstar Canada, 2012
Our portfolios are composed of global funds allowing full access to any investment opportunity available worldwide for the managers
Canada represents a very small part of the global market capitalization !
Bombardier (Can.) X XBoeing (U.S.A.) X XEmbraer (Brazil) XAirbus (France) X X
Company
Portfolio manager's choicesCan. Fund
US Fund
Europe Fund
Global Fund
Investing worldwideRule # 4
Services Financiers Whitemont inc. - Financial Services Firm 8 / 23
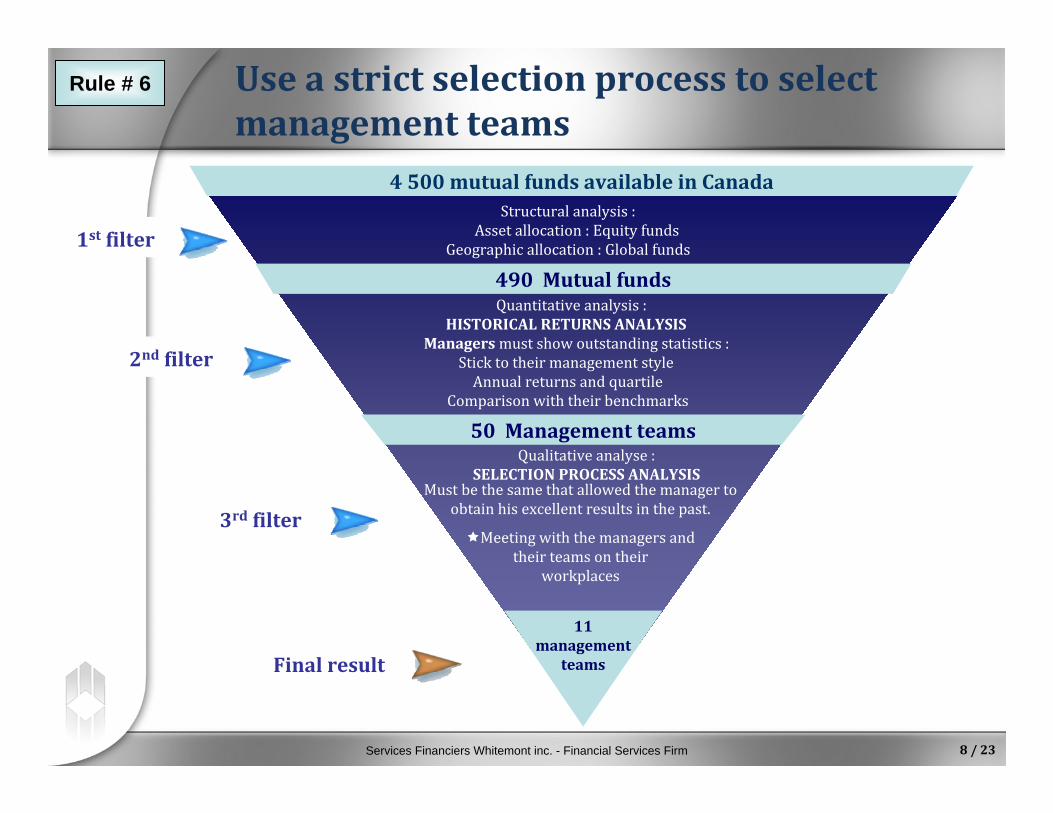
Use a strict selection process to select management teams
1st filter
2nd filter
3rd filter
Final result
4 500 mutual funds available in Canada
490 Mutual funds
50 Management teams
11management
teams
Structural analysis :Asset allocation : Equity funds
Geographic allocation : Global funds
Quantitative analysis : HISTORICAL RETURNS ANALYSIS
Managersmust show outstanding statistics :Stick to their management styleAnnual returns and quartile
Comparison with their benchmarks
Qualitative analyse :SELECTION PROCESS ANALYSIS
Must be the same that allowed the manager to obtain his excellent results in the past.
Meeting with the managers andtheir teams on their
workplaces
Rule # 6

Services Financiers Whitemont inc. - Financial Services Firm 9 / 23
Historical "riskrate of return" relationship
Dex Universe Bond Index vs S&P / TSX since 1956
20 years period : 100% Equity10 years period : 65% Equity & 35% Bonds
1 year period : 20% Equity & 80% Bonds 5 years period : 40% Equity & 60% Bonds
8.20%8.40%
8.60%8.80%9.00%
9.20%9.40%9.60%
9.80%10.00%
3.50% 4.00% 4.50% 5.00% 5.50% 6.00%
Risk (Standard Deviation)
Ret
urn
37 % Equity63 % Bonds
100 % equity
100 % Bonds8.00%
8.50%
9.00%
9.50%
10.00%
10.50%
11.00%
8.00% 10.00% 12.00% 14.00% 16.00% 18.00%
Risk (Standard Deviation)
Ret
urn
22 % Equity78 % Bonds
100 % equity
100 % Bonds
8.40%
8.60%
8.80%
9.00%
9.20%
9.40%
9.60%
9.80%
10.00%
2.75% 2.95% 3.15% 3.35% 3.55% 3.75% 3.95%
Risk (Standard Deviation)
Ret
urn
64 % Equity36 % Bonds
100 % Equity
100 % Bonds
9.20%9.30%9.40%9.50%9.60%9.70%9.80%9.90%
10.00%10.10%10.20%10.30%
1.45% 1.65% 1.85% 2.05% 2.25% 2.45% 2.65%
Risk (Standard Deviation)
Ret
urn
91 % Equity9 % Bonds
100 % Equity
100 % Bonds
Rule # 7

Services Financiers Whitemont inc. - Financial Services Firm 10 / 23
TIME AND VOLATILITY
Source : Templeton Management Ltd 1954‐2013 Fonds Balise : Templeton Growth. All returns shown are annually compounded.
5 years 10 years 25 years1 year$10 000 invested over :
78.94 %
19.03 %
34.03 %24.97 %
1.95%
5.01%
6.88%34.94 %
0 %
15 %
Best period $17 894 $43 248 $92 929 $778 815Worst period $6 506 $7 002 $8 210 $33 939
Rule # 7 Minimize the risk on return ratio based on the investment horizon

Services Financiers Whitemont inc. - Financial Services Firm 11 / 23
MSCI World Price Index US $January 1st, 1972 to June 30th, 2013
Past returns are not indicative of the future.
Stratégie : " Acheter et conserver "(Ne pas tenter de prédire le marché)
Rule # 11 Used strategy : "Buy & Hold" (Do not try to predict the markets)
Investment period Average annual return
Initial investment of $10 000
Always invested 6.52% 137 505$ Less the 10 best days 4.97% 74 584$ Less the 20 best days 3.95% 49 685$ Less the 30 best days 3.16% 36 325$ Less the 40 best days 2.44% 27 144$ Less the 50 best days 1.76% 20 548$ Less the 60 best days 1.11% 15 800$

Services Financiers Whitemont inc. - Financial Services Firm 12 / 23
Selected Value Portfolio Managers
* Bill Kanko took a year off in 2005 to start his own management firm.Past results are not indicative of the future ;Performances shown above were obtained by the portfolio managers and not necessarily by the associated mutual fund.
Manager Annually comp.
2015 (mar. 31 st )
2014 2013 2012 2011 2010 2009 2008 2007 2006 2005 2004 2003 2002 2001 2000 1999 1998 1997 1996 1995 1994 1993 FundsCundill
Investments 9.03% 2.3% 2.2% 34.5% 15.4% -15.8% 9.9% 15.1% -25.1% -1.7% 9.7% 12.5% 12.4% 35.2% -13.8% 13.1% 20.4% 33.4% -10.7% 3.5% 10.8% 8.2% 15.4% 43.1% MFC Cundill Value
Edgepoint 18.54% 12.4% 18.7% 44.5% 11.3% -2.5% 8.0% 28.2% n/a n/a n/a n/a n/a n/a n/a n/a n/a n/a n/a n/a n/a n/a n/a n/a Edgepoint Global Port.
Templeton 9.88% 5.6% 6.0% 28.0% 12.6% -3.4% 7.7% 13.9% -26.3% 3.8% 18.9% 12.0% 11.0% 7.8% -11.0% 2.9% 13.2% 21.5% 0.0% 24.0% 23.7% 25.5% 5.1% 36.8% Mutual Discovery
Bill Kanko * 9.76% 13.6% 3.2% 41.1% 20.0% -14.8% 12.2% 23.2% -20.4% -9.4% 9.9% n/a 5.0% 7.1% -6.3% 9.9% 10.7% 13.2% 17.7% 27.2% 9.5% 13.6% 13.5% 27.3% CI Black Creek Global Leaders
Ivy 8.92% 9.7% 8.3% 31.0% 7.8% -1.4% 8.5% 18.0% -6.7% -4.2% 16.0% 3.2% 3.9% -3.7% -2.2% 4.7% 16.7% 4.2% 17.7% 23.2% 15.0% 16.4% 11.3% 9.9% MFC Ivy Foreign Equity
Average 9.98% 8.7% 7.7% 35.8% 13.4% -7.6% 9.3% 19.7% -19.6% -2.9% 13.6% 9.2% 8.1% 11.6% -8.3% 7.6% 15.2% 18.1% 6.2% 19.5% 14.8% 15.9% 11.3% 29.3%
MSCI World Index 8.09% 11.6% 14.6% 36.2% 13.7% -2.9% 6.5% 12.9% -26.9% -6.7% 20.7% 6.6% 7.3% 9.4% -20.2% -11.5% -9.9% 18.4% 34.0% 21.4% 14.6% 18.0% 11.9% 27.7%

Services Financiers Whitemont inc. - Financial Services Firm 13 / 23
Whitemont Financial Services
Our objective is that our portfolios outperform their respective benchmark.
MSCI World IndexThis global index is the benchmark we compare our performance in equities. Since its creation in 1969, this index obtained an annual compound rate of return of :
Source : Morgan Stanley Capital, 31‐03‐2015
10.08 %
MSCI World Total Return Can $
10
100
1000
10000
1970
1972
1974
1976
1978
1980
1982
1984
1986
1988
1990
1992
1994
1996
1998
2000
2002
2004
2006
2008
2010
2012
2014
Services Financiers Whitemont inc. - Financial Services Firm 14 / 23
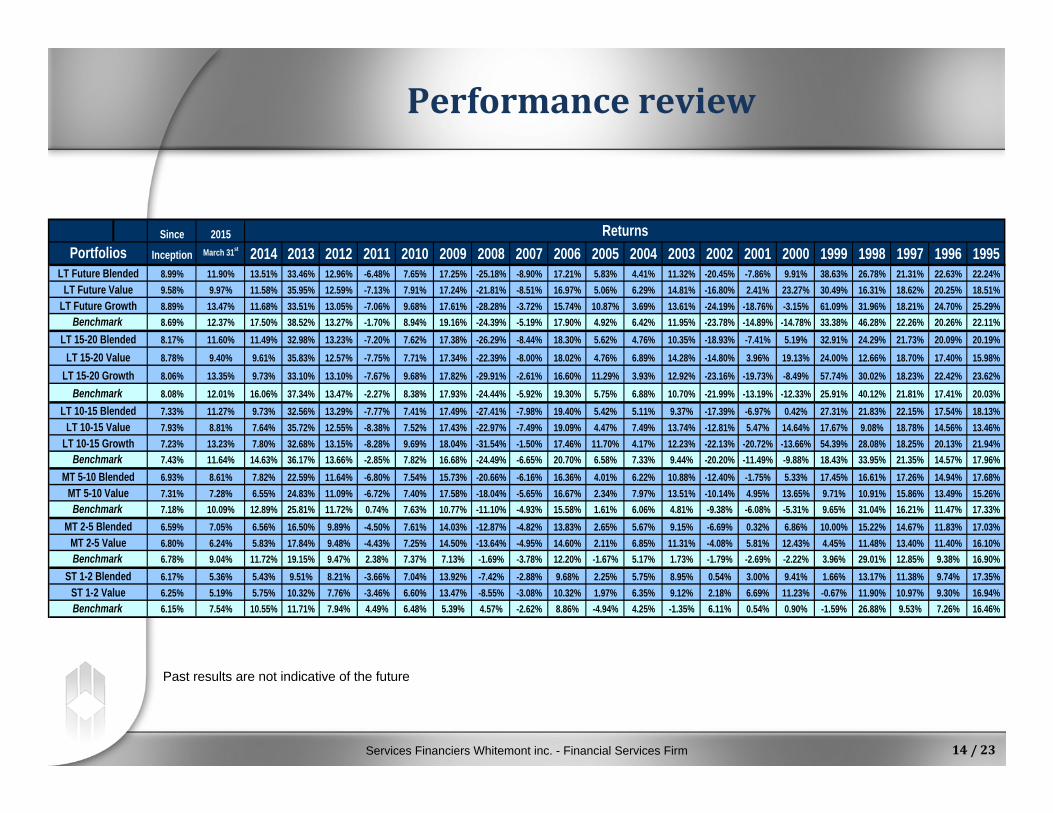
Performance review
Past results are not indicative of the future
Since 2015
Inception March 31st 2014 2013 2012 2011 2010 2009 2008 2007 2006 2005 2004 2003 2002 2001 2000 1999 1998 1997 1996 19958.99% 11.90% 13.51% 33.46% 12.96% -6.48% 7.65% 17.25% -25.18% -8.90% 17.21% 5.83% 4.41% 11.32% -20.45% -7.86% 9.91% 38.63% 26.78% 21.31% 22.63% 22.24%9.58% 9.97% 11.58% 35.95% 12.59% -7.13% 7.91% 17.24% -21.81% -8.51% 16.97% 5.06% 6.29% 14.81% -16.80% 2.41% 23.27% 30.49% 16.31% 18.62% 20.25% 18.51%8.89% 13.47% 11.68% 33.51% 13.05% -7.06% 9.68% 17.61% -28.28% -3.72% 15.74% 10.87% 3.69% 13.61% -24.19% -18.76% -3.15% 61.09% 31.96% 18.21% 24.70% 25.29%8.69% 12.37% 17.50% 38.52% 13.27% -1.70% 8.94% 19.16% -24.39% -5.19% 17.90% 4.92% 6.42% 11.95% -23.78% -14.89% -14.78% 33.38% 46.28% 22.26% 20.26% 22.11%8.17% 11.60% 11.49% 32.98% 13.23% -7.20% 7.62% 17.38% -26.29% -8.44% 18.30% 5.62% 4.76% 10.35% -18.93% -7.41% 5.19% 32.91% 24.29% 21.73% 20.09% 20.19%
8.78% 9.40% 9.61% 35.83% 12.57% -7.75% 7.71% 17.34% -22.39% -8.00% 18.02% 4.76% 6.89% 14.28% -14.80% 3.96% 19.13% 24.00% 12.66% 18.70% 17.40% 15.98%
8.06% 13.35% 9.73% 33.10% 13.10% -7.67% 9.68% 17.82% -29.91% -2.61% 16.60% 11.29% 3.93% 12.92% -23.16% -19.73% -8.49% 57.74% 30.02% 18.23% 22.42% 23.62%8.08% 12.01% 16.06% 37.34% 13.47% -2.27% 8.38% 17.93% -24.44% -5.92% 19.30% 5.75% 6.88% 10.70% -21.99% -13.19% -12.33% 25.91% 40.12% 21.81% 17.41% 20.03%7.33% 11.27% 9.73% 32.56% 13.29% -7.77% 7.41% 17.49% -27.41% -7.98% 19.40% 5.42% 5.11% 9.37% -17.39% -6.97% 0.42% 27.31% 21.83% 22.15% 17.54% 18.13%7.93% 8.81% 7.64% 35.72% 12.55% -8.38% 7.52% 17.43% -22.97% -7.49% 19.09% 4.47% 7.49% 13.74% -12.81% 5.47% 14.64% 17.67% 9.08% 18.78% 14.56% 13.46%7.23% 13.23% 7.80% 32.68% 13.15% -8.28% 9.69% 18.04% -31.54% -1.50% 17.46% 11.70% 4.17% 12.23% -22.13% -20.72% -13.66% 54.39% 28.08% 18.25% 20.13% 21.94%7.43% 11.64% 14.63% 36.17% 13.66% -2.85% 7.82% 16.68% -24.49% -6.65% 20.70% 6.58% 7.33% 9.44% -20.20% -11.49% -9.88% 18.43% 33.95% 21.35% 14.57% 17.96%6.93% 8.61% 7.82% 22.59% 11.64% -6.80% 7.54% 15.73% -20.66% -6.16% 16.36% 4.01% 6.22% 10.88% -12.40% -1.75% 5.33% 17.45% 16.61% 17.26% 14.94% 17.68%7.31% 7.28% 6.55% 24.83% 11.09% -6.72% 7.40% 17.58% -18.04% -5.65% 16.67% 2.34% 7.97% 13.51% -10.14% 4.95% 13.65% 9.71% 10.91% 15.86% 13.49% 15.26%7.18% 10.09% 12.89% 25.81% 11.72% 0.74% 7.63% 10.77% -11.10% -4.93% 15.58% 1.61% 6.06% 4.81% -9.38% -6.08% -5.31% 9.65% 31.04% 16.21% 11.47% 17.33%6.59% 7.05% 6.56% 16.50% 9.89% -4.50% 7.61% 14.03% -12.87% -4.82% 13.83% 2.65% 5.67% 9.15% -6.69% 0.32% 6.86% 10.00% 15.22% 14.67% 11.83% 17.03%6.80% 6.24% 5.83% 17.84% 9.48% -4.43% 7.25% 14.50% -13.64% -4.95% 14.60% 2.11% 6.85% 11.31% -4.08% 5.81% 12.43% 4.45% 11.48% 13.40% 11.40% 16.10%6.78% 9.04% 11.72% 19.15% 9.47% 2.38% 7.37% 7.13% -1.69% -3.78% 12.20% -1.67% 5.17% 1.73% -1.79% -2.69% -2.22% 3.96% 29.01% 12.85% 9.38% 16.90%6.17% 5.36% 5.43% 9.51% 8.21% -3.66% 7.04% 13.92% -7.42% -2.88% 9.68% 2.25% 5.75% 8.95% 0.54% 3.00% 9.41% 1.66% 13.17% 11.38% 9.74% 17.35%6.25% 5.19% 5.75% 10.32% 7.76% -3.46% 6.60% 13.47% -8.55% -3.08% 10.32% 1.97% 6.35% 9.12% 2.18% 6.69% 11.23% -0.67% 11.90% 10.97% 9.30% 16.94%6.15% 7.54% 10.55% 11.71% 7.94% 4.49% 6.48% 5.39% 4.57% -2.62% 8.86% -4.94% 4.25% -1.35% 6.11% 0.54% 0.90% -1.59% 26.88% 9.53% 7.26% 16.46%
Returns
ST 1-2 Blended
MT 5-10 BlendedMT 5-10 Value
Benchmark
LT Future GrowthBenchmark
LT 15-20 Blended
LT 10-15 GrowthLT 10-15 Value
ST 1-2 ValueBenchmark
BenchmarkMT 2-5 Blended
MT 2-5 ValueBenchmark
LT 15-20 GrowthBenchmark
LT 10-15 Blended
PortfoliosLT Future Blended
LT Future Value
LT 15-20 Value

Services Financiers Whitemont inc. - Financial Services Firm 15 / 23
Financial Planning

Services Financiers Whitemont inc. - Financial Services Firm 16 / 23
Working method
1st step : Calculate the rate of return needed to reach you retirement goals
2nd step : Investment analysis & portfolio recommendations
3rd step : Operational research
4th step : Financial protection
5th step : Mortgage loans

Services Financiers Whitemont inc. - Financial Services Firm 17 / 23
Financial projections
We calculate the rate of return needed to reach you retirement goals ;
This step is important as it will tell us if you need to save more for retirement or not, the level of risk needed in your investment portfolio or even if you need to delay the time of retirement.
Step 1

Services Financiers Whitemont inc. - Financial Services Firm 18 / 23
Investments
Strenghts and weaknesses of your actual portfolio ;
Portfolio recommendation based on your investor profile and yourretirement goals.
Step 2

Services Financiers Whitemont inc. - Financial Services Firm 19 / 23
Operational research
Recommendations on how to improve your retirement scenario ;
Debt management ;
Tax efficiency ;
Concepts and programs available : RRSP, TFSA, RESP, HBP, etc… ;
Step 3

Services Financiers Whitemont inc. - Financial Services Firm 20 / 23
Financial protectionStep 4
Insurance needs analysis ;
Analysis of your existing policies ;
Recommendations based on your needs and budget ;
We use a software allowing us to compare the insurance cost of all the insurance companies available in Canada as you can see in this table :
We look for the best product at the best price :

Services Financiers Whitemont inc. - Financial Services Firm 21 / 23
Mortgage loans
Analysis of your mortgage loan ;
Analysis of your mortgage insurance (if any) ;
In this case, we would advise to change financial institution, even if there is a $ 3 000 penalty fee since the mortgage balance would be $492 lower with the new loan at the end of the actual loan (3 years).
Step 5
Example of our expertise :
Actually Replacing loan
Mortgage balance $140 000 $143 000Interest rate 3.50% 2.49%Monthly payment $780 $780Renewal date In 3 years In 3 yearsPenalty fee if paid before 3 years $3 000 n/aMortgage balance in 3 years $125 808 $125 316

Services Financiers Whitemont inc. - Financial Services Firm 22 / 23
Conclusion
Proven results over 15 years
Conservative approach based on a long term relationship
Unmatched service relying on integrated financial planning
Independence without any conflict of interest
Do not hesitate to contact me for any questions you might have :
Mr. Denis Pap(514) 3931790 # 438
Services Financiers Whitemont inc. - Financial Services Firm 23 / 23
The information presented in this document is based on various hypothesis and laws and is presented merely for purposes of illustration.
Although this document has been composed with the greatest care, nothing guarantees the accuracy nor the applicability of all the particular cases.
Although this document has been written in accordance with the laws currently in place, nothing guarantees our interpretation of present laws and/or that of new legal constraints that might be adopted, which could affect the information presented in this document. We advise that you consult a tax specialist before you carry out a transaction as far as an insurance contract is concerned, in order to confirm the legal and fiscal impacts.
The examples presented in this presentation are fictitious.
Insurance contracts provide important information about the products that are presented in this document. It is very important to read these contracts before accepting them.
Net asset value per share and returns made on investments fluctuate. It is important to remind oneself that past performance is not necessarily indicative of future performance.
You will find important information on the mutual funds described in their simplified prospectuses. To obtain a copy, please contact your representative. It is of primary importance to read them before investing.
The rates of return indicated constitute the total real annual compound rates of return taking into consideration the variations in share value and assume reinvestment of all dividends, but do not take into account sales, redemptions or optional charges payable to the shareholder, which may reduce the rates of returns.
An investment loan creates a leverage effect that magnifies the possibility of loss or gain.
The financial situation of the client must permit him to reimburse the interest on the loan and to reimburse a portion of the capital in the case of a margin call.
Warnings