WHITE-TAILED DEER - IDFG Research - Idaho Hayden, David Spicer ... (rut, winter range) can ......
71
IDAHO DEPARTMENT OF FISH AND GAME Steven M Huffaker, Director Project W-170-R-25 Progress Report WHITE-TAILED DEER Study I, Job 3 Prepared By: Jim Hayden, David Spicer ...................................................................... Panhandle Region Jay Crenshaw, Jim White....................................................................... Clearwater Region July 1, 2000 to June 30, 2001 April 2002 Boise, Idaho
Transcript of WHITE-TAILED DEER - IDFG Research - Idaho Hayden, David Spicer ... (rut, winter range) can ......

IDAHO DEPARTMENT OF FISH AND GAME
Steven M Huffaker, Director
Project W-170-R-25
Progress Report
WHITE-TAILED DEER
Study I, Job 3 Prepared By: Jim Hayden, David Spicer ...................................................................... Panhandle Region
Jay Crenshaw, Jim White ....................................................................... Clearwater Region
July 1, 2000 to June 30, 2001
April 2002
Boise, Idaho
Findings in this report are preliminary in nature and not for publication without permission of the Director of the Idaho Department of Fish and Game. The Idaho Department of Fish and Game adheres to all applicable state and federal laws and regulations related to discrimination on the basis of race, color, national origin, age, gender, or handicap. If you feel you have been discriminated against in any program, activity, or facility of the Idaho Department of Fish and Game, or if you desire further information, please write to: Idaho Department of Fish and Game, PO Box 25, Boise, ID 83707; or the Office of Human Resources, U.S. Fish and Wildlife Service, Department of the Interior, Washington, DC 20240. This publication will be made available in alternative formats upon request. Please contact the Idaho Department of Fish and Game for assistance.
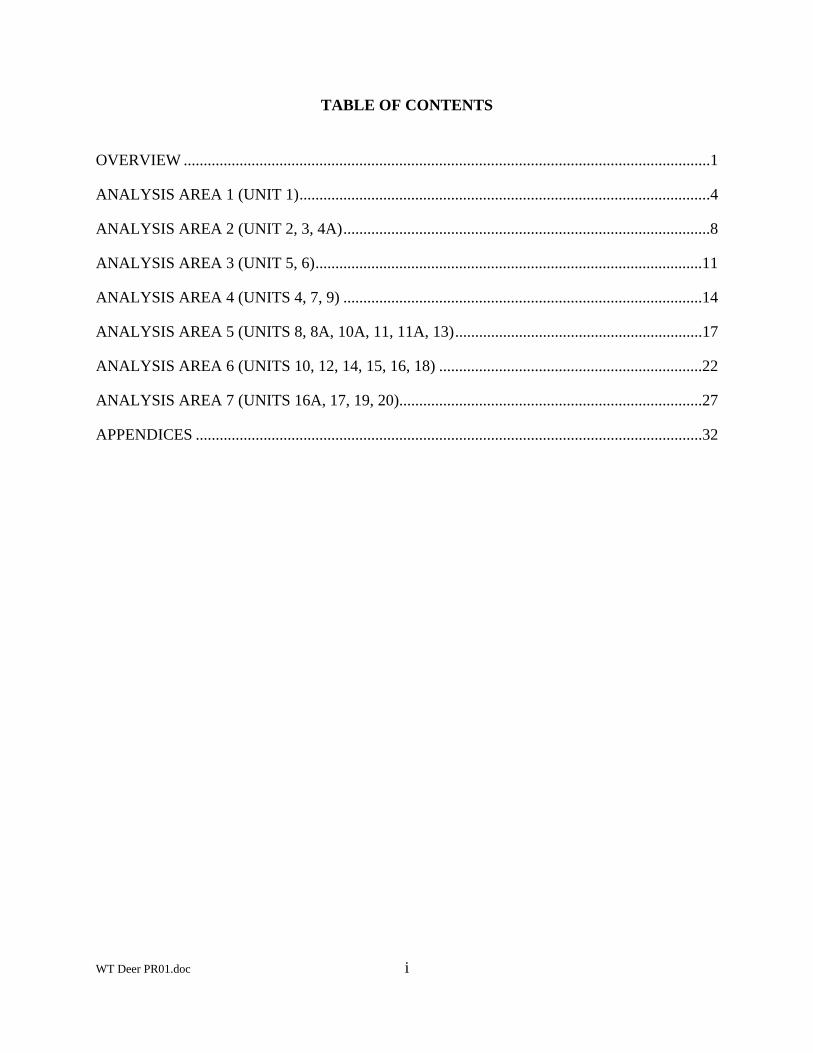
TABLE OF CONTENTS OVERVIEW ....................................................................................................................................1
ANALYSIS AREA 1 (UNIT 1) .......................................................................................................4
ANALYSIS AREA 2 (UNIT 2, 3, 4A) ............................................................................................8
ANALYSIS AREA 3 (UNIT 5, 6) .................................................................................................11
ANALYSIS AREA 4 (UNITS 4, 7, 9) ..........................................................................................14
ANALYSIS AREA 5 (UNITS 8, 8A, 10A, 11, 11A, 13) ..............................................................17
ANALYSIS AREA 6 (UNITS 10, 12, 14, 15, 16, 18) ..................................................................22
ANALYSIS AREA 7 (UNITS 16A, 17, 19, 20)............................................................................27
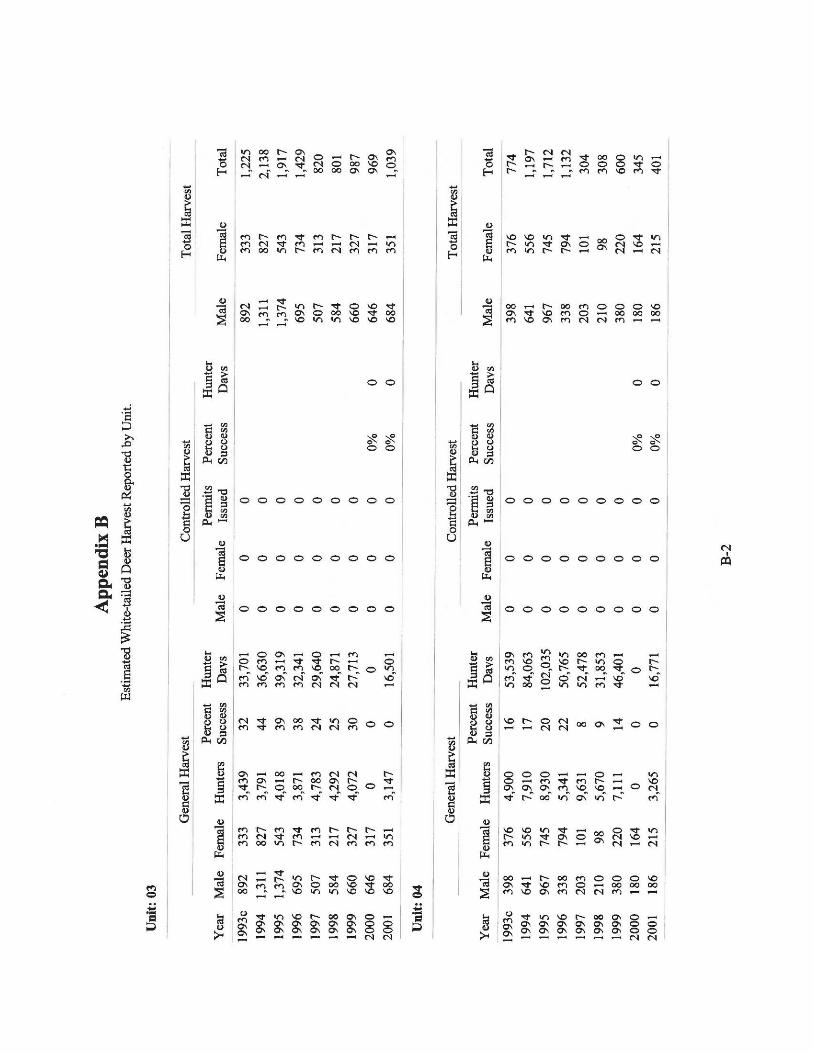
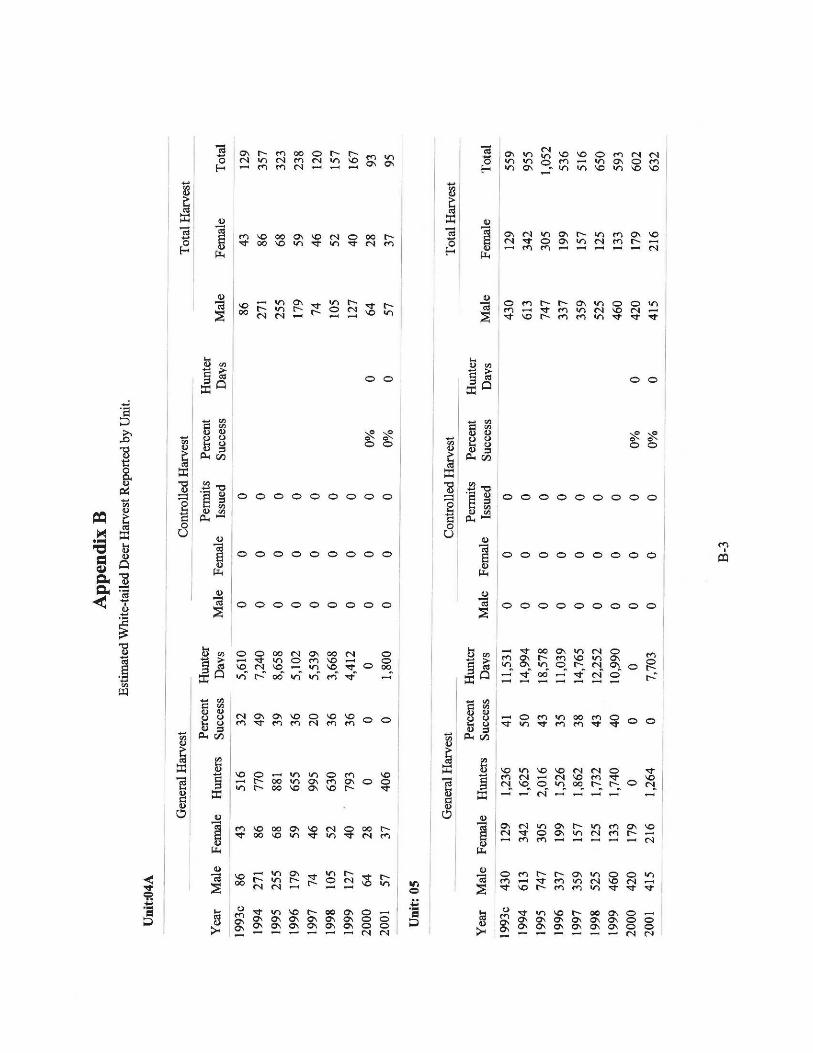
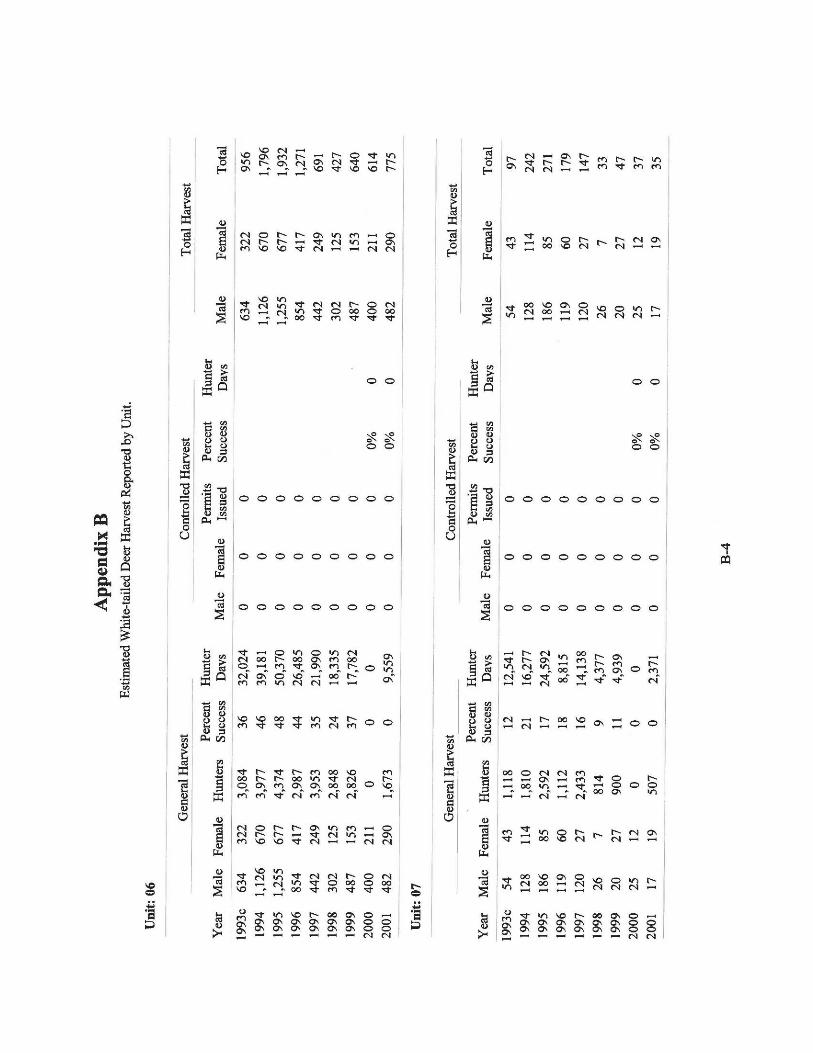
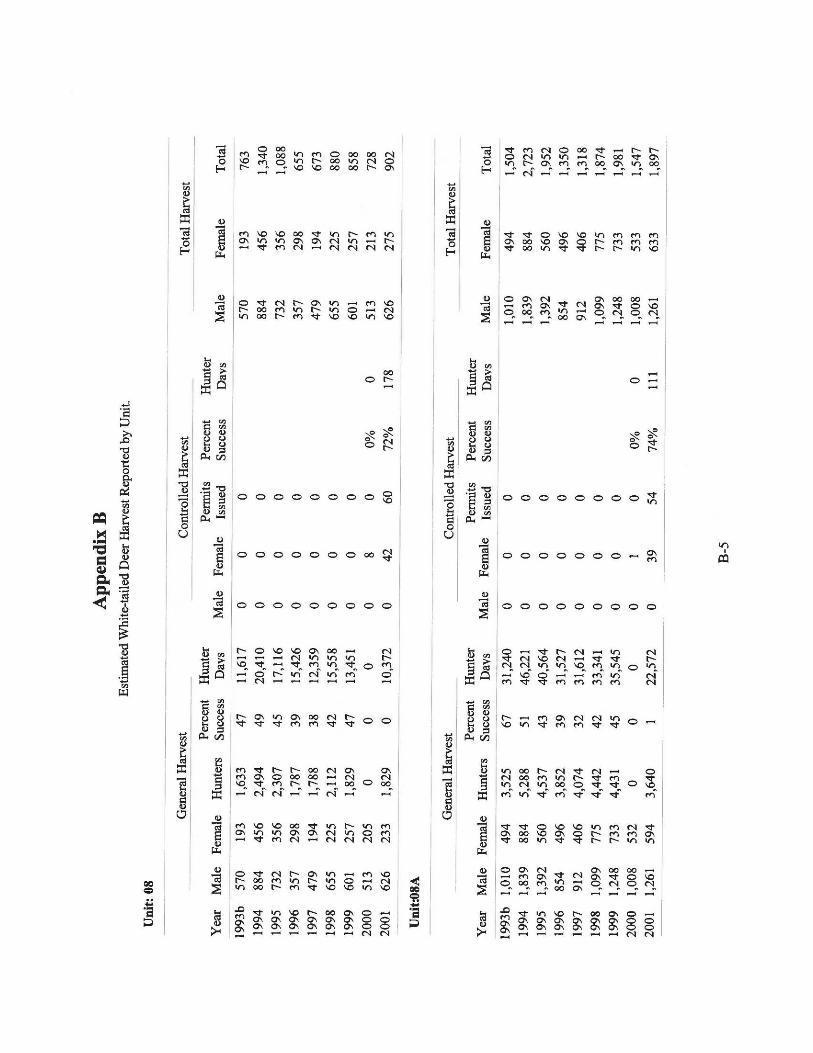
APPENDICES ...............................................................................................................................32
WT Deer PR01.doc i

PROGRESS REPORT SURVEYS AND INVENTORIES
STATE: Idaho JOB TITLE: White-tailed Deer Surveys PROJECT: W-170-R-25 and Inventories SUBPROJECT: 1-7 STUDY NAME: Big Game Population Status, STUDY: I Trends, Utilization, and JOB: 3 Associated Habitat Studies PERIOD COVERED: July 1, 2000 to June 30, 2001
WHITE-TAILED DEER
OVERVIEW
White-tailed deer are found primarily in the 10 northern counties of Idaho. This area corresponds roughly to that portion of the state north of the Salmon River and encompasses the Idaho Department of Fish and Game’s administrative Panhandle and Clearwater Regions. A few small, localized populations are found throughout the remainder of the state. This plan establishes criteria and objectives for white-tailed deer populations in north-central and northern Idaho. Management efforts in the remainder of the state will be incidental to mule deer. Whitetails are primarily browsers. The fall and winter diets consist primarily of shrubs and evergreens. Western redcedar and western yew are often utilized. Preferred shrubs include red-osier dogwood, red-stem ceanothus, serviceberry, maple, and chokecherry. The spring and summer diets consist largely of grasses and forbs, or agricultural crops if available. Winter conditions in northern Idaho can be severe, especially in the Clearwater Region. Snow depths reach 3 feet on low elevation winter ranges, restricting whitetails to closed canopy timber stands where they are forced to concentrate in "deer yards" under mature forest canopies. In the best whitetail habitats, the major limiting factor on population growth appears to be the severity of the winter. Due to their secretive behavior and ability to use dense cover for concealment, white-tailed deer often live close to human habitation. Consequently, whitetails may suffer a higher mortality rate from poaching, free-ranging dogs, and vehicle collisions than other big game species in Idaho. White-tailed deer frequently inflict damage on vegetable gardens, orchards, nurseries, and field crops. Depredation control is, therefore, an important aspect of Idaho's white-tailed deer management program.
1
The effect of harvest mortality is highly variable in white-tailed deer. Generally, the majority of the annual mortality is not hunter-harvest related. Factors such as predation, malnourishment over winter, accidents, and disease are responsible for the majority of deaths in whitetail populations. Therefore, population response tends to be independent of harvest. Exceptions to WT Deer PR01.doc
this rule include extremely liberal antlerless opportunity designed to reduce populations and effects of hunter harvest on buck age structure. Hunting seasons designed to offer much more opportunity for antlered deer than antlerless deer or during periods when bucks are vulnerable (rut, winter range) can reduce the proportion of bucks and particularly older bucks in the population. Throughout much of Idaho, white-tailed deer habitat provides high amounts of security cover; thus, the effects of harvest tend to be extremely limited. Proper harvest management for white-tailed deer, given their relative independence to harvest effects, is to adequately monitor populations annually and be responsive to population changes. Liberal seasons can be applied during most periods and conservative seasons applied when environmental factors are limiting population growth. Because of their secretive behavior and habitats used, management information on white-tailed deer is difficult to collect. Consequently, no population estimates are provided in this plan. Some limited aerial survey data have been collected periodically, but how that information relates to actual population size and herd composition cannot be determined at the present time. Other data collection efforts have included tabulating numbers of harvested animals and collection of antler point and spread data at check stations, jaw collections for age analyses, obtaining reproductive information from road-killed does, determining habitat use and mortality rates, and the telephone harvest survey.
0
5000
10000
15000
20000
25000
30000
1978 1981 1984 1987 1990 1993 1996 1999
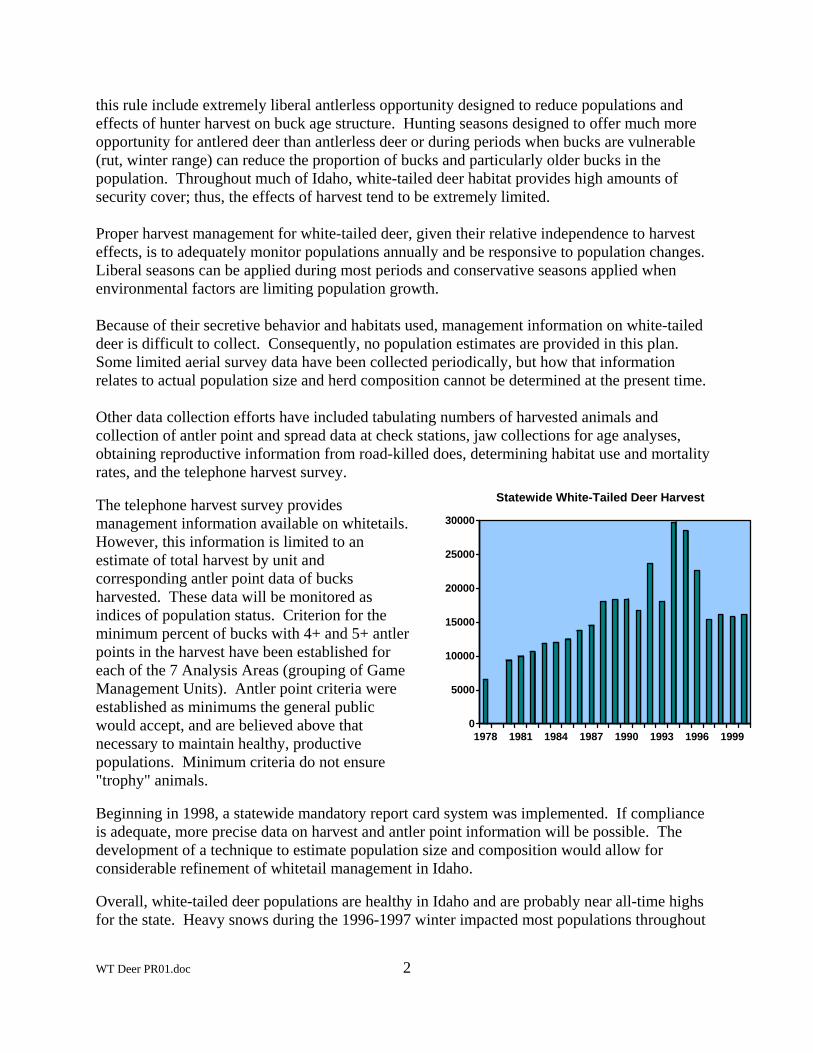
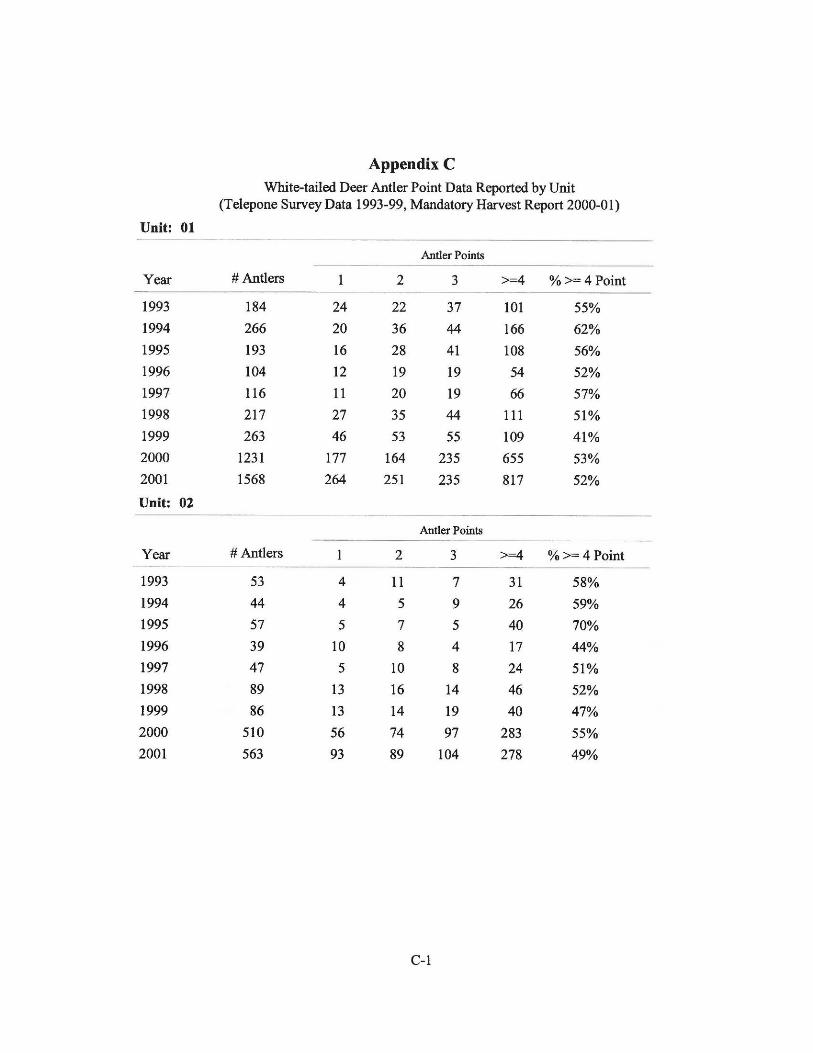
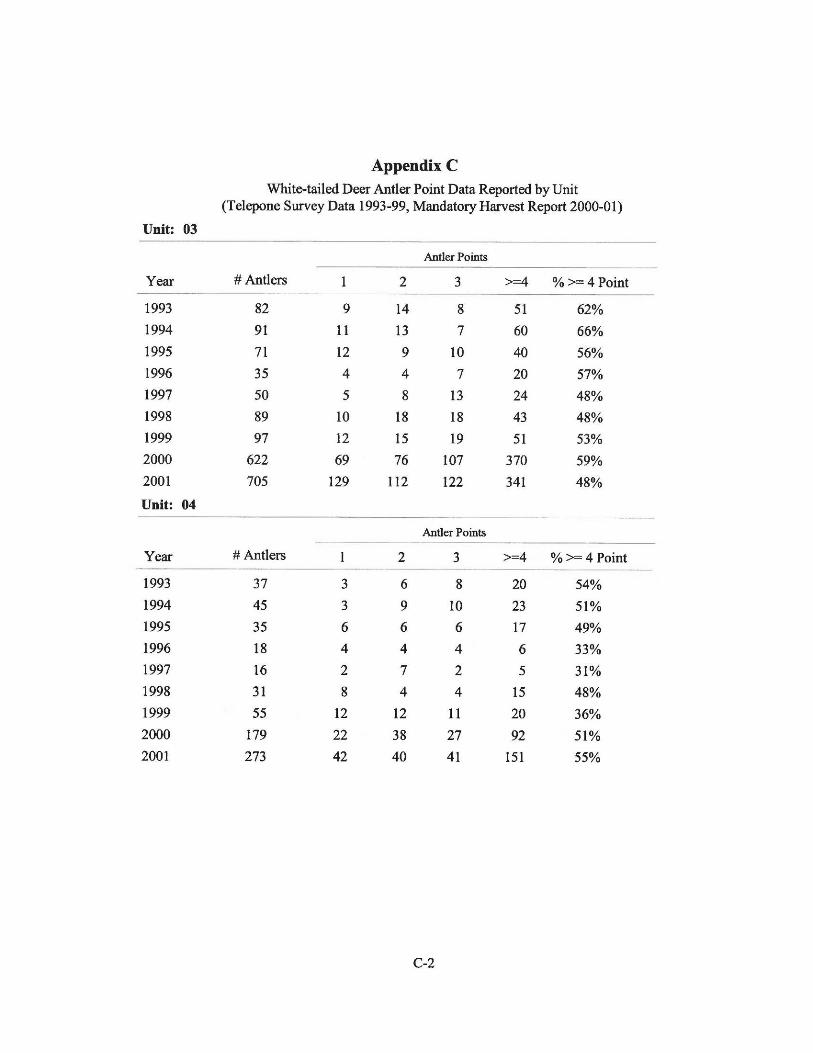
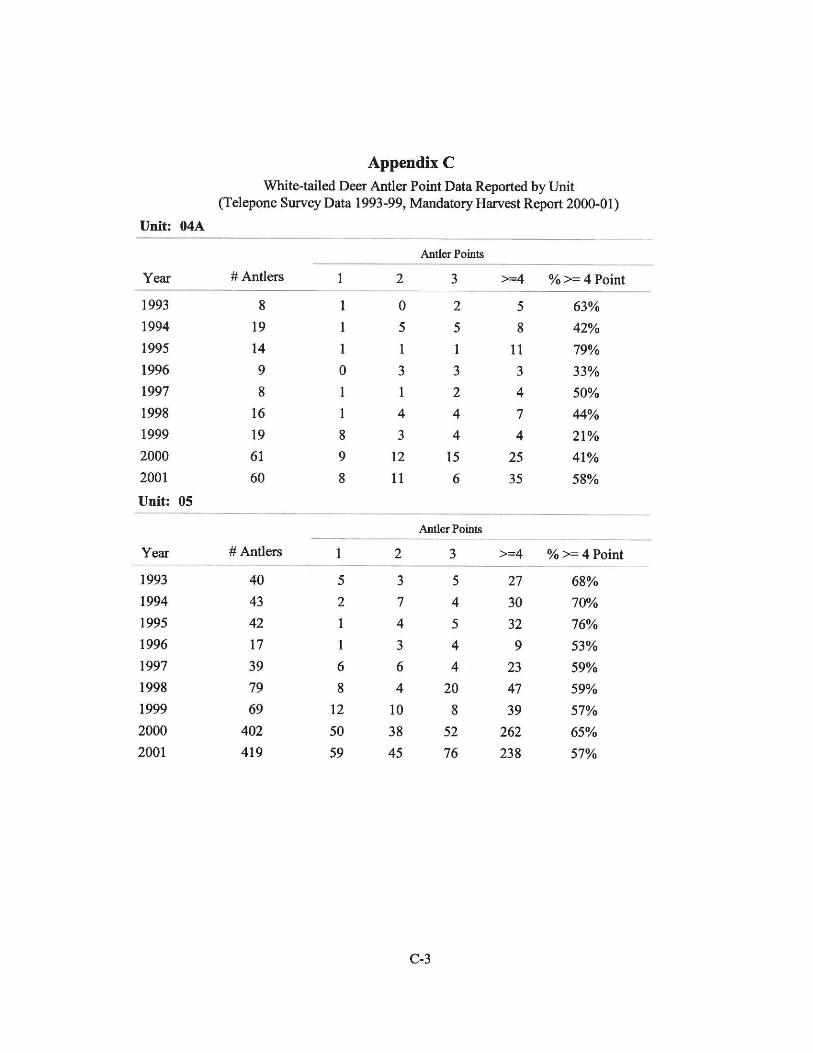
Statewide White-Tailed Deer HarvestThe telephone harvest survey provides management information available on whitetails. However, this information is limited to an estimate of total harvest by unit and corresponding antler point data of bucks harvested. These data will be monitored as indices of population status. Criterion for the minimum percent of bucks with 4+ and 5+ antler points in the harvest have been established for each of the 7 Analysis Areas (grouping of Game Management Units). Antler point criteria were established as minimums the general public would accept, and are believed above that necessary to maintain healthy, productive populations. Minimum criteria do not ensure "trophy" animals. Beginning in 1998, a statewide mandatory report card system was implemented. If compliance is adequate, more precise data on harvest and antler point information will be possible. The development of a technique to estimate population size and composition would allow for considerable refinement of whitetail management in Idaho. Overall, white-tailed deer populations are healthy in Idaho and are probably near all-time highs for the state. Heavy snows during the 1996-1997 winter impacted most populations throughout
WT Deer PR01.doc 2
northern Idaho. Given high quality habitat, populations impacted by the winter should rebound relatively quickly. A differential change in hunting pressure has occurred between south and north Idaho since the early 1990s. While southern Idaho mule deer hunter numbers have remained relatively stable, hunter numbers in north-central and north Idaho have increased. It is unknown whether restrictive mule deer seasons combined with a mule deer population decline in parts of southern Idaho following the 1992-1993 winter has shifted some pressure northward, or a change in human demographics has led to this differential change. Concurrent with the increasing hunter numbers in northern Idaho has been a general decline in both percent 4+ and percent 5+ points in the harvest since 1993. Antler ratio data is not a direct reflection of harvest exploitation because it can be influenced by a broad array of factors including: population changes, changing age structures, differential cohort demographics, hunting season frameworks, and/or harvest exploitation. However, given the increasing hunter numbers and declining antler point count data; the Department will continue to monitor these parameters and recommend appropriate action to ensure that 3-year-average antler point criteria do not fall below minimum.
WT Deer PR01.doc 3
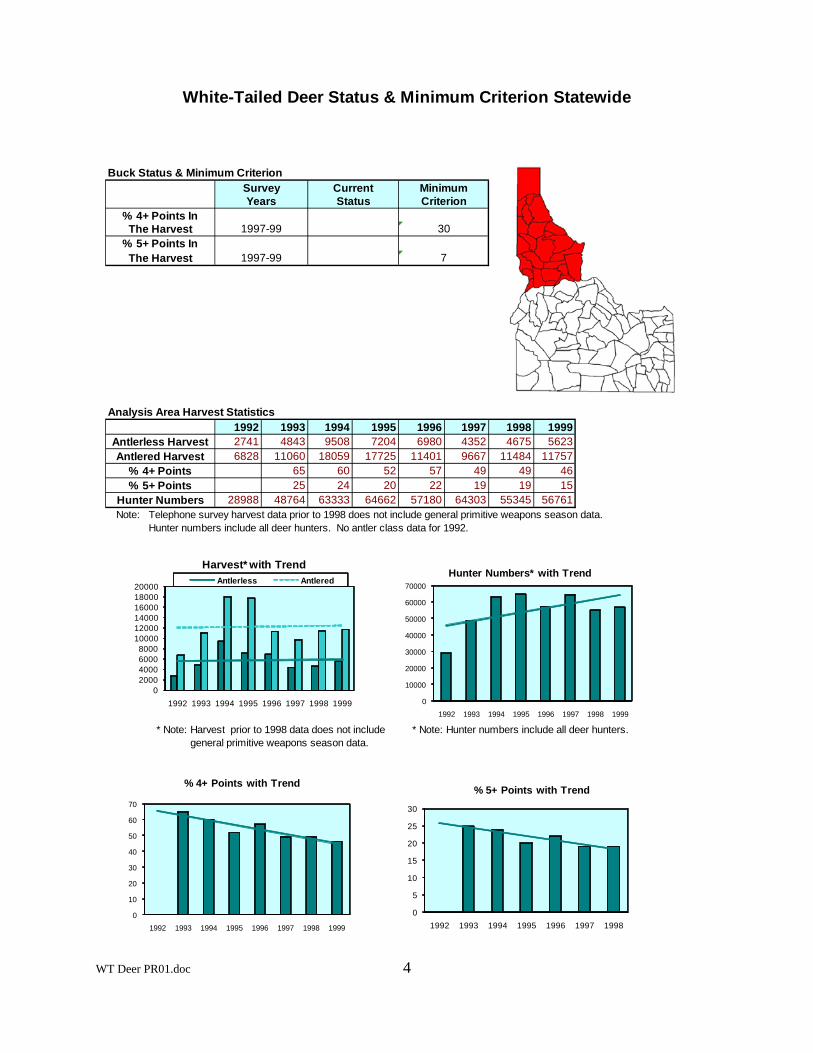
White-Tailed Deer Status & Minimum Criterion Statewide
1992 1993 1994 1995 1996 1997 1998 1999
4
2741 4843 9508 7204 6980 4352 4675 56236828 11060 18059 17725 11401 9667 11484 11757
65 60 52 57 49 49 4625 24 20 22 19 19 15
28988 48764 63333 64662 57180 64303 55345 56761Note: Telephone survey harvest data prior to 1998 does not include general primitive weapons season data.
Hunter numbers include all deer hunters. No antler class data for 1992.
* Note: Harvest prior to 1998 data does not include * Note: Hunter numbers include all deer hunters.general primitive weapons season data.
1997-99
SurveyYears
% 4+ Points In
7
Buck Status & Minimum Criterion
30
Current MinimumCriterionStatus
The Harvest% 5+ Points In
% 5+ PointsHunter Numbers
% 4+ Points
1997-99The Harvest
Antlered Harvest
Analysis Area Harvest Statistics
Antlerless Harvest
02000400060008000
100001200014000160001800020000
1992 1993 1994 1995 1996 1997 1998 1999
Harvest* with Trend
0
10000
20000
30000
40000
50000
60000
70000
1992 1993 1994 1995 1996 1997 1998 1999
Hunter Numbers* with TrendAntlerless Antlered
0
10
20
30
40
50
60
70
1992 1993 1994 1995 1996 1997 1998 1999
% 4+ Points with Trend
0
5
10
15
20
25
30
1992 1993 1994 1995 1996 1997 1998
% 5+ Points with Trend
WT Deer PR01.doc
ANALYSIS AREA 1 (UNIT 1)
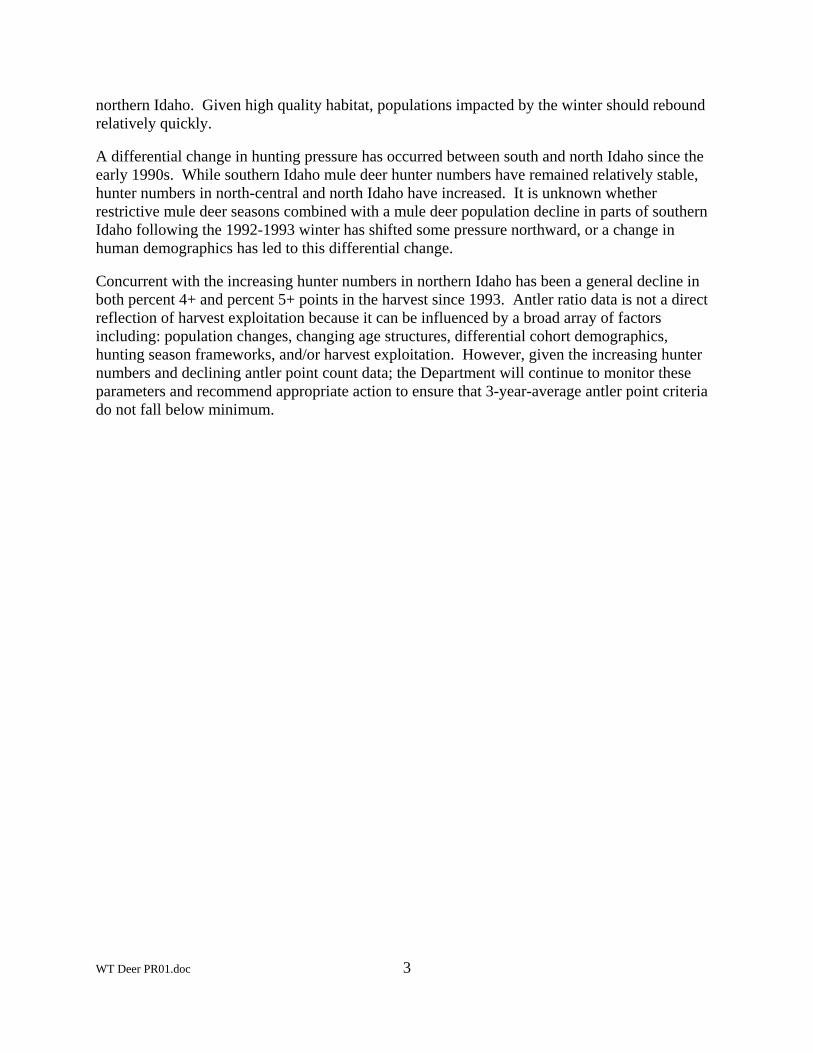
Management Objectives Buck survival will be managed to maintain a minimum of 30% of bucks with four or more antler points per side, and a minimum 7% with five or more antler points per side. Historical Perspective Prior to the 1900s deer were apparently relatively scarce, existing along the rivers and edges of mature conifer stands and within younger stands created by fire, disease, and insects. As mining, logging, and the railroads entered the picture around the turn of the century, deer habitat began to change slowly. The period from 1910 to 1931 included five major fires, each creating hundreds of thousands of acres of younger forests beneficial to white-tailed deer. The newly-created habitat and a major predator control program allowed deer numbers to continue this growth, even through five major die-offs: 1927, 1932, 1946, 1948, and 1949. Concern about "overbrowsed winter ranges" and "too many deer" prompted liberal hunting seasons in an effort to reduce deer numbers in the early 1950s. Long seasons were the rule from 1954 through 1974. By the early 1970s deer numbers had come down substantially from the peak numbers in the 50s and 60s. Hunting seasons were shortened, but no major habitat-creating fires had occurred for over 40 years. Habitat Issues This analysis area can be broadly described as heavily timbered, with very little agricultural land. Habitat security is high, with heavy vegetative cover, and access restrictions through mid-November to protect grizzly bears. Timber harvest in portions of this Analysis Area has improved whitetail summer range. However, research in this area has demonstrated the closed canopies of low-elevation, mature timber is important to deer during severe winters. Loss of this habitat component to logging and development affecting winter range is probably the major habitat issue in the Analysis Area. Grazing is negligible. Biological Issues The management criteria are easily met in this Analysis Area. Research in the Priest River drainage from 1986 through 1995 indicated hunting-related mortality was 7% for does and 18% for bucks. Natural mortality was the major factor influencing total mortality rates of both sexes. In terms of effect, the 1996-1997 winter was probably one of the three or four most severe winters during the last century. Research adjacent to this Analysis Area in Montana indicated 99% of fawns died, as did 26% of adult females. Favorable environmental conditions since the winter of 1996-1997, particularly snow depth on winter range, have allowed substantial recovery of deer populations in this Analysis Area.
WT Deer PR01.doc 5
Interspecific Issues Other wild ungulates within the Analysis Area include mule deer, elk, moose, mountain goats, and woodland caribou. None are believed to be limiting white-tailed deer numbers, and white-tailed deer are not believed to be in competition with any of these species for forage or space. As the most abundant ungulate in the Analysis Area, white-tailed deer do have an indirect influence on other species in the ecosystem. In those years when white-tailed deer numbers change rapidly in response to environmental factors, the resultant effect on predation will be reflected within the population dynamics of alternate prey species. For example, it is hypothesized that whitetail numbers are maintaining enough mountain lions that caribou numbers may be affected. Predation Issues The Priest River research indicated natural causes, primarily predation, were the primary cause of mortality of adult deer. Twenty-three percent of adult males and 10% of adult females died annually to natural mortality, primarily predation. No information is available on the effect on fawn deer, or to the population as a whole. White-tailed deer have the highest intrinsic rate of increase among Idaho's ungulates. Although predation may be a major influence in their population dynamics, predation has not been identified as limiting hunting opportunity for whitetails in northern Idaho. Between 1995 and 1998 mountain lion numbers are believed to have increased substantially, while white-tailed deer numbers dropped substantially due to the severe 1996-1997 winter. It is possible that the influence of predation is greater now than when evaluated during the Priest River study. Winter Feeding Issues The Department has undertaken emergency winter feeding about once every ten to fifteen years in this Analysis Area. The most recent feeding occurred during the 1996-1997 winter, when about 3,000 whitetails were fed at Department-sanctioned sites, primarily in the Bonner's Ferry and Priest River locales. Extrapolating harvest and telemetry data to calculate a crude population estimate of 29,000 deer, it appears approximately 10% of the population in the Analysis Area was fed. Information Requirements Only harvest data are currently available for white-tailed deer management in Analysis Area 1. Success rates and the percentage of females in the harvest are used to index population trend, but the long seasons and variable weather influence makes interpretation difficult. Antler point summaries from harvested bucks index adult buck survival. Given the relatively minor effect of harvest measured on Priest River whitetails, detailed population information is not needed for setting hunting regulations. Better indices of population
WT Deer PR01.doc 6

size (trend) should be developed to better understand changes in harvest information. Development of techniques to monitor recruitment is desirable as well.
WT Deer PR01.doc 7
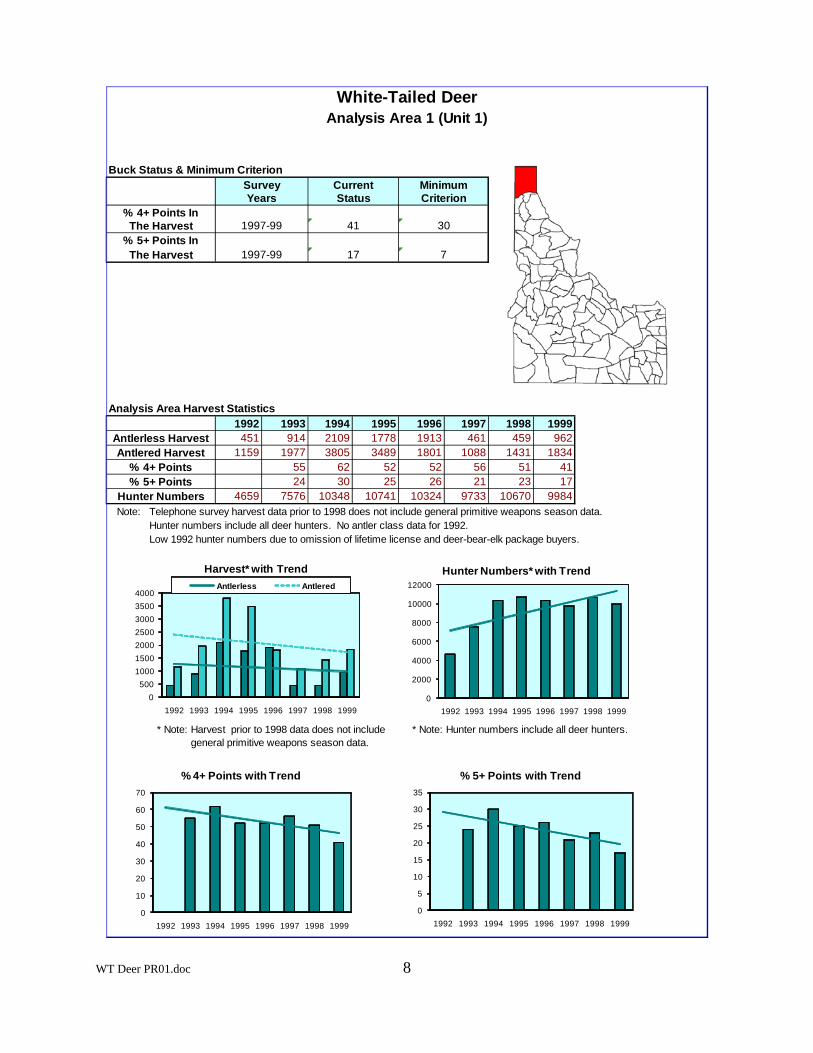
White-Tailed DeerAnalysis Area 1 (Unit 1)
1992 1993 1994 1995 1996 1997 1998 1999
8
451 914 2109 1778 1913 461 459 9621159 1977 3805 3489 1801 1088 1431 1834
55 62 52 52 56 51 4124 30 25 26 21 23 17
4659 7576 10348 10741 10324 9733 10670 9984Note: Telephone survey harvest data prior to 1998 does not include general primitive weapons season data.
Hunter numbers include all deer hunters. No antler class data for 1992.Low 1992 hunter numbers due to omission of lifetime license and deer-bear-elk package buyers.
* Note: Harvest prior to 1998 data does not include * Note: Hunter numbers include all deer hunters.general primitive weapons season data.
% 5+ PointsHunter Numbers
% 4+ Points
1997-99The Harvest
Antlerless HarvestAntlered Harvest
Analysis Area Harvest Statistics
17
Current MinimumCriterionStatus
SurveyYears
% 4+ Points InThe Harvest
% 5+ Points In7
Buck Status & Minimum Criterion
30411997-99
0500
1000150020002500300035004000
1992 1993 1994 1995 1996 1997 1998 1999
Harvest* with Trend
0
2000
4000
6000
8000
10000
12000
1992 1993 1994 1995 1996 1997 1998 1999
Hunter Numbers* with TrendAntlerless Antlered
0
10
20
30
40
50
60
70
1992 1993 1994 1995 1996 1997 1998 1999
% 4+ Points with Trend
0
5
10
15
20
25
30
35
1992 1993 1994 1995 1996 1997 1998 1999
% 5+ Points with Trend
WT Deer PR01.doc
ANALYSIS AREA 2 (UNIT 2, 3, 4A)
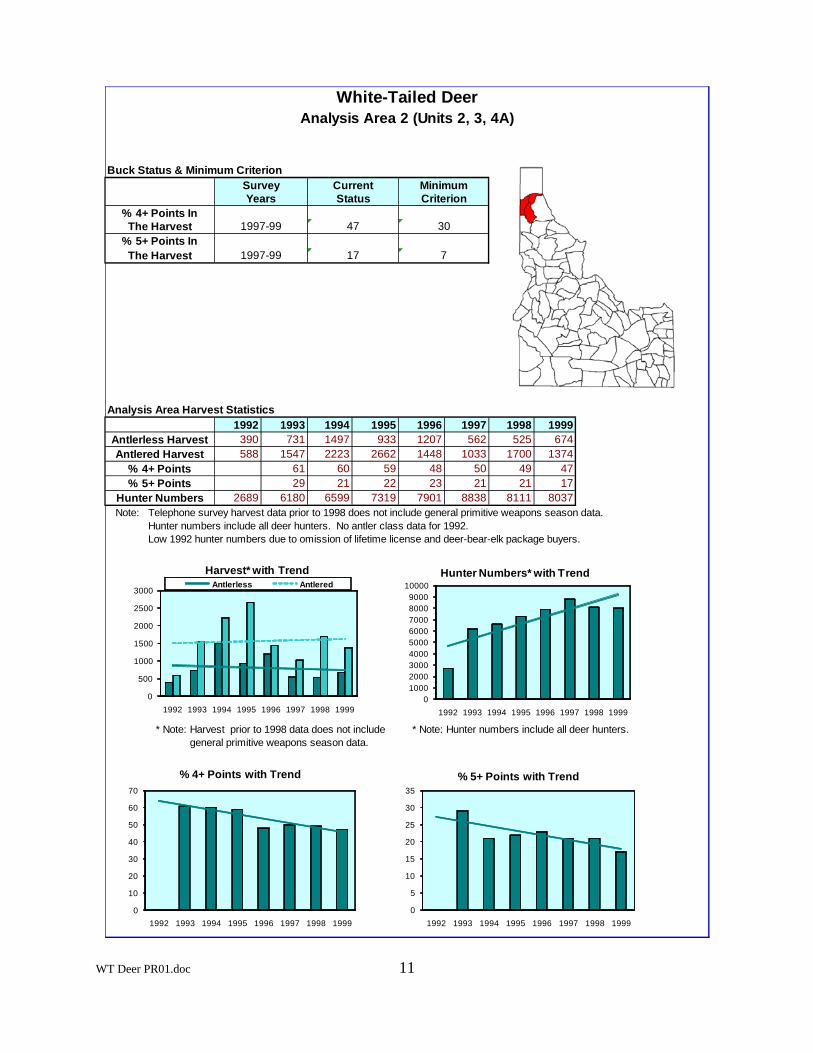
Management Objectives Buck survival will be managed to maintain a minimum of 30% of bucks with four or more antler points per side, and a minimum 7% with five or more antler points per side. Historical Perspective Prior to the 1900s deer were apparently relatively scarce, existing along the rivers and edges of mature conifer stands, and within younger stands created by fire, disease, and insects. As mining, logging, and the railroads entered the picture around the turn of the century, deer habitat began to change slowly. Concern about "overbrowsed winter ranges" and "too many deer" prompted liberal hunting seasons in an effort to reduce deer numbers in the early 1950s. Long seasons were the rule from 1954 through 1974. By the early 1970s deer numbers had come down substantially from the peak numbers in the 1950s and 1960s. Hunting seasons were shortened, but no major habitat-creating fires had occurred for over 40 years. Since shorter seasons began in the mid-1970s, the number of whitetails killed by hunters in the Panhandle rose from 3,000 per year to 10,000 per year. Habitat Issues This analysis area can be broadly described as heavily timbered, with very little agricultural land. Habitat security is good, with heavy vegetative cover. This Analysis Area includes substantial development associated with the Coeur d'Alene area. The primary impact with the one- to ten-acre parcels common in the areas surrounding urban development is the loss of range critical during severe snow accumulations. Timber harvest in portions of this Analysis Area has improved whitetail summer range substantially. Grazing is negligible. Biological Issues The management criteria are easily met in this Analysis Area. As indexed by antler point information from the harvest, buck survival is very good in this Analysis Area despite the human population of the area. Interspecific Issues
9
Other wild ungulates within the Analysis Area include mule deer, elk, and moose. None are believed to be limiting white-tailed deer numbers, and white-tailed deer are not believed to be in competition with any of these species for forage or space. As the most abundant ungulate in the Analysis Area, white-tailed deer do have an indirect influence on other species in the ecosystem. In those years when white-tailed deer numbers change rapidly in response to environmental factors, the resultant effect on predation will be reflected within the population dynamics of alternate prey species. WT Deer PR01.doc
Predation Issues White-tailed deer have the highest intrinsic rate of increase among Idaho's ungulates. Although predation may be a major influence in their population dynamics, predation has not been identified as limiting hunting opportunity for whitetails in northern Idaho. Between 1995 and 1998 mountain lion numbers are believed to have increased substantially, while white-tailed deer numbers dropped substantially due to the severe 1996-1997 winter. Winter Feeding Issues The Department has undertaken emergency winter feeding about once every ten to fifteen years in this Analysis Area. The most recent feeding occurred during the 1996-1997 winter, when about 200 whitetails were fed at Department-sanctioned sites, primarily in the Spirit Lake area. Many private individuals feed small herds of 10 to 20 deer. Information Requirements Only harvest data are currently available for white-tailed deer management in Analysis Area 2. Success rates and the percentage of females in the harvest are used to index population trend, but the long seasons and variable weather influence makes interpretation difficult. Antler point summaries from harvested bucks index adult buck survival. Given the relatively minor effect of harvest measured in adjacent Analysis Area 1 whitetails, and similar buck survival (as indexed by antler point data), detailed population information is not needed for setting hunting regulations. Better indices of population size (trend) should be developed to better understand changes in harvest information. Development of techniques to monitor recruitment is desirable as well.
WT Deer PR01.doc 10
White-Tailed DeerAnalysis Area 2 (Units 2, 3, 4A)
1992 1993 1994 1995 1996 1997 1998 1999
11
390 731 1497 933 1207 562 525 674588 1547 2223 2662 1448 1033 1700 1374
61 60 59 48 50 49 4729 21 22 23 21 21 17
2689 6180 6599 7319 7901 8838 8111 8037Note: Telephone survey harvest data prior to 1998 does not include general primitive weapons season data.
Hunter numbers include all deer hunters. No antler class data for 1992.Low 1992 hunter numbers due to omission of lifetime license and deer-bear-elk package buyers.
* Note: Harvest prior to 1998 data does not include * Note: Hunter numbers include all deer hunters.general primitive weapons season data.
1997-99
SurveyYears
% 4+ Points In
7
Buck Status & Minimum Criterion
3047
Current MinimumCriterionStatus
The Harvest% 5+ Points In
% 5+ PointsHunter Numbers
% 4+ Points
1997-99The Harvest
Antlered Harvest
Analysis Area Harvest Statistics
Antlerless Harvest
17
0
500
1000
1500
2000
2500
3000
1992 1993 1994 1995 1996 1997 1998 1999
Harvest* with Trend
0100020003000400050006000700080009000
10000
1992 1993 1994 1995 1996 1997 1998 1999
Hunter Numbers* with TrendAntlerless Antlered
0
10
20
30
40
50
60
70
1992 1993 1994 1995 1996 1997 1998 1999
% 4+ Points with Trend
0
5
10
15
20
25
30
35
1992 1993 1994 1995 1996 1997 1998 1999
% 5+ Points with Trend
WT Deer PR01.doc

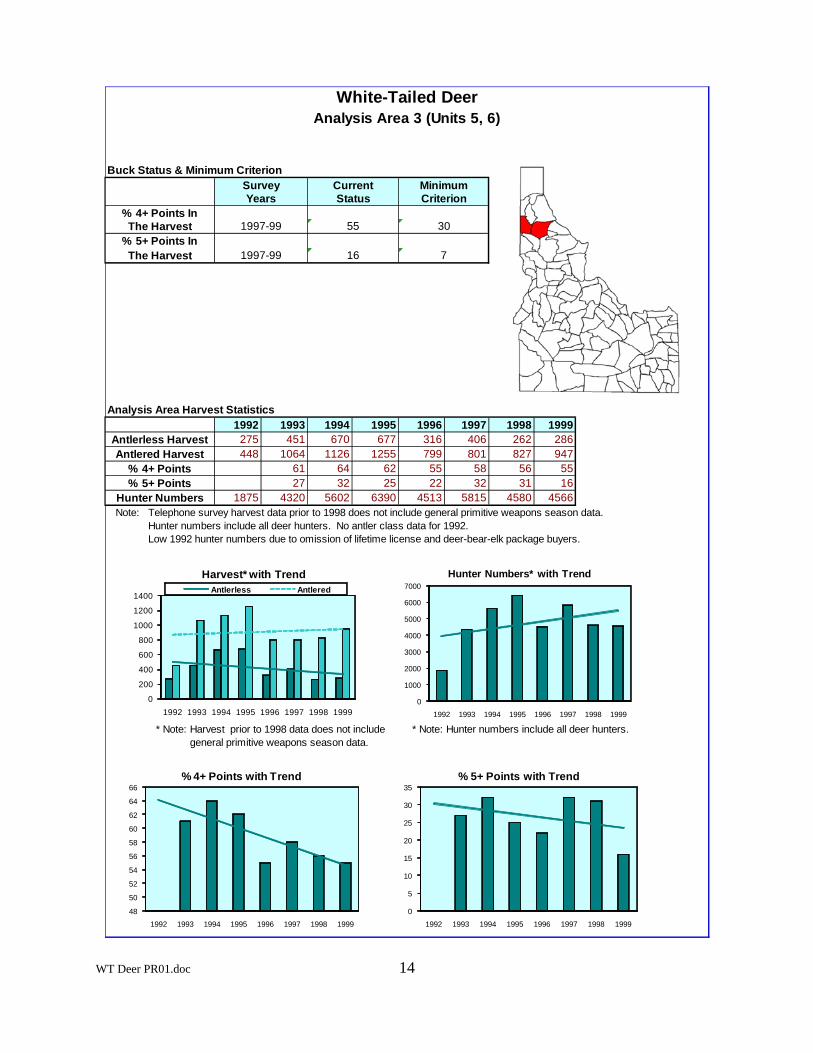
ANALYSIS AREA 3 (UNIT 5, 6)
Management Objectives Buck survival will be managed to maintain a minimum of 30% of bucks with four or more antler points per side, and a minimum 7% with five or more antler points per side. Historical Perspective Prior to the 1900s deer were apparently relatively scarce, existing along the rivers and edges of mature conifer stands, and within younger stands created by fire, disease, and insects. As mining, logging, and the railroads entered the picture around the turn of the century, deer habitat began to change slowly. Concern about "overbrowsed winter ranges" and "too many deer" prompted liberal hunting seasons in an effort to reduce deer numbers in the early 1950s. Long seasons were the rule from 1954 through 1974. By the early 1970s deer numbers had come down substantially from the peak numbers in the 1950s and 1960s. Hunting seasons were shortened, but no major habitat-creating fires had occurred for over 40 years. Since shorter seasons began in the mid-1970s, the number of whitetails killed by hunters in the Panhandle rose from 3,000 per year to 10,000 per year. Habitat Issues This analysis area can be broadly described as heavily timbered to the east, but with abundant agricultural land to the west. Habitat security is variable. This Analysis Area includes most of the Coeur d'Alene Indian Reservation. Timber harvest in portions of this Analysis Area has improved whitetail summer range substantially. Loss of low elevation, closed canopy stands important during deep-snow winters is the primary habitat issue in this Analysis Area. Grazing is negligible. Biological Issues The management criteria are easily met in this Analysis Area. As indexed by antler point information from the harvest, buck survival is very good in this Analysis Area. This Analysis Area did not experience high winter mortality during the 1996-1997 winter, as did the eastern portion of the Area. Interspecific Issues Other wild ungulates within the Analysis Area include mule deer, elk, and moose. None are believed to be limiting white-tailed deer numbers, and white-tailed deer are not believed to be in competition with any of these species for forage or space. As the most abundant ungulate in the Analysis Area, white-tailed deer do have an indirect influence on other species in the ecosystem. In those years when white-tailed deer numbers change rapidly in response to environmental
WT Deer PR01.doc 12
factors, the resultant effect on predation will be reflected within the population dynamics of alternate prey species. Predation Issues White-tailed deer have the highest intrinsic rate of increase among Idaho's ungulates. Although predation may be a major influence in their population dynamics, predation has not been identified as limiting hunting opportunity for whitetails in northern Idaho. Between 1995 and 1998 mountain lion numbers are believed to have increased substantially, while white-tailed deer numbers dropped substantially. Winter Feeding Issues The Department has not fed deer in this Analysis Area in recent years. Many private individuals feed small herds of 10 to 20 deer. Information Requirements Only harvest data are currently available for white-tailed deer management in Analysis Area 3. Success rates and the percentage of females in the harvest are used to index population trend, but the long seasons and variable weather influence makes interpretation difficult. Antler point summaries from harvested bucks index adult buck survival. Given the relatively minor effect of harvest measured in Analysis Area 1 whitetails, and similar buck survival (as indexed by antler point data), detailed population information is not needed for setting hunting regulations. Better indices of population size (trend) should be developed to better understand changes in harvest information. Development of techniques to monitor recruitment is desirable as well.
WT Deer PR01.doc 13
White-Tailed DeerAnalysis Area 3 (Units 5, 6)
1992 1993 1994 1995 1996 1997 1998 1999
14
275 451 670 677 316 406 262 286448 1064 1126 1255 799 801 827 947
61 64 62 55 58 56 5527 32 25 22 32 31 16
1875 4320 5602 6390 4513 5815 4580 4566Note: Telephone survey harvest data prior to 1998 does not include general primitive weapons season data.
Hunter numbers include all deer hunters. No antler class data for 1992.Low 1992 hunter numbers due to omission of lifetime license and deer-bear-elk package buyers.
* Note: Harvest prior to 1998 data does not include * Note: Hunter numbers include all deer hunters.general primitive weapons season data.
% 5+ PointsHunter Numbers
% 4+ Points
1997-99The Harvest
Antlered Harvest
Analysis Area Harvest Statistics
Antlerless Harvest
16
Current MinimumCriterionStatus
SurveyYears
% 4+ Points InThe Harvest
% 5+ Points In7
Buck Status & Minimum Criterion
30551997-99
0
1000
2000
3000
4000
5000
6000
7000
1992 1993 1994 1995 1996 1997 1998 1999
Hunter Numbers* with Trend
0
200
400
600
800
1000
1200
1400
1992 1993 1994 1995 1996 1997 1998 1999
Harvest* with TrendAntlerless Antlered
48
50
52
54
56
58
60
62
64
66
1992 1993 1994 1995 1996 1997 1998 1999
% 4+ Points with Trend
0
5
10
15
20
25
30
35
1992 1993 1994 1995 1996 1997 1998 1999
% 5+ Points with Trend
WT Deer PR01.doc
ANALYSIS AREA 4 (UNITS 4, 7, 9)
Management Objectives Buck survival will be managed to maintain a minimum of 30% of bucks with four or more antler points per side, and a minimum 7% with five or more antler points per side. Historical Perspective Prior to the 1900s deer were apparently relatively scarce, existing along the rivers and edges of mature conifer stands, and within younger stands created by fire, disease, and insects. As mining, logging, and the railroads entered the picture around the turn of the century, deer habitat began to change slowly. The period from 1910 to 1931 included five major fires, each creating hundreds of thousands of acres of younger forests beneficial to white-tailed deer. The newly-created habitat, and a major predator control program, allowed deer numbers to continue this growth, even through five major die-offs: 1927, 1932, 1946, 1948, and 1949. Concern about "overbrowsed winter ranges" and "too many deer" prompted liberal hunting seasons in an effort to reduce deer numbers in the early 1950s. Long seasons were the rule from 1954 through 1974. By the early 1970s deer numbers had come down substantially from the peak numbers in the 50s and 60s. Hunting seasons were shortened, but no major habitat-creating fires had occurred for over 40 years. Habitat Issues This analysis area can be broadly described as heavily timbered to the east, but with abundant agricultural land to the west. Habitat security is variable. Timber harvest in portions of this Analysis Area has improved whitetail summer range substantially. Loss of low elevation, closed canopy stands important during deep-snow winters is the primary habitat issue in this Analysis Area. Grazing is negligible. Biological Issues The management criteria are easily met in this Analysis Area. As indexed by antler point information from the harvest, buck survival is very good in this Analysis Area. Deer densities appear lower in this Area than adjacent Areas, particularly at the southern end. The 1996-1997 winter was probably one of the three or four most severe winters during the last century in this Analysis Area. Favorable environmental conditions since the winter of 1996-1997, particularly snow depth on winter range, have allowed substantial recovery of deer populations in this Analysis Area. Interspecific Issues
15
Other wild ungulates within the Analysis Area include mule deer, elk, moose, and mountain goats. None are believed to be limiting white-tailed deer numbers, and white-tailed deer are not believed to be in competition with any of these species for forage or space. As the most abundant ungulate in the Analysis Area, white-tailed deer do have an indirect influence on other WT Deer PR01.doc
species in the ecosystem. In those years when white-tailed deer numbers change rapidly in response to environmental factors, the resultant effect on predation will be reflected within the population dynamics of alternate prey species. Predation Issues White-tailed deer have the highest intrinsic rate of increase among Idaho's ungulates. Although predation may be a major influence in their population dynamics, predation has not been identified as limiting hunting opportunity for whitetails in northern Idaho. Between 1995 and 1998 mountain lion numbers are believed to have increased substantially, while white-tailed deer numbers dropped substantially due to the severe 1996-1997 winter. Winter Feeding Issues The Department has fed deer about once every 20 years in this Analysis Area. Many private individuals feed small herds of 10 to 20 deer. Information Requirements Only harvest data are currently available for white-tailed deer management in Analysis Area 4. Success rates and the percentage of females in the harvest are used to index population trend, but the long seasons and variable weather influence makes interpretation difficult. Antler point summaries from harvested bucks index adult buck survival. Given the relatively minor effect of harvest measured in Analysis Area 1 whitetails, and similar buck survival (as indexed by antler point data), detailed population information is not needed for setting hunting regulations. Better indices of population size (trend) should be developed to better understand changes in harvest information. Development of techniques to monitor recruitment is desirable as well.
WT Deer PR01.doc 16

White-Tailed DeerAnalysis Area 4 (Units 4, 7, 9)
1992 1993 1994 1995 1996 1997 1998 1999
17
353 419 684 864 762 175 111 254298 463 783 1288 483 351 243 400
50 51 33 44 42 49 3416 18 9 22 13 22 10
3413 6405 10233 12064 6810 12525 6641 8218Note: Telephone survey harvest data prior to 1998 does not include general primitive weapons season data.
Hunter numbers include all deer hunters. No antler class data for 1992.Low 1992 hunter numbers due to omission of lifetime license and deer-bear-elk package buyers.
* Note: Harvest prior to 1998 data does not include * Note: Hunter numbers include all deer hunters.general primitive weapons season data.
1997-99
SurveyYears
% 4+ Points In
7
Buck Status & Minimum Criterion
3034
Current MinimumCriterionStatus
The Harvest% 5+ Points In
% 5+ PointsHunter Numbers
% 4+ Points
1997-99The Harvest
Antlered Harvest
Analysis Area Harvest Statistics
Antlerless Harvest
10
0
200
400
600
800
1000
1200
1400
1992 1993 1994 1995 1996 1997 1998 1999
Harvest* with Trend
0
2000
4000
6000
8000
10000
12000
14000
1992 1993 1994 1995 1996 1997 1998 1999
Hunter Numbers* with TrendAntlerless Antlered
0
10
20
30
40
50
60
1992 1993 1994 1995 1996 1997 1998 1999
% 4+ Points with Trend
0
5
10
15
20
25
1992 1993 1994 1995 1996 1997 1998 1999
% 5+ Points with Trend
WT Deer PR01.doc
ANALYSIS AREA 5 (UNITS 8, 8A, 10A, 11, 11A, 13)
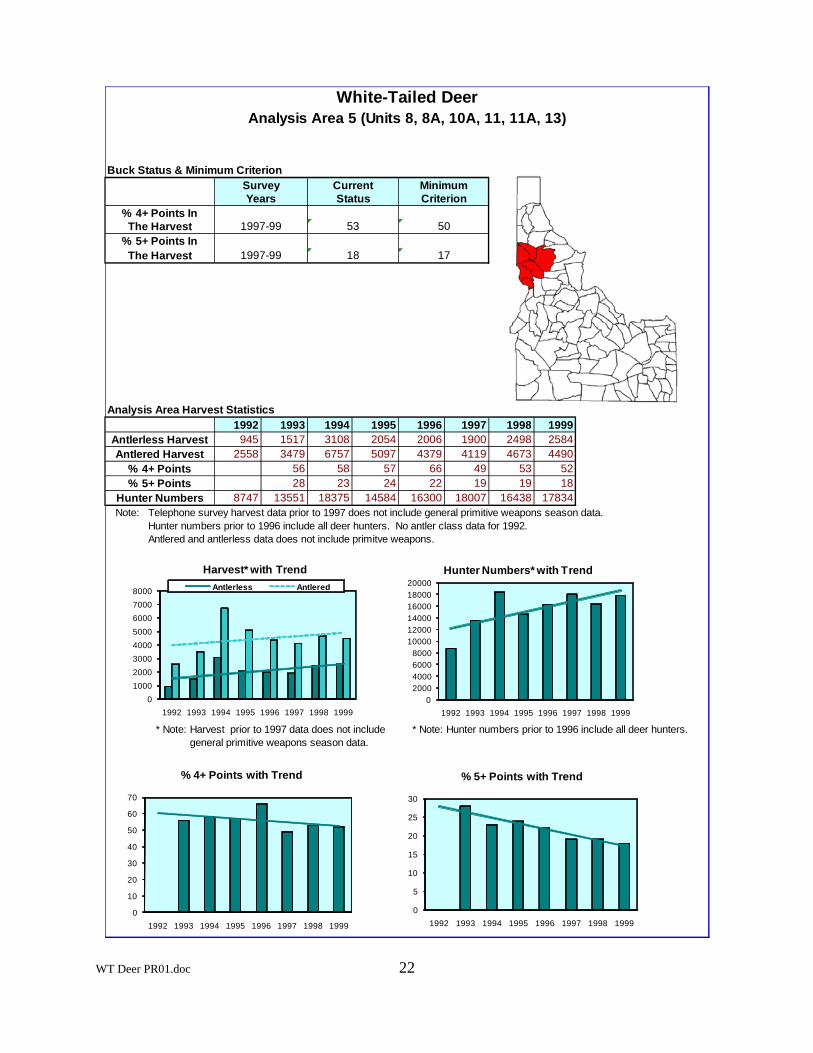
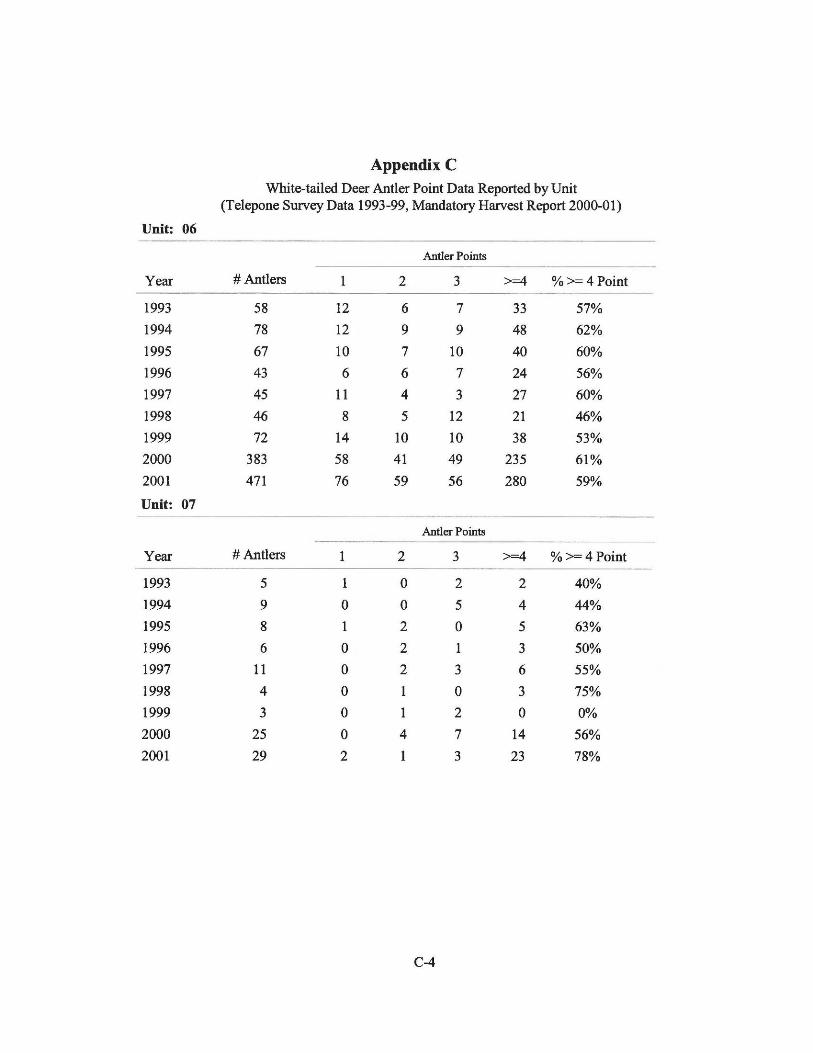
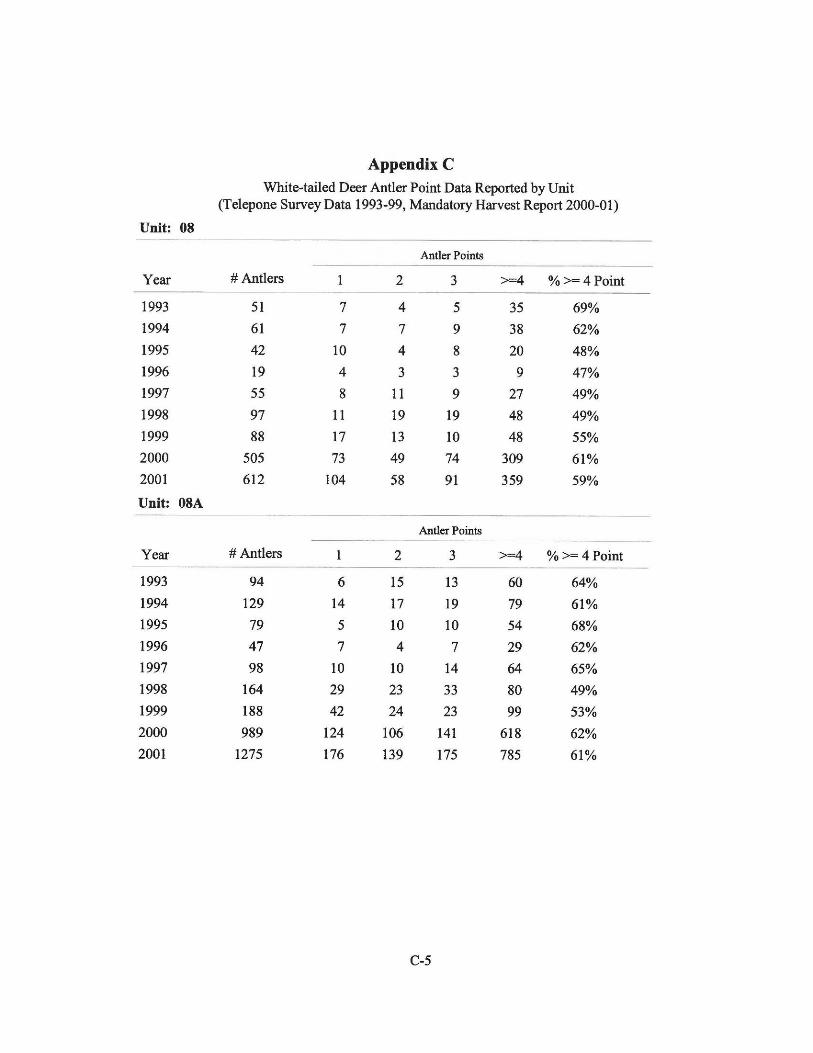
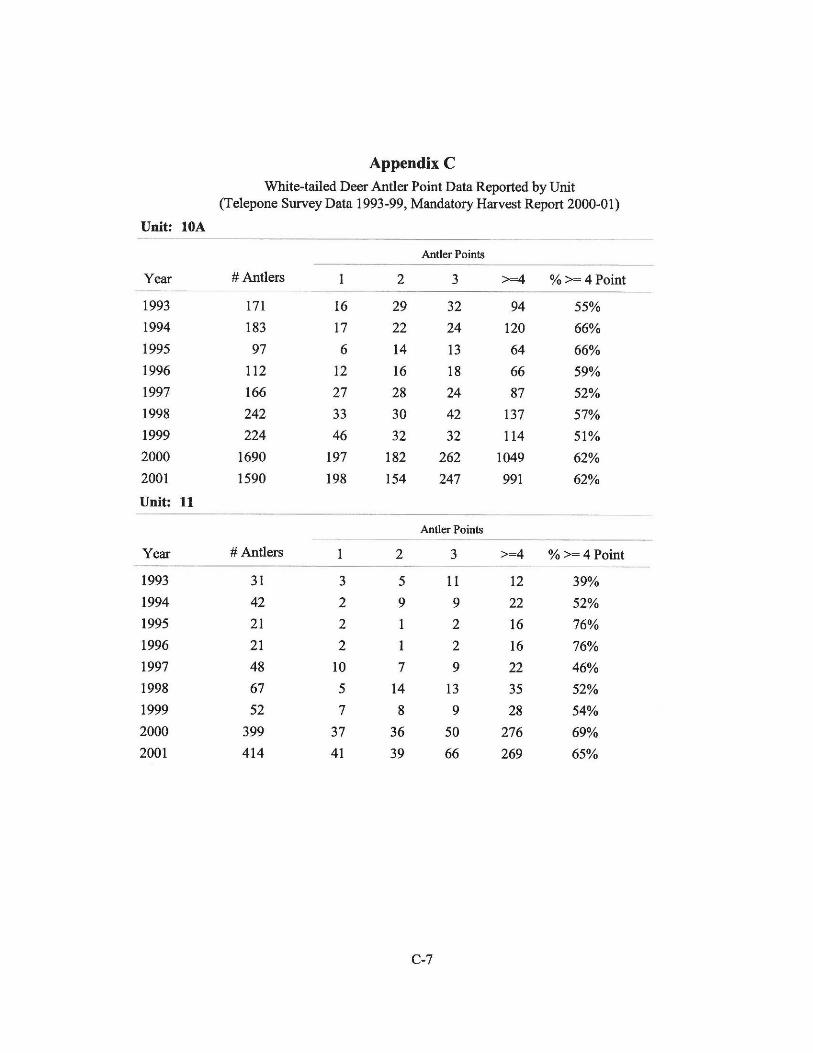
Management Objectives Given the current inability to efficiently census population parameters of white-tailed deer, management objectives will be limited to not falling below 50% ≥4 points and 17% ≥5 points in the harvest. Although the population size is unknown, efforts will be made to maintain current status. Historical Perspective White-tailed deer populations in this Analysis Area were historically low. Accounts from Lewis and Clark during the 1800s suggested that very few animals were found throughout the Clearwater River country. Populations probably did not change much until the early 1900s when large fires and settlement by humans, including grazing of domestic livestock and clearing of land for agricultural purposes, changed the landscape. Logging also converted dense coniferous forests into a mosaic of vegetation-succession types and intensified throughout the late 20th century. Currently, populations are at historic highs. Historically, white-tailed deer and mule deer were managed as a "single species": a single general season harvest framework was established for both species. In 1973 the Department began to offer species-specific seasons in the Clearwater Region. These units have either-sex hunting seasons in October. During the mid-1980s most units extended the antlered white-tailed deer hunting season into mid-November. In 1990 most November white-tailed deer seasons were changed to either-sex hunts. In 1997 an extra doe tag was established in the southern portion of Unit 10A and the southeastern portion of 11A. The 11A hunt was expanded to include the entire unit in 2000 and to include antlerless mule deer. In 1998 the Clearwater Deer Tag was established.
Habitat Issues This Analysis Area includes the highly productive Palouse and Camas prairies, the timbered mountainous terrain of the Lower North Fork Clearwater River, and the drier ponderosa pine uplands and deep canyons along the Snake and Salmon Rivers. In Units 8 and 8A, dryland agriculture began in the 1880s and currently nonforested land is tilled and only small patches of perennial vegetation remain. Timber harvest began in Unit 10A during the early 1900s and increased dramatically in the 1970s. In 1971 Dworshak Reservoir flooded approximately 45 miles of the North Fork Clearwater River in Unit 10A and permanently removed thousands of acres of prime low elevation big game winter range. Historically, sheep and cattle ranchers homesteaded the canyon lands in Units 11, 11A, and 13, while prairie farmers settled land. Around the turn of the century, northern Unit 11 and the prairie land in Unit 11A were under intensive use for dryland agriculture and numerous orchards were planted in the Lewiston area. As settlement increased, the forested portions of the area were intensively logged, especially on private land. In addition, past improper grazing practices degraded many meadow areas and canyons, allowing invasion of noxious weed species in drier areas. WT Deer PR01.doc 18

This Analysis Area contains large tracts of privately owned land. Units 8, 11, and 11A are mostly private lands except for the Craig Mountain Wildlife Management Area along the Snake and Salmon Rivers. Unit 13 has been mostly under private ownership since settlement, and is managed for agriculture and livestock. Units 8A and 10A contain a mixed ownership of private acreage, private timber companies, and public land owned by either the Idaho Department of Lands or the US Forest Service (USFS). Farmland in Units 8 and 8A has provided high-quality forage for deer. Depredations have occurred mostly along timbered edges and canyon lands. The flat, low elevation areas, abundance of meadows, and high productivity of the land make Units 8 and 8A highly productive for wildlife, but with a high likelihood of conflict with humans. Cash crops that receive damage from white-tailed deer include wheat, barley, oats, peas, lentils, rapeseed, organic vegetables, bluegrass, and hay. Landowners establishing tree plantations, tree farms, and orchards also experience damage by white-tailed deer. Units 8A and 10A have both been heavily logged with large tracts of land in seedtree cuts or clearcuts. This early successional forest intermixed with meadows and thousands of acres of brush fields has created excellent white-tailed deer summer and winter range. The habitat in this Analysis Area can support high white-tailed deer populations. Habitat productivity varies widely throughout with steep, dry, river canyon grasslands having low annual precipitation, to higher elevation forests having good habitat productivity and greater precipitation. Late successional forest cover types have become fragmented within the area. Many grassland cover types have been disturbed by various weeds and nonnative grasses including cheat grass and yellowstar thistle. Open road densities are high within the Analysis Area except along the Snake River and Salmon River below White Bird. Construction of new home sites have decreased available white-tailed deer winter ranges and limited hunter access. Biological Issues White-tailed deer numbers have increased dramatically in this Analysis Area during the past several decades. The increase was not as dramatic during the mid-1990s, although in some areas, such as Unit 11, the herd is still expanding. As deer herds have expanded and white-tailed deer hunting in Idaho has become more popular, hunter numbers increased 24% in this Analysis Area from 1991 to 1996. Similarly, harvest increased 37% during the same time period. Due to increased hunter densities in Units 8A, 10A, and 11A, there are concerns about hunter interactions, landowner trespass, and mature buck survival. Percent of bucks with ≥4 points averaged 59% from 1993 to 1996. Since 1998 harvest has stabilized and hunter numbers have decreased slightly. Some units, such as Unit 10A, have high doe densities surrounding agricultural fields and town sites. Interspecific Issues Increasing white-tailed deer populations within this Analysis Area may have had a negative impact on mule deer populations. Mountain lion populations tend to fluctuate in response to changes in white-tailed deer populations due to deer being a major food source for mountain lions.
WT Deer PR01.doc 19

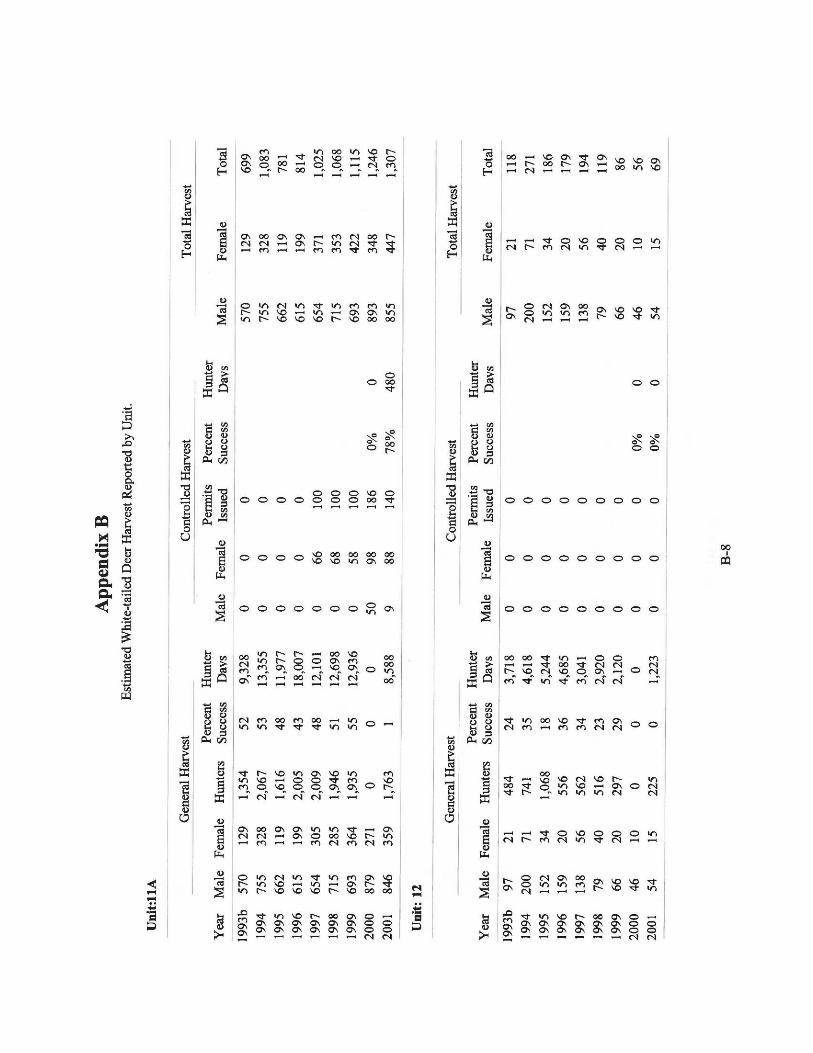
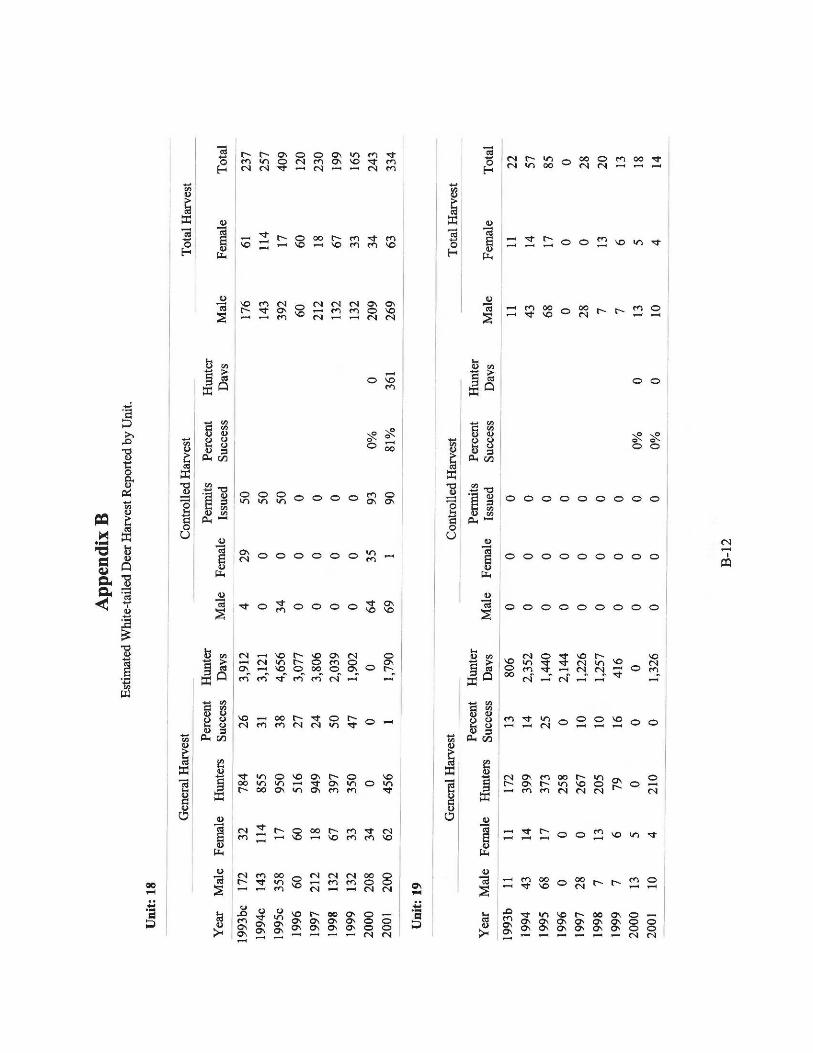
Predation Issues Mountain lion numbers have increased in this Analysis Area during the past decade and seemingly peaked during 1997, especially in Unit 10A, probably due to the dramatic increase in white-tailed deer populations. Black bear numbers have remained static throughout most of this area for the past decade. Increases in road densities during the past several decades due to logging have contributed to increased predator hunting opportunities. Wolves have recently begun to establish themselves in Unit 10A due to reintroduction efforts by the US Fish and Wildlife Service (USFWS). Winter Feeding Issues Emergency winter feeding of white-tailed deer has not occurred in recent years. Information Requirements Population statistics are needed for white-tailed deer. An improved telephone harvest survey and/or the mandatory harvest report should help improve harvest data. Better harvest information is needed concerning mature buck status. There is currently no aerial survey technique perfected for white-tailed deer in North Idaho. Census methodologies are needed to assess population parameters such as fawn:doe:buck ratios, total numbers, and mature buck status. Harvest Total harvest in Analysis Area 5 units during 2000 was estimated at 6,371 white-tailed deer according to the 2000 mandatory harvest reports. This represents a 10% decrease in harvest from 1999. The Analysis Area 5 harvest accounted for 73% of the white-tailed deer taken in the Clearwater Region during 2000. Hunter numbers in the Analysis Area 5 units was estimated at 17,834 hunters with an average success rate of 40% in 1999. Hunter numbers in 1999 increased 8% from 1998 while success rates decreased by 4%. Hunter numbers were not estimated for 2000. These trends indicate relatively stable harvest and stable hunter numbers for the past few years. Hunter numbers in Analysis Area 5 units have decreased 9% since the mid-1990s (1996), while harvest has remained relatively stable. Controlled hunts were offered in Units 10A and 11A to alleviate depredations and increase harvest opportunities for antlerless deer. According to the 2000 mandatory reports, 71 does were harvested in Unit 10A . In Unit 11A, 43 does were harvested. According to mandatory report information, buck quality has remained stable in all units for the past 7 years. Using 2000 mandatory harvest report information, all Analysis Area 5 units except 8A exceeded the ≥4-point buck objective of 50%. All Analysis Area 5 units except Unit 13 exceeded the ≥5-point buck objective of 17%.
WT Deer PR01.doc 20
Aerial Surveys There are currently no aerial survey techniques developed for white-tailed deer in Idaho. Observed white-tailed deer are recorded while performing sightability surveys for mule deer and elk. In Unit 10A, 1,192 white-tailed deer were observed while performing elk sightability surveys during January 1999. While performing sightability surveys for mule deer and elk on Craig Mountain in Unit 11 during December 1999, 257 white-tailed deer were observed. Climatic Conditions During the 2000 hunting season, snowfall was light with warmer than average temperatures throughout the fall until late November. Clearwater Region snowpack was 50% of average, while dry snow conditions resulted in 52% of average snow water equivalent. Winter conditions for big game were favorable throughout the region. Low snowpack and a cooler than normal spring initiated early green-up in low elevations but delayed green-up at higher elevations.
WT Deer PR01.doc 21
White-Tailed DeerAnalysis Area 5 (Units 8, 8A, 10A, 11, 11A, 13)
1992 1993 1994 1995 1996 1997 1998 1999
22
945 1517 3108 2054 2006 1900 2498 25842558 3479 6757 5097 4379 4119 4673 4490
56 58 57 66 49 53 5228 23 24 22 19 19 18
8747 13551 18375 14584 16300 18007 16438 17834Note: Telephone survey harvest data prior to 1997 does not include general primitive weapons season data.
Hunter numbers prior to 1996 include all deer hunters. No antler class data for 1992.Antlered and antlerless data does not include primitve weapons.
* Note: Harvest prior to 1997 data does not include * Note: Hunter numbers prior to 1996 include all deer hunters.general primitive weapons season data.
% 5+ PointsHunter Numbers
% 4+ Points
1997-99The Harvest
Antlered Harvest
Analysis Area Harvest Statistics
Antlerless Harvest
18
Current MinimumCriterionStatus
SurveyYears
% 4+ Points InThe Harvest
% 5+ Points In17
Buck Status & Minimum Criterion
50531997-99
010002000300040005000600070008000
1992 1993 1994 1995 1996 1997 1998 1999
Harvest* with Trend
02000400060008000
100001200014000160001800020000
1992 1993 1994 1995 1996 1997 1998 1999
Hunter Numbers* with TrendAntlerless Antlered
0
10
20
30
40
50
60
70
1992 1993 1994 1995 1996 1997 1998 1999
% 4+ Points with Trend
0
5
10
15
20
25
30
1992 1993 1994 1995 1996 1997 1998 1999
% 5+ Points with Trend
WT Deer PR01.doc
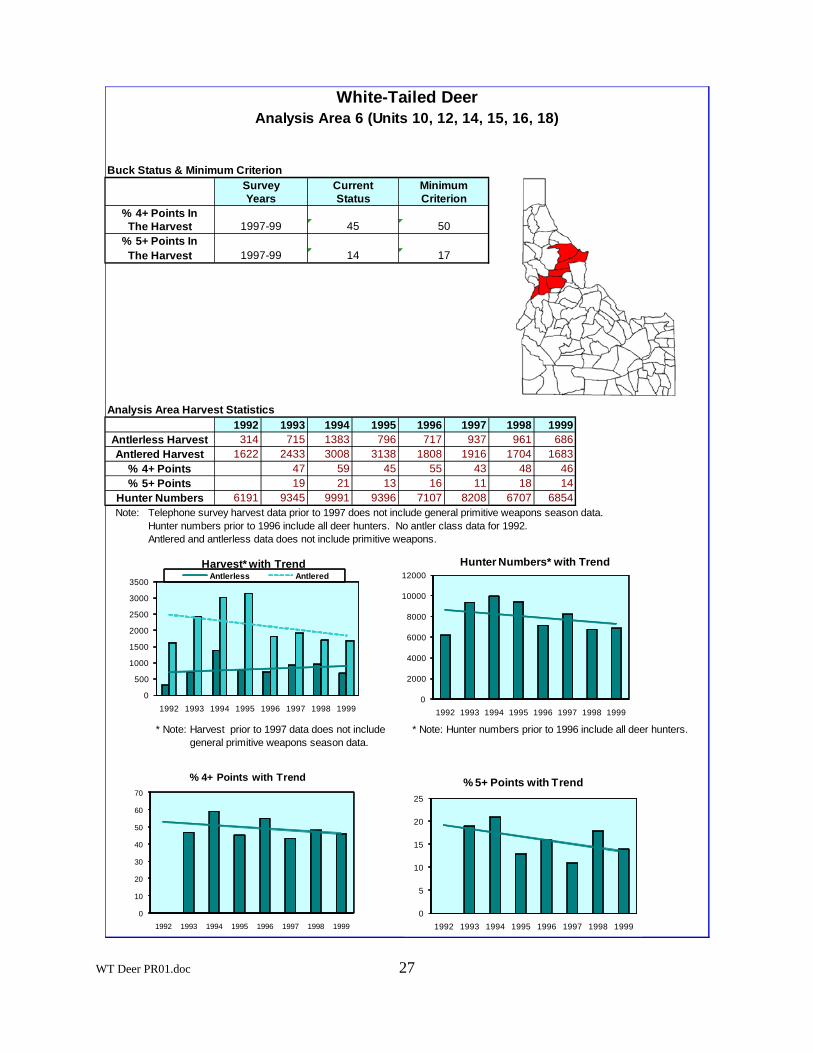
ANALYSIS AREA 6 (UNITS 10, 12, 14, 15, 16, 18)
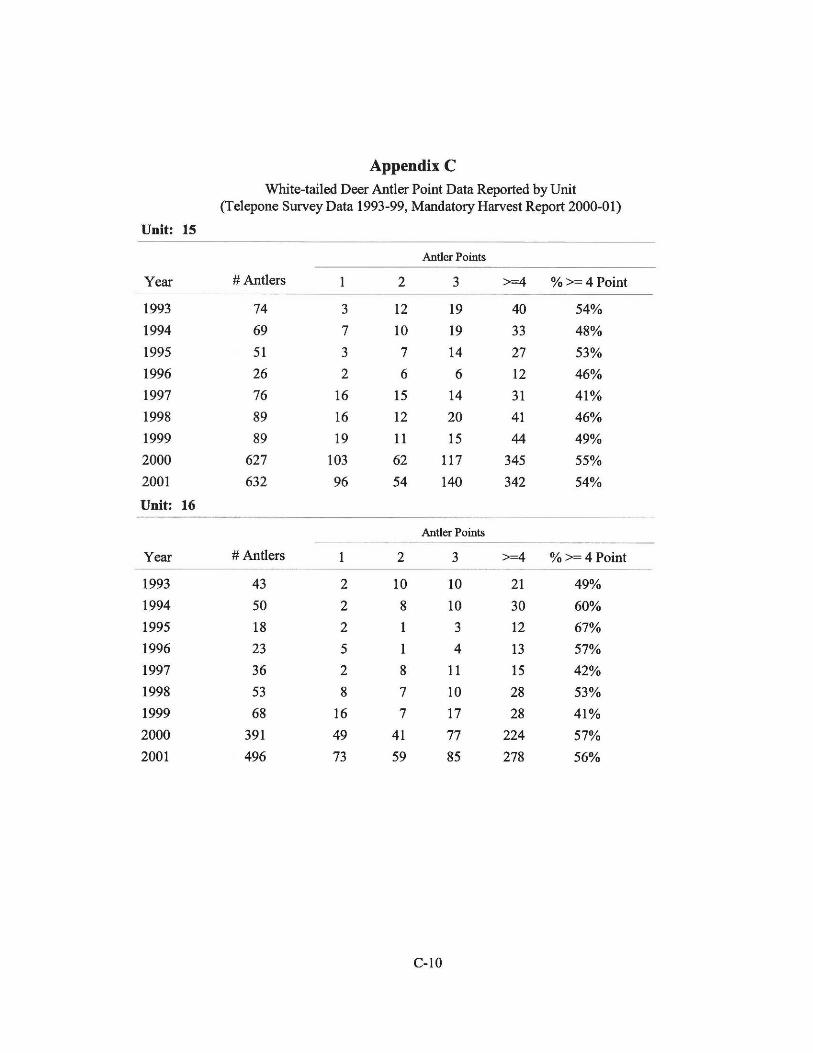
Management Objectives Given the current inability to efficiently census population parameters of white-tailed deer, management objectives will be limited to not falling below 50% ≥4 points and 17% ≥5 points in the harvest. Although the population size is unknown, efforts will be made to maintain current status. Historical Perspective White-tailed deer populations in this Analysis Area were historically low. Accounts from Lewis and Clark during the 1800s suggested that very few animals were found throughout the Clearwater River country. Populations probably did not change much until the early 1900s when fires converted large expanses of dense coniferous forest into a mosaic of vegetation succession types. Logging also contributed to creating a mosaic of brush fields and uneven-aged forest stands. Populations probably peaked around the 1940-1950s, followed by a slight decline. Currently, populations are high. Historically, white-tailed deer and mule deer were managed as a "single species": a single general season harvest framework was established for both species. In 1973 the Department began to offer species-specific seasons in the Clearwater Region. These units have either-sex hunting seasons in October. During the mid-1980s the white-tailed deer hunting season was extended into mid-November. In 1990 most November white-tailed deer seasons became either-sex hunts. In 1997 an extra doe tag was established in Unit 16 south of the Selway River. In 1998 the Clearwater Deer Tag was established.
Habitat Issues Units 10, 12, 15, and 16 are predominately timber intermixed with brush or grass. The majority of land is public in USFS ownership. Most private ownership is on lower elevation ground located along the Clearwater River. Units 14 and 18 are mixed ownership with private land being located at lower elevations along the Salmon River and mostly USFS-owned ground at higher elevations. Private land in Units 14 and 18 consists of summer resort homes and large cattle ranches with limited access. Past logging activities have created high road densities and young successional forests in the western portions of the Analysis Area and throughout most of Unit 15. These areas provide excellent white-tailed deer habitat along with high vulnerability to hunters. The eastern portion of this Analysis Area is characterized by rough terrain and limited access except for trails and a few major roads and is generally too high in elevation to sustain good white-tailed deer populations. In general, the western portions of the Analysis Area provide good white-tailed deer habitat, especially at lower elevations along the Clearwater and Salmon Rivers. Construction of new home sites has increased white-tailed deer depredation problems and limited hunter access. Noxious weeds such as yellowstar thistle and spotted knapweed are out-competing native vegetation on white-tailed deer spring and winter ranges.
WT Deer PR01.doc 23

Until the 1930s wildfire was the primary habitat disturbance mechanism in Units 10, 12, and 16. Between 1900 and 1934 approximately 70% of the Lochsa River drainage was burned by wildfires. From the 1920s to 1990, thousands of miles of road were built for timber harvest in Units 10, 12, 14, 15, and 16. In 1964 most of the southern portion of Unit 12 was designated as part of the Selway-Bitterroot Wilderness. Historically, sheepherders ran their flocks in the canyons of Units 14 and 18 and logging occurred in the forested areas. Units 14 and 18 are two-thirds public lands with the remaining private land at lower elevations along the Salmon River. The majority of the Hells Canyon Wilderness Area, designated in 1975, is in Unit 18. Cash crops that receive damage from white-tailed deer include wheat, barley, oats, and irrigated alfalfa and hay. Unfenced orchards along the Salmon River in Units 14 and 18 experience damage from white-tailed deer. Biological Issues White-tailed deer numbers have increased dramatically in this Analysis Area during the past several decades. The increase was not as dramatic during the mid-1990s. Due to increased hunter densities since the late-1980s in the southern units such as 14, 15, and 18, some sportsmen and landowners have been concerned about hunter interactions, landowner trespass, and mature buck survival. From 1991 through 1995 white-tailed deer numbers and hunter numbers stabilized within this Analysis Area. Percent of bucks with ≥4 points averaged 51% from 1993 to 1996. Since 1998 this Analysis Area has been below the 50% objective for percent of bucks ≥4 points or better. Interspecific Issues Increasing white-tailed deer populations within this Analysis Area may have a negative impact on mule deer populations. Mountain lion populations tend to fluctuate in response to changes in white-tailed deer populations due to deer being a major food source for mountain lions. Predation Issues Mountain lion numbers have increased in this Analysis Area during the past decade, probably due to a dramatic increase in white-tailed deer numbers. Black bear numbers have remained static throughout most of this area for the past decade, with Units 10, 12, and 16 having an increase within the past 5 years due to reductions in season length limiting backcountry access. Increases in road densities during the past several decades have contributed to increased predator hunting opportunities. Wolves have established themselves in Units 10, 12, and 15 due to reintroduction efforts by the USFWS. Winter Feeding Issues Emergency winter feeding of white-tailed deer has not occurred in recent years.
WT Deer PR01.doc 24

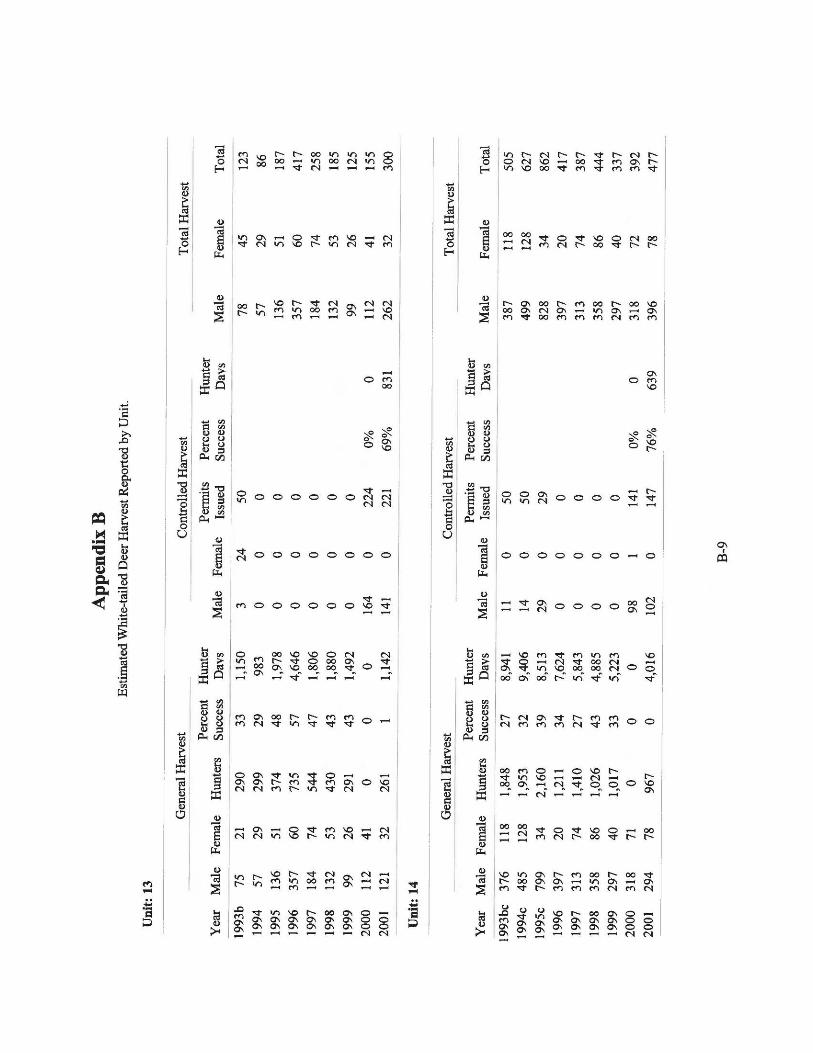
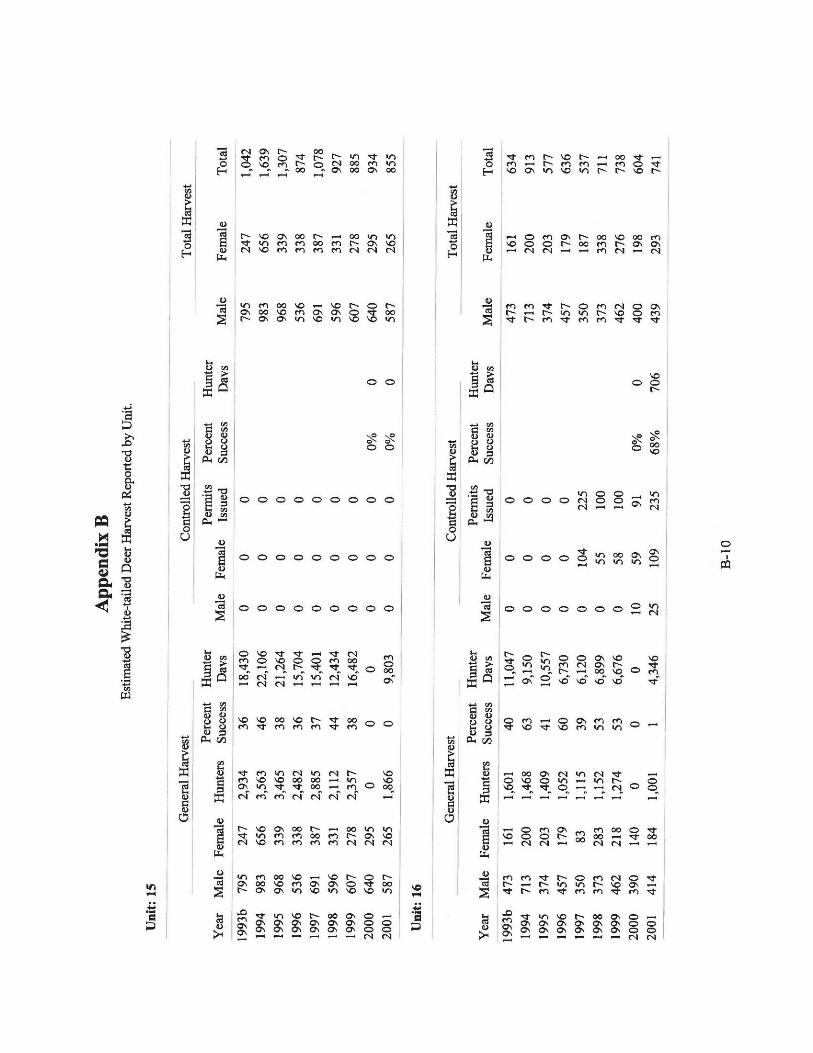
Information Requirements Population statistics are needed for white-tailed deer. An improved telephone harvest survey and/or the mandatory harvest report should help improve harvest data. Better harvest information is needed concerning mature buck status. There is currently no aerial survey technique perfected for white-tailed deer in north Idaho. Census methodologies are needed to assess population parameters such as fawn:doe:buck ratios, total numbers, and mature buck status. Harvest Total harvest in Analysis Area 6 units during 2000 was estimated at 2,182 white-tailed deer according to the 2000 mandatory harvest reports. This represents an 8% decrease in harvest from 1999. The Analysis Area 6 harvest accounted for 24% of the white-tailed deer taken in the Clearwater Region during 2000. Hunter numbers in Analysis Area 6 units were estimated at 6,854 hunters with an average success rate of 35% in 1999. Hunter numbers in 1999 increased 2% from 1998 while success rates decreased by 5%. Hunter numbers and total harvest in Analysis Area 6 units have remained stable since 1996; however, they have both decreased dramatically when compared to 1993-1995. Hunter numbers were not estimated in 2000. A controlled hunt was offered in Unit 16 during 1999 to alleviate depredations and increase harvest opportunities for antlerless deer. According to the 2000 mandatory harvest reports, 59 does were harvested. According to telephone harvest survey information, buck quality has declined in this Analysis Area during the past 5 years. Analysis Area 6 units are currently below the ≥4-point buck objective of 50%. Specific units that are below include Units 12, 16, and 18. No Analysis Area 5 units except Unit 10 met the ≥5-point buck objective of 17%. A check station is conducted in Unit 15 each year during the November white-tailed deer season. Check station data in 2000 indicated a total white-tailed deer harvest of 189. This harvest was a 34% increase since 1999. Previous to 1998 the majority of the deer hunters stopping at the check station were residents from outside the region. Since 1998 the majority of the deer hunters have been from within the region. Aerial Surveys There is currently no aerial survey technique developed for white-tailed deer in Idaho. Observed white-tailed deer are recorded while performing sightability surveys for mule deer and elk. In Unit 14, 325 white-tailed deer were observed while performing elk and mule deer sightability surveys during December 1999. In Unit 15, 633 white-tailed deer were observed during elk surveys in January 2000 compared to 803 in January 1998. In Unit 16, 141 white-tailed deer were observed during elk surveys in January 2000.
WT Deer PR01.doc 25
Climatic Conditions During the 2000 hunting season, snowfall was light with warmer than average temperatures throughout the fall until late November. Snowpack was 50% of average, while dry snow conditions resulted in 52% of average snow water equivalent. Winter conditions for big game were favorable throughout the region. A cooler than normal spring initiated later snow melt and green-up in higher elevations.
WT Deer PR01.doc 26
White-Tailed DeerAnalysis Area 6 (Units 10, 12, 14, 15, 16, 18)
1992 1993 1994 1995 1996 1997 1998 1999
27
314 715 1383 796 717 937 961 6861622 2433 3008 3138 1808 1916 1704 1683
47 59 45 55 43 48 4619 21 13 16 11 18 14
6191 9345 9991 9396 7107 8208 6707 6854Note: Telephone survey harvest data prior to 1997 does not include general primitive weapons season data.
Hunter numbers prior to 1996 include all deer hunters. No antler class data for 1992.Antlered and antlerless data does not include primitive weapons.
* Note: Harvest prior to 1997 data does not include * Note: Hunter numbers prior to 1996 include all deer hunters.general primitive weapons season data.
1997-99
SurveyYears
% 4+ Points In
17
Buck Status & Minimum Criterion
5045
Current MinimumCriterionStatus
The Harvest% 5+ Points In
% 5+ PointsHunter Numbers
% 4+ Points
1997-99The Harvest
Antlered Harvest
Analysis Area Harvest Statistics
Antlerless Harvest
14
0
2000
4000
6000
8000
10000
12000
1992 1993 1994 1995 1996 1997 1998 1999
Hunter Numbers* with Trend
0
500
1000
1500
2000
2500
3000
3500
1992 1993 1994 1995 1996 1997 1998 1999
Harvest* with TrendAntlerless Antlered
0
10
20
30
40
50
60
70
1992 1993 1994 1995 1996 1997 1998 1999
% 4+ Points with Trend
0
5
10
15
20
25
1992 1993 1994 1995 1996 1997 1998 1999
% 5+ Points with Trend
WT Deer PR01.doc

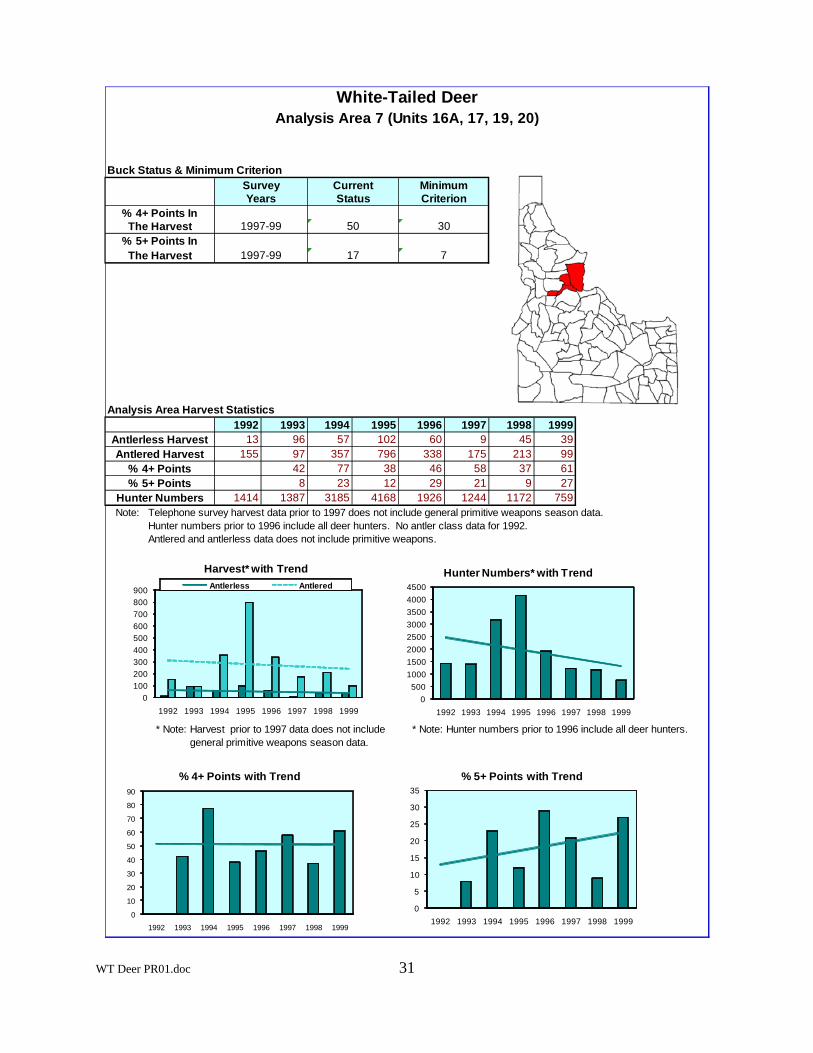
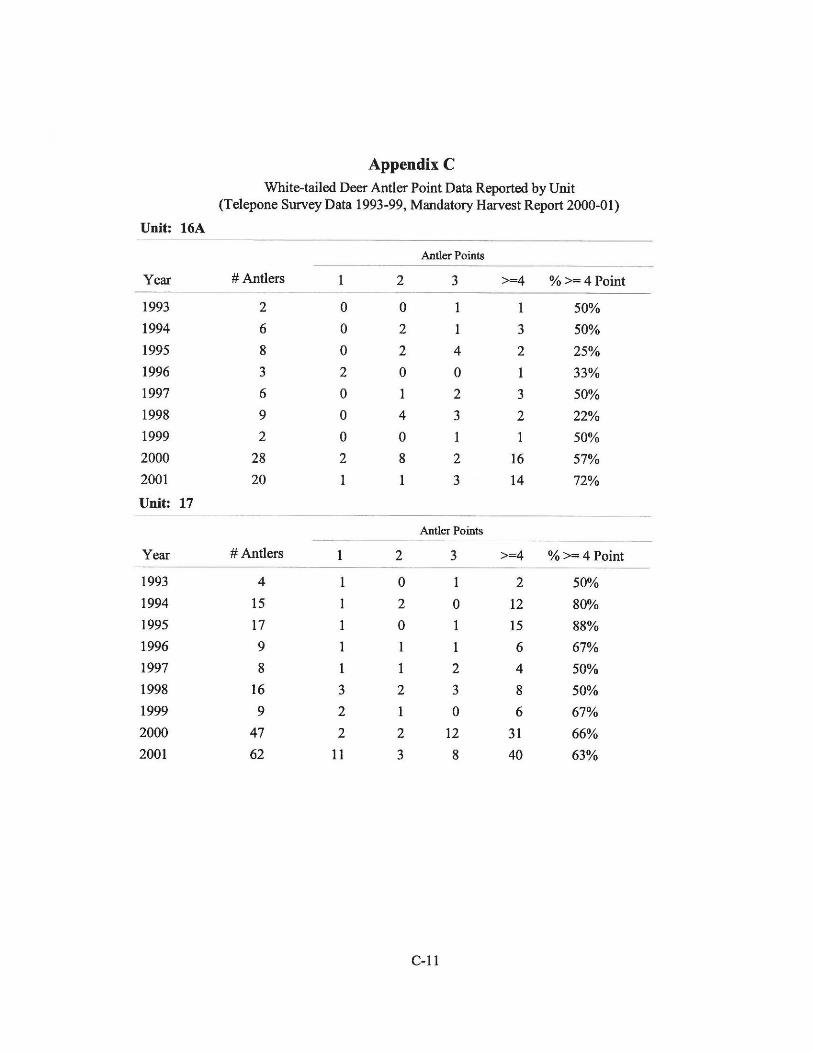
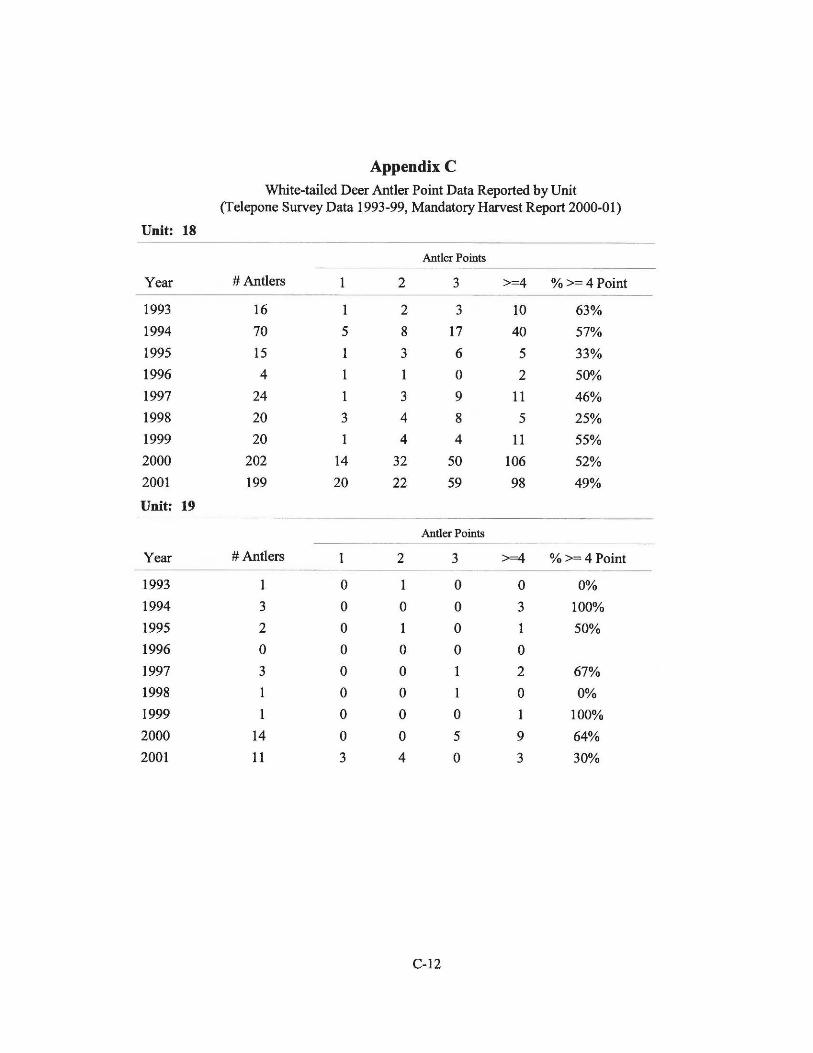
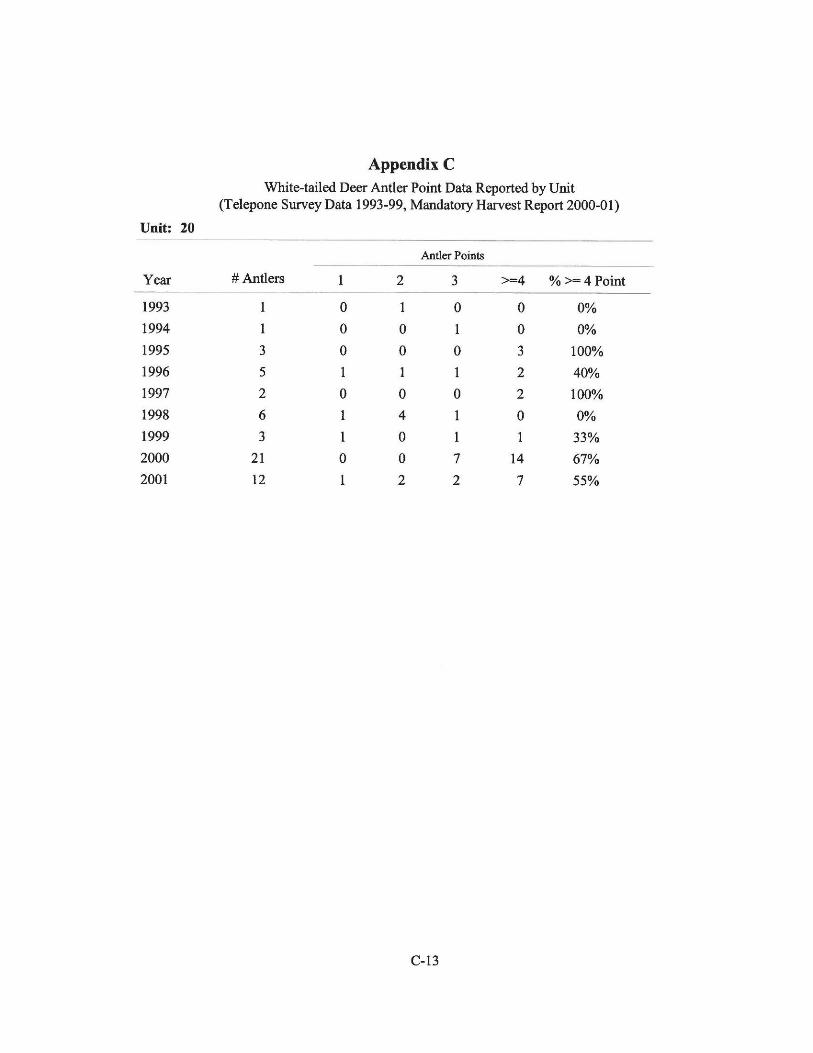
ANALYSIS AREA 7 (UNITS 16A, 17, 19, 20)
Management Objectives Given the current inability to efficiently census population parameters of white-tailed deer, management objectives will be limited to not falling below 30% ≥4 points and 7% ≥5 points in the harvest. Although the population size is unknown, efforts will be made to maintain current status. Historical Perspective White-tailed deer populations in this Analysis Area were probably historically low. Accounts from Lewis and Clark during the 1800s suggested that very few animals were found throughout the Clearwater River country. Populations probably did not change much until the early 1900s, when fires converted large expanses of dense coniferous forest into a mosaic of vegetation succession types. Logging also contributed to creating a mosaic of brush fields and uneven-aged forest stands. Populations probably peaked around the 1940-1950s, followed by a slight decline. Currently, populations are high. Historically, white-tailed deer and mule deer were managed as a "single species": a single general season harvest framework was established for both species. In 1973 the Department began to offer species-specific seasons in the Clearwater Region. Deer seasons in these units have historically been general season, either-sex, and either species. In 1998 the Clearwater Deer Tag was established. Habitat Issues Habitat productivity varies throughout the Analysis Area from high precipitation forested areas along the Lower Selway River to dry, steep, south-facing ponderosa pine and grassland habitat along the Salmon River. Many areas along the Salmon River have a good mixture of successional stages due to frequent fires within the wilderness areas. Fire suppression within portions of the Selway River drainage has led to decreasing forage production for deer. Road densities are low, contributing to low vulnerability for deer. Noxious weeds such as spotted knapweed are out-competing native grasses and vegetation throughout deer habitat, especially on drier sites at lower elevations. Large fires have burned much of the wilderness over the last few years and will likely improve habitat for most game in the near future. Due to the rugged and remote nature of this area, human impacts have been very limited. In 1964 almost all of Unit 17 and a small portion of Unit 16A were included in the Selway-Bitterroot Wilderness. Most of Unit 19 became part of the Gospel Hump Wilderness in 1978, and, in 1980, part of Unit 20 was included in the Frank Church River-of-No-Return Wilderness. Biological Issues
28
White-tailed deer numbers are believed to be increasing within this Analysis Area, especially at lower elevations where they can better survive severe winter weather. As deer have expanded and white-tailed deer hunting in Idaho has become more popular, hunter numbers in this WT Deer PR01.doc

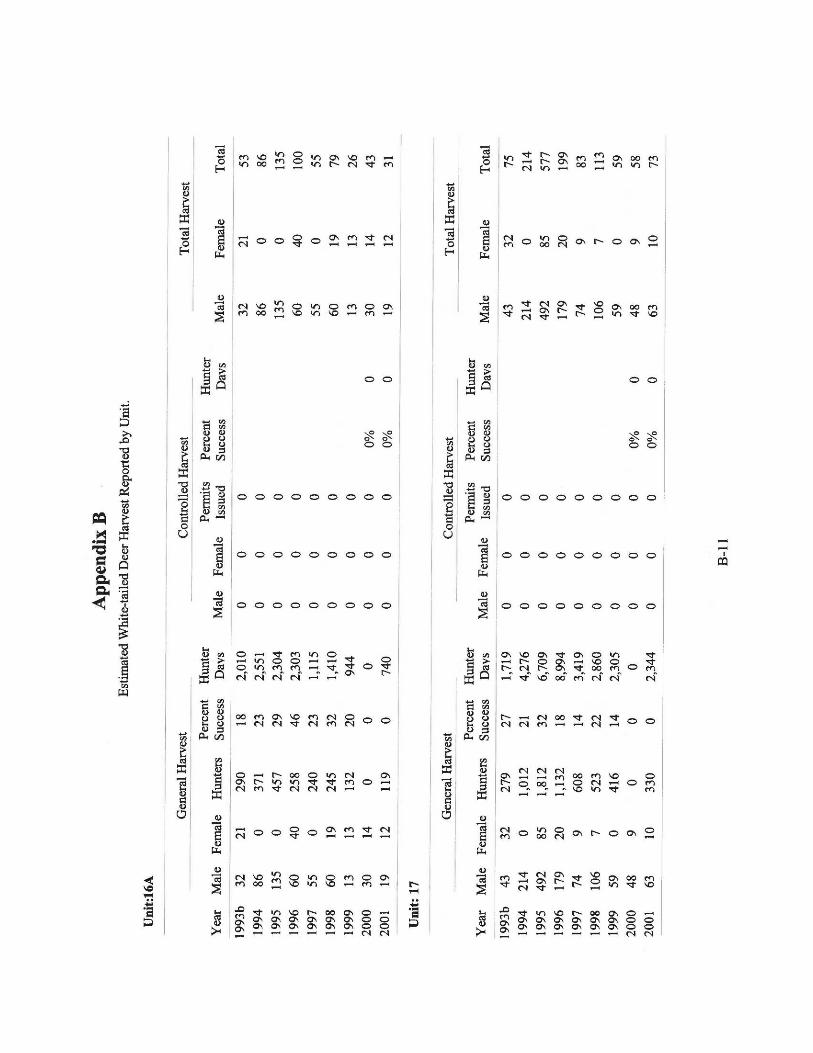
Analysis Area have increased 38% from 1991 to 1996. Similarly, harvest increased 36% during the same time period. Percent of bucks with ≥4 points averaged 52% from 1993 to 2000. Interspecific Issues Increasing white-tailed deer populations within this Analysis Area may have a negative impact on mule deer populations. Mountain lion populations tend to fluctuate in response to changes in white-tailed deer populations due to deer being a major food source for mountain lions. Predation Issues Mountain lion harvest has remained static in this area for several decades, but has increased since the 1970s. Harvest is usually between 10 and 20 mountain lions per year. Bear numbers are also stable, as the small amount of harvest on these species has little impact on populations. Harvest rates of bears and mountain lions are probably reflective of access difficulty due to snow accumulation and few roads. Mountain lion numbers may impact white-tailed deer densities; however, bears have limited impact on deer populations. Wolves have established themselves in this area and grizzly bears may be reintroduced within the next decade into some of these units. Winter Feeding Issues Emergency winter feeding of white-tailed deer has not occurred in recent years. Information Requirements As white-tailed deer densities increase within this Analysis Area, reliable population statistics will become more important for management purposes. Currently, without an estimate for the total white-tailed deer population and improved harvest estimates, it is difficult to assess whether or not to manage these units specifically for white-tailed deer. An improved telephone harvest survey and/or the mandatory harvest report should help improve harvest data. Better harvest information is needed concerning mature buck status. There is currently no aerial survey technique perfected for white-tailed deer in north Idaho. Census methodologies are needed to assess population parameters such as fawn:doe:buck ratios, total numbers, and mature buck status. Harvest Total harvest in Analysis Area 7 units during 2000 was estimated at 146 white-tailed deer. This represents a 43% decrease in harvest from 1998. Harvest estimates and success rates tend to fluctuate for this Analysis Area, probably due to low sample sizes for white-tailed deer harvest. The Analysis Area 7 harvest accounted for 1% of the white-tailed deer taken in the Clearwater Region during 2000. Hunter numbers in the Analysis Area 7 units were estimated at 759 hunters with an average success rate of 18% during 1999. Hunter numbers in 1999 decreased 35% from 1998 while success rates decreased by 4%. White-tailed deer hunter numbers in Analysis Area 7 units have decreased 61% since the mid-1990s (1996), and harvest has decreased 65%. Hunter
WT Deer PR01.doc 29
numbers for 2000 were not available. There are no controlled hunts offered for white-tailed deer in these units. Estimates for management objectives in Analysis Area 7 are difficult to obtain due to low sample sizes. Aerial Surveys There is currently no aerial survey technique developed for white-tailed deer in Idaho. Observed white-tailed deer are recorded while performing sightability surveys for mule deer and elk; however, to date the observed numbers are extremely low for this group of units. Climatic Conditions During the 2000 hunting season, snowfall was light with warmer than average temperatures throughout the fall until late November. Snowpack was 50% of average, while dry snow conditions resulted in 52% of average snow water equivalent. Winter conditions for big game were favorable throughout the region. A cooler than normal spring delayed snow melt and green-up at higher elevations.
WT Deer PR01.doc 30
White-Tailed DeerAnalysis Area 7 (Units 16A, 17, 19, 20)
1992 1993 1994 1995 1996 1997 1998 1999
WT Deer PR01.doc 31
13 96 57 102 60 9 45 39155 97 357 796 338 175 213 99
42 77 38 46 58 37 618 23 12 29 21 9 27
1414 1387 3185 4168 1926 1244 1172 759Note: Telephone survey harvest data prior to 1997 does not include general primitive weapons season data.
Hunter numbers prior to 1996 include all deer hunters. No antler class data for 1992.Antlered and antlerless data does not include primitive weapons.
* Note: Harvest prior to 1997 data does not include * Note: Hunter numbers prior to 1996 include all deer hunters.general primitive weapons season data.
% 5+ PointsHunter Numbers
% 4+ Points
1997-99The Harvest
Antlered Harvest
Analysis Area Harvest Statistics
Antlerless Harvest
17
Current MinimumCriterionStatus
SurveyYears
% 4+ Points InThe Harvest
% 5+ Points In7
Buck Status & Minimum Criterion
30501997-99
0100200300400500600700800900
1992 1993 1994 1995 1996 1997 1998 1999
Harvest* with Trend
0500
10001500200025003000350040004500
1992 1993 1994 1995 1996 1997 1998 1999
Hunter Numbers* with TrendAntlerless Antlered
0
10
20
30
40
50
60
70
80
90
1992 1993 1994 1995 1996 1997 1998 1999
% 4+ Points with Trend
0
5
10
15
20
25
30
35
1992 1993 1994 1995 1996 1997 1998 1999
% 5+ Points with Trend

WT Deer PR01.doc 32
APPENDICES


Submitted by: Jim Hayden Jay Crenshaw Regional Wildlife Manager Regional Wildlife Manager Approved by: IDAHO DEPARTMENT OF FISH AND GAME Wayne Melquist Wayne Melquist Nongame Wildlife Manager Federal Aid Coordinator Tom Parker Tom Parker, Acting Chief Bureau of Wildlife
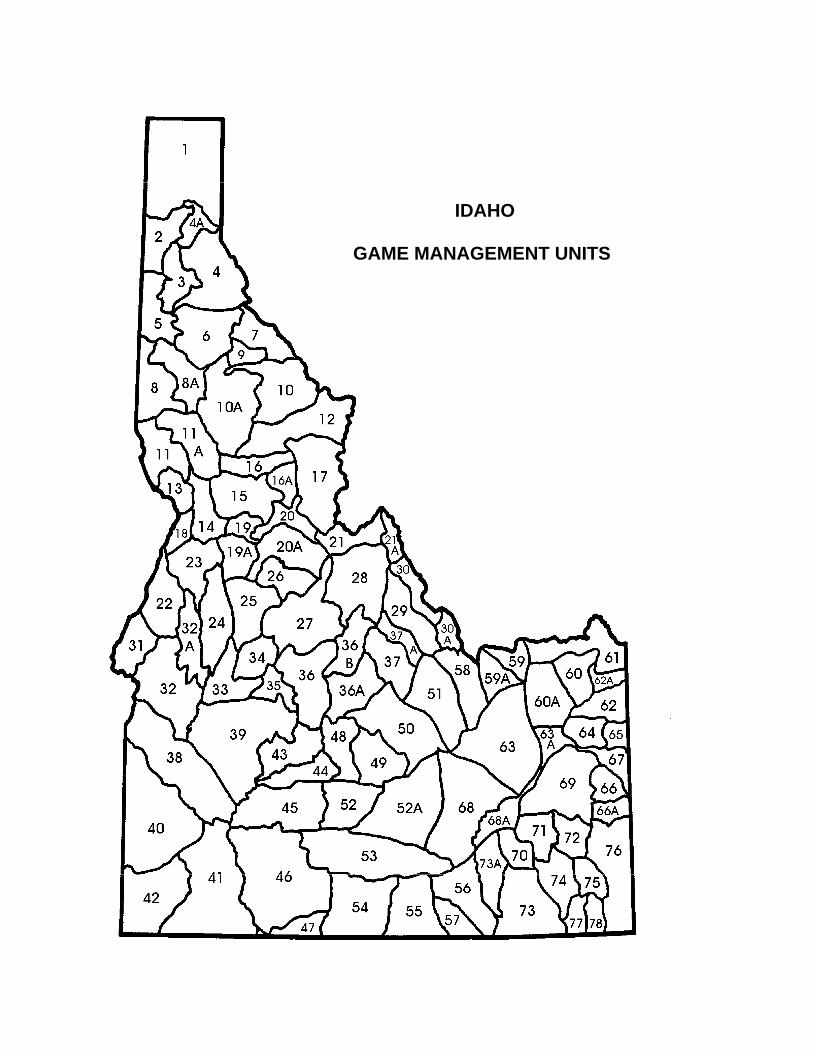
IDAHO
GAME MANAGEMENT UNITS
FEDERAL AID IN WILDLIFE RESTORATION
The Federal Aid in Wildlife Restoration Program consists of funds from a
10% to 11% manufacturer’s excise tax collected from the sale of
handguns, sporting rifles, shotguns, ammunition, and archery equipment.
The Federal Aid program then allots the funds back to states through a
formula based on each state’s
geographic area and the number of
paid hunting license holders in the
state. The Idaho Department of
Fish and Game uses the funds to
help restore, conserve, manage,
and enhance wild birds and
mammals for the public benefit.
These funds are also used to
educate hunters to develop the skills, knowledge, and attitudes necessary
to be responsible, ethical hunters. Seventy-five percent of the funds for
this project are from Federal Aid. The other 25% comes from license-
generated funds.