WHITE PAPER Reducing Return Rates on Consumer Electronics … · 2018-11-05 · 5-6%. of their...
12
WHITE PAPER Reducing Return Rates on Consumer Electronics Products Identification of High Propensity-to-Return™ Customers Must Supplement Product Design, Documentation and Technical Support Improvements
Transcript of WHITE PAPER Reducing Return Rates on Consumer Electronics … · 2018-11-05 · 5-6%. of their...

WHITE PAPER
Reducing Return Rates on Consumer Electronics Products
Identification of High Propensity-to-Return™ Customers Must Supplement Product Design, Documentation and Technical Support Improvements

200 Homer Avenue | Ashland, MA 01721 | p: 508.520.2711 | f: 508.881.9450 | [email protected]
© 2012 OnProcess Technology. All Rights Reserved. 2
Table of Contents
Executive Overview .................................................................................................. 3
Product Returns Erode Profit Margins and Impact Entire Supply Chains .......... 4
Eliminate Unnecessary Players
Costly Customer Support
Looking Beyond Product Returns as a Cost of Doing Business ......................... 6
A Transformational Approach: Identifying Customers with
High-Propensity-to-ReturnTM .................................................................................... 7
Improving the Product Return Rate
Applying the Propensity-to-ReturnTM Algorithm ..................................................... 9
Expanded Methodology to Reduce Product Returns ......................................... 10
The Payoff for Reducing Product Return Rates .................................................. 11
Projected Return Rates
Contact OnProcess ................................................................................................ 12
Accenture research
estimates U.S. con-
sumer electronics
manufacturers, com-
munication carriers
and retailers spent an
estimated $16.7 bil-
lion in 2011 to receive,
assess, repair, re-box,
restock and resell re-
turned merchandise.
Accenture Report—“A Returning
Problem: Reducing the Quantity
and Cost of Product Returns in
Consumer Electronics,” by David
Douthit, Michael Flach and Vivek
Agarwal, 2011.
200 Homer Avenue | Ashland, MA 01721 | p: 508.520.2711 | f: 508.881.9450 | [email protected]
© 2012 OnProcess Technology. All Rights Reserved. 3
Executive Overview
For many years, product returns have persisted at alarming rates across the entire consumer electronics industry. With razor-thin margins and intense competition, solving the challenge could pay huge dividends—not only in reducing costs associated with unnecessary product returns, such as those products with no trouble found, but also in improving brand loyalty and customer referral rates that lead to future revenue generation.
Just how big is the product return problem? Accenture research1 estimates U.S. consumer
electronics manufacturers, communication carriers and retailers spent an estimated $16.7
billion in 2011 to receive, assess, repair, re-box, restock and resell returned merchandise.
Accenture also surmises manufacturers spend 5-6 percent of their revenue to manage customer
returns while retailer returns represent approximately 2-3 percent of sales. Numbers such as
these could mean the difference between profitability and loss for a product, and they could
materially impact market share as well.
A second area of concern identified by Accenture is the return rate for consumer electronics
devices, which falls between 11-20 percent of all products sold and continues to rise. In addition,
approximately 58 percent of consumer electronics retailers and 43 percent of OEMs now
experience higher return rates than in previous years.
Of all returns, a staggering 68 percent are labeled as no trouble found (NTF). Another 27 percent
are associated with buyer’s remorse, which can occur for reasons similar to NTF, such as sub-par
customer education or improper expectation-setting at the time of the sale. When adding these
figures together, 95 percent of consumer electronics product returns are initially attributed
to something other than defects.
This white paper from OnProcess Technology examines the causes and the impact of
product returns, particularly NTF returns. We also discuss why the problem is so acute within
the consumer electronics industry that includes smartphones, tablets, laptops, desktops and
other personal devices as well as home entertainment systems.
We then provide an overview of the unique approach we have developed that enables
consumer electronics firms across the entire supply chain to identify and proactively reach
out to those customers most likely to submit returns. This capability reduces product return
rates as well as the high levels of customer frustration that lead to the most undesirable
outcome of all—customer churn.
1. Accenture Report—“A Returning Problem: Reducing the Quantity and Cost of Product Returns in Consumer Electronics,” by David Douthit, Michael Flach
and Vivek Agarwal, 2011.
200 Homer Avenue | Ashland, MA 01721 | p: 508.520.2711 | f: 508.881.9450 | [email protected]
© 2012 OnProcess Technology. All Rights Reserved. 4
New product models and upgrades are intro-duced at an increasingly faster pace. There are also ever-increasing new product function-alities. In the wireless industry for example, Bluetooth pairing, near field communication, MiFi, WiFi, e-mail, push-to-talk, texting, Skype, navigation, music, apps, cameras, and video cameras all contribute to product returns by making it more difficult for consumers to understand how functions operate and how to properly access the functions. Many other electronics products also create user-interface challenges for customers.
Eliminate Unnecessary Players Complex supply chains, which include OEMs, distributors, carriers, retailers and outsource contract firms, might all play a role in managing returns and in-teracting with customers. In some cases, multiple players handle the return of a single product. This, along with the chang-ing technology, exacerbates the product return issue by creating even more confu-sion among consumers.
Some returns occur because of genuine “buyer’s remorse,” but many more returns oc-cur due to poor documentation, the improper
setting of customer expectations, insufficient customer education, and inadequate after-sales support. The effects of these causes are felt throughout the supply chain.
Costly Customer Support When a product return occurs, the firm within the supply chain that handles the product incurs a series of costs that ham-string product profitability. This includes the resource and communication costs of the technical support team that tries to re-solve the problem with the customer—wheth-er it’s over the phone, via a remote connec-tion, or in-person at a retail location.
Customer aptitude and the ability to com-municate the specifics of issues also play a major role in whether or not tech support calls are resolved successfully. But be-cause of the unpredictable and somewhat unmanageable behavior of customers, this variable is difficult to control. When compa-nies handling product returns are unable to capture customer issues within their many systems the situation is aggravated further; due to their inability to efficiently resolve issues once devices are sold.
Product Returns Erode Profit Margins and Impact Entire Supply Chains
As the research presented indicates, the product return problem continues to grow. Multiple factors create this situation such as a proliferation of features and functionality, insufficient usability education on how to access features, and the complexity of the consumer electronics supply chain.
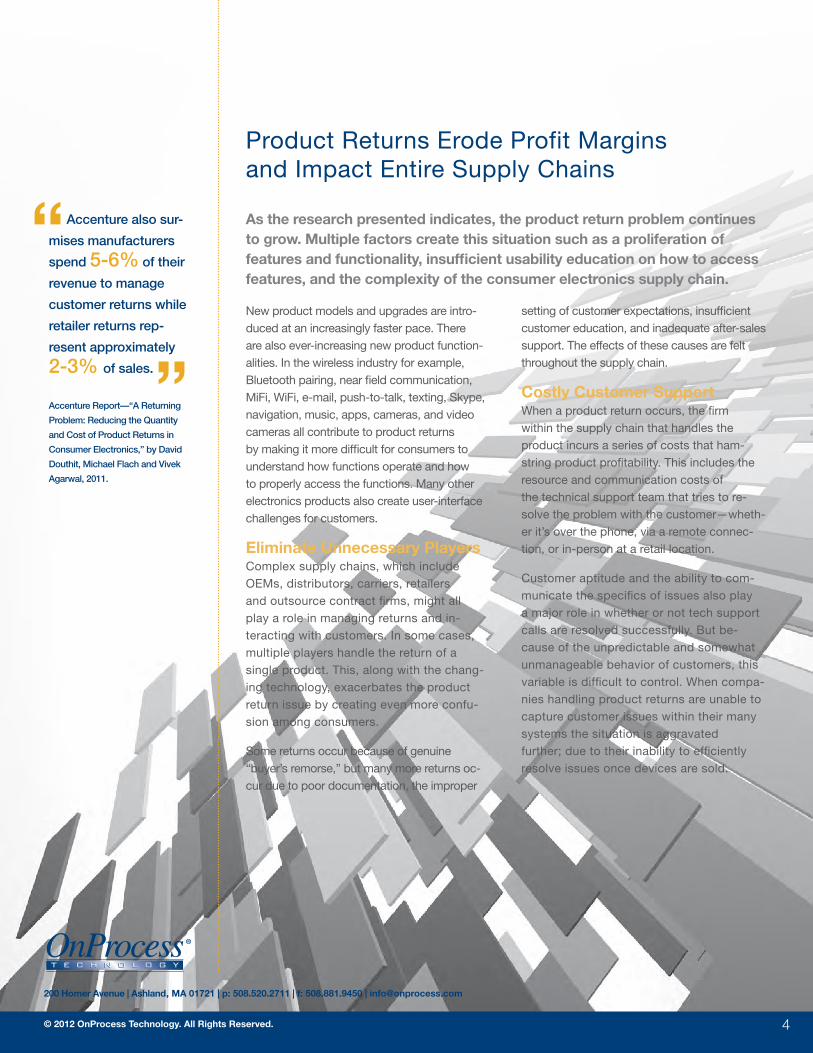
Accenture also sur-
mises manufacturers
spend 5-6% of their
revenue to manage
customer returns while
retailer returns rep-
resent approximately
2-3% of sales.
Accenture Report—“A Returning
Problem: Reducing the Quantity
and Cost of Product Returns in
Consumer Electronics,” by David
Douthit, Michael Flach and Vivek
Agarwal, 2011.

200 Homer Avenue | Ashland, MA 01721 | p: 508.520.2711 | f: 508.881.9450 | [email protected]
© 2012 OnProcess Technology. All Rights Reserved. 5
When the frontline technical support team cannot resolve the issue and the product is returned, the lab testing team then incurs the cost of trying to duplicate and diagnose the issue. In many cases, the reported prob-lem cannot be reproduced. The majority of cases are thus labeled as NTF.
If the device is returned to inventory, by law it can no longer be sold as a new product. The
product must be labeled as such with a corresponding lowering of the price. The combined cost of technical support, retail sales handling, returns processing, logistics, depot, lab testing and other admin-istrative resources that support all the return-process functions as well as the inventory reclassification add up. The company loses its entire profit margin on the device and takes a loss.
Figure 1 Sample Incremental Costs of Returns: Wireless
(Source: OnProcess Technology Proprietary Research)PTR SCORE BY DECILES
Overall NTF Return Rate
Model Score
Act
uals
Incremental Costs (Hard Costs)Call to Call CenterVisit to StoreReceivingFunctional TestRepackingRestockingDirect fulfillment returnRefurb cost - AvgLost Subsidy, Rev., etc.Total
$15.00$15.00$1.50$3.50$1.50$1.00$3.50
$30.00$200.00$271.00
0%
20%
40%
60%
80%
100% 92%88%
80%
44%Model Fit
10% 9% 8% 7% 8%5%
10 9 8 7 6 5 4 3 2 1
Deciles10987654321
N898903902901887904898899901897
11 - 20%
43% 58%
PTR SCORE BY DECILES
Overall NTF Return Rate
Model Score
Act
uals
Incremental Costs (Hard Costs)Call to Call CenterVisit to StoreReceivingFunctional TestRepackingRestockingDirect fulfillment returnRefurb cost - AvgLost Subsidy, Rev., etc.Total
$15.00$15.00$1.50$3.50$1.50$1.00$3.50
$30.00$200.00$271.00
0%
20%
40%
60%
80%
100% 92%88%
80%
44%Model Fit
10% 9% 8% 7% 8%5%
10 9 8 7 6 5 4 3 2 1
Deciles10987654321
N898903902901887904898899901897
11 - 20%
43% 58%
A second area of
concern identified by
Accenture is the return
rate for consumer elec-
tronics devices, which
falls between 11-20% of all products sold and
continues to rise.
Accenture Report—“A Returning
Problem: Reducing the Quantity
and Cost of Product Returns in
Consumer Electronics,” by David
Douthit, Michael Flach and Vivek
Agarwal, 2011.

200 Homer Avenue | Ashland, MA 01721 | p: 508.520.2711 | f: 508.881.9450 | [email protected]
© 2012 OnProcess Technology. All Rights Reserved. 6
Looking Beyond Product Returns as a Cost of Doing Business
Although the consumer electronics industry is keenly aware of the product return issue and just how much the cost for these returns impacts the bottom line, many firms have reluctantly resigned themselves to consider product returns as a cost of doing business that can’t be changed. But taking a new perspective on the challenge is critical since successfully addressing the product return challenge enables consumer electronics firms to realize three significant benefits:
To take on the problem, the
consumer electronics indus-
try has employed many pro-
cess improvements: easier-
port can take over device control remotely
or physically touch the device. But despite
the efforts in all these areas over the past 30
years during which the consumer electronics
industry has exploded, entire supply chains
continue to wrestle with product returns. Not
only do they suffer from reduced margins due
to the cost of returns, they also suffer in terms
of brand reputation.
Customers that return a product with an as-
sumed defect rarely recommend that product
to friends and business colleagues. And even
though NTF product return customers may
actually be wrong in their interpretation, the
situation is a fact the industry must face. In
these cases, perception is reality.
Approximately 58% of consumer electronics
retailers and 43% of
OEMs now experience
higher return rates than
in previous years.
Accenture Report—“A Returning
Problem: Reducing the Quantity
and Cost of Product Returns in
Consumer Electronics,” by David
Douthit, Michael Flach and Vivek
Agarwal, 2011.
Benefits of Efficient Product Returns
Decreasing inventory
expenses linked to
product returns
Reducing costly customer
technical support
interactions and incident
administration
Improving brand loyalty
among customers, which
increases new customer
referrals
to-read documentation, changes to product
designs so screens are easier to interpret
and keypads are easier to manipulate, and
education combined with the proper setting
of expectations at the point-of-sale. Perhaps
the area in which the industry has invested
most heavily to resolve product returns is
technical support.
The proficiency of phone and in-store support
personnel to interface with customers and
diagnose problems goes a long way towards
resolving issues, especially when tech sup-
PTR SCORE BY DECILES
Overall NTF Return Rate
Model Score
Act
uals
Incremental Costs (Hard Costs)Call to Call CenterVisit to StoreReceivingFunctional TestRepackingRestockingDirect fulfillment returnRefurb cost - AvgLost Subsidy, Rev., etc.Total
$15.00$15.00$1.50$3.50$1.50$1.00$3.50
$30.00$200.00$271.00
0%
20%
40%
60%
80%
100% 92%88%
80%
44%Model Fit
10% 9% 8% 7% 8%5%
10 9 8 7 6 5 4 3 2 1
Deciles10987654321
N898903902901887904898899901897
11 - 20%
43% 58%
200 Homer Avenue | Ashland, MA 01721 | p: 508.520.2711 | f: 508.881.9450 | [email protected]
© 2012 OnProcess Technology. All Rights Reserved. 7
OnProcess Technology develops
true solutions to our clients’ chal-
lenges using our combined strengths
in People, Process & Technology as
no other company can.
We start with deep subject mat-
ter expertise focused exclusively
on the service supply chain.
Supported by our proprietary
technology platform, our strong
data management and process
methodology, optimal mix of
proactive outreach technolo-
gies and media, and data-driven
analytics and reporting, OnProc-
ess Technology gives its clients
unprecedented insights into their
service supply chain operations
and customer service experi-
ences. With OnProcess, you’ll
be able to better plan your new
product and service launches,
make smarter and more efficient
parts purchases and distribu-
tions, link all of your disparate
systems, vendors and locations
together to drive a fast, efficient
and accurate service operation.
A Transformational Approach: Identifying Customers with High Propensity-to-Return™
To effectively address the product return issue, firms in the consumer electronics supply chain must first comprehend the severity, complexity and the scope of the problem. Improving product return rates does not occur overnight. It requires a carefully planned approach and the application of ongoing system improvements. After a company begins to understand the causes of returns to a greater extent, only then can the necessary process improvements be applied to reduce the return rate.
When working with cus-
tomers, we also apply a
Six Sigma data-analysis
approach in assessing
customer demographics
along with customer product interaction his-
tory, the attributes of the purchased product,
and the attributes of the internal support team
that handles returns. This overall approach
has given us the ability to create an entirely
new paradigm that transforms how consumer
electronics firms can address the challenge of
product returns.
Improving the Product Return Rate Because of the dynamic characteristics of
new products and the way customers interact
with products, return rates can never be re-
duced to zero. But with the correct approach,
the rate can be lowered significantly so firms
that handle returns can improve support and
inventory costs while also enhancing brand
reputation. To supplement efforts in improving
documentation, product designs, education at
the point-of-sale and technical support, a criti-
cal first step in improving the product return
rate involves identifying those customers with
a propensity to submit returns.
To provide the consumer electronics indus-
try with this unique capability, OnProcess
Technology has devised a proprietary scor-
ing algorithm with statistical modeling that
predicts the likelihood of customers to enact
a return. To create the Propensity-to-Return™
algorithm, we relied on our internal expertise
in advanced data-analytics and post-sales
service processes within the consumer elec-
tronics product industry.
200 Homer Avenue | Ashland, MA 01721 | p: 508.520.2711 | f: 508.881.9450 | [email protected]
© 2012 OnProcess Technology. All Rights Reserved. 8
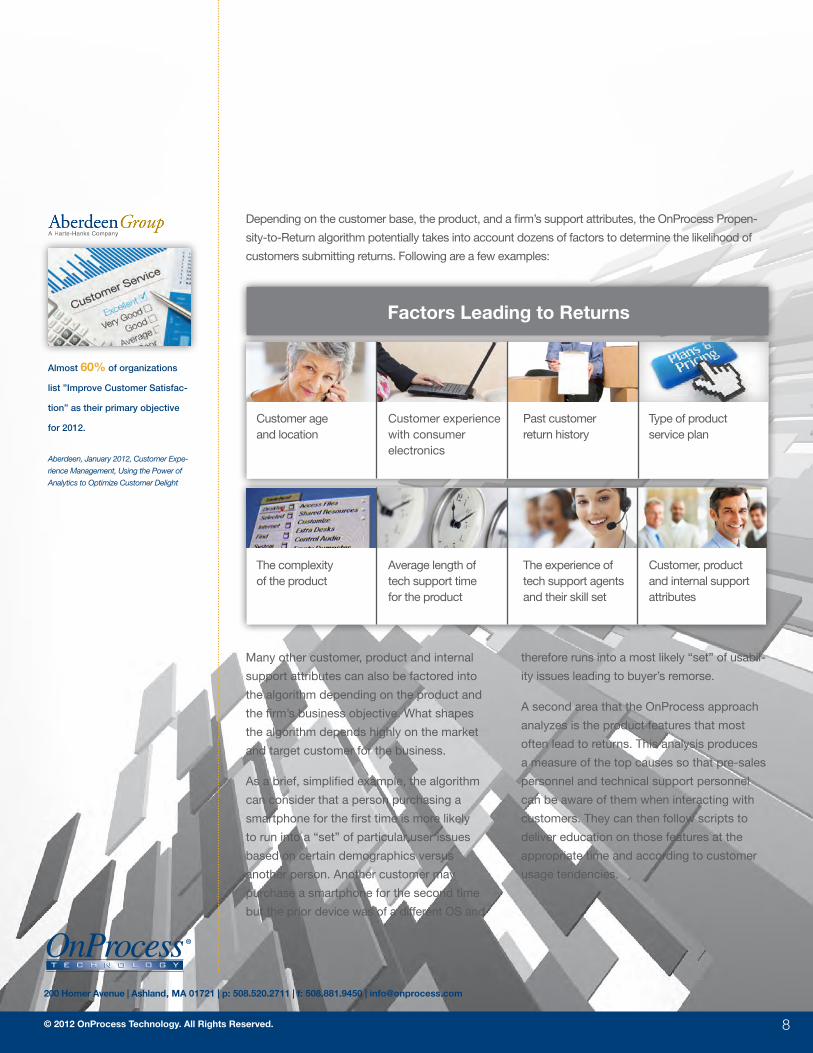
Depending on the customer base, the product, and a firm’s support attributes, the OnProcess Propen-
sity-to-Return algorithm potentially takes into account dozens of factors to determine the likelihood of
customers submitting returns. Following are a few examples:
therefore runs into a most likely “set” of usabil-
ity issues leading to buyer’s remorse.
A second area that the OnProcess approach
analyzes is the product features that most
often lead to returns. This analysis produces
a measure of the top causes so that pre-sales
personnel and technical support personnel
can be aware of them when interacting with
customers. They can then follow scripts to
deliver education on those features at the
appropriate time and according to customer
usage tendencies.
Many other customer, product and internal
support attributes can also be factored into
the algorithm depending on the product and
the firm’s business objective. What shapes
the algorithm depends highly on the market
and target customer for the business.
As a brief, simplified example, the algorithm
can consider that a person purchasing a
smartphone for the first time is more likely
to run into a “set” of particular user issues
based on certain demographics versus
another person. Another customer may
purchase a smartphone for the second time
but the prior device was of a different OS and
Almost 60% of organizations
list ”Improve Customer Satisfac-
tion” as their primary objective
for 2012.
Aberdeen, January 2012, Customer Expe-
rience Management, Using the Power of
Analytics to Optimize Customer Delight
Factors Leading to Returns
Customer age and location
Customer experience with consumer electronics
Past customer return history
Type of product service plan
The complexity of the product
Average length of tech support time for the product
The experience of tech support agents and their skill set
Customer, product and internal support attributes

200 Homer Avenue | Ashland, MA 01721 | p: 508.520.2711 | f: 508.881.9450 | [email protected]
© 2012 OnProcess Technology. All Rights Reserved. 9
For example, a listing of 100,000 customers that purchased a particular smartphone
model could be divided into 10 segments of 10,000 customers each. The resulting
segments would then be placed on a spectrum, with Group 1 being most likely to
submit a return and Group 10 being least likely as illustrated in the diagram below:
Diagram 2: The output of the OnProcess PTR Scoring by Deciles model is validated with
historical data and control groups.
Applying the Propensity-to-Return™ Algorithm
The OnProcess algorithm that measures propensity to return can be applied to a population of customers that purchase a particular product. The resulting database factors in the applicable attributes and then ranks customers according to their individual return tendencies. The algorithm then divides the customer list into segments and creates an average return propensity for the customers within each segment.
PTR SCORE BY DECILES
Overall NTF Return Rate
Model Score
Act
uals
Incremental Costs (Hard Costs)Call to Call CenterVisit to StoreReceivingFunctional TestRepackingRestockingDirect fulfillment returnRefurb cost - AvgLost Subsidy, Rev., etc.Total
$15.00$15.00
$1.50$3.50$1.50$1.00$3.50
$30.00$200.00$271.00
0%
20%
40%
60%
80%
100% 92%88%
80%
44%Model Fit
10% 9% 8% 7% 8%5%
10 9 8 7 6 5 4 3 2 1
Deciles10987654321
N898903902901887904898899901897
11 - 20%
43% 58%
Of all returns, a
staggering 68% are
labeled as no trouble
found (NTF). Another
27% are associated
with buyer’s remorse,
which can occur for
reasons similar to NTF,
such as sub-par cus-
tomer education or
improper expectation-
setting at the time of
the sale. When adding
these figures together,
95% of consumer
electronics product re-
turns are initially attrib-
uted to something other
than defects.
Accenture Report—“A Returning
Problem: Reducing the Quantity
and Cost of Product Returns in
Consumer Electronics,” by David
Douthit, Michael Flach and Vivek
Agarwal, 2011.

200 Homer Avenue | Ashland, MA 01721 | p: 508.520.2711 | f: 508.881.9450 | [email protected]
© 2012 OnProcess Technology. All Rights Reserved. 10
Expanded Methodology to Reduce Product Returns
Admittedly, there is more to the process than identifying segments that dem-onstrate high potential for improvement. Impactful results will also be realized through a number of avenues, including, but not limited to these activities:
Consumers interact with electronic devices in
a highly dynamic and fickle manner. As a result,
knowing when to contact customers becomes
an increasingly complex decision. It is impera-
tive that high-propensity to return customers
are considered for contact at each of the afore-
mentioned stages in addition to other customer
touch points.
It is also important for there to
be a designated point-in-time
when the primary outreach
effort occurs. This can vary
depending on the product and the customer.
As the OnProcess approach is applied over
time, firms gain visibility into how and when to
best interact with product return customers.
How Do Your Service
Supply Chain Operations
Measure Up?
According to Aberdeen in its
January 2012 report—Customer
Experience Management, Using
the Power of Analytics to Optimize
Customer Delight—best-in-class
businesses achieve these levels
of success within their customer
service supply chain operations:
• 82% customer retention rate
• 34.7% average year-over-
year improvement in response
to customer inquiries
• 21.4% average year-over-
year increase in customer
lifetime value
• 19.8% average year-over-
year increase in customer
satisfaction4
Aberdeen, January 2012, Customer Expe-
rience Management, Using the Power of
Analytics to Optimize Customer Delight
For example, customers in segments that
demonstrate the highest potential for improve-
ment through randomized trials could be
proactively contacted and educated on the
top features that result in product returns. The
same script can also be applied to incoming
support calls and pre-sales interactions to
further reduce product returns. Additionally, it
is essential to determine the point-in-time that
outreach should occur:
• First customer inquiry
• Sales transaction date
• Date of first use
• A specific amount of time after the purchase, such as 24-48 hours, or one week
• Date product is returned
Identifying Impactful Results
Identification
of value-added
drivers
Root-cause
analysis leading
to continuous
process
innovation
Optimized,
proactive
customer
outreach/blended
communication
Designed,
randomized
control trials to
demonstrate
cause-and-effect
Workshops on
benchmarking and
best practices

200 Homer Avenue | Ashland, MA 01721 | p: 508.520.2711 | f: 508.881.9450 | [email protected]
© 2012 OnProcess Technology. All Rights Reserved. 11
The Payoff for Reducing Product Return Rates
Conducting proactive outreach to customers with a high propensity-to-return rate and taking them through the features that most often cause returns is a big first step in reducing the product return dilemma that has plagued the consumer electronics industry for many years.
Reducing Customer Remorse Returns: A Product Return Case Study
A leader in the wireless market part-
nered with OnProcess to reduce
remorse returns for a networking
device. We devised a campaign
to provide customer education
targeted at the point-of-first-use.
During the communication,
customer service agents walked
customers through the product set-
up and then provided instruction on
basic features and functionality. The
agents then performed any neces-
sary tier-1 troubleshooting.
The OnProcess campaign activities
reduced the remorse return rate
from 20% to 15%—an overall
improvement in the return rate of
25%. The approach also reduced
the amount of product detrac-
tors by from 16% to 8% and
increased the amount of champions
from 58% to 66%.
Aberdeen, January 2012, Customer Experi-
ence Management, Using the Power of
Analytics to Optimize Customer Delight
The Accenture research referenced earlier also
presented that in some cases, returns can be re-
duced 20 percent2 by identifying and contacting
high propensity-to-return customers within 24
hours of their purchase. The script that support
personnel rely on during these calls does not
necessarily need to be detailed. The simple fact
that customers identified with a high propensity
to return are contacted, is a good first step that
can reduce the return rate appreciably.
In addition to having a positive impact on cus-
tomer perceptions of the product, the outreach
generates valuable feedback on the changes
necessary to reduce returns even further.
Manufacturers and their supply chain partners
will better understand which product design
changes to make as well as which changes to
apply to product documentation, customer on-
boarding processes, and education programs.
Projected Return Rates
By employing the OnProcess Propensity-to-
Return approach, all companies within the
consumer electronics supply chain—manu-
facturers, contract manufacturers, distributors,
carriers, and retailers—also gain visibility into
specific product lines and models. This new
business intelligence helps determine in ad-
vance which products and which processes are
more likely to produce the highest and lowest
return rates.
Given the unpredictability of how products
perform and how customers interact with prod-
ucts, the return rate may never reach zero. But
targeting a 20 plus percent reduction is within
reach for many products over time. This level
of success pays major dividends in reducing
product return support costs as well as improv-
ing brand reputation. With the proper tools and
processes, as well as improvements through
feedback the OnProcess approach naturally
generates, firms can then reduce return rates
by even greater percentages.
The key is to create an environment where
product returns can be managed and brought
under control. The OnProcess Propensity-to-
Return algorithm helps in this endeavor by
creating business intelligence so that compa-
nies can identify customers most likely to return
products. This drives visibility into understand-
ing return tendencies and improves the ability
to forecast return rates. It’s an ongoing process
that continually improves as companies begin
to understand their customers and their prod-
uct return habits to an extent previously not
thought possible.
For more information on the content and concepts presented in this white paper, please contact:
Bill Kenney, EVP, (508) 520-2711 x1122 [email protected].
John Sedej, SVP, (508) 395-8046 [email protected]. Ibid.

200 Homer Avenue | Ashland, MA 01721 | p: 508.520.2711 | f: 508.881.9450 | [email protected]
© 2012 OnProcess Technology. All Rights Reserved. 12
Contact OnProcess Technology
For more information on how OnProcess can help optimize your service supply chain operations, contact our corporate sales team at 508.623.0810 or [email protected], or visit www.onprocess.com.
200 Homer Avenue
Ashland, MA 01721
All Inquiries:
p: 508.520.2711
f: 508.881.9450
Corporate Sales Information:
p: 508.623.0810
Corporate Headquarters Additional Locations
Fall River, MA
Grenada
Not pictured: Sofia, Bulgaria
Asia HQ, Kolkata, India
As more OEM’s
narrow their focus on
core products they
need a solid partner
like OnProcess to take
over their aftermarket
product and customer
service functions with
no dip in the customer
experience. OnProcess
is well positioned in this
“sweet spot” as evi-
denced by their grow-
ing list of clients.
Dr. Bruce C. Arntzen, Executive Director, MIT Supply
Chain Management Program, MIT
Center for Transportation & Logistics