WHITE PAPER DEVELOPMENT OF AN ACCURATE, PRECISE AND …
15
WHITE PAPER DEVELOPMENT OF AN ACCURATE, PRECISE AND ROBUST DEVELOPMENT OF AN ACCURATE, PRECISE AND ROBUST METHOD FOR DETERMINATION OF THE PROTEIN CONTENT METHOD FOR DETERMINATION OF THE PROTEIN CONTENT OF BIOPHARMACEUTICAL THERAPEUTICS OF BIOPHARMACEUTICAL THERAPEUTICS ANDRÉ ABTS ANDRÉ ABTS THORE SCHMEDT THORE SCHMEDT JENNIFER S. CHADWICK JENNIFER S. CHADWICK MARTIN BLÜGGEL MARTIN BLÜGGEL www.protagenproteinservices.com
Transcript of WHITE PAPER DEVELOPMENT OF AN ACCURATE, PRECISE AND …
WHITE PAPER
DEVELOPMENT OF AN ACCURATE, PRECISE AND ROBUST DEVELOPMENT OF AN ACCURATE, PRECISE AND ROBUST METHOD FOR DETERMINATION OF THE PROTEIN CONTENT METHOD FOR DETERMINATION OF THE PROTEIN CONTENT OF BIOPHARMACEUTICAL THERAPEUTICSOF BIOPHARMACEUTICAL THERAPEUTICS
ANDRÉ ABTSANDRÉ ABTSTHORE SCHMEDTTHORE SCHMEDTJENNIFER S. CHADWICKJENNIFER S. CHADWICKMARTIN BLÜGGELMARTIN BLÜGGEL
www.protagenproteinservices.com

Development of an accurate, precise and robust method for determination Development of an accurate, precise and robust method for determination of the protein content of biopharmaceutical therapeuticsof the protein content of biopharmaceutical therapeutics
André Abts1‡, Thore Schmedt1, Jennifer S. Chadwick2, Martin Blüggel1
1Protagen Protein Services GmbH, Otto-Hahn-Str.15, 44227 Dortmund, Germany 2BioAnalytix, Inc., Cambridge, MA 02139‡To whom correspondence should be addressed: [email protected]
Abstract
The development of a biopharmaceutical consists of R&D, CMC manufacturing and clinical trial phases. The quality of the biopharmaceutical product and its assessment via biophysical and biochemical analysis are essential components of this process. The corresponding analytical methods are involved in stages of the biopharmaceutical development, serving as a foundation for process and production development, while also playing a role in assessing clinical outcome (i.e. PK) and approving the final product, from first-in-human (FIH) trials to routine market supply. The different analytical methods include a broad spectrum of techniques from standard methods as described by European and United States pharmacopeia to very specific methods for detailed characterization (e.g., in-vivo CQA determination by mass spectrometry).
Here, we focus on determining the protein concentration of the active pharmaceutical ingredient (API). This protein content determination method is included in the standard set of analytical methods and is applied in all phases throughout the development process. At a first glance, the analytical procedure for protein content determination “would appear simple”. It‘s importance, however, is reflected in the fact that patient dosing is directly related to the protein concentration of the drug substance (DS) and drug product (DP) of the medicinal product. Hence, the quantity of the API is one of the key elements of specifications for each medicinal product recommended by all regulatory bodies and described in ICH guideline 6B (1).
The requirements for the protein content determination method are thus very strict, and there is an eminent need for high precision and accuracy. Meeting both criteria is challenging and requires a sophisticated de-velopment strategy as pointed out in this article. This is particularly true if dose correction is needed, due to an inaccurate method, as this may, in turn, increase the need for reevaluating submitted dossiers, including spe-cifications and CTAs. In the worst case scenario, an inaccurate protein concentration could impact clinical trial design and execution, ultimately, triggering additional clinical studies. Overall, the potential consequences would unduly increase the workload, costs and risk of the development program, relative to those of a thorough analytical development strategy.
Here, we present a concept for developing, qualifying and validating a precise, accurate and robust method for protein content determination, one that can be adapted to the specific requirements of the product and applied universally in different phases of biopharmaceutical development, including execution at multiple laboratories and sites.
WHITE PAPER
Otto-Hahn-Str. 15, 44227 Dortmund | +49 231 9742 6100 | www.protagenproteinservices.com
IntroductionIntroduction
The determination of protein concentration duringThe determination of protein concentration duringthe development of a therapeutic biopharmaceuticalthe development of a therapeutic biopharmaceuticalis an essential and critical step. Relative to sophisti-is an essential and critical step. Relative to sophisti-cated technologies like HDX or site-specifi c masscated technologies like HDX or site-specifi c massspectrometric analysis, however, protein content met-spectrometric analysis, however, protein content met-hods are thought of as hods are thought of as ““simple“ due to the inherent simple“ due to the inherent simplicity of the underlying physical principles, analy-simplicity of the underlying physical principles, analy-tical instrumentation, and speed of measurement.tical instrumentation, and speed of measurement.
Protein content determination is the essential step inProtein content determination is the essential step infi ll-and-fi nish step for DP, as the protein content hasfi ll-and-fi nish step for DP, as the protein content hasa direct impact on the amount of therapeutic agent a direct impact on the amount of therapeutic agent administered to patients. During the process of manu-administered to patients. During the process of manu-facturing biopharmaceutical, the protein concentration facturing biopharmaceutical, the protein concentration of in-process-control (IPC), DS, and DP samples needs of in-process-control (IPC), DS, and DP samples needs to be determined for different concentration ranges and to be determined for different concentration ranges and corresponding buffers/formulations, which imposes corresponding buffers/formulations, which imposes requirements to a universal protein content method.requirements to a universal protein content method.
The protein concentration, which is determined throug-The protein concentration, which is determined throug-hout the entire process and all phases of biopharma-hout the entire process and all phases of biopharma-ceutical production, will be used by many different ceutical production, will be used by many different laboratories for a variety of intended purposes. As laboratories for a variety of intended purposes. As such, the method must be highly robust, and method such, the method must be highly robust, and method transfer must be straightforward.transfer must be straightforward.
Accurate determination of protein content is especi-Accurate determination of protein content is especi-ally important during the development phase, (in PK ally important during the development phase, (in PK studies, etc.) with regards to subcutaneous (sc) for-studies, etc.) with regards to subcutaneous (sc) for-mulations where the total administered amount is ty-mulations where the total administered amount is ty-pically an order of magnitude higher than is the case pically an order of magnitude higher than is the case for intravenous (iv) formulations. The dose is derived for intravenous (iv) formulations. The dose is derived from the extractable volume in combination with the from the extractable volume in combination with the protein concentration. Biopharmaceuticals often show protein concentration. Biopharmaceuticals often show a direct correlation between dose and corresponding a direct correlation between dose and corresponding activity, and variability of the dose could therefore lead activity, and variability of the dose could therefore lead to a pharmacokinetic profi le outside of the intended to a pharmacokinetic profi le outside of the intended activity range.activity range.
Additionally, the determined protein content directly Additionally, the determined protein content directly impacts all other assays, such as potency and bio-impacts all other assays, such as potency and bio-assays. A difference caused by inadequate precision assays. A difference caused by inadequate precision or accuracy of the protein content method will impact or accuracy of the protein content method will impact the result of bioassays and potency assays during the result of bioassays and potency assays during characterization, comparability, or release testing and characterization, comparability, or release testing and could trigger out of specifi cation events.could trigger out of specifi cation events.
Overview of analytical methods for Overview of analytical methods for protein content determinationprotein content determination
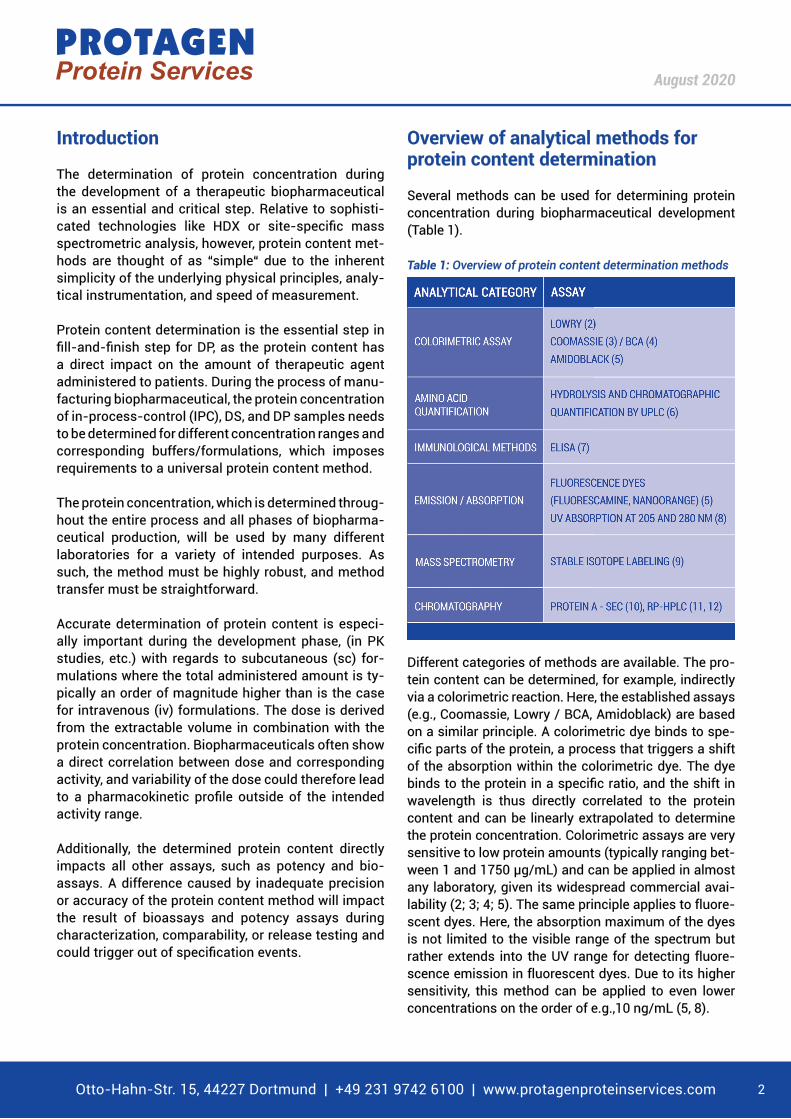
Several methods can be used for determining protein Several methods can be used for determining protein concentration during biopharmaceutical development concentration during biopharmaceutical development (Table 1). (Table 1).
Table 1:Table 1: Overview of protein content determination methodsOverview of protein content determination methods
Different categories of methods are available. The pro-Different categories of methods are available. The pro-tein content can be determined, for example, indirectly tein content can be determined, for example, indirectly via a colorimetric reaction. Here, the established assays via a colorimetric reaction. Here, the established assays (e.g., Coomassie, Lowry / BCA, Amidoblack) are based (e.g., Coomassie, Lowry / BCA, Amidoblack) are based on a similar principle. A colorimetric dye binds to spe-on a similar principle. A colorimetric dye binds to spe-cifi c parts of the protein, a process that triggers a shift cifi c parts of the protein, a process that triggers a shift of the absorption within the colorimetric dye. The dye of the absorption within the colorimetric dye. The dye binds to the protein in a specifi c ratio, and the shift in binds to the protein in a specifi c ratio, and the shift in wavelength is thus directly correlated to the protein wavelength is thus directly correlated to the protein content and can be linearly extrapolated to determine content and can be linearly extrapolated to determine the protein concentration. Colorimetric assays are very the protein concentration. Colorimetric assays are very sensitive to low protein amounts (typically ranging bet-sensitive to low protein amounts (typically ranging bet-ween 1 and 1750 µg/mL) and can be applied in almost ween 1 and 1750 µg/mL) and can be applied in almost any laboratory, given its widespread commercial avai-any laboratory, given its widespread commercial avai-lability (2; 3; 4; 5). The same principle applies to fluore-lability (2; 3; 4; 5). The same principle applies to fluore-scent dyes. Here, the absorption maximum of the dyes scent dyes. Here, the absorption maximum of the dyes is not limited to the visible range of the spectrum but is not limited to the visible range of the spectrum but rather extends into the UV range for detecting fluore-rather extends into the UV range for detecting fluore-scence emission in fluorescent dyes. Due to its higher scence emission in fluorescent dyes. Due to its higher sensitivity, this method can be applied to even lower sensitivity, this method can be applied to even lower concentrations on the order of e.g.,10 ng/mL (5, 8).concentrations on the order of e.g.,10 ng/mL (5, 8).
Otto-Hahn-Str. 15, 44227 Dortmund | +49 231 9742 6100 | www.protagenproteinservices.com
August 2020
2
Methods based on immunological binding, such as ELI-Methods based on immunological binding, such as ELI-SA assays, can be applied where a high specificity for SA assays, can be applied where a high specificity for the protein of interest is needed. the protein of interest is needed. Such assays are used Such assays are used for determining the proportion of active ingredient in the for determining the proportion of active ingredient in the presence of other UV/VIS active substances, including presence of other UV/VIS active substances, including other proteins, formulation components, etc. (7).other proteins, formulation components, etc. (7).
Another way of specifically detecting the amount of the Another way of specifically detecting the amount of the protein of interest in complex matrices or in serum is protein of interest in complex matrices or in serum is mass spectrometry. This approach involves using stable mass spectrometry. This approach involves using stable isotope labels for the purpose of generating specific isotope labels for the purpose of generating specific peptides corresponding to regions of the therapeutic peptides corresponding to regions of the therapeutic protein. These peptides serve as a calibration curve ena-protein. These peptides serve as a calibration curve ena-bling precise quantification by mass spectrometry, even bling precise quantification by mass spectrometry, even in complex mixtures (9). Chromatographic quantification in complex mixtures (9). Chromatographic quantification by HPLC represents an option for quantifying protein by HPLC represents an option for quantifying protein content by affinity chromatography (e.g., Protein A for content by affinity chromatography (e.g., Protein A for mAbs) (10), size exclusion (10) or reverse phase / hydro-mAbs) (10), size exclusion (10) or reverse phase / hydro-phobic interaction chromatography (HIC) (11; 12). HPLC phobic interaction chromatography (HIC) (11; 12). HPLC is applied for the determination of specific proteins of in-is applied for the determination of specific proteins of in-terest in protein mixtures. Here, the limit of quantification terest in protein mixtures. Here, the limit of quantification is very low and specific for the protein of interest when is very low and specific for the protein of interest when the protein can be compared to control samples. Howe-the protein can be compared to control samples. Howe-ver, the gold standard for determining the protein con-ver, the gold standard for determining the protein con-tent of biotherapeutics in solution is amino acid analysis tent of biotherapeutics in solution is amino acid analysis after hydrolysis. The protein is incubated at tempera-after hydrolysis. The protein is incubated at tempera-tures (e.g., 110 °C) in highly concentrated hydrochlo-tures (e.g., 110 °C) in highly concentrated hydrochlo-ric acid (6 M). Afterwards, the amino acids are labeled ric acid (6 M). Afterwards, the amino acids are labeled with a fluorescent dye and subsequently separated with a fluorescent dye and subsequently separated and quantified via liquid chromatography (6). The and quantified via liquid chromatography (6). The outstanding advantage of the amino acid analysis is the outstanding advantage of the amino acid analysis is the independency of the matrix and formulation of the independency of the matrix and formulation of the samples of interest. Despite the accuracy, this approach samples of interest. Despite the accuracy, this approach is laborious and is not often chosen for use through- is laborious and is not often chosen for use through- out the development process. In this article, we will focus out the development process. In this article, we will focus on the most commonly used method of protein content on the most commonly used method of protein content determination in the development of biologic drugs, which determination in the development of biologic drugs, which combines a simple physical principle with inexpensi-combines a simple physical principle with inexpensi-ve analytical equipment and straightforward execution: ve analytical equipment and straightforward execution: protein content determination via UV absorption at 280 protein content determination via UV absorption at 280 nm. nm.
The UV-based method is the industry standard and a The UV-based method is the industry standard and a must-have method in every analytical laboratory must-have method in every analytical laboratory supporting R&D, and process and manufacturing supporting R&D, and process and manufacturing development, as well as QC release and stability testing development, as well as QC release and stability testing for biopharmaceuticals (13). Protein content deter- for biopharmaceuticals (13). Protein content deter- mination by UV absorption has multiple advantages mination by UV absorption has multiple advantages for application during the development of a biopharma- for application during the development of a biopharma- ceutical. On the one hand, ceutical. On the one hand, the method is not the method is not influencedinfluenced by most of the excipients commonly utilized in the by most of the excipients commonly utilized in the biopharmaceutical biopharmaceutical formulations that might interfere formulations that might interfere
with colorimetric and fluorescent dyes. Furthermore, with colorimetric and fluorescent dyes. Furthermore, the concentration range can be adapted to almost any the concentration range can be adapted to almost any concentration by selecting a suitable dilution scheme concentration by selecting a suitable dilution scheme (described in more detail later). On the other hand, the (described in more detail later). On the other hand, the execution of an established UV method can be executed execution of an established UV method can be executed quickly and in an analytical laboratory with little invest-quickly and in an analytical laboratory with little invest-ment in instruments, relative to, say, amino acid analysis. ment in instruments, relative to, say, amino acid analysis. Importantly, the procedure for protein content analysis Importantly, the procedure for protein content analysis can be qualified and validated by UV in a GMP-compliant can be qualified and validated by UV in a GMP-compliant fashion and in a regulated GMP environment, which is fashion and in a regulated GMP environment, which is more time consuming, but more cost-efficient than most more time consuming, but more cost-efficient than most other methods (14).other methods (14).
Protein content determination by UV Protein content determination by UV absorptionabsorption
Light absorption principleLight absorption principleProteins consists of a specific arrangement of ami-Proteins consists of a specific arrangement of ami-no acids, which determine the primary, secondary, no acids, which determine the primary, secondary, tertiary, and/or quaternary structure. Furthermo-tertiary, and/or quaternary structure. Furthermo-re, the amino acids are responsible for a characte-re, the amino acids are responsible for a characte-ristic UV absorbance between around 205 to 290 nm ristic UV absorbance between around 205 to 290 nm (3). Two specific fundamental molecular structures (3). Two specific fundamental molecular structures efficiently absorb light in proteins. The peptide bond, efficiently absorb light in proteins. The peptide bond, which connects the amino acids to each other, which connects the amino acids to each other, absorbs light at a wavelength between 190 and 220 absorbs light at a wavelength between 190 and 220 nm and is typically measured at a single wavelength nm and is typically measured at a single wavelength of 205 or 210 nm. Three amino acids contain aro-of 205 or 210 nm. Three amino acids contain aro-matic side chains: tryptophan, tyrosine and phenyl-matic side chains: tryptophan, tyrosine and phenyl-alanine. These aromatic rings have side chain speci-alanine. These aromatic rings have side chain speci-fic absorption maxima (phenylalanine λfic absorption maxima (phenylalanine λmaxmax 257 nm; 257 nm; tyrosine λtyrosine λmaxmax 274.6 nm and tryptophan λ 274.6 nm and tryptophan λmaxmax 279.8 nm). 279.8 nm). For convenience 280 nm typically is used for mea-For convenience 280 nm typically is used for mea-surement protein concentration because the molar surement protein concentration because the molar absorptivity of Trp is substantially greater than absorptivity of Trp is substantially greater than Phe/Tyr, making it the most reliable wavelength to Phe/Tyr, making it the most reliable wavelength to measure the absorbance related to the aromatic measure the absorbance related to the aromatic side chains (3). The absorbance of light can be used side chains (3). The absorbance of light can be used to determine protein concentration because the amount to determine protein concentration because the amount of absorbed light is proportional to the amount of pro-of absorbed light is proportional to the amount of pro-tein. The physical principle underlying this correlation is tein. The physical principle underlying this correlation is the Lambert-Beer-Law:the Lambert-Beer-Law:
EEλλ = log10 ( I= log10 ( I00 / I / I11 ) = e ) = eλλ ** c c ** d d
Eλ = Extinction (absorbance of light at wavelength λ) I0 = Intensity incoming lightI1 = Intensity transmitting lightc = protein concentrationeλ = decadic extinction coefficient at wavelength (λ) (specific for the tested substance)d = thickness of layer (here cuvette path length)
Otto-Hahn-Str. 15, 44227 Dortmund | +49 231 9742 6100 | www.protagenproteinservices.com
August 2020
3

To measure the absorbance, the substance of interest is placed in a cuvette and analyzed in a UV spectrop-hotometer at a certain wavelength. The spectrophoto-meter measures the intensity of the light after its pas-sage through the cuvette, relative to a reference sample or blank measured in parallel or after the analysis of a blank substance in the same cuvette.
Extinction coefficient (eλ)The proportionality of the absorbance and the prote-in content is specific for every protein and related to the primary sequence of the amino acids. The precise determination of the protein-specific extinction coef-ficient is an essential step. This extinction coefficient can be evaluated theoretically based on the amino acids sequence of the protein (15). The extinction coef-ficient is not only based on the primary sequence of the amino acids but can be influence by the higher-order structure, including secondary and tertiary structure as well as oligomerization and aggregation. For this rea-son, measurement may be performed under denaturing conditions. Additionally, eλ can be influenced by prote-in modifications like glycosylation or pegylation (16). Hence, it is recommended to verify the product speci-fic extinction coefficient experimentally, for example by amino acid analysis (17).The extinction coefficient is a constant for a given mo-lecule in a given matrix and therefore the extinction co-efficient should be determined and verified in the same matrix or buffer used for protein content determination due to the fact that the matrix or buffer has a direct im-pact on the secondary, tertiary and quaternary structure of proteins which influences the extinction coefficient (18).The extinction coefficient applied by the innovator company is unknown to the biosimilars development team, and this will increase the complexity of a com-parability exercise during a biosimilarity assessment. During a biosimilarity demonstration, all methods that rely on the extinction coefficients of both the biosimilar and originator products could be impacted unless the biosimilars development team determines the extinc-tion coefficient.At the same time the protein content is one of the most important factors during a biosimilarity exercise, be-cause the filling amount, which consists of filling volu-me and protein concentration, needs to be as similar as possible between originator and biosimilar candidate. This way, both drugs behave similarly in activity assays and PK studies, which subsequently is the basis for demonstrating that the biosimilar can be applied as a substitute product. It needs to be demonstrated experi-
mentally that the determined extinction coefficient and related protein concentration of the originator and bio-similar candidate are comparable, although the formu-lation between both products might differ, which might result in a slightly different absorption behavior.
Impact of formulation and background absorption (I0 / I1)Biopharmaceutical products not only consist of the API but also are comprised of selected excipients to sta-bilize the protein. The formulation of a DP and buffer components of in-process controls contain several excipients - typically salts, surfactants/detergents, sugars, and amino acids. All these components might contribute to the absorbance measurement of the pro-tein solution and impact the evaluation of the protein concentration measurement. Most of these substances have an absorbance maximum below 250 nm or higher than 300 nm, and therefore, measurement of the absor-bance at 280 nm has further been established as the most common wavelength to specifically determine the concentration of the protein of interest.Best practice is not to use the absorbance at 280 nm directly, but to determine the absorbance at 320 nm in addition and to subtract the absorbance at 320 nm from 280 nm to correct for background absorbance (3). Furthermore, to prevent artificial absorbance, the dilu-ent without protein must be checked for the absorbance maximum as a control. Therefore, a wavelength scan from 180-700 nm is recommended, and if absorbance is detected, background subtraction by measuring the blank performed to correct for the offset. In any case, one critical step during the protein concen-tration determination is the usage of a suitable blank. Background absorption influences directly the resulting intensity and might cause under- or overestimation of the protein concentration, and thereby negatively affect the accuracy and precision of the method.
Limitation based on the path length (d) and linearity of the photometerThe third parameter of the Lambert-Beer-Law (Equa-tion [1]), which impacts the absorbance measure- ment and the protein concentration calculation, is the path length (d).The path length describes the length of the sample through which the light travels, determined by the spe-cific properties and filling volume of the cuvette. There are a number of different cuvettes available with path lengths varying from 1 mm up to 20 mm. Other features of the cuvette may also vary, such as width, depth and shape, leading to typical filling volumes ran-ging from <0.01 mL to as much as 3.5 mL.
Otto-Hahn-Str. 15, 44227 Dortmund | +49 231 9742 6100 | www.protagenproteinservices.com
August 2020
4
An additional limitation stems from the photometer. The intrinsic linearity of the wavelength detectors typi-cally ranges between 0.2 and 2 absorption units (AU).The selection of a suitable cuvette and path length, in combination with the linearity of the wavelength detec-tor of the photometer, therefore determines the mini-mum and maximum range for the protein concentration, that can be analyzed via a specific UV absorption setup. For protein concentrations outside the relevant range the protein solution may need to be diluted, depending on the protein concentration itself and on the combina-tion of instrument and cuvette (i.e. path length) (13; 19).
Evaluation of different approachesIf the product-specific extinction coefficient is not avai-lable, the protein concentration of a solution of interest can be determined relative to a calibration curve.
Calibration curveA calibration curve can be established by using a refe-rence standard of the protein of interest with a known concentration. This standard will be used to establish a calibration curve and the protein concentration of the solution of interest will then be determined relative to the calibration curve. During the biopharmaceutical development, this reference standard can be obtained from the most representative manufacturing lot or from a working reference standard. Within a biosimilarity process, an originated sample can also serve as this reference standard. One disadvantage here lies in the availability of suitable reference material for the protein of interest. Also, differences in formulation buffer com-position (between the reference material and the prote-in of interest) may not easily be accounted for and may bias determination of the concentration.In general, the use of a calibration curve minimizes the intersession variability, however, as potential deviation is negated by normalizing the protein content values to the calibration curve.
Critical parameters to consider for method development
Very high protein concentrations up to 300 g/L Several molecule-specific factors need to be conside-red when developing a protein content method based on UV absorbance. Very high DS concentrations (up to 300 g/L (13; 20)) may be present, especially in bio-pharmaceuticals used in subcutaneous formulations. A highly concentrated protein solution in combination with excipients, that stabilize the protein in solution, often results in a highly viscous solution (21). Such highly
concentrated protein solutions must be adequately diluted for protein absorbance to fall within the linear range of the UV absorbance method (i.e. the combina-tion of photometer and cuvette). In general, dilution of the protein solution adds an additional step or steps to the procedure, thereby introducing a potential source of error or high degree of variability, and should be pre-vented or minimized as much as possible (13). One way to prevent dilution steps for highly concentrated protein solutions or to limit dilution to a single step is to de-crease the path length of the cuvette (19). If the path length is shorter, the volume of protein solution (i.e. the number of molecules) for the light beam to pass through is lower, which yields a less intense signal and UV ab-sorbance. With a shorter path length, the test concen-tration of the protein can be increased and no dilution or only one dilution step is needed. Path lengths from 0.125 mm to 2 cm are commonly available, and decrea-sing the path length by a factor of ten allows users to increase the protein concentration by the same factor. For example, if using a cuvette with a path length of 1 mm, a protein concentration of 200 g/L can be diluted in one step to 10 g/L by applying a dilution factor of 20. If an extinction coefficient of 1 is assumed in this exam-ple, the absorbance will be 1 AU, which is within the li-near range of a typical UV spectrometer. If, for the same protein solution and setup, a cuvette with a 1 cm path length is used, the resulting absorbance will be 10 AU, which is outside the linear range of a typical UV spec-trophotometer, and a two-step dilution workflow might be necessary. However, high viscosity in combination with small volume and narrow path length could require very precise pipetting techniques as well as an in-depth cleaning procedure for the cuvettes. Smart selection of path length and dilution scheme can therefore decrease method variability and increase the precision and accuracy of the UV absorbance method.
Very low protein concentrations down to 0.1 g/LUnlike high-concentration protein solutions (antibodies, etc.) and high-potency therapeutics (enzymes, etc.), peptides and small proteins (parathormone, filgrastim, etc.) are formulated at low concentrations in the range of 0.1 g/L or even lower (e.g., botulinum toxin). Here, the opposite routine might be helpful, as low-concentra-tion samples such as these could potentially be mea-sured by extending the path length. If so, precision and accuracy of the protein concentration determination could be high. If the protein concentration is even lower (µg/mL - ng/mL), protein concentration can be measured reliably by using multiple other techniques, as outlined in the first paragraph, e.g., by labeling the protein with UV active or fluorescence dyes to increase sensitivity.
Otto-Hahn-Str. 15, 44227 Dortmund | +49 231 9742 6100 | www.protagenproteinservices.com
August 2020
5

Dilution factor and volumetric vs. gravimetric dilution approachDuring the development of a biopharmaceutical the API will be present at several different concentrations and under various solution conditions. For example, concentrations are typically lower for in-process con-trol samples, which have only a few excipients in their buffers. The DS is typically presented at a high protein concentration and the DP will constitute the most com-plex formulation. The protein concentration needs to be determined for all of these different types of samples, ideally with the same analytical workflow applicable to all sample types (13). A harmonized workflow for samples with different con-centrations and formulations can be achieved by dilu-ting all samples with a suitable diluent to a final testing concentration range. Whenever possible, a method that is capable of measuring a broad range of protein con-centrations without dilution should be used (13). Two main procedures are available for diluting a protein solution: A volumetric dilution or a gravimetric dilution.
A volumetric dilution is indicated when the viscosity of the protein solution and the diluents is low. This invol-ves mixing a specific volume of the protein solution with a specific volume of the diluent. Important factors when setting up a precise volumetric dilution are the start-ing concentration of the protein solution of interest and the corresponding dilution factors. In general, a dilution factor higher than 50 should be avoided, and a two-step dilution workflow might be considered to provide more reliable results. To further increase the precision and reproducibility of the method, the initial uptake volume of the solution of interest can be increased, whereas pi-petting volumes less than 10 µL should be avoided.For highly viscous protein solutions and diluents, the volumetric dilution (i.e. pipetting of the liquids) intro-duces a potential risk and variability to the dilution pro-cess. An alternative way to dilute highly viscous sam-ples is to perform a gravimetric dilution.
A defined volume of diluent is placed in the vial and the weight is determined with an analytical balance. After-wards, a defined volume of the solution of interest is added to the diluent and the final weight is determined. In addition, the weights can also be corrected for the corresponding density of the diluent and the solution of interest to further increase accuracy of the dilution procedure (22). The difference of the weights in relation to the overall weight determines the gravimetric dilution factor.
The same parameters (i.e. uptake volume, dilution factors and one vs. multiple dilution steps) should be considered for the gravimetric dilution, as outlined above for the volumetric dilution.
In addition to the establishment of a robust dilution procedure (one enabling the application of the protein content analysis procedure to all types of samples), a second generation of techniques evolved for measuring protein concentrations between 0.15 and 242 g/L wit-hout any dilution step (13). Two different approaches are feasible for determining the concentration of high-concentration protein solutions without dilution.
The first approach is based on the classic spectrop-hotometer setup in combination with very small path lengths, with or without a cuvette, and using an instru-ment such as a Nanodrop (Thermo Fischer Scientific, Waltham, MA). The use of cuvettes with very short path lengths (minimum: 0.125 mm) makes it possible to load the protein solution of interest directly, while keeping absorbance within the linear range of the spectropho-tometer. Path lengths of 0.05 and 1 mm are available for the NanoDrop device, which reduces the path length even further to allow for direct measurement of highly concentrated samples without dilution (19).The second approach is called “slope spectroscopy” and is based on the linear correlation of absorbance and path length. The SoloVPE (C Technologies Inc., Bridgewater, NJ) varies the path length during the mea-surement and records the absorption at 280 nm mul-tiple times. The linear correlation is then used for de-termining the protein concentration based on the slope of these measurements. Especially for DS samples of sc formulations, which have high protein concentrations, a dilution step might introduce potential risk for higher variability and inaccurate precision and accuracy (13).Several handling approaches and considerations were studied for mitigating problems that arise when diluting highly concentrated samples, and these are discussed below.
Otto-Hahn-Str. 15, 44227 Dortmund | +49 231 9742 6100 | www.protagenproteinservices.com
August 2020
6
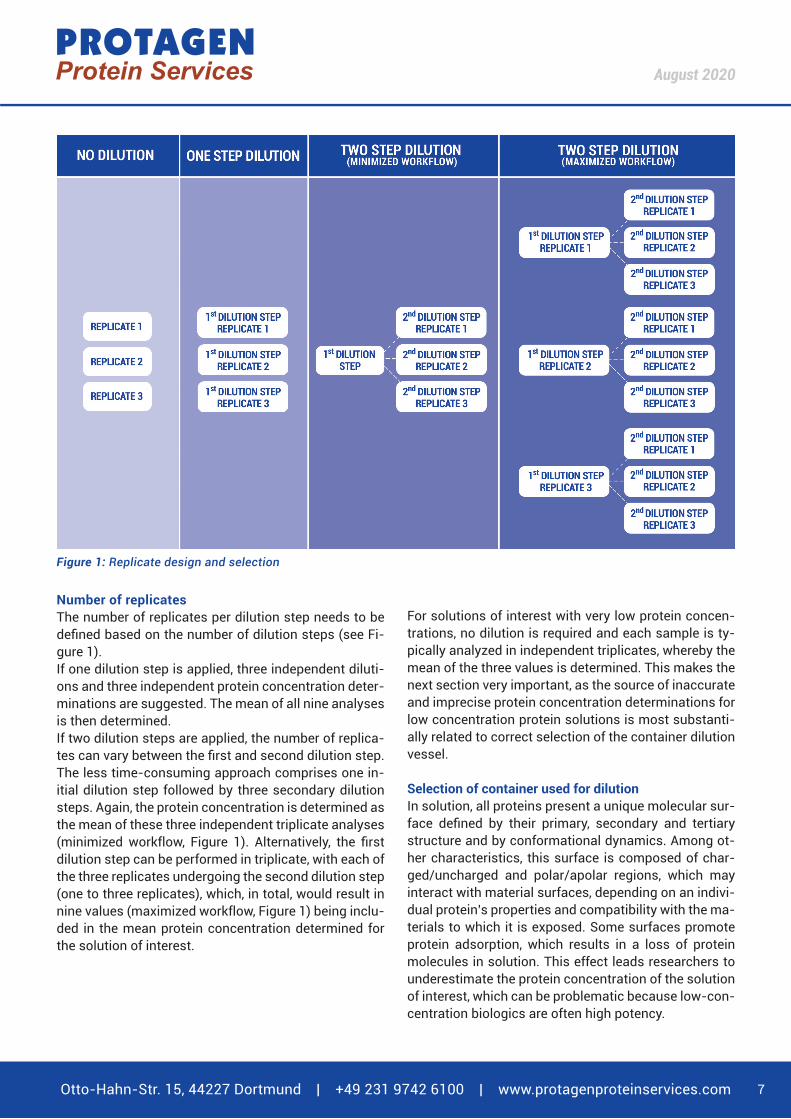
Number of replicatesThe number of replicates per dilution step needs to be defined based on the number of dilution steps (see Fi-gure 1). If one dilution step is applied, three independent diluti-ons and three independent protein concentration deter-minations are suggested. The mean of all nine analyses is then determined. If two dilution steps are applied, the number of replica-tes can vary between the first and second dilution step. The less time-consuming approach comprises one in-itial dilution step followed by three secondary dilution steps. Again, the protein concentration is determined as the mean of these three independent triplicate analyses (minimized workflow, Figure 1). Alternatively, the first dilution step can be performed in triplicate, with each of the three replicates undergoing the second dilution step (one to three replicates), which, in total, would result in nine values (maximized workflow, Figure 1) being inclu-ded in the mean protein concentration determined for the solution of interest.
For solutions of interest with very low protein concen-trations, no dilution is required and each sample is ty-pically analyzed in independent triplicates, whereby the mean of the three values is determined. This makes the next section very important, as the source of inaccurate and imprecise protein concentration determinations for low concentration protein solutions is most substanti-ally related to correct selection of the container dilution vessel.
Selection of container used for dilutionIn solution, all proteins present a unique molecular sur-face defined by their primary, secondary and tertiary structure and by conformational dynamics. Among ot-her characteristics, this surface is composed of char-ged/uncharged and polar/apolar regions, which may interact with material surfaces, depending on an indivi-dual protein’s properties and compatibility with the ma-terials to which it is exposed. Some surfaces promote protein adsorption, which results in a loss of protein molecules in solution. This effect leads researchers to underestimate the protein concentration of the solution of interest, which can be problematic because low-con-centration biologics are often high potency.
Otto-Hahn-Str. 15, 44227 Dortmund | +49 231 9742 6100 | www.protagenproteinservices.com
August 2020
7
Figure 1: Replicate design and selection

To identify incompatibilities in material choices, dif-ferent containers, transfer materials, and/or cuvettes should be tested during the development of a protein-specific method. The first step is to test vials made of glass or polypropylene, as these are considered to have less potential for binding many proteins. Some ma-nufacturers offer coated vials to specifically increase recovery and prevent protein adsorption effects.
DiluentsUse of an appropriate diluent is also dependent on the container material and can support recovery during the dilution steps. A diluent containing components that saturate the surface of the container before the protein solution is added could increase recovery. However, the addition of surfactants, detergents and other excipients that prevent absorption along the container surface need to be considered carefully, because UV absorban-ce at 280 nm must be low in order to minimize back-ground absorption and interference with the analytical procedure.
Table 2 shows an example of the impact that the com-bination of container material (glass vs. polypropylene), and diluent selection (PBS with and without detergent) has for a specific protein (IgG) with a target protein con-centration of 100 g/L. Table 2: Selection of container and diluent In this case study (Table 2) a gravimetric two step di-lution is performed and the diluent containing deter-gent decreased the variability of the method. Using the glass vial resulted in lower protein concentrations than using the coated polypropylene vial. Therefore, the coa-ted polypropylene vial in combination with detergent-containing diluent gave the most accurate and precise results.
Pipetting stylesAttention should be paid to pipetting techniques when pipetting highly viscous solutions or when an interac-tion between the protein and the container surface is observed during method development. The manufac-turers of pipettes provide detailed instructions and re-commendations for how to pipette solutions, and se-veral guidelines are available that detail good pipetting practices (23, 24, 25) (Table 3). Table 3: Pipetting recommendations by pipette vendors.
The general recommendation is to prewet the pipette tips and release the liquid along the vessel wall in order to utilize capillary action.A more detailed description of the pipetting process is needed, however, for method training and/or optimiza-tion. In the following case study (Figure 2), three diffe-rent pipetting styles were applied with a detergent-con-taining diluent (because the protein was known to have a strong interaction with the container surface).
Figure 2: Comparison of different pipetting styles. Prewet and release of diluent and sample at the same wall position (A), Prewet and release of diluent and sample at different wall positions (B), Release of sample directly above the prefilled diluent (C).
Otto-Hahn-Str. 15, 44227 Dortmund | +49 231 9742 6100 | www.protagenproteinservices.com
August 2020
8

Table 4 shows the results of the case study depicted in Figure 2, comparing different pipetting styles to reach a known target protein concentration.
Table 4: Protein concentration depending on the pipetting style.
The lowest protein concentration was obtained when two different operators (1+2) applied pipetting style B. Although pipetting style B follows the recommendati-ons of the manufacturers (i.e. release the protein along the surface of the vial), the protein was observed to ad-sorb to the vessel surface.
When pipetting style A was applied, which involves sa-turating the wall of the container by releasing the de-tergent-containing diluent and then, in a second step, releasing the protein solution at the same spot on the container wall, the protein concentration was found to increase, although it was still lower than the expected target level.
Finally, in pipetting style C, the diluent was placed in the vial and the protein solution was released directly ab-ove the diluent without any interaction with the contai-ner surface. This technique increased recovery compa-red to pipetting styles A and B, and yielded results very close to the expected target concentration.
From method setup to release testingMethod setup, development, and optimizationTaking the suggestions and considerations of the last sections into account, the development of a protein content method might follow the sequence described below (see Figure 3).
After passing the required decision points shown in Fi-gure 3, the next step is to test the final setup through confirmation runs. These confirmation runs should include the maximum number of variables expected during later application. The best case scenario will include several different operators, instruments, dilu-ent batches, cuvette batches, and analytical sessions. When final recovery and variability are acceptable, the method can be considered fit for its intended purpose. The next step is to qualify the method to verify appli-cability.
Otto-Hahn-Str. 15, 44227 Dortmund | +49 231 9742 6100 | www.protagenproteinservices.com
August 2020
9
Figure 3: Schematic route to develop a protein content method

Qualification and validation of the method
Qualification and validationMethod qualification covers the critical parameters of precision, specificity and linearity based in the recommendation of the ICH guideline Q2(R1) (26) for validating methods (see Table 5). The method should exhibit sufficient precision as determined by repeatability and intermediate precision testing, as well as by demonstrating method specificity in the form of negative results from absorbance testing on the diluents and the formulation.
The linearity of the method should range from 50% up to 150% in equidistant intervals. The final test con-centration after all dilution steps is used as the 100% level. If the method passes all three parameters, it is sufficiently developed to be validated for the purpose of release testing, etc.The method validation parameters shown in Table 5 are derived from the ICH Q2(R1) (26) guideline relea-sed by the EMA in June 1995.
Otto-Hahn-Str. 15, 44227 Dortmund | +49 231 9742 6100 | www.protagenproteinservices.com
August 2020
10
Table 5: Overview of method qualification and validation parameters

PrecisionDetermination of precision is similar to tests perfor-med during method development and qualification. The highest possible number of aspects should be varied for intermediate precision testing (e.g., operator, equip-ment, reagents, sessions, sites).
Linearity and rangeThe linearity must also be tested at dilutions ranging from 50% to 150% in equidistant steps, based on the final diluted concentration. Linearity analysis is perfor-med in triplicate at each concentration level, because this allows researchers to determine recovery at each concentration level relative to 100% level, and conse-quently, to derive the accuracy parameter from the same data set. The three replicates at each level can also be used for determining the CV. The overall range can be assessed from the linearity data together with the recovery of the accuracy parameter and in combi-nation with the precision at each concentration level.
SpecificityIn terms of specificity, the diluent and formulations should not exhibit any absorbance during testing that would otherwise result in under- or over-estimation of the protein concentration. In addition, one may be required to show that the met-hod is able to distinguish between products manufac-tured at the same site may be necessary as well. If a si-milar product is manufactured at the same site, and the final concentrations differ from each other, this product could be used to establish specificity relative to simi-lar products. Applying the same dilution factors would cause the protein concentration of the alternative pro-duct to fall outside of the ranges determined during precision testing. Consequently, it can be concluded that this is not the protein of interest.
RobustnessThe robustness of the method should focus on opera-tor-specific issues such as the dilution factor, as well as on instrument- and method-related factors such as wavelength variability and reagents in the diluent that are critical during dilution (sugars that raise the visco-sity, detergents that minimize absorption effects, etc.) (Table 6).
Table 6: Parameter examined for robustness testing
Robustness testing can be set up using a Plackett-Burman (Ferreira SLC, 2017) design, as shown in Ta-ble 7 below. In this example, three critical parame-ters have been selected to be increased (H = upper/high value) or decreased (L = lower value) from the regular applied setting. The matrix in Table 7 can be used to verify the influence of different combinations of changed settings or parameters that could impact the results and variability of the analytical method.
Table 7: Plackett-Burman design for robustness testing. H = upper/high value, L = lower value.
Otto-Hahn-Str. 15, 44227 Dortmund | +49 231 9742 6100 | www.protagenproteinservices.com
August 2020
11
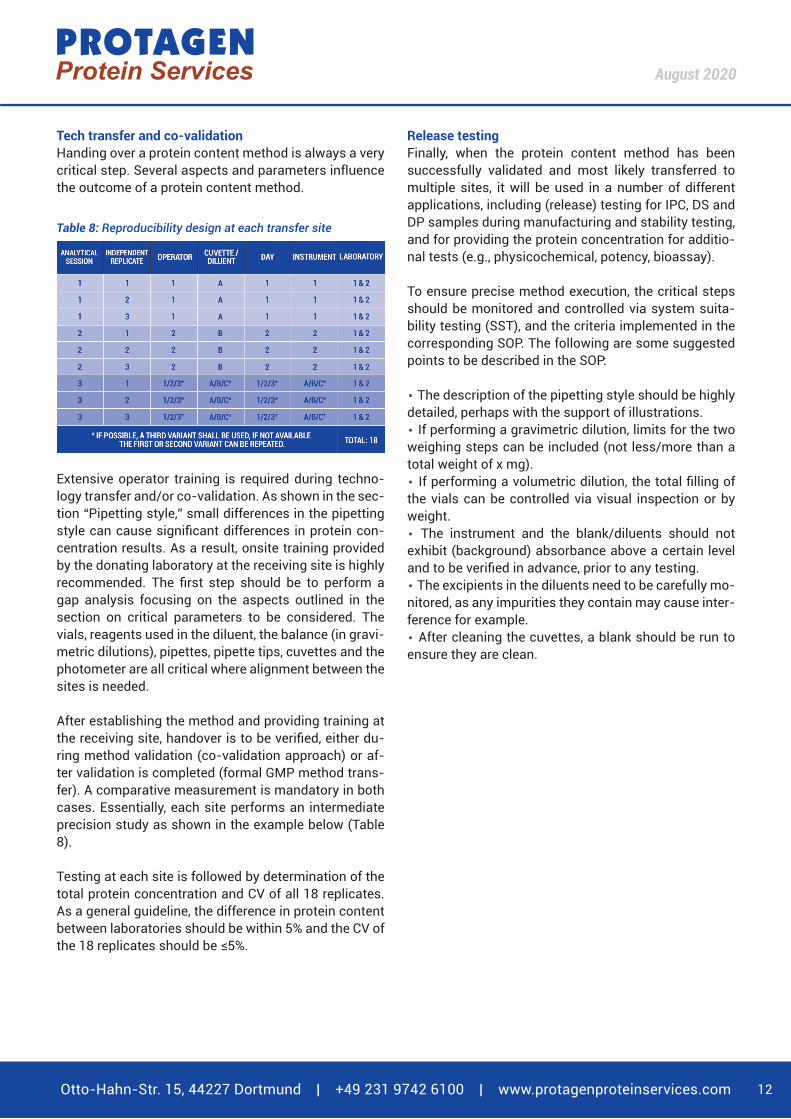
Tech transfer and co-validationHanding over a protein content method is always a very critical step. Several aspects and parameters influence the outcome of a protein content method.
Table 8: Reproducibility design at each transfer site
Extensive operator training is required during techno-logy transfer and/or co-validation. As shown in the sec-tion “Pipetting style,” small differences in the pipetting style can cause significant differences in protein con-centration results. As a result, onsite training provided by the donating laboratory at the receiving site is highly recommended. The first step should be to perform a gap analysis focusing on the aspects outlined in the section on critical parameters to be considered. The vials, reagents used in the diluent, the balance (in gravi-metric dilutions), pipettes, pipette tips, cuvettes and the photometer are all critical where alignment between the sites is needed.
After establishing the method and providing training at the receiving site, handover is to be verified, either du-ring method validation (co-validation approach) or af-ter validation is completed (formal GMP method trans-fer). A comparative measurement is mandatory in both cases. Essentially, each site performs an intermediate precision study as shown in the example below (Table 8).
Testing at each site is followed by determination of the total protein concentration and CV of all 18 replicates. As a general guideline, the difference in protein content between laboratories should be within 5% and the CV of the 18 replicates should be ≤5%.
Release testingFinally, when the protein content method has been successfully validated and most likely transferred to multiple sites, it will be used in a number of different applications, including (release) testing for IPC, DS and DP samples during manufacturing and stability testing, and for providing the protein concentration for additio-nal tests (e.g., physicochemical, potency, bioassay).
To ensure precise method execution, the critical steps should be monitored and controlled via system suita-bility testing (SST), and the criteria implemented in the corresponding SOP. The following are some suggested points to be described in the SOP:
. The description of the pipetting style should be highly detailed, perhaps with the support of illustrations. . If performing a gravimetric dilution, limits for the two weighing steps can be included (not less/more than a total weight of x mg). . If performing a volumetric dilution, the total filling of the vials can be controlled via visual inspection or by weight.. The instrument and the blank/diluents should not exhibit (background) absorbance above a certain level and to be verified in advance, prior to any testing.. The excipients in the diluents need to be carefully mo-nitored, as any impurities they contain may cause inter-ference for example.. After cleaning the cuvettes, a blank should be run to ensure they are clean.
Otto-Hahn-Str. 15, 44227 Dortmund | +49 231 9742 6100 | www.protagenproteinservices.com
August 2020
12
Conclusion
The requirements for protein content determination via UV absorption at 280 nm are established on the basis of both the specific characteristics of the protein of inter-est and the demands of the health authorities (1).
In order to meet all of these requirements, development must be designed to take all influencing factors into account. In this article we present guidelines describing the most critical aspects to be considered during the development and execution of a protein content de-termination method. One of the primary parameters determining the final execution setup derives from the protein of interest itself and the corresponding manu-facturing process. High protein concentrations (as may be observed during the production of monoclonal an-tibodies administered subcutaneously to the patient) require the development of a reliable dilution strategy suitable for DS, DP and IPC samples.
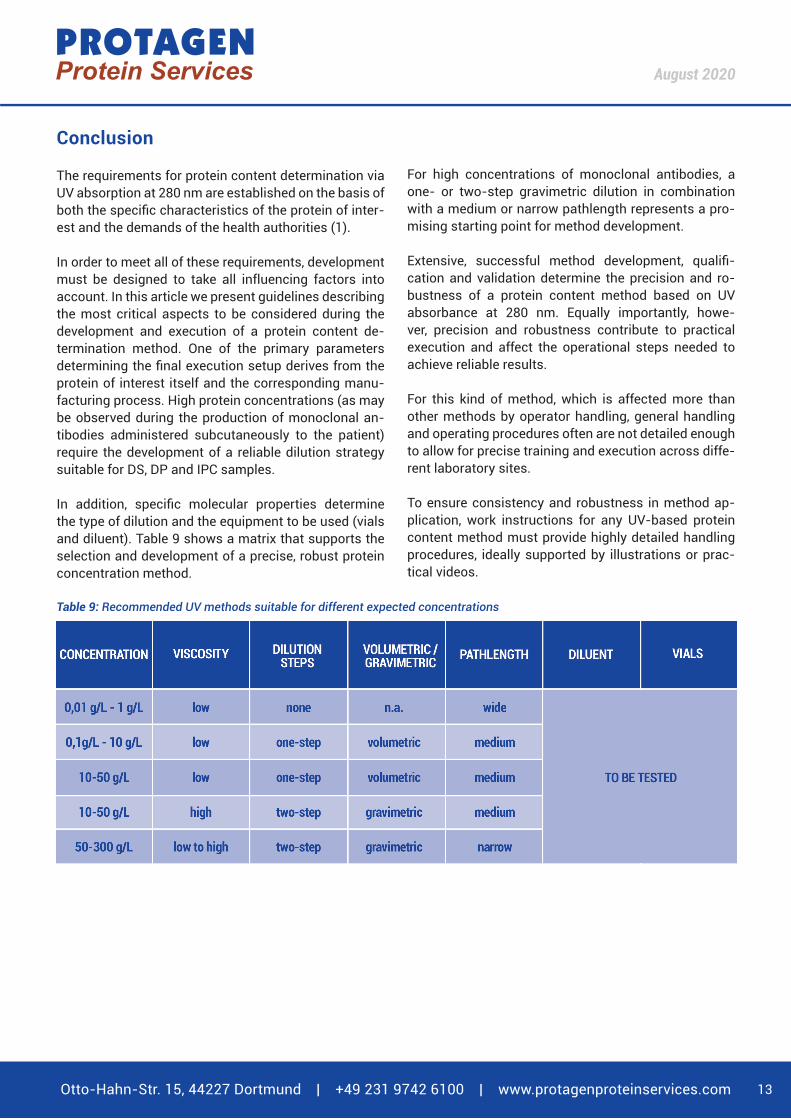
In addition, specific molecular properties determine the type of dilution and the equipment to be used (vials and diluent). Table 9 shows a matrix that supports the selection and development of a precise, robust protein concentration method.
For high concentrations of monoclonal antibodies, a one- or two-step gravimetric dilution in combination with a medium or narrow pathlength represents a pro-mising starting point for method development.
Extensive, successful method development, qualifi-cation and validation determine the precision and ro-bustness of a protein content method based on UV absorbance at 280 nm. Equally importantly, howe-ver, precision and robustness contribute to practical execution and affect the operational steps needed to achieve reliable results.
For this kind of method, which is affected more than other methods by operator handling, general handling and operating procedures often are not detailed enough to allow for precise training and execution across diffe-rent laboratory sites.
To ensure consistency and robustness in method ap-plication, work instructions for any UV-based protein content method must provide highly detailed handling procedures, ideally supported by illustrations or prac-tical videos.
Otto-Hahn-Str. 15, 44227 Dortmund | +49 231 9742 6100 | www.protagenproteinservices.com
August 2020
13
Table 9: Recommended UV methods suitable for different expected concentrations

AcknowledgementAcknowledgement
We thank our sponsors and especially our operator who have a high motivation and affiliation to the analytical methods and molecule specific challenges whom they encounter every day.
ReferencesReferences
11ICH, Topic Q 6 B. ICH, Topic Q 6 B. Specifications: Test Procedures and Acceptance Specifications: Test Procedures and Acceptance Criteria for Biotechnological/Biological. Criteria for Biotechnological/Biological. 22Lowry OH, Rosebrough NJ, Farr AL,.Lowry OH, Rosebrough NJ, Farr AL,. Protein measurement with Protein measurement with the Folin phenol reagent. J Biol Chem. 1951, 193(1):265-75, pp. the Folin phenol reagent. J Biol Chem. 1951, 193(1):265-75, pp. 193:265–275.193:265–275.33JE, Noble. JE, Noble. Quantification of Protein Concentration Using UV Ab-Quantification of Protein Concentration Using UV Ab-sorbance and Coomassie Dyes. Methods Enzymol. 2014, 536:17-26.sorbance and Coomassie Dyes. Methods Enzymol. 2014, 536:17-26.44MM, Bradford.MM, Bradford. Rapid and sensitive method for quantitation of mi- Rapid and sensitive method for quantitation of mi-crogram quantities of protein utilizing principle of protein-dye bin-crogram quantities of protein utilizing principle of protein-dye bin-ding. Analytical Biochemistry. 1976, 72;248-254, pp. 72:248–254.ding. Analytical Biochemistry. 1976, 72;248-254, pp. 72:248–254.55Aschermann K, Lutter P, Wattenberg A.Aschermann K, Lutter P, Wattenberg A. Current Status of Protein Current Status of Protein Quantification Technologies. Bioprocess Technical. April 2008, 44-Quantification Technologies. Bioprocess Technical. April 2008, 44-53, pp. 44-53.53, pp. 44-53.66Moore S, Stein WH.Moore S, Stein WH. Chromatographic determination of amino acids Chromatographic determination of amino acids by the use of automatic recording equipment. Methods in Enzymo-by the use of automatic recording equipment. Methods in Enzymo-logy. 1963, 6;819-831, pp. 6, 819–831.logy. 1963, 6;819-831, pp. 6, 819–831.77Williams, Jörg M. Steiner and David A.Williams, Jörg M. Steiner and David A. Development and analytical Development and analytical validation of an enzyme linked immunosorbent assay for the mea-validation of an enzyme linked immunosorbent assay for the mea-surement of canine gastric lipase immunoreactivity in serum. Can J surement of canine gastric lipase immunoreactivity in serum. Can J Vet Res. 2004, pp. 68(3): 161–168.Vet Res. 2004, pp. 68(3): 161–168.88JPD, Goldring. JPD, Goldring. Measuring Protein Concentration with Absorbance, Measuring Protein Concentration with Absorbance, Lowry, Bradford Coomassie Blue, or the Smith Bicinchoninic Acid Lowry, Bradford Coomassie Blue, or the Smith Bicinchoninic Acid Assay Before Electrophoresis. Electrophoretic Separation of Prote-Assay Before Electrophoresis. Electrophoretic Separation of Prote-ins: Methods and Protocols,. 2018, 1855; 31-39.ins: Methods and Protocols,. 2018, 1855; 31-39.99Valerie C. Wasinger, Ming Zeng, and Yunki Yau. Valerie C. Wasinger, Ming Zeng, and Yunki Yau. Current Status and Current Status and Advances in Quantitative ProteomicMass Spectrometry. Internatio-Advances in Quantitative ProteomicMass Spectrometry. Internatio-nal Journal of Proteomics. 2013, p. 180605.nal Journal of Proteomics. 2013, p. 180605.1010Horak J, Ronacher A, Lindner W. Horak J, Ronacher A, Lindner W. Quantification of immunoglobulin Quantification of immunoglobulin G and characterization of process related impurities using coupled G and characterization of process related impurities using coupled Protein A and size exclusion high performance liquid chromatogra-Protein A and size exclusion high performance liquid chromatogra-phy. Journal of Chromatography A. 2010, 30; 5092-5102.phy. Journal of Chromatography A. 2010, 30; 5092-5102.1111Suzuki Y, Nobusawa A, Furuta N. Suzuki Y, Nobusawa A, Furuta N. Quantification of Protein s by Quantification of Protein s by Measurin g the Sulfur Content of Their Constituent Peptides by Me-Measurin g the Sulfur Content of Their Constituent Peptides by Me-ans of Nano HPLC-ICPMS. ANALYTICAL SCIENCES. 2014, 30; 551-ans of Nano HPLC-ICPMS. ANALYTICAL SCIENCES. 2014, 30; 551-559.559.1212Bonfatti V, Giantin M, Rostellato R, Dacasto M, Carnier P. Bonfatti V, Giantin M, Rostellato R, Dacasto M, Carnier P. Separa-Separa-tion and quantification of water buffalo milk protein fractions and tion and quantification of water buffalo milk protein fractions and genetic variants by RP-HPLC. Food Chemistry. 2013, 2; 364-367.genetic variants by RP-HPLC. Food Chemistry. 2013, 2; 364-367.1313McKechnie WS, Tugcu N, Kandula S. McKechnie WS, Tugcu N, Kandula S. Accurate and Rapid Prote-Accurate and Rapid Prote-in Concentration Measurement of In-Process, High Concentration in Concentration Measurement of In-Process, High Concentration Protein Pools. Biotechnol. Prog. 2018, 1-8.Protein Pools. Biotechnol. Prog. 2018, 1-8.1414Lundblad RL, Price NC. Lundblad RL, Price NC. Protein Concentration Determination The Protein Concentration Determination The Achilles’ Heel of cGMP. BioProcess Technical. 2004, 38-45.Achilles’ Heel of cGMP. BioProcess Technical. 2004, 38-45.1515Artimo P, Jonnalagedda M, Arnold K, Baratin D. Artimo P, Jonnalagedda M, Arnold K, Baratin D. ExPASy: SIB bioin-ExPASy: SIB bioin-formatics resource portal. Nucleic Acids Res,. 2012, 40(W1):W597-formatics resource portal. Nucleic Acids Res,. 2012, 40(W1):W597-W603, pp. 40(W1):W597-W603,.W603, pp. 40(W1):W597-W603,.
1616Noble JE, Knight AE, Reason AJ. Noble JE, Knight AE, Reason AJ. A Comparison of Protein Quan-A Comparison of Protein Quan-titation Assays for Biopharmaceutical Applications. Molecular Bio-titation Assays for Biopharmaceutical Applications. Molecular Bio-technology. 2007, 37, pages99–111.technology. 2007, 37, pages99–111.1717CN, Pace.CN, Pace. How to measure and predict the molar absorption coef- How to measure and predict the molar absorption coef-ficient of a protein. Protein Science. 1995, 4; 2411-2423, pp. 4(11), ficient of a protein. Protein Science. 1995, 4; 2411-2423, pp. 4(11), 2411-23.2411-23.1818Maitya H, Wei A , Chen E, Haidar JN, rivastava A, Goldstein J.Maitya H, Wei A , Chen E, Haidar JN, rivastava A, Goldstein J. Com- Com-parison of predicted extinction coefficients of monoclonal antibo-parison of predicted extinction coefficients of monoclonal antibo-dies with experimental values as measured by the Edelhoch met-dies with experimental values as measured by the Edelhoch met-hod. International Journal of Biological Macromolecules. 2015, 77; hod. International Journal of Biological Macromolecules. 2015, 77; 260-265.260-265.1919Watson, L and Veeraragavan, K. Watson, L and Veeraragavan, K. Dilution-Free Protein Concentrati-Dilution-Free Protein Concentrati-on Measurement for high protein concentration samples. BioPharm on Measurement for high protein concentration samples. BioPharm International. 27,2: 2014.International. 27,2: 2014.2020NW, Warne.NW, Warne. Development of high concentration protein biophar- Development of high concentration protein biophar-maceuticals: The use of platform approaches in formulation de-maceuticals: The use of platform approaches in formulation de-velopment. European Journal of Pharmaceutics and Biopharmaceu-velopment. European Journal of Pharmaceutics and Biopharmaceu-tics. 2011, 2; 208-212.tics. 2011, 2; 208-212.2121Liu J, Nguyen MDH, Andya JD, Shire SJ. Liu J, Nguyen MDH, Andya JD, Shire SJ. Reversible Self-Associa-Reversible Self-Associa-tion Increases the Viscosity of a Concentrated Monoclonal Antibody tion Increases the Viscosity of a Concentrated Monoclonal Antibody in Aqueous Solution. Journal of Pharmaceutical Sciences. 2005, 9; in Aqueous Solution. Journal of Pharmaceutical Sciences. 2005, 9; 1928-1940.1928-1940.2222Fraser, A.Fraser, A. Gravimetric Preparation of Standard Solutions. Applica- Gravimetric Preparation of Standard Solutions. Applica-tion Note 8. 2007.tion Note 8. 2007.2323Eppendorf.Eppendorf. Pipetting Techniques. https://handling-solutions.ep- Pipetting Techniques. https://handling-solutions.ep-pendorf.com/fileadmin/Community/FAQs/2112017/PDFs/Poster_pendorf.com/fileadmin/Community/FAQs/2112017/PDFs/Poster_PipettingTechniques_72923.PDF. PipettingTechniques_72923.PDF. 2424Gilson.Gilson. GUIDE TO PIPETTING Third Edition. https://de.gilson.com/ GUIDE TO PIPETTING Third Edition. https://de.gilson.com/pub/static/frontend/Gilson/customtheme/en_US/images/docs/pub/static/frontend/Gilson/customtheme/en_US/images/docs/GuideToPipettingE.pdf. GuideToPipettingE.pdf. 2525Fischer, Thermo. Fischer, Thermo. Thermo Scientific Good Laboratory Pipetting Thermo Scientific Good Laboratory Pipetting (GLP) Practices. https://assets.thermofisher.com/TFS-Assets/(GLP) Practices. https://assets.thermofisher.com/TFS-Assets/LPD/manuals/Good-Lab-Pipetting-Guide-1517630-01-Brochure-LPD/manuals/Good-Lab-Pipetting-Guide-1517630-01-Brochure-EN.pdf. EN.pdf. 2626ICH, Topic Q 2 (R1).ICH, Topic Q 2 (R1). Validation of Analytical Procedures: Text and Validation of Analytical Procedures: Text and Methodology; 1995 June European Medicines Agency. Methodology; 1995 June European Medicines Agency. 2727Ferreira SLC, Caires AO, Borges T. Ferreira SLC, Caires AO, Borges T. Robustness evaluation in ana-Robustness evaluation in ana-lytical methods optimized using experimental designs. Microchemi-lytical methods optimized using experimental designs. Microchemi-cal Journal. 2017, 131, Pages 163-169.cal Journal. 2017, 131, Pages 163-169.2828Smith PK, Krohn RI, Hermanson GT, Mallia AK, Gartner FH, Pro-Smith PK, Krohn RI, Hermanson GT, Mallia AK, Gartner FH, Pro-venzano MD, Fujimoto EK, Goeke NM, Olson BJ, Klen DC. venzano MD, Fujimoto EK, Goeke NM, Olson BJ, Klen DC. Measure-Measure-ment of protein using bicinchoninic acid. Anal Biochem. 1985, pp. ment of protein using bicinchoninic acid. Anal Biochem. 1985, pp. 150:76–85.150:76–85.
Otto-Hahn-Str. 15, 44227 Dortmund | +49 231 9742 6100 | www.protagenproteinservices.com
August 2020
14