WHITE PAPER - coating-additives.com · Price is a big driving factor in the pigment concentrate...
13
WHITE PAPER An efficient approach to dispersing pigments Nikolina Milanovic and Brian O. Casey, Evonik Resource Efficiency
Transcript of WHITE PAPER - coating-additives.com · Price is a big driving factor in the pigment concentrate...

WHITE PAPER
An efficient approach to dispersing pigments
Nikolina Milanovic and Brian O. Casey, Evonik Resource Efficiency
page 2
WHITE PAPER:
An efficient approach to dispersing pigments
ABSTRACTAs problems related to pigment dispersions become more frequent and as requirements regard-ing color reproducibility become increasingly rigorous, new demands for pigment wetting agents and dispersants are required to resolve these pigment stabilization issues. Over the past 20 years, advances in polymeric dispersants have made significant improvements in the process of wetting and stabilizing pigments. As a result, many dispersant technologies that better stabilize small pigment particles and that better prevent flocculation are emerging in the marketplace. This paper will explain pigment and dispersant interfaces and how harmonizing and optimizing these inter-actions will lead to a better pigment dispersion.
INTRODUCTIONUntil the development of synthetic pigments, pigments of natural origin – materials such as clay, earth colors, and minerals – were used to color paints. Vegetable oils with high lecithin content were used to wet out natural pigments. Since then, technology has progressed immensely.
Dispersing pigments is sometimes viewed as an art instead of a technical process. This is mainly due to the multiple steps that occur during the dispersion process. These processes can seem confusing, but breaking the steps down into a structured manner makes them easier to under-stand and helps find solutions faster.
The following research explains the science behind dispersing pigments and fillers, in hopes to reach a better understanding of how to stabilize them more efficiently. This study discusses different types of wetting and dispersing additives that can be used to stabilize two notoriously difficult pigments.
PIGMENT AND ADDITIVE INTERACTIONSPigments are tiny solid particles that have the ability to refract light [1]. Pigments serve two main functions: an optical function, providing color, opacity, and gloss; and a protective function, for the surface beneath the coating.
Structures of pigments
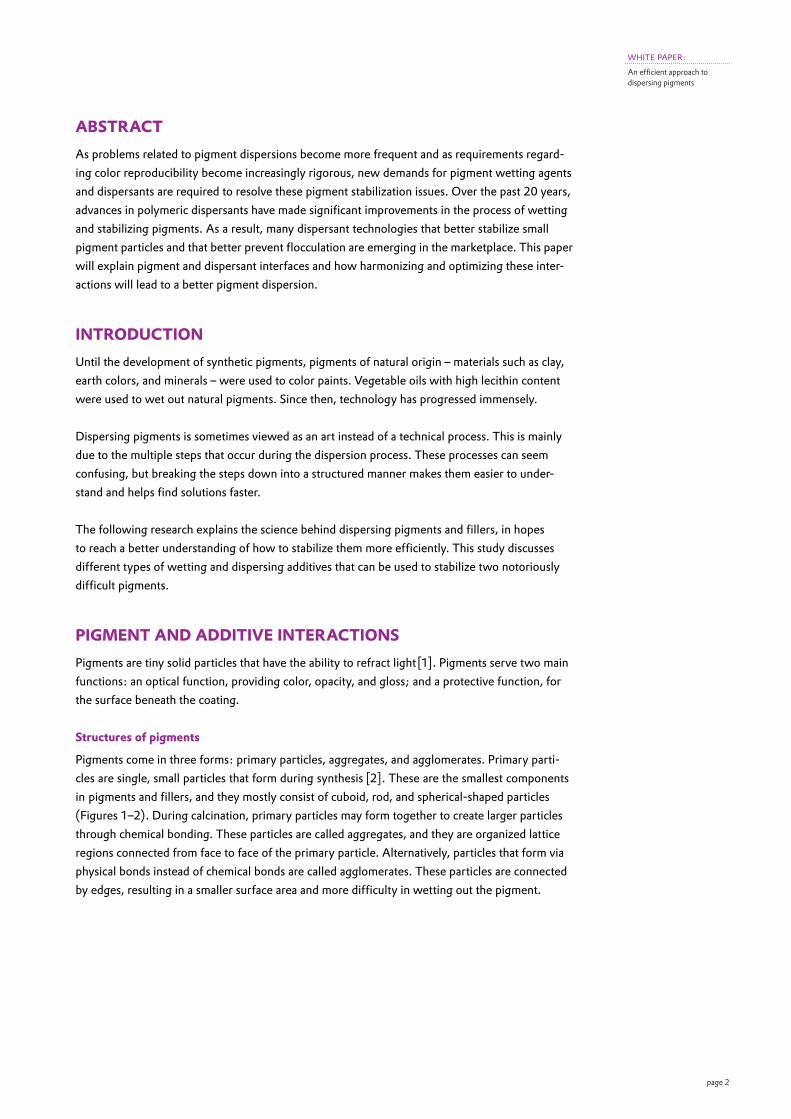
Pigments come in three forms: primary particles, aggregates, and agglomerates. Primary parti-cles are single, small particles that form during synthesis [2]. These are the smallest components in pigments and fillers, and they mostly consist of cuboid, rod, and spherical-shaped particles (Figures 1–2). During calcination, primary particles may form together to create larger particles through chemical bonding. These particles are called aggregates, and they are organized lattice regions connected from face to face of the primary particle. Alternatively, particles that form via physical bonds instead of chemical bonds are called agglomerates. These particles are connected by edges, resulting in a smaller surface area and more difficulty in wetting out the pigment.
page 3
WHITE PAPER:
An efficient approach to dispersing pigments
Organic and inorganic pigments
Pigments are widely classified as either organic or inorganic. Inorganic pigments are used for coloristic properties as well as other properties such as anti-static and anti-corrosion character-istics. Inorganic pigments normally have a high refractive index, meaning they have a greater ability to scatter light [3]. Therefore, these pigments are very good at “hiding” the surface under the coating layer. Oxide compounds such as titanium dioxide and iron oxides are typical examples of inorganic pigments. Carbon blacks are technically classified as inorganic pigments, but they require a different anchor group to adsorb onto the pigment surface [4].
Organic pigments are intensely colored, therefore they are incorporated solely for their coloristic properties. Organic pigments are classified as azopigments, polycyclic pigments, and anthraqui-none pigments [4]. They tend to have a smaller particle size than inorganic pigments, thus making them more transparent. They have a tendency to dissolve when moisture is present, which causes them to migrate and chalk to the surface. Because of their smaller particle size, organic pigments are normally more difficult to disperse compared to inorganic pigments. Because most inorganic pigments have polar surfaces, they are much easier to wet out.
Dispersing technology
In order to understand wetting and dispersing agents, a fundamental knowledge of the dispersing process is required. Dispersing agents stabilize deflocculated pigment particles. For stabilization of these particles to occur, the dispersant must be able to overcome van der Waals attractions that are constantly moving pigment particles back together [2]. The pigment dispersion process can be broken down into three steps: wetting, de-agglomeration, and stabilization.
Figures 1-2: Transmission electron microscope images of iron oxide pigments
page 4
WHITE PAPER:
An efficient approach to dispersing pigments
Step one: Wetting
The first step of the dispersion process consists of wetting the pigments by a liquid. The liquid spreads over the pigment surface and fills the voids and pores of the pigment, displacing any remaining air pockets [2]. For a pigment to be wetted by a liquid, the surface tension of the liquid must be lower than the surface energy of the pigment [1]. This interaction between pigment and liquid is described below by the Young equation. A liquid with a low surface tension typically wets pigments better than one with a higher surface tension.
Ys = Ysl + Yl • cosΘ Equation 1
Step two: De-agglomeration
After the pigments are wetted, they are broken down to achieve small particle sizes with a large surface area. This yields a higher color strength, which is more cost-efficient for paint manufacturers.
In order to grind down to smaller particle sizes, more energy is required. To break up agglomerates and increase the surface area (ΔA), an increased energy input (ΔW) is required (Equation 2) [1]. This energy is proportional to the surface tension (Y) of the dispersion. The smaller the surface tension, the greater the surface area will be for a certain amount of energy [3].
ΔW = Y • ΔA Equation 2
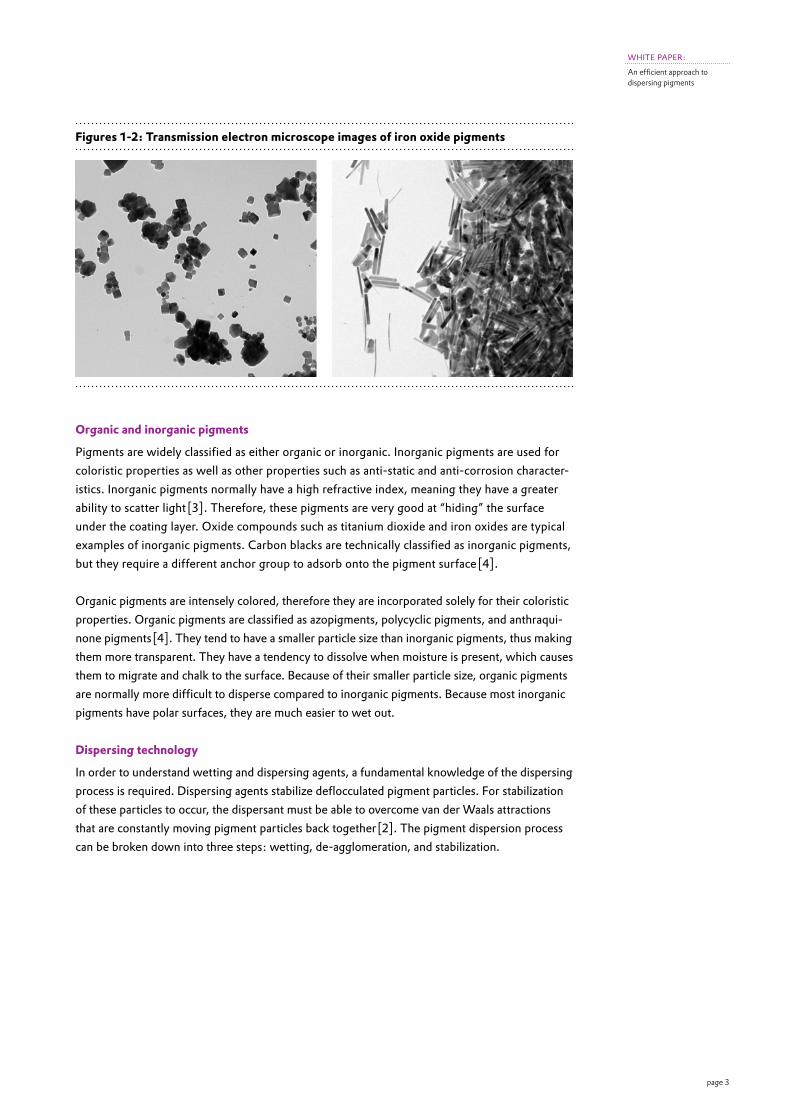
When dispersing, agglomerates are broken down into primary particles and small aggregates. When breaking down agglomerates, only physical bonds are being interrupted.
These energies range from 40 –50 kJ/mol, meaning 40,000 to 50,000 joules are required to break these physical bonds [4]. If aggregates are milled, then approximately 600 to 1000 kJ/mol are required to break these chemical bonds [4]. This is about ten times the energy it takes to grind agglomerates.
Figure 3: Typical ranges of energy contents of one mole (6.0231 x 10²³) associated with the different types of chemical and physical bonds [4]
Interactions
Hydrogen Bonds
<50 kJ/mol
Permanent Dipoles
<30 kJ/mol
Induced Dipoles
<2 kJ/mol
Dispersive Forces
<40 kJ/mol
Covalent Bonds
60 –700 kJ/mol
Ionic Bonds 600 –1000
kJ/mol
Physical Bonds Chemical Bonds
Equation 1
page 5
WHITE PAPER:
An efficient approach to dispersing pigments
Step three: Stabilization
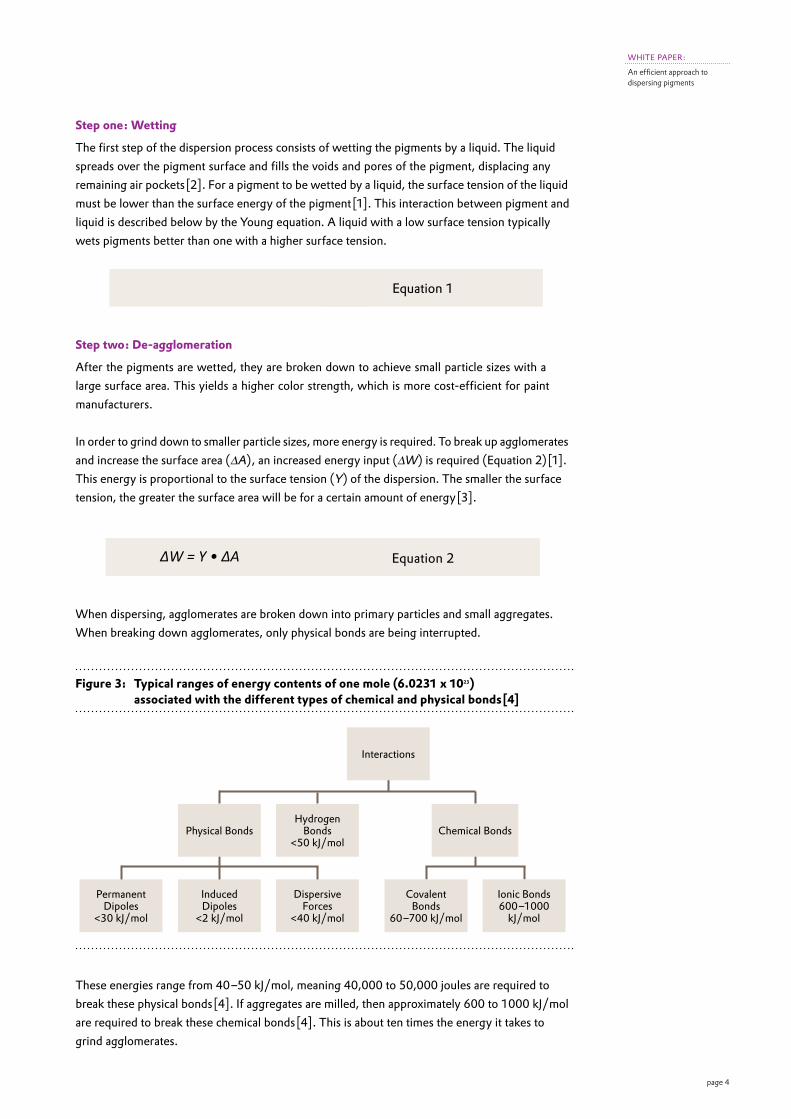
Consequently, when there are large surface areas and small pigment particles, the energy is very high and thermodynamically unstable. Solid particles will always gravitate towards each other in Brownian motion to minimize their surface area and return to a lower energy state that is more stable [2] (Figure 4).
If these particles are not well stabilized, then they will flocculate back together. To achieve good pigment stabilization, the dispersing agent must be able to adsorb onto the surface of the pigment. Therefore, the additive must have anchor groups with high affinity for the pigment surface.
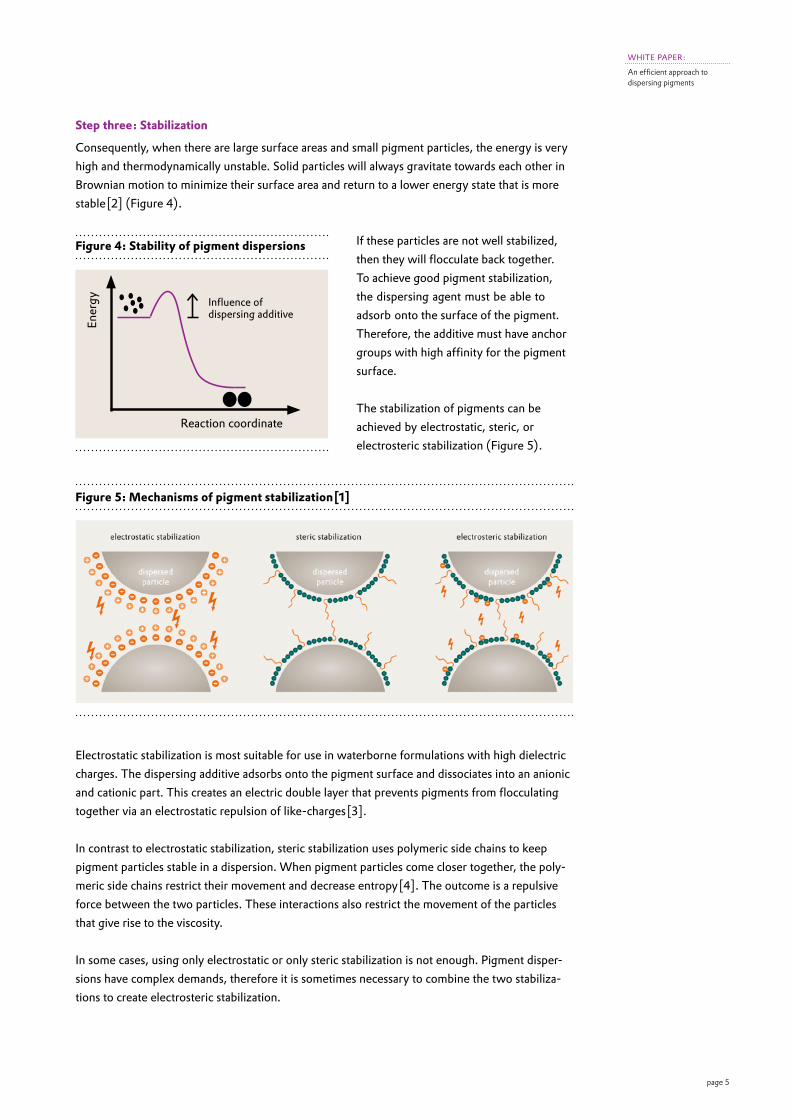
The stabilization of pigments can be achieved by electrostatic, steric, or electrosteric stabilization (Figure 5).
Electrostatic stabilization is most suitable for use in waterborne formulations with high dielectric charges. The dispersing additive adsorbs onto the pigment surface and dissociates into an anionic and cationic part. This creates an electric double layer that prevents pigments from flocculating together via an electrostatic repulsion of like-charges [3].
In contrast to electrostatic stabilization, steric stabilization uses polymeric side chains to keep pigment particles stable in a dispersion. When pigment particles come closer together, the poly-meric side chains restrict their movement and decrease entropy [4]. The outcome is a repulsive force between the two particles. These interactions also restrict the movement of the particles that give rise to the viscosity.
In some cases, using only electrostatic or only steric stabilization is not enough. Pigment disper-sions have complex demands, therefore it is sometimes necessary to combine the two stabiliza-tions to create electrosteric stabilization.
Figure 4: Stability of pigment dispersions
Reaction coordinate
Ener
gy Influence of dispersing additive
Figure 5: Mechanisms of pigment stabilization [1]
page 6
WHITE PAPER:
An efficient approach to dispersing pigments
WETTING AND DISPERSING AGENTSThe terms wetting agent, wetting additive, dispersant, or wetting and dispersing additive are often used without full understanding of their exact definitions. There are very important differ-ences in the chemical structures and functions of each.
Wetting agents are low molecular weight, amphiphilic molecules with a hydrophilic and hydro-phobic segment. They aid in reducing surface tension and wetting out surfaces, but most of the time, stabilization of pigments is not achieved. Dispersing agents are oligomers or polymers that aid in the stabilization of pigments and fillers. At the core of every dispersing agent, there must be a wetting agent in order to facilitate the first step in the dispersion process – wetting out the pigment. The major difference between these two technologies, is that dispersing agents utilize anchor groups and polymeric side chains to stabilize pigments.
Polymeric side chains
Polymeric side chains aid in the adsorption of the dispersing agent onto the pigment surface. The side chains must be soluble in the medium. If they are not soluble, they could collapse onto the pigment surface causing flocculation.
Additionally, polymers of medium molecular weight are optimal. If the mass is too low, in the case of wetting agents, then there might not be enough of an effect to stabilize pigments. On the other hand, if the mass is too large, then it could be incompatible and cause viscosity to rise.
Anchor groups
Anchor groups are placed at the end of the polymeric chains to attach to the surface of the pigment. Without these anchor groups, the polymeric side chains would not be useful. Specific chemical groups are used as anchors for certain pigment types.
Dispersants with aromatic rings have an affinity for surfaces of organic pigments. They adsorb onto the surface by van der Waals forces. Dispersants with hydroxyl-, carbonyl-, or carboxyl- groups have a high affinity for the surface of inorganic pigments. These adsorb onto the surface by hydrogen bonding or induced dipole interactions. Amine groups have high affinity for carbon black surfaces. Without nitrogen, there is not much suitability for carbon black.
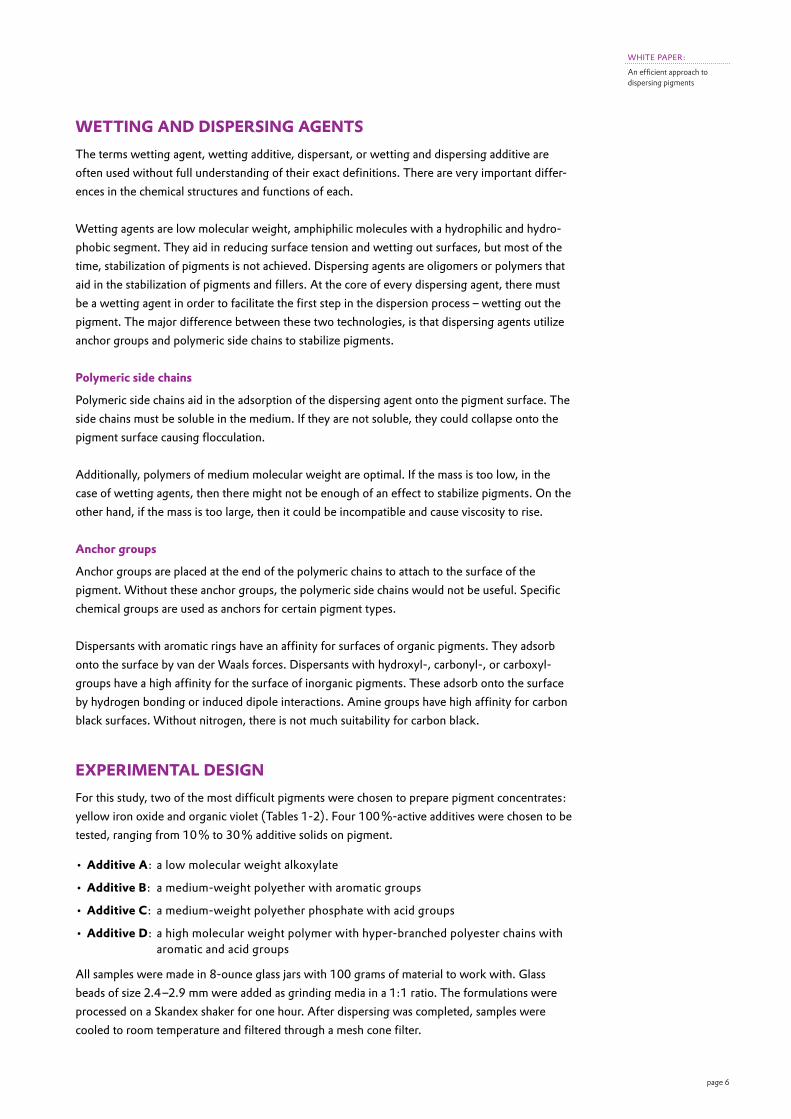
EXPERIMENTAL DESIGNFor this study, two of the most difficult pigments were chosen to prepare pigment concentrates: yellow iron oxide and organic violet (Tables 1-2). Four 100 %-active additives were chosen to be tested, ranging from 10 % to 30 % additive solids on pigment.
• Additive A: a low molecular weight alkoxylate
• Additive B: a medium-weight polyether with aromatic groups
• Additive C: a medium-weight polyether phosphate with acid groups
• Additive D: a high molecular weight polymer with hyper-branched polyester chains with aromatic and acid groups
All samples were made in 8-ounce glass jars with 100 grams of material to work with. Glass beads of size 2.4 –2.9 mm were added as grinding media in a 1:1 ratio. The formulations were processed on a Skandex shaker for one hour. After dispersing was completed, samples were cooled to room temperature and filtered through a mesh cone filter.
page 7
WHITE PAPER:
An efficient approach to dispersing pigments
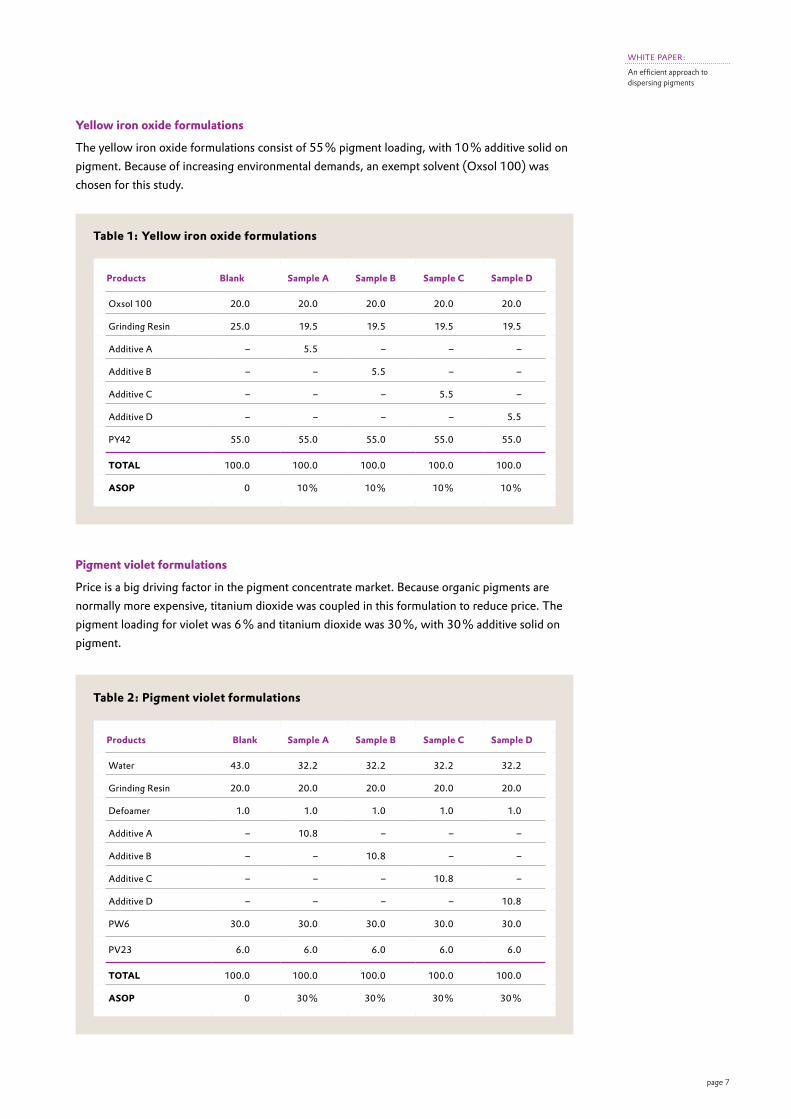
Yellow iron oxide formulations
The yellow iron oxide formulations consist of 55 % pigment loading, with 10 % additive solid on pigment. Because of increasing environmental demands, an exempt solvent (Oxsol 100) was chosen for this study.
Pigment violet formulations
Price is a big driving factor in the pigment concentrate market. Because organic pigments are normally more expensive, titanium dioxide was coupled in this formulation to reduce price. The pigment loading for violet was 6 % and titanium dioxide was 30 %, with 30 % additive solid on pigment.
Table 1: Yellow iron oxide formulations
Products Blank Sample A Sample B Sample C Sample D
Oxsol 100 20.0 20.0 20.0 20.0 20.0
Grinding Resin 25.0 19.5 19.5 19.5 19.5
Additive A – 5.5 – – –
Additive B – – 5.5 – –
Additive C – – – 5.5 –
Additive D – – – – 5.5
PY42 55.0 55.0 55.0 55.0 55.0
TOTAL 100.0 100.0 100.0 100.0 100.0
ASOP 0 10 % 10 % 10 % 10 %
Table 2: Pigment violet formulations
Products Blank Sample A Sample B Sample C Sample D
Water 43.0 32.2 32.2 32.2 32.2
Grinding Resin 20.0 20.0 20.0 20.0 20.0
Defoamer 1.0 1.0 1.0 1.0 1.0
Additive A – 10.8 – – –
Additive B – – 10.8 – –
Additive C – – – 10.8 –
Additive D – – – – 10.8
PW6 30.0 30.0 30.0 30.0 30.0
PV23 6.0 6.0 6.0 6.0 6.0
TOTAL 100.0 100.0 100.0 100.0 100.0
ASOP 0 30 % 30 % 30 % 30 %

page 8
WHITE PAPER:
An efficient approach to dispersing pigments
YELLOW IRON OXIDE RESULTSViscosity was measured on a Haake Rheostress 1 Rheometer equipped with PP35 Ti L03 089 plate and tested under a 0.20 mm gap at room temperature. Initial viscosity studies showed that the blank and Sample A had very shear thickening behavior, meaning their viscosities rose along with the shear rate. This is not ideal for pigment concentrates because it could clog the dosing machine when tinting white base paints. Sample B had a shear thinning viscosity until 1,000/s, where there was a rise in viscosity. This indicates that there was not enough dispersant to wet out the remaining pigment. Sample C and Sample D had shear thinning curves, with viscosity being the lowest overall for Sample D. This is attractive to pigment concentrate suppliers because a low viscosity means more pigment loading is possible. Viscosity will also be tested after a storage period at elevated temperatures to confirm the performance of the additives.
The blank, Sample A, and Sample B did not have a suitable grind after one hour of processing. A suitable grind for most pigment concentrate suppliers would be a 6 Hegman or above. Sample C and Sample D both had grinds over 7 on the Hegman scale. Sample C had a higher viscosity but good grind after one hour; this indicates that the dispersant loading was not optimized. Further work will continue to create an optimized formulation with this dispersant. For Sample D, there was a very low viscosity and high grind, indicating that this was a suitable dispersant loading for this formulation. Color acceptance and color strength research will be done additionally to confirm the performance of the additives.
Figure 6: Initial room temperature viscosity for yellow iron oxide formulations
5,000
4,500
4,000
3,500
3,000
2,500
2,000
1,500
1,000
500
0
Viscosity [mPas]
Shear Rate
1/s 100/s 1,000/s
Blank Sample A Sample B Sample C Sample D
INITIAL VISCOSITY
page 9
WHITE PAPER:
An efficient approach to dispersing pigments
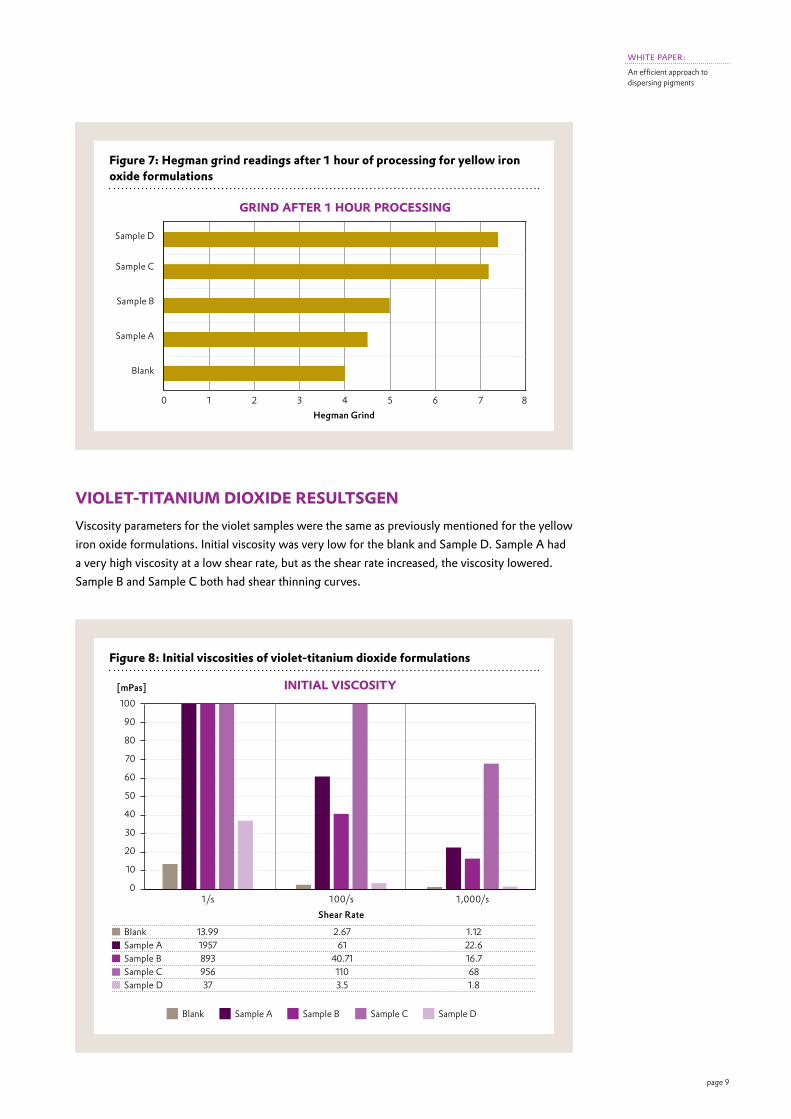
Figure 7: Hegman grind readings after 1 hour of processing for yellow iron oxide formulations
Sample D
Sample C
Sample B
Sample A
Blank
Hegman Grind0 1 2 3 4 5 6 7 8
GRIND AFTER 1 HOUR PROCESSING
VIOLET-TITANIUM DIOXIDE RESULTSGENViscosity parameters for the violet samples were the same as previously mentioned for the yellow iron oxide formulations. Initial viscosity was very low for the blank and Sample D. Sample A had a very high viscosity at a low shear rate, but as the shear rate increased, the viscosity lowered. Sample B and Sample C both had shear thinning curves.
Figure 8: Initial viscosities of violet-titanium dioxide formulations
Blank 13.99 2.67 1.12 Sample A 1957 61 22.6 Sample B 893 40.71 16.7 Sample C 956 110 68 Sample D 37 3.5 1.8
Shear Rate
100
90
80
70
60
50
40
30
20
10
01/s 100/s 1,000/s
Blank Sample A Sample B Sample C Sample D
[mPas] INITIAL VISCOSITY
page 10
WHITE PAPER:
An efficient approach to dispersing pigments
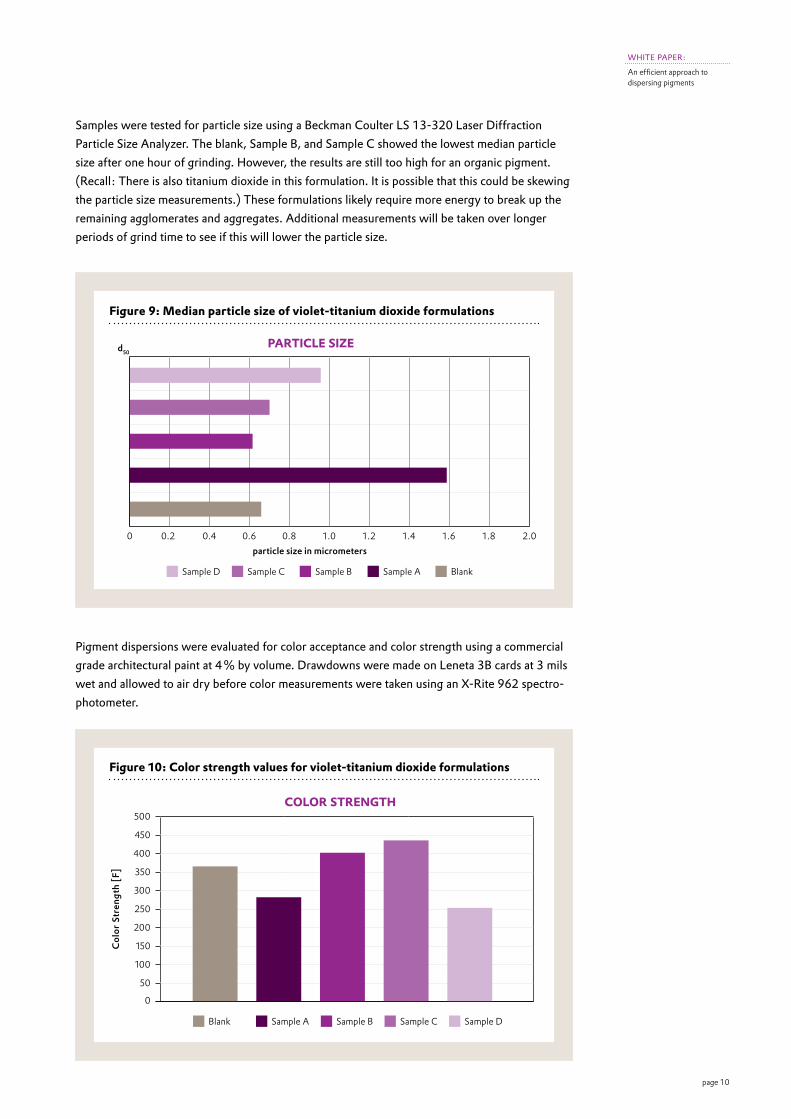
Samples were tested for particle size using a Beckman Coulter LS 13-320 Laser Diffraction Particle Size Analyzer. The blank, Sample B, and Sample C showed the lowest median particle size after one hour of grinding. However, the results are still too high for an organic pigment. (Recall: There is also titanium dioxide in this formulation. It is possible that this could be skewing the particle size measurements.) These formulations likely require more energy to break up the remaining agglomerates and aggregates. Additional measurements will be taken over longer periods of grind time to see if this will lower the particle size.
Pigment dispersions were evaluated for color acceptance and color strength using a commercial grade architectural paint at 4 % by volume. Drawdowns were made on Leneta 3B cards at 3 mils wet and allowed to air dry before color measurements were taken using an X-Rite 962 spectro-photometer.
Figure 9: Median particle size of violet-titanium dioxide formulations
d50
particle size in micrometers0 0.2 0.4 0.6 0.8 1.0 1.2 1.4 1.6 1.8 2.0
PARTICLE SIZE
Sample D Sample C Sample B Sample A Blank
Figure 10: Color strength values for violet-titanium dioxide formulations
Col
or S
tren
gth
[F]
500
450
400
350
300
250
200
150
100
50
0
Blank Sample A Sample B Sample C Sample D
COLOR STRENGTH

page 11
WHITE PAPER:
An efficient approach to dispersing pigments
The blank has a high color strength but also a very high ΔE. This indicates that while the blank may look stable, after the pigment is disrupted, it falls out of stabilization. Sample A and Sample D both had lower color strengths and higher ΔE values. This would be unacceptable to paint manufacturers because not only would the pigment not be utilized for tint strength, it would also change color when applied. Sample B and Sample C had the highest color strength and a ΔE less than one. These would be the most stable and most attractive formulations in this case.
For this formulation, overall Sample B and Sample C had the best performance. More research will be done to optimize these formulations. Additionally, all dispersion samples will undergo elevated temperature testing for 1 week at 50 °C. Viscosity, particle size, color acceptance, and color strength will then again be tested for confirmation of each additive’s performance.
CONCLUSION The results for yellow iron oxide convey that Sample D was the best dispersant for that formula-tion. The higher molecular structure in combination with the hyper-branched polymeric chains was found to be especially useful with the viscosity of the formulation. This allows for a higher pigment loading to be achieved at a fraction of the grinding time. Less machine time, less energy consumption, and fewer labor costs drastically reduce the complexity of processing, simply by utilizing the most suitable additive. This contributes to a more cost-efficient way to formulate pigment concentrates and coatings.
On the other hand, Sample D did not perform well in the violet-titanium dioxide formulation. Most likely, the molecular weight was too high and the polymeric side chains were not soluble and caused incompatibilities with this system. Here, Sample B and Sample C performed well in regards to color strength and color acceptance, and they produced the most economic grinds by getting the most out of the pigment. These two additives kept the violet and titanium dioxide stable using a “controlled flocculation” matrix. This allowed for the two pigments to be bound together to prevent further flocculation by using the dispersant as the bridge between the two.
Figure 11: Color acceptance values for violet-titanium dioxide formulations
Col
or D
iffer
ence
[ΔE
]
6
5
4
3
2
1
0
COLOR ACCEPTANCE
Blank Sample A Sample B Sample C Sample D

page 12
WHITE PAPER:
An efficient approach to dispersing pigments
Pigment and additive interactions can be difficult to determine because there are so many vari-ables at play. However, the ability to understand the dispersant and pigment structure and the forces acting on them leads to a better understanding of how to harmonize the two when devel-oping paints and pigment concentrates.
REFERENCES
[1] Evonik Corporation, TEGO Chemie Service GmbH. TEGO Journal, 4th ed.; 2012. pp 79–89.
[2] Mueller, Bodo. Understanding Additives. European Coatings Literature, Vincentz Network GmbH & Co.: Hannover, Germany 2010
[3] Heilen, Wernfried. Additives for Waterborne Coatings. European Coatings Literature, Vincentz Network GmbH & Co.: Hannover, Germany, 2009.
[4] Winkler, Jochen. Dispersing Pigments and Fillers. European Coatings Literature, Vincentz Network GmbH & Co.: Hannover, Germany, 2012.
CONTACTBrian O. Casey, Phone +1 804 [email protected]
Figure 12: Controlled flocculation matrix between organic and inorganic pigment
This information and all further technical advice are based on our present knowledge and experience. However, it implies no liability or other legal responsibility on our part, including with regard to exist-ing third party intellectual property rights, especially patent rights. In particular, no warranty, whether express or implied, or guarantee of prod-uct properties in the legal sense is intended or implied. We reserve the right to make any changes according to tech-nological progress or further developments.
The customer is not released from the obligation to conduct careful inspection and testing of incoming goods. Perfor-mance of the product described herein should be verified by testing, which should be carried out only by qualified experts in the sole responsibil-ity of a customer. Reference to trade names used by other companies is neither a recom-mendation, nor does it imply that similar products could not be used.
AEROSIL®/ACEMATT®Evonik Resource Efficiency GmbHRodenbacher Chaussee 463457 HanauGermanyPhone +49 6181 59-12532Fax +49 6181 [email protected] TEGO®Evonik Resource Efficiency GmbHGoldschmidtstraße 10045127 EssenGermanyPhone +49 201 173-2222Fax +49 201 [email protected] SURFYNOL®/DYNOL™/AIRASE®Evonik Materials Netherlands BVKanaalweg 153502 GD UtrechtNetherlandsPhone [email protected]
ACEMATT®, ADDID®, AEROSIL®, AIRASE®, ALBIDUR®, CARBOWET®, DYNOL TM, NANOCRYL®, SILIKOFTAL®, SILIKOPHEN®, SILIKOPON®, SILIKOPUR®, SILIKOTOP®, SURFYNOL®, TEGO®, TEGOMER®, ZETASPERSE® are registered trade marks of EVONIK INDUSTRIES AG or one of its subsidiary companies and are written in capital letters.
03_2
018