White House Travel Bloggers Summit - U.S. Study Abroad
24
Bureau of Educational & Cultural Affairs
-
Upload
kevin-barta -
Category
Travel
-
view
155 -
download
0
Transcript of White House Travel Bloggers Summit - U.S. Study Abroad

Bureau of Educational & Cultural Affairs

Over 50% of U.S. students enter university with expectations to
study abroad.
Source: American Council on Education, Student Poll: Interests in Study Abroad and Other Learning Activities. p. 3 http://goo.gl/jS1ymU

but fewer than 10% currently take part in study abroad over their
entire academic careers.
Source: Open Doors, an Annual International and U.S. Student Mobility Report, Sponsored by the U.S. Department of State and administered by the Institute of International Education. http://goo.gl/ikSxlA

289,000 U.S. students study abroad for credit
Source: Open Doors, an Annual International and U.S. Student Mobility Report, Sponsored by the U.S. Department of State and administered by the Institute of International Education. http://goo.gl/ikSxlA

1.5%Of 20 Million U.S. Students
Source: Open Doors, an Annual International and U.S. Student Mobility Report, Sponsored by the U.S. Department of State and administered by the Institute of International Education. http://goo.gl/ikSxlA

0
100,000
200,000
300,000
400,000
500,000
600,000
700,000
U.S. Students Abroad
15 Years to Double
35Years to
Double at Current Rate
1998
2012
2046
Source: Open Doors, an Annual International and U.S. Student Mobility Report, Sponsored by the U.S. Department of State and administered by the Institute of International Education. http://goo.gl/ikSxlA

Study Abroad is for Everyone

25 Years to Double at 2% per year
White 62%African American 14%Hispanic 13%Asian/ Pacific Islander 7%Native American 1%Other 3%
20 Million U.S. Students
Source: U.S. Census Bureau, Statistical Abstract of the United States, Table 279. College Enrollment by Selected Characteristics: 1999 – 2009. http://goo.gl/fRJH6E

25 Years to Double at 2% per year
U.S. Study Abroad Students
White 76%African American 5%Hispanic 8%Asian/ Pacific Islander 7%Native American 0.5%Other 3.5%
Source: U.S. Census Bureau, Statistical Abstract of the United States, Table 279. College Enrollment by Selected Characteristics: 1999 – 2009. http://goo.gl/fRJH6E

0
50,000
100,000
150,000
200,000
250,000
300,000
350,000
2000 2003 2006 2009 2012
U.S. Minority Students Abroad
16%
Source: American Council on Education, Student Poll: Interests in Study Abroad and Other Learning Activities. p. 3 http://goo.gl/jS1ymU & Open Doors, an Annual International and U.S. Student Mobility Report, Sponsored by the U.S. Department of State and administered by the Institute of International Education. http://goo.gl/ikSxlA

Destination Diversity

63%6%
3%
3%
5%
15%
1%1998/99 Academic Year
Source: Open Doors, an Annual International and U.S. Student Mobility Report, Sponsored by the U.S. Department of State and administered by the Institute of International Education. http://goo.gl/ikSxlA

53%12%
5%
2%
4%
16%
1%2012/13 Academic Year
Source: Open Doors, an Annual International and U.S. Student Mobility Report, Sponsored by the U.S. Department of State and administered by the Institute of International Education. http://goo.gl/ikSxlA

in 1998
63%in 2013
53%(81,367) (154,254)
Source: Open Doors, an Annual International and U.S. Student Mobility Report, Sponsored by the U.S. Department of State and administered by the Institute of International Education. http://goo.gl/ikSxlA
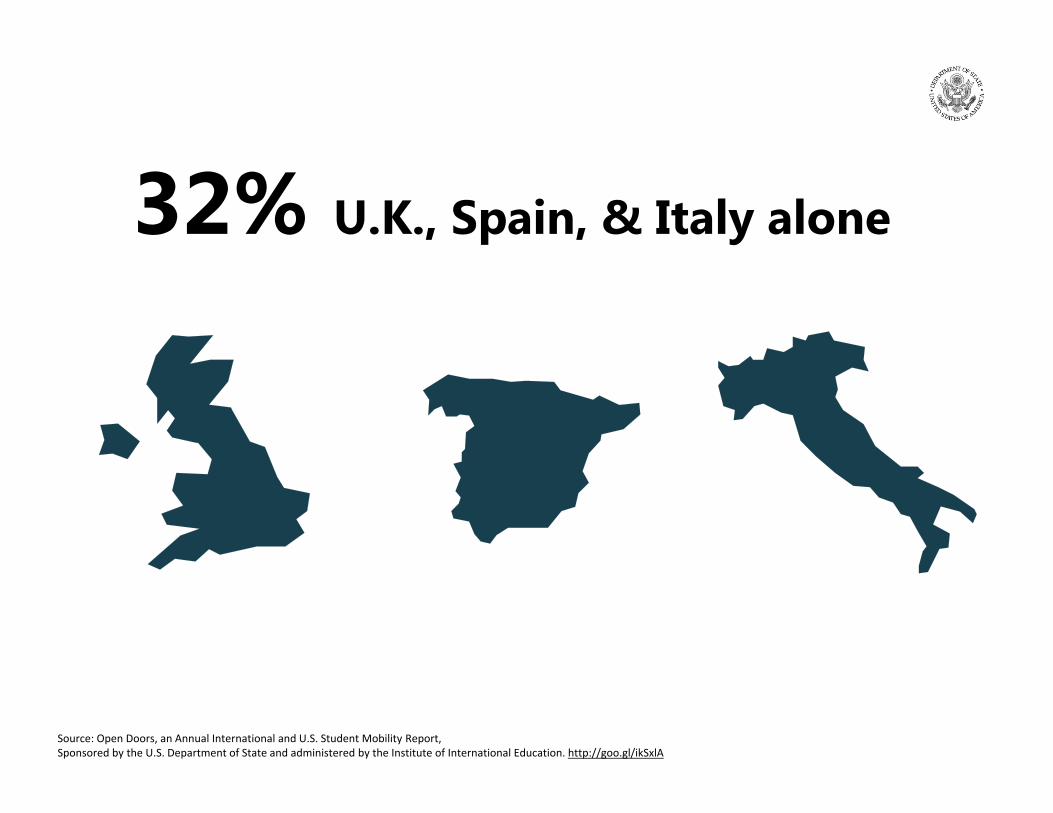
32% U.K., Spain, & Italy alone
Source: Open Doors, an Annual International and U.S. Student Mobility Report, Sponsored by the U.S. Department of State and administered by the Institute of International Education. http://goo.gl/ikSxlA

15% in 1998
(19,464)
16% in 2013
(45,437)
Source: Open Doors, an Annual International and U.S. Student Mobility Report, Sponsored by the U.S. Department of State and administered by the Institute of International Education. http://goo.gl/ikSxlA
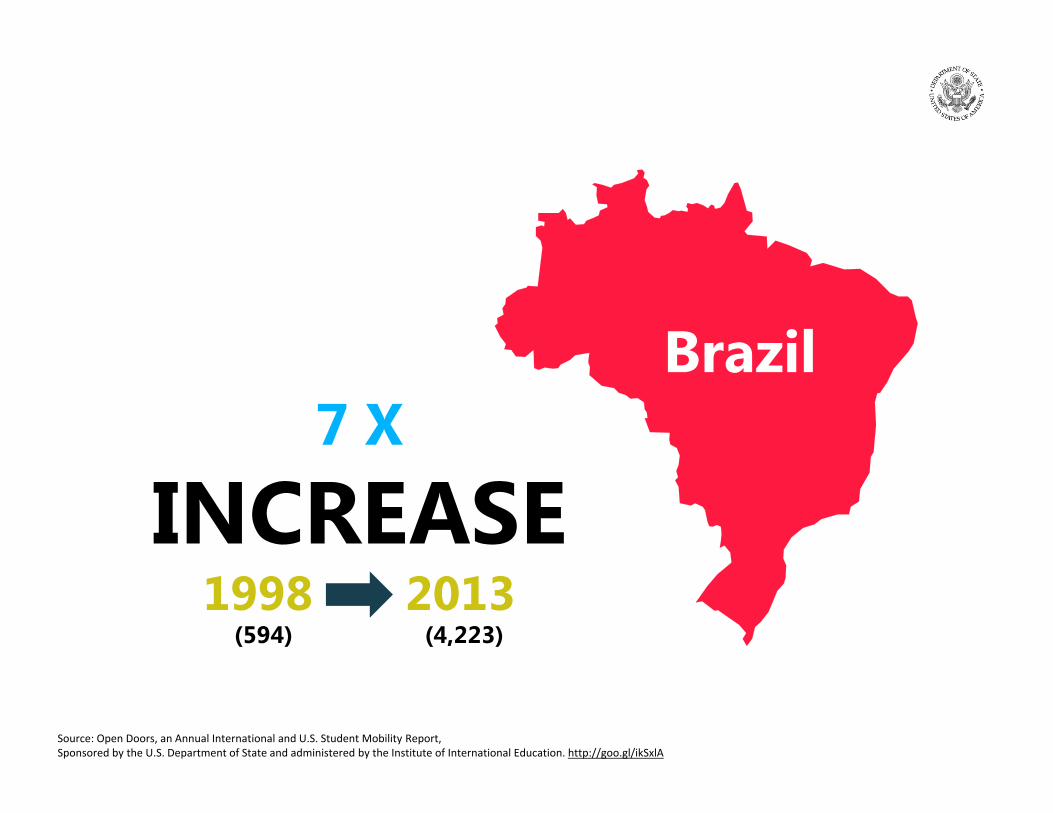
Brazil7 X
INCREASE1998 2013
(594) (4,223)
Source: Open Doors, an Annual International and U.S. Student Mobility Report, Sponsored by the U.S. Department of State and administered by the Institute of International Education. http://goo.gl/ikSxlA

6% 2X 12%
INCREASE1998 2013
Asia
(7,781) (35,887)Source: Open Doors, an Annual International and U.S. Student Mobility Report, Sponsored by the U.S. Department of State and administered by the Institute of International Education. http://goo.gl/ikSxlA

China
2% in 1998
(2,278)
5% in 2013
(14,413)
Source: Open Doors, an Annual International and U.S. Student Mobility Report, Sponsored by the U.S. Department of State and administered by the Institute of International Education. http://goo.gl/ikSxlA
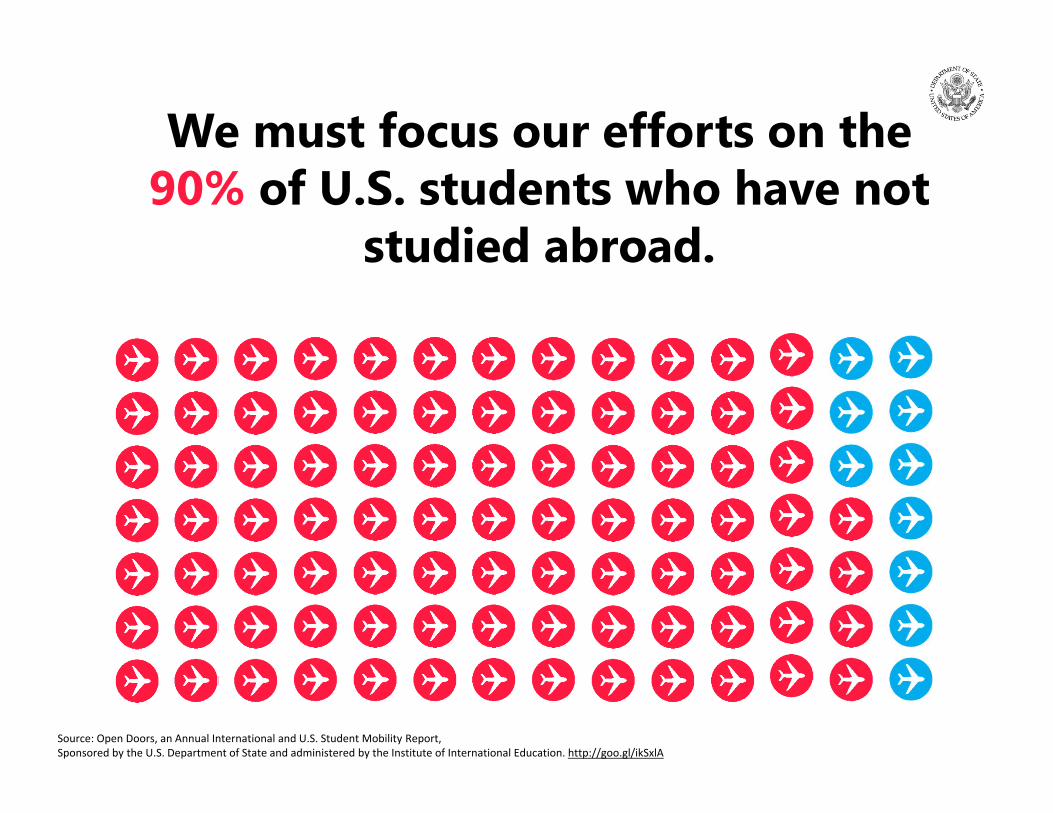
We must focus our efforts on the 90% of U.S. students who have not
studied abroad.
Source: Open Doors, an Annual International and U.S. Student Mobility Report, Sponsored by the U.S. Department of State and administered by the Institute of International Education. http://goo.gl/ikSxlA
Exchanges.state.gov

What Can Other Players Do About It?

What Can You Do About It?

#WHTravelBloggers