
White cert final clear ready for printing
122
TRADABLE CERTIFICATES FOR ENERGY SAVINGS (WHITE CERTIFICATES) - THEORY AND PRACTICE - PAOLO BERTOLDI European Commission, DG JRC, Institute for Environment and Sustainability, Renewable Energies Unit SILVIA REZESSY Central European University, Environmental Sciences and Policy Department Institute for Environment and Sustainability 2006 EUR 22196 EN
Transcript of White cert final clear ready for printing

TRADABLE CERTIFICATES FOR ENERGY SAVINGS
(WHITE CERTIFICATES)
- THEORY AND PRACTICE -
PAOLO BERTOLDI European Commission, DG JRC,
Institute for Environment and Sustainability, Renewable Energies Unit
SILVIA REZESSY Central European University, Environmental Sciences and Policy
Department
Institute for Environment and Sustainability
2006
EUR 22196 EN

The mission of the Institute for Environment and Sustainability is to provide scientific and technical support to the European Union's policies for protecting the environment and the EU Strategy for Sustainable Development.
European Commission Directorate-General Joint Research Centre Institute for Environment and Sustainability Contact information Address: TP 450, I-21020 Ispra (VA), Italy E-mail: [email protected] Tel.: +39 0332 78 9299 Fax: +39 0332 78 9992 http://energyefficiency.jrc.cec.eu.int http://www.jrc.cec.eu.int Legal Notice Neither the European Commission nor any person acting on behalf of the Commission is responsible for the use which might be made of this publication. A great deal of additional information on the European Union is available on the Internet. It can be accessed through the Europa server http://europa.eu.int EUR 22196 EN Luxembourg: Office for Official Publications of the European Communities ISBN 92-79-01818-3 © European Communities, 2006 Reproduction is authorised provided the source is acknowledged Printed in Italy
1
Preface
Market-based instruments (MBIs)1 that aim at bringing sustainability to the energy sector
have been implemented to promote electricity from renewable energy sources and cut harmful
emissions. Quota systems (also known as renewable portfolio standards (RPS)) coupled with
tradable green certificate (TGC) schemes have been developed and tested in several European
countries to foster market-driven penetration of renewable energy sources. Another well-
known and widely analysed type of MBI is the tradable CO2 allowance; the EU Emission
Trading System commenced on 1st January 2005.
To stimulate energy efficiency investments and achieve national energy savings targets, the
attention of policy makers has recently been attracted by the possibility of introducing energy
savings obligations on certain types of market players coupled with tradable certificates for
energy savings (TCES). While such schemes have been introduced in different forms in Italy
and Great Britain, are currently under preparation in France and are considered in other
European countries, there is an ongoing debate over their effectiveness and applicability in
practice.
The present report:
Reviews experiences to date with the design of market-based instruments in
the energy sector, namely emission trading and tradable green certificates;
Describes the concept and main elements of a TCES scheme;
Outlines how these have been put into practice in Italy and Great Britain;
1 Market-based instruments (MBIs) are public policies, which make use of market mechanisms with transferable property rights to distribute the burden from a policy. We recognize the difference between policy instruments that are well positioned to harness market forces to achieve a certain policy goal (such as renewable energy quotas or renewable portfolio standards) and the market instruments themselves (namely carbon allowances, green and white certificates) the latter being a much narrower concept representing just a tradable commodity. This differentiation is not so important in the context of the present report and in the text we refer to complex policy tools/portfolios that include trading of financial commodities (such as certificates or allowances) as market-based instruments (MBIs).
2
Compares on a set of four criteria the TCES scheme with energy taxation and a
particular type of mandatory demand-side management (DSM) program;
Examines possible ways to increase the uptake of end-use energy efficiency
(EUEE) projects and projects for utilisation of renewable energy sources (RES) in the
framework of emission trading and the carbon market, the advantages and challenges
of integration of green and white certificates and possible ways to establish such an
integration
The report has the following structure. Section 1 places the energy efficiency and energy
savings discussion in the context of relevant European policies. Section 2 reviews European
experience with MBIs in the energy sector and provides a description, analysis and
comparison of the existing and planned TCES schemes. Section 3 presents a qualitative
comparison of the TCES scheme, also known as white certificate scheme or Energy
Efficiency Titles, with energy taxation and mandatory demand-side management (DSM)
programs, using a set of four criteria. Section 4 analyses the possibilities for integrating
existing MBIs in the energy sector to achieve better environmental and economic results. The
advantages and dangers of integrating green and white certificates in emission trading and
possible ways to establish such an integration are then examined.
Further development and testing of TCES schemes is needed to prove the effectiveness and
cost-efficiency of this instrument: as the first ‘real’ TCES scheme has just started in Italy in
20052, it is still to be seen whether this policy instrument will deliver savings and at what cost
this will be achieved.
A number of other research activities have focussed on white certificates in Europe,
including:
• “A Comparison of Market Mechanisms for Energy Efficiency” (White & Green
project co-financed under SAVE program of the European Commission)3;
2 While the Energy Efficiency Commitment in Great Britain follows similar principles and is considered as a policy portfolio of this type, it has no trading of savings element at the moment; there is a possibility for trading of obligations. See details later. 3 www.iiiee.lu.se/QuickPlace/whiteandgreen/Main.nsf/h_Toc/695a3dfe0be56ce1c1256eba00356cb1/!OpenDocument
3
• “Stepwise towards effective European energy efficiency policy portfolios involving
white certificates” (EuroWhiteCert project co-financed under the Intelligent Energy
Europe program of the European Commission)4;
• Task XIV “Market Mechanisms for White Certificates Trading” of the International
Energy Agency Demand Side (IEA-DSM) Implementing Agreement5.
4 www.eurowhitecert.org 5 http://dsm.iea.org/

4

5
Table of contents 1. INTRODUCTION: SUSTAINABILITY IN THE ENERGY SECTOR – THE EUROPEAN CONTEXT . 11
1.1. EU Emission Trading System ....................................................................................... 16 1.2. Quota systems with tradable green certificates ............................................................. 23
2. TRADABLE CERTIFICATES FOR ENERGY SAVINGS............................................................... 35
2.1. Elements of a white certificate policy portfolio: issues and experiences...................... 38 2.2. Certificates, trading rules and tools to stabilize the certificate market ......................... 69 2.3. Summary of practical issues related to the implementation of white certificate-based schemes ................................................................................................................................ 77
3. COMPARATIVE ANALYSIS .................................................................................................... 79
3.1. Certainty of outcome..................................................................................................... 80 3.2. Economic efficiency...................................................................................................... 81 3.3. Information requirements .............................................................................................. 83 3.4. Institutional costs........................................................................................................... 84 3.5. Comparative analysis: summary ................................................................................... 86
4. INTEGRATION OF MARKET-BASED INSTRUMENTS IN THE ENERGY SECTOR....................... 89
4.1. Why integration? ........................................................................................................... 89 4.2. Integrating white certificates with green certificates .................................................... 93 4.3. Integrating white and green certificates in emission trading......................................... 94 4.4. Emission trading, white and green certificates: implementation possibilities .............. 99
5. CONCLUSIONS .................................................................................................................... 109 REFERENCE LIST.................................................................................................................... 113
6
List of text boxes, figures and tables Box 1. Basics of EU ETS ......................................................................................................... 18 Box 2. End-use energy efficiency and renewables: caveats of the EU ETS (continues on next
page) ................................................................................................................................. 21 Box 3. Combined heat and power (CHP) certification ............................................................ 33 Box 4. Energy efficiency obligations: examples from the United States................................. 46 Box 5. Bottom-up versus top-down measurement of savings.................................................. 64 Box 6. New South Wales Greenhouse Gas Abatement scheme: a case of a case of credit-based
carbon trading scheme with a demand-side energy efficiency element........................... 91 Figure 1. Tradable green certificate markets............................................................................ 24 Figure 2. Energy savings target and evolution of savings in the first 5-year compliance period
in Italy .............................................................................................................................. 40 Figure 3. A policy portfolio with mandatory savings targets and white certificates: summary
of roles of actors and relationships between them ........................................................... 47 Figure 4. Verification process: from projects to certificates .................................................... 68 Figure 5. Summary of transactions .......................................................................................... 71 Figure 6: Financial and certificate flows in a TCES scheme ................................................... 74 Figure 7. One-way fungibility (flexible use of EUEE and RES-generated allowances in an
emission cap) and dedicated set-aside quotas ................................................................ 102 Figure 8. Dedicated set-aside quotas for EUEE and RES-generated allowances in an emission
cap .................................................................................................................................. 105 Table 1. TGC in Europe ........................................................................................................... 28 Table 2. Overview of energy efficiency obligations in Europe ............................................... 45 Table 3. Indicative (open) lists of eligible measures in Great Britain and Italy ...................... 56 Table 4. The Energy Efficiency Commitment in Great Britain, the white certificate scheme in
Italy and the planned portfolio in France: a comparison.................................................. 78
7
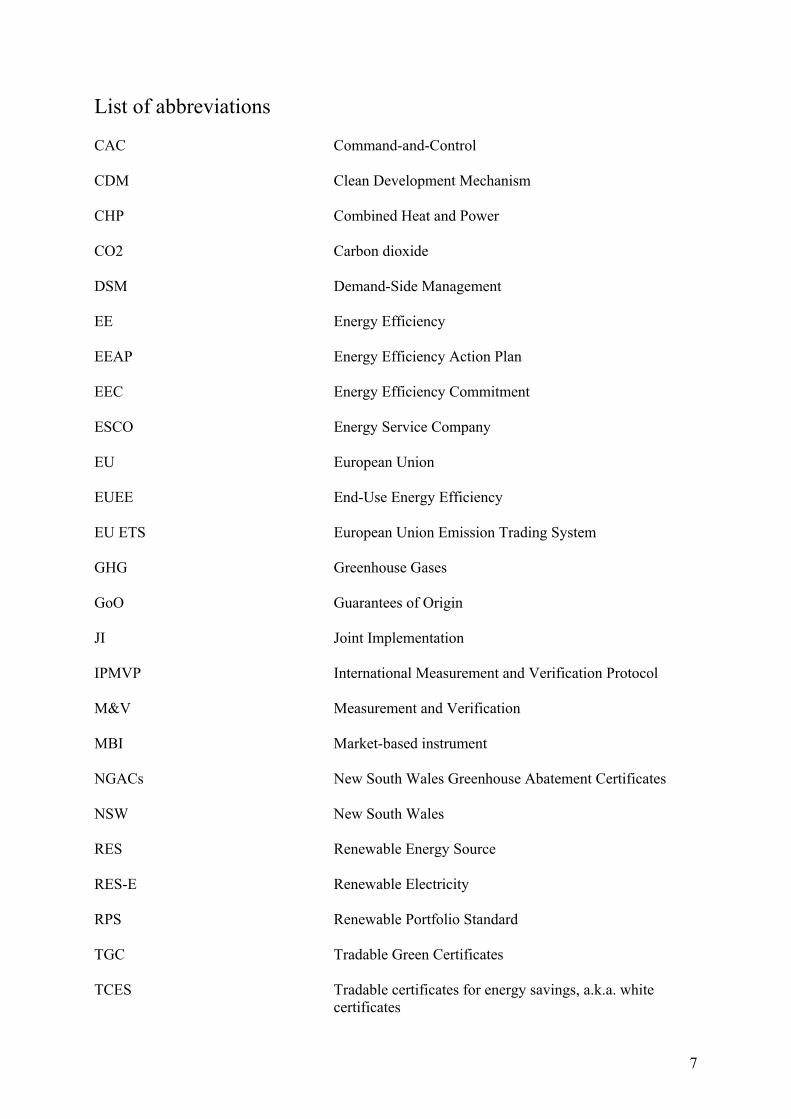
List of abbreviations CAC Command-and-Control CDM Clean Development Mechanism CHP Combined Heat and Power CO2 Carbon dioxide DSM Demand-Side Management EE Energy Efficiency EEAP Energy Efficiency Action Plan EEC Energy Efficiency Commitment ESCO Energy Service Company EU European Union EUEE End-Use Energy Efficiency EU ETS European Union Emission Trading System GHG Greenhouse Gases GoO Guarantees of Origin JI Joint Implementation IPMVP International Measurement and Verification Protocol M&V Measurement and Verification MBI Market-based instrument NGACs New South Wales Greenhouse Abatement Certificates NSW New South Wales RES Renewable Energy Source RES-E Renewable Electricity RPS Renewable Portfolio Standard TGC Tradable Green Certificates TCES Tradable certificates for energy savings, a.k.a. white
certificates

8

9
Acknowledgements
The authors would like to acknowledge the contribution of Marcella Pavan, Charles
Hargreaves, Eoin Lees, Dan Staniaszek, Stéphanie Monjon, Monique Voogt, David Young,
Mary Jean Burer, Adriaan Perrels, David Crossley, Steven Schiller, Vlasis Oikonomou,
Randall Bowie, Natascia Falcucci, Peter Zapfel, Stefaan Vergote, Antonio Capozza, Diana
Ürge-Vorsatz, Lena Neij, Reinhard Haas, Ton van Dril, Ole Langniss, Mario Ragwitz, and
Wolfgang Eichhammer. We are indebted to all of them for their numerous helpful comments,
suggestions and/or clarifications provided at various stages of the writing of this report and
for assisting us in updating country information. All mistakes, omissions and opinions
expressed remain the sole responsibility of the authors.

10

11
1. Introduction: sustainability in the energy sector – the European context Energy efficiency is a well-established option to decouple economic growth from the increase
in energy consumption and thus reduce greenhouse gas (GHG) emissions by cutting the
amount of energy required for a particular amount of end-use energy service. Energy saving is
one of the quickest, most effective and cost-efficient ways to reduce not only GHG emissions,
but also to improve air quality [4]. Apart from being a sound part of the environmental and
climate change agenda, increased energy efficiency can contribute to meeting widely accepted
goals of energy policy such as improved security of supply, economic efficiency and
increased business competitiveness coupled with job creation and improved consumers’
welfare.
Under the Kyoto protocol, the 15 members of the European Union (EU-15 then) has agreed to
reduce greenhouse gas (GHG) emissions between 2008 and 2012 by 8 percent relative to
1990 levels; there is now an emerging discussion on post-2012 action to combat climate
change. As a result GHG mitigation issues are playing a central role in EU energy and
environmental policies; in addition some Member States (among them the UK, Germany,
France, the Netherlands, and the Czech Republic) have adopted long-term strategies with
quantified targets to reduce CO2 emissions. On the long-term the EU aims to not let global
average temperatures exceed 2 degrees Celsius above pre-industrial level and the framing of
the post-Kyoto climate change regime is already under discussion.
The new priorities in the EU strategy for sustainable development, adopted by the Gothenburg
European Council in June 2001, include the following targets regarding demand-side energy
efficiency: realize the potential for energy-efficiency improvements as far as economically
possible, and reduce energy consumption by 1 percent per year to achieve two-thirds of the
potential savings (18 percent by 2010) and thereby reduce CO2 emissions by about 40 percent
of the EU’s Kyoto commitment.
Policies to promote energy efficiency, as well as policies to foster the increased utilisation of
renewable energy sources, should however be valued beyond their GHG mitigating effect as
they can potentially bring industry and technology development and facilitate the

12
implementation of social policy objectives, such as employment creation and alleviation of
energy poverty. The EU could save at least 20 % of its present energy consumption in a cost-
effective manner; this would mean that depending on its energy consumption an average EU
household could save in a cost effective manner between 200 and 1000 Euro per year [4]. The
Green Paper on Energy Efficiency or Doing More With Less (COM(2005) 265 final) seeks to
put energy savings higher on the agenda; it lists a number of options to save in a cost effective
way 20 % of energy consumption by 2020 through changes in consumer behaviour and
energy efficient technologies. This amount of savings would allow the EU to save an
estimated 60 billion Euro on its energy bill. The Green paper refers to estimates that the
suggested 20 % saving of present energy consumption in the European Union by 2020 can
potentially create directly or indirectly as many as a million new jobs in Europe: apart from
fighting unemployment, this brings additional tax revenues. The net impact on employment in
Europe in the manufacturing and construction industries of a 1 % annual improvement in
energy efficiency – a target proposed and currently under discussion in the European Union –
has been shown to induce a positive effect on total employment [5, 6]6: the strongest effects
are shown to in the area of semi-skilled labour in the buildings trades, which also affords the
strongest regional policy effects [5, 6]. Energy efficiency is therefore also to bring positive
regional and cohesion effects because of the decentralized nature of energy efficiency action.
In 2006, at the end of the Green paper consultation process, the Commission will come
forward with a comprehensive Action Plan, identifying measures which should be put
forward.
The proposal for a Directive on Energy End-Use Efficiency and Energy Services (EUEE&ES)
aims at fostering cost effective improvement of energy end use efficiency and at transforming
and promoting the market for energy services. The proposal – whose text has been agreed
upon at the end of 2005 by the European Parliament and the Council – sets forth an indicative
energy savings target of an additional 1% annually in the nine years following the adoption of
the Directive. The baseline for the energy saving target is calculated using the average energy
consumption during the last five years where statistical data are available in a country before
the entry into force of the Directive. This is a fixed – “hard” – target, which is independent of
GDP developments. The Directive targets all end-use sectors except for companies in the EU
6 The effect has been shown to be substantially positive, even after taking into account all direct and indirect macroeconomic factors such as the reduced consumption of energy, impact on energy prices, reduced VAT, etc [5].

13
ETS, aviation and foreign shipping; it covers energy distributions, distribution system
operator, retail energy sales companies, final customers.
In accordance with the Directive, the Member States of the European Union will have to
adopt three multi-annual Energy Efficiency Action Plans (EEAPs). In the first, to be
submitted to the Commission no later than end of June 2007, an intermediate goal for the third
year must be set. In all three plans (the second to be submitted until end of June 2011, the
third until end of June 2014), Member States must describe the energy efficiency measures
planned to reach the targets. Member States will have a period of two years to transpose the
Directive into national law with the exception of the first EEAP, which has to be submitted
until end of June 2007, and which will be reviewed by the Commission before January 2008.
Another positive point is that the public sector will have to set an example. Member States
are invited to develop guidance aiming to include energy efficiency as a criterion for public
procurement processes. The Directive also requires giving more to consumers on energy end
use efficiency and they will receive detailed and regular statements on their energy
consumption. At the time of finalizing this report the Directive has not been yet published in
the Official Journal of the European Union.
The other main direction in EU energy policy is to restructure electricity and gas markets. A
European Directive (96/92/EC) adopted in 1996 established rules for an Internal Electricity
Market. To accelerate electricity market restructuring, the European Union adopted a new
Directive in June 2003 on market liberalisation (2003/54/EC) with the following timetable for
market opening: the electricity and gas markets were fully liberalised by July 2004 for non-
household customers, and all customers (including households) will be able to choose their
supplier by 1 July 2007 at the latest7.
The effect of the market liberalisation on energy efficiency is dependent upon a complex
plethora of factors and it cannot yet be clearly stated what the exact effect would be. Falling
prices give raise to short-termism with suppliers focused on maximising turnover and
margins; this may make suppliers possibly hostile to action beyond the consumer’s meter,
7 The European Commission is monitoring the market liberalization process, more information can be read at http://europa.eu.int/comm/energy/electricity/report_2005/index_en.htm
14
especially where electricity and gas markets are not fully liberalised in the presence of
regulated tariff setting methodologies that provide an incentive for maximising kWh sales (for
details see for instance [7, 8]). Falling and volatile prices are expected to have a negative
impact on projects implemented by energy service companies (ESCOs). Price volatility is
crucial from the perspective of business provision of energy services, but its effect is less self-
evident than this of price falls. Price volatility may vary according to the stage of energy
market liberalization, the sequence by which liberalization occurs and the resulting structure
of the energy sector as well as the extent of physical interconnection of the resulting energy
market. Price volatility may be due to market power (which may be driven by increasing
vertical integration of energy companies) and geographic network constraints. As competition
develops, price volatility may be expected to decline to a certain degree and incentives for
energy efficiency may be created8.
At the same time improved efficiency at the demand side may be fostered by suppliers trying
to retain consumers and attract new ones by offering energy services as ‘added value’ to an
otherwise homogenous commodity such as electricity. Therefore with the ongoing
restructuring and liberalization of the energy sector, new types of incentives that conform
with liberalised market principles are needed in order to foster the market penetration of
efficient technologies for energy conversion and the improvement of end-use energy
efficiency. Hence a key policy challenge is to establish long-term synergies between the
energy sector liberalisation and end-use energy efficiency.
Many energy efficiency advocates and policy makers have called for legislation introducing
energy efficiency and energy services as a natural complement to the electricity and gas
market liberalisation. Otherwise market failures in the energy sector would lead to lower
levels of investment in energy efficiency than is socially optimal with the final outcome being
additional cost to the EU economy due to an imbalance between the supply side and demand
side in the energy sector. Better allocation of resources arising from important non-
environmental benefits such as deferred and avoided investment in electricity generation
plants and network upgrades and improvements in the reliability of energy supply will result
in an increase in social wealth [9].
8 We are indebted for this comment to David Young.

15
Most of the existing energy savings potential – estimated to reach 22 % in the residential and
tertiary sectors of EU-15 in the time horizon up to 20109 – can be effectively realised through
energy services and other cost efficient energy end-use efficiency measures. The main
mechanism to achieve this objective will be to improve the functioning of the EU energy
market by removing barriers hampering the development of a well functioning, commercially
viable and competitive market for cost-effective energy-efficiency measures on the end-use
side. A way to realize this potential is to utilize market-based instruments (MBIs)10.
MBIs that aim at bringing sustainability to the energy sector have been implemented to
promote electricity from renewable energy sources and cut harmful emissions. Quota systems
(also known as Renewable portfolio standards (RPS)) coupled with tradable green certificate
(TGC) schemes have now been developed and tested in several European countries to foster
market-driven penetration of renewable energy sources. Another well-known and widely
analysed type of MBI is the tradable CO2 allowance; the first international CO2 emission
trading scheme took off the ground in the European Union (EU) in January 2005. The
sections to follow describe experiences with these two most prominent MBIs in Europe: EU
ETS and various national green certificate systems.
9 Result obtained by the simulation model MURE (MURE: Mesures d'Utilisation Rationelle de l'Energie) 10 There is a profound difference between policy instruments that harness market forces to achieve certain policy goal (such as renewable energy quotas or renewable portfolio standards) and the market instruments themselves (namely carbon allowances, green and white certificates) the latter being a much narrower concept representing a just a tradable commodity. This differentiation is not so important in the context of the present report and in the text we refer to complex policy tools/portfolios that include trading of financial commodities (such as certificates or allowances) as market-based instruments (MBIs).

16
1.1. EU Emission Trading System
One of the largest and most commonly cited benefits of energy efficiency is contribution to
environmental problem alleviation, in particular to GHG emission mitigation. This section
presents one of the building blocks of the European climate change program – the EU
Emission Trading System, presenting both its benefits and shortcomings, especially when it
comes to end-use energy efficiency.
The European Climate Change Program report identified the introduction of an EU emission
trading scheme (EU ETS) as an important policy area to attain the Kyoto targets. The EU
adopted a Directive (2003/87/EC of 13 October 2003) introducing a scheme for greenhouse
gas emission (GHG) allowance trading within the Community. The Directive allows emission
trading (ET) to start in 2005 in some sectors; the first three-year trading period is limited only
to CO2. Under a standard set of assumptions and provided adequate enforcement, this scheme
offers the possibility to implement the most cost-effective measures in the covered sectors to
reduce GHG emissions while still achieving the same environmental benefit.
The EU ETS is supposed to cover at least 45-50 % of the EU-25’s total CO2 emissions (or
about 30 % of total GHG emissions) in 2010 and involve more than 12,000 installations that
fall under the activities specified in Annex I of the Directive. Practically all energy intensive
sectors are targeted: energy production (combustion installations with rated thermal output
above 20 MW except hazardous or municipal waste installations), mineral coke refineries,
coke ovens, production and processing of ferrous metals, mineral industry (cement, lime,
glass and ceramic products), pulp, paper and board manufacturing. Each installation annually
receives emissions allowances that are valid for the whole trading period. For the first period
(2005-2007, trial period) allowances are free of charge (even though there is a possibility to
auction up to 5 % of allowances and some Member States have chosen to do so). All Member
States have allocated allowances using historical emissions (grandfathering approach)11, for
the second phase (2008-2012) up to 10% can be auctioned. No banking is allowed from the
first period. The Member States have allocated the emissions to the concerned installations by
means of a national allocation plan (NAP) and according to defined criteria. If installations
11 According to Eurelectric estimates at EU level power Generation received 52.5% of total allowances, leaving a shortfall of 112 MtCO2/year [9].
17
do not meet their obligations they have to pay a penalty of 40 Euro per ton CO2 for the period
2005-2007, which for subsequent periods will rise to 100 Euro per ton CO2. To fulfil their
emission reduction targets companies can use emission reductions from joint implementation
(JI) or clean development mechanism (CDM) projects. The details are regulated in a specific
Directive (2004/101/EC). From 2005 obliged parties have direct access through CDM to
credits from countries without targets; from 2008 JI credits will be available for countries with
targets. JI and CDM are on principle forbidden on EU territory, when they lead to direct or
indirect emission reductions in installations covered by the EU ETS. It is also agreed that
companies have the possibility to pool their emissions allocations until 2012, which means
that e.g. industrial branches can try to find a common solution.
There has been a certain delay and market developments have been determined by the delay
of NAPs approval and registry opening: in October 2005 there were 14 registries operating
and there have been 150 MtCO2 traded, worth Euro 2.5 billion at price ranges from Euro 8
(January 2005) to Euro 30 (July 2005)12 [10]. There has been a concern raised that as no
banking is allowed in Phase 1 and there is no time to effect major investment in Phase 1,
short-term abatement options limited to fuel-switching (gas and biomass) and small efficiency
improvements will account for the majority of abatement options [10].
Box 1 presents the basic principles of EU ETS. More information about the role of the EU in
global climate change efforts, as well as European action to address its own GHG emissions
can be found at http://europa.eu.int/comm/environment/climat/home_en.htm.
12 As of February 2006 the average carbon price in the EU ETS is about 27 Euro/tCO2
18
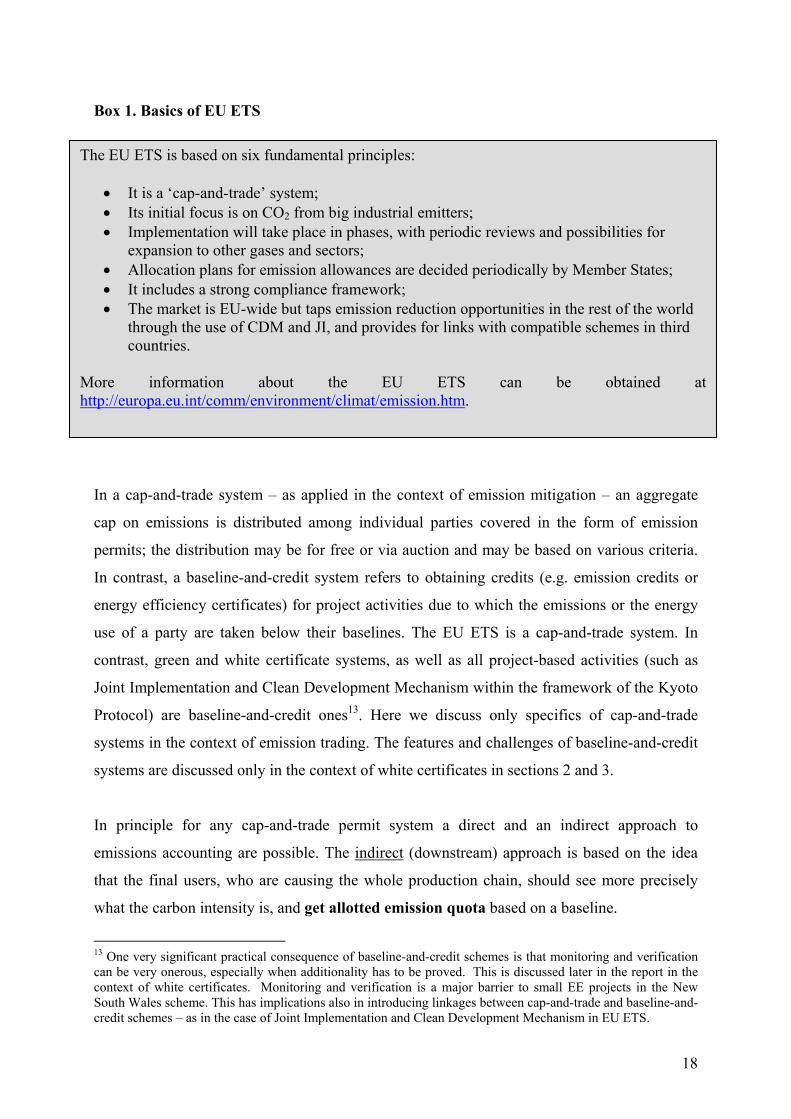
Box 1. Basics of EU ETS
In a cap-and-trade system – as applied in the context of emission mitigation – an aggregate
cap on emissions is distributed among individual parties covered in the form of emission
permits; the distribution may be for free or via auction and may be based on various criteria.
In contrast, a baseline-and-credit system refers to obtaining credits (e.g. emission credits or
energy efficiency certificates) for project activities due to which the emissions or the energy
use of a party are taken below their baselines. The EU ETS is a cap-and-trade system. In
contrast, green and white certificate systems, as well as all project-based activities (such as
Joint Implementation and Clean Development Mechanism within the framework of the Kyoto
Protocol) are baseline-and-credit ones13. Here we discuss only specifics of cap-and-trade
systems in the context of emission trading. The features and challenges of baseline-and-credit
systems are discussed only in the context of white certificates in sections 2 and 3.
In principle for any cap-and-trade permit system a direct and an indirect approach to
emissions accounting are possible. The indirect (downstream) approach is based on the idea
that the final users, who are causing the whole production chain, should see more precisely
what the carbon intensity is, and get allotted emission quota based on a baseline.
13 One very significant practical consequence of baseline-and-credit schemes is that monitoring and verification can be very onerous, especially when additionality has to be proved. This is discussed later in the report in the context of white certificates. Monitoring and verification is a major barrier to small EE projects in the New South Wales scheme. This has implications also in introducing linkages between cap-and-trade and baseline-and-credit schemes – as in the case of Joint Implementation and Clean Development Mechanism in EU ETS.
The EU ETS is based on six fundamental principles:
• It is a ‘cap-and-trade’ system; • Its initial focus is on CO2 from big industrial emitters; • Implementation will take place in phases, with periodic reviews and possibilities for
expansion to other gases and sectors; • Allocation plans for emission allowances are decided periodically by Member States; • It includes a strong compliance framework; • The market is EU-wide but taps emission reduction opportunities in the rest of the world
through the use of CDM and JI, and provides for links with compatible schemes in third countries.
More information about the EU ETS can be obtained at http://europa.eu.int/comm/environment/climat/emission.htm.

19
In contrast, the direct (upstream) approach to emission accounting is based on the physical
source (‘the pipe’), whereby the actual emitters are obliged to hand over an amount of
allowances that equals their emissions in the previous year. The EU ETS follows this
upstream approach. The cost of the allowances should be accounted for in the price of the
products emitters sell: products with high carbon content will become more expensive and
buyers will respond by consuming less or switching to an alternative with lower price rise
(which presumably, but not certainly, is also less carbon intensive). Hence, this approach only
indirectly gives some incentive to energy savings as a means to consume less carbon intensive
product without losing the desired service level. However, price differences between product
alternatives are not only caused by carbon intensity. While one may argue that the carbon
content will be internalised in the electricity price, which will create a sufficient price signal
to be passed through to consumers and will encourage savings, even this short-term impact of
the EU ETS on electricity prices will be contingent upon a plethora of complex factors. The
size of the cap, the method of allowance allocation, the allowance price in the EU ETS, the
extent to which additional costs are passed on to consumers rather than to e.g. shareholders or
fuel suppliers, the carbon intensity of the electricity generation system as a whole, and the
elasticities that operate on behaviour (in relation to price, substitution, and income), are
among these factors [3, 11]. Because the elasticity of demand for energy is estimated to be
low [12] at least on the short term, especially in end-use sectors with non-intensive energy
uses such as residential and tertiary, price incentives may fail to generate the desired response
in terms of reduction of an activity14. These would probably make negligible effect on end-use
energy efficiency of a possible price increase driven by the EU ETS [3]. More details about
the effects of EU ETS on electricity markets is available in [13].
The upstream approach makes the guidance of energy efficiency for companies inside the
ETS only indirect: an industrial user without on-site power generation and with an emission
cap under an upstream scheme such as the EU ETS cannot get any carbon credit for
improving the electricity efficiency of end-use at his site(s). Sectors outside the ETS are
14 Price elasticity of demand /supply refers to the percentage change generated by 1% price change. Elasticity depends on the existence of close substitutes (for electricity, none), on the sensitivity of demand to income (for electricity, moderate) and on the share in the total expenditure (for electricity, moderate). Very rough estimates show that the (short-term) elasticity of demand for electricity is 0.1-0.4; for natural gas elasticity of demand is higher at around 0.2-0.6 due to availability of substitutes in some applications: both these values are below 1, which means that demand is inelastic towards price increases and therefore there will be a small demand response to a price increase [12].

20
influenced by the initial division of reduction tasks between trading and non-trading sectors: if
Member States wish to favour the export-oriented companies inside the EU ETS, they end up
with having to demand greater emission mitigation efforts from other sectors in order to fulfil
an overall national target. Energy saving is a rather important GHG mitigation option for
sectors not covered by the ETS. However, with respect to electricity savings from efficiency
measures this is less the case since the benefit of reduced emissions remains with the power
generation sector15.
Under these circumstances one may wish to seek additional means to get more energy savings
realized by crediting the resulting carbon reductions to the efficiency project developer(s).
Rather than imposing sector specific efficiency obligations one could choose to combine the
certainty of mandated quantified targets (quotas) with the flexibility and potential cost
advantages of market mechanisms by introducing an energy saving quota in conjunction with
tradable certificates for energy saving.
In fact, there is more than one reason to rely on policy measures for energy efficiency and
renewables other than the EU ETS alone. Box 2 presents several caveats of the EU ETS and
supports the conclusion that EU ETS alone cannot be relied upon to significantly increase
end-use energy efficiency and renewable energy deployment.
15 In a climate change framework where capping of emissions at national level is targeted, electricity saving measures can contribute to CO2 reduction provided a reduced amount of allowances are allocated to the power sector, the reduction corresponding to the carbon saved as a result of electricity saving measures. Otherwise generators will receive credit for carbon savings achieved by other actors.

21
Box 2. End-use energy efficiency and renewables: caveats of the EU ETS (continues on next page)
There are a few major reasons why the EU ETS by itself is insufficient to stimulate end-use energy efficiency and significant amounts of renewable energy deployment, and why it is important to consider additional policy measures. We refer to energy efficiency and renewable energy projects that are not covered by the EU ETS, i.e. not undertaken by operators under CO2 cap in EU ETS.
Emissions trading will stimulate RES and end-use energy efficiency only after all cheaper options are taken up by the market. Direct ‘competition’ of EUEE and RES projects against other carbon saving options in the EU ETS is expected to bring limited number of EUEE and RES projects deployed.
For renewables this is because
o renewables may have higher marginal abatement costs than other carbon mitigation options; o estimates show that the current allowance prices in EU ETS are not sufficiently high to foster strategic deployment of RES
(see next page for details); o Markets are indifferent towards the direction of technological change (this is valid for MBIs in general rather than for EU
ETS solely).
On the other hand, EUEE is a low-cost carbon mitigation option. However, there is the risk that not many EUEE projects will enter the ETS because:
o EUEE is ‘invisible’: businesses may not recognize it as an energy source, business opportunity and a way to improve competitiveness and comfort and, in addition, a plethora of barriers hinder energy efficiency projects even when they are economically justified; and
o power generators obliged under the EU ETS are more likely to take measures at the supply side where their area of expertise is. In this sense an indicative gradation of their preferences would be to first improve the efficiency of plants (rehabilitation and/or fuel switch), then to install RES-E generation capacity, and only last to look beyond the consumer’s meter.
Second, the upstream approach to allowance allocation applied in the EU ETS only indirectly gives some incentive to energy savings
and RES as a means to consume less carbon intensive products without losing the desired service level.

22
(Continued)
Third, over-allocation of permits to large industry players is highly possible. If allowances are over-allocated, the obliged parties under the cap-and-trade system would be required to make smaller effort to attain their targets. This would result in downstream sectors (residential and tertiary sectors, transport that are not easily or efficiently covered by an ET scheme) paying disproportionately for reductions to ensure that a given emission reduction target is attained.
Fourth, price increases are expected to be insufficient to stimulate EE and RES deployment. Estimates presented in the Carbon
Weekly of Fortis Bank – citing Reuters LEBA Carbon Index of early December 2005 indicate much higher switch prices: they point to a need for emission allowance prices going up to 78 Euro/tCO2 in the first year as a theoretical switch price at which power from a 38 % efficiency coal generator and a 53 % efficiency gas generator costs the same to produce; i.e. the CO2 price at which gas becomes more economic than coal. This means that at present coal-fired plants are highly utilised, physical emissions are high and compliance needs are growing. It should be noted that this estimation refers barely to fuel switch from coal to natural gas and not to strategic deployment of renewables: the price level necessary to induce RES deployment therefore is much greater. In addition carbon prices are only one factor influencing the fuel mix, other important variables including taxes, subsidies and – perhaps most importantly the prices of natural gas and coal on the world markets.
Fifth, already current evidence shows that under the Clean Development Mechanism (CDM), supply side projects and methane
emission reductions are the preferred option for investors. Most energy efficiency-related projects will generate only a small stream of carbon credits and consequently fall under the small project stream of the CDM. Even though this stream is designed for easier flow through the CDM project cycle, a recent study shows that at present energy efficiency projects are under-represented relative to their estimated potential, which suggests the existence of factors and flaws, such as high administrative costs or other barriers that are not fully reflected in analyses of the achievable potential for these projects [2]. Project bundling will reduce administrative costs.
Finally, inertia in the energy system as well as the climate system calls for significant investment in low-carbon energy systems
today such as RES and EUEE. Source: Bertoldi et al [3] and references herein

23
1.2. Quota systems with tradable green certificates16
In October 2001 the EU adopted the so-called renewable electricity Directive (2001/77/EC),
aiming to increase the share of green electricity from 14 to 22 percent of gross electricity
consumption in the EU-15 by 201017. It establishes non-mandatory national targets for the
portion of electricity consumption to be met by RES. In accordance with the instruction of the
Directive the European Commission has published a report on the progress of individual
member states toward their national objective. The Directive also mentions that the European
Commission will, if necessary, propose mandatory targets for Member States that do not
reach their goals. The current public debate is mostly focussed on taking away further market
barriers that hamper actual realisation of the indicative targets, rather than on setting
mandatory targets or harmonisation of support mechanisms. This section presents experiences
with green certificate systems in Europe and also briefly outlines the main arguments in the
debate of quota and certificate systems versus feed-in tariff systems.
A system which involves renewable energy quotas and tradable renewable (green) certificates
(TGC schemes) work as follows: a quantified obligation (quota) is imposed on one category
of electricity system “operators” (generators, producers, distributors, retailers, or consumers)
to cover (produce, supply or consumer/purchase) a certain percentage of electricity from
renewable energy sources (RES-E). On a settlement date, the operators must submit the
required number of certificates to demonstrate compliance. Certificates can be obtained in one
of the following ways. First, operators can own their own RE generation, and each defined
amount of energy (e.g. each 100 KWh) produced by these would represent a certificate.
Second, operators can purchase electricity and associated certificates from eligible RES-E
generators. Third, operators can purchase certificates without purchasing the actual power
from a generator or trader or via a broker, i.e. certificates that are traded independently from
the power itself. Because of supply side competition, a TGC system, under perfect market
conditions (perfect price signals), minimises generation costs for renewable energy sources,
but only if there is surplus renewable generation beyond the demand for certificates. The size
of the target is of crucial importance: a target that reflects little more than business-as-usual
16 This section builds on Bertoldi et al [14]. 17 This overall target was specified for the EU-15. With the Accession of ten additional Member States in May 2004 the overall target was set at 21%.
24
and can be mostly met with existing RES generation is unlikely to foster demand for green
certificates and stimulate additional RES generation.
In a TGC scheme, each certificate is unique and associated with a defined and identified
amount of electricity produced from renewable sources (e.g., 1 MWh of wind energy
produced on date and time XY by generator ZZ). The purchase of a certificate without the
purchase of the associated power would in any case transfer the ownership of the “greenness”
of the renewable electricity produced from the original power producer to the new market
actor and therefore would prevent the original power producer from claiming that they have
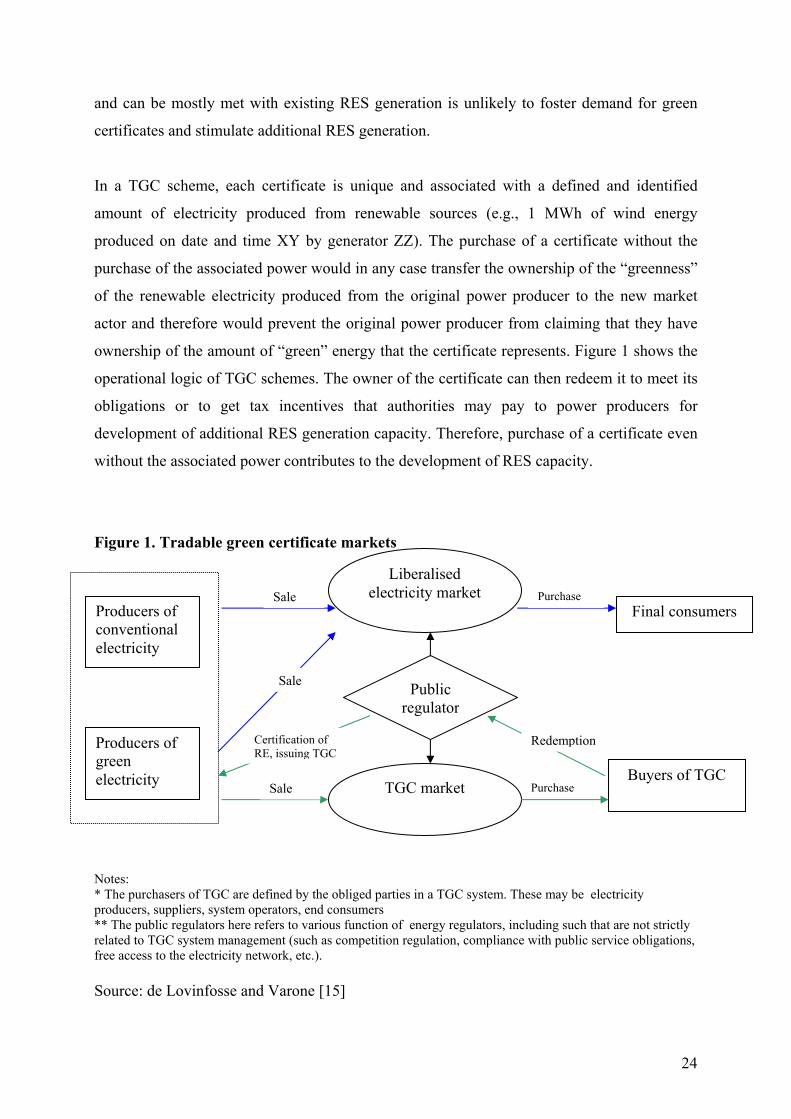
ownership of the amount of “green” energy that the certificate represents. Figure 1 shows the
operational logic of TGC schemes. The owner of the certificate can then redeem it to meet its
obligations or to get tax incentives that authorities may pay to power producers for
development of additional RES generation capacity. Therefore, purchase of a certificate even
without the associated power contributes to the development of RES capacity.
Figure 1. Tradable green certificate markets Notes: * The purchasers of TGC are defined by the obliged parties in a TGC system. These may be electricity producers, suppliers, system operators, end consumers ** The public regulators here refers to various function of energy regulators, including such that are not strictly related to TGC system management (such as competition regulation, compliance with public service obligations, free access to the electricity network, etc.). Source: de Lovinfosse and Varone [15]
Purchase
Producers of conventional electricity
Producers of green electricity
Liberalised electricity market
TGC market
Public regulator
Final consumers
Buyers of TGC Sale
Sale
Sale
Certification of RE, issuing TGC
Redemption
Purchase

25
During the past few years, interest in systems that include tradable certificates has increased
markedly in Europe and elsewhere, and markets have been established in a number of EU
Member States, including the UK, Italy, Belgium and Sweden. In the Netherlands the
certificate system was not linked to a quota obligation, but to various systems of tax
exemption and production support. Austria has formally used a TGC system for only a short
period of time, linked to its obligation to small-scale hydro production. However, the system
was never fully operational and was replaced by a new feed-in tariff scheme. Nevertheless
Austria was the first EU country to introduce the Guarantees of Origin (GoO)18 and to allow
foreign certificates meeting the GO requirements to be imported [14]. Poland has a quota
system since 2001, but has only introduced a system of tradable GoOs and penalty for under-
or non-compliance in October 2005. Denmark for many years planned the introduction of a
TGC system but because of major shifts in policy objectives never actually implemented it
[14]. Among the Candidate Countries Romania has introduced a TGC system in 2005 and
Bulgaria is planning to do so in 2006.
To date experiences are mixed, both resulting from the specific design of the TGC systems
and from the initial market conditions. The Dutch market was the first European market
where certificates were actually used. Initially the system (then called the Green Label) was
intended to register the compliance of Dutch utilities with the voluntary target setting and
allow for trade among this group. Later the system was called a certificate system and linked
to a combination of tax exemption and production support (a pass through of part of tax
revenues from non-green electricity supplies to RES-E producers). The certificates were again
used for registration matters, but also by the tax authorities to arrange payments on tax
exemptions and production support19. During part of this period the certificates could also be
imported and imports overran domestic production. From July 2004 until January 2005 the
certificate system has been linked to a combination of tax exemption and feed-in tariff. As of
January 2005 the system is only linked to a feed-in tariff and the certificates are substituted by
Guarantees of Origin.
18 EU Directive 2001/77/EC on the promotion of electricity from RES requires EU Member States to issue a Guarantee of Origin (GO) for green electricity. The GO requirement primarily aims to enable renewable energy producers and traders to prove that the electricity they sell is renewable. 19 The main aim of Dutch support for renewables was to support domestic demand for green power. This indeed happened: the number of green power customers increased to nearly 3 million (out of 7 million households).
26
The Italian system is designed in such a way that the system operator, GRTN, covers the
shortfall of certificates: because private RES-E producers (under and not under obligation)
cannot produce the required level of GTC, GRTN has the right to get the certificates for the
renewable it support with its feed-in scheme CIP6 scheme and sell them at a price it
announces annually. The certificates again serve as a means to register target compliance.
Italian certificates are only issued for new production. In Sweden the market was designed
with moderate targets, aiming to create a long market at least in the first years of the system.
Because of strong market control by a small number of parties, initially the market failed to
comply with the targets set and large amounts of green certificates were in store. More
recently more certificates have come to be market; offered by a larger number of parties
thereby decreasing market power and control. The design of the UK market puts large credit
risks on investors and plant developers, resulting in large problems to acquire long-term
financing or purchase power contracts. Unlike the Swedish market, the UK market was
designed to be short. Parties handing in Renewable Obligation Certificates (ROCS) are
entitled to take advantage of the recycling of the revenue fund that is filled with buy-out
payments (i.e. payments from parties not meeting targets).
Inherently to the design of the system prices paid for certificates on the different markets also
largely vary. Where in Italy the price is still almost artificially set by GRTN at above 86
Euro/MWh in 2004 and above 108 Euro/MWh in 200520, the price on the UK market is fully
established by the definition of the buy-out price (30 pounds or approx 43 Euro/MWh) and
anticipated recycle payments, resulting in ROCs prices of approx. 60-65 Euro/MWh. In
Sweden prices in the first years have been around 240 SEK or 43 Euro/MWh, but as the
market was short prices were fluctuating around the penalty price; in 2005 markets went to
about 22-24 Euro/MWh. The Dutch market has seen large price fluctuations resulting from
the continuous changes in the connected policies: from an initial 50 Euro/MWh to below 10
Euro/MWh at the end of 2003. Prices for imported biomass certificates fluctuated between 2
and 10 Euro/MWh. Due to the fact that certificates expire after one year, oversupplies at
different times resulted in very low market prices.
20 GRTN published its offer price for year 2005 certificates available at the beginning of January 2006 for operators under obligation to purchase them. As GRTN has so many TGC (more than the target) this offer price becomes the reference price for the year.

27
Without technology bands specified, TGC systems mainly trigger establishing production
from the cheapest resource available. In Italy mainly electricity from municipal solid waste
and from upgrading of hydro power account for meeting the targets, while in the UK nearly
half of the ROCS were issued for landfill gas. In both countries wind power (onshore in Italy,
offshore in the UK) is expected to deliver most of the certificates in the coming years. In
Sweden approximately 75% of the certificates were issued for biomass, of which again
approx. 75% for bio-CHP (mainly in the paper and pulp industry). In the Netherlands a large
amount of certificates (approx two-thirds) was imported in the period until end 2004. The
certificates issued for Dutch power mainly originated from biomass electricity (52%) and
wind power (44%).
In addition to these government-based TGC systems, the RECS21 facilitated trade in TGCs
used mainly for voluntary demand. So far over 55 TWh of certificates have been issued
within the RECS of which over 20 TWh has been redeemed. Out of the total number of
certificates issued nearly 60% was issued for electricity from hydro power and more than 35%
for biomass from forest residues. Most of the certificates were issued in Finland, Norway,
Sweden, Austria, Spain and Slovakia. Nearly a quarter of all certificates used were consumed
in the Dutch market, where they could profit from the former support system. Austria imports
a good deal of RECS certificates, strongly supported by the fact that RECS certificates in this
country have been fully compatible with the system of guarantees of origin.
The table below summarises the main features of TGC systems that have been applied in
Europe.
21 The Renewable Energy Certificate System is an organisation that was established in March 1999, aiming to prove that a high quality system of tradable green certificates can operate in the European market. Its two main objectives were and are to facilitate actual trade in TGCs as well as establishing harmonization between national systems. To ensure the latter, the RECS developed and adopted a set of rules on the establishment of systems (issuing certificates, trade regulations and rules for redemption). More information: www.recs.org.
28
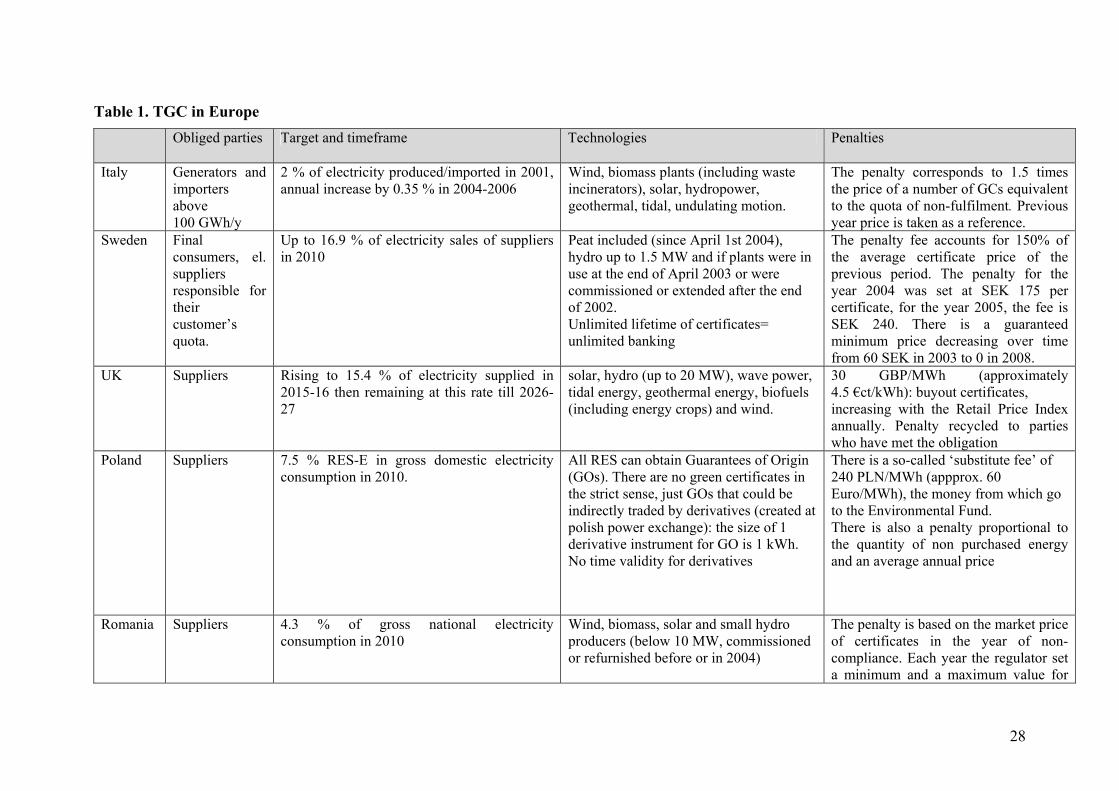
Table 1. TGC in Europe Obliged parties Target and timeframe Technologies Penalties
Italy Generators and importers above 100 GWh/y
2 % of electricity produced/imported in 2001, annual increase by 0.35 % in 2004-2006
Wind, biomass plants (including waste incinerators), solar, hydropower, geothermal, tidal, undulating motion.
The penalty corresponds to 1.5 times the price of a number of GCs equivalent to the quota of non-fulfilment. Previous year price is taken as a reference.
Sweden Final consumers, el. suppliers responsible for their customer’s quota.
Up to 16.9 % of electricity sales of suppliers in 2010
Peat included (since April 1st 2004), hydro up to 1.5 MW and if plants were in use at the end of April 2003 or were commissioned or extended after the end of 2002. Unlimited lifetime of certificates= unlimited banking
The penalty fee accounts for 150% of the average certificate price of the previous period. The penalty for the year 2004 was set at SEK 175 per certificate, for the year 2005, the fee is SEK 240. There is a guaranteed minimum price decreasing over time from 60 SEK in 2003 to 0 in 2008.
UK Suppliers Rising to 15.4 % of electricity supplied in 2015-16 then remaining at this rate till 2026-27
solar, hydro (up to 20 MW), wave power, tidal energy, geothermal energy, biofuels (including energy crops) and wind.
30 GBP/MWh (approximately 4.5 €ct/kWh): buyout certificates, increasing with the Retail Price Index annually. Penalty recycled to parties who have met the obligation
Poland Suppliers 7.5 % RES-E in gross domestic electricity consumption in 2010.
All RES can obtain Guarantees of Origin (GOs). There are no green certificates in the strict sense, just GOs that could be indirectly traded by derivatives (created at polish power exchange): the size of 1 derivative instrument for GO is 1 kWh. No time validity for derivatives
There is a so-called ‘substitute fee’ of 240 PLN/MWh (appprox. 60 Euro/MWh), the money from which go to the Environmental Fund. There is also a penalty proportional to the quantity of non purchased energy and an average annual price
Romania Suppliers 4.3 % of gross national electricity consumption in 2010
Wind, biomass, solar and small hydro producers (below 10 MW, commissioned or refurnished before or in 2004)
The penalty is based on the market price of certificates in the year of non-compliance. Each year the regulator set a minimum and a maximum value for

29
Obliged parties Target and timeframe Technologies Penalties
the market price of certificates. Austria (phased out)
Suppliers 8 % of electricity supplied comes from domestic small-scale hydroelectric plants (below 10 MW) Certificate system functioned in the period 2000-2002
Hydropower 10 kW-10 MW Penalty equal to the average production costs of small-scale hydropower plants and the market price. Between 3.91 Cent/kWh for Styria and 1.01 Cent/kWh for Vienna.
Netherlands (mostly phased out22)
No obligation No obligation. Initially the system (then called the Green Label) was intended to register the compliance of Dutch utilities with the voluntary target setting and allow for trade among this group. Later the system was called a certificate system and linked to a combination of tax exemption and production support (a pass through of part of tax revenues to RES-E producers). During part of this period the certificates could also be imported. From July 2004 until January 2005 the certificate system has been linked to a combination of tax exemption and feed-in tariff. As of January 2005 the system is only linked to a feed-in tariff and the certificates are substituted by GoOs.
Biomass, Hydropower production below 15MW, Solar energy, Wind energy, Wave and tidal energy
Belgium: Flanders
Suppliers Up to 5 % in 2010 All RES, hydro up to 10 MW; certificates from other regions/countries not accepted. A CHP certificate recently started (see details in text box).
125 Euro/certificate in 2004
Belgium Walloon
Suppliers Up to 8 % in 2010
RES and CHP below 20 MW. 1 cert for each 456 kg of avoided CO2 (1 MWh in
100 Euro/certificate in 2004 (progressively increasing since 2002)
22 The tax exemption has been entirely phased out, but the certification route linked to feed-in tariffs and some pass-on still exists. Now no longer called green cert system, but GoO system, but in principle the system is the same. We are indebted for this clarification – and for many other updates on the green certificate systems in Europe – to Monique Voogt.

30
Obliged parties Target and timeframe Technologies Penalties
quarterly redemption 55 % efficiency CCGT) Belgium Brussels
Up to 2,5% in 2005. Certificates are valid for 5 years.
Hydro up to 10 MW, systems older than 10 years not eligible. 1 certificate for each 217 kg of avoided CO2 (emissions of burning 1 MWh Eprim of natural gas)

31
The other main model for operational support of renewables is the fixed price feed-in tariff
(FIT or REFIT). Under a FIT scheme an obligation is introduced to purchase electricity
generated from RES at a tariff determined by public authorities that may be guaranteed for a
specified period of time. The tariff can be uniform for all sources (single feed-in), or
differentiated by source (or even by location, as is the case for wind power in Germany). The
first successful FIT was introduced in Germany in 1990 [16]. Apart from Germany, in the
EU-15 feed-in tariffs also function in Denmark, Spain, Finland, France and Portugal, Austria,
Greece, Luxemburg, and the Netherlands (from July 2003) [17]; Italy still has a REFIT
scheme for PV that functions in parallel to its TGC. Only Greece and Luxemburg apply a
single feed-in tariff for all RES [18].
Most new Member States and Candidate Countries have feed-in systems introduced in the
past 5 years, predominantly not differentiated by source. Romania has introduced RE quotas
and green certificates in 2005. Hungary has legislated the possibility of replacing its feed-in
system by a TGC scheme in its Electricity Act of 2001, but the start date will be specified in a
later Ministerial Decree. Bulgaria has declared in a decree its intention to introduce a green
certificate system from 2007. In addition to these government-based TGC systems, the
RECS23 facilitated trade in green certificates used mainly for voluntary demand.
FIT and TGC systems represent the classical debate known as “prices versus quantities”, or
price-driven versus capacity-driven approaches. FITs indicate the exact price, or cost of
compliance, without giving any clear indication as to the exact quantity to be produced at this
price. Conversely, the quantity model (quota combined with TGC) stipulates in advance the
exact outcome to be achieved, without giving indications on the cost of compliance, except
that marginal cost of compliance is normally equalized across sources [19]. There are pros
and cons for both of these instruments (see for instance [20, 21]).
A TGC system aims to develop a set percentage of RES-E at least cost, and does not provide
any incentives to develop renewables exceeding the quota. Prioritisation of cost minimization
may lead to restricted geographical distribution, limited technological development and
23 The Renewable Energy Certificate System is an organisation that was established in March 1999, aiming to prove that a high quality system of tradable green certificates can operate in the European market. Its two main objectives were and are to facilitate actual trade in TGCs as well as establishing harmonization between national systems. To ensure the latter, the RECS developed and adopted a set of rules on the establishment of systems (issuing certificates, trade regulations and rules for redemption). More information: www.recs.org.

32
technological variety, reliance on foreign equipment producers and low or no R&D
investments on the part of equipment producers [16]. On the other hand if quotas are set for a
long-term period and are independent from governmental policy, then a stable planning
horizon is set and risk is minimized for producers. Factors related to stability and
predictability of governmental policies also make investments more attractive for financing
institutions. In addition, since there is no bottom price, generators are likely to exercise
pressure on equipment producers for lower prices and on developers for best available
locations [16].
In contrast, feed-in tariffs encourage technological development (dynamic efficiency) and if
properly designed ensure security for producers for the long term. However, feed-in tariffs
allow producers to keep the surplus created by technical development and generate excessive
profits, unless there is a way to adjust the tariff accordingly [16, 19]. A stepped FIT may
allow for decreasing the tariffs over time according to the expected learning curve and
economies of scale. To avoid windfall profits FIT is differentiated according to technology
performance indicators and according to whether they are given to existing, possibly fully
depreciated, or new capacity [22]24. However, such precise design involves significant
information requirements, that is, the marginal generation costs of each generator25.
A final MBI in the energy sector, which is relevant for the present discussion, is a system of
combined heat and power (CHP) production quotas and certification of CHP output. As a
CHP plant has four main outputs – heat, electricity, energy losses (waste heat), and
environmental externalities (e.g. CO2 emissions) – the question is which output or
combination of outputs should be chosen as the basis for issuing CHP certificates. Each of
these choices has certain implications, discussed in literature [see for example [21]]. Box 3
summarises the features of existing CHP certification schemes.
24 A stepped feed-in tariff refers to a band specific tariff level (e.g. depending on the number of full load hours for wind energy) therefore gives different support to different cost bands. 25 For a detailed analysis of the various support mechanism for renewable in the European Union, please see the Communication from the Commission “The support of electricity from renewable energy sources” (COM(2005) 627 Final) available at http://europa.eu.int/comm/energy/res/legislation/support_electricity_en.htm
33
Box 3. Combined heat and power (CHP) certification
In addition to existing certificates for green electricity, there are also applications of CHP certification. In Flanders (Belgium) a decree introduces the implementation of CHP certificates as of January 2005. Electricity suppliers are obliged to submit certificates according to 1.2 % of electricity supplied in 2005 until 5.2 % in 2013. Electricity production, capacity and primary energy savings are registered. One CHP certificate is awarded for each primary energy saving (PES) of 1 MWh realized as compared to the separate reference power and heat generation technologies. Installations commissioned before January 2002 are not eligible. In Wallonia (Belgium) electricity from CHP is certified within the framework of the tradable green certificate scheme in place. Since mid-2004 in the Netherlands a CO2 index is applied to calculate ‘blue electricity’, that is the CO2 free part of CHP electricity. Blue certificates reward ‘blue electricity’ and CHP generates 85% of Dutch CO2 free electricity. While the index system is operational, support is subject to limitations because of the EU environmental support framework and cost considerations. The CHP certification system in the UK is linked to the existing climate change levy (CCL): from 1 April 2003, the exemption from CCL has been extended to include indirect supplies of qualifying CHP electricity. Each MWh of qualifying electricity generated is certified through a CHP Levy Exemption Certificate (CHP LECs), which carries a unique reference number incorporating a station identifier. LECs are issued monthly, up to three months in arrears based on the amount of qualifying electricity within the total output notified by the station. In the UK the debate during the passage of the Energy Act called for support measures in transport and heat sectors, leading to provisions for the introduction of a Renewable Transport Fuel Obligation. The benefits and prospective operation of a Renewable Heat Obligation are currently being evaluated. The concept has already been endorsed by the Royal Commission on Environmental Pollution’s report on biomass energy and a research study produced for DEFRA.

34

35
2. Tradable certificates for energy savings
One of the strongest arguments in favour of MBIs in general is that under a standard set of
assumptions about perfect markets they minimize the costs to society26: trading equalises the
marginal costs spent on complying with a target (static efficiency) and under certain
circumstances create incentives to innovate and improve performance27 (dynamic efficiency).
Since obliged parties have different marginal costs of compliance, equalising of marginal
costs through trading will be beneficial provided that transaction costs are not excessive to
undermine the potential benefits of the scheme. In addition with the gradual opening of
European electricity and gas markets to competition, new policy tools are needed to promote
energy efficiency in end-use that are compatible with market conditions. Apart from
complying with this requirement and often being more acceptable than, for instance, taxation,
market-oriented schemes are likely to change mindsets. Harnessing market forces to deliver
energy savings may thus focus the attention of businesses on the economic benefits of
demand-side energy efficiency and energy services and hence stimulate both investments and
the ESCO industry.
A possible market-based policy portfolio could comprise energy-savings quota for some
category of operators (distributors, suppliers, consumers, etc.) coupled with a trading system
for energy-efficiency measures resulting in energy savings. The savings would be verified by
the regulator and certified by means of the so-called “white” certificates (tradable
certificates for energy savings). In Italy certificates are called Energy Efficiency Titles, while
in France they are referred to as Certificates of energy savings.
26 In practice whether MBIs minimise costs for society depends on a few factors, the two major ones being (1) whether long term risk can be reduced and therefore risk premium is low and (2) whether the cost curve is shallow enough to avoid large windfall profits in a technology unspecific scheme. We are indebted for this comment to Mario Ragwitz and Wolfgang Eichhammer from the Fraunhofer Institute. 27 Market-based instruments stimulate innovations only when these bring extra rent to the obliged parties.
A white certificate is an instrument issued by an authority or an authorised body providing a
guarantee that a certain amount of energy savings has been achieved. Each certificate is a
unique and traceable commodity that carries a property right over a certain amount of
additional savings and guarantees that the benefit of these savings has not been accounted for
elsewhere.

36
In principle a system of obligations and energy saving certificates can be defined and
delineated in different ways. First, it may refer to a system of imposing energy saving
obligations and verifying compliance via certification of savings or via other methods
(e.g. ex-post programme evaluation). Second, it may refer to a system of imposing energy
saving obligations and allowing the trade of obligations (in which case the money will flow
from the party “selling” its obligation to the party assuming/”buying” it) and/or of certified
savings. Third, it may refer to only savings certification that is applied to guarantee that a
certain amount of energy savings has been achieved and can be used also for demonstrating
eligibility for e.g. tax relieves or subsidies or carbon offset programmes. A final wider
definition would consider white certificates scheme any scheme that involves an obligation
that can be met by improved energy efficiency or other project types and energy efficiency
and savings certificates can be created and traded within a larger allowance, certificate or
project credit trading regime. This less strict case obviously would cover saving certificates
applied in a GHG cap-and-trade system. The scheme is New South Wales (Australia) would
not qualify as a white certificate scheme under the narrow definition, but it would qualify
under the wider definition28.
In the sections to follow we make an overview of the elements of schemes that involve energy
savings targets and a possibility to trade certified energy savings or savings obligations, of the
different arrangements of these in the two existing schemes – in Italy and Great Britain, – and
the one in preparation in France. While these schemes are conceptually similar, the
implementation shows some marked differences.
It should be emphasised here that improving energy efficiency and energy savings are two
separate concepts, which can exist independently and may be targeted separately by policy
intervention. Increased energy efficiency of a system does not always result in energy savings
because of factors such as the so-called “rebound effect”29 of partially offsetting efficiency
28 We are indebted to David Crossley for pointing out this broader definition. 29 Empirical works show 20-30 % rebound effect for space heating in residential building retrofits in Austria [23]; in the United Kingdom, Milne and Boardman [24] found that about 30 % of the potential energy savings from retrofit measures was taken as increased comfort in low-income households as of the late 1990s. Other empirical studies found rebound effect in US manufacturing of 24 % [25] and rebound effect for all OECD energy use of 5-15 % [26] (cited in [27] and [28]). But the magnitude of this rebound effect is declining over time due to the increasing penetration of central heating and increasing average indoor temperature [29]. The sizes of the rebound effect differs markedly across technologies and measures: for example for refrigerators there has been a mere 1.7 % increase in adjusted net volumes of refrigerators over the period 1994-2004 [30]. For an
37
improvements with greater usage or improved comfort and because of the reduced unit cost of
energy services, which also fuels consumption. On the other hand energy savings may be
disconnected from energy efficiency improvements and result from e.g. behavioural changes
(such as turning off equipment when not in use) or changes in system conditions (such as
reduced indoor temperature, lower production or occupancy levels). Often the term energy
conservation is used to denote energy savings, which do not result in improvements to energy
efficiency.
In the authors’ view only additional energy savings justify a policy intervention: policy may
support measures that involve either investments or achieved savings (or both) provided that
they are measured against the same system conditions. Measures may include:
investments in energy efficiency evaluated against the same system conditions (i.e.
‘hard’ measures such as equipment upgrade or installation) as well as
‘soft’ measures (information, good management, education on behaviour changes,
such as switching off equipment when not in use).
extended discussion of the rebound effect, see, for instance, the special issue of Energy Policy from June 2000 (Volume 28, Issues 6-7) [31].

38
2.1. Elements of a white certificate policy portfolio: issues and experiences
A TCES portfolio involves the following basic elements (see [14, 32-36]):
The creation and framing of the demand: tradable certificates represent a meaningful
option only if there is interest in buying/selling them;
The tradable instrument (certificate) representing the savings and conferring property
rights to the holder, and the rules for trading;
Institutional infrastructure and processes to support the scheme and creation of the
market: an aspect that is often overlooked is that markets do not function in a vacuum.
These activities include for instance measurement and verification, evaluation methods
and rules for issuing certificates, a data management and certificate tracking system
and a registry;
Cost recovery mechanism in some cases.
2.1.1. General characteristics of energy saving obligations and trading systems in Europe
Variations of the policy mix described above have been introduced in Italy and Great Britain;
a white certificate system is currently in preparation in France and likely to start in 2006. In
the Flemish region of Belgium there are savings obligations imposed on electricity
distributors without certificate trading option. The first operational scheme in the world with a
white certificate trading element has been introduced in New South Wales (NSW, Australia);
it is however a greenhouse gas trading system that has an end-use energy efficiency element.
In Italy command-and-control measures (energy savings targets in primary energy
consumption for electricity and gas grid distribution companies with more than 100,000
customers as of end of 2001) are combined with market instruments (tradable certificates for
energy savings issued to distributors and energy service companies), as well as with elements
of tariff regulation (a cost recovery mechanism via electricity and gas tariffs and multiple
39
driver tariff schemes30 to reduce the disincentives for regulated electricity and natural gas
companies to promote end-use energy efficiency among their customers) or dedicated funds in
some circumstances. Over the 5 years of the current phase of the scheme 3 million tons of oil
equivalent (Mtoe) of cumulative primary energy savings are projected to be realised, of which
1,6 Mtoe by electricity distributors and 1,3 Mtoe by natural gas distributors. Figure 2 gives
details on target formation and evolution of savings over the 5 years of the current phase. At
least half of the target set for each single year is to be achieved via a reduction of electricity
and gas end-use consumption (referred to as the “50% constraint” to which each distributor is
subject). The remaining share can be achieved via primary energy savings in all the other end-
use sectors. Energy savings projects contribute to the achievement of targets for up to five
years (with only some exceptions). Only savings that are additional to spontaneous market
trends and legislative requirements are considered. After a long process of designing and
elaborating elements, the Italian scheme finally became operational in January 2005 [34, 38-
40].
30 Multiple Driver Tariffs (MDT) essentially constitutes tariff regulation schemes linking the evolution over time of allowed revenues with cost drivers such as number of customers, grid lengths and energy sales [37].

40
Figure 2. Energy savings target and evolution of savings in the first 5-year compliance period in Italy
Source: Pavan [41]
Energy Saving Targets, incremental and cumulated (electricity sector)
0
0,2
0,4
0,6
0,8
1
1,2
1,4
1,6
1,8
2005 2006 2007 2008 2009 2010 2011 2012 2013
Mte
p/an
no
incrementa lsavings year, 5
incrementa l savings, year 4
incrementa l savings, year 3
incrementa l savings, year 2
incrementa l savings, year 1
cumulated savings
Energy Saving Targets, incremental and cumulated (natural gas sector)
0
0,2
0,4
0,6
0,8
1
1,2
1,4
2005 2006 2007 2008 2009 2010 2011 2012 2013
Mte
p/an
no
incrementalsavings year, 5
incremental savings, year 4
incremental savings, year 3
incremental savings, year 2
incremental savings, year 1
cumulated savings

41
In Great Britain, the Energy Efficiency Commitment (EEC) runs in 3-year cycles from 2002
to 2011. It replaced the previously existing Energy Efficiency Standards of Performance
(EESOP) running from 1994 till 2002, which established the principle of pooled spending on
energy efficiency for domestic consumers. EEC-1 program required that all gas and electricity
suppliers with 15,000 or more domestic customers deliver a certain quantity of ‘fuel
standardised energy benefits’ by encouraging or assisting customers to take energy-efficiency
measures in their homes. The overall savings target was 62 fuel standardised TWh31 (lifetime
discounted) and the total delivered savings reached 86.8 TWh32 [42]. In EEC-2 (2005-2008)
the threshold for obligation has been increased to 50,000 domestic customers. The target has
been increased to 130 TWh; however also due to carrying over of savings from EEC-1 already
in 2005 more than a quarter of this target has already been achieved. Suppliers must achieve at
least half of their energy savings in households on income-related benefits and tax credits.
Projects can be related to electricity, gas, coal, oil and LPG. Suppliers are not limited to
assisting their own customers only and can achieve improvements in relation to any domestic
consumers in the UK. Carbon benefits estimations take into account the rebound effect – the
likely proportion of the investment to be taken up by improved comfort – by adjusting the
benefits to ‘comfort factors’33; in addition dead-weight factors are considered to account for
the effect of investments that would be made anyway. At present certificate trading is not a
feature of the scheme in Great Britain.
The proposed French system, whose start is planned for 2006, envisages that all electricity,
gas, LPG34, oil, cooling and heating for stationary applications fuel suppliers that supply over
0.4 TWh/year will have to meet a target of energy savings35. It excludes plants under the EU
ETS Directive and fuel substitution between fossil fuels, as well as energy savings resulting
only from measures implemented just to comply with current legislation. Apart from these no
additional restrictions on compliance are foreseen: to meet the obligation savings can be made
in any sector and with any energy source or carrier. The following details related to the
31 Energy savings are discounted over the lifetime of the measure and then standardized according to the carbon content of the fuel saved. 32 These are fuel standardised units although the savings from individual fuels are carbon weighted. Fuel standardisation means that each energy carrier is weighted according to his CO2 emission factor. 33 Suppliers are accredited with the complete energy saving, it is only when the carbon saving from the scheme is calculated that the comfort factors are used. We are indebted for this clarification to Charles Hargreaves. 34 Domestic fuel excludes transport usages. 35 The main rules are defined in a law passed in July 2005. Details, such as precise thresholds, are given in two Decrees – one on obligations and one on certificates.
42
obligation parameters are known at the time of finalising this report: the total target for the
first three years (2006-2008) will be 54 TWh (in final energy) cumulated over the life of the
energy efficiency actions with a 4 % discount rate. The target apportionment is a two-step
procedure: first the total obligation is divided among different energies, and then the
obligation for a particular energy is apportioned among respective energy suppliers included
in the system. The expected cost of action is below 20 Euro/MWh [43].
Energy efficiency obligations without certificate trading are also in place in the Flemish
region of Belgium. Regional utility obligations have been introduced in 2003 and are
imposed on the electricity distributors: there are currently 16 electricity distributors covered
by the obligation. The annual target is 0.58 TWh and eligible actions refer to residential and
non energy intensive industry and service and can involve saving fuel from any sources.
Separate targets are set for low voltage clients (<1kv) (mainly residential) and high voltage
clients (>1kV). For the low voltage clients, the targets are 10.5% of electricity supplied over
the 6 years from 2003 to 2008 and for high voltage users (>1kV) 1% per annum for each over
the same period. The reason for the higher than 1% per annum target for the low voltage users
is because of the Flemish Parliament’s decision to provide free vouchers for the head of every
family in 2004 and 2005 which can be exchanged via the electricity distributor for either an
energy saving CFL or a low flow shower head or an energy meter. In 2006 and 2007, it is
planned that the other members of the family will receive a voucher for an energy efficient
light bulb [44].
There is a discussion going on in the Netherlands about the introduction of a white certificate
scheme. At the time of finalising this report36 the following elements are under discussion: a
target of 65 PJ of additional savings over the period 2008-2020 (or 1.8 % of annual demand in
end year) with obligation imposed on energy suppliers or energy distribution companies and
the target groups being dwelling and tertiary sector (existing building stock). It is proposed to
allow non-obliged parties to create certificates and allow all measures contributing to an
improved energy performance of buildings as well as a selection of other efficiency measures
with small market share or low penetration [45]. Various corrections are being considered
(rebound, lifetime of measures, misuse). There is a strong intention to establish long-term
certainty and predictability with clear mechanisms for adjusting targets in consequent
36 December 2005

43
compliance periods and regular updates of assigned saving values of energy efficiency index
and individual measures. Options to minimise administrative costs are also discussed,
including electronic and web-based registration and using existing energy efficiency
attestation tools (such as the EPBD efficiency index and efficiency labels). It is expected that
a decision whether to introduce the scheme will be taken in early 2006 [45].
The white certificates scheme in New South Wales (Australia) is part of a larger scheme: the
NSW Greenhouse Gas Abatement Scheme. Under this scheme, which started to operate in
2003, electricity retailers and certain other parties (collectively referred to as benchmark
participants37) must meet mandatory targets for reducing the emission of GHG from the
production of the electricity they supply or use. One way to achieve this is through activities
that result in reduced consumption of electricity (“demand side abatement”) [46, 47]. While
the New South Wales (NSW) scheme is designed as a cap and trade carbon abatement scheme
applied to energy retailers, unlike the EU ETS NSW Greenhouse Abatement Certificates
(NGACs) can be sourced from the end-use energy efficiency of energy consumers. The unit
of the scheme is CO2 reduction not energy saved. The NSW scheme in practice is delivering
limited outcomes in terms of energy efficiency, because other forms of GHG have a
significantly lower marginal cost38. This scheme is discussed in more detail in Section 4 of
this report for its relevance in the context of integrating white certificates with other market-
based instruments in the energy sector, such as emission trading.
Table 2 below summarises the key features of energy efficiency obligations in Europe. Two of
the schemes – the Italian and the French ones – employ or envisage tradable certificates for
energy savings. The other two – the one in Great Britain and the one in the Flemish region –
are focussed on imposing a savings obligation39. Major issues related to the specific elements
and design features of the policy portfolio that includes energy savings and tradable white
certificates are discussed in detail in the text to follow with profound examples from the
different models in the three largest schemes – in Italy, Great Britain and the one to start in
37 Enforceable targets have been set for electricity retail suppliers, electricity customers taking supply directly from the National Electricity Market, and scheduled generators listed in the Regulations. In addition, some large electricity customers and persons carrying out projects designated as being State significant development can elect to become benchmark participants. 38 We are indebted for this comment to David Young. 39 The EEC in the UK does allow for some trading, see details in text.

44
France. Box 4 provides a summary of state-level energy efficiency obligations in the United
States.
Table 4 at the end of the section summarises in greater details the discussion of
implementations in Europe. It should be emphasised that because experience with mandatory
targets for energy savings coupled with a trading mechanism is rather limited, the analysis is
based on design options and is therefore theoretical rather than empirical in nature.

45
Table 2. Overview of energy efficiency obligations in Europe Source: Lees [44]
Country Obliged party
Size of target, primary or final
Nature of savings target
Discount rate
Eligible customers
Administrator Penalty Certificate trade
Italy Electricity and gas distributors
3 Mtoe in 5th year Primary energy
Cumulative primary energy
- All Regulator (AEEG) Dependent, inter alia, upon the size of under-compliance and the certificate price
Yes, 3 types of certificates
Great Britain (EEC-2)
Electricity and gas suppliers
130.2 TWh carbon weighted Final energy
Lifetime delivered energy
3.5 % Residential only
Regulator (OFGEM) Dependent upon the size of under-compliance
No, possibility to trade obligations
France All energy suppliers
54 TWh over 3 years (2006-2008) Final
Lifetime final energy
4 % All (incl. transport) excluding EU ETS
Government 0.02 Euro/kWh
Yes
Belgium (Flanders)
Electricity distributors
0.58 TWh annual Primary
Lifetime primary energy
0 % Residential and non energy intensive industry and service
Flemish Government
0.1 Euro/kWh and the fine cannot be passed in the tariffs
No
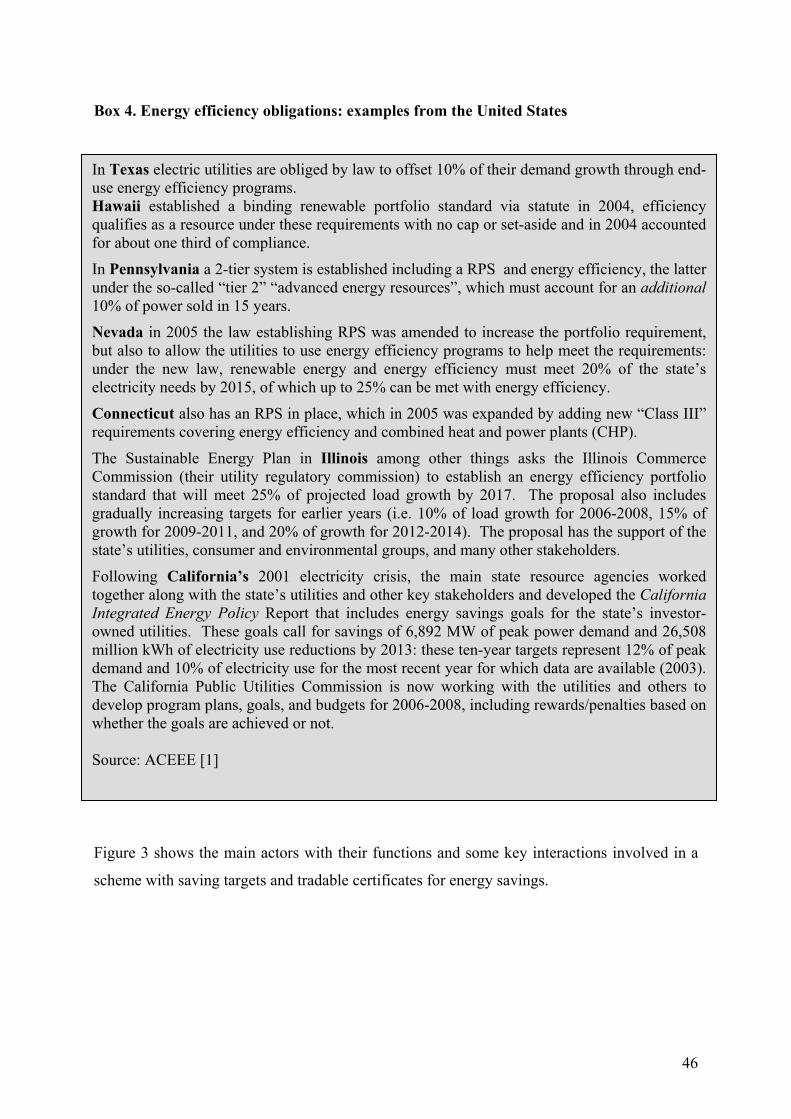
46
Box 4. Energy efficiency obligations: examples from the United States
Figure 3 shows the main actors with their functions and some key interactions involved in a
scheme with saving targets and tradable certificates for energy savings.
In Texas electric utilities are obliged by law to offset 10% of their demand growth through end-use energy efficiency programs. Hawaii established a binding renewable portfolio standard via statute in 2004, efficiency qualifies as a resource under these requirements with no cap or set-aside and in 2004 accounted for about one third of compliance.
In Pennsylvania a 2-tier system is established including a RPS and energy efficiency, the latter under the so-called “tier 2” “advanced energy resources”, which must account for an additional10% of power sold in 15 years.
Nevada in 2005 the law establishing RPS was amended to increase the portfolio requirement, but also to allow the utilities to use energy efficiency programs to help meet the requirements: under the new law, renewable energy and energy efficiency must meet 20% of the state’s electricity needs by 2015, of which up to 25% can be met with energy efficiency.
Connecticut also has an RPS in place, which in 2005 was expanded by adding new “Class III” requirements covering energy efficiency and combined heat and power plants (CHP).
The Sustainable Energy Plan in Illinois among other things asks the Illinois Commerce Commission (their utility regulatory commission) to establish an energy efficiency portfolio standard that will meet 25% of projected load growth by 2017. The proposal also includes gradually increasing targets for earlier years (i.e. 10% of load growth for 2006-2008, 15% of growth for 2009-2011, and 20% of growth for 2012-2014). The proposal has the support of the state’s utilities, consumer and environmental groups, and many other stakeholders.
Following California’s 2001 electricity crisis, the main state resource agencies worked together along with the state’s utilities and other key stakeholders and developed the California Integrated Energy Policy Report that includes energy savings goals for the state’s investor-owned utilities. These goals call for savings of 6,892 MW of peak power demand and 26,508 million kWh of electricity use reductions by 2013: these ten-year targets represent 12% of peak demand and 10% of electricity use for the most recent year for which data are available (2003). The California Public Utilities Commission is now working with the utilities and others to develop program plans, goals, and budgets for 2006-2008, including rewards/penalties based on whether the goals are achieved or not. Source: ACEEE [1]

47
Figure 3. A policy portfolio with mandatory savings targets and white certificates: summary of roles of actors and relationships between them
Implement projects to meet targets (or buy certificates, or pay penalty)
Implement projects as part of normal business operation
Demonstrate compliance with targets or pay penalty
Certificate market
GOVERNMENT
REGULATOR AUTHORITY
Obliged parties (distribution companies or supply companies, or large
consumers)
Non-obliged parties allowed to get certificates for projects
implemented (ESCOs, large consumers, brokers)
FINAL CONSUMERS
Define the overall target (cap) and apportionment criteria for individual company’s targets
Market operator: organizes the registry, updates it for all transactions, communicates the results to the regulator
Project evaluation and approval, M&V methodologies, Verification of savings, Issuing certificates
Certificate trade
Note: See section 2.1.3. for a more detailed discussion of institutional structures and roles.
48
2.1.2. Creation and framing of the market: relevant policy aspects
There are two options to create demand for tradable certificates for energy savings: by
obligation or by some kind of incentive (for instance, tax exemptions). We disregard the
option of setting up an entirely voluntary scheme, since it is our belief that voluntary demand
will not create a substantial market for TCES and focus on emerging issues about setting the
obligation. Imposing obligations provides for certain outcome, but at the same time opens a
whole new array of associated design complexities.
2.1.2.1. Size and unit of the target
First, the size of the target should be defined; a sound technical-economic analysis is needed
to inform such a decision. As experience with TGC shows, a target that reflects little more
than business-as-usual is to foster additional energy efficiency measures. The reference point
and year for setting the target is crucial – the target can be defined e.g. in terms of technical-
economic potential (for instance taking into account payback period), of actual or predicted
consumption.
The policy goal and the underlying policy driver is a central issue with profound impacts also
on the political and public acceptability of the scheme. The type of effect a government wants
to achieve through establishing such a scheme has a major influence on the type of trading
scheme set up and its operation details. There is a range of policy objectives that can be
addressed through energy savings obligations and trading schemes, such as security of supply,
reliability of electricity supply, GHG mitigation, local pollution reduction. Significant co-
benefits of a TCES scheme, such as social policy objectives (e.g. fuel poverty alleviation),
increased productivity of the economy and technology diffusion should also be made explicit
and quantified.
The policy goal under which a TCES scheme is introduced has direct implications for setting
the unit of the target: if a TCES scheme builds on the policy goal of improved security of
supply, the target will probably be defined in primary energy savings, while if the aim is

49
reliability of electricity supply the target will be set in final energy [35]40. A TCES scheme
based on a quantitative CO2 reduction target involves a certain risk of non-carbon benefits of
end-use energy efficiency being ignored; unless it is explicitly specified that the scheme refers
to end-use energy efficiency, a target expressed in CO2 and/or primary energy may focus
action on supply side projects or other not energy efficiency related emission mitigation
projects41. Local pollution is not an obvious driver for the setting of such a scheme. In our
opinion TCES scheme fits best under policy goals related to improved security of supply and
improved reliability of electricity supply; carbon emission reduction is another possibility: in
this case it is important to clearly establish that this is an energy saving scheme and refers to
end-use consumption (rather than, for example, supply-side efficiency gains).
The Italian scheme has a target expressed in primary energy (tons of oil equivalent), while the
British system has a target in TWh of fuel weighted energy benefits. Establishing the exact
size of the target remains contentious also because the externality issue is unclear and hence
the question of which the public good is commoditized through the certificate remains
unanswered42.
2.1.2.2. Obliged parties
A second step is to define who the obliged actors should be and how the overall target should
be apportioned to individual actors. The alternatives are upstream and downstream systems.
The former, as applied with regard to e.g. emission trading, aim at fuel or electricity producers
and importers of energy and have the advantage of comprehensiveness. With regard to end-
use energy efficiency an upstream system it cannot aim “higher” in the energy chain than
transmission and distribution. The downstream system targets users, such as industrial users
40 Unless a limited end-use sectoral coverage is introduced and the scheme is restricted to end-use energy efficiency improvements (as is the case in the proposal in the Netherlands where the target is also expressed in primary energy, see details later), a target expressed in primary energy will involve supply side efficiency improvements. In effect the market may then be mostly oriented towards the supply side for larger size of projects and minimizing transaction costs for economies of scale. 41 While in Great Britain fuel-standardisation introduces a strong climate element in energy efficiency, the obligation attainment nevertheless refers to end-use energy efficiency only (and possibly micro-CHP) rather than any emission mitigation option. 42 Externalities arise when certain actions of producers or consumers have unintended external (indirect) effects on other producers or/and consumers; in the presence of externalities social benefits (costs) and private benefits (costs) differ. Externalities may be positive or negative. With negative externalities social costs are higher than private costs: pollution is a negative externality. With positive externalities social benefit is higher than private benefit, which leads to the undersupply of the activity by the market: the technological spillover of research and development is a positive externality.

50
(outside EU ETS), commercial facilities, and even households. There has been debate in the
UK around domestic tradable CO2 quotas with the obligation imposed on households.
In Italy each year national targets are apportioned among distributors that serve more than
100,000 customers on the basis of the quantity of electricity and gas distributed to final
customers compared to the national total in year t-2. The apportionment in Italy is linear to the
market share. Because in Italy the subject under obligation are distributors with more than
100,000 customers, for the gas sector distributors responsible for above 40%
of final consumption are not covered; Italgas account for the distribution of 20 % of final
consumption and among gas distributors is the market actor with largest target [38a]. For
electricity the amount of non-covered distributors’ share in final consumption is about 2 %;
Enel Distribuzione has the largest market share (almost 88 % of final consumption) and
consequently accounts for the largest share of the target [38a].
In Great Britain target apportionment is based on number of domestic customers; in EEC-1
the obligation became tighter for companies with increasing size, but this feature of the
system was removed in EEC-2. In the proposed French system the distribution of obligations
is based on market shares of energy sales turnover in the residential and tertiary sectors. It is
proposed that suppliers with annual sales above 0.4 TWh43 will be subject to the obligation;
the apportionment of the total annual target will be done on annual basis to take into account
new market players.
In principle the individual targets can be expressed as a sales percentage or as an absolute
value, i.e. independently of the commercial choices of suppliers [48]. Quirion [49] compares
the distributional effects of alternative apportionment rules. It appears to be more acceptable
to set targets as a percentage of the energy that distributors or suppliers sell rather than in
absolute terms and should be contingent upon the evolution of market share. In the latter case
under assumptions of perfect competition and no public intervention in the energy market
energy suppliers’ profit decreases since suppliers cannot pass the cost of certificate generation
on to consumers44. This is likely to generate fierce opposition from these potentially obliged
distributors or suppliers [49].
43 Except for domestic oil. 44 If a white certificate scheme is designed with suppliers’ targets independent of changes in kWh sales, then under a set of standard assumptions the only effect on energy price is decrease because the energy supply curve s

51
2.1.2.3. Temporal content Third, the temporal content of the obligation should be defined. The definition of
compliance period and possibly rate of increase are important from the point of view of
providing security for investors and hence from the point of view of financing institutions. In
Great Britain the compliance period for EEC-1 has been 2002-2005; EEC 2 runs in the period
2005-2008; there has been a roughly double increase in target between EEC-1 and EEC-2;
however due to changes in the way the savings have been calculated, it is difficult to put a
precise figure on it. The obliged parties under the Italian scheme have to demonstrate
compliance annually in the period 2005-2009; by the end of 2006 the government has to come
up with targets for the next period. Measures generate certificates for a 5-year lifetime
period45. The first stage of the French scheme will cover a 3-year period; in Flanders there are
annual targets for the period 2004-2007. More details on temporal aspects available in the
section on tools for mitigating certificate price volatility.
2.1.2.4. Eligible projects: technologies, actors, energy carriers, customer base
Fourth, it should be decided what projects and/or technologies are eligible under the scheme.
In Italy, activities in all end-use sectors are eligible; there is an illustrative list of eligible
projects. However, at least half of the target set for each single year should be achieved by
reduction of the supplied energy, i.e. electricity and gas uses (a.k.a. the “50 % constraint”)
[34]. Projects are not subject to approval before their implementation, although project
developers may ask for an ex-ante “qualitative” eligibility check. Projects must be designed,
implemented and evaluated according to criteria established by the Italian regulator AEEG
following consultation of all interested parties. Early experience in Italy shows that a
significant share of savings certified at present46 are coming from cogeneration, district
heating and public lighting projects. There are numerous submissions for certification of
projects following the deemed savings verification method, which has very minor data
requirements (see more details later). A surplus of certificates and banking of certificates are
upward-slopping. However – as explained by Quirion [49] based on a partial equilibrium model simulation – if suppliers must generate more certificates if they increase their sales, then certificates’ cost is a part of their marginal cost (hence of the energy price) and is passed like a tax on to consumers. While these statements are made with an assumption of perfect markets and competition, in practice the level of the market liberalization and the possibility to increase tariffs have profound effects too. 45 Certain types of measures related to buildings and bioclimatic improvements may have longer lifetimes. 46 Autumn of 2005.

52
expected in Italy because the regulator has to evaluate and certify the savings from eligible
projects starting from 2001, when the decrees were passed.
In Great Britain only activities concerning domestic users are eligible; at least 50% of the
energy savings must be targeted at customers that receive income related benefits or tax
credits (a.k.a. “priority group”). A non-exclusive list of measures is included within the
illustrative mix for EEC 2005-2008. Measures that are related to the reduction of energy
vectors other than the one supplied by the obliged party are allowed. For instance often
insulation measures – that account for the bulk of measures implemented by electricity and
gas suppliers – lead to reduction of gas consumption in gas-heated homes.
Experience from EEC-1 in Great Britain shows that a significant share (56 %) of the 86.8
TWh of savings delivered in the period 2002-2005 come from insulation (wall and loft).
Compact fluorescent lamps (CFLs) accounted for a quarter of the savings achieved, followed
by appliances (11 %) and heating measures (9 %) [42]. CFLs accounted for the largest
number of projects undertaken (almost 40 million measures related to CFL installation in
EEC-1), followed by wet and cold appliances [50]47. All suppliers, but two – who went into
administration and administrative receivership – achieved their targets; six suppliers exceeded
their targets in EEC-1 and carried out their additional savings to EEC-2, which equal roughly
25 % of EEC-2 target.
Apart from plants under the EU ETS Directive, fuel substitution between fossil fuels and
measures resulting just from measures implemented only to conform to current legislation, no
other restrictions on compliance are foreseen in the French scheme. Table 4 at the end of this
section of the report summarises the above points and presents a comparison of other details
of the schemes in Great Britain, Italy and France.
The Flemish obligation envisages that each year each grid operator submits a plan with
actions for the next year and actions must contain financial support, awareness-raising and
47 An illustrative list of measures for EEC-2 includes installations related to cavity wall insulation (1.7 million), loft installations (1.56 million), A-rated boilers (1.2 million), fuel switching (61,000), heating controls (0.5 million), CFLs (42 million), fridge saver-type schemes, A-rated appliances (2.6 million), tank insulation (0.46 million), draught proofing (0.31 million) [42]. New measures for EEC-2 include micro-CHP.
53
information campaigns48 and proposal for calculating of the energy savings [51]. In 2003 all
the electricity distributors met their targets except for one high voltage distributor49. The
target was met with less investment than initially expected. The energy saving target for 2004
was increased by over 44 % as compared to 2003; the targets for 2005 have been slightly
increased (by 5%) over 2004 to 579 GWh, out of which 351 GWh in the low-voltage segment
and 228 GWh in the high voltage segment [51]. In 2003 the average cost of measures in the
residential sector was 3.7 eurocents/kWhp of primary energy (ranging between 0.5 and 113
eurocents/kWhp); for the non-household sector the average cost of measures was 1.03
eurocents/kWhp primary energy (ranging between 0.25 and 152 eurocents/kWhp) [51].
Arguments in favour of a completely open scheme
With regard to project eligibility, the economic textbook argument is not to give preferential
treatment to any technology, form of energy or end-use sector and to instead focus on primary
or final energy that is causing the environmental or social harm. A preferential treatment
could lead to higher costs of compliance than if the market forces were left to determine the
least-cost path to the environmental or social objective [52]. In addition, theoretically the
wider the scope in terms of types of projects/investment choices and the fewer limitations in
terms of compliance routes, the more diverse marginal costs of compliance become and the
greater the benefits of trading in terms of lowering the overall cost of compliance. Therefore,
many project types should be allowed in order for trading to bring benefits that are sufficient
to offset the associated administrative and institutional costs; in contrast, limiting the scope to
certain technologies will increase the risk of price uncertainties and fluctuations. Limiting the
scope of a scheme in terms of participating sectors and actors can potentially reduce
administrative costs, but has the drawback of marginal cost of energy efficiency measures
increasing with time as lower cost options (“low-hanging fruits”) are used up50. Should there
be a large pool of low cost energy efficiency improvements already available, this may not be
a problem in the short term, however it will in the long term constrain further gains in energy
48 No energy savings are attributed to either information or awareness raising even though these are included in the actions. 49 The Flemish experience shows that it is especially difficult for small network managers with only have a few high voltage customers to meet their targets. 50 This effect may be even stronger if schemes are developed with short-term vision and goals subject to review. Short-termism is poorly suited to stimulating innovation in the energy efficiency market, because neither new or existing market participants will have the incentives to invest in any new technologies or services, if the schemes provide insufficient time in which to obtain a return on that investment. We are indebted for this comment to David Young.

54
efficiency. On the other hand such a development – if happening in a stable system of savings
obligations designed with a long-term vision – may stimulate further technology and service
innovation; beyond this a white certificate system is more likely to focus on technology
diffusion rather than innovation.
Arguments against a completely open scheme
There are some practical arguments against a comprehensive scheme that is completely open
in terms of technologies and sectors and, as described above, it is entirely up to market forces
to determine where and what measures are taken. As research on emission trading shows, the
positive effect of leaving it completely to market forces to decide on measures taken is only
valid where the benefits yielded by each unit of compliance/action – e.g. toe saved – are the
same in whatever end-use sector or location it is achieved. If this is not the case – for instance
in cases where multiple policy objectives are addressed through the scheme – then activities
will migrate to low cost measures, sectors or regions, which may raise equity issues and go
contrary to parallel policy goals [53]. Because cost minimisation is an inherent feature of
markets, a completely open scheme is likely to focus compliance on large-scale projects. This
may leave out certain sectors usually pointed at as especially problematic from energy
efficiency point of view, such as residential and in general buildings (where transaction costs
and higher and payback periods longer).
Last, but not least, any possible negative consequences of allowing obliged parties to
undertake measures outside their own energy carrier should be carefully considered for
possible interferences with competition law. For example, if an electricity supplier engages in
energy saving projects outside its own client base and outside its own energy carrier (e.g. gas),
then gas supplier, in whose client area the incursion takes place, could claim that the
considered energy carrier is more prone to energy saving and hence the scheme has
introduced an unfair disadvantage and consequently the alleged loser may insist that the state
pays compensation for stranded cost. Similarly if an energy supplier engages in energy saving
projects outside its own client base whereby end-users buy the considered energy carrier from
a non-obligated parties, then the alleged loser – the non-obligated company – seems to have a
strong case in demanding either compensation or prohibition of this kind of actions51.
51 We are indebted for this comment to Adriaan Perrels.

55
Table 3 provides the indicative (open) lists of eligible measures in Great Britain and Italy. As
shown by the implementation of both British and the Italian schemes, such a complex policy
portfolio is likely to serve multiple policy goals (for instance social goals such as alleviation
of fuel poverty as is the case in Great Britain): this is why often bonuses and/or special
restrictions are applied to encourage specific action. In Great Britain, suppliers can receive a
50%-uplift on the savings of energy efficiency measures that are promoted through energy
service activities. This uplift, however, is limited to 10 % of the overall activity. Of the six
major suppliers with an EEC target three submitted schemes that would take them over the 10
% threshold if take up had been as forecasted; in reality the energy services uplift was only
3.6% of all insulation activity. There is an uplift on innovative technologies too. The short-
term impact of enhancement is a reduction in overall carbon impact of policy instrument,
which in itself is undesirable [54]. However, if the market transforms more rapidly as a result
of this enhancement factor, then the long-term benefits can be greater and this impact is
justifiable52. A purely operational consideration against extensive scope is that inclusion of all
project types and all sectors may result in difficult and expensive validation and monitoring of
savings and a huge amount of work for regulators to design monitoring and verification
methodologies.
52 We are indebted for these clarifications to Eoin Lees and Dan Stanieszek.

56
Table 3. Indicative (open) lists of eligible measures in Great Britain and Italy
Italy UK
Electrical re-phasing; Electric motors and their applications; Lighting systems; Electricity leaking (stand-by, etc.); Actions to employ energy vectors more appropriate than electricity (substitution of electric boilers, etc.); Reduction of electricity consumption for thermal uses; Reduction of electricity consumption for cooling; Very efficient appliances and office equipment; Substitution of systems for combustion of non-renewable energy sources with more efficient ones; Substitution of electricity vector or other energy vector with more efficient ones; Room conditioning and heat recovering in buildings via renewable energy sources (district heating, etc.); Installation of renewable energy systems by end-users (solar panels, biomass, pv panels, etc.); Natural gas and electric vehicles; Education, information, training of end-users on energy saving;
Cavity wall insulation; Loft insulation, top up; Fridge saver-type programme; Condensing boilers; Appliance replacement; CFL – first or extra bulbs; Tank insulation, new – for hot water tanks currently without any form of insulation; Tank insulation, top-up – adding a further layer of insulation to reduce heat loss.
Note: In Italy the eligible energy efficiency measures are defined in Article 5 of the July 20, 2004 decree; paragraph 1 states that grid distribution companies have to reach their saving targets through energy efficiency measures typically belonging to the typologies listed above. The set of energy efficiency measures listed above is an ‘open’ one and suppliers are invited to include other measures, which are subject to the joint approval of the Ministry of Industry and the Ministry of Environment.
2.1.3. Cost recovery mechanism Cost recovery is a process whereby an energy distributor is able to recover, through rates, the
costs of implementing either DSM programs or any other type of energy saving action beyond
the consumers’ meter53.
53 These costs can include rebates, measure implementation costs and expenses. A key element of cost recovery is the prudency review. In contrast lost revenue recovery is a process whereby a utility estimates the amount of

57
Cost recovery via regulated tariffs can only be applicable where electricity and gas markets
are not fully liberalised and/or where the obligation is imposed on grid companies. Since cost
recovery is linked to regulated tariffs, it is not applicable in fully liberalized markets whereby
the obliged parties are energy suppliers who can pass the additional cost of compliance to the
final user (as is the case of Great Britain). Cost recovery is not applicable if savings
obligations are imposed on final users (none of the existing or planned schemes in Europe has
final users under obligation).
With perfect competition assumed all customers will bear the same specific burden of the
costs incurred for savings project implementation by energy suppliers. In practice suppliers
may shift the burden to less competitive market segments54.
In Italy, where the obligation is imposed on distribution grid companies, cost recovery is
allowed only for interventions concerning the obliged party’s own energy source or carrier;
cost recovery is also allowed when the intervention concerns measures implemented at the
premises of customers of another distributor. The cost recovery is net of any contribution from
other sources. The maximum cost share to be contributed to suppliers is specified ex-ante and
– in order to discourage high cost-low impact projects – is framed as a standard average lump
sum (maximum allowed costs), not as a full pass-through [34, 38-40]. For the cost recovery
there is a new tariff charge in the tariff of 3 Eurocent/kWh (100 Euro/ toe). The revenues are
collected in a fund and distributed by the regulator for gas and electricity this goes to a found
and then the authority distribute it to the distributors. Cost recovery is allowed for savings
projects only until an obliged party reaches its target: therefore a distributor cannot receive
cost recovery for measures if it sells or banks the associated certificates.
The French proposal stipulates rises in prices and tariffs to be limited to a maximum of 0.5 %.
In Flanders the savings obligation is incorporated in the electricity tariffs as a public service
obligation.
energy sales that did not occur due to the end-use energy efficiency efforts. We are indebted for these clarifications to Steven Schiller. Lost revenue recovery is not a feature of white certificate systems in Europe. 54 In addition cross-subsidisation in the energy sector is very difficult – even more so in the case of shifting the financial burden of a white certificate to a certain customer group. We are indebted for these comments to Ole Langniss and Stephanie Monjon.

58
Finally, while cost recovery aims to compensate suppliers for the investments in end-use
energy efficiency measures, there are also larger economic effects of overall energy demand
reduction caused by the application of a scheme with energy saving obligations: these are
related to possible price reduction for energy purchased at the wholesale markets by suppliers,
due to among other deferred and avoided investment in electricity generation plants and
network upgrades. For instance, in Australia the wholesale price reductions from savings
resulting from the introduction of a national energy efficiency target have been modelled
under different scenarios; the price impact comes with regard to reduction in a number of cost
components of the electricity market, such fuel costs, both fixed and variable operation and
maintenance costs, capital costs and transmission costs) [9] 55. The net present value of
national savings in electricity supply costs in Australia has been estimated to be between 2.2
and 5.2 million AUD depending on the size of the savings target and other assumptions [9].
Ideally these factors should also be considered when framing a cost recovery regime.
2.1.4. Institutional infrastructure and processes to support the scheme
A sound institutional structure is needed to support a complex policy mix such as a TCES
portfolio: it involves administrative bodies to manage the system as well as processes such as
verification, certification and market operation, transaction registry, detection and penalisation
of non-compliance.
Under the EEC in Great Britain the regulator OFGEM manages project evaluation and
approval, verifies savings and manages the data. In Italy the regulator AEEG implements the
scheme. The marketplace is organized and managed by the electricity market operator GME
according to rules and criteria approved by AEEG. GME issues and registers certificates upon
specific request by AEEG, organises market sessions, and register bilateral over-the-counter
contracts according to rules set by AEEG [34].
Two issues deserve special attention for their fundamental role in institutional infrastructure
of TCES schemes: baseline setting to measure the impact of projects and choice of
verification system.
55 We are indebted for this comment to David Young. Further details are available in [9].

59
2.1.4.1. Baselines and additionality
To determine the energy savings resulting from an energy efficiency activity, the eventual
energy consumption has to be compared to a baseline (reference situation) without additional
saving efforts. The choice of the reference scenario – in terms of reference consumption and
conditions – raises some challenges. These are related to issues such as determining the
relevant system boundary, minimizing the risk of producing leakage, the practicality and cost-
effectiveness of a baseline methodology, and treating no-regret measures in the baseline
determination56. This is a major difference with TGC schemes where effective electricity
production can be metered without any reference, even if only additional generation capacity
is allowed in the scheme for a limited amount of time, because at each additional supply it is
possible to add a meter and check the electricity production after a certain period (or during a
specified period).
Additionality is another issue to carefully consider. It refers to certification of genuine and
durable increases in the level of energy efficiency beyond what would have occurred in the
absence of the energy efficiency intervention, for instance only due to technical and market
development trends and policies in place. While in practice projects tend to have a mix of
public and private benefits, the cost of disaggregating these benefits and precisely accounting
for the exact share of no-regret measures in a larger action may be prohibitively high. One
way of overcoming this problem would be to place an objectively defined discount factor on
investments, which accounts for these private benefits. One possibility is to use minimum
efficiency requirements or current sale weighted average efficiency levels. Furthermore the
electricity price and the effects of the EU ETS and other policies in place (such as taxation or
standards), which inevitably affect the amount of energy efficiency measures taken, should
also be accounted for in the baseline to ensure genuine additional savings. Nevertheless it is
also widely acknowledged that many low- or no-cost energy efficiency measures do not occur
because of the presence of numerous barriers (for a discussion on barriers to energy efficiency
see, for example, [7, 55-59]).
In Great Britain a discount factor of 3.5 % over the lifetime of the measure is applied, while in
France the discount factor is 4 %. However both in the British and in the French schemes the
savings are cumulated over the time life of equipment, the discount factor refers to actualising
60
the annual savings: because different measures have different lifespans, account of this is
taken when the level of savings are attributed to a type of measure. Nevertheless in Great
Britain saving estimations take into account the likely proportion of the investment to be taken
up by improved comfort (‘comfort factors’ adjustment of carbon benefits, see earlier
discussion), as well as dead-weight factors to account for the effect of investments that would
be made anyway.
In Great Britain, the Department for Environment, Food and Rural Affairs (DEFRA) requires
suppliers to demonstrate clear additionality in each of the schemes they carry out – for
instance, schemes must go beyond building regulations or involve the installation of
appliances better than the market average. For accreditation purposes it is difficult to assess
what the business-as-usual level actually is, because this is dependent on the personal
judgement of individual consumers. However, there is a business-as-usual trend across the
economy and this is accounted for in the calculations to assess overall carbon saving from the
programme. Nevertheless concerns have been raised over additionality because of a situation
that energy suppliers can claim towards their EEC target the total energy savings that flow
from a partnership project regardless of the actual financial contribution made by the supplier.
This points to a characteristic feature of compliance routes in Great Britain, namely
negotiation of the rebate for energy efficient equipment between equipment
manufacturer/supplier and energy suppliers. Rather than energy suppliers paying to
equipment manufacturers/retailers/installers/consultants to provide the efficiency measure, it
is rather the efficient equipment or product manufacturers/retailers/installers/consultants
approaching energy suppliers to enquire how much they will receive for enlarging the market.
In Italy savings have to go over and above spontaneous market trends and/or legislative
requirements [38, 39]. The business-as-usual trend shall be adjusted with time: taking
replacement of refrigerators with more efficient models as an example, one may assume that if
in 2005 the reference trend in the economy is class A, in 2007 it should be A+ and in 2009
perhaps A++. Clearly the nature of the check differs for different project types: e.g.
installation of efficient equipment may be evaluated on the basis of difference with national
average installed or with what is offered in shops. For projects that are based on the deemed
savings and engineering verification approach (see below) there is a case-by-case additionality
56 We are indebted for these comments to Ole Langniss.
61
check performed by the regulator. The largest electricity distributor Enel Distribuzione (which
has about 85 % of the electricity target) has organised a big CFL give-away campaign (2
million CFLs) and is also covering a 10 % rebate on A class appliances. Similar to the British
situation, in this case Enel is entitled to all the 100 % savings resulting from the selling of the
A class appliance, which may pose some uncertainties about additionality57.
Nevertheless it is possible that an energy saving scheme would not have gone ahead without
support from obliged parties, regardless of the share of their financial contribution. As long as
the partnering organisation in such a scheme does not claim the same savings for any other
purpose, then the additionality concern is not an acute one.
2.1.4.2. Measurement and verification
Energy savings can be determined by metering or estimating energy consumption before and
comparing it to the consumption after the implementation of one or more energy efficiency
improvement measures adjusting for external factors such as occupancy levels, level of
production etc. In principle adjustments for energy consumption changes caused by
behavioural and life-style changes can be introduced too as well as changes in products that
deliver the same energy-services, e.g. information from internet instead of on paper. Taking
into account all these possible adjustments shows that energy savings in addition to being the
result of energy efficiency measures, can be caused by changes in behaviour and life-style and
the products/installations used – which may or may not mean changing the level of service
provided [60].
In general possible verification approaches are:
The Metering Approach – metering real electricity consumption and calculating
savings (could be with climate or weather corrections) based on consumption before
and after the energy-efficiency improvement is carried out, or
57 There are further concerns about windfall profit for distributors as the CFL give away may cost less that the cost recovery available (100 Euro/toe, see details later).

62
The Standard Savings Formula (deemed savings) Approach – using standard
formulas for energy-efficiency measures (e.g., a given number of CFLs installed in the
residential sector is equivalent to a given quantity of kWh saved).
Combination of the above, such as sampling of metering
In principle the metering approach is a more accurate guarantee of energy saved than the
standard factors approach (the latter cannot verify details such as location and operating hours
of installed CFLs), but in practice it can be difficult to identify the actual saving (e.g. in
households there is only one meter for all electricity usage which increases each year due to
growth in appliances and can fluctuate with changing household numbers, lifestyle, weather
etc.). It may be reasonable for large installations or projects, but may result in high monitoring
costs for projects of smaller size [38, 39]. One solution would be to use the metering approach
and to take into account the conditions prevailing in the facility, which would affect the
energy efficiency project. Before being granted a certificate, operators could be required to
describe the measures they are implementing and provide metered data before and after the
implementation, as well as any “standard” information and conditions (weather, activity, etc.)
needed to evaluate the measures (e.g. their load profile).
The Italian TCES scheme uses three valuation approaches: (a) a deemed savings approach
with default factors for free riding, delivery mechanism and persistence; (b) an engineering
approach, and (c) a third approach based on monitoring plans whereby energy savings are
inferred through the measurement of energy use; in the latter case all monitoring plans must
be submitted for pre-approval to the regulatory authority AEEG and must conform with pre-
determined criteria (e.g. sample size, criteria to choose the measurement technology, etc.) [38,
39]. In practice, most of the projects submitted to date have been of the deemed saving
variety. There is ex-post verification and certification of actual energy savings achieved on a
yearly basis58 [48 and references herein].
In Great Britain the savings of a project are calculated and set when a project is submitted
based on a standardized estimate taking into consideration the technology used, weighted for
fuel type and discounted over the lifetime of the measure. There is the option for energy
suppliers to monitor and demonstrate the savings retrospectively instead of ex-ante
58 E.g. in the case of CHP the plant operator has to prove that the plant has run a certain number of hours, etc.

63
assessment, but this option has never been used. There is limited ex-post verification of the
energy savings carried out by the Government although this work would not affect the way
energy savings are accredited in the current scheme; the monitoring work affects the energy
savings accredited in future schemes. The reason for this is that adjustments to the way
energy savings are calculated for target setting purposes and accreditation would have
implications for the costs for suppliers and consequently consumers. However, this work
could have implications for the way energy savings are accredited in future.
In the Flemish region of Belgium, grid operators submit to the Department of Natural
Resources and Energy of the Ministry of Flanders, plans for actions to be implemented in the
following year. These plans also include proposals for the calculation of energy savings.
Measures can refer to all fuels; the target is expressed in primary energy savings and
electricity savings are enhanced by a factor of 2.5. The Department then evaluates and
approves (or does not approve) the method for calculation of savings. Every year grid
operators are obliged to submit to the Flemish Regulator (VREG) an evaluation report about
the implementation of measures during the previous year [51]. In case of non-compliance the
regulator starts legal proceedings for collecting fines.
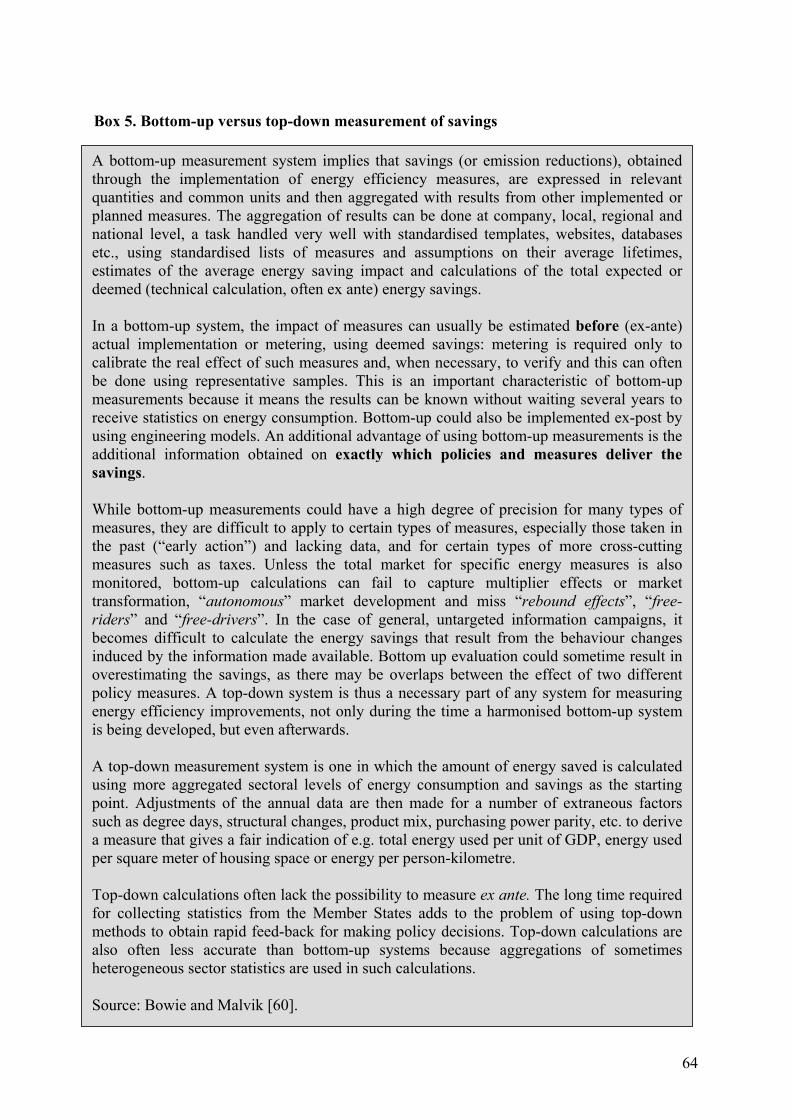
64
Box 5. Bottom-up versus top-down measurement of savings
A bottom-up measurement system implies that savings (or emission reductions), obtained through the implementation of energy efficiency measures, are expressed in relevant quantities and common units and then aggregated with results from other implemented or planned measures. The aggregation of results can be done at company, local, regional and national level, a task handled very well with standardised templates, websites, databases etc., using standardised lists of measures and assumptions on their average lifetimes, estimates of the average energy saving impact and calculations of the total expected or deemed (technical calculation, often ex ante) energy savings. In a bottom-up system, the impact of measures can usually be estimated before (ex-ante) actual implementation or metering, using deemed savings: metering is required only to calibrate the real effect of such measures and, when necessary, to verify and this can often be done using representative samples. This is an important characteristic of bottom-up measurements because it means the results can be known without waiting several years to receive statistics on energy consumption. Bottom-up could also be implemented ex-post by using engineering models. An additional advantage of using bottom-up measurements is the additional information obtained on exactly which policies and measures deliver the savings. While bottom-up measurements could have a high degree of precision for many types of measures, they are difficult to apply to certain types of measures, especially those taken in the past (“early action”) and lacking data, and for certain types of more cross-cutting measures such as taxes. Unless the total market for specific energy measures is also monitored, bottom-up calculations can fail to capture multiplier effects or market transformation, “autonomous” market development and miss “rebound effects”, “free-riders” and “free-drivers”. In the case of general, untargeted information campaigns, it becomes difficult to calculate the energy savings that result from the behaviour changes induced by the information made available. Bottom up evaluation could sometime result in overestimating the savings, as there may be overlaps between the effect of two different policy measures. A top-down system is thus a necessary part of any system for measuring energy efficiency improvements, not only during the time a harmonised bottom-up system is being developed, but even afterwards. A top-down measurement system is one in which the amount of energy saved is calculated using more aggregated sectoral levels of energy consumption and savings as the starting point. Adjustments of the annual data are then made for a number of extraneous factors such as degree days, structural changes, product mix, purchasing power parity, etc. to derive a measure that gives a fair indication of e.g. total energy used per unit of GDP, energy used per square meter of housing space or energy per person-kilometre. Top-down calculations often lack the possibility to measure ex ante. The long time required for collecting statistics from the Member States adds to the problem of using top-down methods to obtain rapid feed-back for making policy decisions. Top-down calculations are also often less accurate than bottom-up systems because aggregations of sometimes heterogeneous sector statistics are used in such calculations. Source: Bowie and Malvik [60].

65
Certificates can be issued either ex-post and thus they represent the energy saved over a
certain period of time, or they can be issued ex-ante and thus represent the estimation of the
energy to be saved over a certain period of time. With regard to ex-post certification there are
different options: the saved energy resulting from an energy efficiency measure could be
measured at the end of a predetermined period (e.g. after 1 year) or over the lifetime of the
project (which has to be accurately assessed). The energy efficiency certificate can be equal to
the energy saved over the period or the lifetime of the project, or could be issued when a
certain amount of energy savings has been achieved (e.g. 1 MWh). The latter option will
make the system more comparable to a TGC scheme – the certificate will have a unique time
of issue attached to it, will indicate the period over which and the location where energy has
been saved, and by whom it has been saved (initial owner of the certificate) – but will increase
validation efforts and verification costs. Alternatively, for projects that can be monitored
through a standard savings approach, certificates can be granted in advance of the actual
energy savings delivery to mitigate liquidity constraints of project implementers and allow
them to finance new projects. If with such ex-ante attribution of savings underperformance is
detected at the end of the lifetime of the measure, the underperforming project owner should
be asked to cover the shortage with certificates purchased on the spot market59.
There are a number of possible combinations of the roles of the various actors and depending
on the design of the scheme the role of the regulator may or may not include the issue of
certificates and verification of savings. For instance, third parties (such as ESCOs or providers
of a particular energy technology or service) may be licensed to evaluate and approve
projects, verify savings and issue certificates. The role of the regulator in this model would be
to accredit (issue the licenses to) third parties and audit their performance. This option has
elements of self-regulation – which inevitably carries with it a higher degree of risk for policy
makers. Nevertheless with the cost of compliance being one of the major issues raised about
the implementation of white certificate schemes, it can potentially reduces the overall cost. In
principle it is not so crucial which body issues the certificates provided that these are based on
verified data, which can come from the energy regulator (as is the case in Italy) or from a
certified verifier60.
59 This rationale has been applied with regards to green certificates in Italy. 60 We are indebted for this comment to David Young.
66
One of the frequently used protocols to verify energy savings is the International Performance
Measurement and Verification Protocol (IPMVP). It provides an overview of current best
practice techniques available for verifying results of energy efficiency projects in commercial
and industrial facilities. Energy efficiency measures covered in the protocol include fuel
saving measures, water efficiency measures, load shifting and energy reductions through
installation or retrofit of equipment, and/or modification of operating procedures. The general
framework of the IPMVP builds around four measurement and verification options. Those
options are:
1. Option A: Partially measured retrofit insulation. Savings are determined by partial
field measurement (some, but not all, parameters may be stipulated) of the energy use
of the system(s) to which an energy efficiency measure is applied, separate from the
energy use of the rest of the facility. Measurements may be either short term or
continuous. This option involves the insulation of the energy use of the
equipment/system affected by an energy efficiency measure from the rest of the
facility.
2. Option B: Retrofit insulation. The savings determination techniques of Option B are
identical to those of Option A except that no stipulations are allowed under B. Full
measurement is required. Savings are determined by field measurement of the energy
use of the systems to which the EEM is applied, separate from the energy use of the
rest of the facility. Short term or continuous measurements are taken throughout the
post-retrofit.
3. Option C: Whole building. Option C is often referred to as the Whole Building
approach; however, this option can be used for part of a building. It determines the
collective savings of all energy efficiency measures applied to that part of the facility
monitored by a single meter. Short-term or continuous measurements taken throughout
the post-retrofit period. Option C usually relies on continuous measurement of whole
facility energy use and electric demand for a specific time before retrofit (base-year)
and continuous measurement of the whole-facility energy use and demand, post-
installation. Measurements may be taken on a periodic basis if acceptable to all parties
involved.

67
4. Option D: Calibrated simulation. Savings are determined through computer-based
simulation of the energy use of components of the whole facility. Simulation routines
must be calibrated so they predict an energy use and demand pattern that reasonably
matches actual energy consumption. Caution is warranted, as this option typically
requires considerable skill in calibrated simulation and considerable data input; so the
process can be quite costly.
Figure 4 presents a scheme of actions related to measurement, verification and certification of
savings along the chain starting with project implementation and going to certified (and
tradable) savings.

68
Figure 4. Verification process: from projects to certificates
Certificates issued after verification*
Verification of energysavings
Measurement& flow of energy
savings
REGULATORY AUTHORITY
Obliged parties (distribution companies or supply companies, or large consumers)
Non-obliged parties allowed to get certificates for projects implemented (e.g. ESCOs, large consumers and/or
brokers)
FINAL CONSUMERS**
Projects implemented
Measurement & flow of energy savings
Projects
implemented
Verification of energy savings
* Note: Certificates can be issued by a body other than the energy regulator – for example by the market operator – on request of the regulator or another verifying body. **End users are get measures implemented at their premises. They are not doing measurement themselves, the arrows indicate that certain measurements need to be made at their premises to ensure sufficient data for verification and certification.

69
2.2. Certificates, trading rules and tools to stabilize the certificate market
It is important to separate the rules for the issue of the certificates (and the institutional
processes behind it represented in Figure 3) from the rules of the trading of the certificates. In
principle, trading is not a precondition for certification: certificates can be used to simply
verify compliance with targets or obligations beyond energy saving obligations. However
creation of a market and trading options is likely to deploy the full benefit deployment of this
policy instrument.
2.2.1. What is a certificate? Certificate delineation
The certificate is an instrument that provides a guarantee that savings have been achieved;
therefore it can be used for different energy policies, such as tax credits and fiscal incentives.
It is essential that each certificate is unique, traceable, and at any time has a single owner.
Certificates need to be a well-defined commodity that carries a property right over a certain
amount of additional savings and guarantees that the benefit of these savings has not been
accounted for elsewhere. Property rights61 must be clear and legally secured as it is unlikely
that trades will occur if either party is unsure of ownership [52]. Minimum project size may
be applied for certification of savings in order to reduce transaction costs and encourage
pooling of projects [34]. Ex-post adjustment of energy savings calculation for climatic
conditions, e.g. a very hot summer or a cold winter, and/or production levels is also needed.
Whether to certify genuine and durable increases in the level of energy efficiency beyond
technical and market development trends and beyond what will happen as a result of policies
in place (additionality) or energy savings (i.e. amount of conserved energy) in general is a
central issue. Thus, an important aspect is whether to include in the certificate saving
measures, which do not include energy efficiency improvements but rather behavioural
changes62.
61 According to Faure and Skogh effective property rights have to fulfill the following criteria: (1) the owner must be able to enjoy the benefits and influence the costs generated by the resource and the owner’s effort; (2) it must be possible to enforce rights and duties privately and/or publicly; and (3) the owner needs to be able to contract with other parties involved [61]. 62 For example, the user may decide to switch off equipment, decrease the set point (heating/cooling) or decrease the size of equipment (e.g. refrigerator). A contraction of business (e.g. an empty hotel) or a smaller production

70
Therefore, one of the overarching questions is whether it is improved efficiency or savings
that are to be certified. Savings can be achieved in three major ways:
• through investments in energy efficiency projects (which may not always result
in savings),
• through promoting behavioural changes, or
• through change in both exogenous and endogenous conditions (i.e. outside and
inside temperature, production levels, occupancy levels).
The size of a certificate also has important implication on the number of parties that can offer
certificates for sale (unless other restriction apply). In Italy certificates are expressed in
primary energy saved and the unit is 1 tep [40]. In France certification is allowed only above a
threshold of 3 GWh of savings over the lifetime of a project [43].
2.2.2. Trading rules
Figure 5 provides a simplified scheme of major movements related to the market transactions
of certified energy savings. Once a project is in place, unless otherwise specified (e.g. in case
of deemed savings approach) the implementing body should submit a measurement data, on
the basis of which the regulatory body will verify the savings of a project and issue
certificates corresponding to these. Certificates can be issued to obliged parties that implement
a project and also to other parties without obligations (that may be limited to certain actors to
reduce monitoring requirements). In case a market transaction takes place, then certificates
flow in the opposite direction of money – therefore resulting in an additional cash stream for
the implementing party. An exception to this statement is the case when obligations are
traded; this is possible under the EEC in Great Britain. Then the flow of money and the
obligation go in the same direction. The certificates are ultimately used to prove compliance
with the target.
output will results in energy savings. At the same time companies that are in a business expansion phase which will results in more consumption should not be penalised.

71
Figure 5. Summary of transactions
“Sell” savings to ESCOs e.g. via accounting them in the contract
Pay for measures through tariffs or in energy prices
Efficiency measures
Bilateral trade of certificates among obliged parties
Verify and issue certificatesVerify and issue certificates
Submit project M&V
Submit project M&V
Submit certificates to prove compliance
REGULATORY AUTHORITY
Obliged parties (distribution companies or supply companies, or large
consumers)
Non-obliged parties allowed to get certificates for projects
implemented (e.g. ESCOs, large consumers and/or brokers)
Market operator:register alltransactions
Money flow (bilateral contracts or spot market)
Flow of certificates (certified project credits)
Final users
Efficiency measures

72
Figure 6 summarises the transactions between actors in a TCES scheme. As can be seen
transactions can occur between obliged parties, or between obliged parties and non-obliged
parties that are allowed to receive certificates for projects implemented. Obliged parties can
implement projects directly at the end users’ premises, or can purchase certificates from
brokers or other intermediaries. Brokers and intermediaries may purchase and certified
savings (receivables) from project developers too (forfeiting).
The validity and any associated inter-temporal flexibility embodied by banking and borrowing
rules63, the rules for ownership transfer, the length of the compliance period and expectations
of market actors about policy stability and continuity will all influence the market for white
certificates.
A long certificate lifetime and banking increase the elasticity and flexibility of demand in the
long term. To mitigate the uncertainties about the achievement of the quantified policy target
within the pre-specified timeframe, banking for obliged parties may be allowed only once
they achieve their own targets. In Italy certificates are valid for up to five years, with a few
exceptions [34]. In Great Britain suppliers can carry over to EEC-2 all their excess savings
from measures implemented under EEC; this refers to measures rather than savings. In France
it has been proposed that the certificates’ validity is at least 10 years. Borrowing is
discouraged because it makes the attainment of a target uncertain and is against the ex-post
logic of the white certificate scheme as applied in Italy, for instance.
Rules defining trading parties are also important for market liquidity. Provided that
administrative and monitoring costs are not disproportionate, as many parties should be
allowed in the scheme as possible, since this enhances the prospects of diversity in marginal
abatement costs and lowers the risks of excessive market power [35]. Parties that may be
allowed to receive and sell certificates include obliged actors, exempt actors, ESCOs,
consumers, market intermediaries, NGOs, even manufacturers of appliances. A key benefit of
63 Banking or borrowing do not in any way modify the inherent value of the certificate, i.e. that a measured amount of energy has been saved, during a specific time, and in a specific location as a result of an energy efficiency action.

73
allowing many parties in the scheme is that new entrants may have the incentive to innovate
and deliver energy efficiency solutions, which have a lower marginal cost.
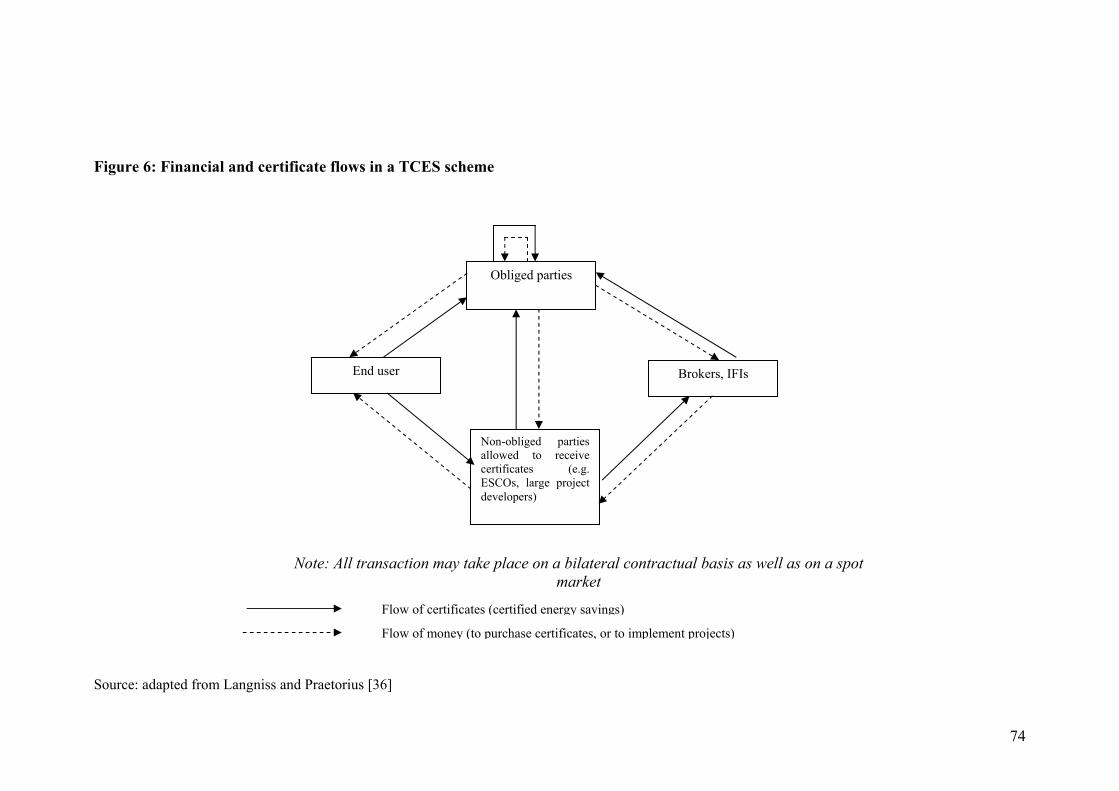
74
Figure 6: Financial and certificate flows in a TCES scheme Source: adapted from Langniss and Praetorius [36]
Obliged parties
Non-obliged parties allowed to receive certificates (e.g. ESCOs, large project developers)
Brokers, IFIs End user
Flow of certificates (certified energy savings)
Flow of money (to purchase certificates, or to implement projects)
Note: All transaction may take place on a bilateral contractual basis as well as on a spot market

75
In Italy certificates are issued by the electricity market operator upon request of the regulator
AEEG to all distributors and their controlled companies and to energy services companies.
Certificates are tradable via bilateral contracts or on a spot market organised and administered
according to rules set out jointly by AEEG and the electricity market operator. There are three
types of certificates – for electricity savings, for gas savings and for primary energy savings64;
they are fully fungible [40]. In France any economic actor can make savings actions and get
certificates as long as the savings are at least 3 GWh over the lifetime; other conditions
include that measures are additional relative to the usual activity of entities applying for
certification of savings and the minimum lifetime savings should come from similar actions.
Certificates are delivered after the programs are carried out but before the realisation of
energy savings [43]. The proposed French system attempts to deal with free riders by
allowing certification of project implemented by bodies, which do not have savings
obligation, but only after considering the impact of a project on their business turnover: If
impact on business turnover is identified, then for non-obliged actors certification of savings
is allowed only for innovative products and services. ‘Innovative’ product in this discourse
means that its efficiency is at least 20 % higher compared to standard equipment and its
market share is below 5 %.
In Great Britain there are no certificates in the strict sense of the word. The scheme covers
obliged parties and no other party can receive verified savings that can be used to demonstrate
compliance with the savings target: suppliers may trade among themselves either energy
savings from approved measures or obligations, with written agreement from the regulatory
office (Office for Electricity and Gas Markets, OFGEM). In Great Britain there has been little
interest in trading to date, which reflects mostly the fact that energy savings can only be
traded once the supplier’s own energy saving target has been achieved. In Great Britain
suppliers are also allowed to trade excess energy savings into the national emission trading
scheme as carbon savings [62]. However the linking of carbon savings to the national
emission trading scheme was never formalised and consequently no supplier could take
advantage of the possibility to traded carbon savings into the national emission trading
scheme. Suppliers have been allowed to carry savings over from EEC-1 to EEC-2 and this is
what all suppliers who exceeded their target have chosen to do.
64 Because the gas targets appear to be more demanding, one may expect that gas certificate price would be higher.

76
2.2.3. Penalties and certificate reserves
A primary concern of regulators is to reduce the price risk of high costs to society; this can be
achieved by imposing a price ceiling for compliance: either by setting a buy-out price or a
pre-defined penalty [35]. Pre-defined non-compliance penalties, minimum or maximum buy-
out prices and certificate reserves attained by the regulator are tools to mitigate price
volatilities. Recycling the revenue collected from penalties to overcomplying parties enforces
the effect of a penalty by increasing the opportunity costs of non-compliance. The use of these
price-mitigating instruments may compromise the achievement of targets.
In Italy the sanctions for non-compliance have to be “proportional and in any case greater than
investments needed to compensate the non-compliance” [34]. There are two types of non-
compliance: with the 50 % constraint for action concerning an actor’s own energy vector, and
with the general obligation. The proposal is that the unit value of each of the two penalties
equals the bigger value between a level to be defined at the end of the consultation process
and the average market price of the certificates in the previous year, multiplied by a factor
greater than one. The idea behind this is not to pre-define a potentially distortive reference
price for certificates; in practice this means that there is no ceiling of the unit cost of
certificates that will act as a cap of the overall cost of reaching the target [34]. In Great Britain
the regulator OFGEM has the power to consider whether it is appropriate to set a penalty for
non-compliance. However, there is no specific guidance on how this penalty would be
calculated. The revenue collected from penalty collection is not recycled, but accrues to the
government. In the planned French system a penalty of 0.02 Euro/kWh non-compliance is
envisaged. In Flanders the non-compliance penalty is 0.1 Euro/kWh and the fine cannot be
passed in the tariffs.
77
2.3. Summary of practical issues related to the implementation of white certificate-based schemes
A variety of issues have been raised by the TCES schemes already under way. Some of the
most important issues include setting the size and the unit of savings obligations, defining the
obliged parties and apportioning national savings targets into individual ones. While
discouraged by economic theory, limiting the scheme to certain sectors and to certain types of
measures, imposing specific requirements to meet the obligation and giving preferential
treatment of certain measures or end-use sectors are common practices in existing schemes.
The lifetime of measures, the redemption period, banking and borrowing of certificates, the
definition of parties that can acquire certificates and the design of non-compliance penalties
all have an impact on market liquidity and stability. Table 4 provides a comparative overview
of the major issues related to a policy scheme with savings obligations and possibly tradable
energy savings certificates. A final comment is the need for closer examination of interactions
between existing policy instruments. A more rigorous harmonisation of white certificates with
other existing support schemes may be needed to avoid duplications. For instance in Italy
CHP installations receive certificates only for their thermal energy output (but receive green
certificates for electricity output). Photovoltaic installations receive both white certificates and
feed in tariff. There have been some concerns raised over double counting possibilities – for
instance with regard to CHP plants – because the Italian scheme seems to not explicitly
exclude measures in on the premises of installations covered by the EU ETS.
Recently other EU Member States have announced their intention to introduce a TCES
scheme; among these are France – where preparations are in a very advanced stage with the
major parameters agreed – and the Netherlands. TCES schemes will attract more and more the
interest of national policy makers, as the proposed Directive on Energy End-Use Efficiency
and Energy Services mentions white certificates and leaves the option of the Commission to
later on recommend the introduction of this market approach. The proposal gives a clear
definition of white certificates as “certificates issued by independent certifying bodies
confirming the claims of market actors for savings of energy, as a consequence of energy end-
use efficiency measures”.
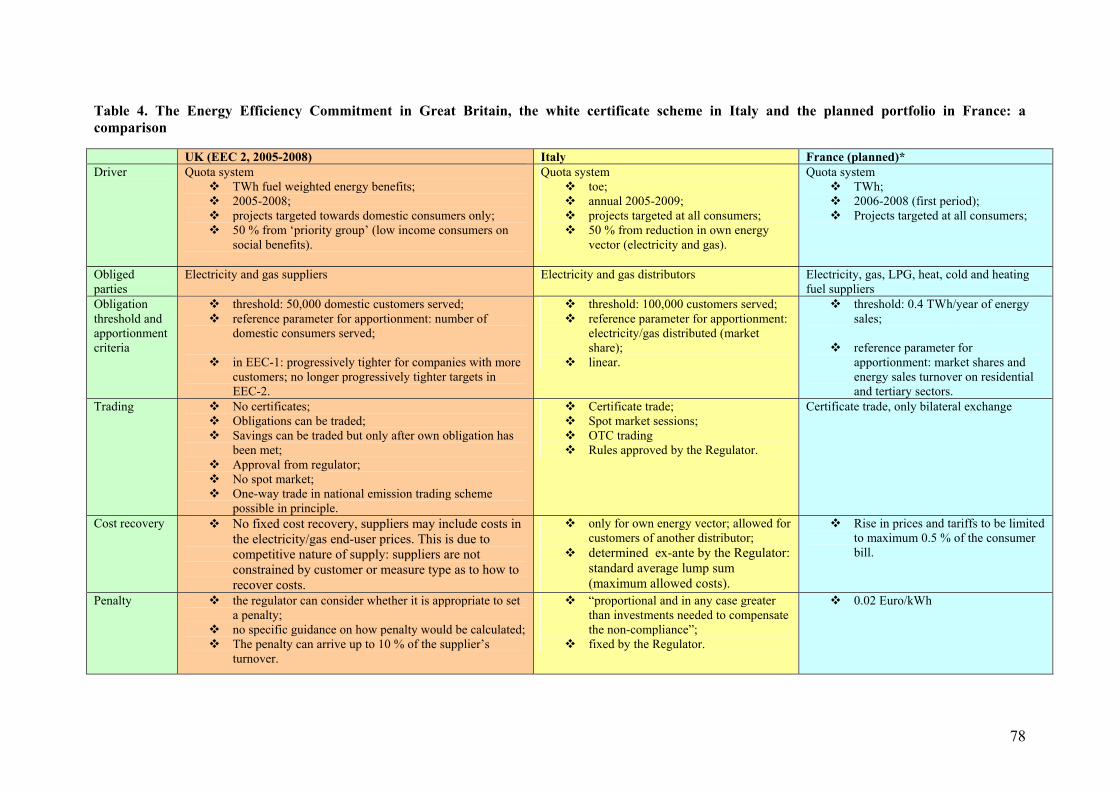
78
Table 4. The Energy Efficiency Commitment in Great Britain, the white certificate scheme in Italy and the planned portfolio in France: a comparison
UK (EEC 2, 2005-2008) Italy France (planned)* Driver Quota system
TWh fuel weighted energy benefits; 2005-2008; projects targeted towards domestic consumers only; 50 % from ‘priority group’ (low income consumers on
social benefits).
Quota system toe; annual 2005-2009; projects targeted at all consumers; 50 % from reduction in own energy
vector (electricity and gas).
Quota system TWh; 2006-2008 (first period); Projects targeted at all consumers;
Obliged parties
Electricity and gas suppliers Electricity and gas distributors Electricity, gas, LPG, heat, cold and heating fuel suppliers
Obligation threshold and apportionment criteria
threshold: 50,000 domestic customers served; reference parameter for apportionment: number of
domestic consumers served;
in EEC-1: progressively tighter for companies with more customers; no longer progressively tighter targets in EEC-2.
threshold: 100,000 customers served; reference parameter for apportionment:
electricity/gas distributed (market share);
linear.
threshold: 0.4 TWh/year of energy sales;
reference parameter for
apportionment: market shares and energy sales turnover on residential and tertiary sectors.
Trading No certificates; Obligations can be traded; Savings can be traded but only after own obligation has
been met; Approval from regulator; No spot market; One-way trade in national emission trading scheme
possible in principle.
Certificate trade; Spot market sessions; OTC trading Rules approved by the Regulator.
Certificate trade, only bilateral exchange
Cost recovery No fixed cost recovery, suppliers may include costs in the electricity/gas end-user prices. This is due to competitive nature of supply: suppliers are not constrained by customer or measure type as to how to recover costs.
only for own energy vector; allowed for customers of another distributor;
determined ex-ante by the Regulator: standard average lump sum (maximum allowed costs).
Rise in prices and tariffs to be limited to maximum 0.5 % of the consumer bill.
Penalty the regulator can consider whether it is appropriate to set a penalty;
no specific guidance on how penalty would be calculated; The penalty can arrive up to 10 % of the supplier’s
turnover.
“proportional and in any case greater than investments needed to compensate the non-compliance”;
fixed by the Regulator.
0.02 Euro/kWh
79
3. Comparative analysis
Below we provide a qualitative comparison of a TCES scheme with an energy tax and a
particular type of mandatory demand-side management (DSM) action (stand-alone savings
targets) on the following four policy aspects: certainty of outcome, cost effectiveness,
information requirements for establishment and implementation, and institutional costs. It is
interesting to compare these three instruments situated along the spectrum of command-and-
control (CAC) to incentive-based instruments: from a pure CAC (mandatory stand-alone
savings obligation), to a synthesis of CAC and market tool (savings obligation combined with
tradable certificates), to a pure economic instrument (energy tax). We have selected these four
policy aspects/criteria to provide a balance between theoretical insights (economic efficiency
and information requirements that draw the attention of researchers and analysts) on the one
hand, and implementation practicalities (certainty of outcome and institutional costs that are
the major concern of policy practitioners) on the other hand.
Traditionally DSM programs consist of the planning, implementing, and monitoring activities
undertaken by electric utilities to encourage consumers to reduce and/or modify their level
and pattern of electricity usage. Conventionally DSM has been linked to cost recovery.
Because in the past within vertically integrated utilities DSM has mostly been driven by load
management and deferral of investment in generation capacity, with electricity market
liberalisation traditional DSM becomes difficult to implement. This is why we chose to also
consider a modification of DSM, namely requiring distributors or suppliers to implement and
monitor activities to encourage consumers to increase the efficiency of their consumption by
imposing quantified savings targets on distributors or suppliers65
It should be again emphasized that the effectiveness of economic instruments, such as
tradable certificates and taxation, depends on the elasticities that operate on behaviour (in
relation to price, substitution, and income, see earlier discussion), on the strength of the signal
given (e.g. the level of the tax or the size of the target), and on the availability of substitution
or alternative actions [63].
65 Note that in the past many DSM programs did not have any quantified savings targets. In some cases the obligation merely referred to spending a certain amount of money on consumer-oriented actions, which money could then be reclaimed via a cost recovery mechanism.
80
3.1. Certainty of outcome
Assuming adequate enforcement and compliance, the mandatory target of a TCES scheme
keeps the advantage of certainty of outcome, while the certificate trading gives the flexibility
for cost effective compliance. Thus the market forces determine the allocation of activities,
but not the scale of action. Certainty of results to be achieved however can be undermined by
ambiguities in reference consumption and conditions, measurement and verification
procedures, and additionality issues: this uncertainty about baselines and additionality may
result in savings accounted for where they have not happened because of a particular project.
By contrast, traditional DSM programs may not necessarily include quantified mandatory
targets on energy savings and in general DSM becomes difficult to implement with
unbundling and retail competition in the energy sector.
Stand-alone targets also provide the advantage of certainty of outcome. A solution that may
soften the rigidity of stand-alone targets (see explanations later) by providing financial
sources to cover (in part or in full) the additional costs incurred by obliged parties is to
combine mandatory quantified savings target with taxation in the form of a public benefit
charge (PBC).
An energy tax is usually not linked to a savings target (though taxes may be based on
preparatory studies on expected responses of energy demand and various carbon related
energy taxes imposed in the 90s in various EU countries were actually based such economic
studies). While rates are often set according to the fiscal requirements, not according to a
valuation of externalities (Pigouvian taxation)66 or in line with a desired environmental target
(‘standard pricing’ approach)67, many energy taxes are intended to steer demand in a certain
direction (a cleaner alternative) and/or to simply diminish it while at the same time becoming
important sources of revenue (e.g. taxes on transport fuels). The revenue generation function
of taxation and the demand steering function may interfere: a successful tax policy aiming at
66 Due to the huge number of activities involved and persons affected, and difficulties in quantifying many important consequences, externalities are problematical to evaluate [64]. 67 Baumol and Oates [65] suggest setting a charge/tax to achieve specific pre-define standard/target rather than attempting to base the tax on the unknown value of marginal net benefits. Consequently the rate may need to be
81
energy savings will result in lower energy tax revenues than a policy aimed at safeguarding
public sector revenues68. Nevertheless it is not clear in advance what outcome the tax will
bring in terms of savings and it is also difficult to isolate the impact of the tax and to estimate
ex-post its effect on improved end-use efficiency.
To offset the uncertainties about marginal costs and benefits of compliance, Roberts and
Spence [66] propose a hybrid instrument that employs marketable permits supplemented by a
fee (fixed penalty) paid by obliged parties in case the cost of permits is very high and a
subsidy paid to obliged parties in case marginal costs of compliance and the price of
certificates appear to be lower than expected. The fee serves as an escape mechanism, while
the subsidy would incentivise overcompliance in case when setting the initial target
availability of cost-effective compliance opportunities has been underestimated. If cost of
compliance turns out to be too high, then the penalty will be paid and the target may be
missed. For a TCES a predefined penalty coupled with recycling of penalty revenues
produces similar effects; in this case if there is information available on the probable overall
undercompliance, then for overcomplying parties the size of the expected subsidy from
recycling of the penalty payment can be estimated.
3.2. Economic efficiency
The most straightforward mechanism to optimise energy efficiency in economic terms is to
fully internalise externalities in the price via a Pigouvian tax. Under a set of standard
assumptions about perfect markets, tradable certificates have the same economic efficiency as
taxes: essentially the two differ in the path towards efficiency. The way to equilibrium for a
tax is that a public agency – not the market – sets a charge that may cause excess demand or
supply [61]. One standard assumption in economics is that there are no costs involved in
carrying out market transactions. While this classical assumption has been criticised by many
(see some key work related to Transaction Cost Economics [67-70]), the present section pays
limited attention to transaction costs.
adjusted to generate an iterative path converging towards the pre-defined target. This procedure may turn out to be politically unacceptable. 68 We are indebted for this comment to Adriaan Perrels.

82
Mandating certain quantity of savings in a TCES scheme results in a positive price scarcity: a
price emerges for the certificates that represent savings as a commodity69. In theory by
allowing trading among participants the scheme provides a uniform cost signal – the
certificate trading price – to all participants and thus applies the equi-marginal principle for
cost-minimization [52]70. A TCES scheme also encourages market participants (ESCOs or
manufacturers) not covered by the savings quotas to invest in energy efficiency projects and
sell the associated certificates to the operators with quotas. However, in practice the
transaction costs – defined by Coase [68] in his seminal article on social costs as the costs
“[...] to discover who it is that one wishes to deal with, to inform people that one wishes to
deal and on what terms, to conduct negotiations leading up to a bargain, to draw up the
contract, to undertake the inspection needed to make sure that the terms of the contract are
being observed, and so on“ [68] – may be prohibitively high and prevent many market
transactions. In addition, while cost minimization is embedded, the exact cost of achieving the
pre-defined outcome of such a scheme is not known in advance. Furthermore in practice cost
minimization (static efficiency) depends on the liquidity of both the buyer and seller markets.
Under certainty about the relevant marginal cost of compliance and marginal benefit
functions, exactly the same result can be achieved by marketable permits and taxation: if the
regulator issues the optimal number of permits, then the price bid in the market will be
precisely the level of a Pigouvian tax [65]. With uncertainty about marginal cost and benefit
functions a tax will be preferred on welfare maximization grounds if the marginal control cost
curve (resp. marginal saving cost curve) is steeper than the marginal benefits curve; the
opposite is valid for marketable permits (for details and graphical presentation of this
statement see Baumol and Oates [65]).
An energy tax charges a price for pollution and also gives a uniform cost signal throughout
the economy, which theoretically results in demand reduction of the polluting activity. In this
comparison we do not include impacts of an energy tax through a redistribution of its
revenues to energy-saving activities. While often tax revenue either goes to the general state
budget and/or is used to lower distorting taxes on labour (the ‘double dividend’ discussion),
69 With energy saving certificate trading the nature of the commodity embodied in the certificate is in effect defined by the regulator in accordance with the relevant policy goal: it may be expressed for instance in primary energy or in carbon saved (see discussion earlier in this paper). 70 What the impact on non-participants would be is an issue that needs to be carefully analyzed.

83
notable examples of using energy tax revenue to finance energy efficiency include the UK,
Denmark and to certain extend Netherlands. Nevertheless in all these countries revenue from
energy taxes have been partially directed to lowering social security contributions for
businesses or personal income taxation for households [see 71]. As already stated, the price
elasticity of demand for energy is low, at least on the short term, and hence the impact of a
price increase due to energy taxation is expected to be limited. In addition earmarking of tax
revenues for energy efficiency purposes is not necessarily economically efficient. Common
practices in energy taxation such as tax differentiation and a large number of exemptions
made on social or political grounds undermine the cost efficiency by disregarding
opportunities for compliance at the same marginal cost [64].
Practical design features of both systems – a TCES scheme and a taxation regime – also bring
profound implications on efficiency. Current fiscal structures, alternative ways to recycle
taxes, the level and availability of information and asymmetry in relevant markets, the initial
allocation and possible free transfers (such as accounting for past years energy saving efforts
in energy certificate trading system) are among these design features71.
The mandatory savings targets with a PBC function in a way that is similar to the FIT system
for renewables support in the sense that it guarantees a price for a kWh saved. No matter
whether a savings target is part of such a DSM package, the regulator receives no information
regarding optimality over time. Obliged parties face different marginal costs of compliance
and in the absence of trading to allocate activities to where it is cheapest to undertake them,
cost effectiveness is precluded. Cost minimisation in achieving the overall target can be
achieved but only if different objectives are assigned to each obliged party in accordance with
its economic potential: however both the regulator and the obliged parties are likely to have
only incomplete information, which makes very difficult – if not impossible – the allocation
of differentiated individual targets that will equalise marginal costs of compliance [21].
3.3. Information requirements
In the real world, where information is limited, the benefit of trading is that it reallocates
certificates to their highest value without the need for central information about the shape of
84
the marginal net benefit curves [61]. However, significant information requirements are
involved in e.g. target apportionment72, and especially in baseline setting and additionality
criteria, choice of reference technology and conditions, ongoing M&V, and non-compliance
detection.
The key information requirement related to taxation is setting the tax rate: ideally it should be
equal to the marginal net damage produced by e.g. electricity generation. This method is
complicated by the absence of information on relevant elasticities [64]. The amount of
information required to set an optimal tax level of an externality-generating activity is
enormous, since the tax should not equal the marginal net damage it generates initially, but
the damage it would cause if the level of the activity had been adjusted to its optimal level
[65] 73. Similar difficulty is involved in the calculation of an optimal rate of a lump sum cost
recovery, which should be equal to the marginal net benefit of an activity.
Similar to a TCES scheme, DSM programs with energy savings targets involve significant
information requirements in target setting and apportionment, baseline setting, M&V, and
non-compliance detection.
3.4. Institutional costs
Institutional costs are often cited as the main disadvantage of MBIs. In a TCES scheme the
regulator has to monitor projects implemented, to design methodologies for verification of
savings prior to certification and, where applicable, administer the cost recovery of eligible
projects. Establishing these processes and costs to monitor, verify, register, certify, trade and
acquit certificates is likely to involve a significant amount of institutional effort, time and
costs especially at the early stage of designing and initiating the scheme. The administrative
costs for the regulator OFGEM for EEC have been estimated to be around 1 million British
pounds, whereas suppliers’ administration and development costs exceed 20 % of project
71 We are indebted for this comment to Adriaan Perrels. 72 In theory target apportionment should require calculation involving simultaneous relationships and extensive information on each obliged party marginal cost function [65]. In practice it is based on criteria such as number of consumers or kWh distributed. 73 It the UK there is a social cost of carbon, which makes it possible to set a carbon tax at this rate for the purpose of internalising the externality. However, for the reasons explained above, this would not result in the right amount of carbon saving activity. We are indebted for this comment to Dan Staniaszek.

85
costs [42]. As for costs to final consumer, it has been estimated that EEC-1’s cost was 6.5
Euro per customer per fuel annually [42]. As noted earlier in the discussion, a certain degree
of self-regulation may be possible in the implementation of the scheme to reduce the
involvement of the regulator in the evaluation and certification of individual projects.
Baseline setting and monitoring additionality deserve special attention because a TCES
system essentially represents a baseline-and-credit scheme, which leaves an incentive to
misreport on baselines and ensuing savings: for instance if future consumption is
overestimated by setting the baseline too high, reductions will be credited that have not
occurred (additionality problem). Both the investor and the host partner have an incentive to
exaggerate baselines: the former in order to receive more credits, the latter to receive more
money. On the other hand a TCES scheme relieves the regulator from monitoring of
effectiveness and comprehensive ex-post result evaluation since in a well-designed scheme
monitoring is embedded: based on the certificates issued one can monitor the progress
towards a pre-defined target.
A taxation regime involves less monitoring and the burden of this monitoring is likely not to
be imposed on the energy regulator, but on taxation authorities and the finance ministries. In
contrast to a TCES scheme, evaluation of performance is very difficult, also because the
effect of the tax is hard to isolate.
In any scheme that involves cost recovery there is a need to monitor closely and ensure that
suppliers do not get a recovery larger than their project investment, which also adds up to
informational requirements and institutional costs. While one may argue that an energy tax
system can potentially be more fair from a societal point of view because it would generate
revenue to the state, which then can be re-distributed in a more adequate manner. However
there is no assurance that tax revenue is recycled to energy efficiency and even less that this is
done in a rational manner.
While institutional costs deserve closer attention, there has been hardly any comprehensive
and systematic attempt to list and quantify the parameters affecting institutional costs, and to
conduct a comprehensive analysis and comparison of institutional costs of different policy
tools [72]. A notable exception is Great Britain, where administration and monitoring costs of
EEC have been estimated to be below 2 % of total expenditure of energy suppliers and there

86
has been a decrease since earlier programs [73]. Institutional costs are generally a function of
the simplicity of the system; factors influencing the administrative burden include the number
of regulated sources, the availability of the necessary data, and the level of reporting and
monitoring needed.
3.5. Comparative analysis: summary
Table 5 attempts to summarise the discussion and to scale the instruments discussed in this
section. We refrain from weighing the comparison criteria, because the value attached to these
criteria will differ in different policy contexts.
Table 5. Summary of comparative assessment of three market-based instruments from the perspective of their effectiveness to promote energy efficiency74
Instrument\ Comparison criteria
TCES
Energy tax
Mandatory savings targets
Certainty of outcome Potentially very high2
☺
Very low to medium3
Very high ☺
Economic efficiency of bringing energy savings1
Potentially very high
☺
Potentially very high
☺
Low
Information requirements Very high
Low to very high
depending on design 4
?
Low to very high depending on program design and incentives
(penalties) with success (failure)5
? Institutional costs Very high
Low ☺
High
Notes: 1. Here we refer to the classical notion of economic efficiency, which assumes perfect markets and disregards transaction costs 2. Due to the mandatory nature of the target. 3. Depending on the sector and the size of the tax. 4. In case the regulator pursues optimal tax rate 5. If the regulator pursues cost recovery rate equal to the marginal net benefit of an activity
As can be seen, a TCES scheme has the potential to foster energy efficiency in liberalised
energy markets, delivering pre-defined amount of energy savings. As with many complex
87
policy tools the devil is in the details and the comparative efficiency, effectiveness and costs
of a TCES scheme all depend on the parameter setting. For instance, the size of the target and
the degree to which it is demanding vis-à-vis existing economic potential for energy savings,
the possibility for a wide-range of non-obliged parties to generate certified savings, the size of
the certificate and the possibility for banking all have very strong implications on the
comparative efficiency of the scheme. In addition there is a certain trade-off between certainty
cost efficiency and administrative complexity of the scheme: for instance a scheme that
allows savings from any energy or usage and with any size would certainly harness savings
from a wider range of possibilities, which by providing a wider range of very cost efficient
solutions is expected to reduce costs of compliance for obliged parties, but at the same time
makes the scheme extremely hard to administer with numerous projects, including ones of
small size. Finally the certainty of outcome of a TCES scheme is implicitly defined by the
quantitative target but dependent upon adequate enforcement and compliance, unambiguously
defined reference consumption and conditions, measurement and verification procedures, and
additionality issues. In terms of certainty of outcome a TCES scheme has the advantage of
imbedded evaluation of compliance.
Nevertheless one should consider that policy instruments in general and market-based ones in
particular are rarely implemented in the real world in their textbook form. Due to lack of track
record with TCES the above argumentation does not draw a clear line between theory and
practice and is based on the theoretical features of this policy instrument. Nevertheless the
authors acknowledge that a certain degree of divergence can be expected between theoretical
claims and real-world markets introduced via policy intervention, which may add to the
complexities inherent to the implementation of market-based policy.
74 We are indebted for the idea to compose this table to Diana Ürge-Vorsatz.

88

89
4. Integration of market-based instruments in the energy sector
White and green certificates and emission trading are three MBIs that can be and already have
been introduced in the energy sector in parallel (e.g. Italy and Great Britain). This section
looks at the possibility and desirability from an environmental and economic point of view of
integrating these three MBIs and at the additional challenges involved in this.
Projects that generate additional energy savings and green electricity result in CO2 emission
reductions, and these reductions can be calculated (even in a more sophisticated way than
national or, say, EU averages)75 and the respective carbon displacement value (carbon offset)
could be included in a certificate. It should be noted that the carbon value of energy savings
and RES projects varies in accordance with factors such as the local electricity mix and the
time of the day when energy is saved or green electricity is generated.
4.1. Why integration?
Energy savings projects and energy efficiency investments are often very cost effective (for
instance, see [4]). Therefore integrating energy efficiency in the EU Emission Trading System
(ETS) would from a theoretical point of view bring the benefits of improved static efficiency
of the latter; conversely, excluding energy efficiency may increase the overall compliance
costs because due to exclusion of measures in sectors outside the scope of the ETS – which
sectors may offer a wide range of carbon mitigation options coming from cost efficient energy
savings measures on the demand side – more expensive options on the supply side may be
taken up to attain the target [3]76.
The core of tradable emission permit systems is lowest marginal compliance costs and in
general markets are neutral towards the direction of technological change77. Hence, provided
75 Note that here we refer to energy efficiency and RE projects that are not covered by emission trading, i.e. not directly undertaken by operators under CO2 emission cap. 76 We assume that power generators will not invest in end-use energy saving programs to fulfil their carbon caps, see reasoning below. 77 On the one hand emission trading is expected to only evoke innovations when these bring extra rent to the obliged parties. On the other hand one may consider that by creating competition between abatement options,

90
that the objective of carbon abatement goes beyond cost effectiveness for obliged parties,
some other support mechanisms for technology innovation are needed: in the case of
renewable energy integrating renewable energy projects in EU ETS will improve the dynamic
efficiency of the latter [11 and references herein]. Integrating end-use energy efficiency in
emission trading improves the environmental equity of the latter: if white certificates and
emission trading are not linked, then the benefit of reduced emissions due to lower electricity
consumption remains within the ETS obliged parties (power generators), which would receive
credit for an effort that they may not have been involved in. While in principle a power
generator can assist end-users in saving energy and thus free allowances, in practice this
scenario is more likely to function in a vertically integrated utility: the energy industry
restructuring has made end-use energy efficiency rather disconnected from power generation.
Therefore in case of a TCES scheme covering end use electricity and aiming at achieving CO2
effects, allocation set for power producers under EU ETS has to be adjusted according to the
expected reduction in electricity consumption. This idea – and the challenges associated with
its implementation – is elaborated in section 4.4.2. It should be noted at this point that
integrating white certificates coming from end-use electricity savings in the present direct
emission scheme in the EU is a very complicated matter because the conversion of white
certificates into emission allowances puts the threat of double counting: electricity savings are
already accounted by the power generators within EU ETS, which produce less CO2
emissions at their ‘pipe’. This complication to integrating end-use energy efficiency within
emission trading does not hold for non-electricity end-use savings in the sectors outside the
EU ETS: for instance measures related to replacing an existing old boiler in a building with a
more efficient one or building insulation. Given the large share of space heating in energy
consumption and carbon emissions, this is an important opportunity to investigate.
Box 6 presents the details of the New South Wales Greenhouse Gas Abatement scheme: this
is a credit-based carbon system that has an explicit demand-side energy efficiency element
rather than carving out a protected share of the “abatement market”, carbon trading may produce more innovation than alternative instruments that are not technology blind.

91
Box 6. New South Wales Greenhouse Gas Abatement scheme: a case of a case of credit-based carbon trading scheme with a demand-side energy efficiency element
The white certificates scheme in New South Wales (Australia) is a part of a larger scheme: the NSW Greenhouse Gas Abatement Scheme. The scheme introduced in 2003 requires electricity retailers and certain other parties to meet mandatory targets for reducing the emission of GHG from the production of the electricity they supply or use. The Government has set a state-wide benchmark of reducing GHG emissions to 7.27 tonnes of carbon dioxide equivalent per capita by 2007; the 7.27 tCO
2e benchmark level will then be maintained until at least 2012.The
Independent Pricing and Regulatory Tribunal (IPART) administers the scheme.
The environmental credits applicable to the NSW GHG Abatement Scheme are called New South Wales Greenhouse Abatement Certificates (NGACs) and are surrendered by benchmark participants to offset their excess emissions above the level of their GHG benchmark One NGAC represents the abatement of one tonne of CO2e associated with the consumption of electricity in New South Wales. NGACs can be created through:
- low-emission generation of electricity;
- through activities that result in reduced consumption of electricity (“demand side abatement”);
- through the capture of carbon from the atmosphere in forests (“carbon sequestration”);
- through industrial activities that reduce on-site GHG emissions not directly related to electricity consumption.
Therefore energy savings are just one way to create NGACs and represent just one component of the NSW GHG Abatement Scheme. There is a non-compliance penalty of AUD 10.50 per tonne of emissions above the targets.
Five main classes of demand-side oriented projects are allowed in the NSW scheme:
(a) energy efficiency projects that modify existing energy consuming equipment, processes or systems, or which modify the usage of Installations;
(b) energy efficiency projects that replace existing Installations, with other Installations;
(c) energy efficiency projects that install new installations that consume less electricity than other installations of the same type;
(d) fuel switching projects; and
(e) on-site electricity generation that replaces supply from the National Electricity Market.
Four methods for calculating the emissions reductions from such activities are possible: project impact assessment method, metered baseline method, default abatement factors method, and generation emissions method. Third parties can also create NGACs: for example, an energy management firm that undertakes an energy efficiency project can offer a discount to the owner of the site in return for the owner nominating the energy management. Sources: Crossley [27] and New South Wales Government [28]

92
Some practical considerations for integrating a white certificate market with emission trading
or with a market for TGC include the establishment of one homogenous good, the increase of
compliance options, the boost of liquidity of the carbon market and bringing market stability.
Under the EU ETS78 a few barriers exist to the uptake of end-use energy efficiency measures
and RES deployment; integrating white and green certificates in the carbon market may
address these barriers and other issues as described in the sections to follow [3]. First, as the
EU ETS covers direct emissions only, it does not account for reduced industrial electricity
consumption and therefore if an industrial user reduces its on-site electricity consumption, he
does not receive carbon benefit for this, unless electricity is generated onsite. While this is a
general distributional issue of carbon abatement choices under a cap-and-trade regime, one
may still consider the need of EU ETS providing a possibility for sending a stronger signal to
industrial electricity efficiency79. Second, coverage of direct emissions only may give
negative incentives for new industrial cogeneration in company under CO2 cap and encourage
the extension of lifetime of old inefficient boilers: an operator under the EU ETS replaces a
boiler with a CHP plant (thus increasing the on site emissions) may not have any economic
incentive to do so, unless the electricity price increases significantly due to the ETS80. Third,
there may be a shift from thermal to electricity: in the case that electricity price does not vary
due to the ETS a way to reduce on-site CO2 emissions for a plant without on-site generation
is to change thermal process with electricity processes, this may result in overall higher CO2
emission in the country.
It should be however emphasised once more that the arguments above hold provided that the
objective of a cap-and-trade carbon system is wider than cost effectiveness of compliance for
obliged parties and covers societal issues. If this is not the case and the primary purpose of a
cap-and-trade carbon system is cost effectiveness for obliged parties to retain their carbon
caps – as is the case by and large with EU ETS – then other channels and not carbon markets
may be more appropriate for policy support to be effectively directed towards energy
efficiency. However if a GHG cap-and-trade regime is taken from a broader societal
perspective, then an intervention to bring more energy efficiency measures and renewable
78 We recognize that there is a profound difference between emission trading as defined in UNFCCC and the EU ETS and the latter is much more limited. Here we describe the practical concerns related to EU ETS. 79 Nevertheless as industrial consumers, especially large ones, are more sensitive to rising fuel and electricity prices reducing electricity consumption brings benefits not strictly related to carbon constraints 80 This argument refers to a replacement case and not the new entrants one (additional plant).

93
energy sources may be desirable even if such an intervention increases the overall costs of
compliance.
4.2. Integrating white certificates with green certificates
It is possible to combine domestic TGC and TCES in a single common scheme, where both
RES and energy efficiency and savings measures contribute to meeting a specific obligation
like reduction of fossil fuel consumption. Energy savings may contribute to meeting an
overall RES target by reducing overall consumption. In effect Directive 2001/77/EC on the
promotion of electricity produced from renewable energy sources in the internal electricity
market encourages such integration by establishing the RES-E target as a share of final
consumption. The key common characteristic of green and white certificates is that both
allow for the separation of the physical flow of electricity from, respectively, the “greenness”
of electricity and energy savings. The same rationale in principle holds for integrating
renewable heat and end-use energy efficiency81. From a cost effectiveness perspective,
integration of supply and demand options should result in the lowest cost for society.
Conversely applying different instruments to different parts of the sector increases the risk of
undertaking high-cost measures in one part, while ignoring lower cost options in another.
Purely operational matters, like registries, can be managed in an integrated way. Double
counting can be avoided by using a database and again in the principle of redemption.
Nonetheless there may be a long way to make an integrated system work: either in terms of an
integrated energy efficiency and renewables quota, or an integration of green and white
certificates in the EU ETS. Because cost minimisation is an inherent feature of trading a
‘combined’ quota for renewables and energy savings may bring a ‘rush’ for low cost savings
options, which may divert attention from investments into more costly alternatives such as
renewables. There are possibilities to mitigate this effect by introducing a multiplier (for
instance two green certificates equal one white certificate), but in this way the establishment
of exact “exchange rate” may bring a lot of controversy. Some list arguments against a
combined energy efficiency and green energy quota taking as a starting point that even though
81 Currently there are no green heat certification schemes. Therefore TGC and TCES schemes are asymmetric in the sense that the former at present apply to renewable electricity only, whereas the latter in principle can be applied to all fuels, energy carriers and sectors (although it may be decided to limit white certificate schemes to electricity and gas only, as is in Italy).

94
both end-use energy efficiency and renewables share the common characteristic of reducing
the dependence on fossil fuels and thus the economic, environmental and political benefits of
reduced reliance on these fuels, efficiency is a demand side resource and renewables are a
supply side resource. They have different sets of costs, benefits, timing, and regulatory issues
and may be better treated in parallel policies rather than in an undifferentiated mix82. This
argument is correct in case an isolated approach is taken to support efficiency at the supply
and at the demand side in a disconnected manner. However there is a need for coherency in
sustainable energy policy: while it is beneficial to have more RES-E generation, it is dubious
whether RES-E generation should be made an aim of its own and disconnected from the
overarching aim to have a sustainable energy system. Therefore directing massive investment
towards sustainable energy generation while at the same time inefficiency at the final point of
consumption may be a strategy of limited total impact handling in an isolated manner only
one part of the energy system. For this reason an integrated approach of brining together and
optimising generation and consumption needs should be explored: renewables and end-use
energy efficiency are the two building blocks of such a comprehensive strategy to cover the
entire energy chain: from production to obtaining useful service from the energy delivered at
the point of final consumption.
In Italy there is a certain degree of integration of renewables in the TCES: solar heaters and
small photovoltaic installations are eligible for white certificates. The Australian TGC scheme
certifies solar water heaters based on the electricity consumption they displace. Therefore,
integration is not only a technical issue, but a matter of policy choice.
4.3. Integrating white and green certificates in emission trading
Projects that deploy additional energy savings and green electricity result in CO2 emission
reductions; the precise calculation of the exact amount of carbon displaced is a technically
solvable issue though no doubt it brings additional complexity in a trading system. In the NOx
set-asides in the United States there are software programs that calculate the real time power
generation displaced by savings taking into account factors such as time of the day and exact
generation mix [74]. This section looks at the arguments for and against integration.
82 We are indebted for this comment to Steven Schiller.

95
Analysis of the arguments in favour of integration
The rationale for considering integration of white and green certificates in emission trading is
based on a few theoretical arguments. First, from a cost effectiveness perspective, integration
of supply and demand compliance options should result in the lowest cost for society.
Conversely applying different instruments to different parts of the sector increases the risk of
undertaking high-cost carbon mitigation measures in one part, while ignoring lower cost
options in another part of, for instance, the energy chain, which is not covered the carbon cap
(e.g. household fuel use). Energy savings projects and energy efficiency investments are often
very cost effective but the existence of a wide range of barriers to energy efficiency, including
market failures, prevent their deployment.
Therefore, white certificates can bring more – and possibly more cost efficient – carbon
reductions from sectors currently not covered by the EU ETS. Energy savings can
technically be converted into carbon savings without a burdensome procedure, and could in
principle be treated in a way similar to CERs resulting from CDMs83. The concern of double
counting, especially with regard to electricity savings, deserves special attention. If an
electricity saving measure is taking place inside the EU, then a straightforward conversion of
the electricity savings into CO2 saving and “import” into the carbon market would result in
the same amount of CO2 accounted for twice – electricity savings also reduces the emissions
of the power generator. For this reason currently the Linking Directive in principle forbids
project credits (JI and CDM) when they lead directly or indirectly to emission reductions in
installations covered by the EU ETS. Different and much less complicated is the case of
savings in natural gas or heating oil: for instance a residential or tertiary building
insulation project (in a building heated by a gas or oil boiler) brings genuine and additional
to EU ETS carbon reduction that are otherwise not covered by the EU ETS and that can be
accounted for via a white certificate and converted into an emission allowance, which can in
principle be used in the EU ETS.
Second and related to the previous point , the issues of environmental equity and fairness will
be addressed: integration of certificate systems in carbon markets would make it possible to
credit the party that has actually undertaken measures that have directly resulted in carbon
96
savings. Under the EU ETS as it stands at present generators will receive the carbon credit
from somebody else’s efforts. Giving carbon allowances to the party directly responsible for
energy savings – and thus carbon saving – has implications to the overall carbon cap (see
discussion later in the report).
Third, in the case of the domestic projects coming from emissions not covered by the
carbon cap in the EU ETS, such as household fuel use, the ability to do domestic projects
that generate credits will act as a “safety valve” for buyers in an ETS scheme by not limiting
the source of allowances only to those with a surplus under their allocations [36]84. As
suggested above, double counting can be avoided if white and green certificates (project
credits) are submitted to the governmental body of the respective country (e.g. the one in
charge of the registry) that will have to subsequently exchange it for allowances in the case
the carbon cap is to be preserved intact (energy saving project credits are equal to the same
amount of emission allowances redeemed) or will account for them for the purpose of
offsetting the surplus emissions of the obliged party if the cap is exceeded. In case of
redeeming those parties under the carbon cap will be affected, which have indirectly benefited
from emission reductions: e.g. power generators in case of electricity savings. Purely
operational matters, like registries, can be managed in an integrated way (nevertheless
separate registries will be required). However, linking requires robust tracking and data
management across markets and will increase the administrative complexity.
Finally, if projects are eligible for different kinds of certificates, investors will feel more
confident that there will be some way for them to obtain additional revenues from the sale of
these and hedge against a wider range of prices on different markets. As long as there is a
common register indicating when a certificate is sold or redeemed and barring the certificate
and the energy saving or the green electricity behind a particular project from other
certification programs, then projects are also credible against double-counting critics.
In a situation where white and green certificates are not integrated in the carbon market, only
the energy value from a green electricity project or energy savings project is certified via
83 For CDMs it is possible to have end-use energy efficiency projects (e.g. a CFLs project in China), and this could enter the EU ETS through the linking Directive. 84 One should take into account the effects of cheaper project credits on innovation in the system covered by the emission trading: an abundance of cost efficient (cheaper) project credits may overshadow more expensive but

97
green or white certificates. In this case, energy efficiency and green energy projects are not
converted in CO2 and cannot enter the emission trading regime. A possible consequence of
imposing energy saving quotas without linking the schemes and letting carbon credits and
white certificates compete for energy efficiency projects may be that some cheap carbon
mitigation options on the demand side are ignored, which may limit the scope of CO2
abatement options85. Furthermore, the creation of parallel markets may impose higher
transaction costs and/or sub-optimal market sizes.
There will be interaction on prices of carbon allowances and white certificates regardless of
whether certain degree of integration of white certificates in emission trading is pursued or
not. The most obvious impact is that the parallel co-existence of the EU ETS and white
certificate program is likely to reduce the carbon allowance price (see [13] for more details).
The nature of the interactions of the EU ETS, green and white certificates in relation to effects
on the electricity markets strictly have been analysed elsewhere [13] and will therefore not be
discussed in the present report.
Analysis of the arguments against integration
Despite arguments in favour outlined above integration must be approached with caution for a
number of reasons. First, one needs to carefully assess whether in seeking to preserve the
delivery benefits and specific policy objectives of individual MBIs, an integrated scheme may
becomes too complex in administrative and technical terms and therefore hard to manage and
vulnerable to misreporting and other flaws: if there is a significant risk of additional
complexity introduced, then three (relatively) simple schemes might deliver better than one
more complex integrated scheme. Second, it is again emphasised that a white certificate
scheme is additional and complementary to other existing policy instruments (such as
appliance standards, building codes, labelling) and should not be used as an ‘excuse’ to
weaken the implementation of these. Nevertheless the introduction of a white certificate
system may weaken the implementation and the rationale behind policy tools such as energy
also innovative mitigation technologies, which may potentially bring spillover benefits in the sector and stimulate a change in technology and use patterns. We are indebted for this comment to Mary Jean Burer. 85 This will depend on the prices across certificate and allowance markets. Market mechanisms may correct such a ’migration’. The counter-argument for this concern is that if allowance prices are high enough, this will stimulate innovation and significant change in covered sectors, or start to change industrial behaviour significantly because there fewer options.

98
taxation and subsidies for energy efficiency measures86. In addition it is not clear whether an
integrated scheme can co-exist with CHP set-aside quotas used by some governments in the
framework of the EU ETS. Third , as outlined earlier, energy efficiency and renewables serve
multiple goals, including security of supply and energy import reduction, employment
creation and regional cohesion, poverty alleviation, and technological innovation and
diffusion, which from a societal perspective may be equally important – if not more important
in some contexts – than climate change mitigation. Therefore society might not be indifferent
to the choice of implementing specific mitigation options because of high value of these co-
benefits of renewables and energy efficiency87. Therefore it might be inherently difficult to
find a commonly agreed value so as to link the carbon, renewable energy and energy
efficiency systems whose goals and objectives significantly differ. In addition if – in line
with economic text book arguments – cost effectiveness is the sole motivation of a carbon
cap-and-trade scheme, pricing co-benefits of energy efficiency or renewables in the scheme
may be undesirable for increasing its complexity and compliance costs.
Fourth, savings certification is challenging with respect to measuring and verifying savings.
Some specific double counting challenges emerge in relation with project types that have
multiple values: e.g. how to treat a project, such as CHP on biomass that may receive
emission allowances, and may turn out to be eligible for both green and white certificates. It
should however be pointed in this context that this issue has been solved for instance with the
approval of methodologies for energy efficiency projects in the framework of CDM88.
Last but not least, both carbon trading and white certificate systems have just commenced and
it may therefore be advisable to leave them develop separately till more practical experience
is accumulated. Furthermore the white certificate schemes, where they exist to date, differ in
regard to fundamental design features, such as obliged parties, covered sectors and measures
and unit of the target, which may further exacerbate the challenges of allowing in a common
European carbon trading system white certificates that account for different values in different
countries.
86 More robust analysis will be provided in the framework of the EuroWhiteCert project supported by the European Commission (www.eurowhitecert.org) 87 The costs of renewables in terms of GHG mitigation are for most options much higher than for other GHG mitigation options and thus integration of green certificate systems in emission trading without a set-aside quota would significantly reduce the market for renewable technologies.
99
All these reasons along with double counting challenges make integration appear undesirable
with regard to end-use electricity savings. Integrating white certificates coming from non-
electricity end-use energy saving measures in the sectors outside the EU ETS however
deserves more attention for it holds opportunities for increasing the scope and outreach of
emission trading in Europe.
4.4. Emission trading, white and green certificates: implementation
possibilities
The total value of certificates (both white and green) may be viewed as composed of two
separate items: an energy benefit and a carbon benefit. The energy value is limited to a certain
country or region and hence purely domestic and unsuitable for trade in an international
carbon scheme; conversely the benefits from carbon mitigation are global, i.e. internationally
valid89. We believe there are three major routes to establish links between certificate and
carbon permit markets – by making tradable commodities one and two-way fungible and by
establishing a set-aside quota for energy efficiency and renewable projects. Below we
demonstrate that while the first two establish links between the markets, they do not really
integrate them. In contrast set-aside quotas allow real integration of white and green
certificates in carbon markets.
4.4.1. Integration options: one- and two-way fungibility
One-way fungibility refers to a situation whereby green and white certificates may be used to
comply with emission caps and in effect will be allowed to enter the carbon markets; in
contrast carbon credits cannot be used to meet green electricity or energy saving targets.
Separate carbon and energy values are assigned to energy savings and RES projects that are
not covered by emission trading. The three possible routes of one-way fungibility are [3, 14]:
88 Smaller projects might rather be carried out as programmes as is the case in energy efficiency programmes. 89 Oikonomou [48] points this out about TGC. The difficulty here, as noted by Sorrell [11], is that with EU ETS in place the CO2 value of renewables and energy efficiency has been partly reflected in the allowances ‘freed up’ by displaced fossil fuel emissions.
100
If both the energy and the carbon value of a project are utilized, then the carbon value
(the value of carbon displaced by the projects) is accounted for in the emission trading
scheme, while the energy benefit goes to green/white certification schemes.
If either energy or carbon value is utilized90, there are two possibilities. First, if only
the carbon value is utilized, then the carbon value of a project (the value of carbon
displaced by the projects) is accounted for in the emission trading system, but the
energy value is not accounted for in a green/white certification scheme. This
corresponds to a situation where green or white certificate systems are not in place.
Second, if only the energy value of a project is utilized, then energy value is accounted
for in a green/white certification scheme, but no carbon value is accounted for. This
corresponds to a situation of no integration between certificate and permit markets.
If both energy and carbon values are utilized but only a portion of carbon benefit, then
the energy value of a project is accounted for in a green/white certification scheme,
while the carbon value is accounted for in the emission trading system but only for a
portion of the energy value over and above the energy-related obligation (i.e. once the
green electricity or savings obligation is met). This is in general possible in the EEC in
Great Britain, whereby savings can be one-way traded in the national emission trading
scheme.
In any of the implementation routes of one-way fungibility where the energy and carbon
values of a project are distinguished, at least some component of white and green certificates
can be traded in the emission trading system.
In direct competition of energy savings and RES project credits against other carbon saving
options in a cap-and-trade regime not many energy savings and RES project credits are
expected to enter the carbon markets: for renewables this is because they have higher
marginal abatement costs than other carbon mitigation options and so far the allowance prices
in EU ETS has been lower than estimates show as necessary to foster strategic fuel switch to
renewables, and in general MBIs are indifferent towards the direction of technological
change. While energy saving projects are a low-cost carbon mitigation option, there is a risk
that not many end-use energy efficiency projects will enter the ETS because energy efficiency
is ‘invisible’ (businesses may not recognize it as an energy source, as a business opportunity
90 The project developers’ choice of which value to account for will depend on the relative prices across markets. The other benefits of energy efficiency and renewables will be ignored
101
and as a way to improve competitiveness and comfort) and power generators obliged under
the EU ETS are more likely to take measures on the supply side where their area of expertise
is. In this sense an indicative gradation of their preferences would be to first improve the
efficiency of plants (rehabilitation and/or fuel switch), then to install renewable generation
capacity, and only last to look beyond the consumer’s meter. Therefore carbon trading as
currently applied in the EU ETS cannot be considered as a tool to encourage end-use energy
efficiency: EU ETS has not been designed to promote energy efficiency measures or any
other technology and the rationale behind it is cost minimisation of compliance for obliged
parties.
With regard to the overall carbon cap in principle two scenarios are possible: keeping the
initial carbon cap intact after allowing project-based green or white certificates to enter the
carbon market, or allowing the cap to be exceeded under certain conditions. In the former case
an equal number of carbon permits will need to be withdrawn from the allocation of the
obliged party, in relation to whose emissions energy savings - and therefore carbon - have
taken place. Because this is likely to introduce some extra complexity in the system, in the
latter case the obliged party will be allowed to exceed its carbon cap with an amount of
emissions, which can be precisely offset with project-based energy saving credits generated
by sectors outside the trading scheme and reducing their own emissions. Because energy
savings have a precisely measurable carbon content, this will have no implications in terms of
environmental soundness as long as the surplus emissions can be covered by white and green
certificates denominated in carbon. The two cases are illustrated in Figure 7.
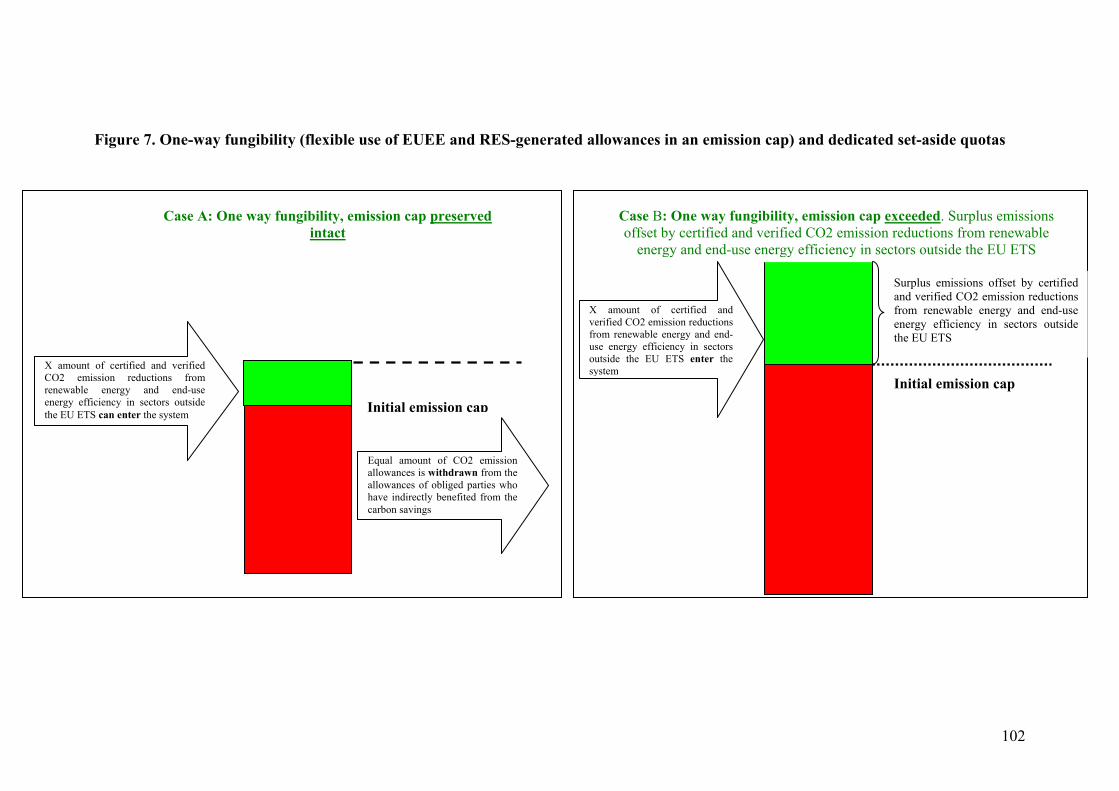
102
Figure 7. One-way fungibility (flexible use of EUEE and RES-generated allowances in an emission cap) and dedicated set-aside quotas
Case B: One way fungibility, emission cap exceeded. Surplus emissions offset by certified and verified CO2 emission reductions from renewable
energy and end-use energy efficiency in sectors outside the EU ETS
X amount of certified and verified CO2 emission reductions from renewable energy and end-use energy efficiency in sectors outside the EU ETS enter the system
Initial emission cap
Surplus emissions offset by certified and verified CO2 emission reductions from renewable energy and end-use energy efficiency in sectors outside the EU ETS
X amount of certified and verified CO2 emission reductions from renewable energy and end-use energy efficiency in sectors outside the EU ETS can enter the system
Equal amount of CO2 emission allowances is withdrawn from the allowances of obliged parties who have indirectly benefited from the carbon savings
Case A: One way fungibility, emission cap preserved intact
Initial emission cap

103
There may also be two-way (full) fungibility among the three schemes, whereby green and
white certificates can be used to show compliance with the carbon target and also carbon
credits can be used to show compliance with green electricity or savings targets. However,
two-way fungibility may compromise the environmental soundness especially of certificate
systems: while green electricity and EUEE have a carbon component/value, not all carbon
projects have an energy component.
4.4.2. Set-aside quotas for renewable energy and energy savings projects in emission
trading
One-way fungibility with both energy and carbon values utilized in effect it creates three
separate markets – there will probably be profound influences across markets, but no real
linkage. An alternative can be to seek integration of energy savings- and renewable energy-
based project credits (i.e. green and white certificates) with ETS via a dedicated link.
A possible approach to integration via a dedicated link is through a set-aside quota in the
ETS. A set-aside is a pool of allowances that are kept by the program administrator and used
to reward energy savings and renewable energy projects; this will influence the market
towards more such projects. Energy efficiency or renewables set-aside quotas have been
developed and introduced by 6 states in the NOx Allowance Trading Program in the USA
[74]. Set-aside quotas could avoid possible problems arising from additional allowances
generated by energy savings and renewable energy projects, as this are reserved ex-ante and
therefore there is no need for ex-post adjustments of allowances.
In effect a set-aside can function in different ways. One arrangement would be to impose on
each entity under the EU ETS a total cap and deduct a fraction of this allowance cap
‘reserving’ it for emission reductions accounted for via energy efficiency and green electricity
project credits (dedicated set-aside within a cap). Therefore energy efficiency and green
electricity projects would be converted into emission allowances that can be sold on the
carbon market. Parties with emissions caps will have the possibility to create or purchase
these ‘special’ allowances if they wish to fully utilise their initial emission cap. A variation of
this arrangement is to mandate the exact share of the set-aside quota, thus creating a portfolio
104
standard in the ETS and making end-use energy efficiency and renewable electricity generate
‘tagged’ emission allowances. This latter case is illustrated in Figure 8.
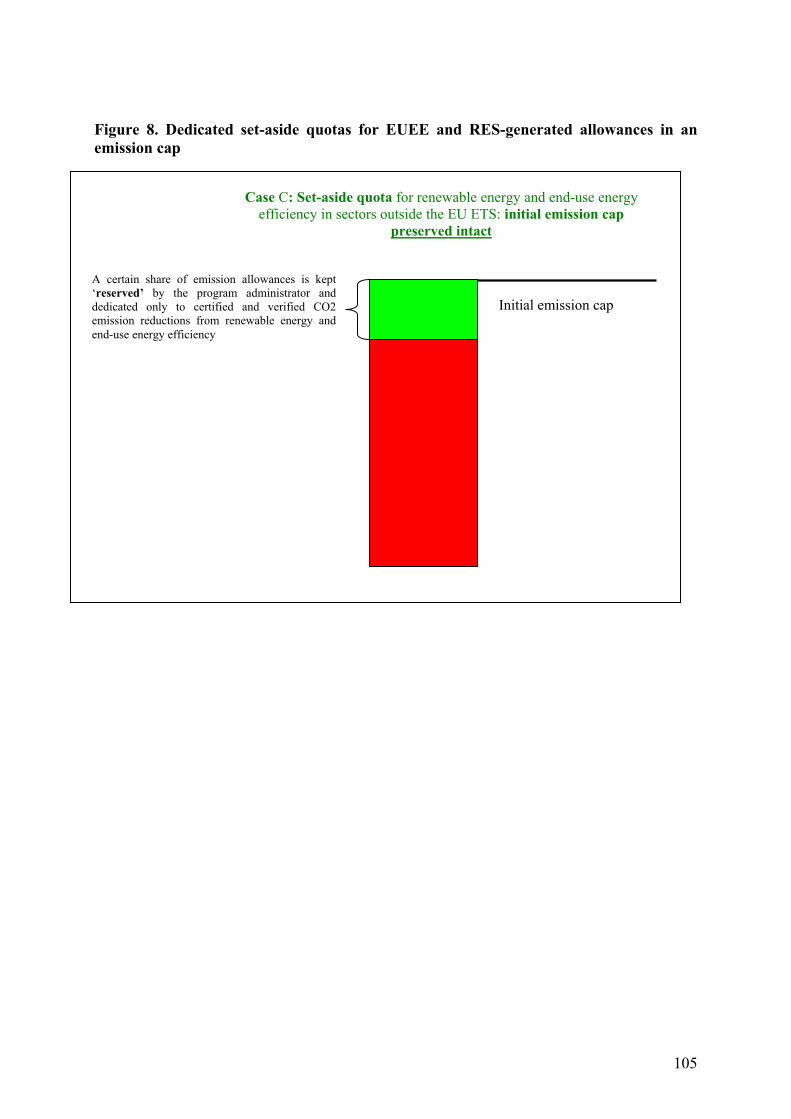
105
Figure 8. Dedicated set-aside quotas for EUEE and RES-generated allowances in an emission cap
Case C: Set-aside quota for renewable energy and end-use energy efficiency in sectors outside the EU ETS: initial emission cap
preserved intact
Initial emission cap
A certain share of emission allowances is kept ‘reserved’ by the program administrator and dedicated only to certified and verified CO2 emission reductions from renewable energy and end-use energy efficiency
106
Another option in calibrating a set-aside is to allow obliged parties to exceed their emission
caps provided that they submit sufficient green and/or white certificates to cover these surplus
emissions. Therefore the program administrator may sell allowances generated via energy
efficiency and renewable energy projects to carbon emitters who need to buy allowances. This
option will not compromise the environmental integrity of the emission cap because
renewable and energy savings projects have a carbon component. As this functions in a way
similar to straightforward one-way fungibility, in practice carving a special additional share
for green or white certificates is not necessary.
Set-asides can also take different shapes: above we have described “offset” type of set-asides
that allow participants outside of formal emissions markets to participate by allowing certain
types of activities to be recognized for the emissions reductions these projects provide.
Energy efficiency and RES facilities generate emissions offsets that regulated utilities can
purchase to meet their targets.
Despite arguments in favour, the desirability and design features of set-aside quotas should
be carefully considered in order to not increase the complexity of the overall system and the
inherent transaction costs. Arguments against carving on the carbon market a share for energy
savings and renewable energy is that by establishing more than one homogenous commodity
on the market, there is a certain risk of compromising its liquidity and pushing more
expensive options thus increasing the overall cost for obliged parties of meeting the carbon
cap. This statement holds where all non-carbon benefits of energy saving and renewable
energy measures are disregarded. Another related and rather fundamental point argument
against set asides is that energy saving, in contrast to GHG emission reduction, has genuinely
national or local benefits (such as security of supply, job creation, social burden reduction and
fuel poverty alleviation, regional cohesion), these elements get lost in a cross-border scheme,
even more so if merged with emission trading. A more technical observation is that currently
existing white certificate schemes are not only very different in terms of implementation
characteristics, but also introduced in deeply different policy contexts; this may necessitate a
better harmonisation of energy and tax policies across countries to avoid inadvertent effects of
linking national schemes and integrating then in emission trading.
In general there still little attention by the carbon market for energy savings projects. This is
due mainly to difficulties to measure and certify energy savings. White certificates scheme

107
will contribute to standardise energy savings measurement and to build confidence in the
market on the accuracy, persistency and reliability of the savings. For examples, companies
willing to offset CO2 emissions could buy certified energy savings with the equivalent carbon
credits from energy efficiency projects implemented by other operators (e.g. a CFL campaign,
a street lighting projects, a motor project). This could well be a new financial source for
energy efficiency projects. The next question is whether this certified CO2 emission reduction
linked to the energy efficiency project could also have some interest for ETS to justify less
allowances in the system, this is similar to the introduction of CDM credits which are
converted into allowances.
In conclusion the integration of MBI and trading regime is technically complicated and
undesirable at the current very young stage of all three markets (carbon, green electricity and
energy savings). While the precise and certified CO2 emission reduction from energy
efficiency projects may potentially have a great value and be an option in the carbon market
in particular with regard to measures in sectors currently outside the EU ETS (heating fuel
use in residential and tertiary sector, transport), these benefits could be by far outweighed by
the complexity of integration in practice. Integration inevitably involves some serious issues
to be solved to avoid undermining the environmental soundness of the emission regime and
failure to implement in practice solutions for instance to avoid double counting and crediting
can seriously undermine the soundness of the whole system. While set-aside quotas may
seem an appealing way of stimulating more investment in energy efficiency and renewables,
the rationale of emission markets is to be neutral towards technologies and focus on least-cost
compliance, which may make set-aside quotas hard to implement for being perceived as yet
another governmental intervention.

108

109
5. Conclusions
This report has provided an analysis of the possible role that tradable certificates for energy
savings can play in the sustainable energy policy space. The report provides an overview and
in-depth analysis of the experiences to date with MBIs in the energy sector. It describes the
concept, the main elements and the overarching issues related to the establishment of a system
with tradable certificates for energy savings bringing examples from the implementation in
Italy and Great Britain, from the currently designed French scheme and from the obligations
in place in Flanders. The report also presents a brief qualitative comparison of the TCES
scheme with other policy tools that aim to improve the efficiency of energy consumption and
foster energy savings: one of those instruments (mandatory DSM) from a command-and-
control and the other (energy taxation) a pure economic instrument type.
One of the most commonly cited benefit of certificate trading – minimization of costs of
compliance – depends on the size and liquidity of the market, which in turn are related to
issues such as stringency of the target and market power. Moreover, there is a certain trade-off
between liquidity (e.g. allowing non-obliged parties to acquire and sell certificates) and
manageability and transaction costs of the scheme. As the latter may be very high, a simple
obligation to achieve energy savings for electricity and gas distributors may be a better way to
deliver the desired outcome. However, this comparison rather serves to open and focus future
research, pointing at the need for more rigorous quantitative analysis of the costs and benefits
of applying different policy tools to deliver energy savings and of the general macroeconomic
effects of different policy tools. The discussion shows that the existing schemes are very
different with regard to obliged actors, fuel coverage, eligible sectors and measures. Under
such background, a harmonised European white certificate scheme is hard to imagine. The
potential advantages (such as cost minimisation and savings pursued where most
economically rational to implement) of such a harmonised trans-European scheme need to be
weighted against potential drawbacks. Potential drawbacks include consumers in countries
with longer traditions in energy efficiency ending up paying for efficiency improvements
made at the premises of consumers in other countries, reduced innovation spillover benefits or
concentrated reductions in important carbon intensive sectors. Lastly, at least initially a
diversity of national schemes and design option may be very useful for the learning process.

110
Finally, the report outlines the possible benefits, challenges and solutions related to
integrating white certificates with other existing domestic and international permit and
certificate schemes. The presently existing TCES schemes are not integrated with emissions
trading or other presently operating or planned schemes involving certificate trading in the
energy field91. Such integration requires careful consideration because it can bring multiple
benefits, but at the same time raises a plethora of new challenges. The benefits of integration
with the EU ETS highlighted in the report include the streamlining of the already
overcrowded energy policy space and therefore increased market transparency; improved
static and dynamic efficiency; increased market liquidity; and enhanced environmental
integrity of the emission trading scheme. The report establishes a few options for integration,
and presents in more detail set-aside quotas for renewable energy and energy savings projects
in emission trading. More work is needed to systematically explore the feasibility of this
option in Europe, and its costs and benefits in a comparative context. The report also
considers the integration of white and green certificates as a feasible vehicle to allow energy
savings to contribute to meeting an overall RES target by reducing the overall consumption.
However considering the early stage of developments and experiences with MBIs for CO2
emission reduction, energy savings and renewable energy sources, it is very complex to
integrate the three schemes, and the additional complexity may outweigh the benefits. Finally,
at present only non-electricity end-use savings from sectors outside the EU ETS can be
considered for integration.
A scheme with savings obligations and tradable certificates for energy savings could deliver
energy savings in a cost-effective manner in perfect markets for electricity and gas. Some key
issues to carefully consider when designing a scheme like this include the setting of the size
of the target, determining the obliged parties, the verification rules, the trading rules, and the
under- or non-compliance regime. Monitoring and verification and associated procedures of
baseline setting, defining additionality and taking into account the free rider problem are the
key operational procedures and should be given great consideration as the precursors of
success or failure of a scheme.
A final remark is that a TCES scheme can only function in a fully unbundled energy sector;
where this is not the case and there are corporate interests of selling more energy and tariff
91 As of November 2005.

111
regulation that fosters the drive to sell more kWh, the proper functioning of the scheme may
be hindered [48]. While in Italy the scheme introduces an entirely new role to distributors and
hence may at least initially face some hostility, in Great Britain there has been over 11 years
experience of energy supplier obligations.

112

113
Reference list 1. ACEEE, Energy Efficiency Savings Standards Around the U.S. and the World. 2005,
Amercian Council for Energy Efficient Economy: Washington.
2. Wang, Y.-D., J. Byrne, W.-J. Chung, A. Zhou, J. Kulkarni, H. Yamaguchi, and K. Takahashi, Potential of the Clean Development Mechanism on Residential Energy Efficiency Upgrades in Developing Countries: A Regional Perspective on the Case of Selected Asian Countries. In: Proceedings of the Third Conference on Energy Efficiency in Domestic Appliances and Lighting (EEDAL), Turin: JRC and Softech., 2003: p. 1273-1289.
3. Bertoldi, P., S. Rezessy, and M.J. Bürer. Will emission trading promote end-use energy efficiency and renewable energy projects? In: Summer study on efficiency in industry of the American Council for Energy Efficient Economy. 2005. New York.
4. European Commission, Green Paper on Energy Efficiency. Doing more with less. COM(2005) 265 final of 22 June 2005. 2005, European Commission, DG TREN: Brussels.
5. Jeeninga, H., C. Weber, I. Mäenpää, F. Rivero García, V. Wiltshire, and J. Wade, Employment Impacts of Energy Conservation Schemes in the Residential Sector. Calculation of direct and indirect employment effects using a dedicated input/output simulation approach. 1999, ECN: Petten.
6. European Commission, Proposal for a Directive of the European Parliament and of the Council on energy end-use efficiency and energy services. COM(2003) 739 final, 2003/0300 (COD). 2003, European Commission: Brussels.
7. Wuppertal Institute, et al., Completing the market for least-cost services. Strengthening energy efficiency in changing European electricity and gas markets. 2000, Wuppertal Institute for Climate, Environment, Energy. A study under the SAVE Program.: Wuppertal.
8. Pagliano, L., P. Alari, W. Irrek, U. Leprich, G. Ruggieri, and S. Thomas. Price regulation to remove EE-DSM disincentives and pressure for increased sales in monopoly segments of restructured electricity and gas markets. The Multiple Drivers Target (MTD) tariff scheme. In: European Council for Energy Efficient Economy (ECEEE) summer study. 2001. Mandeleau: Stockholm: ECEEE.
9. McLennan Magasanik Associates Pty Ltd, National Energy Efficiency Target. A report for the Sustainable Energy Authority Victoria. 2004, MMA: Melbourne.
10. Limbrick, A. Planning for an Energy and Technology Revolution. In: BEAMA Centenary Conference. 2005.
11. Sorrell, S., Who owns the carbon? Interactions between the EU Emissions Trading Scheme and the UK Renewables Obligation and Energy Efficiency Commitment. In: Energy and Environment, 2003. 14(5): p. 677-703.
12. Varró, L. Economics of open markets. In: ERRA summer school. 2004. Budapest: ERRA.
13. NERA Economic Consulting, Interactions of the EU ETS with Green and White Certificate schemes. 2005, Report prepared for Directorate General Environment of the European Commission.

114
14. Bertoldi, P., S. Rezessy, O. Langniss, and M. Voogt. White, green & brown certificates: how to make the most of them? In: Summer study of the European Council for Energy Efficient Economy. 2005. Mandelieu: ECEEE.
15. de Lovinfosse, I. and F. Varone, Renewable electricity policies in Europe: patterns of change in the liberalised market. Working Paper nr. 1. 2001, UCL Université Catholique de Louvain: Louvain.
16. Lauber, V., REFIT and RPS: options for a harmonised Community framework. In: Energy policy, 2004. 32(12): p. 1405-1414.
17. ECN, Renewable Energy Policy homepage. Country fact sheets. 2003, ECN.
18. PHARE Twinning project, Green electricity - Documents. Preliminary comments/suggestions provided by the short-term experts. WP 2: green electricity. 2003, Energia Közpönt: Budapest.
19. Menanteau, P., D. Finon, and M.-L. Lamy. Prices versus quantities : choosing policies for promoting the development of renewable energy. In: ENER Forum 3. 2002. Budapest: ENER.
20. Ürge-Vorsatz, D., S. Rezessy, and A. Antypas, Renewable electricity support schemes in Central Europe: A Case Of Incomplete Policy Transfer. In: Energy and Environment, 2004. 15(4): p. 699-721.
21. Menanteau, P., D. Finon, and M.-L. Lamy, Prices versus quantities: choosing policies for promoting the development of renewable energy. In: Energy policy, 2003. 31: p. 799-812.
22. Haas, H., et al. Summary of the 3rd ENER Forum: how to promote renewable energy systems successfully and effectively. In: ENER Forum 3. Successfully Promoting Renewable Energy Sources in Europe. 2002. Budapest: ENER.
23. Haas, R. and P. Biermayr, The rebound effect for space heating: empirical evidence from Austria. In: Energy policy, 2000. 28(6-7): p. 403-410.
24. Milne, G. and B. Boardman, Making cold homes warmer: the effect of energy efficiency improvements in low-income households. In: Energy policy, 2000. 28(6-7): p. 411-424.
25. Bentzen, J., Estimating the rebound effect in US manufacturing energy consumption. In: Energy Economics, 2004. 26: p. 123-134.
26. Schipper, L. and M. Grubb, On the rebound? Feedback between energy intensities and energy uses in IEA countries. In: Energy Policy, 2000(28): p. 367-388.
27. Binswanger, M., Technological progress and sustainable development: what about the rebound effect? In: Ecological Economics, 2001. 36: p. 119-132.
28. Oikonomou, V. and M. Patel, White Certificates. Phase II of the White and Green project. 2004, Utrecht University, Copernicus Institute: Utrecht.
29. Geller, H. and S. Atalli, The experience with energy efficiency policies and programs in IEA countries. Learning from the Critics. 2005, IEA: Paris.
30. Meli, L. Energy efficiency: the European manufacturers’ achievements in year 2004. In: Energy Efficiency potential in buildings, barriers and ways to finance projects in New Member States and Candidate Countries. 2005. Tallinn.
115
31. Schipper, L., On the Rebound: The Interaction of Energy Efficiency, Energy Use and Economic Activity. In: Energy policy, 2000. 28(6-7).
32. Bertoldi, P. and S. Rezessy. Tradable certificates for energy efficiency: the dawn of a new trend in energy policy? In: American Council for Energy Efficient Economy (ACEEE) summer study on energy efficiency in buildings. 2004. Asilomar, Ca.: ACEEE.
33. Bertoldi, P. and T. Huld, Tradable certificates for renewable electricity and renewable savings. In: Energy policy, 2004. article in press.
34. Pavan, M. What's up in Italy? Market liberalization, tariff regulation and incentives to promote energy efficiency in end-use sectors. In: American Council for Energy Efficient Economy (ACEEE) summer study. 2002. Asilomar, Ca.: ACEEE.
35. Pavan, M. Expectation from Italy: suggestions to focus the project proposal. In: Workshop on organising a task on white certificates under the IEA-DSM Implementing agreement. 2003. Milan: CESI.
36. Langniss, O. and B. Praetorius. How much market do market-based instruments create? An analysis for the case of “white” certificates. In: European Council for Energy Efficient Economy (ECEEE) summer study. 2003. Saint Raphael, France: Stockholm: ECEEE.
37. Politechnico di Milano, Final report of SAVE project „DSM pilot actions, DSM bidding and removal of DSM disincentives in restructured electricity markets". 2000. p. Cited in: Pagliano et al. 2001.
38. Pavan, M. The Italian White Certificates System: Measurement and Verification Protocols. In: EU and ECEEE expert seminar on Measurement and Verification in the European Commission's Proposal for a Directive on Energy Efficiency and Energy Services. 2004. Brussels.
39. Pavan, M. Italian Energy Efficiency Obligation and White Certificates: Measurement and Evaluation. In: European Parliament Workshop on Case studies of Current European Schemes for the Measurement and Verification of Energy Efficiency Improvements. 2005. Brussels.
40. Pavan, M., Italian Energy Efficiency Obligation and White Certificates: Measurement and Evaluation, in RECS open seminar. 2005, 23 September 2005: Copenhagen.
41. Pavan, M. White Certificates can foster ESCO development. In: ESCOs in Europe conference, 6-8 October 2005. 2005. Vienna.
42. Mansero, S., Energy efficiency commitment. An example from the UK, in RECs open seminar. 2005, RECS International: Copenhagen.
43. Baudry, P. and S. Monjon, The French Energy Law and white certificates system. 2005, RECS open seminar, 25 September 2005: Copenhagen.
44. Lees, E. Summary of Workshop. In: Bottom–up Measurement and Verification of Energy Efficiency Improvements: National and Regional Examples. 2005. Brussels: DG TREN, European Parliament, ECEEE.
45. Boot, P. White certificates in the Netherlands. In: Seminar White Certificates in the Netherlands. 2005. Ecofys, Utrecht.

116
46. Crossley, D. The white certificates scheme in New South Wales, Australia. In: IEA Demand Side Management Programme, Task 14 Workshop on White Certificate, 14 April 2005. 2005. Paris.
47. New South Wales Government, New South Wales Greenhouse Gas Abaterment Scheme. 2005: Materials available at http://www.greenhousegas.nsw.gov.au/.
48. Oikonomou, V., M. Patel, L. Mundaca, T. Johansson, and U. Farinelli, A qualitative analysis of white, green certificates and EU CO2 allowances. Phase II of the White and Green project. 2004, Utrecht University, Copernicus Institute: Utrecht.
49. Quirion, P. Distributional impacts of energy-efficiency certificates vs. taxes and standards. In: Summer study of the European Council for Energy Efficient Economy. 2005. Mandelieu: ECEEE.
50. Lees, E., How increased activity on energy efficiency lowers the cost of energy efficiency. 2005, RECS seminar: Copenhagen.
51. Collys, A. The Flanders (BE) regional utility obligation. In: Bottom–up Measurement and Verification of Energy Efficiency Improvements: National and Regional Examples. 2005. Brussels.
52. Jaccard, M. and Y. Mao, Making Markets Work Better, in Energy for sustainable development. A policy agenda, J. Goldemberg, Editor. 2002, UNDP: New York. p. 41-76.
53. Boemare, C. and P. Quirion. Implementing greenhouse trading in Europe: lessons from economic theory and international experiences. In: Concerted Action on Tradable Permits (CATEP) workshop on the Design and Integration of National Tradable Permit Schemes for Environmental Protection. 2002: Fondazione ENI Enrico Mattei, Venice. Environmental Studies, University College Dublin.
54. Department of Trade and Industry, Energy services and market transformation effects in the energy efficiency commitment. 2003, Energy Services Working Group ESWG (03) 14, DTI: London.
55. Schipper, L., S. Meyers, R. Howarth, and R. Steiner, Energy efficiency and human activity: past trends, future prospects. 2nd ed. 1994, Cambridge: Cambridge University Press.
56. Weizsäcker, E., A. Lovins, and H. Lovins, Factor Four: doubling health - halving resource use. The new report of the Club of Rome. 1998, London: Earthscan.
57. Golove, W. and J. Eto, Market barriers to energy efficiency: a critical reappraisal of the rationale for public policies to promote energy efficiency. 1996, Energy & Environment Division Lawrence Berkeley National Laboratory: Berkeley.
58. OECD, Financing energy efficiency in countries with economies in transition. Annex I expert group on United Nations Framework Convention on Climate Change. Working paper No. 6. 1997, Organisation for economic co-operation and development: Paris.
59. Vine, E., An international survey of the energy service company (ESCO) industry. In: Energy Policy, 2005. 33(5): p. 691-704.
60. Bowie, R. and H. Malvik. Measuring savings target fulfilment in the proposed Directive on energy end-use efficiency and energy services (COM(2003)0739). In: Summer study of the European Council for Energy Efficient Economy. 2005. Mandelieu: ECEEE.

117
61. Faure, M. and G. Skogh, The economic analysis of environmental policy and law. An introduction. 2003, Cheltenham: Edward Elgar.
62. Costyn, J. Certificate Trading for UK's Energy Efficiency Commitment. In: IEA/CESI workshop on Energy Efficiency Certificate Trading. 2002. CESI, Milan.
63. Hogg, D., The limitations of economic instruments as stimuli for technical change, technological change and innovation,, in Market-based instruments for environmental management. Politics and Institutions., M.S. Andersen and R.-U. Sprenger, Editors. 2000, Edward Elgar: Cheltenham.
64. Andersen, M.S., Designing and introducing green taxes: institutional aspects, in Market-based instruments for environmental management., M.S. Andersen and R.-U. Sprenger, Editors. 2000, Edward Edgar: Cheltenham. p. 27-48.
65. Baumol, W.J. and W.E. Oates, The Theory of Environmental Policy,. 2nd edition ed. 1988, Cambridge: Cambridge University Press.
66. Roberts, M.J. and M. Spence, Effluent charges and licenses under uncertainty. In: Journal of Public Economics, 1976: p. 193-208.
67. Coase, R., The nature of the firm. In: Economica, 1937. 4: p. 386-405.
68. Coase, R.H., The problem of social cost. In: The Journal of Law and Economics, 1960. III: p. 1-44.
69. Williamson, O.E., Markets and hierarchies: analysis and antitrust implications. 1975, New York: The Free Press.
70. Williamson, O.E., Transaction Cost Economics, in Handbook of industrial organisation, R. Schmalensee and R.D. Willig, Editors. 1989, North-Holland: Amsterdam. p. 135-182.
71. Agnolucci, P., Ex post evaluation of CO2-based taxes: a survey. 2004, Tyndall Centre for Climate Change Research: Norwich.
72. Boom, J.-T. and A. Nentjes. Alternative design options for emission trading: a survey and assessment of the literature. In: Concerted Action on Tradable Permits (CATEP) workshop on the Design and Integration of National Tradable Permit Schemes for Environmental Protection. 2002. Dublin: Environmental Studies, University College.
73. Lees, E., The UK Energy Efficiency Commitment., in EU and ECEEE Expert Seminar on Measurement and Verification. 2004: Brussels.
74. Shiller, S., S. Kumar, E. Franconi, and E. Merdaco. Emission allowances for renewable energy and energy efficiency projects. In: ISEC Solar 2004. 2004. Oregon, Portland: ISEC.

European Commission EUR 22196 EN – DG Joint Research Centre, Institute for Environment and Sustainability Luxembourg: Office for Official Publications of the European Communities 2006 – 113 pp. – 21 x 29.7 cm Scientific and Technical Research series ISBN 92-79-01818-3 Abstract The report introduces and discusses the role of the Tradable Certificates for Energy Savings (TCES) scheme to implement energy savings. Section 1 of the report places the energy efficiency and energy savings discussion in the context of relevant European policies. Section 2 reviews European experience with market based instruments in the energy sector and provides a description, analysis and comparison of the existing and planned TCES schemes. Section 3 presents a qualitative comparison of the TCES scheme (also known as white certificate scheme or Energy Efficiency Titles), with energy taxation and mandatory demand-side management (DSM) programs, using a set of four criteria. Section 4 analyses the possibilities for integrating existing MBIs in the energy sector to achieve better environmental and economic results. The advantages and dangers of integrating green and white certificates in emission trading and possible ways to establish such an integration are then examined.
The mission of the JRC is to provide customer-driven scientific and technical support for the conception, development, implementation and monitoring of EU policies. As a service of the European Commission, the JRC functions as a reference centre of science and technology for the Union. Close to the policy-making process, it serves the common interest of the Member States, while being independent of special interests, whether private or national.
LB-N
A-22196-EN
-C