Which Factors of Capital Structure Decisions are Important...
42
Which Factors of Capital Structure Decisions are Important: Evidence from Dutch Firms Author (student Number): Chen Wei (s1062301) Program: MSc Business Administration (track: Financial Management) Supervisor(s): 1 st supervisor: Henry van Beusichem MSc 2 nd supervisor: Dr. Xiaohong Huang
Transcript of Which Factors of Capital Structure Decisions are Important...

Which Factors of Capital Structure Decisions are Important: Evidence from
Dutch Firms
Author (student Number): Chen Wei (s1062301) Program: MSc Business Administration (track: Financial Management) Supervisor(s): 1st supervisor: Henry van Beusichem MSc 2nd supervisor: Dr. Xiaohong Huang
2
Abstract This study explores the important factors which determine a firm’s capital structure using the Ordinary Linear Squares (OLS) technique. The focus is on trade-off theory and corporate governance (agency costs) with consideration of non-financial institutional headquartered in the Netherlands. Our empirical results indicate that profitability is not a significant factor. In other word, a firm can not make choice of leverage based on the extent of its profitability. Moreover, only when considering the variables under agency costs and corporate governance, priority shares negatively relate to the choice of leverage, otherwise, takeover defense is not regarded as a significant factor. In conclusion, leverage is mainly determined by non-debt tax shield, tangibility and free cash flow. The important influence of free cash flow verifies that Dutch firms prefer to avoid agency costs by increasing their leverage. Adequate cash prevents firms to issue debts. However, the evidence of heteroskedasticity shows the model may not be the most appropriate. So the further research could be focused on more possible influential factors from other theories with adopting several analytical methods to be precise.
3
Table of Contents 1. Introduction ................................................................................................................................... 4 2. Literature review ........................................................................................................................... 7
2.1 Definition of capital structure ................................................................................................. 7 2.2 Modigliani-Miller theorem...................................................................................................... 7 2.3 Trade-off theory ...................................................................................................................... 8
2.3.1 Tax shield ....................................................................................................................... 10 2.3.2 Bankruptcy costs ............................................................................................................ 10
2.4 Agency cost ........................................................................................................................... 12 2.4.1 Free cash flows and growth opportunities ...................................................................... 13 2.4.2 Corporate governance .................................................................................................... 13
2.5 Pecking order theory ............................................................................................................. 14 2.6 Market timing hypothesis ...................................................................................................... 15 2.7 Dutch institutional settings associate with capital structure decisions .................................. 16
2.7.1 Takeover defense characteristic ...................................................................................... 16 2.7.2 Accounting regulations ................................................................................................... 17 2.7.3 Financial markets ........................................................................................................... 18
2.8 Review of literature on capital structure for the Netherlands................................................ 19 3. Data and methodology ................................................................................................................ 22
3.1 Research questions ................................................................................................................ 22 3.2 Data ....................................................................................................................................... 22 3.3 Hypotheses ............................................................................................................................ 23 3.4 Definition of variables........................................................................................................... 23
3.4.1 Independent variable ...................................................................................................... 23 3.4.2 Dependent variables from Trade-off theory ................................................................... 24 3.4.3 Independent variables from agency cost hypothesis ...................................................... 25 3.4.4 Control variables ............................................................................................................ 26
3.5 Methods of analysis .............................................................................................................. 30 4. Empirical results and discussion ................................................................................................. 31
4.1 Results ................................................................................................................................... 31 4.2 Discussion ............................................................................................................................. 36
5. Conclusion .................................................................................................................................. 38 References ....................................................................................................................................... 39

4
1. Introduction
The problem of optimal capital structure is one of the central problems for corporate finance, which has attracted considerable attention from many academics in recent years. Practically, corporate finance managers are always attempting to determine how much of their money should come from a bank loan or other lenders without endangering the business, or find the perfect capital structure in terms of reward / risk payoff for its shareholders. So many researchers are trying to find out what factors determine a firm’s optimal capital structure. Results of these studies are able to provide management of firms a better understanding of what they need to focus while choosing financing methods. The discussion of optimal capital structure begins with the Modigliani-Miller theorem proposed by Modigliani and Miller (1958; 1961; 1963), which is the foundation of modern capital structure theories. It is generally viewed as a pure theoretical assumption based on the assumption that many important influential elements in the capital structure decision do not exist. In a perfect market, how a firm is financed is irrelevant to its value. The finding also reveals several reasons for researchers to examine why capital structure is relevant in the real world. The influential factors include bankruptcy costs, agency costs, taxes, and information asymmetry. Since Modigliani and Miller (1958) proposed their first modern capital structure theory, plenty of theoretical literatures have emerged to extend the Modigliani-Miller theorem. For instance, a classic version of trade-off theory states that financial leverage is determined by the balance between the bankruptcy costs and taxation saving benefits of debts (Kraus and Litzenberger, 1973). Moreover, agency costs associated with corporate governance problems are considered exiting in this balance that affects a firm’s capital structure decision (Jensen and Meckling, 1976; De Jong, 2002). These problems might be produced from the different objectives between management and shareholders, over-investment problems that are caused by information asymmetry and so on. Myers and Majluf (1984)’s Pecking order theory argues that firms must prioritize their sources of financing according to the principle of least effort or least resistance, namely, prefer to use internal resources when they need funding, next to issue debt. The last choice is the issuance of equity. Market timing hypothesis claims their capital structure is determined by the timing of the current market (Baker & Wurgler, 2002). Besides, the factors may vary in different countries. For example, compared to the US firms, the Dutch tax law and accounting regulations are different to the US (Chen & Jiang, 2001). Financial markets in the Netherlands are much less accessible while banks are Dutch firms’ major external financiers (Degryse et al., 2009). Many Dutch

5
listed firms have a two-tier board system (De Jong, 2002) and their shareholders are hardly able to control their managers’ behavior (De Jong & Veld, 1999). This thesis is to analyze these potential factors through reviewing the classic capital structure theories and previous research articles and to find out a new set of significant factors which determine Dutch firms’ financial leverage based on the static trade-off theory and the agency cost hypothesis. However, in previous research, Chen and Jiang (2001), De Jong (2002), Danisevska et al. (2004), Bie and Haan (2007) and Degryse et al. (2009) have done their capital structure determinants’ study on Dutch firms. But their data are gathered from last century. Due to the current debt crisis in the Euro-zone and the fact that financial leverage of firms in Euro zone has become focal point, revisiting this topic in the Netherlands – one of the Euro-zone core economies shall help to enhance Dutch managers’ general understanding of their capital structure decisions. In other words, the results might be more reasonably applicable in recent years. In order to overcome the drawbacks and extend the research in Dutch background, the academic purpose of this thesis is to find out the most influential variables for Firms’ capital structure decisions in the Netherlands with a recent view. Therefore, accordingly, the main research question is summarized below: What factors are important for capital structure decisions of Dutch firms? For answering the main research question, the literatures that I review in previous chapters can provide some theoretical ideas. This article focuses on Trade-off theory and effect of corporate governance (agency cost). However, I do not ignore the term “Dutch” in the research question as well. Thus, several sub-questions could be considered to arise:
• Is the relationship between factors and capital structure within Dutch firms in line with trade-off theory?
• Is the relationship between factors and capital structure within Dutch firms in line with agency cost hypotheses?
After answering these sub-questions and creating an empirical research model, the main question can be answered by analyzing the model’s quantitative tested results. To start this analysis, I choose Dutch listed non-financial firms on Euronext Amsterdam from 2004 to 2009 as my target sample and collect most of cross-sectional data for measuring our variables from the REACH database. However the data for takeover defenses are collected from Effectengids. The ordinary linear squares (OLS) are run to test our hypotheses. The empirical results show that non-debt tax-shield, profitability, tangibility and free
6
cash flow are main factors to the financial leverage of the Dutch firms. Among those, tangibility and free cash flow are of the most importance. However, profitability and free cash flow might be concurrent and their effects could change by the other elements or situation. Moreover, takeover defense is regarded as almost no impact to corporate leverage within Dutch firms. Only when considering the variables under agency costs and corporate governance, priority shares present negative effect to the choice of leverage. In general, business risks, growth opportunity and takeover defense are not significant factors in Dutch environment. This thesis improves the shortages of existing papers which study Dutch firms’ capital structure determinants. Compared to the previous articles, this thesis integrates the independent variables from Trade-off theory and Agency cost hypotheses. And new measurements of many variables are proposed. Unlike many previous papers, size is not considered as one independent variable, but as control variable in this thesis. Furthermore, to overcome the limitations in this thesis, the future research could be focused on (1) aggregate more possible influential factors from other capital structure theories; (2) update the data from more recent years; (3) adopt several analytical methods rather than using only one method. Following the introduction, the next chapter of this paper is literature review. MM theory, trade-off theory and agency cost hypotheses are reviewed and explained in detail. A review and comparison of previous studies is stated at the end of this chapter. The third chapter of this study is the methodology part. In this part, I develop the research questions and explain how I collect and measure data, followed by hypotheses generating and definitions of variables. Consequently, the ordinary least square (OLS) model is described. The fourth chapter is the results, discussion and limitation part. The test results are summarized and discussed in this chapter, followed by some limitations of this research. The last chapter gives a general conclusion of our research results and summarizes the limitation of the whole study and provides recommendation for future relevant research.
7
2. Literature review
This chapter particularly reviews several classical theories of capital structure – The Modigliani-Miller theorem, trade-off theory, agency cost hypotheses, pecking order theory and market timing hypotheses. These theories provide the theoretical base for the empirical research where the potential factors are collected. But I will only focus on trade-off theory, agency cost hypotheses in this study. Afterward, the institutional settings within the Netherlands are discussed as well since our research targets are based in this country. The specific characteristics that relates to Dutch firms’ capital structures are pointed out in order to find out which influential factors of financial leverage which make the most sense within Dutch firms.
2.1 Definition of capital structure
Within the domain of corporate finance, the term capital structure refers to how companies finance their assets and the percentage of the companies’ capital using different forms. There are two forms of capital: equity capital and debt capital. Equity capital is a firm’s funds owned by the firm’s owners or shareholders. Debt capital in a firm's capital structure refers to the borrowed funds in the business such as account payables, loans and bonds. Each kind of them has its own benefits and drawbacks. Thus, according to the fact that capital structure is the mixture of equity capital and debt capital, how large a firm’s debt capital takes part of its total capital is the proxy of capital structure. In another word, capital structure can be represented by financial leverage. After doing survey, De Jong (2002) states that most of Dutch CFOs use book value of debt ratio to measure capital structure. He then says that short-term debt includes many business credit factors which are under the impact of totally different determinants. Therefore, total debt ratio is difficult to explain capital structure decision (De Jong et al., 2008). His current evidence shows that using either book leverage or market leverage induce similar results in capital structure decisions studies (De Jong et al., 2011).
2.2 Modigliani-Miller theorem
Modigliani and Miller (1958) initiated the research of modern capital structure theory, and this could be seen as a cornerstone of modern corporate finance theory. At the

8
central part, this theorem is an irrelevance statement. The basic version of this theorem argues that, within an efficient market, under a certain market price procedure and in the absence of taxes, bankruptcy costs, agency costs, and asymmetric information, the value of a firm is never affected by how this firm is financed. It does not matter whether the firm's capital is financed by taking loan from banks, issuing debts or issuing stock on capital market. It also does not matter what kind of dividend policy the firm has. Therefore, the Modigliani–Miller theorem is also known as “capital structure irrelevance principle”. In fact, the Modigliani-Miller Theorem is comprised by four different propositions from a series of papers (Modigliani and Miller, 1958; 1961; 1963). The first proposition states that under certain conditions, debt-equity ratio of a firm does not have any effect on the firm’s market value. The second proposition says that financial leverage of a firm do not influence its weighted average cost of capital (WACC). The third proposition argues that market value of a firm has no relationship with the firm’s policy of dividends. The fourth proposition proposes that a firm’s equity holders do not care about its financial policy. According to Villamil (2008), the Modigliani-Miller Theorem has two fundamental contributions to the finance field. “It represents one of the first formal uses of a no arbitrage argument”. Fundamentally, it starts the debate on the reason why the irrelevance principle fails around the Theorem’s assumptions in the real world. These assumptions are (1) neutral taxes business environment; (2) no bankruptcy and other financial distress cost; (3) information symmetry occurs in debt and credit markets (i.e., different firms borrow or lend at the same interest rate); and (4) firms’ financial policy do not expose any financial information. Modigliani and Miller (1958) also assume that all firms belong to their respective “risk class”, a set of companies with similar earnings across countries of the world, although Stiglitz (1969)’s results show that this assumption is not essential. These relevant assumptions are significant because they set certain conditions for effective arbitrage: If financial markets are not affected by taxes, bankruptcy or other financial distress costs, asymmetric information or any other factors which limits access to credit, all investors can easily copy what a successful firm has done in the market to arbitrage. Subsequently, the systematic analysis of these assumptions has led to an expansion of the theories by researchers within fields of corporate finance. After all, although the assumptions and conditions above are hardly met in the real world, the theorem is still commonly quoted and taught in business schools due to the important content that it tells firstly. That is, says Villamil (2008), “capital structure matters precisely because one or more of these assumptions is violated. It tells where to look for determinants of optimal capital structure and how those factors might affect optimal capital structure”.
2.3 Trade-off theory
Trade-off theory is one of the most popular variations of Modigliani-Miller theorem.
9
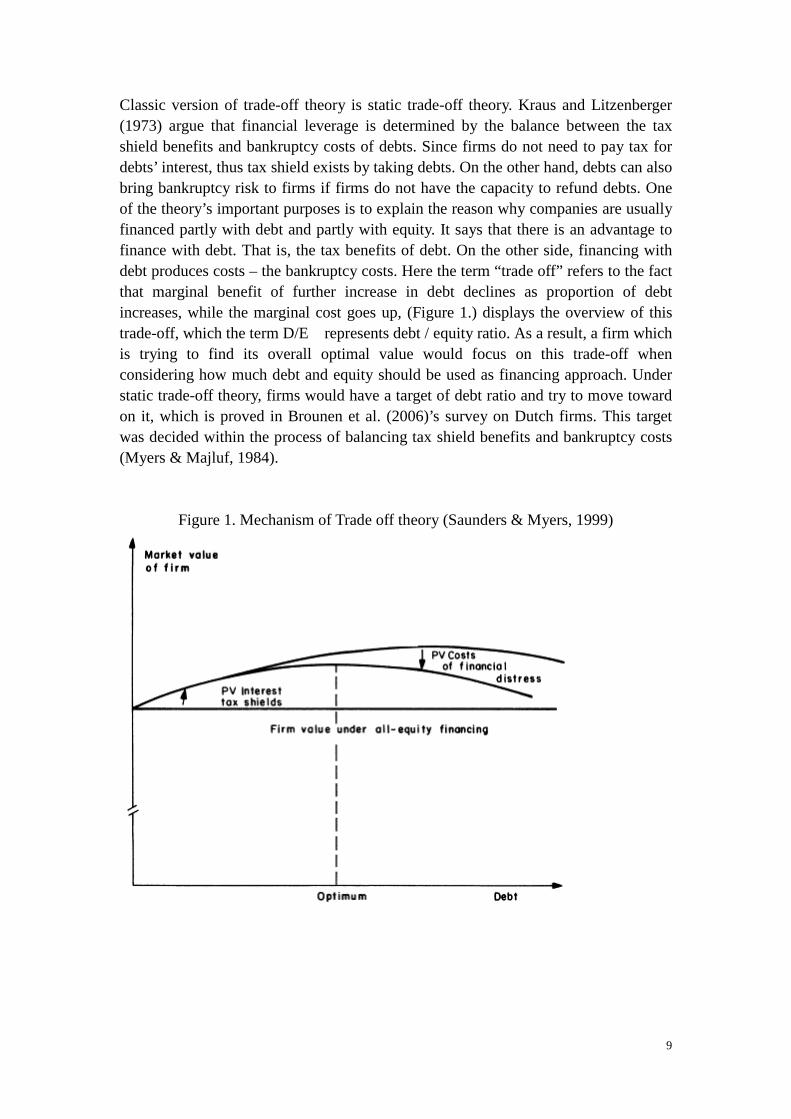
Classic version of trade-off theory is static trade-off theory. Kraus and Litzenberger (1973) argue that financial leverage is determined by the balance between the tax shield benefits and bankruptcy costs of debts. Since firms do not need to pay tax for debts’ interest, thus tax shield exists by taking debts. On the other hand, debts can also bring bankruptcy risk to firms if firms do not have the capacity to refund debts. One of the theory’s important purposes is to explain the reason why companies are usually financed partly with debt and partly with equity. It says that there is an advantage to finance with debt. That is, the tax benefits of debt. On the other side, financing with debt produces costs – the bankruptcy costs. Here the term “trade off” refers to the fact that marginal benefit of further increase in debt declines as proportion of debt increases, while the marginal cost goes up, (Figure 1.) displays the overview of this trade-off, which the term D/E represents debt / equity ratio. As a result, a firm which is trying to find its overall optimal value would focus on this trade-off when considering how much debt and equity should be used as financing approach. Under static trade-off theory, firms would have a target of debt ratio and try to move toward on it, which is proved in Brounen et al. (2006)’s survey on Dutch firms. This target was decided within the process of balancing tax shield benefits and bankruptcy costs (Myers & Majluf, 1984).
Figure 1. Mechanism of Trade off theory (Saunders & Myers, 1999)

10
2.3.1 Tax shield Modigliani and Miller (1963) and Miller (1977) propose that interest bearing tax shield affects a firm’s capital structure. Tax shield is the concept of reduction in income taxes payment resulted from taking an allowable deduction of taxable income. For instance, due to the fact that interest on debt is a kind of tax-deductible payment, taking on debt creates a tax shield from this expense. Since a tax shield is an approach to save cash flows, it increases the value of the business, and it is an important aspect of business valuation. If tax payments are deductible, firms would prefer debt rather than equity to gain more from taxed income, thus would like to have higher debt ratio. In other words, tax shield positively affect the choice of financing in debt. The model used by DeAngelo and Masulis (1980) allows the marginal benefit of the corporate tax deduction of interest to change with financial leverage, and so produce an optimum for capital structure. In their model, the optimal level of financial leverage depends on non-debt tax shields of a firm, such as depreciation and R&D expenditures. Larger non-debt tax shields means that there is a larger chance of having no or very low taxable income, a lower expected corporate tax rate or a lower expected payment from interest tax shields. Therefore, they predict that financial leverage is negatively related to the level of non-debt tax shields. De Jong (2002) empirically concludes that negative relationship occurs between leverage and non-debt tax shields within Dutch firms. Profitable firms have lower risk of bankruptcy. So they face higher tax payment, which make their tax shields more valuable (Frank & Goyal, 2009). Moreover, profitable firms result in lower bankruptcy cost – the term that is discussed in next paragraph. However, according to Kayhan and Titman (2007), leverage and profitability are negatively related because firms passively accumulate profits.
2.3.2 Bankruptcy costs Debts’ over issuing may lead to financial risks, and these risks may bring the company to bankruptcy. According to the modern corporate finance theory, debt’s bankruptcy costs are increased by financing with debt instead of equity that results higher probability of bankruptcy. Bankruptcy is generally a process of producing costs. These bankruptcy costs could be summarized into two categories: direct costs and indirect costs. Direct costs include administrative and legal fees, such as fees for employing accountants and lawyers to handle the bankruptcy issues. Indirect costs consists of a very wide range of opportunity and management distraction costs, such as sales loss, additional operating costs, and weakened competitiveness and so on, which are very difficult to measure. However, bankruptcy is not only a transfer

11
procedure of firms’ ownership but its costs have negative effects to the firm value. The costs generated by bankruptcy can be considered as one kind of financial cost as well. These financial costs can be understood as the fact that the cost of financing goes up because the probability of bankruptcy become larger. For example, when a firm goes bankrupt, investors who hold its debt are likely to lose part or even all of their investments. As a result, investors are likely to require a higher rate of return when they are considering investing in bonds of a company which they think may go bankrupt much more easily than others. This explains that an increase of debt which potentially increasing a firm's probability of bankruptcy can generate an increase in these bankruptcy costs of debt. Within the trade-off theory of capital structure, firms are supposedly selecting their portfolio of debt by trading off these bankruptcy costs of debt against the tax benefits that debt can bring to the firm. Particularly, a firm that is trying to maximize its shareholders’ value will balance the marginal cost of debt that caused by these bankruptcy costs with the marginal benefit of debt that results from tax benefits. So far, many researchers have contributed to the discussion regarding the significance of bankruptcy cost in the capital structure decision. And hereby I can summarize that the impact of the trade-off between the tax saving benefit from debt financing and its costs of bankruptcy can determine a firm’s capital structure decisions. Baxter (1967) confirms the above opinion and says that the cost of capital decreases when debt amounts are low. Cost of capital goes up where leverage becomes higher. Any additional increase in financial leverage beyond a point pulls the equity-investors and creditor’s required rates of return higher, which decreases the firm’s ability to support its debt even more difficult. Moreover, the author points out that the benefits of tax savings provided by the debt financing are limited due to the potential risk of failure that can be created due to the effect of over-leverage. Kraus and Litzenberger (1973) state that the market value of a firm with partly debt financing, plus the corporate tax rate times the market value of the firm’s debt, less the complement of the corporate tax times the present value of bankruptcy costs equals to the market value of a firm without debt financing. Therefore, it clearly shows that bankruptcy cost plays an important role in determining the value of a levered company. Gruber and Warner (1977) investigate the significance of direct cost of bankruptcy for bankrupting a firm in their paper and they finally conclude that bankruptcy cost is not important factor for pushing a firm’s bankruptcy. Stone (1977) points out that the direct bankruptcy cost is not significant because of the absence of indirect cost in the total bankruptcy cost evaluation. Then, he suggests that both the direct and indirect bankruptcy costs are needed to be incorporated into models for estimating the trade-off between tax benefits and bankruptcy cost. Altman (1984) argues that conceptual research does not have enough persuasion to explain about the significance of bankruptcy cost for impacting firms’ value and financial leverage, this kind of importance should be approved and demonstrated by empirical research method. As a result, he computes the direct and indirect bankruptcy costs for a sample of twelve retailers and seven firms from other business area through regression models and
12
estimates from reliable professional analysts. Castanias (1983)’s study also shows empirically that firms who are handling with business that seems to have higher rates of failure, has lower level of debt financing for their optimal capital structure decision. Litzenberger (1986) investigates two case studies about Phillips Petroleum and Unocal’s recapitalization in response of extreme leverage position. He states that these two cases explain that the two firms’ market values were either negatively affected or unaffected by sharp increase in their use of debt for financing purpose. And it was due to financial distress costs such as liquidation and bankruptcy costs. Payments on debt are obligatory; the debt holders can ask the firms for bankruptcy if the firms cannot repay their debts. With respect to the bankruptcy costs, variables like tangibility, business risks and firm size are used as proxies (De Jong et al., 2008). Tangibility of assets may reduce bankruptcy costs to firms’ debt holders and is expected to increase leverage because it brings the firms the ability to repay their debts. In the Netherlands, firms’ business risks increase the bankruptcy costs since investors cannot see bright future of the firms’ operational performance while size of firms reduces these costs since larger firms are less likely to go bankrupt (De Jong, 2002). For defining determinants of capital structure, it is more appropriate than the dynamic version of trade-off theory, since the dynamic version is mainly used for testing how the determinants affect capital structure decisions and how firms adjust their leverage toward their targets (Frank & Goyal, 2007). Thus, according to the trade-off theory, the following hypotheses are generated: There is a negative relationship between non-debt tax shields and financial leverage (H1). There is a positive relationship between profitability and financial leverage (H2). There is a positive relationship between tangibility and financial leverage (H3). There is a negative relationship between business risks and financial leverage (H4).
2.4 Agency cost
Agency cost is an economic concept about firms’ potential internal costs that are associated with problems like divergent shareholder interest, manager’s goals and information asymmetry (Jensen and Meckling, 1976). Though the influence of agency cost is present in any kind of agency relationship, mostly, this term is used and discussed in business contexts. Agency costs consist of two sources: The first is the costs associated with using an agent, such as the risks’ increasing of which an agent would use organizational resource for their own benefit. The second is the costs of techniques associated with using an agent like the costs of producing financial statements. According to De Jong (2002), agency cost is connected to capital structure decisions through growth opportunity, free cash flows and corporate governance within Dutch firms.

13
2.4.1 Free cash flows and growth opportunities Jensen (1986) defines free cash flow as “the cash flow in excess of the cash flow that is required to fund all projects with a positive net present value that are available to the firm”. Shareholders can have maximum benefit if all the free cash flows are paid back to them as dividends. However, the payment of dividends is at the management’s discretion. Managers have incentives so that they are willing to retain the firms’ earnings to be used for their further expansion even when the asset is not worthy as what they invest. In this case, the problem of conflicts arises between shareholders and firms’ management. In shareholders’ view, this problem is referred to as the term of overinvestment. According to Jensen (1986), by issuing debt, the problems of debt can be minimized as it frees all free cash flow to be returned to shareholders. Different from equity, the payment on debt does not have a discretionary nature. In this case, the presence of debt can cause the managers to use their cash flow on hand as interests and repayments for the debt. However, if there is growth opportunity for the firm such as high-return projects, the negative effect of free cash flows is lower. In this case, managers are willing to invest these cash into these projects for making profits rather than spending them with their own discretion. As a result, a firm’s free cash flow and its growth opportunities affect the firm’s leverage in conjunction with overinvestment problem. The opposite problem of overinvestment is underinvestment. Underinvestment is defined as the refusal of shareholders to invest in low-risk assets, to avoid losing wealth from themselves. In the Netherlands, problems of overinvestment are more common than problems of underinvestment (Degryse & De Jong, 2006). In a Dutch firm without further growth opportunities, but with free cash flow, most of managers are likely to become over investors because they have incentives to expand the firms (Grossman and Hart, 1982; Jensen, 1986; De Jong, 2002). These firms would benefit if they adopt more debts to be their financed capital, and their financial leverage would be higher. Due to its disciplinary role of deducting free cash flow, plus the fact that interests of debts need to be paid obligatory, managers do not have too much free cash flow on hand. Hence, managers’ abilities to over invest is restricted. As a result, they are not able to spend too much free cash flows in any potential low return projects which are considered as overinvestment and produce additional agency costs. De Jong (2002) proves this argument is true for the Dutch firms as well.
2.4.2 Corporate governance Corporate governance is the process, structure, systems and culture, used to direct and manage the business affairs of the company in order to enhance the business success of the firm and to realize long-term value of the firm’s shareholders (Keasey et al., 1997). In the case of overinvestment problem, a firm’s agency cost arises because of

14
the conflicts of interest between managers and shareholders. If corporate governance is effective, the agency cost of the firm will be lower. Therefore, opinion difference or conflicts between shareholders and managers will decrease and disciplinary role of debt is weakened which lead to the decline of firms’ financial leverage (De Jong, 2002). Corporate governance has been identified by many other researchers as influential factor to capital structure of a firm (Jensen, 1986; Berger et al., 1997; Wen et al., 2002; Abor, 2007), although their opinions on whether the relationship are positive or negative do not coincide. However, board size and board composition are commonly considered as proxy of corporate governance in previous literatures. The board of directors is appointed by shareholders to supervise and appoint firm’s management. Berger et al. (1997) find that firms with larger boards have lower financial leverage. They assume that larger board burdens managers to pursue lower debt ratio and to have a better financial performance. However, Jensen (1986) says that firms with higher financial leverage have larger boards. The empirical results of Wen et al. (2002) and Abor (2007) approve the existence of positive relationship between board size and capital structure as well. Their results show that larger board pursues larger leverage to raise firm value due to its stronger regulatory bodies. And they argue that large amount of board members will cause stronger conflicts, thus, result in difficulty of achieving consistency during decision-making period. These conflicts exist not only among board members but can also occur between board members and managers. Hence, corporate governance is weakened. Setting of corporate governance varies among countries due to different business and cultural environment. For Dutch firms, their specific corporate governance features could influence their capital structure in different way compared to US firms. Therefore, Dutch institutional settings associated with capital structure will be discussed later in this chapter. According to agency cost hypothesis, the following hypotheses are proposed: There is negative relationship between growth opportunity and financial leverage (H5). There is positive relationship between free cash flow and financial leverage (H6).
2.5 Pecking order theory
Pecking order theory argues that firms do not have target of debt ratio. Due to asymmetric information, managers simply prefer using internal resource such as retained earnings for financing purpose rather than using external resources like debt and equity issuance; when retained earnings are not available, issuing debts would be the next choice; only when the two previous financing approaches cannot satisfy the firms’ need of funding, issuance of equity would be considered by managers (Myers & Majluf, 1984). This theory is consistent with De Haan and Hinloopen (2003)’s study of Dutch Firms’ preference of hierarchies on financing approaches choices.

15
How does this theory associate to the capital structure decisions? Clearly, when firms are profitable, retained earnings are available for financing. When retained earnings are treated as equity, under pecking order theory, debt issuing would not be considered as the first financing choice in profitable firms (Myers & Majluf, 1984). Large firms are better known and are experienced to retain earnings (Frank & Goyal, 2009), so the chance of using internal funds of financing are larger, namely, their leverage should be lower. Ross et al. (2008) argue that the firms which have not been in growth stage prefer to finance their projects by internal financing, nevertheless, leverage should increase when the firms enters growth stage. This is consistent with Frank and Goyal (2009)’s statement that firms with more investments accumulate more and more debts over time. In pecking order view, liquidity is commonly used in testing firm-specific determinants of leverage (De Jong et al., 2008); free cash flows are normally used firstly instead of debts.
2.6 Market timing hypothesis
To my knowledge, Baker and Wurgler (2002) are the first researchers who proposed the market timing hypothesis. They claim that market timing is the most important factor for determining a firms’ capital structure decision. Under this hypothesis, managers do not care whether the firms finance with debt or equity, the structure of debt and equity combination is decided according to the accumulated effect of past attempts to time the financial market. Managers evaluate the current situation of both debt and equity markets, to see mis-pricing within the firms’ shares in the market, then they make decisions to issue or repurchase their own shares (Frank & Goyal, 2009). In other words, firms would issue new shares when their stock prices are overvalued and oppositely would repurchase them back once their stock prices are considered to be undervalued (Bie & Haan, 2007). Hence, debt ratio may go down if the firms’ stock returns are high as they prefer to issue equity. Besides mis-pricing of equity, factors in association with cost of debts would affect managers’ decisions of choosing debts as financing approach under market timing hypothesis. Harvey et al. (2004) and Barry et al. (2008) argue that managers’ decisions of issuing debts are impacted by the time of different interest rate. Firms would issue more debts when current interest rates are low compared to historical levels. As a result, the inflation which is highly related to current interest rate (Ritter & Warr, 2002) should be another potential factor for determining leverage (Frank & Goyal, 2009). Empirical results of Bie and Haan (2007) shows that market timing hypothesis exist in Dutch firms. Pecking order theory and Market timing hypothesis are not theories that we concentrate on in this thesis so that we do not go too far into these two theories and

16
develop any hypotheses from them.
2.7 Dutch institutional settings associate with capital structure
decisions
2.7.1 Takeover defense characteristic As mentioned at the beginning, Dutch firms have very special corporate governance characteristics. Compared to the US, the Dutch bankruptcy law provides more protection to creditors. (Brounen et al., 2006) This creditor-oriented system is harsh for firms who default and go bankrupt. Because of this institutional difference, bankruptcy costs that are induced from trade-off theory are expected to be higher in the Netherlands (Brounen et al., 2006; Chen & Jiang, 2001). Moreover, very commonly, listed firms in the Netherlands have one large block holder, who has the power to prevent company from a hostile takeover (De Jong, 2002). Takeover defenses are broadly adopted by firms, market-for-corporate-control is absent in the Netherlands (Kabir et al., 1997). Market-for-corporate-control is a concept of an equity market’s role in facilitating company takeovers. As a result, Dutch managers would prefer to over invest without market-for-corporate-control, since presence of market-for-corporate-control can minimize their control of the firm. Another particular feature of Dutch firms is that they have a two-tier board system (De Jong et al., 2001), the executive board and supervisory board. Thus Dutch shareholders are less able to control their managers’ behavior (De Jong & Veld, 1999) than the US and conflicts generally do appear. Consequently, effectiveness of internal controls may be more important in the Netherlands than external controls. According to Kabir et al. (1997), issuance of preferred shares is the most widely used takeover defense mechanism in the Netherlands. These preferred shares are usually issued in the name of friendly parties because of their controlling ability. The process of defense with preference shares takes place in three steps which do not need to exist at the same time. Firstly, ordinary shareholders authorize current management to create the possibility of issuing preferred shares. The second, the current management grants the option to a friendly foundation or institutional investor to buy these preferred shares. Afterwards, current management issues the preferred shares during the threat of outside hostile takeover event. In reference to the Dutch law, only a minimum of 25 percent of the share price need to be required. Even though these shares do not need to be fully acquired, the holders of these preferred shares may have the same voting rights as holders of ordinary shares. If firms want to oppose any unfriendly external takeover, holders of ordinary shares would authorize managers of the firms to issue preferred shares when it is necessary, so that they offer reliable
17
voting power to friendly entities and these entities are able to resist any takeover attempts. Priority shares are shares that offer their holders certain controlling rights of firms’ management such as rights to appoint managers or to make recommendation on the appointment. Moreover, some important investment payments of dividends have to be approved by priority shareholders as well. Priority shares are usually issued to a friendly foundation which is reliable for the firm to reserve the right of approving any modification of the firm’s management direction. Therefore, the general meeting of ordinary shareholders’ power is restricted when an external takeover attempt is involved. According to Roosenboom and Goot (2003), “priority shares are not traded on the stock exchange”. Firms in the Netherlands often deposit their original voting shares with a trustee – normally an administrative office. For every deposited share, the trustee issues a share certificates, or depository receipt of a common share which is traded on Euronext Amsterdam. The holder of depository receipts has the cash flow rights attached to ordinary shares, but not the voting rights. The voting rights here still rest with the administrative office so that takeover defense mechanism could be exercised via the administrative office. Roosenboom and Goot (2003) says that private investors are able to exchange share certificates for voting shares up to a maximum proportion of one percent of outstanding equity capital. Commonly, the administrative trustee office consists of both the board members of a firm and some outside members. Nevertheless, the director and most of the trustee office members must come from outside, and they are often on friendly terms with firms’ management in practice. Share certificates are comparable to dual class shares that are used in the US, since Class A and B shares within dual class shares system also means different voting rights. However, share certificates limit shareholders’ rights more than that of dual class shares. Under a dual class capitalization, two classes of stock exist, and one has superior voting rights compared to the other. In the case of share certificates, the shareholders’ right to vote is simply stripped. It is not cancelled but restricted by the administrative office. According to the takeover defense characteristic within Dutch listed firms, the hypothesis below is generated: Takeover defense level negatively relates to financial leverage (H7).
2.7.2 Accounting regulations In the Netherlands, firms follow the International Financial Reporting Standards (IFRS), on the other hand, the US GAAP is being used by US firms. Since most of capital structure literatures are based on facts and data of firms in the US, it is
18
necessary to compare the accounting rules between these two countries, to see whether difference between these two accounting standards that are relevant to capital structure exist, because accounting regulations can directly affect how financial leverage displays on firms’ financial statement. The most important of the differences for our analysis is that these two regulations vary in the recognition of liability and equity. Under IFRS, a financial instrument is a financial liability if it will or may be settled in a variable number of the entity’s own equity instruments; financial instruments which have both liability and equity characteristics are accounted separately. An obligation for an entity to acquire its own equity instruments creates a financial liability. Unlike IFRS, under US GAAP, a financial instrument is a financial liability if it is predominantly indexed to a fixed amount of monetary; financial instruments with characteristics of both liability and equity are not always split between their debt and equity components; an obligation for an entity to acquire its own equity instruments gives rise to a financial liability only if it has certain characteristics. Under IFRS, there is a very common used account of liabilities call “provision”. A provision is recognized for a legal or constructive obligation arising from a past event, as this makes more likely that outflow of resources and the amount can be estimated reliably. According to the Dutch tax laws, this provision can either be deducted directly from account receivables or be fully used for tax deduction against income (Chen & Jiang, 2001). Each choice of these two may result in different leverage and since provision amount was huge in Dutch firms’ balance sheets, provision seems to play significant role in determining capital structure. Unlike IFRS, in US GAAP provision is called as “contingency”. A contingency is recognized if it is likely to occur that a debt has been incurred and the amount can be measured using a reasonable estimate.
2.7.3 Financial markets Financial system in the Netherlands is less market-oriented than the US because it is less accessible, compared to the US market. Internal funding is preferred by Dutch firms, and banks are more commonly used as the major external financiers, (Bie & Haan, 2007; Degryse et al., 2009) while equity market is always the last financing option, unlike US firms. However, this shows that pecking order theory is more relevant with the institutional settings in the Netherlands. According to several papers (Bie & Haan, 2007; Chen & Jiang, 2001), stock repurchase are less frequently observed in the Netherlands than in the US. Moreover, it is notable that credit market does not play a significant role in the Netherlands (Bie & Haan, 2007). These evidences show that market timing in the Netherlands does not play an important role for capital structure decisions.
19
2.8 Review of literature on capital structure for the Netherlands
So far, many researchers have tested each of these capital structure theories through different methodologies and have found many factors which are important for determining firms’ capital structure. However, most of these studies are based on data collected from the United States. Though several literatures such as Chen and Jiang (2001), De Jong (2002), Danisevska et al. (2004), Bie and Haan (2007) and Degryse et al. (2009) have done the capital structure determinants studies specially within Dutch firms. But they are not consistent in theories basis, variables measuring, research methodologies, samples etc. Table 1 displays a comparable overview of literatures which study Dutch firms’ capital structure determinants. These five literatures all have their own research limitations. De Jong (2002) employs growth as control variable. But growth is one of the important factors that affect capital structure under agency cost theory. Since one of his theory bases is agency cost, growth should not be treated as control variable. De Bie and de Haan (2007)’s study is based on Market-timing hypothesis only. They treat most of variables quoted from annual reports as control variables. However, they missed factors like free cash flows which are significant determinant of capital structure under agency cost theory. Degryse et al. (2009) focus on Dutch SMEs only. And they believe that larger firms equal to lower bankruptcy costs. However, after the financial crisis of 2007, I have seen that this opinion is not always true. Many large firms bankrupt during or after the crisis just because of their out-of-controlled debts. Employing firm size as one of the determinants of capital structure is then questionable. Danisevska et al. (2004) does their research about how banks influence capital structure. What they concentrate on is firms’ debt from banks. This is far from what I want study. Moreover, they employ total debt ratio as measurement of financial leverage. But actually, it is difficult to explain leverage (De Jong et al., 2008). Literature of Chen and Jiang (2001) explain that provision ratio affect capital structure as well. But however, provision is excluded when calculate long-term debt ratio. So employ it as one of determinant is non-sensed. Moreover, most of the literatures mentioned above do not systematically analyze the Dutch institutional settings Except Chen and Jiang (2001). These settings explain how different Dutch firms can be from US firms, so that the meaning of doing research on Dutch firms is clear. Additionally, data set of these literatures is from last century, which means too long ago. New data from past couple of years can test whether old theories are still valid nowadays. Furthermore, almost none of these literatures employ variables of corporate governance in their papers except de Jong (2002). Corporate governance is considered

20
significant in other US-based literatures (Jensen, 1986; Berger et al., 1997; Wen et al., 2002; Abor, 2007). And in the Netherlands, corporate governance, especially its takeover defense characteristics, is even more important than in the Anglo-Saxion world. Last but not least, none of these 5 literatures include a chapter that discusses its limitation of research. A limitation chapter is important for an academic article which helps further researchers who quote this article to easily find what they need to do further for the same topic so that the research can be completed step by step clearly.
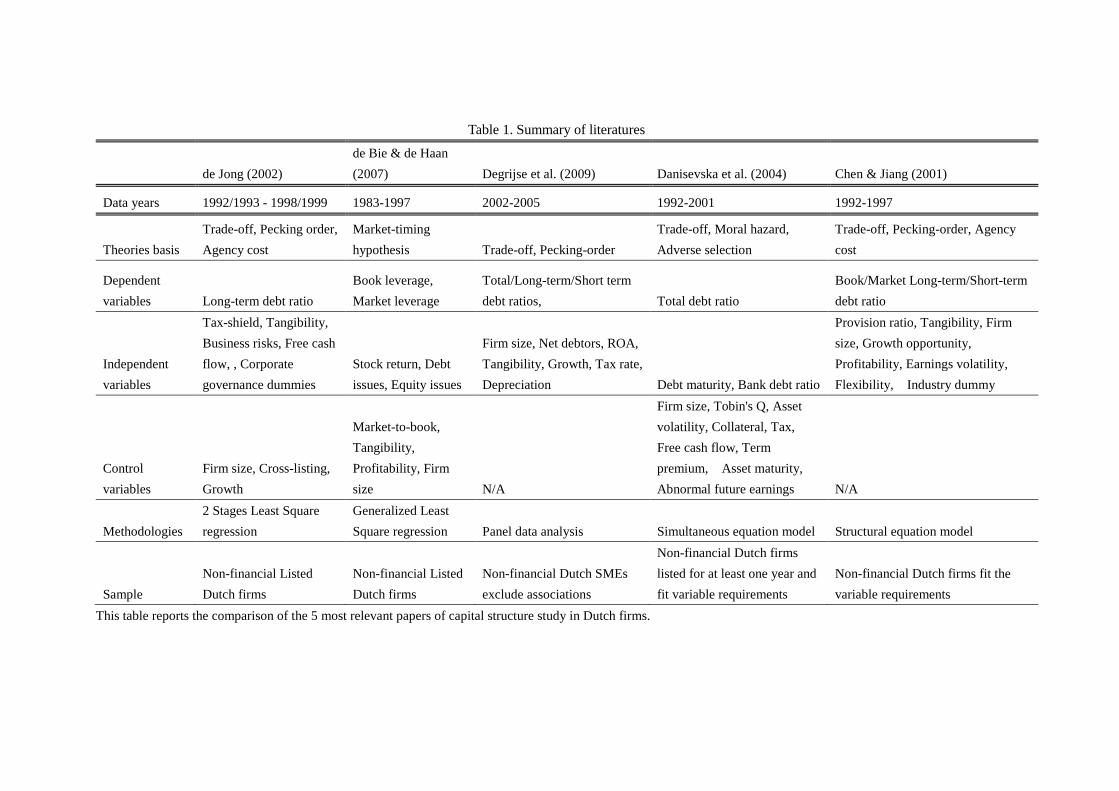
Table 1. Summary of literatures
de Jong (2002) de Bie & de Haan (2007) Degrijse et al. (2009) Danisevska et al. (2004) Chen & Jiang (2001)
Data years 1992/1993 - 1998/1999 1983-1997 2002-2005 1992-2001 1992-1997
Theories basis Trade-off, Pecking order, Agency cost
Market-timing hypothesis Trade-off, Pecking-order
Trade-off, Moral hazard, Adverse selection
Trade-off, Pecking-order, Agency cost
Dependent variables Long-term debt ratio
Book leverage, Market leverage
Total/Long-term/Short term debt ratios, Total debt ratio
Book/Market Long-term/Short-term debt ratio
Independent variables
Tax-shield, Tangibility, Business risks, Free cash flow, , Corporate governance dummies
Stock return, Debt issues, Equity issues
Firm size, Net debtors, ROA, Tangibility, Growth, Tax rate, Depreciation Debt maturity, Bank debt ratio
Provision ratio, Tangibility, Firm size, Growth opportunity, Profitability, Earnings volatility, Flexibility, Industry dummy
Control variables
Firm size, Cross-listing, Growth
Market-to-book, Tangibility, Profitability, Firm size N/A
Firm size, Tobin's Q, Asset volatility, Collateral, Tax, Free cash flow, Term premium, Asset maturity, Abnormal future earnings N/A
Methodologies 2 Stages Least Square regression
Generalized Least Square regression Panel data analysis Simultaneous equation model Structural equation model
Sample Non-financial Listed Dutch firms
Non-financial Listed Dutch firms
Non-financial Dutch SMEs exclude associations
Non-financial Dutch firms listed for at least one year and fit variable requirements
Non-financial Dutch firms fit the variable requirements
This table reports the comparison of the 5 most relevant papers of capital structure study in Dutch firms.

3. Data and methodology
This chapter includes where and how data are collected and processed, how the variables are described and what quantitative method is used for testing the data.
3.1 Research questions
The purpose of this paper is to find out the influential variables on firms’ capital structure in the Netherlands; therefore, accordingly, the main research question is summarized below: What factors are important for capital structure decisions of Dutch firms? For answering the main research question, the literatures that I review in previous chapters can provide some theoretical ideas. This article focuses on Trade-off theory and the effect of corporate governance (agency cost). However, I do not ignore the term “Dutch” in the research question as well. Thus, several sub-questions could be considered to arise: Is the relationship between factors and capital structure within Dutch firms in line
with trade-off theory? Is the relationship between factors and capital structure within Dutch firms in line
with agency cost hypotheses?
3.2 Data
For testing the variables of static trade-off theory and agency cost hypothesis, cross-sectional data is appropriate. Its static feature just requires observations on different subjects at one point of time. The study is formed by variables that are separate for each firm, which assumes they do not impact each other over a certain period. As a result, cross-sectional data is able to satisfy the need of a cross sectional study. I select data set of Dutch firms from 2004 to 2009 as our sample pool. Data of most variables are collected from REACH database. I choose only firms that are listed on Euronext Amsterdam as our sample targets. The data include market value which I can use to calculate the market-to-book ratio as measurement of growth opportunity. I then screen financial service firms such as banks, insurance companies, real estate firms and pension funds from our sample. This kind of firms are irrelevant due to the
23
restrict regulation and specific features of their financial structure. Preliminarily, 116 non-financial firms that listed on Euronext Amsterdam are selected from REACH. For takeover defense level proxy, I collect them from “Gids bij de officiele prijscourant van Euronext Amsterdam” of the year 2004 to 2009. I collect leverage from years 2005-2009 and all other independent variables from years 2004-2008. The Dutch Corporate tax rate is 34.5% in the year of 2004, 31% in 2005, 29.6% in 2006, 25.5% in 2007 and 2008.
3.3 Hypotheses
According to the trade-off theory, the following hypotheses are generated: There is a negative relationship between non-debt tax shield and financial leverage (H1). There is a positive relationship between profitability and financial leverage (H2). There is a positive relationship between tangibility and financial leverage (H3). There is a negative relationship between business risks and financial leverage (H4). According to agency cost hypothesis, the following hypotheses are proposed: There is a negative relationship between growth opportunity and financial leverage (H5). There is a positive relationship between free cash flow and financial leverage (H6). According to the takeover defense characteristic within Dutch listed firms, the hypothesis below is generated: Takeover defense level negatively relates to financial leverage (H7).
3.4 Definition of variables
3.4.1 Independent variable Leverage (LEV) This article is about capital structure, so it is necessary to define what it is before I begin the analysis. Capital structure refers to how companies finance their assets via the combination of debts and equity. Thus the capital structure of firms is the composition of their liabilities. When people discuss making decisions for capital structure, it means the financial leverage of firms is decided by managers. As a result, leverage should be the independent variable. In this study, I will use book value of long-term debt ratio because of three reasons. First of all, previous studies shows that Most of Dutch CFOs use book value of debt ratio to measure capital structure (De Jong, 2002); Secondly, current evidence shows that using either book leverage or market leverage induce similar results in capital structure decisions studies (De Jong et al., 2011); The third, most of relevant studies use book value, it makes more sense to compare our results with others’; Finally, short-term debt includes many business
24
credit factors which is under the impact of totally different determinants, total debt ratio is then difficult to explain (De Jong et al., 2008). However, total debt ratio will also be used as one of the definition of leverage in the empirical analysis, but just for checking the robustness of the analysis.
3.4.2 Dependent variables from Trade-off theory Non-debt Tax shield (TAX) DeAngelo and Masulis (1980) state that tax deductions for depreciation and R&D expenditure can be substitutes for debt financing’s tax benefit. As a result, firms with larger non-debt tax shields have lower debt level (H1). Tax shield itself is not considered in most of Dutch firms’ capital structure studies except de Jong (2002); it is commonly measured by other proxies such as profitability. In this study I apply non-debt tax shield itself as one of the independent variables. The formula that provided by Titman and Wessel (1988) is used to calculate non-debt tax shield: Operating income minus interest payments, minus corporate income tax payments over corporate tax rate. Profitability (PROF) Profitability is one of the most commonly used variables in capital structure studies. Firms with higher profitability result in lower risk of bankrupt, thus cause lower bankruptcy cost and higher tax, which make their tax shields more valuable (Frank & Goyal, 2009). So, the hypothesis is assumed that there is positive relationship between profitability and leverage (H2). I use equation of EBIT / total assets to compute profitability. Tangibility (TANG) Tangibility of assets may reduce bankruptcy costs to firms’ debt holders and is expected to increase leverage because it brings the firms the ability to repay their debts. Namely, there is positive relationship between tangibility and leverage (H3). Tangibility is commonly calculated by the formula of tangible assets / total assets (De Jong, 2002, Frank & Goyal, 2009). However, long-term tangible assets such as land, plant and buildings do not always give the owners ability to repay debt immediately when the owners need it. And it is also difficult to borrow loan from bank by mortgaging these assets. So in this study I apply both cash and tangible fixed assets for calculating the tangibility of firms since cash is able to be used as liquid instrument to repay firms’ debts when it is needed. Business risks (RISK)

25
Firms’ business risks increase the bankruptcy costs as most investors cannot see bright future of the firms’ operational performance. Thus, there is negative relationship between business risks and leverage (H4). This parameter is generated from De Jong (2002)’s study which quotes standard deviation of operating income change rate over pass three years to measure business risks.
3.4.3 Independent variables from agency cost hypothesis Growth opportunity (GROW) Managers of firms without growth opportunities and with free cash flow in hand are most likely to become over investors because they have incentives to expand the firm (Jensen, 1986), and agency cost arises. For minimizing agency cost, firms will increase their debt ratio if there is little growth opportunities. Therefore, there is negative relationship between growth opportunity and leverage (H5). I use market-to-book ratio as measurement of growth opportunity and calculate this ratio with the equation market capitalization divided by book equity. Because market-to-book ratio shows a firm’s market capitalization is undervalued or not. It also represents the market’s expectation of future projects’ value, which is similar to what the definition of growth opportunity is (De Jong, 2002). Free cash flow (FCF) When agency cost is producing within management, free cash flow always works together with growth opportunity. Opposite to growth opportunity, there is positive relationship between free cash flow and leverage (H6). Following Brealey et al. (2005), I adopt cash flows as proxy to free cash flow. The equation of net cash flows / total assets is used to measure the free cash flow variable in this study because this equation makes more sense than De Jong (2002)’s equation of (operation income – tax – interest – dividends) / total assets for calculating free cash flow since operational income may contain non-cash incomes. Corporate governance Agency cost theory and the Dutch corporate characteristics propose that effective corporate governance for Dutch firms. Lower takeover defense level (DEF) would mitigate shareholder-manager conflicts and thus leverage (De Jong, 2002). So, According to agency cost hypothesis, there is a positive relationship between takeover defense level and leverage (H7); I follow the way of Kabir et al. (1997) and De Jong (2002) to measure takeover defense level. I apply the presence of the most three prevailing defenses – preferred shares, priority shares and share certificates as indicator of takeover defense level.
26
Kabir et al. (1997)’s study found that 90 percent of their 177 target Dutch firms have issued at least one takeover defense barrier. 29 percent of them have one defense mechanism, 35 percent have two and 27 percent have three or more. According to the vast difference of defense mechanism within each firm, it is quite difficult to measure takeover defense in an equal stage for all firms. So I adopt the method of De Jong (2002) which is to value one point to each firm once they have one of those three takeover defense barriers. If an observation does not have any barriers, then it is valued with a score of 0. Data of preferred shares, priority shares and share certificates are collected from “Gids bij de officiele prijscourant van Euronext Amsterdam”. To determine whether a firm’s preferred share functions as takeover defense, the following condition must be met: [statutory amount of preferences share capital (number of preference shares multiplied with the par value) – placed amount of preference share capital] > [placed amount of common share capital + placed amount of preference shares], or [het maatschappelijk preferente aandelenkapitaal (aantal preferente aandelen * nominale waarde per aandeel) – geplaatst preferente aandelenkapitaal] > geplaatste gewone aandelen + geplaatste preferente aandelen]. Once the condition is met, I score 1 for this observation’s preferred share dummy. However, there are different kinds of preferred shares such as cumulative preferred shares, convertible preferred shares, financing preferred shares etc. I do not apply those preferred shares whose functions are far from takeover defense as a takeover defense proxy, for example, financing preferred shares. Unlike the preferred shares, once priority shares (prioriteitsaandelen) or share certificates (certificaten) exist in a firm, its proxy of dummy variables can be scored 1 point immediately
3.4.4 Control variables Firm size (SIZE) Many researchers believe that larger firms are less likely to go bankrupt, thus have lower bankruptcy costs. They see firm size as one independent variable which is generated from trade-off theory and predict that: there is positive relationship between firm size and leverage (De Jong, 2002; Frank & Goyal, 2009). However, the financial crisis has shown us that large firms could indeed go bankrupt because of their out-of-control debts. Hence, I have doubt that larger firm size could result in low bankruptcy cost so that I do not treat firm size as an independent variable in this study but see it as control variable, just for eliminating any potential impact of firm size on our results. Most of researchers use either log of total assets or log of total sales to measure firm size. I choose the previous one as our measurement since it causes a smaller calculation results. Table 2 displays the definition of all variables in detail. Table 3 reports the means, medians, standard deviations, minimums and maximums of the variables of the Dutch listed non-financial firms over the period 2004-2009. Table 4 reports the descriptive statistic of observations that are employed in the regression.

27
Table 2. Definition of variables
Variables Definition Long-term debt ratio Long-term debt / Total assets Total debt ratio Total debt / Total assets
Non-debt Tax shields Operating income – interest payments – corporate income tax payments / corporate tax rate.
Profitability EBIT / Total assets (Frank & Goyal, 2009) Tangibility 1 Cash / Total assets Tangibility 2 Tangible fixed assets / Total assets
Business risks Standard deviation of operating income over pass 3 years (De Jong, 2002)
Growth opportunity Market-to-book ratio
Free cash flow EBIT+D&A-changes in working capital - CAPEX-EBIT* corporate tax rate
Preference share as take over defense Value with score of 1 for existence (De Jong, 2002) Priority share as take over defense Value with score of 1 for existence (De Jong, 2002) Share certificate as take over defense Value with score of 1 for existence (De Jong, 2002)
Firm size Logarithm of total assets (Frank & Goyal, 2009); (Degryse et al., 2009)
This table reports the definition of all variables. Corporate tax rate is 34.5% in the year of 2004, 31% in 2005, 29.6% in 2006, 25.5% in 2007 and 2008. Market to book value equals to (market capitalization / shareholders’ funds). Capital expenditure equals to (change of total asset – change of total debt). Variables are represented by the following notations in later tables: LTD/TA (Long-term debt ratio), TD/TA (Total debt ratio), TAX (Non-debt tax shield), PROF (Profitability), CASH/TA (Tangibility 1), FIX/TA (Tangibility 2), BUSR (Business risk), GROW (Growth opportunity), FREE (Free cash flow), PREF (Preference share), PRIO (Priority share), CERT (Share certificates).

Table 3. Descriptive statistics of all observation Mean Median St.dev. Min Max N LTD/TA 0.180 0.150 0.150 0.000 0.790 511 TD/TA 0.520 0.530 0.210 0.000 0.990 541 SIZE 5.470 5.510 1.060 -0.140 7.600 541 TAX 1.250 0.900 1.070 -3.930 12.420 473 PROF 0.040 0.060 0.490 -10.740 1.880 538 CASH/TA 0.080 0.030 0.130 0.000 0.990 478 FIX/TA 0.220 0.130 0.220 0.000 1.000 530 BUSR 0.240 0.050 0.640 0.000 6.650 403 GROW 2.820 1.270 2.800 0.190 31.920 366 FREE 0.070 0.030 1.020 -4.060 20.280 462 PREF 0.570 0.000 0.500 0.000 1.000 404 PRIO 0.220 0.000 0.410 0.000 1.000 404 CERT 0.150 0.000 0.360 0.000 1.000 404
The table reports the means, medians, standard deviations, minimums and maximums of the variables of the sample of Dutch listed non-financial firms over the period 2004-2009. The variables are defined in table 2.
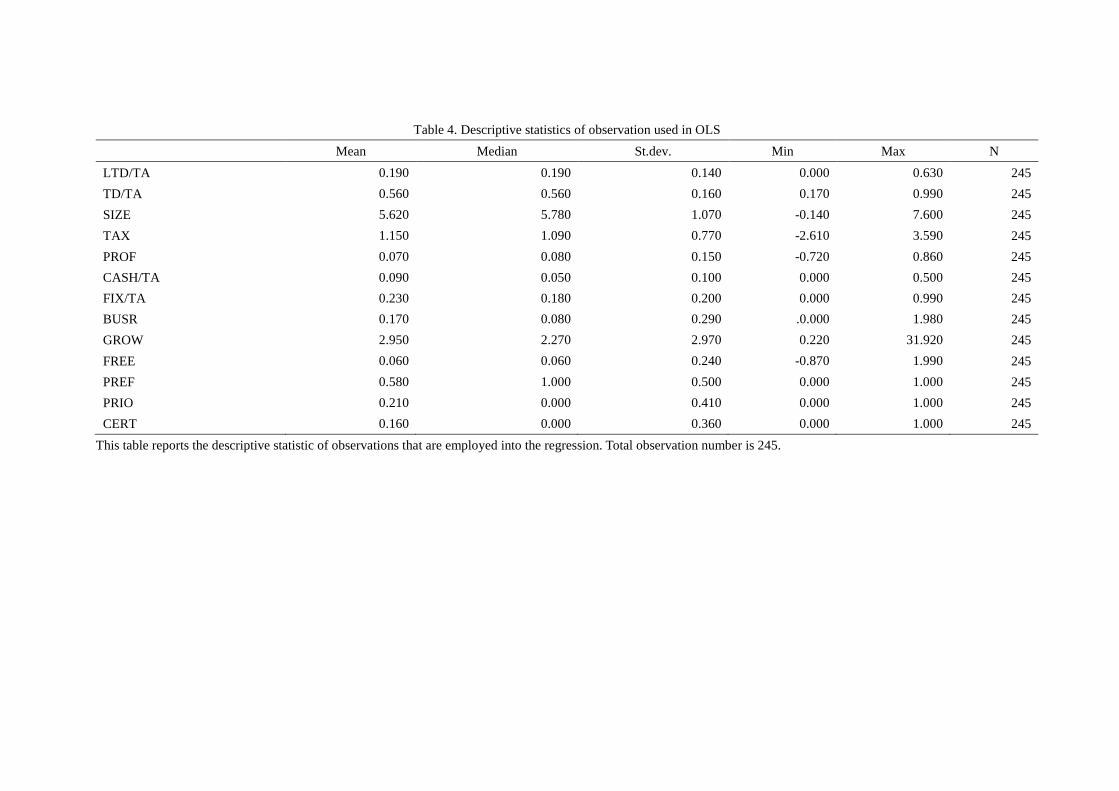
Table 4. Descriptive statistics of observation used in OLS Mean Median St.dev. Min Max N LTD/TA 0.190 0.190 0.140 0.000 0.630 245 TD/TA 0.560 0.560 0.160 0.170 0.990 245 SIZE 5.620 5.780 1.070 -0.140 7.600 245 TAX 1.150 1.090 0.770 -2.610 3.590 245 PROF 0.070 0.080 0.150 -0.720 0.860 245 CASH/TA 0.090 0.050 0.100 0.000 0.500 245 FIX/TA 0.230 0.180 0.200 0.000 0.990 245 BUSR 0.170 0.080 0.290 .0.000 1.980 245 GROW 2.950 2.270 2.970 0.220 31.920 245 FREE 0.060 0.060 0.240 -0.870 1.990 245 PREF 0.580 1.000 0.500 0.000 1.000 245 PRIO 0.210 0.000 0.410 0.000 1.000 245 CERT 0.160 0.000 0.360 0.000 1.000 245
This table reports the descriptive statistic of observations that are employed into the regression. Total observation number is 245.
3.5 Methods of analysis
For quantitative analysis, Ordinary Linear Squares (OLS) is commonly used in capital structure determinants studies (De Jong, 2002; Bie & Haan, 2007; De Jong et al., 2008; Frank & Goyal, 2009). In this article, I create four multiple linear regression models to test the hypotheses. The first model includes control variable – firm size only, to see if firm size affects capital structure for controlling purpose. The second model employs control variable and independent variables of Trade-off theory, to check if Trade-off theory stands within our sample. I then include control variable and independent variables from agency cost hypotheses and Dutch corporate governance feature. The last model employs control variable with all independent variable, to see whether all independent variables influence financial leverage as a whole. I use SPSS as our data analysis software to run and test these models.

31
4. Empirical results and discussion
4.1 Results
This section is to explain the results and analyze them to finalize a group of factors which do influence the capital structure the most. Table 5 shows the correlation matrix of all variables. Table 6 and Table 7 display the coefficient of all independent variables against two dependent variables under four models separately. Preliminary analyses are conducted to show that the residuals are normally distributed which means no violation of the assumptions of normality. Table 5 shows the correlation matrix of all variables. Firm size, non-debt tax shield, and tangibility (both CASH/TA, TFA/TA) are strongly correlated with the choice of leverage. Namely corr (LEVE, FIRM) = 0.393 (P < 0.01); corr (LEVE, TAX) = -0.169 (P < 0.01); corr (LEVE, CASH/TA) = -0.190 (P < 0.01); corr (LEVE, TFA/TA) = 0.287 (P <0.01). This result indicates that these four variables are the most significant factors of capital structure choice individually. The result also indicates that Non-debt tax shield and tangibility (CASH/TA) negatively correlated with financial leverage. The variables of profitability, free cash flow and priority have significant correlation with the dependent variable. Besides, the rest of variables have no significant impact on leverage separately. Among the independent variables, firm size and tangibility (both CASH/TA, TFA/TA) are significantly correlated with growth opportunity (P < 0.01); Non-debt tax shield are significantly correlated with profitability, two tangibility variables and business risks (P< 0.05). Correlations between profitability and business risks, free cash flow, preferred shares; the tangibility of CASH/TA and TFA/TA, business risks, growth opportunity and free cash flow; TFA/TA and business risks, growth opportunity, certificate; business risks and growth opportunity, free cash flow, certificate; growth opportunity and certificate are significant as well (P < 0.05). There is no high multicollinearity happening based on the correlation between independent variables. (corr < 0.7).

Table 5. Correlation between variables
LTD/TA SIZE TAXS PROF CASH/TA TFA/TA BUSR GROW FREE PREF PRIO CERT
LTD/TA 1.000
SIZE 0.393 1.000
***
TAX -0.169 -0.003 1.000
***
PROF -0.116 -0.111 0.275 1.000
** ** ***
CASH/TA -0.190 -0.089 -0.240 -0.057 1.000
*** * ***
FIX/TA 0.287 0.097 -0.126 0.071 -0.345 1.000
*** * ** ***
BUSR 0.037 -0.086 -0.386 -0.326 0.359 -0.197 1.000
* *** *** *** ***
GROW -0.018 -0.234 -0.013 0.063 0.151 -0.172 0.145 1.000
*** *** *** **
FREE 0.137 -0.056 0.053 -0.123 -0.160 0.037 -0.138 0.020 1.000
** ** *** **
PREF -0.030 -0.002 -0.050 0.126 0.021 -0.049 -0.060 -0.061 0.005 1.000
**
PRIO -0.140 -0.079 -0.013 0.071 0.081 -0.068 -0.039 -0.024 -0.035 -0.039 1.000 **
CERT -0.021 0.021 -0.085 -0.026 -0.102 0.164 -0.150 -0.136 -0.044 0.049 0.053 1.000 * * *** *** ** The table reports the t-test correlation between each variable of the regression. The variables are defined in table 2. Observation number is 245. The symbol***denotes that the parameter estimate is significant at 1% level, **is 5% level and * is 10% level

Table 6 displays the coefficient of independent variables against two variables of leverage under difference models. In table 6, firm size definitely makes strongly significant contribution for all four models (P < 0.01). In model 2, the tangibility of TFA/TA positively impacts the leverage the most and then non-debt tax shield makes significantly negative influence (H1 supported). The rest variables in Model 2 are all not significant factors on the determination of leverage. In Model 3, free cash flow and priority statistically significantly contribute to the choice of leverage with opposite direction (Beta=0.095;-0.048). (H6 supported). Model 4 is formed from the integration of two theories, which results there are four significant variables contribution to the choice of leverage, namely tax shield, two tangibility variables and free cash flow. (P < 0.05) Among all, there are significantly positive effects on leverage from TFA/TA and free cash flow, which are opposite to tax shield and tangibility of CASH/TA. So hypothesis 3 is supported with the measurement of TFA/TA, but rejected when I measure tangibility with CASH/TA. The variable of TFA/TA is the most important factor to the determinant of leverage. In contrast, priority is not significant element any more. Consequently, two tangibility variables and free cash flow are the most important factors (Beta = -0.206; 0.151; 0.081). Profitability, business risks, growth opportunity, preferred shares, priority shares and certificate shares are all not significant factors (H2, H4, H5 and H7 rejected). Within the four models, when the only variable of firm size is entered, the whole model explains 15.5% of the variance (R2=0.155). However, after the variables from Model 2, 3, and 4 are included, it shows that Model 2 as a whole occupies the most variance of 31.5%. Meanwhile, I perform a robustness analysis for the regressions with a different definition of leverage, namely the ratio of total debts over total assets (Table 7). I investigate the robustness over all four models. The results of LTD/TA and TD/TA are highly similar. Both the coefficients and their significance levels are hardly impacted by two kinds of leverage. So it can be confirmed that the main findings are robust to this test.
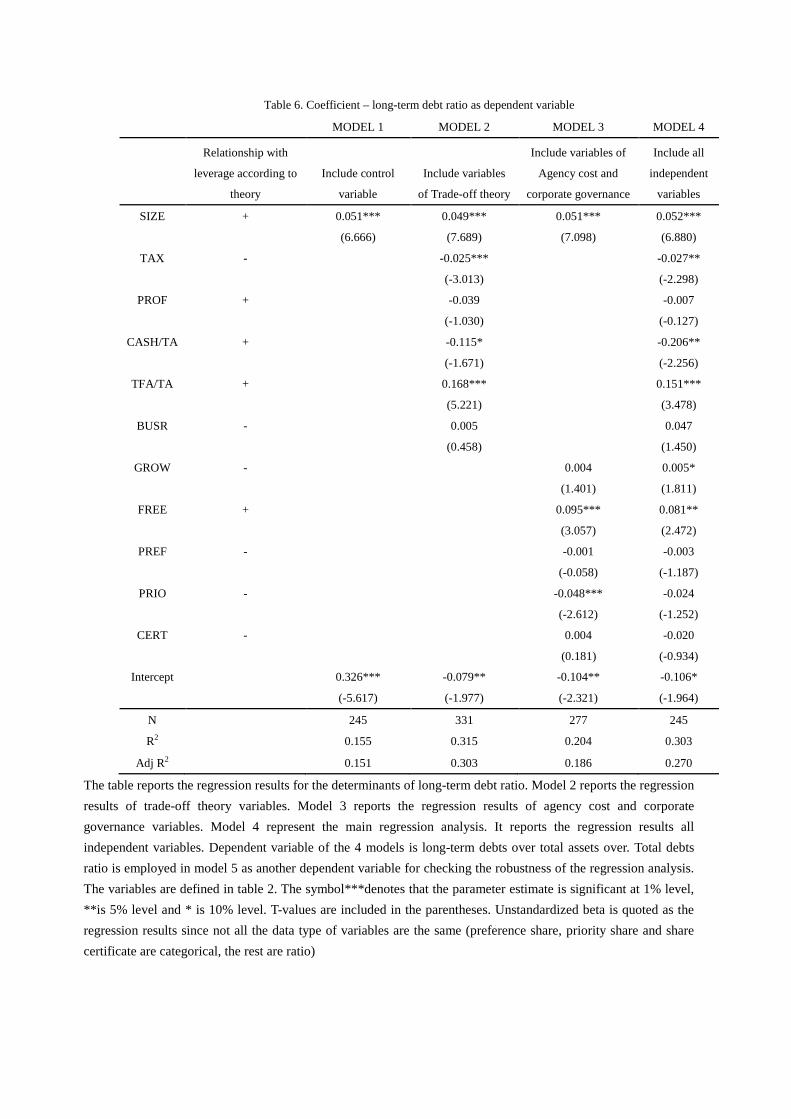
Table 6. Coefficient – long-term debt ratio as dependent variable
MODEL 1 MODEL 2 MODEL 3 MODEL 4
Relationship with
leverage according to
theory
Include control
variable
Include variables
of Trade-off theory
Include variables of
Agency cost and
corporate governance
Include all
independent
variables
SIZE + 0.051*** 0.049*** 0.051*** 0.052***
(6.666) (7.689) (7.098) (6.880)
TAX - -0.025*** -0.027**
(-3.013) (-2.298)
PROF + -0.039 -0.007
(-1.030) (-0.127)
CASH/TA + -0.115* -0.206**
(-1.671) (-2.256)
TFA/TA + 0.168*** 0.151***
(5.221) (3.478)
BUSR - 0.005 0.047
(0.458) (1.450)
GROW - 0.004 0.005*
(1.401) (1.811)
FREE + 0.095*** 0.081**
(3.057) (2.472)
PREF - -0.001 -0.003
(-0.058) (-1.187)
PRIO - -0.048*** -0.024
(-2.612) (-1.252)
CERT - 0.004 -0.020
(0.181) (-0.934)
Intercept 0.326*** -0.079** -0.104** -0.106*
(-5.617) (-1.977) (-2.321) (-1.964)
N 245 331 277 245
R2 0.155 0.315 0.204 0.303
Adj R2 0.151 0.303 0.186 0.270
The table reports the regression results for the determinants of long-term debt ratio. Model 2 reports the regression results of trade-off theory variables. Model 3 reports the regression results of agency cost and corporate governance variables. Model 4 represent the main regression analysis. It reports the regression results all independent variables. Dependent variable of the 4 models is long-term debts over total assets over. Total debts ratio is employed in model 5 as another dependent variable for checking the robustness of the regression analysis. The variables are defined in table 2. The symbol***denotes that the parameter estimate is significant at 1% level, **is 5% level and * is 10% level. T-values are included in the parentheses. Unstandardized beta is quoted as the regression results since not all the data type of variables are the same (preference share, priority share and share certificate are categorical, the rest are ratio)

Table 7. Coefficient – total debt ratio as dependent variable
MODEL 1 MODEL 2 MODEL 3 MODEL 4
Relationship with
leverage according to
theory
Include control
variable
Include variables
of Trade-off theory
Include variables of
Agency cost and
corporate governance
Include all
independent
variables
SIZE + 0.039*** 0.044*** 0.046*** 0.041***
(3.862) (5.209) (4.668) (4.113)
TAX - 0.039*** 0.048***
(3.400) (3.095)
PROF + -0.214*** -0.168**
(-4.098) (-2.197)
CASH/TA + -0.303*** -0.386***
(-3.334) (-3.280)
TFA/TA + -0.049*** -0.067
(-1.118) (-1.136)
BUSR - -0.012 0.05
(-0.822) (1.149)
GROW - 0.007* 0.008**
(1.958) (2.103)
FREE + 0.117*** 0.055
(2.721) (1.230)
PREF - 0.025 0.024
(1.196) (1.114)
PRIO - -0.021 0.012
(-0.836) (0.459)
CERT - -0.026 -0.032
(-0.896) (-1.085)
Intercept 0.326*** 0.310*** 0.249*** 0.274***
(5.617) (5.736) (4.045) (3.769)
N 245 338 282 245
R2 0.056 0.191 0.109 0.194
Adj R2 0.053 0.176 0.09 0.157
The table reports the regression results for the determinants of Total debt ratio. Model 2 reports the regression results of trade-off theory variables. Model 3 reports the regression results of agency cost and corporate governance variables. Model 4 represent the main regression analysis. It reports the regression results all independent variables. Dependent variable of the 4 models is long-term debts over total assets over. Total debts ratio is employed in model 5 as another dependent variable for checking the robustness of the regression analysis. The variables are defined in table 2. The symbol***denotes that the parameter estimate is significant at 1% level, **is 5% level and * is 10% level. T-values are included in the parentheses. Unstandardized beta is quoted as the regression results since not all the data type of variables are the same (preference share, priority share and share certificate are categorical, the rest are ratio).

The multicollinearity is checked among the independent variables. I looked at the correlation table and VIF data which shows no correlation is over 0.7 and all VIF data is less than 10. That means no high multicollinearity exists in all four models (Tabachnick & Fidell, 2007). Afterwards, outliers are also checked. According to Tabachnick and Fidell (2007), I first take a look at the scatter plot. Several residuals are considered as outliers when they appear outside the area of -3.3 to 3.3 either horizontally and vertically. Then I take a look at the table titled Casewise Diagnostics. This table presents the cases that have standardized residual values above 3.0 or below -3.0. To check whether these cases are having strange influence on the results for the whole models, I look at the value for Cook’s Distance. Cases with the value larger than 1 indicate a potential problem. So I delete the offending cases and obtain the ultimate observation group. Heteroscedasticity is tested through visual examination of residuals. I first look at the Histogram of residuals. The residuals are pretty much normal distributed. Then I look at the normal probability plot of residuals. The plots are quite consistently lying in the straight line. Last but not least, it is necessary to look at the scatter-plot of residuals. The plots are normal distributed but slightly “fans out”. There is evidence of heteroscedasticity if “fan out” occurs. But since the “fan out” in this graph is slight, I decide to not to treat it as an evidence of heteroscedasticity. This decision can cause bias of the regression result and it will be mentioned in the limitation of this paper.
4.2 Discussion
According to the above analysis of results, the residuals demonstrate a normal distribution about DV scores. Firm size as control variable does highly positively influence the choice of financial leverage. The larger the Dutch firms, the more possibility the company can choose debt financing. Under trade-off theory, the negative relationship between tangibility of CASH/TA and long-term debt ratio demonstrates that companies with high proportion of cash to total assets issue less debt which contradicts the previous literatures, but the result can be explained that the company has enough cash so that it is not necessary to issue debt. However, profitability has no significant impact on the choice of capital structure, which is violated with the opinion of Kayhan and Titman (2007). Under the theory of agency cost and corporate governance, the results do not show there is a significant relationship between growth opportunity and leverage. But it is confirmed when Dutch firms has free cash flows, they are much likely to over invest so that finance more debts (Grossman and Haart, 1982; Jensen, 1986; De Jong, 2002). However, the effects of priority shares only exist under this theory.
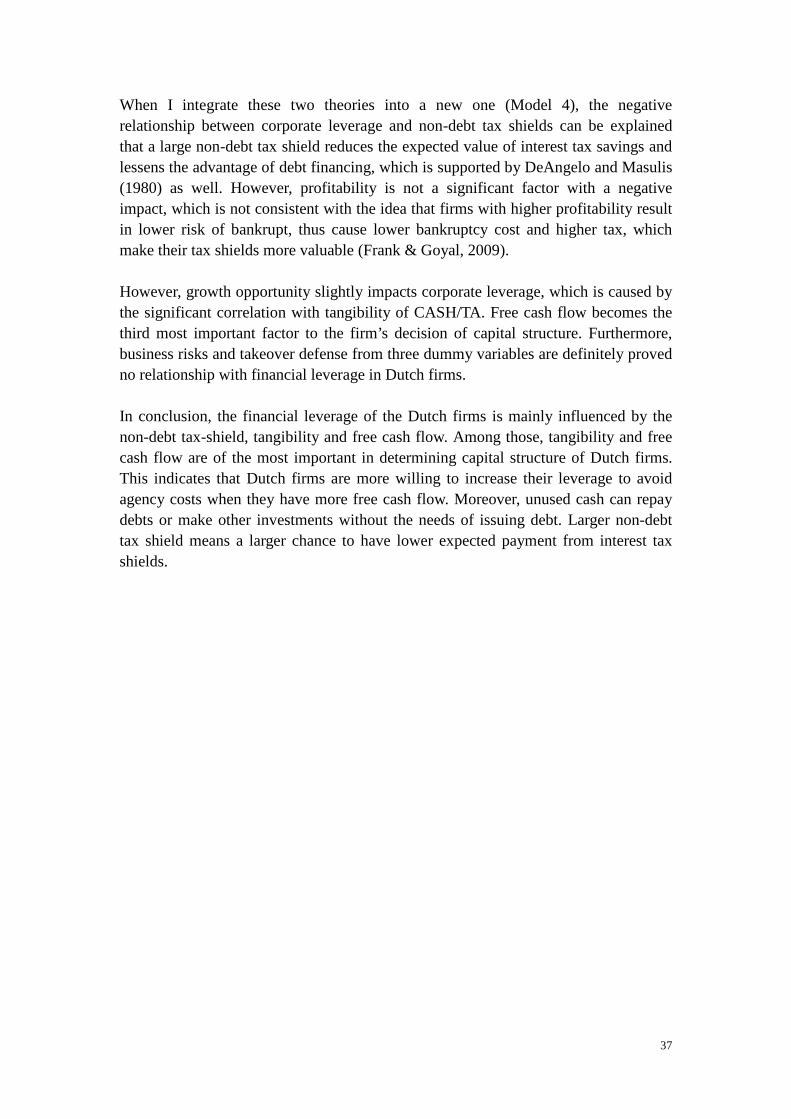
37
When I integrate these two theories into a new one (Model 4), the negative relationship between corporate leverage and non-debt tax shields can be explained that a large non-debt tax shield reduces the expected value of interest tax savings and lessens the advantage of debt financing, which is supported by DeAngelo and Masulis (1980) as well. However, profitability is not a significant factor with a negative impact, which is not consistent with the idea that firms with higher profitability result in lower risk of bankrupt, thus cause lower bankruptcy cost and higher tax, which make their tax shields more valuable (Frank & Goyal, 2009). However, growth opportunity slightly impacts corporate leverage, which is caused by the significant correlation with tangibility of CASH/TA. Free cash flow becomes the third most important factor to the firm’s decision of capital structure. Furthermore, business risks and takeover defense from three dummy variables are definitely proved no relationship with financial leverage in Dutch firms. In conclusion, the financial leverage of the Dutch firms is mainly influenced by the non-debt tax-shield, tangibility and free cash flow. Among those, tangibility and free cash flow are of the most important in determining capital structure of Dutch firms. This indicates that Dutch firms are more willing to increase their leverage to avoid agency costs when they have more free cash flow. Moreover, unused cash can repay debts or make other investments without the needs of issuing debt. Larger non-debt tax shield means a larger chance to have lower expected payment from interest tax shields.
38
5. Conclusion
This thesis uses Ordinary Linear Squares (OLS) to empirically test the determinants of capital structure choice of Dutch firms. I include trade-off theory, agency costs hypotheses and the new model from the integration of these two with consideration of Dutch institutional settings. Our empirical results shed many valuable insights on the Dutch firms’ capital structure. In particular, profitability is not a significant factor any more. In other word, a firm can not make choice of leverage based on the extent of profitability. Moreover, takeover defense is not certified its impact to corporate leverage within Dutch firms. Only when considering the variables under agency costs and corporate governance, priority shares negatively relate to the choice of leverage. The important influence of free cash flow verifies that Dutch firms prefer to avoid agency costs by increasing their leverage. Adequate cash prevents firms to issue debts. In general, business risks, growth opportunity and takeover defense are not significant factors in Dutch environment. It is inevitable that there is several limitation worth to mention here. The first, I do not involve variables of pecking order, market timing as into the empirical model. These variables could be influential factors for leverage as well. The second, many data of each variable are missed. So the number of observations cannot fully represent duration of 5 years. The third, although there is evidence of Heteroscedasticity, I still decide to ignore it. So the OLS model that I used may not be the most appropriate method. For further research, the focus could be to (1) aggregate more possible influential factors from other capital structure theories; (2) update the data from more recent years; (3) adopt several analytical methods rather than using only one method.

39
References
Abor, J (2007), “Corporate governance and financing decisions of Ghanaian listed firms”, Corporate Governance, 7 (1), 83 – 92. Altman, E., (1984), “A Further Empirical Investigation of Bankruptcy Costs Question,” The Journal of Finance, 39(4), 1067-1089. Villamil, A. P. (2008), “Modigliani–Miller theorem”. From The New Palgrave Dictionary of Economics, Second Edition. Baker, M. & Wurgler, J. (2002), “Market timing and capital structure”. The Journal of Finance, 57 (1), 1-32. Barry, C. B., Mann S.C., Mihov, V. T. and Rodriguez, M. (2008), “Corporate debt issuance and the historical level of interest rates”. Financial Management, 37(3), 413-430. Baxter, N., (1967), “Leverage, Risk of Ruin and the Cost of Capital”. The Journal of Finance 22(3), 395-403. Berger, P., E. Ofek, D. Yermack (1997), “Managerial entrenchment and capital structure decisions”, The Journal of Finance, 52 (4), 1411-1438. Bie, T., Haan, L. (2007), “Market timing and capital structure: Evidence for Dutch firms”, De Economist, 155(2), 183-206. Brealey, R. A., Myers, S. C. & Allen, F. (2005), “Principles of Corporate Finance”, 8th ed. McGraw-Hill/Irwin. Brounen, D., De Jong, A., & Koedijk, K. (2006), “Capital structure policies in Europe: Survey evidence”. Journal of Banking & Finance, 30 (5), 1409-1442. Castanias, R. (1983), “Bankruptcy risk and optimal capital structure”. The Journal of Finance, 38 (5), 1617-1635 Chen, L. H. & Jiang, G. J. (2001), “The determinants of Dutch capital structure choice”. SOM-Theme E.

40
Danisevska, P., A. De Jong & M. Rosella (2004), “Disciplining managers: Evidence from two-tier boards”, working paper. DeAngelo, H., and R.W. Masulis (1980), “Optimal Capital Structure under Corporate and Personal Taxation,” Journal of Financial Economics, 8(1), 3-29. De Jong, A. & Veld, C. (1999), “Unilever's superdividend”. Economisch-Statistische Berichten, 163-163. De Bie, T. & De Haan, L. (2007), “Market timing and capital structure: Evidence for Dutch firms”. De Economist, 155 (2), 183-206. De Haan, L. & Hinloopen, J. (2003), “Preference hierarchies for internal finance, bank loans, bond, and share issues: evidence for Dutch firms”. Journal of Empirical Finance, 10 (5), 661-681. De Jong, A. & Veld, C. (2001), “An empirical analysis of incremental capital structure decisions under managerial entrenchment”. Journal of Banking & Finance, 25 (10), 1857-1895. De Jong, A. d., Kabir, R., & Nguyen, T. T. (2008), “Capital structure around the world: The roles of firm- and country-specific determinants”. Journal of Banking & Finance, 32 (9), 1954-1969. De Jong, A., Verbeek, M. & Verwijmeren, P. (2011), “Firms’ debt-equity decisions when the static tradeoff theory and the pecking order theory disagree”. Journal of Banking & Finance, 35 (5), 1303-1314. De Jong, A. (2002), “The disciplining role of leverage in Dutch firms”. European Finance Review, 6 (1), 31-62. Degryse, H. & De Jong, A. (2006), “Investment and internal finance: Asymmetric information or managerial discretion?”. International Journal of Industrial Organization, 24 (1), 125-147. Degryse, H., De Goeij, P. & Kappert, P. (2009), “The impact of firm and industry characteristics on small firms’ capital structure: evidence from Dutch panel data”. European Banking Center Discussion Paper, no. 2009-03. Frank, M. Z., and Goyal, V. K. (2007), “Corporate leverage: How much do managers really matter?”. Working Paper. Frank, M. Z., & Goyal, V. K. (2009), “Capital structure decisions: Which factors are reliably important?”. Financial Management, 38 (1), 1-37.
41
Grossman, S. J. and Hart, O. (1982), “Corporate financial structure and managerial incentives”. In: McCall, J. (Ed.) The economics of information and uncertainty. University of Chicago Press, Chicago. Gruber, M. J. & Warner, J. B. (1977), “Bankruptcy costs: Some evidence”. The Journal of Finance, 32 (2), 337–347. Harvey, C. R., Lins, K. V. & Roper, A. H. (2004), “The effect of capital structure when expected agency costs are extreme”. Journal of Financial Economics, 74 (1), 3-30. Jensen, M. C. (1986), “Agency costs of free cash flow, corporate finance and takeovers”. American Economic Review, 76 (2), 323 – 339. Jensen, M. C. & Meckling, W. (1976), “Theory of the firm: Managerial behavior, agency costs, and ownership structure”. Journal of Financial Economics, 3 (4), 305 – 360. Kabir, R., Cantrijn, D., and Jeunink, A. (1997), “Take over defenses, ownership structure and stock returns in the Netherlands: An empirical analysis”. Strategic Management Journal, 18 (2), 97-109. Kayhan, A. & Titman, S. (2007), “Firms' histories and their capital structure”. Journel of Financial Economics, 83 (1), 1-32. Keasey, K, Thompson, S & Wright, M (1997), “Introduction: The Corporate Governance Problem-Competing Diagnoses and Solutions” In Keasey, K., Thompson, S. and Wright, M. (Eds.), Corporate Governance: Economics, Management, and Financial Issues. Oxford University Press, Oxford, UK. Kraus, A. & Litzenberger, R. H. (1973), “A state-preference model of optimal financial leverage”. Journal of Finance, 28 (4), 23-34. Litzenberger, R. H. (1986), “Some Observations on Capital Structure and the Impact of Recent Recapitalizations on Share Prices”. Journal of Financial and Quantitative Analysis, 21 (1), 59-71 Miller, M. H., & Modigliani, F. (1961), “Dividend Policy, Growth and the Valuation of Shares”. The Journal of Business, 34 (4), 411-433. Miller, M. H. (1977). Debt and Taxes. Journal of Finance, 32, 261-75. Modigliani, F. & Miller, M. H. (1958), “The cost of capital, corporation finance and the theory of investment”. The American Academic Review, 48 (3), 261 – 297.
42
Modigliani, F. & Miller, M. H. (1963), “Corporate Income Taxes and the Cost of Capital: A Correction”. The American Economic Review, 53 (3), 433-443. Myers, S. C. & Majluf, C. S. (1984), “Corporate financing and investment decisions when firms have information that investors do not have”. Journal of Financial Economics, 13 (2), 187 – 221. Ritter, J. R. and Warr, R. S. (2002), “The decline of inflation and the bull market of 1982 -1999”. Journal of Financial and Quantitative Analysis, 37 (1), 29-61. Roosenboom, P. and van der Goot, T. (2003), “Takeover defenses and IPO firm value in the Netherlands”. European Financial Management 9, 485-512 Ross, S. A., Westerfield, R. W., Jaffe, J. F., & Jordan, B. D (2008), “Modern financial management”. McGraw-Hill. Saunders & Myers (1999), “Testing static tradeoff against pecking order models of capital structure”. Journal of Financial Economics, 51 (2), 219-244. Stiglitz, J. E. (1969), “A Re-Examination of the Modigliani-Miller Theorem”. American Economic Review, American Economic Association, 59(5), 784-793. Stone B. K. (1977), “Bankruptcy Costs: Some Evidence: Discussion”. The Journal of Finance, 32 (2). 366-368. Tabachnick, B. G., & Fidell, L. S. (2007), “Using multivariate statistics (5th ed.)”. Upper Saddle River, NJ: Pearson Allyn & Bacon. Titman, S. and Wessels, R. “The Determinants of Capital Structure Choice.” Journal of Finance, 43(1988), 1-19. Wen, Y., Rwegasira, K. & Bilderbeek, J., (2002), “Corporate Governance and CapitalStructure Decisions of Chinese Listed Firms”. Corporate Governance: An International Review, 10 (2), 75-83.