Where's my bot? - NOAA Ocean...
17
FOCUS Marine navigation GRADE LEVEL 9-12 (Earth Science/Mathematics) FOCUS QUESTION What are some workable solutions to typical problems involved with the design of practical underwater robots? LEARNING OBJECTIVES Students will estimate geographic position based on speed and direction of travel. Students will integrate geographic position esti- mates with GPS data to estimate the set and drift of currents. MATERIALS Rulers or dividers for measuring distance Parallel rules or two drafting triangles for trans- ferring course lines to a compass rose Copies of “Student Worksheet on Dead Reckoning and Navigation with Nautical Charts;” one copy for each student group AUDIO/VISUAL MATERIALS None T EACHING TIME Two or three 45-minute class periods, plus time for students to complete their projects SEATING ARRANGEMENT Groups of 2-4 students MAXIMUM NUMBER OF STUDENTS 32 KEY WORDS Coral reef Bonaire Robot AUV Navigation Dead reckoning Set Drift BACKGROUND INFORMATION Coral reefs provide habitats for some of the most diverse biological communities on Earth. Most people have seen photographs and video images of shallow-water coral reefs, and many have vis- ited these reefs in person. Historically, scientists have believed that reef-building corals were con- fined to relatively shallow depths because many of these corals have microscopic algae called zooxanthellae (pronounced “zoh-zan-THEL-ee”) liv- ing inside their soft tissues. These algae are often important for the corals’ nutrition and growth, but require sunlight for photosynthesis. The maxi- mum depth for reef-building corals was assumed to be about 150 m, since light levels below this depth are not adequate to support photosynthesis. Recently, though, ocean explorers have discovered extensive mounds of living coral in depths from 400 m to 700 m—depths at which there is virtu- Bonaire 2008: Exploring Coral Reef Sustainability with New Technologies Expedition Where’s My Bot?
Transcript of Where's my bot? - NOAA Ocean...

�
Focus
Marine navigation
Grade LeveL 9-12 (Earth Science/Mathematics)
Focus Question
What are some workable solutions to typical problems involved with the design of practical underwater robots?
LearninG objectives
Students will estimate geographic position based on speed and direction of travel.
Students will integrate geographic position esti-mates with GPS data to estimate the set and drift of currents.
MateriaLs
Rulers or dividers for measuring distance Parallel rules or two drafting triangles for trans-
ferring course lines to a compass rose Copies of “Student Worksheet on Dead
Reckoning and Navigation with Nautical Charts;” one copy for each student group
audio/visuaL MateriaLs
None
teachinG tiMe
Two or three 45-minute class periods, plus time for students to complete their projects
seatinG arranGeMent
Groups of 2-4 students
MaxiMuM nuMber oF students
32
Key Words
Coral reefBonaireRobotAUVNavigationDead reckoningSetDrift
bacKGround inForMation
Coral reefs provide habitats for some of the most diverse biological communities on Earth. Most people have seen photographs and video images of shallow-water coral reefs, and many have vis-ited these reefs in person. Historically, scientists have believed that reef-building corals were con-fined to relatively shallow depths because many of these corals have microscopic algae called zooxanthellae (pronounced “zoh-zan-THEL-ee”) liv-ing inside their soft tissues. These algae are often important for the corals’ nutrition and growth, but require sunlight for photosynthesis. The maxi-mum depth for reef-building corals was assumed to be about 150 m, since light levels below this depth are not adequate to support photosynthesis. Recently, though, ocean explorers have discovered extensive mounds of living coral in depths from 400 m to 700 m—depths at which there is virtu-
Bonaire 2008:Exploring Coral Reef Sustainability with New Technologies
Expedition
Where’s My Bot?

�
Bonaire 2008: Exploring Coral Reef Sustainability with New Technologies ExpeditionFocus: Marine navigation – Grades 9-12 (Earth Science/Mathematics) oceanexplorer.noaa.gov
ally no light at all! These deep-water corals do not contain zooxanthellae, and do not build the same types of reef that are produced by shallow-water corals. But recent studies indicate that the diversity of species in deep-water coral ecosystems may be comparable to that of coral reefs in shallow waters, and that there are just as many species of deep-water corals (slightly more, in fact) as there are species of shallow-water corals.
Coral reefs provide a variety of benefits includ-ing value for recreation and tourism industries, protecting shorelines from erosion and storm dam-age, supplying foods that are important to many coastal communities, and providing promising sources of powerful new antibiotic, anti-cancer and anti-inflammatory drugs (for more information about drugs from the sea, visit the Ocean Explorer Web site for the 2003 Deep Sea Medicines Expedition (http://oceanexplorer.noaa.gov/explorations/03bio/welcome.html). Despite their importance, many of Earth’s coral reefs appear to be in serious trouble due to causes that include over-harvesting, pol-lution, disease, and climate change (Bellwood et al., 2004). In the Caribbean, surveys of 302 sites between 1998 and 2000 show widespread recent mortality among shallow- (≤ 5 m depth) and deep-water (> 5 m depth) corals. Remote reefs showed as much degradation as reefs close to human coastal development, suggesting that the decline has probably resulted from multiple sources of long-term as well as short-term stress (Kramer, 2003; for additional information about threats to coral reefs, see “More About the Coral Reef Crisis” in the introduction to this Expedition Education Module).
Despite these kinds of data and growing concern among marine scientists, visitors continue to be thrilled by the “abundance and diversity of life on coral reefs.” This paradox is an example of “shift-ing baselines,” a term first used by fishery biolo-gist Daniel Pauly. A baseline is a reference point that allows us to recognize and measure change. It’s how certain things are at some point in time.
Depending upon the reference point (baseline), a given change can be interpreted in radically dif-ferent ways. For example, the number of salmon in the Columbia River in 2007 was about twice what it was in the 1930s, but only about 20% of what is was in the 1800s. Things look pretty good for the salmon if 1930 is the baseline; but not nearly as good compared to the 1800’s. The idea is that some changes happen very gradually, so that we come to regard a changed condition as “normal.” When this happens, the baseline has shifted. Shifting baselines are a serious problem, because they can lead us to accept a degraded ecosystem as normal—or even as an improvement (Olson, 2002). So, people who have never seen a coral reef before may still find it to be spectacu-lar, even though many species have disappeared and the corals are severely stressed.
One of the few coral systems that seems to have escaped the recent coral reef crisis is found in the coastal waters of Bonaire (part of the Netherlands Antilles in the southwestern Caribbean). A 2005 survey of the state of Bonaire’s reefs (Steneck and McClanahan, 2005) found that they were among the healthiest reefs in the Caribbean, even though dramatic changes have occurred among corals and other reef species. This means that Bonaire’s reefs have unique importance as base-lines for comparison with other Caribbean coral reef ecosystems. Detailed mapping of Bonaire’s shallow- and deep-water coral reefs is a top prior-ity for protecting these ecosystems, as well as for defining a baseline for investigating and possibly restoring other coral reef systems. This map-ping is the focus of the Bonaire 2008: Exploring Coral Reef Sustainability with New Technologies Expedition.
The technological centerpiece of the Bonaire 2008: Exploring Coral Reef Sustainability with New Technologies Expedition is a collection of underwater robots known as Autonomous Underwater Vehicles (AUVs). AUVs operate with-out a pilot or cable to a ship or submersible. This

�
oceanexplorer.noaa.govBonaire 2008: Exploring Coral Reef Sustainability with New Technologies Expedition
Focus: Marine navigation – Grades 9-12 (Earth Science/Mathematics)
independence allows AUVs to cover large areas of the ocean floor, as well as to monitor a spe-cific underwater area over a long period of time. Typical AUVs can follow the contours of underwa-ter mountain ranges, fly around sheer pinnacles, dive into narrow trenches, take photographs, and collect data and samples. These capabilities will make it possible to map and study the coral reefs of Bonaire in much greater detail than has been possible with surveys that relied solely on the capabilities of human divers. An additional ben-efit of AUVs is that they are much less expensive to operate than manned submersibles.
The AUVs used on the Bonaire Expedition will provide scientists with video and sonar images. To use these data to create maps of the reefs, it is essential to be able to assign an accurate geo-graphic position to each image. Modern global positioning system (GPS) technology can accu-rately determine the location of a GPS receiver on Earth’s surface, but ordinary GPS signals can-not be received underwater (for more about GPS, visit http://oceanservice.noaa.gov/topics/navops/positioning/welcome.html). During the Bonaire Expedition, the geographic position of AUVs on the sea surface will be determined with GPS receivers. When the AUVs are underwater, their geographic position will be calculated from the speed of the AUV and direction of travel. This method of calculating geo-graphic position is known as “dead reckoning.”
In this activity, students will use dead reckoning techniques to calculate the geographic position of an AUV during a simulated dive, as well as to estimate the set and drift of currents affecting the AUV’s position.
LearninG Procedure [NOTE: Portions of this lesson are adapted from the National Ocean Service Discovery Classroom Lesson, “Plot Your Course” (http://oceanservice.noaa.gov/education/classroom/lessons/18_marinenav_plotcourse.pdf)]
1. To prepare for this lesson, review the intro-ductory essays for the Bonaire 2008: Exploring Coral Reef Sustainability with New Technologies Expedition at http://oceanexplorer.noaa.gov/explorations/08bonaire/welcome.html.
If you are not already familiar with coral reefs,
you may also want to review the coral reef tutorials at nos.noaa.gov/education/kits/corals/, as well as essays and trip logs from the 2007 Cayman Island Twilight Zone Expedition (http://oceanex-plorer.noaa.gov/explorations/07twilightzone/welcome.html).
Review “Student Worksheet on Dead Reckoning and Navigation with Nautical Charts,” and work through the dead reckoning calculations.
2. Discuss the importance of coral reefs, and reasons that they are threatened. Discuss the importance of monitoring to identify threatened reef areas and to establish baselines for assess-ing changes in reef structure and functions.
Lead an introductory discussion of the Bonaire 2008: Exploring Coral Reef Sustainability with New Technologies Expedition, and the role of underwater robots on the expedition. Briefly discuss the advantages and disadvantages of underwater robots compared to free divers or manned submersibles. You may want to show students some images from the Ocean Explorer Web sites (oceanexplorer.noaa.gov/gallery/livingocean/liv-ingocean_coral.html).
3. Provide each student group with a copy of the “Student Worksheet on Dead Reckoning and Navigation with Nautical Charts.” Tell students that their assignment is to interpret data to establish the position of an underwater robot during a survey of coral reefs on the coast of Bonaire. You may want to work through the example with the entire class to ensure that the basic concepts are understood. Be sure students distinguish between dead reckoning positions, which are estimates of the true geographic posi-

�
Bonaire 2008: Exploring Coral Reef Sustainability with New Technologies ExpeditionFocus: Marine navigation – Grades 9-12 (Earth Science/Mathematics) oceanexplorer.noaa.gov
tion, and fixes which are more accurate (but still subject to errors) position estimates. You may also want to mention that velocity is a vector quantity that includes direction as well as speed.
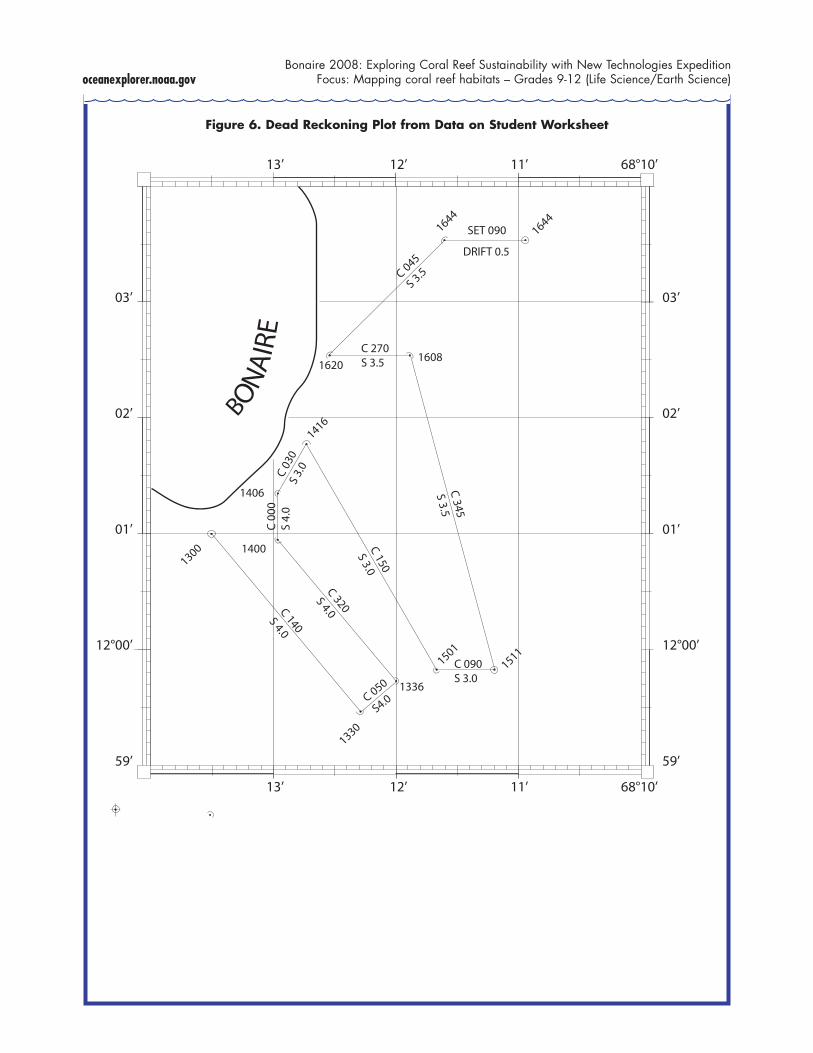
4. Evaluate and discuss students’ results, using Figure 6 as an answer key. Tell students that dead reckoning plots for AUVs are normally accomplished by computers that analyze course and speed data, and make corrections based on GPS fixes; but the basic principles are the same as those used in this exercise. You may also want to discuss other factors (in addition to currents) that could cause dead reckoning posi-tions to differ from actual geographic position. These include set and drift due to wind (only relevant near the sea surface), errors in deter-mining course and speed, and errors inherent in GPS technology (visit http://oceanservice.noaa.gov/topics/navops/positioning/welcome.html for more about GPS).
the bridGe connection
www.vims.edu/bridge/ – In the “Site Navigation” menu on the left, click “Ocean Science Topics,” then “Human Activities,” then “Technology” for links to resources about submersibles, ROVs, and other technologies used in underwater exploration.
the “Me” connection Have students write a brief essay describing how knowing how to compute a geographic position based on velocity (or course and speed) could be of personal benefit. You may also want to invite students to describe their own experiences with using GPS to determine geographic position, and explain why it might be important to have more than one way to establish geographic position.
connections to other subjects
English/Language Arts, Mathematics
evaLuation
Worksheet results and essays (if assigned) pro-vide opportunities for assessment.
extensions 1. Visit oceanexplorer.noaa.gov to keep up to date
with the latest Bonaire 2008: Exploring Coral Reef Sustainability with New Technologies Expedition discoveries.
2. The National Ocean Service Coral Reef Discovery Kit (http://oceanservice.noaa.gov/education/kits/corals/welcome.html) contains a variety of other coral reef-related lessons, information, and activities.
3. Discuss the concept of “shifting baselines,” and why this is relevant to environmental and con-servation issues. Brainstorm examples of shifting baselines from students’ own experience. You may also want to visit http://www.shiftingbaselines.org/index.php for more information about this concept and its relevance to ocean conservation.
4. Discuss the “coral reef crisis” and what students might do to help protect and restore coral reefs. Visit http://www.coralreef.noaa.gov/outreach/thingsyoucando.html and http://www.publicaffairs.noaa.gov/25list.html for ideas. A key concept is that the current envi-ronmental conditions on Earth are not the result of a single event or human action; they are the result of countless individual decisions that collectively can have huge—and often unfore-seen—impacts.
MuLtiMedia LearninG objects http://www.learningdemo.com/noaa/ – Click on the links to Lessons 3, 12, and 13 for interactive multi-media presentations and Learning Activities on Deep-Sea Corals, Food, Water, and Medicine from the Sea, and Ocean Pollution.
other reLevant Lesson PLans FroM the ocean exPLoration ProGraM
The Benthic Drugstorehttp://oceanexplorer.noaa.gov/explorations/07twilightzone/back-ground/edu/media/drugstore.pdf (8 pages; 278kb PDF) (from the 2007 Cayman Island Twilight Zone Expedition)

�
oceanexplorer.noaa.govBonaire 2008: Exploring Coral Reef Sustainability with New Technologies Expedition
Focus: Marine navigation – Grades 9-12 (Earth Science/Mathematics)
Focus: Pharmacologically-active chemicals derived from marine invertebrates (Life Science/Chemistry)
Students will be able to identify at least three pharmacologically-active chemicals derived from marine invertebrates, describe the disease-fighting action of at least three pharmacologically-active chemicals derived from marine invertebrates, and infer why sessile marine invertebrates appear to be promising sources of new drugs.
Watch the Screen!http://oceanexplorer.noaa.gov/explorations/07twilightzone/back-ground/edu/media/watchscreen.pdf (8 pages; 278kb PDF) (from the 2007 Cayman Island Twilight Zone Expedition)
Focus: Screening natural products for biological activity (Life Science/Chemistry)
In this activity, students will be able to explain and carry out a simple process for screening natural products for biological activity, and will be able to infer why organisms such as sessile marine invertebrates appear to be promising sources of new drugs.
Now Take a Deep Breathhttp://oceanexplorer.noaa.gov/explorations/07twilightzone/back-ground/edu/media/breath.pdf (8 pages; 278kb PDF) (from the 2007 Cayman Island Twilight Zone Expedition)
Focus: Physics and physiology of SCUBA diving (Physical Science/Life Science)
Students will be able to define Henry’s Law, Boyle’s Law, and Dalton’s Law of Partial Pressures, and explain their relevance to SCUBA diving; discuss the causes of air embolism, decompression sickness, nitrogen narcosis, and oxygen toxicity in SCUBA divers; and explain the advantages of gas mixtures such as Nitrox and Trimix and closed-circuit rebreather systems.
History’s Thermometers http://oceanexplorer.noaa.gov/explorations/02alaska/back-ground/edu/media/thermo9_12.pdf (5 pages, 80k) (from the 2002 Alaska Seamount Expedition)
Focus: Use of deep-water corals to determine long-term patterns of climate change (Physics)
In this activity, students will be able to explain the concept of paleoclimatological proxies, learn how oxygen isotope ratios are related to water temper-ature, and interpret data on oxygen isotope ratios to make inferences about climate and climate change in the geologic past.
Cut-off Genes http://oceanexplorer.noaa.gov/explorations/04mountains/back-ground/edu/media/MTS04.genes.pdf (12 pages, 648k) (from the Mountains in the Sea 2004 Expedition)
Focus: Gene sequencing and phylogenetic expressions (Life Science)
In this activity, students will be able to explain the concept of gene-sequence analysis; and, given gene sequence data, students will be able to draw inferences about phylogenetic similarities of different organisms.
Feeding in the Flow http://oceanexplorer.noaa.gov/explorations/03bump/background/edu/media/03cbfeedflow.pdf (6 pages, 268k) (from the 2003 Charleston Bump Expedition)
Focus: Effect of water currents on feeding efficien-cy in corals (Life Science)
In this activity, students will be able to describe at least two ways in which current flow may affect the feeding efficiency of particle-feeding organ-isms and explain how interactions between cur-rent flow and the morphology of a particle-feed-ing organism may affect the organism’s feeding efficiency. Students will also be able to identify at least two environmental factors in addition to cur-
�
Bonaire 2008: Exploring Coral Reef Sustainability with New Technologies ExpeditionFocus: Marine navigation – Grades 9-12 (Earth Science/Mathematics) oceanexplorer.noaa.gov
rent flow that may affect the morphology of reef-building corals.
Cool Corals http://oceanexplorer.noaa.gov/explorations/03edge/background/edu/media/cool.pdf (7 pages, 476k) (from the 2003 Life on the Edge Expedition)
Focus: Biology and ecology of Lophelia corals (Life Science)
In this activity, students will describe the basic morphology of Lophelia corals and explain the significance of these organisms, interpret prelimi-nary observations on the behavior of Lophelia polyps, and infer possible explanations for these observations. Students will also discuss why biological communities associated with Lophelia corals are the focus of major worldwide conser-vation efforts.
Keep It Complex! http://oceanexplorer.noaa.gov/explorations/03bump/background/edu/media/03cb_complex.pdf (5 pages, 272k) (from The Charleston Bump 2003 Expedition)
Focus: Effects of habitat complexity on biological diversity (Life Science)
In this activity, students will be able to describe the significance of complexity in benthic habitats to organisms that live in these habitats and will describe at least three attributes of benthic habi-tats that can increase the physical complexity of these habitats. Students will also be able to give examples of organisms that increase the structural complexity of their communities and infer and explain relationships between species diversity and habitat complexity in benthic communities.
Are You Related? http://oceanexplorer.noaa.gov/explorations/05deepcorals/back-ground/edu/media/05deepcorals_related.pdf (11 pages, 465k) (from the Florida Coast Deep Corals 2005 Expedition)
Focus: Molecular genetics of deepwater corals (Life Science)
In this activity, students will define “microsatellite markers” and explain how they may be used to identify different populations and species, explain two definitions of “species,” and describe pro-cesses that result in speciation. Students will also use microsatellite data to make inferences about populations of deep-sea corals.
How Does Your (Coral) Garden Grow? http://oceanexplorer.noaa.gov/explorations/03mex/background/edu/media/mexdh_growth.pdf (6 pages, 456k) (from the Gulf of Mexico Deep Sea Habitats 2003 Expedition)
Focus: Growth rate estimates based on isotope ratios (Life Science/Chemistry)
In this activity, students will identify and briefly explain two methods for estimating the age of hard corals, learn how oxygen isotope ratios are related to water temperature, and interpret data on oxygen isotope ratios to make inferences about the growth rate of deep-sea corals.
other LinKs and resources The Web links below are provided for informa-tional purposes only. Links outside of Ocean Explorer have been checked at the time of this page’s publication, but the linking sites may become outdated or non-operational over time.
oceanexplorer.noaa.gov – Web site for NOAA’s Ocean Exploration program
oceanexplorer.noaa.gov/gallery/livingocean/livingocean_coral.html – Ocean Explorer photograph gallery
Bellwood, D.R., T.P. Hughes, C. Folke, and M. Nyström. 2004. Confronting the coral reef crisis. Nature 429:827-833 (http://www.eco.science.ru.nl/Organisme%20&%20Milieu/PGO/PGO3/Bellwood.pdf)

�
oceanexplorer.noaa.govBonaire 2008: Exploring Coral Reef Sustainability with New Technologies Expedition
Focus: Marine navigation – Grades 9-12 (Earth Science/Mathematics)
Bohm, H. and V. Jensen. 1998. Build Your Own Programmable Lego Submersible: Project: Sea Angel AUV (Autonomous Underwater Vehicle). Westcoast Words. 39 pages.
Bohm, H. 1997. Build your own underwater robot and other wet projects. Westcoast Words. 148 pages.
Kramer, P. 2003. Synthesis of coral reef health indi-cators for the Western Atlantic: Results of the AGRRA program (1997-2000). In Lang, J.C. (ed.) 2003. Status of coral reefs in the Western Atlantic: results of initial surveys, Atlantic and Gulf Rapid Reef Assessment (AGRRA) program. Atoll Research Bulletin 496. 639 pp. Washington, DC. (http://www.botany.hawaii.edu/faculty/duffy/arb/496/Synthesis.pdf)
Olson, R. 2002. Slow-motion disaster below the waves. Los Angeles Times, November 17, 2002, pp. M.2 (http://www.actionbioscience.org/environment/olson.html)
Steneck, R.S., S.N. Arnold, and J.B. Brown, eds. 2005. A report on the status of the coral reefs of Bonaire in 2005 with advice on the establishment of fish protection areas. Pew Charitable Trust Report, 64 pp. (http://www.bmp.org/pdfs/Status-of-coral-reef-2005.pdf)
http://www-biol.paisley.ac.uk/courses/Tatner/biomedia/units/cnid1.htm – Phylum Cnidaria on Biomedia of the Glasgow University Zoological Museum on the Biological Sciences, University of Paisley, Scotland Web site; includes expla-nations of the major classes, a glossary of terms and diagrams and photos
http://www.calacademy.org/research/izg/calwildfall2000.pdf – Article from California Wild: “Stinging Seas - Tread Softly In Tropical Waters” by Gary C. Williams; an introduction to the venomous nature of tropical cnidarians, why and how they do it
http://www.cees.iupui.edu/Education/Workshops/Project_Seam/Exercises/bird_biodiversity_exerciese.htm – Biodiversity exercises from the Center for Earth and Environmental Science, Indiana University – Purdue University, Indianapolis
http://www.mcbi.org/publications/pub_pdfs/Deep-Sea%20Coral%20issue%20of%20Current.pdf – A special issue of Current: the Journal of Marine Education on deep-sea corals.
http://www.mesa.edu.au/friends/seashores/index.html – “Life on Australian Seashores” by Keith Davey on the Marine Education Society of Australasia Web site, with an easy introduction to Cnidaria, including their method of repro-duction
http://www.ucmp.berkeley.edu/cnidaria/cni-daria.html – Introduction to Cnidaria from the University of California Museum of Paleontology
Diamante-Fabunan, D. 2000. Coral Bleaching: the Whys, the Hows and What Next? OverSeas, The Online Magazine for Sustainable Seas. http://www.oneocean.org/over-seas/200009/coral_bleaching_the_hows_and_whys_and_whats_next.html
http://www.crc.uri.edu/download/COR_0011.PDF – “Coral Bleaching: Causes, consequences and response;” a collection of papers from the Ninth International Coral Reef Symposium.
http://www.nmfs.noaa.gov/habitat/habitatconservation/publica-tions/Separate%20Chapters/Cover%20and%20Table%20of%20Contents.pdf – “The State of Deep Coral Ecosystems of the United States,” 2007 report from NOAA providing new insight into the complex and biologically rich habi-tats found in deeper waters off the U.S. and elsewhere around the world.

�
Bonaire 2008: Exploring Coral Reef Sustainability with New Technologies ExpeditionFocus: Marine navigation – Grades 9-12 (Earth Science/Mathematics) oceanexplorer.noaa.gov
http://www.latimes.com/news/local/oceans/la-oceans-series,0,7842752.special – “Altered Oceans,” five-part series from the Los Angeles Times on the condition of Earth’s ocean; published July 30 – August 3, 2006
nationaL science education standards Content Standard A: Science As Inquiry
• Abilities necessary to do scientific inquiry• Understanding about scientific inquiry
Content Standard D: Earth and Space Science• Structure of the Earth system
Content Standard E: Science and Technology • Abilities of technological design • Understandings about science & technology
Content Standard F: Science in Personal and Social Perspectives • Natural hazards
ocean Literacy essentiaL PrinciPLes and FundaMentaL concePts Essential Principle �. The Earth has one big ocean with many features.
Fundamental Concept h. Although the ocean is large, it is finite and resources are limited.
Essential Principle �. The ocean and humans are inextricably interconnected.
Fundamental Concept f. Coastal regions are susceptible to natural hazards (such as tsunamis, hurricanes, cyclones, sea level change, and storm surges).
Essential Principle �. The ocean is largely unexplored.
Fundamental Concept a. The ocean is the last and largest unexplored place on Earth—less than 5% of it has been explored. This is the great frontier for the next generation’s explorers and researchers, where they will find great opportuni-ties for inquiry and investigation.Fundamental Concept b. Understanding the
ocean is more than a matter of curiosity. Exploration, inquiry and study are required to bet-ter understand ocean systems and processes.Fundamental Concept d. New technologies, sensors and tools are expanding our ability to explore the ocean. Ocean scientists are relying more and more on satellites, drifters, buoys, sub-sea observatories and unmanned submersibles.Fundamental Concept f. Ocean exploration is truly interdisciplinary. It requires close collabora-tion among biologists, chemists, climatologists, computer programmers, engineers, geologists, meteorologists, and physicists, and new ways of thinking.
send us your FeedbacK
We value your feedback on this lesson.Please send your comments to: [email protected]
For More inForMation
Paula Keener-Chavis, Director, Education ProgramsNOAA Ocean Exploration ProgramHollings Marine Laboratory331 Fort Johnson Road, Charleston SC 29412843.762.8818843.762.8737 (fax)[email protected]
acKnoWLedGeMents
This lesson plan was produced by Mel Goodwin, PhD, The Harmony Project, Charleston, SC for the National Oceanic and Atmospheric Administration. If reproducing this lesson, please cite NOAA as the source, and provide the follow-ing URL: http://oceanexplorer.noaa.gov

oceanexplorer.noaa.govBonaire 2008: Exploring Coral Reef Sustainability with New Technologies Expedition
Focus: Mapping coral reef habitats – Grades 9-12 (Life Science/Earth Science)
Student Worksheet on Dead Reckoningand Navigation with Nautical Charts
(adapted, in part, from the National Ocean Service Discovery Classroom Lesson, “Plot Your Course”; http://oceanservice.noaa.gov/education/classroom/lessons/18_marinenav_plotcourse.pdf)
Latitude and LongitudeAll nautical charts are based on a system of geographic coordinates that can be used to describe a specific location on a body of water. One of the best-known and most widely used set of geographic coordinates is the latitude - longitude system. This system is based on two sets of imaginary circles on the Earth’s surface. One set includes circles that pass through the north and south poles. These circles are known as “meridians of longitude.” The other set includes circles that would lie on plane surfaces cutting through the Earth perpendicular to the polar axis (and therefore perpendicular to meridians of longitude). This second set of circles is known as “parallels of latitude” (see Figure 1).
Geographic coordinates using the latitude - longitude system are measured in terms of degrees. The reference point for all measurements of longitude is the meridian passing through Greenwich, England; this meridian is called the “prime meridian,” and is represented by 0 degrees. The meridian of longitude that passes through any position on Earth is described in terms of how many degrees that meridian is to the east or west of the prime meridian. The maximum in either direction is 180 degrees. Parallels of latitude are measured in terms of how many degrees a given parallel is north or south from the equa-tor (which is assigned a latitude of 0 degrees). Fractions of degrees are expressed in minutes (there are 60 minutes in one degree) and seconds (there are 60 seconds in one minute). Minutes and seconds are sometimes divided decimally for very precise descriptions of geographic location. Each degree of latitude corresponds to sixty nautical miles, so one minute of latitude corresponds to one nautical mile (a nautical mile is equal to about 6,076 ft, or about 1.15 statute miles).
Useful Features of the Mercator ProjectionA fundamental problem faced by all mapmakers is how to depict the three-dimensional curved surface
EquatorParallels of�Latitude
Meridians of�Longitude
Figure 1. Parallels of Latitude and Meridians of Longitude

oceanexplorer.noaa.govBonaire 2008: Exploring Coral Reef Sustainability with New Technologies Expedition
Focus: Mapping coral reef habitats – Grades 9-12 (Life Science/Earth Science)
of Earth on the two-dimensional flat surface of a paper chart. To deal with this problem, mapmakers use mathematical constructions known as “projection systems” to approximate Earth’s curved surface in two dimensions. One of the most familiar projection systems is the Mercator projection, which is often explained as projection of Earth’s surface features onto a cylinder wrapped so that the long axis of the cylinder is parallel to Earth’s polar axis and the inner surface of the cylinder touches Earth’s equator. A conspicuous feature of the Mercator projection is that meridians of longitude appear as straight vertical lines, and do not converge at the poles. The main advantage of charts that use the Mercator projection is that the geographic position of an object on the chart can be easily measured using the latitude and longitude scales along the four outer borders of the chart. A straight line drawn between two points on a Mercator chart corresponds to the compass direction between these points, and to the course that should be steered to navigate from one point to the other. In addition, the distance between the two points can be easily determined by transferring the length of a line between these points to the latitude scale on the left or right sides of the chart (most often using a pair of dividers), since one minute of latitude corre-sponds to one nautical mile as described above.
The Compass RoseThe compass rose is a tool provided on all nautical charts to simplify the process of measuring direc-tions. The most commonly used reference point for direction on nautical charts is Earth’s geographic north pole (“true north”). The direction from one point on Earth’s surface to another point on Earth’s surface is usually described as the angle between a line connecting the two points and the meridian that passes through the first point. It may be easier to visualize this angle as the compass course that one would follow to move from one point to the next if the compass pointed toward true north (see Figure 2).
A
B
Angle between Course�Line and Meridian through �Point A
Course Line Connecting �Points A and B
Meridian Through �Point A
Figure 2. Direction Between Two Points on Earth’s Surface
oceanexplorer.noaa.govBonaire 2008: Exploring Coral Reef Sustainability with New Technologies Expedition
Focus: Mapping coral reef habitats – Grades 9-12 (Life Science/Earth Science)
This angle is measured in degrees moving clockwise from the meridian. A compass rose on most charts consists of two or three concentric circles, several inches in diameter. Each circle is subdivided into small-er segments. The outer circle is divided into 360 segments (degrees) with zero at true north, usually indi-cated by a star. The next inner circle describes magnetic direction, also in degrees, with an arrow at the zero point which corresponds to the direction of magnetic north. The innermost circle (if there is one) is also oriented to magnetic north, but is divided into “points.” This is a traditional way to express nautical directions based on subdividing the intervals between the four “cardinal” directions (north, east, south, and west). There are 32 points on the traditional mariner’s compass (in this system, the points between north and east are named north, north by east, north-northeast, northeast by north, northeast, northeast by east, east-northeast, and east by north), and each point may be further divided into half- and quarter-points. This system is rarely used, except that north, northeast, east, southeast, etc. are sometimes used to give rough descriptions of direction, particularly wind direction.
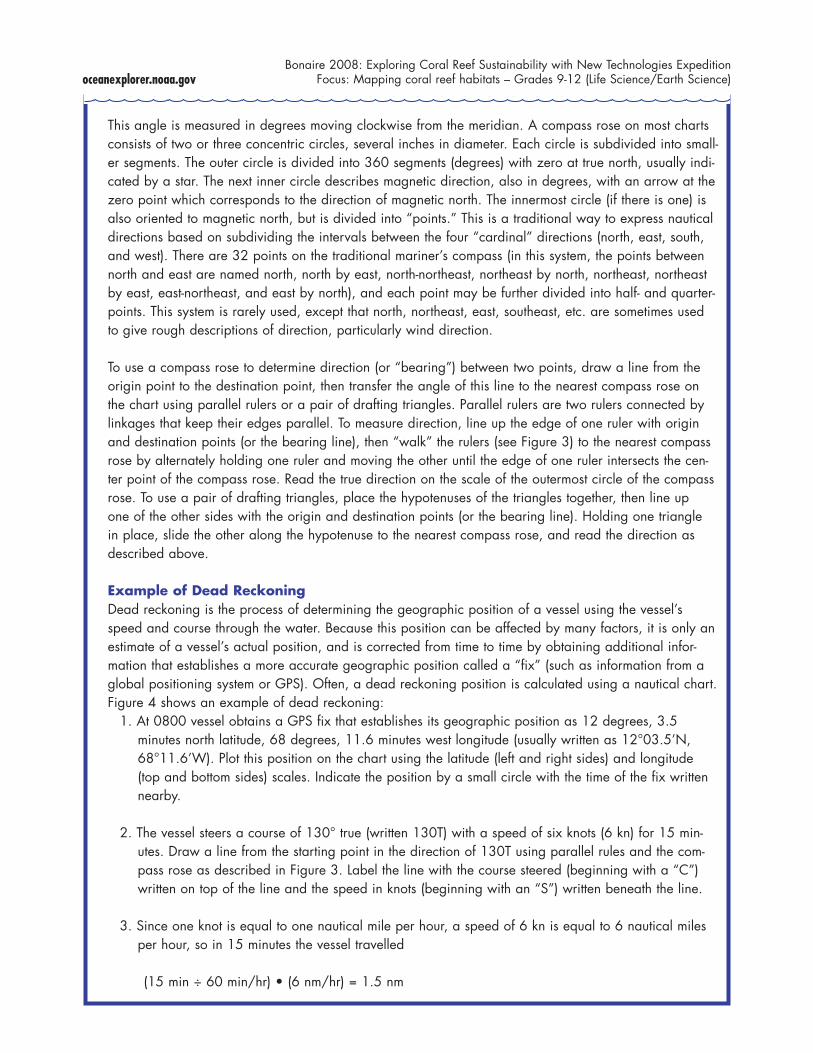
To use a compass rose to determine direction (or “bearing”) between two points, draw a line from the origin point to the destination point, then transfer the angle of this line to the nearest compass rose on the chart using parallel rulers or a pair of drafting triangles. Parallel rulers are two rulers connected by linkages that keep their edges parallel. To measure direction, line up the edge of one ruler with origin and destination points (or the bearing line), then “walk” the rulers (see Figure 3) to the nearest compass rose by alternately holding one ruler and moving the other until the edge of one ruler intersects the cen-ter point of the compass rose. Read the true direction on the scale of the outermost circle of the compass rose. To use a pair of drafting triangles, place the hypotenuses of the triangles together, then line up one of the other sides with the origin and destination points (or the bearing line). Holding one triangle in place, slide the other along the hypotenuse to the nearest compass rose, and read the direction as described above.
Example of Dead ReckoningDead reckoning is the process of determining the geographic position of a vessel using the vessel’s speed and course through the water. Because this position can be affected by many factors, it is only an estimate of a vessel’s actual position, and is corrected from time to time by obtaining additional infor-mation that establishes a more accurate geographic position called a “fix” (such as information from a global positioning system or GPS). Often, a dead reckoning position is calculated using a nautical chart. Figure 4 shows an example of dead reckoning:
1. At 0800 vessel obtains a GPS fix that establishes its geographic position as 12 degrees, 3.5 minutes north latitude, 68 degrees, 11.6 minutes west longitude (usually written as 12°03.5’N, 68°11.6’W). Plot this position on the chart using the latitude (left and right sides) and longitude (top and bottom sides) scales. Indicate the position by a small circle with the time of the fix written nearby.
2. The vessel steers a course of 130° true (written 130T) with a speed of six knots (6 kn) for 15 min-utes. Draw a line from the starting point in the direction of 130T using parallel rules and the com-pass rose as described in Figure 3. Label the line with the course steered (beginning with a “C”) written on top of the line and the speed in knots (beginning with an “S”) written beneath the line.
3. Since one knot is equal to one nautical mile per hour, a speed of 6 kn is equal to 6 nautical miles per hour, so in 15 minutes the vessel travelled
(15 min ÷ 60 min/hr) • (6 nm/hr) = 1.5 nm
oceanexplorer.noaa.govBonaire 2008: Exploring Coral Reef Sustainability with New Technologies Expedition
Focus: Mapping coral reef habitats – Grades 9-12 (Life Science/Earth Science)
A
A
A
A
A
B
B
B
B
B
C
C
C
C
C
Hold
Hold
Hold
Move
Move
Move
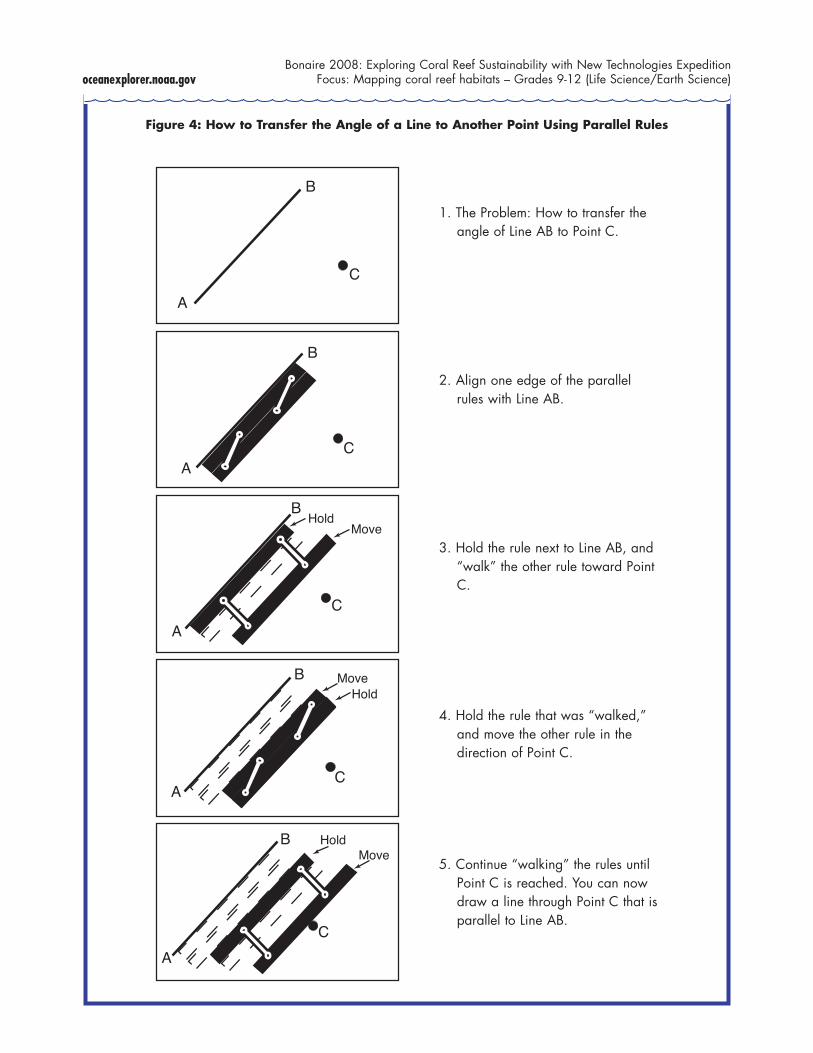
Figure 4: How to Transfer the Angle of a Line to Another Point Using Parallel Rules
1. The Problem: How to transfer the angle of Line AB to Point C.
2. Align one edge of the parallel rules with Line AB.
3. Hold the rule next to Line AB, and “walk” the other rule toward Point C.
4. Hold the rule that was “walked,” and move the other rule in the direction of Point C.
5. Continue “walking” the rules until Point C is reached. You can now draw a line through Point C that is parallel to Line AB.

oceanexplorer.noaa.govBonaire 2008: Exploring Coral Reef Sustainability with New Technologies Expedition
Focus: Mapping coral reef habitats – Grades 9-12 (Life Science/Earth Science)
68°10’
12°00’
01’
02’
03’
59’
C 240
68°10’11’12’13’
BON
AIR
E
68°10’11’12’13’
12°00’
01’
02’
03’
59’
0
270
300
330
90
30
60
210
240
120
150
180
340 350 0
270
280
290
300
310
320330
7080
90
10 2030
40
5060
100
190200
210
220
230
240250
260
110
120
130
140
150160
170180
MAGNETIC
VAR
5° 45' W (1999)
ANNUAL INCREASE9'
0845
0845
SET 135DRIFT 0.8
S 6.0
C130S 6.0
0800
0815
Figure 4. Example of Dead Reckoning
oceanexplorer.noaa.govBonaire 2008: Exploring Coral Reef Sustainability with New Technologies Expedition
Focus: Mapping coral reef habitats – Grades 9-12 (Life Science/Earth Science)
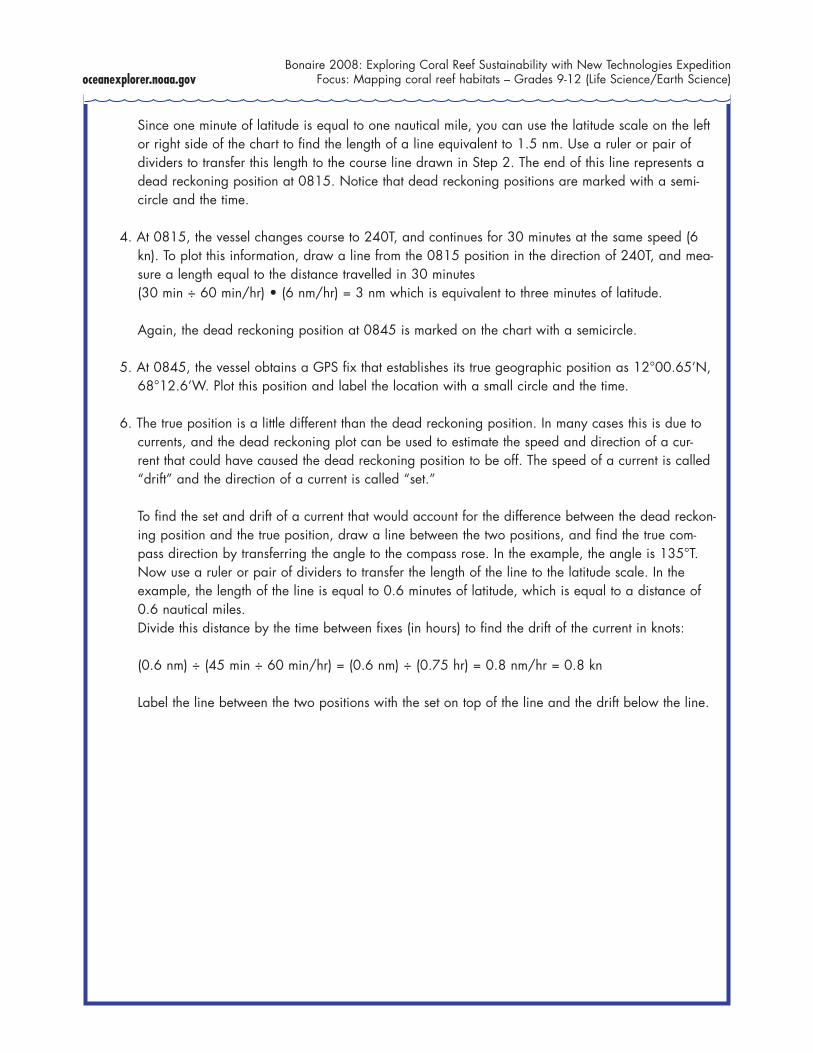
Since one minute of latitude is equal to one nautical mile, you can use the latitude scale on the left or right side of the chart to find the length of a line equivalent to 1.5 nm. Use a ruler or pair of dividers to transfer this length to the course line drawn in Step 2. The end of this line represents a dead reckoning position at 0815. Notice that dead reckoning positions are marked with a semi-circle and the time.
4. At 0815, the vessel changes course to 240T, and continues for 30 minutes at the same speed (6 kn). To plot this information, draw a line from the 0815 position in the direction of 240T, and mea-sure a length equal to the distance travelled in 30 minutes
(30 min ÷ 60 min/hr) • (6 nm/hr) = 3 nm which is equivalent to three minutes of latitude.
Again, the dead reckoning position at 0845 is marked on the chart with a semicircle.
5. At 0845, the vessel obtains a GPS fix that establishes its true geographic position as 12°00.65’N, 68°12.6’W. Plot this position and label the location with a small circle and the time.
6. The true position is a little different than the dead reckoning position. In many cases this is due to currents, and the dead reckoning plot can be used to estimate the speed and direction of a cur-rent that could have caused the dead reckoning position to be off. The speed of a current is called “drift” and the direction of a current is called “set.”
To find the set and drift of a current that would account for the difference between the dead reckon-ing position and the true position, draw a line between the two positions, and find the true com-pass direction by transferring the angle to the compass rose. In the example, the angle is 135°T. Now use a ruler or pair of dividers to transfer the length of the line to the latitude scale. In the example, the length of the line is equal to 0.6 minutes of latitude, which is equal to a distance of 0.6 nautical miles.
Divide this distance by the time between fixes (in hours) to find the drift of the current in knots:
(0.6 nm) ÷ (45 min ÷ 60 min/hr) = (0.6 nm) ÷ (0.75 hr) = 0.8 nm/hr = 0.8 kn
Label the line between the two positions with the set on top of the line and the drift below the line.

oceanexplorer.noaa.govBonaire 2008: Exploring Coral Reef Sustainability with New Technologies Expedition
Focus: Mapping coral reef habitats – Grades 9-12 (Life Science/Earth Science)
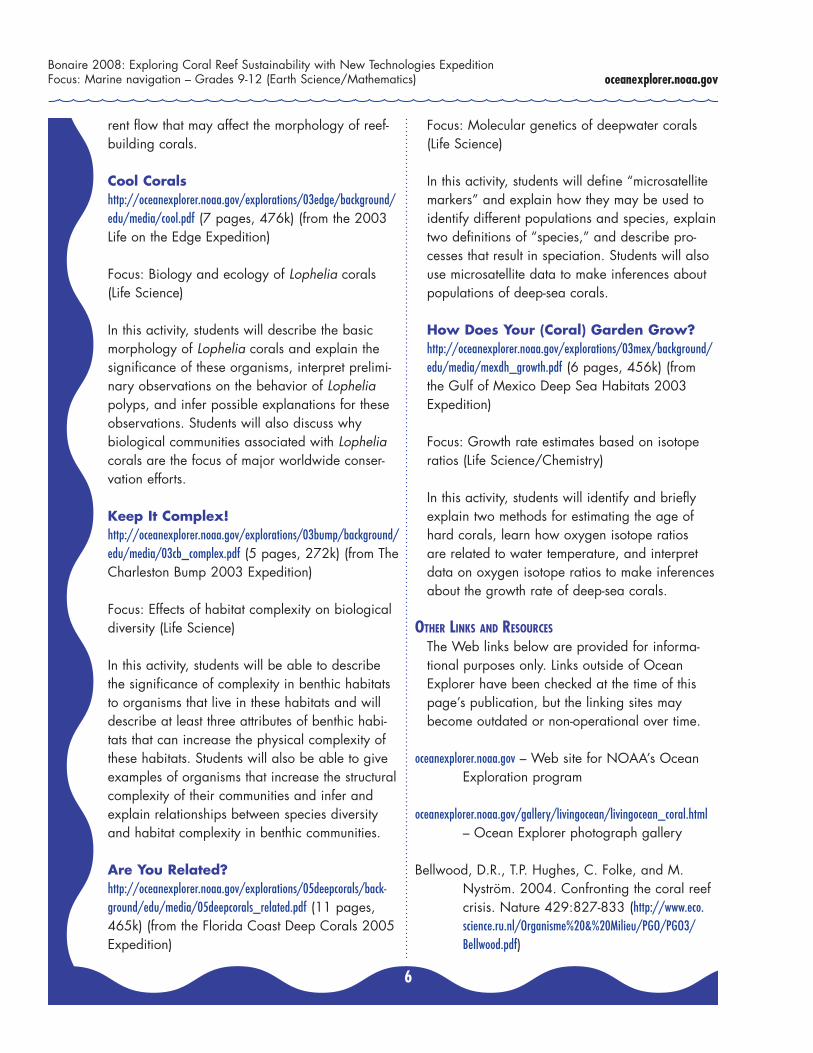
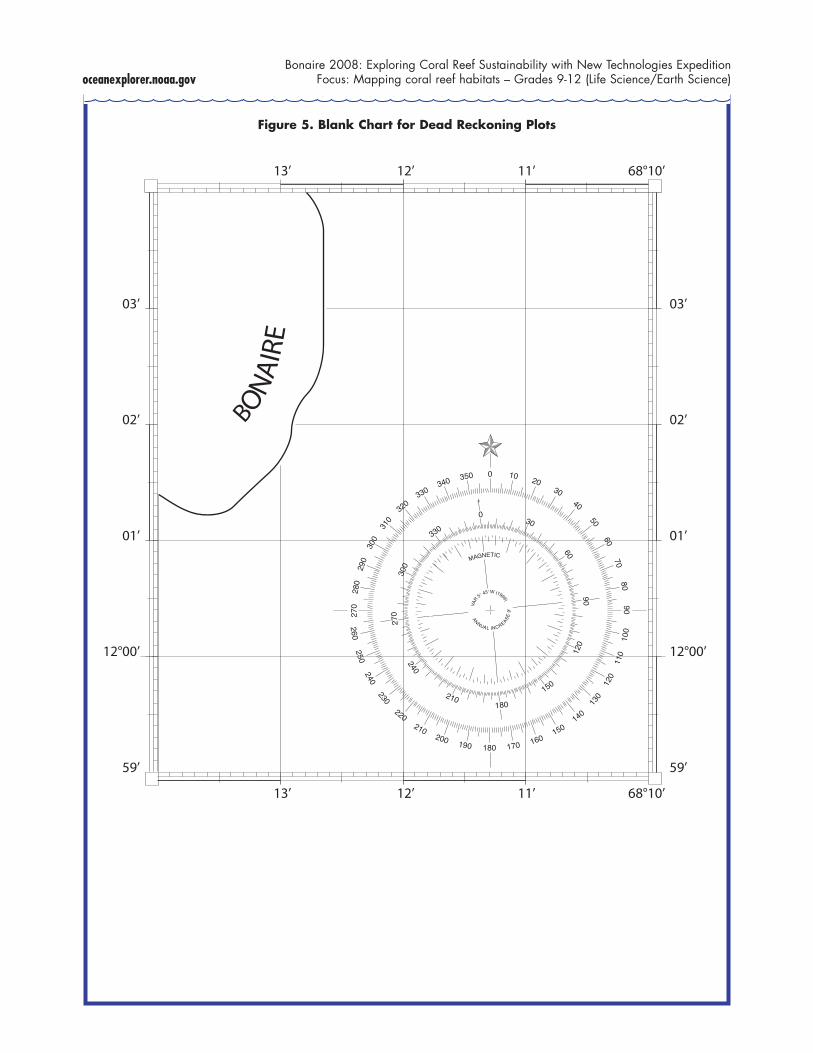
Now It’s Your Turn! Following are several logbook entries recording the movements of an AUV engaged in coral reef
surveys. Use this information to construct a dead reckoning plot on the blank chart for the AUV’s geographic position during this survey.
Time 1300 AUV launched from position 12°01.1’N, 68°13.5’W (fix by GPS); course = 140T; speed = 4 kn
1330 Change course = 050T; speed = 4 kn
1336 Change course = 320T; speed = 4 kn
1400 Change course = 000T; speed = 4 kn
1406 Change course = 030T; speed = 3 kn
1416 Change course = 150T; speed = 3 kn
1501 Change course = 090T; speed = 3 kn
1511 AUV at surface for GPS fix; GPS position = 11°59.85’N, 68°11.21’W
QUESTION: Does this GPS fix match the dead reckoning position? If not, what is the set and drift of a current that could have caused the discrepancy?
1520 AUV underway; course = 345T; speed = 3.5 kn
1608 Change course = 270T; speed = 3.5 kn
1620 Change course = 045T; speed = 3.5 kn
1644 AUV at surface for GPS fix; GPS position = 12°03.55’N, 68°10.95’W
QUESTION: Does this GPS fix match the dead reckoning position? If not, what is the set and drift of a current that could have caused the discrepancy?
oceanexplorer.noaa.govBonaire 2008: Exploring Coral Reef Sustainability with New Technologies Expedition
Focus: Mapping coral reef habitats – Grades 9-12 (Life Science/Earth Science)
Figure 5. Blank Chart for Dead Reckoning Plots
12°00’
01’
02’
03’
59’
68°10’11’12’13’
BON
AIR
E
68°10’11’12’13’
12°00’
01’
02’
03’
59’
0
270
300
330
90
30
60
210
240
120
150
180
340 350 0
270
280
290
300
310
320330
7080
90
10 2030
40
5060
100
190200
210
220
230
240250
260
110
120
130
140
150160
170180
MAGNETIC
VAR
5° 45' W (1999)
ANNUAL INCREASE9'
oceanexplorer.noaa.govBonaire 2008: Exploring Coral Reef Sustainability with New Technologies Expedition
Focus: Mapping coral reef habitats – Grades 9-12 (Life Science/Earth Science)
Figure 6. Dead Reckoning Plot from Data on Student Worksheet
1336
12°00’
01’
02’
03’
59’
68°10’11’12’13’
BON
AIR
E
68°10’11’12’13’
12°00’
01’
02’
03’
59’
1300
1330
1400
1406
1416
1501
1511
16081620
16441644
SET 090
DRIFT 0.5
C 140
S 4.0
C 050
S4.0
C 320
S 4.0
C 0
00S
4.0
C 03
0S
3.0
C 150
S 3.0
C 090S 3.0
C 345
S 3.5
C 270S 3.5
C 045
S 3.5