Where to spend the next million: Impact evaluation of trade - Vox
238
Where to Spend the Next Million? Applying Impact Evaluation to Trade Assistance edited by Olivier Cadot, Ana M. Fernandes, Julien Gourdon and Aaditya Mattoo a THE WORLD BANK
Transcript of Where to spend the next million: Impact evaluation of trade - Vox
Where to Spend the Next Million? Applying Impact Evaluation to Trade Assistance
edited by Olivier Cadot, Ana M. Fernandes, Julien Gourdon and Aaditya Mattoo
“A welcome trend is emerging towards more clinical and thoughtful approaches to addressing constraints faced by developing countries as they seek to benefit from the gains from trade. But this evolving approach brings with it formidable analytical challenges that we have yet to surmount. We need to know more about available options for evaluating Aid for Trade, which interventions yield the highest returns, and whether experiences in one development area can be transplanted to another. These are some of the issues addressed in this excellent volume.” Pascal Lamy, Director-General, World Trade Organization
“Five years into the Aid for Trade project, we still need to learn much more about what works and what does not. Our initiatives offer excellent opportunities to evaluate impacts rigorously. That is the way to better connect aid to results. The collection of essays in this well-timed volume shows that the new approaches to evaluation that we are applying to education, poverty, or health programs can also be used to assess the results of policies to promote or assist trade. This book offers a valuable contribution to the drive to ensure value for aid money.”Robert Zoellick, President, The World Bank
aa
a
THE WORLD BANK
THE WORLD BANK 9 781907 142390
ISBN 978-1-907142-39-0
Where to Spend the N
ext Million? Applyng Im
pact Evaluation to Trade Assistance


WHERE TO SPEND THE NEXT MILL ION?

Where to Spend the Next Million? Applying Impact Evaluation to Trade Assistance
Copyright © 2011 byThe International Bank for Reconstruction and Development/The World Bank1818 H Street, NW, Washington, DC 20433, USA
ISBN: 978-1-907142-39-0
All rights reserved
The findings, interpretations, and conclusions expressed herein are those of theauthor(s) and do not necessarily reflect the views of the Executive Directors of theInternational Bank for Reconstruction and Development/The World Bank or thegovernments they represent.
The World Bank does not guarantee the accuracy of the data included in this work.The boundaries, colors, denominations, and other information shown on any map inthis work do not imply any judgment on the part of The World Bank concerning thelegal status of any territory or the endorsement or acceptance of such boundaries.
Rights and Permissions
The material in this publication is copyrighted. Copying and/or transmittingportions or all of this work without permission may be a violation of applicablelaw. The International Bank for Reconstruction and Development/The World Bankencourages dissemination of its work and will normally grant permission toreproduce portions of the work promptly.
For permission to photocopy or reprint any part of this work, please send a requestwith complete information to the Copyright Clearance Center Inc., 222 RosewoodDrive, Danvers, MA 01923, USA; telephone: 978-750-8400; fax: 978-750-4470;Internet: www.copyright.com.
All other queries on rights and licenses, including subsidiary rights, should beaddressed to the Office of the Publisher, The World Bank, 1818 H Street NW,Washington, DC 20433, USA; fax: 202-522-2422; e-mail: [email protected].
Copyedited and typeset by T&T Productions Ltd, London
Published in association with the London Publishing Partnershipwww.londonpublishingpartnership.co.uk
The cover image is a painting titled Helping hand by Chidi Okoye (www.chidi.com)Reproduced with permission
Centre for Economic Policy Research
The Centre for Economic Policy Research is a network of over 700 ResearchFellows and Affiliates, based primarily in European universities. The Centrecoordinates the research activities of its Fellows and Affiliates and communi-cates the results to the public and private sectors. CEPR is an entrepreneur,developing research initiatives with the producers, consumers and sponsorsof research. Established in 1983, CEPR is a European economics research orga-nization with uniquely wide-ranging scope and activities.
The Centre is pluralist and non-partisan, bringing economic research to bearon the analysis of medium- and long-run policy questions. CEPR research mayinclude views on policy, but the Executive Committee of the Centre does notgive prior review to its publications, and the Centre takes no institutional pol-icy positions. The opinions expressed in this report are those of the authorsand not those of the Centre for Economic Policy Research.
CEPR is a registered charity (No. 287287) and a company limited by guaranteeand registered in England (No. 1727026).
Chair of the Board Guillermo de la DehesaPresident Richard PortesChief Executive Officer Stephen YeoResearch Director Mathias DewatripontPolicy Director Richard Baldwin
The World BankThe World Bank Group is a major source of financial and technical assis-tance to developing countries around the world, providing low-interest loans,interest-free credits and grants for investments and projects in areas suchas education, health, public administration, infrastructure, trade, financialand private sector development, agriculture, and environmental and naturalresource management. Established in 1944 and headquartered in Washing-ton, DC, the Group has over 100 offices worldwide. The World Bank’s missionis to fight poverty with passion and professionalism for lasting results and tohelp people help themselves and their environment by providing resources,sharing knowledge, building capacity and forging partnerships in the publicand private sectors.

Where to Spend theNext Million?
Applying Impact Evaluation to Trade Assistance
edited by
OLIVIER CADOT, ANA M. FERNANDES,JULIEN GOURDON AND AADITYA MATTOO

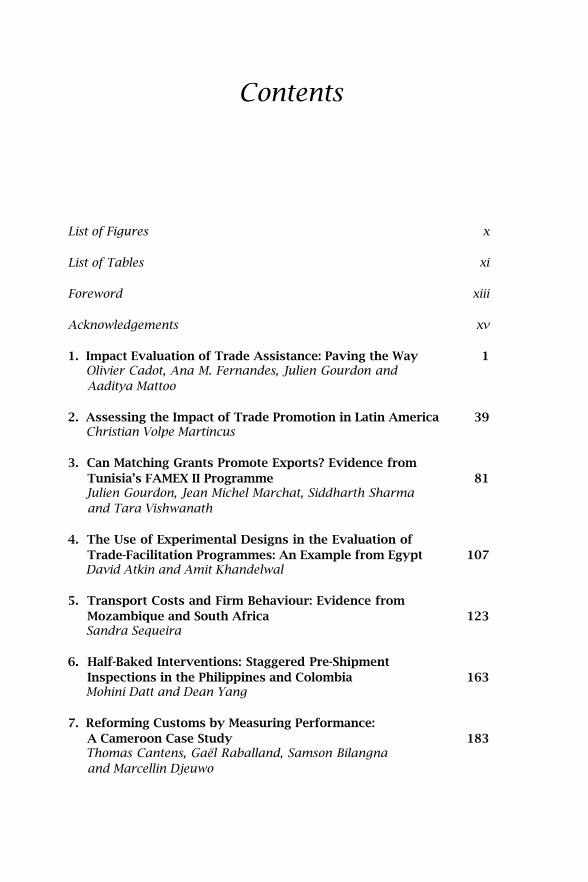
Contents
List of Figures x
List of Tables xi
Foreword xiii
Acknowledgements xv
1. Impact Evaluation of Trade Assistance: Paving the Way 1Olivier Cadot, Ana M. Fernandes, Julien Gourdon andAaditya Mattoo
2. Assessing the Impact of Trade Promotion in Latin America 39Christian Volpe Martincus
3. Can Matching Grants Promote Exports? Evidence fromTunisia’s FAMEX II Programme 81Julien Gourdon, Jean Michel Marchat, Siddharth Sharmaand Tara Vishwanath
4. The Use of Experimental Designs in the Evaluation ofTrade-Facilitation Programmes: An Example from Egypt 107David Atkin and Amit Khandelwal
5. Transport Costs and Firm Behaviour: Evidence fromMozambique and South Africa 123Sandra Sequeira
6. Half-Baked Interventions: Staggered Pre-ShipmentInspections in the Philippines and Colombia 163Mohini Datt and Dean Yang
7. Reforming Customs by Measuring Performance:A Cameroon Case Study 183Thomas Cantens, Gaël Raballand, Samson Bilangnaand Marcellin Djeuwo

viii Where to Spend the Next Million?
8. Aid for Trade and Export Performance:The Case of Aid in Services 207Esteban Ferro, Alberto Portugal-Pérez and John S. Wilson
List of Figures
1.1 Tariffs and GDP per capita. 5
1.2 World Bank aid-for-trade commitments 2002–10. 6
1.3 World Bank Group trade portfolio 2008. 7
1.4 Evaluation of World Bank trade-related projects 1995–2005. 15
1.5 From inputs to impact. 16
2.1 Peru: Average export assistance effect on assisted firms. 54
2.2 Costa Rica: average export assistance effect on assistedfirms by type of products. 55
2.3 Uruguay: export assistance effect on the probability ofentering new country and product markets. 56
2.4 Chile: assistance effect on assisted firms by export outcomedeciles. 57
2.5 Chile: distribution of exports over significance groups anddeciles defined in terms of export growth. 58
2.6 Argentina: average assistance effect on assisted firms bysize category. 59
2.7 Colombia: average effect of export assistance programmeson assisted firms relative to non-participation. 60
2.8 Colombia: average effect of export assistance programmeson assisted firms relative to each other. (a) Total exports;(b) number of products; (c) number of countries. (d) Averageexports per product and country; (e) average exports perproduct; (f) average exports per country. 61
3.1 Average annual growth rate over 2004–8. 92
3.2 Distribution of propensity score for FAMEX (treated) firmsand control (untreated) firms. 93
3.3 Impact of FAMEX on average annual growth rates over2004–8 (in per cent). 95
5.1 Firms surveyed in South Africa and the choice of transportcorridor between Maputo and Durban. 129
5.2 Transport corridors in southern (Maputo), central (Beira)and northern (Nacala) Mozambique. 130
5.3 Traffic volumes going through the Maputo Railway. 131
x Where to Spend the Next Million?
5.4 Surveyed firms in South Africa. 1315.5 Nearest port through the railway network for surveyed firms. 1325.6 Traffic volumes reaching the port of Maputo via rail in 2009. 1335.7 Propensity scores for treated firms (Maputo region) and
untreated firms (from Beira and Nacala) in Mozambique. 1345.8 Propensity scores for treated firms (Gauteng and
Mpumalanga regions) and untreated firms (from WesternCape and KwaZulu Natal) in South Africa. 134
5.9 Covariate balance for treated and untreated firms inMozambique. 135
5.10 Covariate balance for treated and untreated firms in SouthAfrica. 136
5.11 Covariate balance for treated and untreated firms in SouthAfrica, using KwaZulu Natal as the primary comparison group. 136
5.12 Covariate balance for treated and untreated firms in SouthAfrica, using the Western Cape as the primary comparisongroup. 137
5.13 Traffic volumes going through the Maputo port. 1385.14 Trade costs and the capacity for a country to control
corruption. (a) Cost of imports (US dollars) (top) and daysto import (bottom). (b) Cost of imports (US dollars) SSA(top) and days to import (bottom). 141
5.15 Road network in South Africa. 1515.16 Non-parametric regression of the probability of choosing
the port of Maputo relative to the transport cost of reachingthe alternative port of Durban. 152
5.17 Distribution of bribes per container at the ports of Durbanand Maputo. (a) Maputo; (b) Durban. 154
5.18 South African firms’ choice of port for imports. 154
6.1 Identifying a control group. 177
7.1 Comparison of the most-efficient and least-efficientcustoms officers on the ratio of taxes adjusted to taxesassessed over the contract period (as a percentage). 198
8.1 Aid for trade 1990–2008. 2098.2 Service intensities by manufacturing sector. 215
List of Tables
1.1 Focused trade interventions. 81.2 Boundaries of impact evaluation. 181.3 Intermediate and ultimate performance outcomes. 30
2.1 Empirical approach used in each case study. 502.2 Datasets. 53
3.1 Impact of FAMEX on export outcomes with matchingdifference-in-difference method: growth over 2004–8. 94
3.2 Impact of FAMEX on other outcomes with matchingdifference-in-difference method: growth over 2004–8. 95
3.3 Impact of FAMEX on export outcomes with matchingdifference-in- difference method including drop-outs intreatment group: growth over 2004–8. 96
3.4 OLS estimation of difference-in-differences regressions:growth over 2004–8. 97
3.5 OLS estimation of difference-in-differences regressions withinteractions: growth over 2004–8 with interactions. 98
3.7 Additional characteristics of FAMEX firms and control firms. 1033.8 Unmatched differences in growth over 2004–8 for several
outcomes. 1033.9 Probit regression for the propensity to receive FAMEX
assistance: survey data. 1043.10 Weighted OLS estimation of difference-in-differences
regressions with interactions using generated control firms. 106
4.1 Sample budget (in US dollars). 115
5.1 Comparing the ports of Durban and Maputo. 1475.2 Summary statistics of bribes at each port. 150
7.1 Customs indicators. 188
8.1 Databases’ concordances. 2138.2 Sample of countries. 2148.3 Impact of aid to services on manufacturing exports. 2158.4 Robustness checks. 216

Foreword
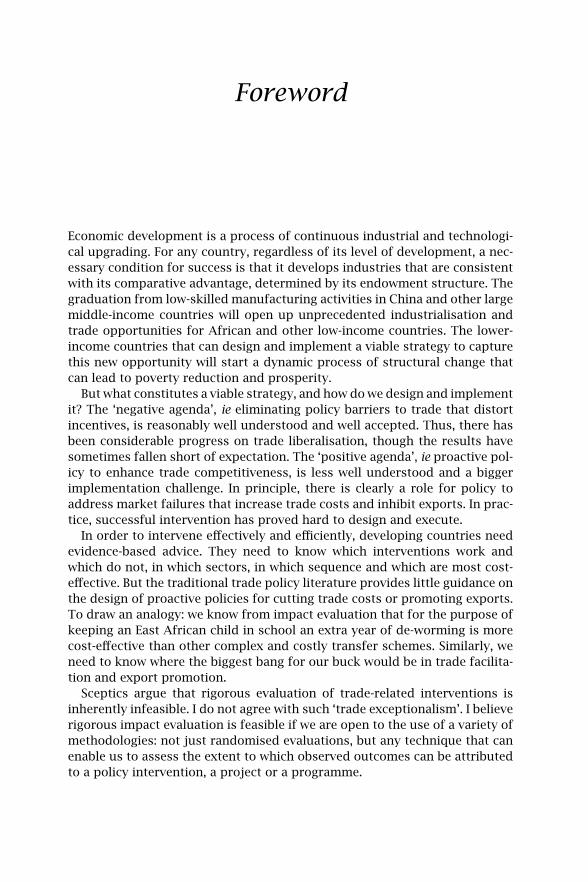
Economic development is a process of continuous industrial and technologi-cal upgrading. For any country, regardless of its level of development, a nec-essary condition for success is that it develops industries that are consistentwith its comparative advantage, determined by its endowment structure. Thegraduation from low-skilled manufacturing activities in China and other largemiddle-income countries will open up unprecedented industrialisation andtrade opportunities for African and other low-income countries. The lower-income countries that can design and implement a viable strategy to capturethis new opportunity will start a dynamic process of structural change thatcan lead to poverty reduction and prosperity.
But what constitutes a viable strategy, and how do we design and implementit? The ‘negative agenda’, ie eliminating policy barriers to trade that distortincentives, is reasonably well understood and well accepted. Thus, there hasbeen considerable progress on trade liberalisation, though the results havesometimes fallen short of expectation. The ‘positive agenda’, ie proactive pol-icy to enhance trade competitiveness, is less well understood and a biggerimplementation challenge. In principle, there is clearly a role for policy toaddress market failures that increase trade costs and inhibit exports. In prac-tice, successful intervention has proved hard to design and execute.
In order to intervene effectively and efficiently, developing countries needevidence-based advice. They need to know which interventions work andwhich do not, in which sectors, in which sequence and which are most cost-effective. But the traditional trade policy literature provides little guidance onthe design of proactive policies for cutting trade costs or promoting exports.To draw an analogy: we know from impact evaluation that for the purpose ofkeeping an East African child in school an extra year of de-worming is morecost-effective than other complex and costly transfer schemes. Similarly, weneed to know where the biggest bang for our buck would be in trade facilita-tion and export promotion.
Sceptics argue that rigorous evaluation of trade-related interventions isinherently infeasible. I do not agree with such ‘trade exceptionalism’. I believerigorous impact evaluation is feasible if we are open to the use of a variety ofmethodologies: not just randomised evaluations, but any technique that canenable us to assess the extent to which observed outcomes can be attributedto a policy intervention, a project or a programme.
xiv Where to Spend the Next Million?
I am very glad that this volume seeks to facilitate, and in the process developmethodologies for, rigorous impact evaluation of trade-related interventions(whether financed by World Bank projects or by governments). As part of ourOpen Data, Open Knowledge and Open Solutions initiative, I am also proud toreport that a parallel process is underway to create a large cross-country firm-level customs-transactions database which will be made publicly available andwill allow evaluators everywhere to assess the impact of trade interventions.
Justin Yifu LinSenior Vice President and Chief Economist
World Bank
Acknowledgements
This volume includes a set of papers that were presented and discussed atthe workshop on ‘Impact Evaluation of Trade Interventions: Paving the Way’held in Washington, DC, in December 2010. The editors thank the authorsof individual chapters as well as participants in the workshop for valuablecomments and suggestions that have helped to improve the papers. The edi-tors also thank Justin Lin for his guidance, as well as David Mackenzie andDaniel Lederman for their advice. Michelle Chester and Anna Regina Bonfieldprovided outstanding administrative support and Lawrence Mastri providedexcellent editorial support.
This volume is the result of collaboration between the World Bank and theSwiss National Centres for Competence in Research (NCCR) on the evaluationof trade-related interventions. Support for World Bank trade research fromthe governments of Norway, Sweden and the UK through the Multi-DonorTrust Fund for Trade and Development is gratefully acknowledged. The viewsexpressed in this volume are those of the authors and do not necessarilyrepresent the views of the World Bank or the authors’ affiliated organisations.

1
Impact Evaluation of Trade Assistance:Paving the Way
OLIVIER CADOT, ANA M. FERNANDES, JULIEN GOURDON ANDAADITYA MATTOO1
1 INTRODUCTION
Trade policy has changed fundamentally since the days of structural adjust-ment and economy-wide trade reforms. Partly in reaction to the uneven resultsof trade policy reforms, the focus has shifted to more targeted interventionsaimed at reducing trade costs and addressing market failures that inhibitexports. Significant national resources and international assistance are nowdevoted to trade facilitation and export promotion, and the internationaldevelopment community has galvanised around a new ‘aid-for-trade’ (AfT)mantra as a means of helping low-income countries integrate into the globaleconomy.
The environment in which trade-related assistance is provided has alsochanged. In times of fiscal austerity, taxpayers increasingly question thejustification for large aid flows and, at the very least, demand results andaccountability.2 The development community has struggled to respond tothese demands because there is surprisingly little evidence about what doesand does not work in the area of trade and industrial policies.
An authoritative survey of trade and industrial policy recently acknow-ledged that there is hardly any microeconomic evidence to guide specific tradeinterventions (Harrison and Rodrigues-Clare 2010). Even the most basic ques-
1We thank Vivian Agbegha for excellent research assistance, Christina Neagu and Fran-cis Ng for help with tariff data, and Mohini Datt for help with data on World Bank aid fortrade. We thank the participants at the December 2010 workshop on ‘Impact Evaluationof Trade Interventions: Paving the Way’ in Washington, DC, and Daniel Lederman for com-ments. Support from the governments of Norway, Sweden and the United Kingdom throughthe Multi-Donor Trust Fund for Trade and Development is gratefully acknowledged.
2A recent poll featured by the Financial Times (12 July 2010) showed that the majorityof respondents in OECD countries considered defence and development aid as priorityareas for spending cuts.
2 Where to Spend the Next Million?
tions go unanswered. For instance:
• if reducing trade costs is the objective, should limited resources befocused on transport or customs reform?
• in customs reform, should the emphasis be on computerising processesor on creating incentives for integrity?
• in transport, should it be on containerising ports or improving inlandlinks?
• if the object is to enhance the ability of firms to export, should thefocus be on assistance to particular firms or on improving the businessenvironment?
• if particular firms, should the focus be on the few large firms who canuse it but may not need it, or the many small firms who need it but maynot be able to use it?
• if the focus is on improvements in the business environment, should itbe economy-wide or good-governance enclaves such as export process-ing zones?
There are two reasons for the disappointing pace at which evidence on thesequestions has gathered. First, trade policy research has been slow to respondto changing needs. Tariffs continue to occupy centre stage in policy research,in spite of their declining importance as trade barriers, simply because theyare easy to measure. Second, the AfT community has been slow to build aculture of rigorous evaluation. For instance, a review of 85 recent World Banktrade-related projects conducted by the authors revealed that only 5 of themincluded rigorous evaluation components. Worse, those few evaluations reliedon crude before–after comparisons, which are known to be vulnerable to con-founding influences.
Still, the tools for a serious evaluation of trade-related interventions arethere. Originally developed in the medical sciences, impact-evaluation (IE)methods have spread to the social sciences and are routinely employed inthe areas of health and education. In essence, an impact evaluation comparesthe outcomes of entities—individuals or firms—that received support from aprogramme or were directly affected by a policy with the counterfactual out-come of those same entities had the programme or policy not been in place.Because such counterfactual outcomes are not observable, they are approxi-mated by the outcomes of a control group.
The recent creation by the World Bank of a separate impact-evaluation unitas part of the Development Impact Evaluation Initiative (DIME) has helpedspread IE methods to new areas of development research and practice.3 Forinstance, World Bank researchers have led the way in analysing the impact ofbusiness registration reform or bankruptcy reform (Klapper and Love 2010;
3Information on DIME can be obtained at http://go.worldbank.org/1F1W42VYV0.
Impact Evaluation of Trade Assistance: Paving the Way 3
Bruhn 2011; Gine and Love 2010). Researchers have also begun to use thesemethods to evaluate programmes and policies in the area of private sectordevelopment, where the treated ‘entities’ are firms (see McKenzie (2010) fora survey).
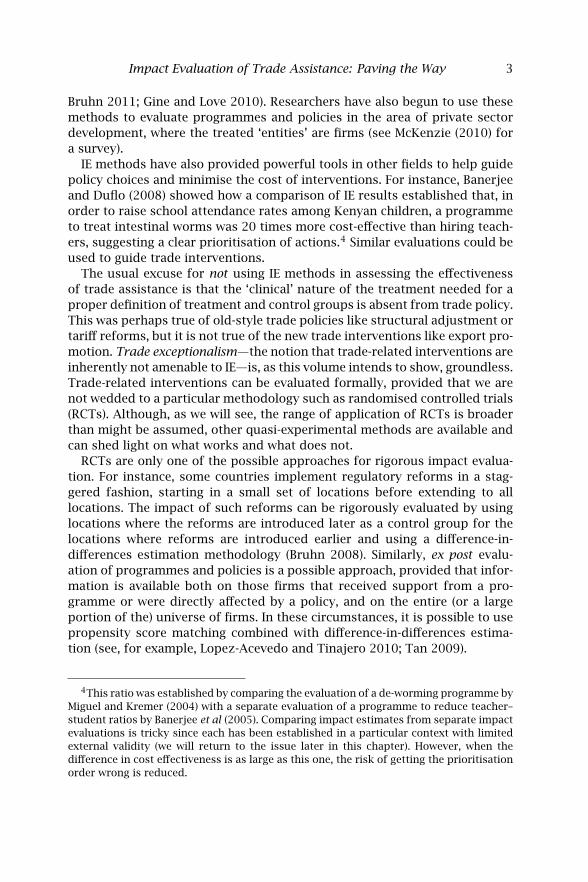
IE methods have also provided powerful tools in other fields to help guidepolicy choices and minimise the cost of interventions. For instance, Banerjeeand Duflo (2008) showed how a comparison of IE results established that, inorder to raise school attendance rates among Kenyan children, a programmeto treat intestinal worms was 20 times more cost-effective than hiring teach-ers, suggesting a clear prioritisation of actions.4 Similar evaluations could beused to guide trade interventions.
The usual excuse for not using IE methods in assessing the effectivenessof trade assistance is that the ‘clinical’ nature of the treatment needed for aproper definition of treatment and control groups is absent from trade policy.This was perhaps true of old-style trade policies like structural adjustment ortariff reforms, but it is not true of the new trade interventions like export pro-motion. Trade exceptionalism—the notion that trade-related interventions areinherently not amenable to IE—is, as this volume intends to show, groundless.Trade-related interventions can be evaluated formally, provided that we arenot wedded to a particular methodology such as randomised controlled trials(RCTs). Although, as we will see, the range of application of RCTs is broaderthan might be assumed, other quasi-experimental methods are available andcan shed light on what works and what does not.
RCTs are only one of the possible approaches for rigorous impact evalua-tion. For instance, some countries implement regulatory reforms in a stag-gered fashion, starting in a small set of locations before extending to alllocations. The impact of such reforms can be rigorously evaluated by usinglocations where the reforms are introduced later as a control group for thelocations where reforms are introduced earlier and using a difference-in-differences estimation methodology (Bruhn 2008). Similarly, ex post evalu-ation of programmes and policies is a possible approach, provided that infor-mation is available both on those firms that received support from a pro-gramme or were directly affected by a policy, and on the entire (or a largeportion of the) universe of firms. In these circumstances, it is possible to usepropensity score matching combined with difference-in-differences estima-tion (see, for example, Lopez-Acevedo and Tinajero 2010; Tan 2009).
4This ratio was established by comparing the evaluation of a de-worming programme byMiguel and Kremer (2004) with a separate evaluation of a programme to reduce teacher–student ratios by Banerjee et al (2005). Comparing impact estimates from separate impactevaluations is tricky since each has been established in a particular context with limitedexternal validity (we will return to the issue later in this chapter). However, when thedifference in cost effectiveness is as large as this one, the risk of getting the prioritisationorder wrong is reduced.
4 Where to Spend the Next Million?
These methods have already been applied in a number of recent studies,some of which are included in this volume, and have produced interestingand unexpected results. Consider the following three examples.
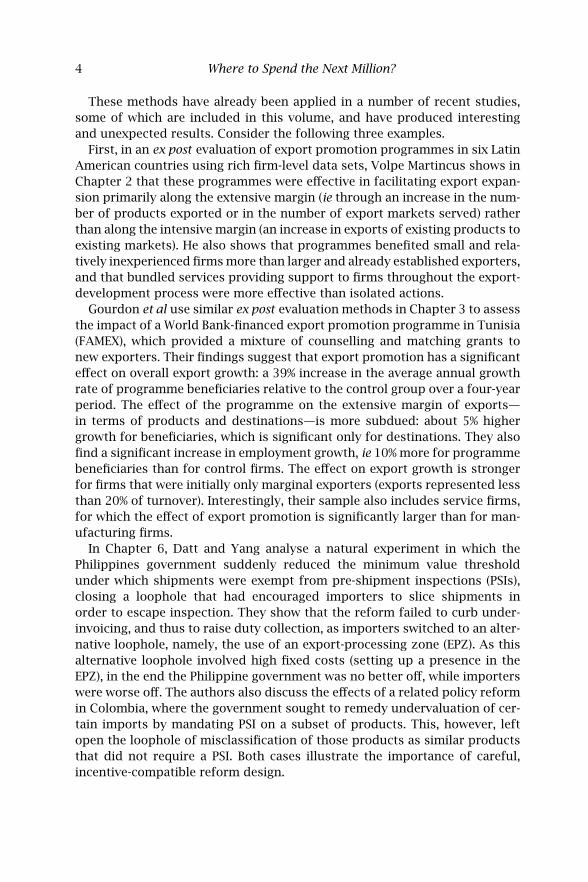
First, in an ex post evaluation of export promotion programmes in six LatinAmerican countries using rich firm-level data sets, Volpe Martincus shows inChapter 2 that these programmes were effective in facilitating export expan-sion primarily along the extensive margin (ie through an increase in the num-ber of products exported or in the number of export markets served) ratherthan along the intensive margin (an increase in exports of existing products toexisting markets). He also shows that programmes benefited small and rela-tively inexperienced firms more than larger and already established exporters,and that bundled services providing support to firms throughout the export-development process were more effective than isolated actions.
Gourdon et al use similar ex post evaluation methods in Chapter 3 to assessthe impact of a World Bank-financed export promotion programme in Tunisia(FAMEX), which provided a mixture of counselling and matching grants tonew exporters. Their findings suggest that export promotion has a significanteffect on overall export growth: a 39% increase in the average annual growthrate of programme beneficiaries relative to the control group over a four-yearperiod. The effect of the programme on the extensive margin of exports—in terms of products and destinations—is more subdued: about 5% highergrowth for beneficiaries, which is significant only for destinations. They alsofind a significant increase in employment growth, ie 10% more for programmebeneficiaries than for control firms. The effect on export growth is strongerfor firms that were initially only marginal exporters (exports represented lessthan 20% of turnover). Interestingly, their sample also includes service firms,for which the effect of export promotion is significantly larger than for man-ufacturing firms.
In Chapter 6, Datt and Yang analyse a natural experiment in which thePhilippines government suddenly reduced the minimum value thresholdunder which shipments were exempt from pre-shipment inspections (PSIs),closing a loophole that had encouraged importers to slice shipments inorder to escape inspection. They show that the reform failed to curb under-invoicing, and thus to raise duty collection, as importers switched to an alter-native loophole, namely, the use of an export-processing zone (EPZ). As thisalternative loophole involved high fixed costs (setting up a presence in theEPZ), in the end the Philippine government was no better off, while importerswere worse off. The authors also discuss the effects of a related policy reformin Colombia, where the government sought to remedy undervaluation of cer-tain imports by mandating PSI on a subset of products. This, however, leftopen the loophole of misclassification of those products as similar productsthat did not require a PSI. Both cases illustrate the importance of careful,incentive-compatible reform design.
Impact Evaluation of Trade Assistance: Paving the Way 5
0
10
20
30
40
50T
ariff
s (%
)
0 2000 4000 6000 8000
GDP per capita (US dollars)
1980s 1990s2000s
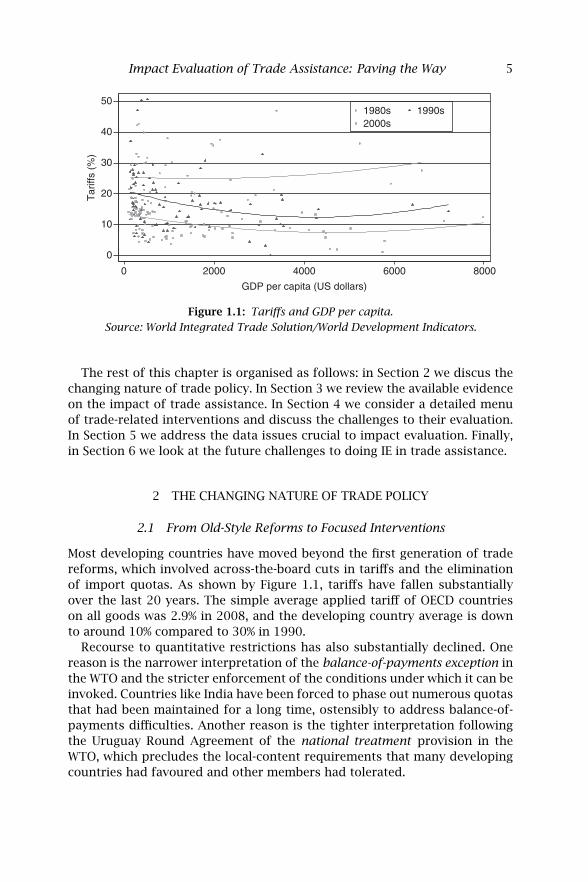
Figure 1.1: Tariffs and GDP per capita.
Source: World Integrated Trade Solution/World Development Indicators.
The rest of this chapter is organised as follows: in Section 2 we discus thechanging nature of trade policy. In Section 3 we review the available evidenceon the impact of trade assistance. In Section 4 we consider a detailed menuof trade-related interventions and discuss the challenges to their evaluation.In Section 5 we address the data issues crucial to impact evaluation. Finally,in Section 6 we look at the future challenges to doing IE in trade assistance.
2 THE CHANGING NATURE OF TRADE POLICY
2.1 From Old-Style Reforms to Focused Interventions
Most developing countries have moved beyond the first generation of tradereforms, which involved across-the-board cuts in tariffs and the eliminationof import quotas. As shown by Figure 1.1, tariffs have fallen substantiallyover the last 20 years. The simple average applied tariff of OECD countrieson all goods was 2.9% in 2008, and the developing country average is downto around 10% compared to 30% in 1990.
Recourse to quantitative restrictions has also substantially declined. Onereason is the narrower interpretation of the balance-of-payments exception inthe WTO and the stricter enforcement of the conditions under which it can beinvoked. Countries like India have been forced to phase out numerous quotasthat had been maintained for a long time, ostensibly to address balance-of-payments difficulties. Another reason is the tighter interpretation followingthe Uruguay Round Agreement of the national treatment provision in theWTO, which precludes the local-content requirements that many developingcountries had favoured and other members had tolerated.
6 Where to Spend the Next Million?
IBRD IDA IFCU
S d
olla
rs (
mill
ions
)
30,000
25,000
20,000
15,000
10,000
0
5,000
FY02 FY03 FY04 FY05 FY06 FY07 FY08 FY09 FY10
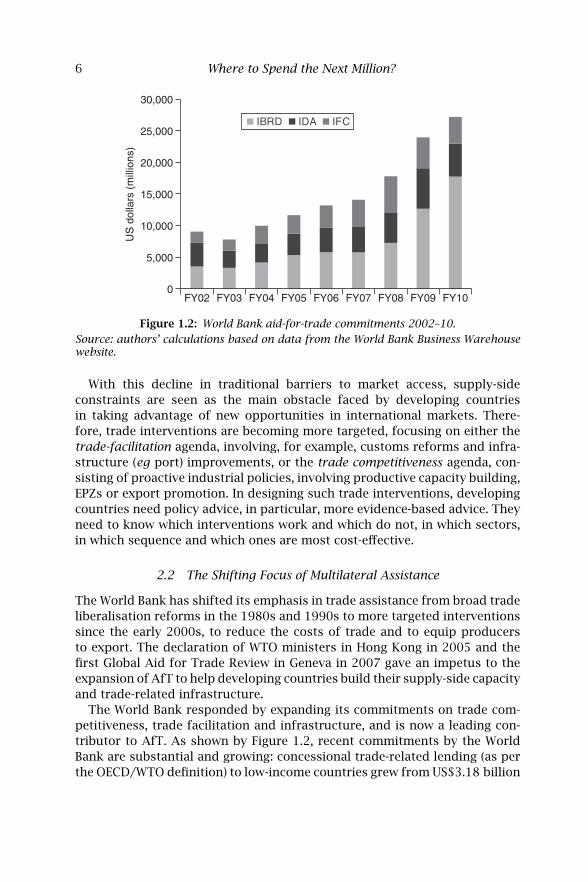
Figure 1.2: World Bank aid-for-trade commitments 2002–10.
Source: authors’ calculations based on data from the World Bank Business Warehousewebsite.
With this decline in traditional barriers to market access, supply-sideconstraints are seen as the main obstacle faced by developing countriesin taking advantage of new opportunities in international markets. There-fore, trade interventions are becoming more targeted, focusing on either thetrade-facilitation agenda, involving, for example, customs reforms and infra-structure (eg port) improvements, or the trade competitiveness agenda, con-sisting of proactive industrial policies, involving productive capacity building,EPZs or export promotion. In designing such trade interventions, developingcountries need policy advice, in particular, more evidence-based advice. Theyneed to know which interventions work and which do not, in which sectors,in which sequence and which ones are most cost-effective.
2.2 The Shifting Focus of Multilateral Assistance
The World Bank has shifted its emphasis in trade assistance from broad tradeliberalisation reforms in the 1980s and 1990s to more targeted interventionssince the early 2000s, to reduce the costs of trade and to equip producersto export. The declaration of WTO ministers in Hong Kong in 2005 and thefirst Global Aid for Trade Review in Geneva in 2007 gave an impetus to theexpansion of AfT to help developing countries build their supply-side capacityand trade-related infrastructure.
The World Bank responded by expanding its commitments on trade com-petitiveness, trade facilitation and infrastructure, and is now a leading con-tributor to AfT. As shown by Figure 1.2, recent commitments by the WorldBank are substantial and growing: concessional trade-related lending (as perthe OECD/WTO definition) to low-income countries grew from US$3.18 billion
Impact Evaluation of Trade Assistance: Paving the Way 7
Tradecompetitiveness
(32%)Tradefacilitation –infrastructure
(47%)
Tradefacilitation –
institutional (12%)
Trade-relatedbudget support
(7%)
Trade policy and regulations
(2%)
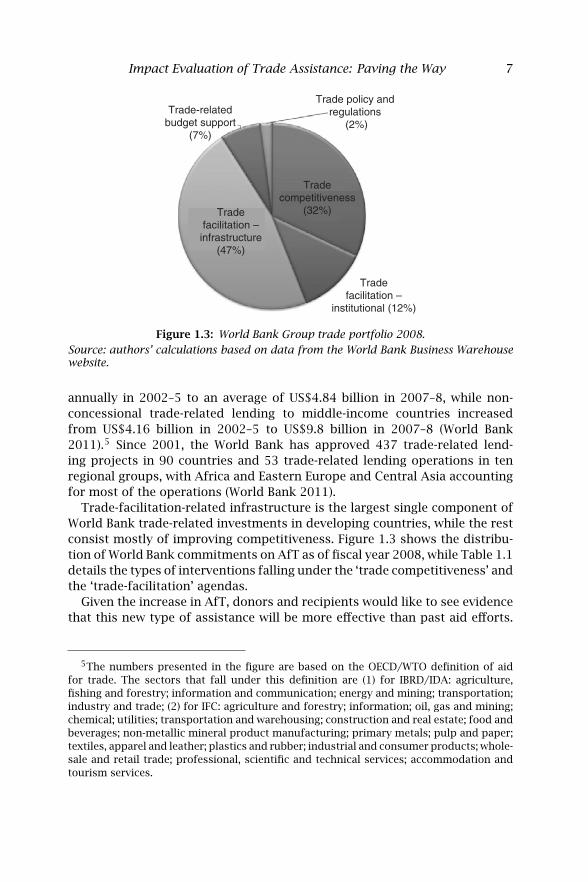
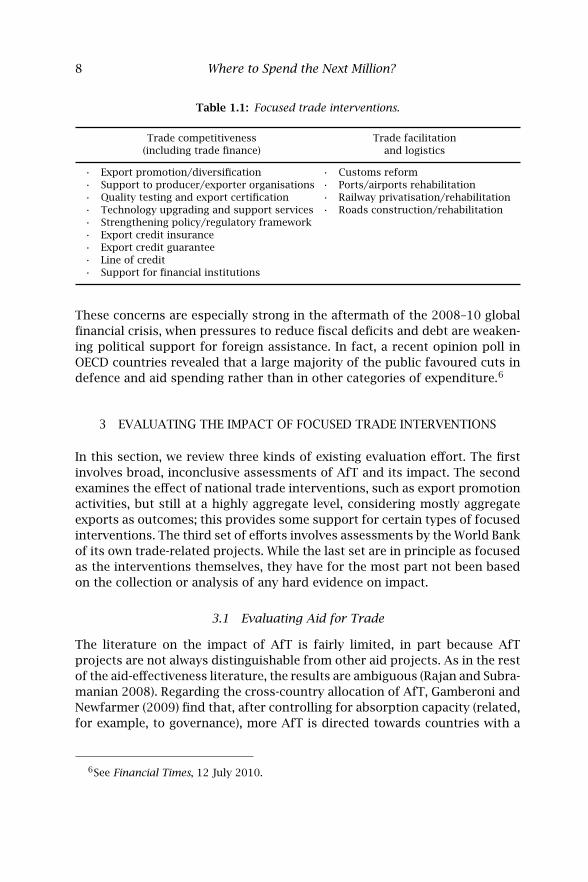
Figure 1.3: World Bank Group trade portfolio 2008.
Source: authors’ calculations based on data from the World Bank Business Warehousewebsite.
annually in 2002–5 to an average of US$4.84 billion in 2007–8, while non-concessional trade-related lending to middle-income countries increasedfrom US$4.16 billion in 2002–5 to US$9.8 billion in 2007–8 (World Bank2011).5 Since 2001, the World Bank has approved 437 trade-related lend-ing projects in 90 countries and 53 trade-related lending operations in tenregional groups, with Africa and Eastern Europe and Central Asia accountingfor most of the operations (World Bank 2011).
Trade-facilitation-related infrastructure is the largest single component ofWorld Bank trade-related investments in developing countries, while the restconsist mostly of improving competitiveness. Figure 1.3 shows the distribu-tion of World Bank commitments on AfT as of fiscal year 2008, while Table 1.1details the types of interventions falling under the ‘trade competitiveness’ andthe ‘trade-facilitation’ agendas.
Given the increase in AfT, donors and recipients would like to see evidencethat this new type of assistance will be more effective than past aid efforts.
5The numbers presented in the figure are based on the OECD/WTO definition of aidfor trade. The sectors that fall under this definition are (1) for IBRD/IDA: agriculture,fishing and forestry; information and communication; energy and mining; transportation;industry and trade; (2) for IFC: agriculture and forestry; information; oil, gas and mining;chemical; utilities; transportation and warehousing; construction and real estate; food andbeverages; non-metallic mineral product manufacturing; primary metals; pulp and paper;textiles, apparel and leather; plastics and rubber; industrial and consumer products; whole-sale and retail trade; professional, scientific and technical services; accommodation andtourism services.
8 Where to Spend the Next Million?
Table 1.1: Focused trade interventions.
Trade competitiveness Trade facilitation(including trade finance) and logistics
• Export promotion/diversification • Customs reform• Support to producer/exporter organisations • Ports/airports rehabilitation• Quality testing and export certification • Railway privatisation/rehabilitation• Technology upgrading and support services • Roads construction/rehabilitation• Strengthening policy/regulatory framework• Export credit insurance• Export credit guarantee• Line of credit• Support for financial institutions
These concerns are especially strong in the aftermath of the 2008–10 globalfinancial crisis, when pressures to reduce fiscal deficits and debt are weaken-ing political support for foreign assistance. In fact, a recent opinion poll inOECD countries revealed that a large majority of the public favoured cuts indefence and aid spending rather than in other categories of expenditure.6
3 EVALUATING THE IMPACT OF FOCUSED TRADE INTERVENTIONS
In this section, we review three kinds of existing evaluation effort. The firstinvolves broad, inconclusive assessments of AfT and its impact. The secondexamines the effect of national trade interventions, such as export promotionactivities, but still at a highly aggregate level, considering mostly aggregateexports as outcomes; this provides some support for certain types of focusedinterventions. The third set of efforts involves assessments by the World Bankof its own trade-related projects. While the last set are in principle as focusedas the interventions themselves, they have for the most part not been basedon the collection or analysis of any hard evidence on impact.
3.1 Evaluating Aid for Trade
The literature on the impact of AfT is fairly limited, in part because AfTprojects are not always distinguishable from other aid projects. As in the restof the aid-effectiveness literature, the results are ambiguous (Rajan and Subra-manian 2008). Regarding the cross-country allocation of AfT, Gamberoni andNewfarmer (2009) find that, after controlling for absorption capacity (related,for example, to governance), more AfT is directed towards countries with a
6See Financial Times, 12 July 2010.
Impact Evaluation of Trade Assistance: Paving the Way 9
higher demand for AfT as measured by indicators of ‘underperformance’ intrade.7
One strand of the literature explores whether AfT positively affects exportsfrom the donor country to the recipient country given that, until the early1990s, over half of all bilateral aid was at least partly tied to donor exports.Using a gravity equation, Wagner (2003) shows that this form of trade wasindeed boosted; but Osei et al (2004), using a gravity equation in first differ-ences for a panel of four European donors and 26 African recipients, foundan unstable and insignificant impact of aid on exports from donor to recipi-ent. Recently, Nelson and Silva (2008) have used a more conventional gravityequation, including bilateral aid flows as a regressor (instrumented by theirone-year lagged value), and have found a small but significant impact on tradeflows from donor to recipient.
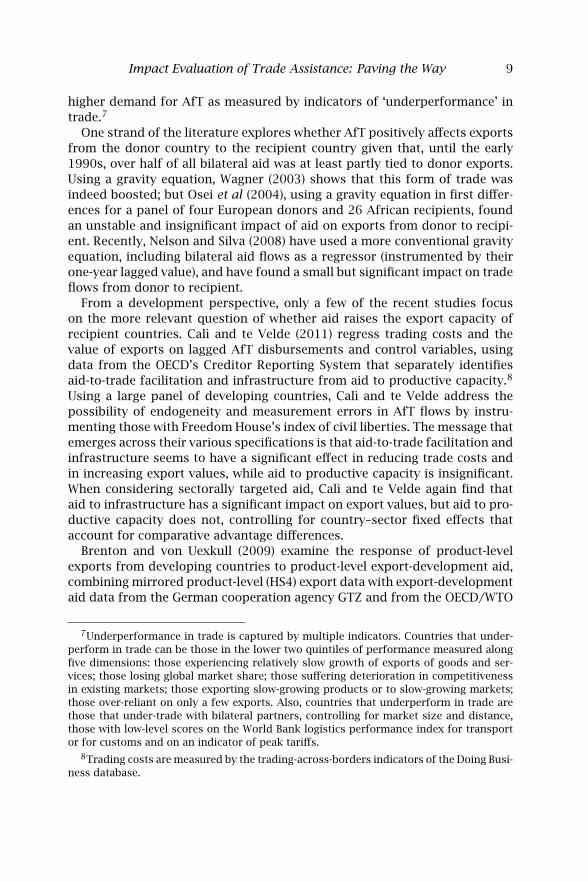
From a development perspective, only a few of the recent studies focuson the more relevant question of whether aid raises the export capacity ofrecipient countries. Calì and te Velde (2011) regress trading costs and thevalue of exports on lagged AfT disbursements and control variables, usingdata from the OECD’s Creditor Reporting System that separately identifiesaid-to-trade facilitation and infrastructure from aid to productive capacity.8
Using a large panel of developing countries, Calì and te Velde address thepossibility of endogeneity and measurement errors in AfT flows by instru-menting those with Freedom House’s index of civil liberties. The message thatemerges across their various specifications is that aid-to-trade facilitation andinfrastructure seems to have a significant effect in reducing trade costs andin increasing export values, while aid to productive capacity is insignificant.When considering sectorally targeted aid, Calì and te Velde again find thataid to infrastructure has a significant impact on export values, but aid to pro-ductive capacity does not, controlling for country–sector fixed effects thataccount for comparative advantage differences.
Brenton and von Uexkull (2009) examine the response of product-levelexports from developing countries to product-level export-development aid,combining mirrored product-level (HS4) export data with export-developmentaid data from the German cooperation agency GTZ and from the OECD/WTO
7Underperformance in trade is captured by multiple indicators. Countries that under-perform in trade can be those in the lower two quintiles of performance measured alongfive dimensions: those experiencing relatively slow growth of exports of goods and ser-vices; those losing global market share; those suffering deterioration in competitivenessin existing markets; those exporting slow-growing products or to slow-growing markets;those over-reliant on only a few exports. Also, countries that underperform in trade arethose that under-trade with bilateral partners, controlling for market size and distance,those with low-level scores on the World Bank logistics performance index for transportor for customs and on an indicator of peak tariffs.
8Trading costs are measured by the trading-across-borders indicators of the Doing Busi-ness database.
10 Where to Spend the Next Million?
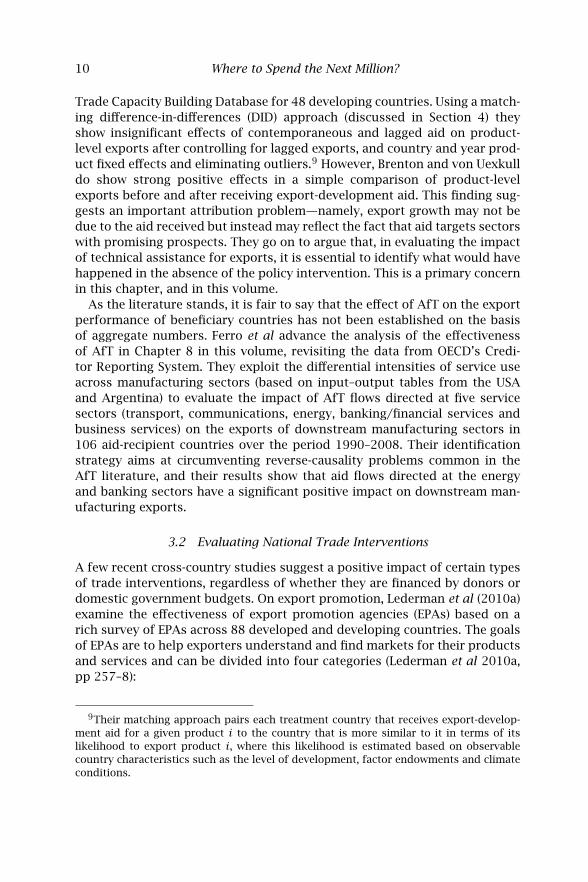
Trade Capacity Building Database for 48 developing countries. Using a match-ing difference-in-differences (DID) approach (discussed in Section 4) theyshow insignificant effects of contemporaneous and lagged aid on product-level exports after controlling for lagged exports, and country and year prod-uct fixed effects and eliminating outliers.9 However, Brenton and von Uexkulldo show strong positive effects in a simple comparison of product-levelexports before and after receiving export-development aid. This finding sug-gests an important attribution problem—namely, export growth may not bedue to the aid received but instead may reflect the fact that aid targets sectorswith promising prospects. They go on to argue that, in evaluating the impactof technical assistance for exports, it is essential to identify what would havehappened in the absence of the policy intervention. This is a primary concernin this chapter, and in this volume.
As the literature stands, it is fair to say that the effect of AfT on the exportperformance of beneficiary countries has not been established on the basisof aggregate numbers. Ferro et al advance the analysis of the effectivenessof AfT in Chapter 8 in this volume, revisiting the data from OECD’s Credi-tor Reporting System. They exploit the differential intensities of service useacross manufacturing sectors (based on input–output tables from the USAand Argentina) to evaluate the impact of AfT flows directed at five servicesectors (transport, communications, energy, banking/financial services andbusiness services) on the exports of downstream manufacturing sectors in106 aid-recipient countries over the period 1990–2008. Their identificationstrategy aims at circumventing reverse-causality problems common in theAfT literature, and their results show that aid flows directed at the energyand banking sectors have a significant positive impact on downstream man-ufacturing exports.
3.2 Evaluating National Trade Interventions
A few recent cross-country studies suggest a positive impact of certain typesof trade interventions, regardless of whether they are financed by donors ordomestic government budgets. On export promotion, Lederman et al (2010a)examine the effectiveness of export promotion agencies (EPAs) based on arich survey of EPAs across 88 developed and developing countries. The goalsof EPAs are to help exporters understand and find markets for their productsand services and can be divided into four categories (Lederman et al 2010a,pp 257–8):
9Their matching approach pairs each treatment country that receives export-develop-ment aid for a given product i to the country that is more similar to it in terms of itslikelihood to export product i, where this likelihood is estimated based on observablecountry characteristics such as the level of development, factor endowments and climateconditions.
Impact Evaluation of Trade Assistance: Paving the Way 11
• country image building (advertising, promotional events, but also advo-cacy);
• export support services (exporter training, technical assistance, capacitybuilding, including regulatory compliance, information on trade finance,logistics, customs, packaging, pricing);
• marketing (trade fairs, exporter and importer missions, follow-up ser-vices offered by representatives abroad);
• market research and publications (general, sector, and firm-level infor-mation, such as market surveys, online information on export markets,publications encouraging firms to export, importer and exporter contactdatabases).
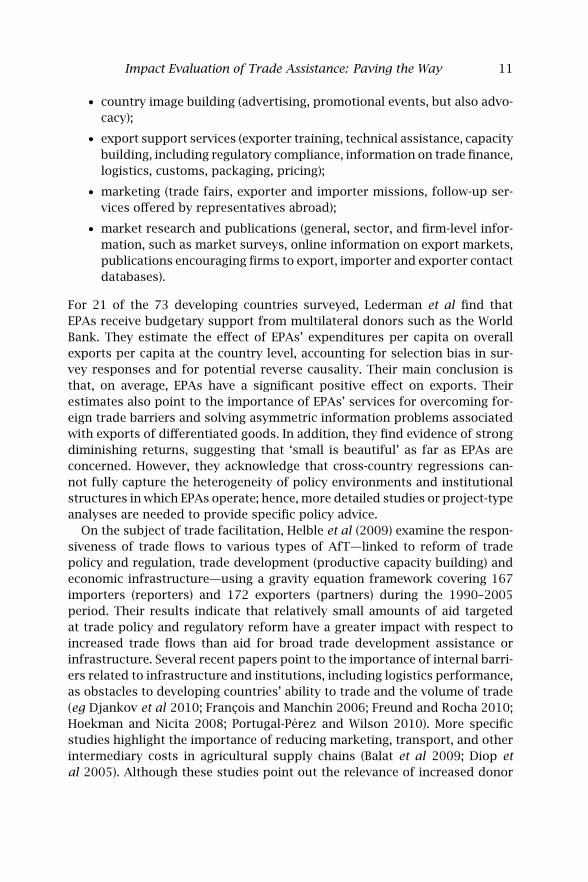
For 21 of the 73 developing countries surveyed, Lederman et al find thatEPAs receive budgetary support from multilateral donors such as the WorldBank. They estimate the effect of EPAs’ expenditures per capita on overallexports per capita at the country level, accounting for selection bias in sur-vey responses and for potential reverse causality. Their main conclusion isthat, on average, EPAs have a significant positive effect on exports. Theirestimates also point to the importance of EPAs’ services for overcoming for-eign trade barriers and solving asymmetric information problems associatedwith exports of differentiated goods. In addition, they find evidence of strongdiminishing returns, suggesting that ‘small is beautiful’ as far as EPAs areconcerned. However, they acknowledge that cross-country regressions can-not fully capture the heterogeneity of policy environments and institutionalstructures in which EPAs operate; hence, more detailed studies or project-typeanalyses are needed to provide specific policy advice.
On the subject of trade facilitation, Helble et al (2009) examine the respon-siveness of trade flows to various types of AfT—linked to reform of tradepolicy and regulation, trade development (productive capacity building) andeconomic infrastructure—using a gravity equation framework covering 167importers (reporters) and 172 exporters (partners) during the 1990–2005period. Their results indicate that relatively small amounts of aid targetedat trade policy and regulatory reform have a greater impact with respect toincreased trade flows than aid for broad trade development assistance orinfrastructure. Several recent papers point to the importance of internal barri-ers related to infrastructure and institutions, including logistics performance,as obstacles to developing countries’ ability to trade and the volume of trade(eg Djankov et al 2010; François and Manchin 2006; Freund and Rocha 2010;Hoekman and Nicita 2008; Portugal-Pérez and Wilson 2010). More specificstudies highlight the importance of reducing marketing, transport, and otherintermediary costs in agricultural supply chains (Balat et al 2009; Diop etal 2005). Although these studies point out the relevance of increased donor
12 Where to Spend the Next Million?
assistance to trade facilitation, they do not help delineate the policies andprogrammes that would be most effective in cutting trade costs.10
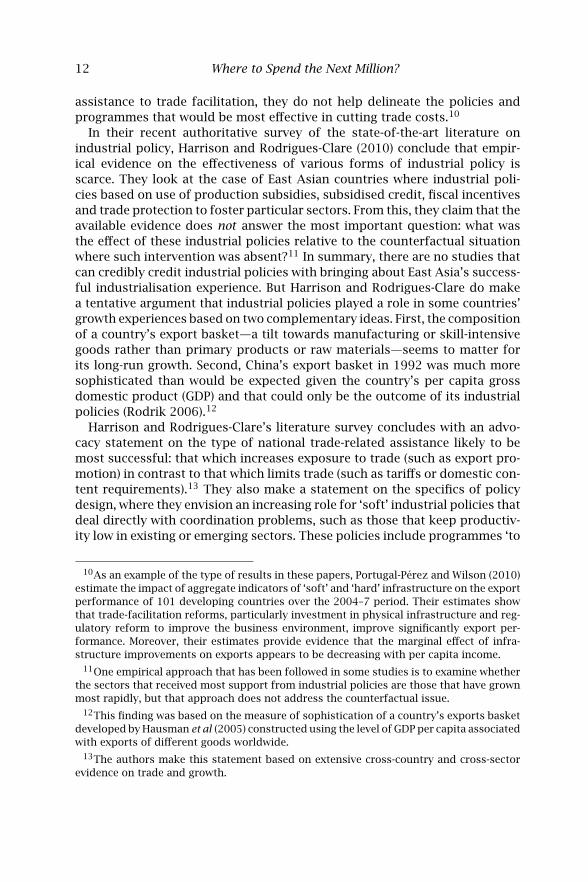
In their recent authoritative survey of the state-of-the-art literature onindustrial policy, Harrison and Rodrigues-Clare (2010) conclude that empir-ical evidence on the effectiveness of various forms of industrial policy isscarce. They look at the case of East Asian countries where industrial poli-cies based on use of production subsidies, subsidised credit, fiscal incentivesand trade protection to foster particular sectors. From this, they claim that theavailable evidence does not answer the most important question: what wasthe effect of these industrial policies relative to the counterfactual situationwhere such intervention was absent?11 In summary, there are no studies thatcan credibly credit industrial policies with bringing about East Asia’s success-ful industrialisation experience. But Harrison and Rodrigues-Clare do makea tentative argument that industrial policies played a role in some countries’growth experiences based on two complementary ideas. First, the compositionof a country’s export basket—a tilt towards manufacturing or skill-intensivegoods rather than primary products or raw materials—seems to matter forits long-run growth. Second, China’s export basket in 1992 was much moresophisticated than would be expected given the country’s per capita grossdomestic product (GDP) and that could only be the outcome of its industrialpolicies (Rodrik 2006).12
Harrison and Rodrigues-Clare’s literature survey concludes with an advo-cacy statement on the type of national trade-related assistance likely to bemost successful: that which increases exposure to trade (such as export pro-motion) in contrast to that which limits trade (such as tariffs or domestic con-tent requirements).13 They also make a statement on the specifics of policydesign, where they envision an increasing role for ‘soft’ industrial policies thatdeal directly with coordination problems, such as those that keep productiv-ity low in existing or emerging sectors. These policies include programmes ‘to
10As an example of the type of results in these papers, Portugal-Pérez and Wilson (2010)estimate the impact of aggregate indicators of ‘soft’ and ‘hard’ infrastructure on the exportperformance of 101 developing countries over the 2004–7 period. Their estimates showthat trade-facilitation reforms, particularly investment in physical infrastructure and reg-ulatory reform to improve the business environment, improve significantly export per-formance. Moreover, their estimates provide evidence that the marginal effect of infra-structure improvements on exports appears to be decreasing with per capita income.
11One empirical approach that has been followed in some studies is to examine whetherthe sectors that received most support from industrial policies are those that have grownmost rapidly, but that approach does not address the counterfactual issue.
12This finding was based on the measure of sophistication of a country’s exports basketdeveloped by Hausman et al (2005) constructed using the level of GDP per capita associatedwith exports of different goods worldwide.
13The authors make this statement based on extensive cross-country and cross-sectorevidence on trade and growth.
Impact Evaluation of Trade Assistance: Paving the Way 13
help particular clusters by increasing supply of skilled workers, encouragingtechnology adoption, and improving regulation and infrastructure’ (Harrisonand Rodriguez-Clare 2010, p 4112).14 The problem with this statement is thatit has a ‘magic wand’ aspect, because the survey includes little supporting evi-dence. In fact, the absence of evidence for the policy recommendations thesurvey offers is a reason for our effort to initiate new research on these issues.
3.3 Evaluating the World Bank’s Trade Programmes
In principle, World Bank trade-related projects should be a key source ofevidence on the effects of specific trade interventions, which could becomethe basis for further evidence-based policy advice. In practice, though, this israrely the case. Few interventions have undergone rigorous impact evaluation.
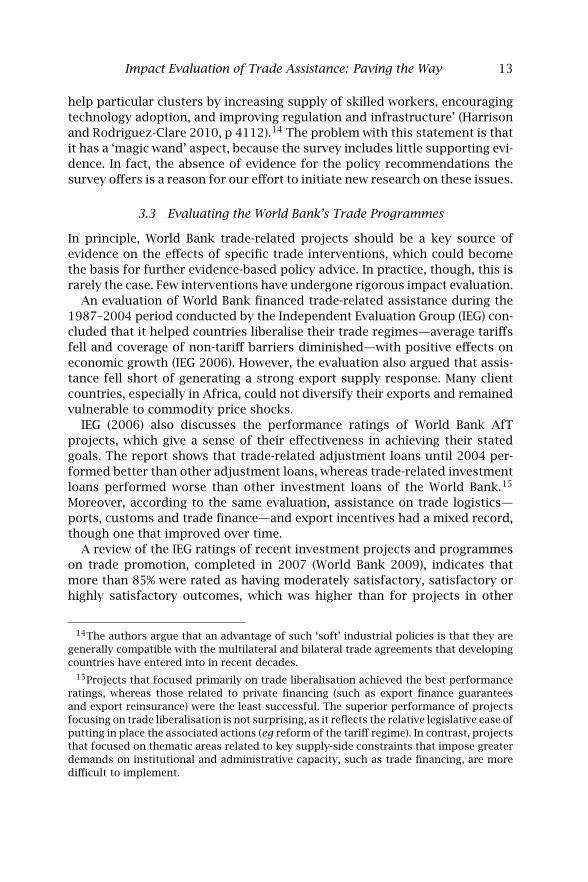
An evaluation of World Bank financed trade-related assistance during the1987–2004 period conducted by the Independent Evaluation Group (IEG) con-cluded that it helped countries liberalise their trade regimes—average tariffsfell and coverage of non-tariff barriers diminished—with positive effects oneconomic growth (IEG 2006). However, the evaluation also argued that assis-tance fell short of generating a strong export supply response. Many clientcountries, especially in Africa, could not diversify their exports and remainedvulnerable to commodity price shocks.
IEG (2006) also discusses the performance ratings of World Bank AfTprojects, which give a sense of their effectiveness in achieving their statedgoals. The report shows that trade-related adjustment loans until 2004 per-formed better than other adjustment loans, whereas trade-related investmentloans performed worse than other investment loans of the World Bank.15
Moreover, according to the same evaluation, assistance on trade logistics—ports, customs and trade finance—and export incentives had a mixed record,though one that improved over time.
A review of the IEG ratings of recent investment projects and programmeson trade promotion, completed in 2007 (World Bank 2009), indicates thatmore than 85% were rated as having moderately satisfactory, satisfactory orhighly satisfactory outcomes, which was higher than for projects in other
14The authors argue that an advantage of such ‘soft’ industrial policies is that they aregenerally compatible with the multilateral and bilateral trade agreements that developingcountries have entered into in recent decades.
15Projects that focused primarily on trade liberalisation achieved the best performanceratings, whereas those related to private financing (such as export finance guaranteesand export reinsurance) were the least successful. The superior performance of projectsfocusing on trade liberalisation is not surprising, as it reflects the relative legislative ease ofputting in place the associated actions (eg reform of the tariff regime). In contrast, projectsthat focused on thematic areas related to key supply-side constraints that impose greaterdemands on institutional and administrative capacity, such as trade financing, are moredifficult to implement.
14 Where to Spend the Next Million?
areas.16 Aid-for-trade projects also had higher estimated economic rates ofreturn (around 32%) than other non-trade related projects (around 23.7%).17
While they provide valuable insights, the IEG evaluations of trade assistanceoffer limited evidence to support focused trade interventions. Moreover, theevaluation does not cover much of the recent increase in AfT assistance forexport promotion and trade facilitation.
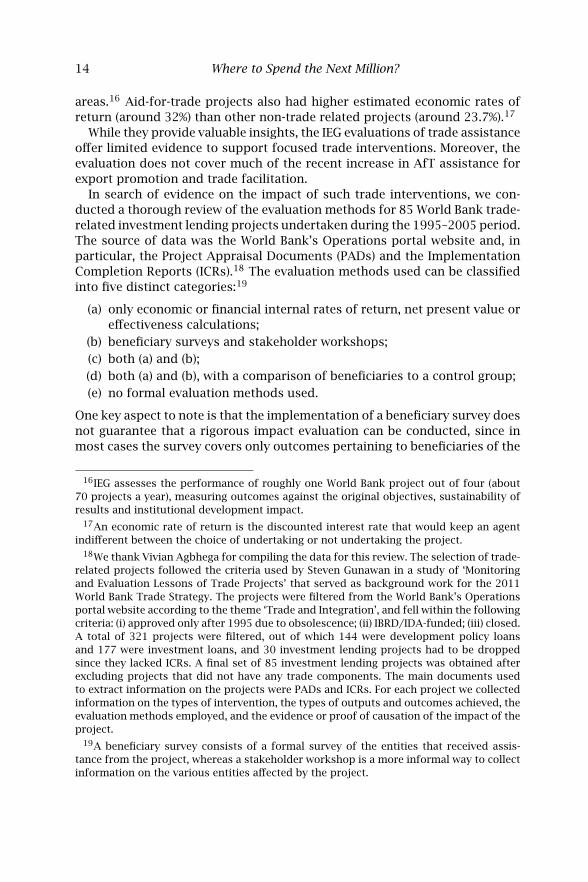
In search of evidence on the impact of such trade interventions, we con-ducted a thorough review of the evaluation methods for 85 World Bank trade-related investment lending projects undertaken during the 1995–2005 period.The source of data was the World Bank’s Operations portal website and, inparticular, the Project Appraisal Documents (PADs) and the ImplementationCompletion Reports (ICRs).18 The evaluation methods used can be classifiedinto five distinct categories:19
(a) only economic or financial internal rates of return, net present value oreffectiveness calculations;
(b) beneficiary surveys and stakeholder workshops;
(c) both (a) and (b);
(d) both (a) and (b), with a comparison of beneficiaries to a control group;
(e) no formal evaluation methods used.
One key aspect to note is that the implementation of a beneficiary survey doesnot guarantee that a rigorous impact evaluation can be conducted, since inmost cases the survey covers only outcomes pertaining to beneficiaries of the
16IEG assesses the performance of roughly one World Bank project out of four (about70 projects a year), measuring outcomes against the original objectives, sustainability ofresults and institutional development impact.
17An economic rate of return is the discounted interest rate that would keep an agentindifferent between the choice of undertaking or not undertaking the project.
18We thank Vivian Agbhega for compiling the data for this review. The selection of trade-related projects followed the criteria used by Steven Gunawan in a study of ‘Monitoringand Evaluation Lessons of Trade Projects’ that served as background work for the 2011World Bank Trade Strategy. The projects were filtered from the World Bank’s Operationsportal website according to the theme ‘Trade and Integration’, and fell within the followingcriteria: (i) approved only after 1995 due to obsolescence; (ii) IBRD/IDA-funded; (iii) closed.A total of 321 projects were filtered, out of which 144 were development policy loansand 177 were investment loans, and 30 investment lending projects had to be droppedsince they lacked ICRs. A final set of 85 investment lending projects was obtained afterexcluding projects that did not have any trade components. The main documents usedto extract information on the projects were PADs and ICRs. For each project we collectedinformation on the types of intervention, the types of outputs and outcomes achieved, theevaluation methods employed, and the evidence or proof of causation of the impact of theproject.
19A beneficiary survey consists of a formal survey of the entities that received assis-tance from the project, whereas a stakeholder workshop is a more informal way to collectinformation on the various entities affected by the project.
Impact Evaluation of Trade Assistance: Paving the Way 15
0 5 10 15 20 25 30 35
No formal evaluation method
Both rates of return and beneficiaries’surveys with a comparison
of beneficiaries to control group
Only beneficiaries’ surveys/stakeholderworkshops
Both rates of return and beneficiaries’surveys/stakeholder workshops
Only rates of return
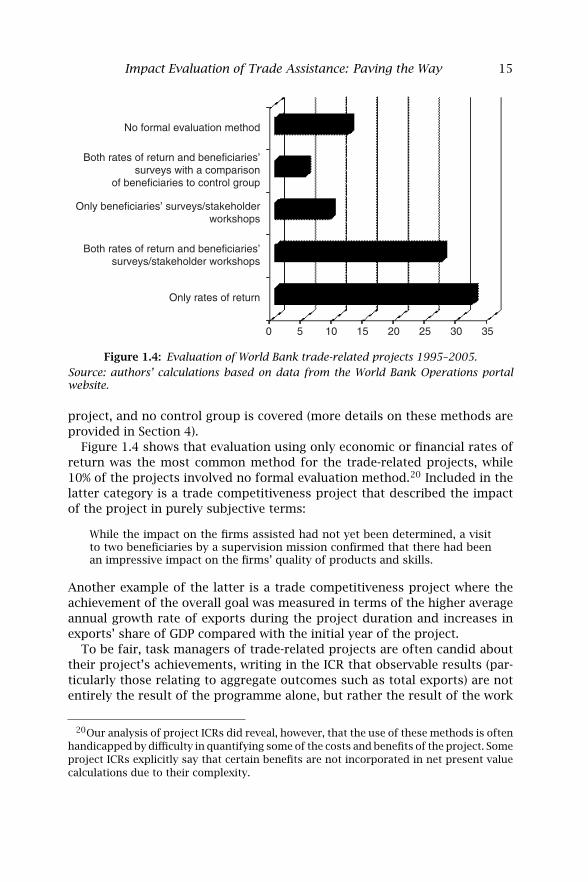
Figure 1.4: Evaluation of World Bank trade-related projects 1995–2005.
Source: authors’ calculations based on data from the World Bank Operations portalwebsite.
project, and no control group is covered (more details on these methods areprovided in Section 4).
Figure 1.4 shows that evaluation using only economic or financial rates ofreturn was the most common method for the trade-related projects, while10% of the projects involved no formal evaluation method.20 Included in thelatter category is a trade competitiveness project that described the impactof the project in purely subjective terms:
While the impact on the firms assisted had not yet been determined, a visitto two beneficiaries by a supervision mission confirmed that there had beenan impressive impact on the firms’ quality of products and skills.
Another example of the latter is a trade competitiveness project where theachievement of the overall goal was measured in terms of the higher averageannual growth rate of exports during the project duration and increases inexports’ share of GDP compared with the initial year of the project.
To be fair, task managers of trade-related projects are often candid abouttheir project’s achievements, writing in the ICR that observable results (par-ticularly those relating to aggregate outcomes such as total exports) are notentirely the result of the programme alone, but rather the result of the work
20Our analysis of project ICRs did reveal, however, that the use of these methods is oftenhandicapped by difficulty in quantifying some of the costs and benefits of the project. Someproject ICRs explicitly say that certain benefits are not incorporated in net present valuecalculations due to their complexity.
16 Where to Spend the Next Million?
Effects partly or exclusivelyattributable to the project
Welfare effects on target groupdirectly attributable to the project
Physical goods and servicesproduced by the project
Actions and tasks carried outto transform inputs into outputs
Financial, human, and material resources required
Impactevaluation
Implementationmonitoring
Impact
Outcomes
Outputs
Inputs
Activities
Figure 1.5: From inputs to impact.
and resources of different institutions and sectors. The most striking fact inFigure 1.4 is that only 6% of projects (5 out of 85 projects) included a rig-orous impact evaluation, involving a proper comparison of the outcomes ofproject beneficiaries with those of a control group. But even in such cases, theimpact-evaluation method raised certain issues, which we discuss in the nextsection.
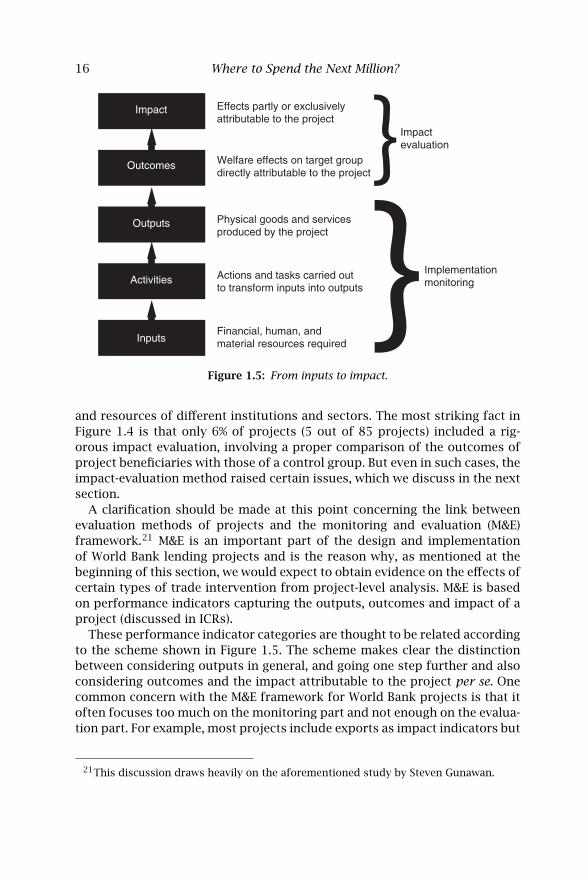
A clarification should be made at this point concerning the link betweenevaluation methods of projects and the monitoring and evaluation (M&E)framework.21 M&E is an important part of the design and implementationof World Bank lending projects and is the reason why, as mentioned at thebeginning of this section, we would expect to obtain evidence on the effects ofcertain types of trade intervention from project-level analysis. M&E is basedon performance indicators capturing the outputs, outcomes and impact of aproject (discussed in ICRs).
These performance indicator categories are thought to be related accordingto the scheme shown in Figure 1.5. The scheme makes clear the distinctionbetween considering outputs in general, and going one step further and alsoconsidering outcomes and the impact attributable to the project per se. Onecommon concern with the M&E framework for World Bank projects is that itoften focuses too much on the monitoring part and not enough on the evalua-tion part. For example, most projects include exports as impact indicators but
21This discussion draws heavily on the aforementioned study by Steven Gunawan.
Impact Evaluation of Trade Assistance: Paving the Way 17
do not include a proper impact-evaluation strategy that allows for attributionto the project of an increase in exports.
In addition to World Bank investment lending projects, the World Bank alsoproduces a large amount of analytical work—economic and sector work—where we could expect to find evidence that supports certain trade inter-ventions. The key trade-related analytical pieces—diagnostic trade integra-tion studies—do highlight the high costs of producing goods and servicesfor export, and for delivering them to foreign markets, as being the majorbarriers to trade integration in less developed countries, and point to infra-structure as the most pressing constraint. But they do not inform the devel-opment community about which interventions work and which do not, andwhich interventions are most cost-effective.
4 CHALLENGES TO THE EVALUATION OF TRADE INTERVENTIONS
4.1 Striving for Internal and External Validity
The key problem that IE addresses is attribution: making sure that observedchanges in outcome variables are caused by the programme or policy underevaluation and not by outside influences. Many outside influences can con-found the identification of a programme or policy’s impact. For instance, anexport promotion scheme put in place in 2007 would see its positive impactconfounded by the negative impact of the global crisis of 2008–9; a simplebefore–after comparison of outcomes is likely to suggest a negative impactof the programme.
In order to filter out these influences, we would want to know how bene-ficiary firms would have performed in the absence of the programme (pre-sumably worse). But the data needed for this counterfactual does not exist,because firms cannot be both beneficiaries and non-beneficiaries at the sametime. This missing data problem is solved by using as a counterfactual the per-formance of other firms that did not benefit from the programme. By analogywith medical sciences, where IE methods originate, beneficiaries are called thetreatment group and non-beneficiaries the control group.22
The central idea of IE is best illustrated by a widely used techniquecalled double-differences or difference-in-differences. Using this technique,the effect of a programme is assessed by comparing the performance of ben-eficiary firms before and after the treatment (first difference), and then bench-marking that difference by comparing it with the difference in performance
22A pedagogical reference to IE techniques can be found in Khandker et al (2010), whichcontains analytical guidance as well as case studies and Stata do-files. A formal treatmentcan be found in Blundell and Dias (2002).
18 Where to Spend the Next Million?
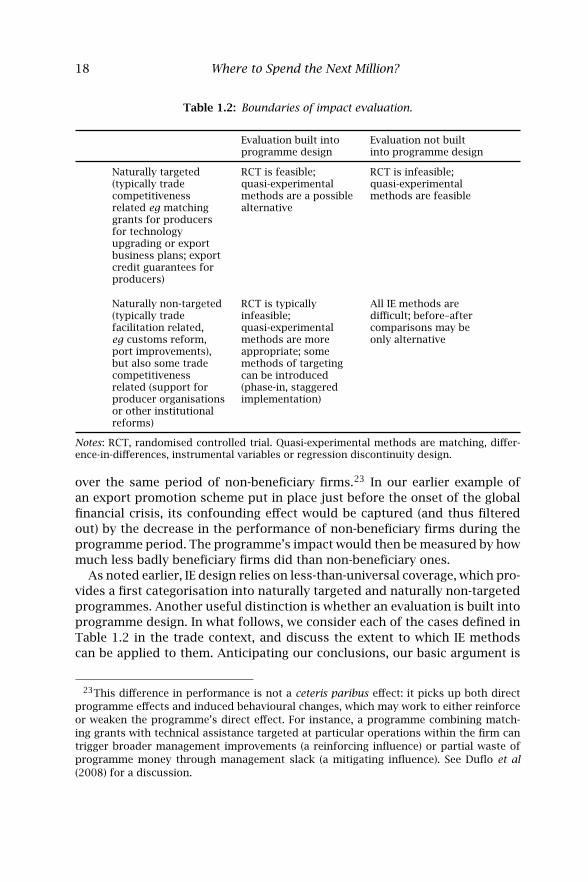
Table 1.2: Boundaries of impact evaluation.
Evaluation built intoprogramme design
Evaluation not builtinto programme design
Naturally targeted(typically tradecompetitivenessrelated eg matchinggrants for producersfor technologyupgrading or exportbusiness plans; exportcredit guarantees forproducers)
RCT is feasible;quasi-experimentalmethods are a possiblealternative
RCT is infeasible;quasi-experimentalmethods are feasible
Naturally non-targeted(typically tradefacilitation related,eg customs reform,port improvements),but also some tradecompetitivenessrelated (support forproducer organisationsor other institutionalreforms)
RCT is typicallyinfeasible;quasi-experimentalmethods are moreappropriate; somemethods of targetingcan be introduced(phase-in, staggeredimplementation)
All IE methods aredifficult; before–aftercomparisons may beonly alternative
Notes: RCT, randomised controlled trial. Quasi-experimental methods are matching, differ-ence-in-differences, instrumental variables or regression discontinuity design.
over the same period of non-beneficiary firms.23 In our earlier example ofan export promotion scheme put in place just before the onset of the globalfinancial crisis, its confounding effect would be captured (and thus filteredout) by the decrease in the performance of non-beneficiary firms during theprogramme period. The programme’s impact would then be measured by howmuch less badly beneficiary firms did than non-beneficiary ones.
As noted earlier, IE design relies on less-than-universal coverage, which pro-vides a first categorisation into naturally targeted and naturally non-targetedprogrammes. Another useful distinction is whether an evaluation is built intoprogramme design. In what follows, we consider each of the cases defined inTable 1.2 in the trade context, and discuss the extent to which IE methodscan be applied to them. Anticipating our conclusions, our basic argument is
23This difference in performance is not a ceteris paribus effect: it picks up both directprogramme effects and induced behavioural changes, which may work to either reinforceor weaken the programme’s direct effect. For instance, a programme combining match-ing grants with technical assistance targeted at particular operations within the firm cantrigger broader management improvements (a reinforcing influence) or partial waste ofprogramme money through management slack (a mitigating influence). See Duflo et al(2008) for a discussion.
Impact Evaluation of Trade Assistance: Paving the Way 19
that the scope for IE in trade assistance projects is broader than might at firstappear, provided that we are not wedded to a particular methodology (RCTs,for instance).
4.2 Naturally Targeted Interventions
Naturally targeted trade interventions include ‘clinical’ trade competitivenessprogrammes such as export promotion schemes through matching grantsfor supporting export business plans, through export-credit guarantees, orthrough firm-level technical assistance for technology upgrading, for acquisi-tion of international quality certifications or to meet other product standards.Because these interventions operate at the level of the firm, non-assisted firmscan in principle serve as the control group.
Randomised Control Trials
In naturally targeted interventions, when evaluation is built into programmedesign, a randomised controlled trial, sometimes called the ‘gold standard’ ofIE, is the best option. It consists of drawing beneficiaries at random from alarge pool of firms. By the law of large numbers, the average characteristics ofbeneficiaries will be the same as those of non-beneficiaries. Were this condi-tion not met, there would be a selection bias; that is, the programme’s impactwould be confounded not by outside factors, as before, but by differences inindividual characteristics.24
Randomisation can be carried out in many ways, some better than others.For instance, it is better to randomise among firms that have applied to aprogramme if the decision to apply correlates with unobserved characteristicsthat may affect performance, like managerial ability. Randomisation requiresthat the programme be designed for IE at the outset, and we will discuss laterin this chapter the difficulties that randomisation encounters, both in generaland in the context of trade-related assistance.
In Chapter 4 of this volume, Atkin and Khandelwal describe an ongoingproject for an RCT to assist microenterprises in the handloom weaving sectorin Akhmeem, Upper Egypt, to enter into export markets. The project’s objec-tive is to link those microenterprises to foreign buyers in the USA through theprovision of three kinds of service:
• putting Egyptian producers in contact with design consultants to de-velop patterns that can appeal to the tastes of US consumers;
• marketing assistance with US buyers;
• general business training.
24In other words, the probability of getting treatment, conditional on the firm’s charac-teristics, should be independent of the outcome.
20 Where to Spend the Next Million?
The project’s impact-evaluation design is simple: after drawing up a list ofpotentially viable producers/exporters in the sector and region, a randomgroup of them will be given the opportunity to export to the US marketwith the help of the three services listed above. The data on both outcomes(export performance) and covariates (producer characteristics) will be gen-erated through surveys conducted as part of the IE. A baseline survey willcollect information on all viable exporters—both those that will benefit fromthis intervention and those not approached before the services are provided.Another survey will be conducted long enough after the intervention in orderfor the effects to be tangible.
The World Bank is considering implementing RCTs in some of its ownprojects as well, although plans at this stage are preliminary. Candidateprojects include a customs border-post modernisation project at the borderbetween the Democratic Republic of Congo and Rwanda, where petty traderson foot, mostly women, are regularly exposed to corruption and harass-ment. The project would involve some of the women’s associations (withgroup randomisation) to designate customs brokers acting as shields betweenwomen and predatory customs officers. Another project involves the facili-tation of payments for small cross-border transactions through branchlessbanking near the Cameroon–Chad border. Currently, all payments for suchtransactions are made in cash, which hampers trade. At the very least, theproject would involve a natural experiment if branchless banking is allowedfor traders on one side of the border but not on the other; in addition, thedesign may involve, in a pilot phase, selected access to non-cash paymentsfor a randomly chosen treatment group.
One of the reasons why RCT is a preferred design for such experiments isthat randomisation does away with the need for complex econometric tech-niques to control for selection in non-experimental settings. However, RCTis no silver bullet in small sample environments, as it relies on the law oflarge numbers to ensure that expected untreated outcomes are equal in treat-ment and control groups. In low-income countries, interventions sometimestarget very small numbers of firms (McKenzie 2011).25 For instance, the Pes-ticides Initiative Program (PIP), a European Union (EU) technical-assistanceprogramme designed to help fruit and vegetable producers cope with EU stan-dards, covers less than a few dozen firms in some African countries (Jaud andCadot 2011). Randomisation is not an option in such environments. Quasi-
25McKenzie (2011) discusses the issue of small samples in World Bank private sectorsupport programmes in Africa. None of those programmes has been subject to rigorousimpact evaluations so far, but if such evaluations were to be conducted, researchers wouldbe faced with a serious problem of power given the small number of enterprises assistedby the projects and their large degree of heterogeneity.
Impact Evaluation of Trade Assistance: Paving the Way 21
experimental methods may not do very well either, but if a cross-country sam-ple is available with enough observations, econometrics may offer some scopeto control for cross-country heterogeneity.26 We will return to this small sam-ple issue in the context of naturally non-targeted interventions in Section 4.3when referring to the Cameroon customs project described by Cantens et alin Chapter 7.
In terms of practical feasibility, randomisation can be a hard sell with clientgovernments. Duflo et al (2008) note that the spread of RCTs in health, educa-tion and poverty reduction programmes owes much to the collaboration withnon-governmental organisation (NGOs), as collaboration with local authori-ties is still relatively rare. NGOs are much less involved in trade-related pro-grammes than in other programmes, so the scope for RCTs may be inherentlyless, at least as long as the evaluation culture remains rare in public policy.Atkin and Khandelwal discuss in Chapter 4 how carrying out an RCT withinthe context of international trade depends crucially on finding a suitable localproject partner who can provide the export promoting services to producers,and on convincing such a project partner of the feasibility and value of therandomisation procedure.
Randomisation does allow for flexibility, which may help make it acceptable.First, it does not need to cover all individuals. For instance, a programme canuse standard selection methods to determine eligibility, and introduce ran-domisation among either all eligible firms or only ‘marginal’ ones. That is, verystrong candidates can be taken in, very weak ones left out and only those inthe middle subject to randomisation.27 Lotteries are somehow more appealingthan blind randomisation because they avoid the impression that somethingis hidden. Alternatively, ‘encouragement’ designs can be used, whereby somefirms, chosen at random, get more information (eg phone calls) than others,raising the probability that they apply to a programme.28
Quasi-Experimental Methods
When evaluation is not built into programme design, RCT is not an option andquasi-experimental methods must be used, all relying on econometric tech-
26Randomisation across countries would be more difficult to implement than within acountry and would not necessarily increase the test’s power.
27We are grateful to David McKenzie for pointing this out to us.
28Duflo et al (2006) offer a recent example of an encouragement design. They testedwhether seeing a neighbour use fertilisers would encourage other farmers to do the same.For each using farmer, they invited randomly chosen neighbours to attend a demonstrationof fertiliser use. Although other farmers were also welcome to attend, the attendancerate was much higher in the subsample of invited ones, which was randomised. To ourknowledge, no trade intervention has been evaluated with encouragement design.
22 Where to Spend the Next Million?
niques to overcome selection bias.29 The first is the difference-in-differences(DID) method briefly described above. By comparing differences in outcomesinstead of comparing levels, DID controls for unequal performance levels oftreatment and control groups not related to the programme. However, DIDrelies on the assumption of parallel trends and does not control for selectionon observables (firm-level covariates).
The DID method can be improved by matching, provided that selectioninto the programme is based on observable characteristics. Matching con-trols for observed firm-level characteristics correlating with both programmeparticipation and performance. However, it does not control for unobservedcharacteristics. The matching procedure evolves in two steps. First, firm-levelcovariates are used to predict the probability of getting (or enrolling into) theprogramme using a probit or logit regression. This predicted probability iscalled a propensity score. Second, the control group is formed by picking, foreach treated firm, the untreated firms with the closest propensity score. Foreach treated firm, depending on the method, there can be either one matchedcontrol firm or several, using a weighted scheme.30 Average outcomes (in firstdifferences) are then compared between the treatment group and the matchedcontrol group.
The studies surveyed by Volpe Martincus in Chapter 2 are good illustrationsof the use of quasi-experimental methods in the evaluation of trade assis-tance. These studies, recently carried out at the Integration and Trade Sectorof the Inter-American Development Bank, use DID and matching-DID meth-ods to assess the effectiveness of export promotion activities of PROMPEX/PROMPERU (Peru), PROCOMER (Costa Rica), URUGUAY XXI (Uruguay), PRO-CHILE (Chile), EXPORTAR (Argentina) and PROEXPORT (Colombia). They userich and unique data sets for the six Latin American countries that combinefirm-level customs data with covariates drawn from other national firm-leveldata sources and constitute the first rigorous micro-based evidence of theeffects of export promotion.31 The picture emerging from Volpe Martincus’ssurvey is that export promotion was effective in facilitating export expansionfor firms in Latin America, but primarily along the extensive margin. Firms
29How well quasi-experimental methods perform compared with randomisation has beena subject of intense scrutiny since the seminal paper of Lalonde (1986), with largely incon-clusive results. Glazerman et al (2003) found that quasi-experimental methods producedsubstantially biased results compared with experimental ones in 12 replication studies ofwelfare and employment programmes in the USA. Cook et al (2006) found less clear-cutresults for education programmes.
30The single-match method is called ‘nearest neighbour’. Alternatively, we can use nnearest neighbours, or the entire sample of untreated firms with weights that decreasewith distance from the treated firm’s propensity score. This latter method is called ‘kernelmatching’. Many other refinements are possible.
31An alternative, more traditional route to the evaluation of export-promotion’s effec-tiveness is the aforementioned cross-country study of Lederman et al (2010a).
Impact Evaluation of Trade Assistance: Paving the Way 23
exporting differentiated goods benefit more than those selling more homo-geneous goods. Small and relatively inexperienced companies benefit morethan larger and already established exporters. Finally, bundled services thatprovide support to firms throughout the export-development process appearto be more effective than isolated actions.
In Chapter 3 of this volume, Gourdon et al apply the same type of quasi-experimental methods to the evaluation of FAMEX, a World Bank-supportedexport promotion programme in Tunisia, which provided a mixture of coun-selling and matching grants to new exporters. The study exploits a customisedfirm-level survey to estimate the effects of FAMEX on the export perfor-mance of beneficiary firms at the intensive and extensive margins. Propensity-score matching DID estimates suggest a very large and statistically significantgrowth effect at the intensive margin: a 39% differential in terms of annualexport growth compared to control firms over the 2004–8 period. The treat-ment effect at the extensive margin, in terms of products and destinations, isboth smaller quantitatively (a 5% growth differential in the count of productsand destinations for programme beneficiaries compared with control firms)and of marginal or no significance (at 10% confidence level for destinationsand insignificant for products). In addition to the observed acceleration inexport growth, Gourdon et al find a significant boost to employment growth:a 10% annual differential for programme beneficiaries, significant at the 5%confidence level. An original feature of their data set is that it covers servicefirms in addition to manufacturing firms, and they find considerably strongereffects for the former. One potential issue with their data is that the surveywas conducted ex post (no baseline survey was conducted, as IE was not partof the programme design) so the data may suffer from recall bias. Preliminaryresults by Cadot et al (2001) based on an alternative source of data (customsdata) suggest a smaller and non-persistent treatment effect.
Jaud and Cadot (2011) also apply quasi-experimental methods to assess theimpact of PIP on the export performance of firms in Senegal’s horticulturesector. Their results suggest that, while the programme had no significanteffect on exports of fresh fruit and vegetables pooled over all products anddestinations, it had a positive effect when considering exports to the EU.
Other quasi-experimental methods can address selection bias in the eval-uation of the impact of a programme. One approach relies on instrumentalvariable (IV) estimation. This can be used when programme take-up is lessthan complete and thought to be correlated with unobserved individual char-acteristics influencing performance. In this case, eligibility can be used as aninstrument for participation, provided that eligibility is truly exogenous (eg ifthere is randomisation of eligibility but programme take-up is incompleteor some participants drop out). This method is used in the context of natu-rally non-targeted interventions by Sequeira in Chapter 5 of this volume, asdescribed in Section 4.3.
24 Where to Spend the Next Million?
Another approach is regression discontinuity design, which makes use ofbreaks in eligibility to identify a programme’s impact.32 For instance, sup-pose that an export promotion programme targets small and medium-sizedenterprises (SMEs) as defined by a cut-off level of sales. If the sample is largeenough, outcomes can be compared for SMEs immediately below the cut-off(eligible) and for SMEs immediately above (ineligible), on the assumption thatthey are close enough in the characteristic upon which eligibility is defined tobe good matches for each other, and most importantly that the cut-off rule isindeed enforced.33
4.3 Naturally Non-Targeted Interventions
Naturally non-targeted trade interventions mostly cover programmes thathelp reduce trade costs. These include trade-facilitation programmes such asupgrading of bottleneck infrastructures in ports, roads or railways, reforms ofcustoms agencies and procedures, and some types of trade competitivenessprogrammes related to general improvements in the business environmentor support to producer organisations. Because these interventions generallydo not target micro entities and their direct beneficiaries are multiple anddiffuse, the identification of a control group is difficult, and so they are lessamenable to experimental or quasi-experimental design.
Considering ‘hard’ and ‘soft’ infrastructure-related trade-facilitation pro-grammes, the two key constraints to estimating their effects are the endo-geneity of programme placement and the absence of well-defined treatmentand control groups. Thus, the pre-treatment unobservable characteristics thatdetermine infrastructure placement and affect outcomes are likely to differbetween treatment and comparison groups (where groups are, in this case,most likely to be locations). Randomisation in the context of large and sensi-tive hard transport infrastructure programmes is generally not feasible. Thisis also the case for soft trade-facilitation programmes relating to rules, regu-lations and government agencies dealing with the movement of cargo acrossborders that are often not amenable to random assignment at the micro levelnor to the creation of comparison groups for the purposes of an IE.
For interventions such as customs reform, the only way to generate a con-trol group is to introduce elements of targeting through progressive phase-induring a pilot phase, staggered, for example, across different border posts,or through selective implementation covering only some customs offices orofficials, or by giving privileged access only to some firms or to some typesof traded goods. For instance, a ‘green channel’ in customs, which is a speedy
32See Campbell (1969) for details; a survey can be found in Todd (2006).33The issue of rule enforcement has been a controversial one, eg in the context of micro-
credit evaluation (Morduch 1998), but may be less fraught for firm-level trade interventionslike support to SMEs.
Impact Evaluation of Trade Assistance: Paving the Way 25
clearance for trusted operators, can be restricted and randomly allocated inan early phase, using non-eligible operators as controls.34 In this case, meth-ods such as DID can in principle be applied using the locations initially notcovered and customs offices, officials or firms like the control group for thetargeted entities.
However, in many cases, during the pilot phase the control group will not bestrictly comparable to the treatment group. For example, when a border mod-ernisation programme is initially deployed in one border post, other borderposts of different scale and product mixes serving other areas could serve ascontrols. It may then be necessary to use regression analysis to control explic-itly for the heterogeneity in covariates in estimating differences in outcomesbetween treated and control border posts.
In some cases, policy design or implementation inadvertently createsthe conditions necessary to perform evaluation through quasi-experimentalmethods: what economists call a ‘natural experiment’. Datt and Yang exploitone such natural experiment in Chapter 6. The government of the Philippinesused pre-shipment inspection (PSI) services to combat corruption in customsand increase import duty collections. The natural experiment arose from twoconditions:
• imports from only some countries of origin were covered by PSI, whichcreated a natural control group (imports from other countries);
• in 1990 the Philippines government decided to close a loophole wherebyimport transactions below a threshold of US$5,000 were exempted fromPSI.
The loophole had enabled traders to slice shipments into small batches andunder-invoice them without being detected. The customs reform consisted oflowering the threshold to US$500, so the period after 1990 can be considered a‘treatment period’. A DID equation can then be used to compare the evolutionof outcomes before and after the reform for the treatment and control groupof countries. The DID estimates show that, when inspections were expandedto lower-valued shipments, imports shipments were no longer mis-valued, butthose from treatment countries shifted differentially to an alternative duty-avoidance method: shipping via duty-exempt EPZs. Thus, increased enforce-ment reduced the targeted method of duty avoidance, but led to substantialdisplacement to an alternative duty-avoidance method. Duty collection failedto rise, while importers incurred higher fixed costs as they relocated to EPZs.This chapter shows that, to be successful, anti-corruption reforms need toencompass a wide range of possible alternative methods of combatting ille-gal activity.
34This approach is similar to so-called ‘pipeline’ methods, where applicants are used ascontrols for beneficiaries.
26 Where to Spend the Next Million?
In Chapter 5 of this volume Sequeira discusses a transport infrastructureproject consisting of investments in a railway connecting the economic heart-land of South Africa to the port of Maputo in Mozambique. Given the poorstate of Mozambique’s infrastructure after two decades of war—and consid-ering budget constraints—the government had to be selective in its choice ofinfrastructure investments. They decided to rehabilitate the old-pre-colonialrailway in the Maputo transport corridor (which would promote regional inte-gration) rather than building an entirely new north–south connection, as wasdemanded by the Mozambican business class. As the layout of the old-pre-colonial railways had been designed to serve 19th-century mining companies,there is plausible exogenous variation in the emergence of the rehabilitatedrailway relative to the geography of manufacturing and retail firms at the timeof rehabilitation of the railway.
The IE of this transport infrastructure project estimates the impact of rail-way rehabilitation on firm performance—namely, changes in transport costsfor different firms and sectors, how firms respond to these changes, and whatthe spillover and network effects are across rail and road transport. To iden-tify a causal relationship, the study will use a quasi-experimental method,IV, where the treatment, defined as changes in transportation costs, will beinstrumented by the distance between a firm’s location and a working railwaystation.
In addition, the study exploits the fact that other transport corridors inMozambique developed at different speeds, and identifies two sets of controlfirms to match to the treated firms in the Maputo transport corridor:
• firms in the Beira corridor (that have access to a new port but no railway)and
• firms in the Nacala corridor (that have no access to a new port or rail-way).
To isolate the impact of the Maputo railway rehabilitation, the study will usea matching DID estimation that assumes that the only factor making the tra-jectories of these three sets of firms different during the sample period isthat they were exposed to different transport choice sets. The impact of theMaputo railway rehabilitation is not yet known, since only the baseline sur-vey information is available; a follow-up survey will be conducted in spring2011.
Sequeira also discusses a ‘soft’ transport infrastructure project, focusing oncorruption in Southern African ports.35 By collecting original data on bribepayments made to customs officials and to port operators in the two com-peting ports of Durban and Maputo, the study is able to trace differences
35The project is described more extensively in Djankov and Sequeira (2010).
Impact Evaluation of Trade Assistance: Paving the Way 27
in bribe schedules to the organisational structure of each port. By observinghow firms adapt their shipping and sourcing decisions to the type of corrup-tion faced at each port—which enters into the calculation of the overall costof using each port—the study estimates the impact of corruption at portson the behaviour of South African firms. The estimates show that corruptionimposes a distortion in terms of ‘diversion’, ie firms travel on average an addi-tional 322 kilometres, more than doubling their transport costs, just to avoid‘coercive’ corruption at a port.
This effect is only observed for firms facing a higher probability of beingcoerced into a bribe because of the kind of product they ship. Firms are will-ing to incur higher costs to avoid corruption because of an aversion to theuncertainty surrounding bribe payments at the more corrupt port (Maputo).The uncertainty in Maputo seems linked to the short time periods caused byhigh job turnover among customs officials. Firms also respond to differenttypes of corruption by adjusting their sourcing decisions for inputs, domes-tically or internationally, since corruption at ports increases the cost of usingthe port and thus directly affects the relative cost of imports.
While this project is not an impact evaluation of an intervention to reducecorruption in ports, it provides two sets of valuable insights on such interven-tions because it considers the entire chain between competing port bureau-cracies setting bribes and user firms making shipping and sourcing decisions.First, the study shows that, depending on the type of corruption that bureau-crats engage in, bribes can affect the deadweight loss, tariff revenue and thedemand for the public service. In particular, corruption seems to reduce sig-nificantly demand for the Maputo port, stifling the returns to the massiveinvestments in hard infrastructure of the corridor that have taken place inrecent years. Second, policy changes to the organisation of ports and to thenature of the interaction between shippers and port officials could reduce cor-ruption. Such changes include reducing the discretion of port officials in theclearance process, and eliminating face-to-face interactions between clearingagents and port officials.
Cantenset al describe in Chapter 7 of this volume a recent pilot for customsreform in Cameroon that involved the introduction of contracts with perfor-mance indicators for front-line customs inspectors in two of the country’s cus-toms bureaus (henceforth referred to as ‘treated bureaus’). The performanceindicators covered both trade facilitation and the fight against fraud and badpractices. Front-line customs inspectors with good performance would berewarded with non-financial incentives such as congratulatory letters enteredinto their personnel files, easier access to the director general of customs,training courses and transfers to more attractive bureaus. Poorly performinginspectors would be sanctioned by eviction from bureaus with strong ‘fiscalpotential’, that is, where the possibilities of earning money legally throughdisputed claims were high.
28 Where to Spend the Next Million?
This project is an interesting example of a trade intervention that in prin-ciple is naturally non-targeted, but where targeting could have been intro-duced by focusing on a subset of front-line customs inspectors. This couldthen have been an ideal setting to implement an RCT, whereby a subset ofrandomly chosen front-line inspectors would have been under performancecontracts, while others would not. However, it was not possible to implementan RCT for several reasons. First, the seven customs bureaus in Cameroonare specialised (oil imports, special customs regimes related to public trends,transit, exports, bulk cargo and the two treated bureaus) and differ so muchin customs practices that it would be difficult to make comparisons acrossbureaus. Hence, if anything, a bureau would need to be split into a treatedgroup and a control group of front-line inspectors. But this was not feasiblegiven a small sample problem: less than ten staff work in each bureau. Second,as is generally the case in projects funded by governments or internationaldonors, the time devoted to the pilot project was limited. Thus, it was notpossible to overcome the small sample issue by allowing for turnover withineach bureau to artificially increase the number of treated and control officers.Moreover, since contract incentives were not financial, time was required toreward good performers (eg it would not have been feasible to appoint high-performing inspectors to better positions every six months).
Therefore, the IE of the customs performance contracts project was con-ducted as a comparison of inspectors’ behaviour before and after the projectwas implemented, without a defined control group, although the impact onclearance times was assessed using the bulk-cargo import bureau as a coun-terfactual. The estimated effects of the pilot performance contracts were pos-itive surprisingly soon after the pilot was launched in mid 2009. Duties andtaxes assessed increased despite a fall in the number of imported containers(likely to be linked to the financial crisis), and the tax yield of the declarationsalso rose. The performance contracts also affected clearance times, as theshare of declarations treated within 24 hours increased more in the treatedbureaus than in the counterfactual bureau, and the variance of clearance timesdecreased dramatically. The impact on disputed claims was equally interest-ing, with inspectors abandoning low-level disputed claims to focus on majorones, and the ratio of taxes adjusted to taxes assessed increased. Finally, thecontracts also had a major impact in reducing costly practices. For instance,the number of litigious reroutings from the yellow channel (documents con-trol) to the red channel (physical inspection) declined tremendously.
5 DATA ISSUES
5.1 What Are We Measuring?
The choice of performance measures is important not only to ensure that IEfocuses on the appropriate indicators, but also because using IE can affect
Impact Evaluation of Trade Assistance: Paving the Way 29
the incentives of agents and programme managers in unintended ways. Per-formance indicators that strongly relate to targeted interventions in a causalsense are often too technical to be of interest from a broad policy perspec-tive, whereas the highly aggregate indicators that interest policymakers arerarely faithful reflections of the effect of targeted interventions and projects.Thus, selecting performance indicators involves a trade-off between breadthand identification.
Much of the talk in AfT evaluation focuses on aggregate indicators such asnational export performance or other macro variables. Although policymak-ers may find these broad indicators relevant, the causal link between themand the actual performance of trade interventions is tenuous, implying weakidentification.
By contrast, M&E frameworks, developed to ensure project managementand quality control, have used intermediate outcomes more directly linkedto the projects themselves, like customs clearance times. In a causal sense,these measures are closer to project management but are likely to be narrow inscope. Deciding which approach is better depends on what the indicators areused for. If evaluation results are expected to feed into incentive structuresfor programme managers, identification is critical and breadth is secondary.In contrast, in order to catch the attention of policymakers, breadth mattersmore, possibly at the cost of weaker identification.
Impact evaluation does not escape this general trade-off between breadthand identification, but is typically located at the ‘narrow’ end of the spec-trum, since it identifies changes in performance measures that are directlyattributable to the project. For instance, when evaluating a customs moderni-sation programme, the performance measure is likely to be something likecontainer dwell time, even though less quantifiable dimensions of customsperformance, like security at the borders, may also matter.
But identifying and documenting the chain of causality from programme toultimate outcomes can be challenging for some trade interventions. In trade-facilitation programmes it is not always clear what the micro-level mecha-nisms are by which transport costs reductions influence firms and householdsand, more generally, economic activity.
In addition, the use of IE can affect incentives in the long run. The focuson narrow, immediate performance outcomes may well lead to measurementbiases or, even worse, create perverse incentives when used for monitoringand evaluation. For one thing, it can focus attention on readily measured out-comes at the expense of less easily measured ones.
Consider a customs modernisation programme. Using IE results to designreward schemes for customs officials might lead to over-emphasis on easy-to-measure reductions in clearance times, at the expense of the monitoringof suspect shipments. If, say, there is a low rate of smuggling illicit products,it may take time before the consequences of reduced monitoring get noticed:too long to show up in an IE.
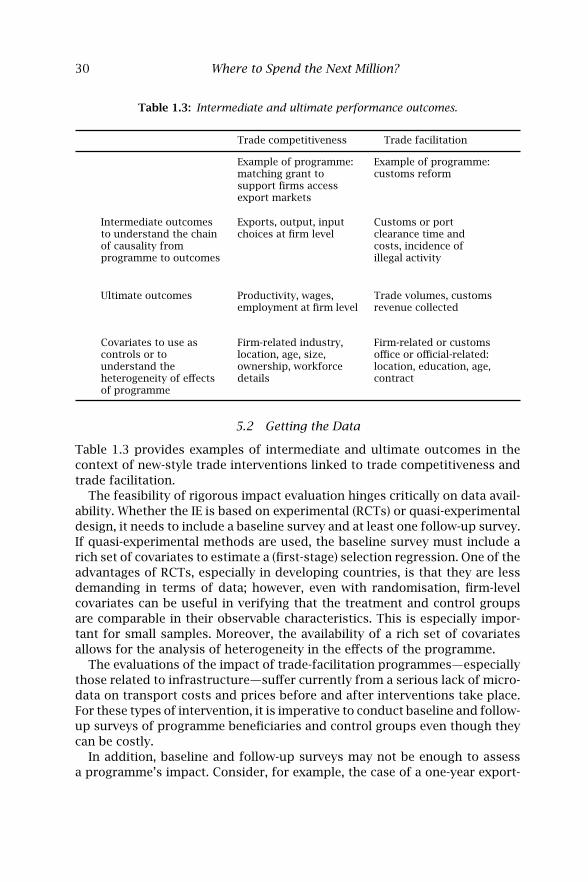
30 Where to Spend the Next Million?
Table 1.3: Intermediate and ultimate performance outcomes.
Trade competitiveness Trade facilitation
Example of programme:matching grant tosupport firms accessexport markets
Example of programme:customs reform
Intermediate outcomesto understand the chainof causality fromprogramme to outcomes
Exports, output, inputchoices at firm level
Customs or portclearance time andcosts, incidence ofillegal activity
Ultimate outcomes Productivity, wages,employment at firm level
Trade volumes, customsrevenue collected
Covariates to use ascontrols or tounderstand theheterogeneity of effectsof programme
Firm-related industry,location, age, size,ownership, workforcedetails
Firm-related or customsoffice or official-related:location, education, age,contract
5.2 Getting the Data
Table 1.3 provides examples of intermediate and ultimate outcomes in thecontext of new-style trade interventions linked to trade competitiveness andtrade facilitation.
The feasibility of rigorous impact evaluation hinges critically on data avail-ability. Whether the IE is based on experimental (RCTs) or quasi-experimentaldesign, it needs to include a baseline survey and at least one follow-up survey.If quasi-experimental methods are used, the baseline survey must include arich set of covariates to estimate a (first-stage) selection regression. One of theadvantages of RCTs, especially in developing countries, is that they are lessdemanding in terms of data; however, even with randomisation, firm-levelcovariates can be useful in verifying that the treatment and control groupsare comparable in their observable characteristics. This is especially impor-tant for small samples. Moreover, the availability of a rich set of covariatesallows for the analysis of heterogeneity in the effects of the programme.
The evaluations of the impact of trade-facilitation programmes—especiallythose related to infrastructure—suffer currently from a serious lack of micro-data on transport costs and prices before and after interventions take place.For these types of intervention, it is imperative to conduct baseline and follow-up surveys of programme beneficiaries and control groups even though theycan be costly.
In addition, baseline and follow-up surveys may not be enough to assessa programme’s impact. Consider, for example, the case of a one-year export-
Impact Evaluation of Trade Assistance: Paving the Way 31
promotion programme, where firms can enlist in any year between 2005 and2009; and then suppose that a baseline survey is conducted in 2004 and afollow-up survey is conducted in 2010. For firms that enrolled in 2005, thefollow-up survey will pick up outcomes four years after the treatment. By then,if the effects are transient, they may have vanished, and the follow-up surveywill pick up heterogeneous effects (one year after treatment for firms enrolledin 2009, two years for those enrolled in 2008 and so on). Thus, although costly,it may be necessary to run repeated follow-up surveys year after year.
While World Bank projects typically have budgets for baseline data collec-tion, these may not always be enough to gather the data needed for a proper IEevaluation after the project is completed. An alternative cost-efficient methodis to use official pre-existing sources of data, provided that they are collectedoften enough and can be reconciled with programme data. For example, for anexport promotion programme, customs records at the transaction/firm levelcan be used to measure outcomes such as growth in export value (the inten-sive margin), number of products and number of destinations (the extensivemargin).36
The trade and integration unit of the World Bank Development ResearchGroup is involved in a major data-collection exercise that may help IE oftrade-related interventions in the next few years. As described in Freund andPierola (2011), the exercise consists of the collection and compilation of thefirst ever database on exporter-level customs transaction data across coun-tries and over time. Data has been obtained for 20 countries in Africa, Asia,Eastern Europe and Latin America, and negotiations are in progress to obtaindata for 25 more countries. The database will include statistics on exporters’characteristics and behaviour by country, industry and destination market.The purpose of the database is to provide policymakers, development agen-cies, researchers and the public with a novel source of information to conductanalysis of export growth at the micro level and allow for the evaluation ofprogrammes and policies affecting that growth.
Data on firm characteristics (covariates), used to control for selection bias,is typically hard to obtain. If an industrial survey is available in the countrywhere the trade intervention is taking place, it can provide the required vari-ables (eg location, age of the firm, education of its head, number of employ-ees, foreign ownership). However, this requires that customs and industrialcensus data be merged, which raises confidentiality issues. When data is notavailable, an alternative is to conduct a ‘retrospective survey’, although thismethod may be biased. In its evaluation of Tunisia’s export-promotion agency,Chapter 3 by Gourdon et al uses a combination of data from their own surveyand from national sources (customs and national statistics institute).
36See Freund and Pierola (2010) and Lederman et al (2010b) for uses of such data in anon-IE context.
32 Where to Spend the Next Million?
6 LOOKING AHEAD: CHALLENGES FACING IE OF TRADE ASSISTANCE
6.1 External Validity and Cost
One key concern with impact evaluations is that their external validity is anact of faith. When a programme is found to be effective (or ineffective), howdo we know that the result would carry over to other programmes run indifferent environments?
As Rodrik (2008) and Ravallion (2008) argued, IE does not produce anyharder evidence than traditional econometric methods. Instead, there is atrade-off in policy evaluation between external and internal validity. As tradi-tional identification of causal effects through instrumental-variable strategiesnever completely eliminates confounding influences, these strategies alwayssuffer from an internal-validity problem. However, when based on cross-country evidence, they pick up average effects that can be relatively stable—provided they are consistent with some sort of theory—because induction,even on cross-country samples, may fail to produce generalised results.
By contrast, IE purges confounding influences, but generates results thatare empirical and case dependent. Such results may fail to carry over to dif-ferent settings. Limited external validity of any study would not be a problemif we could replicate it easily. With enough replications, the sheer mass ofevidence would provide the desired generality (although the method wouldstill be inductive and would thus suffer from the general critism of inductivemethods in science).
But some kinds of IE can be costly. For instance, the World Bank reckonsthat household surveys cost on average US$300 per household. At that rate,a baseline and final survey of 500 households would cost US$300,000. Thisis a lot for studies for only internal validity.37 However, costs can often becontained by working with local institutions, which has the added advantageof building capacity in a key area.
Some trade-related programmes target limited numbers of firms, so theirevaluation is less costly than that of poverty-reduction programmes. Forinstance, in a middle-income country, the cost of surveying 500 firms canbe substantially lower than US$100,000. Moreover, the data often exist priorto and independently of the IE in the form of census or industrial surveysand customs records. In that case, the cost of the IE goes down dramatically.
37In their discussion of quasi-experimental versus experimental methods, Duflo et al(2008) make a noteworthy point about the commitment value of costly experimentaldesign. It has often been argued, with some statistical support (see, for example, Ashen-felter et al 1999), that statistically significant results (positive impact in our setting) aremore likely to get published, a so-called ‘publication bias’. As experimental methods arecostly and usually planned with donors, self-censure in the face of insignificant resultsis less likely to be feasible than when relatively low-cost quasi-experimental methods areused with publicly available data. In that sense, IEs may be less affected by publicationbias.
Impact Evaluation of Trade Assistance: Paving the Way 33
The problem then is no longer one of cost but of securing buy-in from theagencies possessing the data so that they share it.
6.2 Can Treatment Effects Be Used to Justify Government Intervention?
Externalities can bias treatment effects by blurring or magnifying the differ-ence in outcomes between treatment and control groups. In the context ofpolicy evaluation, this raises a deep issue, as externalities are the basic justi-fication for government intervention.
One key assumption of both experimental and quasi-experimental methodsis that the control group is not ‘polluted’ by the treatment group, lest thecomparison of outcomes be biased. A classic case in economics occurs whengeneral equilibrium effects transmit the benefits conferred on beneficiariesto non-beneficiaries or, alternatively, penalise them, say, through rising inputprices.
In the evaluation of trade-related programmes of limited scale, such asexport promotion or trade facilitation, general equilibrium effects may notbe critical. However, spillovers may be present through other channels; forexample, an export promotion programme may have ‘demonstration effects’yielding valuable information on the viability of destinations or product mar-kets that can be easily imitated by non-participants. In such circumstances,the estimated treatment effect will be biased downward because the differencein outcomes between the treatment and control groups will measure only thepurely private effect.
Conversely, a programme to upgrade one border post may induce traf-fic shifting from other, untreated border posts. The volume of trade goingthrough the treated border post will then be increased by the substitutionfrom traffic that normally goes through other ones, and as ‘control’ borderposts see their traffic go down, using them as controls will result in a bias inthe estimated treatment effect of the programme.
Not surprisingly, treatment effects may be contaminated by informationexternalities. After all, even the most rigorous RCTs used to test the effec-tiveness of drugs can also be affected by informational biases, as is the casewhen individuals in the control group observe that they do not suffer a drug’sside-effects while individuals in the treatment group do, and as a result inferthat they received the placebo instead of the treatment. But in economics, thepresence of externalities takes on special importance because it plays a keyrole in justifying government intervention. If the benefits of a programmewhose costs are borne by taxpayers were internalised by the beneficiaries,surely those beneficiaries ought to pay for it and there would be no justifica-tion for public intervention. In contrast, if a programme generated spilloversso powerful that no treatment effect was detectable, ie the control group indi-rectly benefits as much from the programme as the beneficiaries—then the
34 Where to Spend the Next Million?
argument for a public intervention could be right, as beneficiaries would bewilling to pay nothing for the treatment.38
Thus, seeking to justify government-financed programmes solely on thebasis of treatment effects may not just be affected by bias, it may be altogetherwrongheaded. In the export promotion scheme example, what IE would bemeasuring is only the private-good dimension of the intervention; the public-good dimension would be left unevaluated.
It is thus important to disentangle whether a no-effect finding is due toexternalities or to programme ineffectiveness. This may call for an indepen-dent effort, aside from the IE itself, to detect the presence of externalities.For instance, a regression of outcomes of untreated individuals might be runon some continuous measure of exposure/closeness to treated individuals,to see if more, or closer, treated neighbours raise the outcome of untreatedones.
Alternatively, we can include this same measure of exposure to (other)treated individuals in the DID equation and interact it with the treatmentto see if the treatment is more powerful on individuals ‘surrounded’ (in someeconomic sense) by other treated individuals. These methods are inspired bymeasures of contagion used in epidemiological studies.
In contrast with medical sciences, however, in social sciences the mecha-nisms by which contagion takes place are largely unknown. Baseline surveysmay help in understanding and identifying channels through which futureprogramme benefits might spread from one firm to another, eg professionalassociation memberships, personal contacts and so on.
6.3 Mainstreaming IE into Trade Interventions
In spite of the challenges, rising demands for results and accountability fromdonors and clients alike require that AfT evaluation strategies need moreambition and rigour. Implementing agencies should no longer be content withtraditional methods based on output monitoring and before–after compar-isons. Output monitoring is largely introspective, relying on measures definedby the task managers and therefore liable to biases, while before–after com-parisons are vulnerable to confounding influences.
The basic problem faced in the evaluation of a policy, programme or projectimpact is attribution. Are the observed changes in the performance of treatedentities really attributable to the intervention under consideration, or do theyreflect a fortuitous combination of effects? IE methods—developed outside ofthe social sciences but widely adopted in the evaluation of poverty-reduction,health and education programmes—provide a generally accepted answer tothe problem of attribution.
But trade interventions have so far escaped the rising tide of evaluationmethods. And, as this book tries to show, there is no justification for this
38This point was made to the authors by Daniel Lederman.
Impact Evaluation of Trade Assistance: Paving the Way 35
‘trade exceptionalism’. IE techniques are many and provide numerous flexi-bilities for use in the case of interventions not ‘naturally targeted’ at a definedgroup of treated individuals.
As the authors have experienced in their campaign for greater recourseto IE techniques in trade, the key barriers to progress are not conceptual.Rather, they concern incentive issues, as IEs are costly, burdensome, lengthyand not necessarily aligned with project managers’ incentives. For example,World Bank projects to assist private sector firms in Africa last, on average,five years, which would imply that, if their IE involved an RCT, many yearswould need to elapse for the projects to show results (McKenzie 2011). Thesemany years would go well beyond a project manager’s horizon.
However, researchers would not need to wait until completion of the projectto evaluate its effects; rather, results one or two years after the project couldbe assessed and be used to guide the implementation of the project in thesubsequent years.
The weakness of current evaluation practice can be illustrated no betterthan by this critical assessment, found in the Implementation CompletionReport of a recent World Bank project in the area of export promotion:
Although the design of the M&E system was appropriate, both Bank andGovernment project teams had difficulty measuring the achievements of theproject using the broad indicators cited in the PAD. [B]y current standards,they were insufficient and incomplete.
… M&E, particularly important as a learning objective, was weak. It was slowto start and did not deliver. The M&E staff … lacked the capacity and experi-ence to carry out the monitoring activities, and the Unit was unable to carryout baseline and impact surveys of randomly selected farmers in both projectand non-project areas, ie survey to gauge key interest groups’ response to theoutputs generated by the pilot activities. The M&E Unit’s ability to collabo-rate with other implementing agencies to collect information and data wasalso ineffective. Implementing partners did not regard the M&E exercise asa learning process but instead, conducted their promotion activities withoutconsulting or collaborating with the M&E unit.
As the reviewers noted, the learning function of evaluation escapes imple-menting agencies, being overshadowed by the ‘monitoring’ function.
In order to overcome these hurdles, several avenues must be explored. First,the burden imposed on project managers should be relieved by making impactevaluation a separate exercise, carried out by specialists, albeit in collabora-tion with project managers. Project managers should be involved at the righttime, ie during project design, and from then on, as much as possible, left inpeace. The World Bank has moved in this direction through the creation ofthe DIME unit, which provides expertise and help with IE financing.
At the same time, governments in the countries receiving trade assistancemust buy into the process. This means sharing knowledge and building capac-ities for a proper interpretation of IE results and, in the long run, for govern-
36 Where to Spend the Next Million?
ments to build their own IE capabilities as part of public-services deliveryimprovements.
Also, every effort should be made to reduce the cost of IEs. For small-scale activities, the cost of an IE can be as great as that of the activity itself.This is excessive. Local resources—in particular, universities and graduatestudents—should be involved, producing a double benefit: costs are reducedand local capacities are strengthened.
Finally, the exploitation of IE results should prioritise learning over mon-itoring. That is, donors and implementing agencies should tread cautiouslyin using IE results to frame incentive systems. Care is needed in the inter-pretation of IE results because premature conclusions could easily provoke abacklash and because a considerable accumulation of evidence is needed toyield truly valuable new knowledge.
Olivier Cadot is a Senior Trade Economist in the International Trade Depart-ment, Poverty Reduction and Economic Management Network at the WorldBank.
Ana M. Fernandes is a Senior Economist in the Trade and International Inte-gration Team in the Development Research Group at the World Bank.
Julien Gourdon is a Consultant in the Social & Economic Development Groupfor the Middle East and North Africa Region at the World Bank.
Aaditya Mattoo is the Manager of the Trade and International IntegrationTeam in the Development Research Group at the World Bank.
REFERENCES
Ashenfelter, O., C. Harmon, and H. Oosterbeek (1999). A review of estimates of theschooling/earnings relationship. Labour Economics 6, 453–470.
Banerjee, A., S. Jacob, M. Kremer, J. Lanjouw, and P. Lanjouw (2005). Moving to univer-sal education: costs and trade-offs. Mimeo, MIT, Cambridge, MA.
Banerjee, A., A. Amsden, R. Bates, J. Bhagwati, and N. Stern (2007). Making Aid Work.Cambridge, MA: MIT Press.
Banerjee, A., and E. Duflo (2008). The experimental approach to development eco-nomics. NBER Working Paper 14467.
Blundell, R., and M. Dias (2002). Alternative approaches to evaluation in empiricalmacroeconomics. CEMMAP Working Paper CWP10/02.
Brenton, P., and E. von Uexkuhll (2009). Product-specific technical assistance forexports; has it been effective? Journal of International Trade and Economic Devel-opment 18, 235–254.
Bruhn, M. (2011). License to sell: the effect of business registration reform onentrepreneurial activity in Mexico. Review of Economics and Statistics 93, 382–386.
Cadot, O., A. Fernandes, J. Gourdon, and A. Mattoo (2011). An evaluation of Tunisia’sexport promotion program. Mimeo, World Bank.
Calì, M., and D. te Velde (2011). Does aid for trade really improve trade performance?World Development 39(5), 725–740.
Impact Evaluation of Trade Assistance: Paving the Way 37
Campbell, D. (1969). Reforms as experiments. American Psychologist 24, 407–429.Cook, T. D., W. Shadish, and V. Wong (2006). Within study comparisons of exper-
iments and non-experiments: can they help decide on evaluation policy? Mimeo,Northwestern University, Evanston, IL.
Djankov, S., C. Freund, and C. Pham (2010). Trading on time. Review of Economics andStatistics 92(1), 166-173.
Djankov, S., and S. Sequeira (2010). An empirical study of corruption at ports. Mimeo,London School of Economics.
Duflo, E., M. Kremer, and J. Robinson (2006). Understanding technology adoption:fertilizer in Western Kenya. Preliminary results from field experiments. Mimeo, MIT,Cambridge, MA.
Duflo, E., R. Glennerster, and M. Kremer (2008). Using randomization in developmenteconomics research: a toolkit. Handbook of Development Economics 4, 389–392.
Freund, C., and M. Pierola (2010). Export entrepreneurs: evidence from Peru. WorldBank Policy Research Working Paper 5407.
Freund, C., and M. Pierola (2011). Global patterns in exporter entry and exit. Mimeo,World Bank.
Gine, X., and I. Love (2010). Do reorganization costs matter for efficiency? Evidencefrom a bankruptcy reform in Colombia. Journal of Law and Economics 53(4), 833–864.
Glazerman, S., D. Levy, and D. Myers (2003). Nonexperimental Replications of SocialExperiments: A Systematic Review. Princeton, NJ: Mathematica Policy Research, Inc.
Harrison, A., and A. Rodriguez-Clare (2010). Trade, foreign investment, and industrialpolicy for developing countries, Handbook of Development Economics, Volume 5,Chapter 63. Amsterdam: Elsevier.
IEG (2006). Assessing World Bank support for trade, 1987–2004: an IEG evaluation.Report, World Bank, Washington, DC. http://go.worldbank.org/5T55SG8ZD1.
Jaud, M., and O. Cadot (2011). A second look at the pesticides initiative program:evidence from Senegal. World Bank Policy Research Working Paper 5635.
Khandker, S., G. Koolwal, and H. Samad (2010). Handbook on Impact Evaluation. WorldBank.
Klapper, L., and I. Love (2010). The impact of business environment reforms on newfirm registration. World Bank Policy Research Working Paper 5493.
Lalonde, R. (1986). Evaluating the econometric evaluations of training programs usingexperimental data. American Economic Review 76, 602–620.
Lederman, D., M. Olarreaga, and L. Payton (2010a). Export promotion agencies revis-ited. Journal of Development Economics 91, 257–265.
Lederman, D., A. Rodriguez-Clare, and D. Yi Xu (2010b). Entrepreneurship and theextensive margin in export growth: a microeconomic accounting of Costa Rica’sexport growth during 1997–2007. World Bank Policy Research Working Paper 5376.
Lopez-Acevedo, G., and M. Tinajero (2010). Mexico: Impact Evaluation of SME ProgramsUsing Panel Firm Data. World Bank Policy Research Working Paper 5186.
McKenzie, D. (2010). Impact assessments in finance and private-sector development:what have we learned and what should we learn? World Bank Research Observer 25,209–233.
McKenzie, D. (2011). How can we learn whether firm policies are working in Africa?Challenges (and solutions?) for experiments and structural models. World Bank Pol-icy Research Working Paper 5632.
Miguel, E., and M. Kremer (2004). Worms: identifying impacts on education and healthin the presence of treatment externalities. Econometrica 72, 159–217.
38 Where to Spend the Next Million?
Morduch, J. (1998). Does microfinance really help the poor? new evidence from flag-ship programs in bangladesh. Princeton University, Woodrow Wilson School of Pub-lic and International Affairs, Research Program in Development Studies WorkingPaper 198.
Nelson, D., and S. J. Silva (2008). Does aid cause trade? Evidence from an asymmetricgravity model. University of Nottingham Research Paper 2008/21.
Osei, R., O. Morrissey, and T. Lloyd (2004). The nature of aid and trade relationships.European Journal of Development Research 16, 354–374.
Rajan, R., and A. Subramanian (2008). Aid and growth: what does the cross-countryevidence really show? Review of Economics and Statistics 90, 643–665.
Ravallion, M. (2008). Evaluation in the Practice of Development. World Bank.Rodrik, D. (2008). The new development economics: we shall experiment, but shall we
learn? Mimeo, John F. Kennedy School of Government, Harvard University.Rosenbaum, P., and D. Rubin (1983). The central role of the propensity score in obser-
vational studies for causal effects. Biometrika 70, 41–55.Savedoff, W. (2006). The Evaluation Gap: An International Initiative to Build Knowledge.
Washington, DC: Center for Global Development.Tan, H. (2009). Evaluating SME support programs in Chile using panel firm data. World
Bank Policy Research Working Paper 5082.Todd, P. (2006). Evaluating social programs with endogenous program placement and
self selection of the treated. Handbook of Development Economics 4, 3848–3891.Wagner, D. (2003). Aid and trade: an empirical study. Journal of the Japanese and
International Economies 17, 153–173.World Bank (2009). Unlocking global opportunities: the aid for trade program of the
World Bank Group. Report. http://go.worldbank.org/CJVEJIR2J0.World Bank (2011). Leveraging Trade for Development and Growth: The World Bank
Group Trade Strategy, 2011–2021. World Bank.
2
Assessing the Impact of Trade Promotion inLatin America
CHRISTIAN VOLPE MARTINCUS1
1 INTRODUCTION
Factors shaping firms’ (and thereby countries’) trade performance can be clas-sified into two interrelated groups: those affecting conditions under whichproduction activities are developed within the countries, and those affectingconditions under which the output of these activities can be moved betweencountries.2 The second set of factors can be generically bundled as trade costs.Trade costs are all the costs incurred in getting a good to the final user otherthan the marginal cost of producing the good itself (Anderson and van Win-coop 2004). In considering possible trade cost-related explanations of tradeoutcomes, tariffs and non-tariff impediments, as well as transport costs (bothfreight and time costs), appear as natural candidates.3
But other subtler, less studied barriers can also present deterrents to trade.Without denying the relevance of other obstacles, it can be argued that onesuch barrier to trade is lack of information. Information and the search forit play a vast role in economic life (Stigler 1961). Relevant, accurate andtimely information is a key input to effective marketing decisions.4 Given the
1The views and interpretation in this chapter are strictly those of the author and shouldnot be attributed to the Inter-American Development Bank, its executive directors or itsmember countries. Other usual disclaimers also apply.
2The first set of factors has been examined extensively elsewhere (see, for example,Pagés-Serra 2010).
3A recent study shows that nowadays transport costs are higher than tariffs over severalcountry and sector dimensions and appear to have a significant negative impact on bothLatin American and Caribbean countries’ total exports and their diversification (MesquitaMoreira et al 2008).
4Information is necessary for understanding the marketplace in which the firms intendto operate, and for monitoring changes in rapidly shifting business environments, design-ing reliable marketing plans and strategies, finding solutions to specific marketing prob-lems such as changing prices, setting up distribution channels and choosing effectivemeans for promoting products (Leonidou and Theodosiu 2004).
40 Where to Spend the Next Million?
variety of business environments, the many factors to be considered whenselling abroad and, in particular, the need to deal with situations not encoun-tered in domestic operations, information is especially important for firmsoperating beyond national boundaries (Johanson and Vahlne 1977; Czinkotaand Ronkainen 2001; Leonidou and Theodosiu 2004). Among other things,firms must know the formal export process at home, the different ways ofshipping the merchandise and their associated costs, the potential marketsabroad and their demand profile, the conditions for entering these marketsand the channels available to raise awareness of their products and to marketthese products, and they must find specific business partners. In this latterregard, supply–demand signals cannot frequently be sent (or received) cost-effectively to (or from) potential exchange partners independently or via mar-ket mechanisms. Thus, firms pursuing cross-border economic opportunitiesmust engage in a costly process of identifying and assessing the reliability,trustworthiness, timeliness and capabilities of these partners.5
In short, information gaps limit the ability of firms to learn about inter-national trading opportunities and find a suitable trade partner, and in thisway negatively affect exports.6 In particular, exporters intending to enter anew market or expand foreign sales within an already served market are pre-ceded by their reputation, which, in the absence of an identifiable brand name,largely depends on the perception of country of origin (Chisik 2003). Thisissue is especially important for firms from developing countries, whose prod-ucts are more likely to be perceived as technologically less advanced and ofpoorer quality than those of peers from developed countries (see, for example,Chiang and Masson 1988; Egan and Mody 1992; Han and Terpstra 1988; Hud-son and Jones 2003). This would especially be the case if consumers attachinformational value to quantity and accordingly interpret low market sharesas a signal of low quality (Caminal and Vives 1996).
How important are information obstacles? While, unlike other trade costs,such as tariffs and transport costs, there is no direct measure of the relative
5The difficulty of this search is determined by the extent to which economic opportuni-ties and potential trading partners are geographically dispersed, whereas the importanceof deliberations increases with the cost of reversing business decisions or their effects(Rangan and Lawrence 1999; Rangan 2000). Hence, the search and deliberation processesthat must precede entry into a new export market usually require face-to-face contacts tocoordinate business activities (Storper and Venables 2004). Interviews with managers ofpurchasing firms have confirmed the importance of face-to-face contacts. These executivesput a high priority on capable management when deciding among alternative partners, andfor this reason tend to visit their counterparts in their place of business before establishinga trade relationship (Egan and Mody 1992).
6See Rauch and Casella (2003); Suárez-Ortega (2003) and Chen (2004). Lack of informa-tion can be a particularly significant barrier to trade when uncertainty aversion is a factor.It has been shown that countries whose business communities are uncertainty averse, andthus more sensitive to informational ambiguity, trade disproportionately less with moredistant partners with whom they are predictably less familiar (Huang 2007).
Assessing the Impact of Trade Promotion in Latin America 41
importance of those obstacles, indirect means, such as surveys to firms andinferences from econometric estimations, make it possible to arrive at someconclusions. Several survey-based empirical studies on the impact of alterna-tive trade barriers in the USA, Europe and newly industrialised Asian countriesindicate that lack of information is one of the most relevant export barriers, interms of both frequency of occurrence and degree of severity.7 In particular,most common export impediments are associated with identifying the initialcontact and the marketing costs involved in doing business overseas, and alsowith difficulties in establishing initial dialogue with prospective customers orbusiness partners and building relationships (Kneller and Pisu 2007).
Indications of the importance of information barriers can also be obtainedfrom econometric studies (Rauch 1999; Rauch and Trindade 2002). The Chi-nese immigrant network is shown to have a larger trade-increasing effect fordifferentiated goods (ie products that are heterogeneous in both characteris-tics and quality) than for homogeneous goods.8 If the trade-expanding effectof the network on the latter group of goods can be interpreted as the value ofthe network as informal contract enforcement, then the difference in observedimpacts between these two goods classes may be taken to represent the valueof market information, matching and referral services provided by the net-work, the implied information costs being approximately 6%.9 Similarly, ithas been shown that, after being intermediated in Hong Kong, mark-ups onre-exports of Chinese differentiated goods are 9–13% higher than those onhomogeneous goods, which might be seen as the value of information-cost-reducing services provided by intermediating middlemen.10
Information impediments have motivated public interventions, which arecommonly called export promotion actions. In fact, these interventions, andthe formal entities responsible for them, export promotion organisations, are
7The studies use information directly obtained from the firms, primarily through mailsurveys, and through personal and phone interviews (Leonidou 1995; see also Albaum1983; Czinkota and Ricks 1983; Keng and Jiuan 1989; Katsikeas and Morgan 1994; Suárez-Ortega 2003; Leonidou 2004). In particular, limited information is often cited by exportersas a major barrier to both entering new export markets and expanding current exportoperations (Cavusgil and Naor 1987; Katsikeas 1994; Souchon and Diamantopoulos 1998).
8On the role of immigrant networks as information institutions that serve as nodes thathelp match buyers and sellers; see, for example, Gould (1994); Belderbos and Sleuwaegen(19980); Head and Ries (1998, 2001); Combes et al (2005); Herander and Saavedra (2005).
9By comparing the impact on trade of switching the Chinese network variable from zeroto the sample mean for countries with strong Chinese immigrant links (ie both partnershave more than 1% Chinese population), Anderson and van Wincoop (2004) calculate thatthe information-cost-reducing value of the network would be worth a 47% increase intrade. Assuming a value of elasticity of substitution of 8, the Chinese networks save aninformation cost worth 6%.
10Mark-ups are also higher for products with higher variance in export prices, for prod-ucts sent to China to further processing, and for products shipped to countries that tradeless with China (Feenstra and Hanson 2004).
42 Where to Spend the Next Million?
almost ubiquitous (Rauch 1996). Economically, these actions might be—andhave been—justified on the basis of market failures, primarily in the form ofinformation externalities.11 Given that it is difficult to exclude third partiesfrom information and that its use is one of non-rivalry (ie use by one agentdoes not preclude its use by other agents), there is a potential for free ridingon the successful searches of firms for foreign buyers.12 These searches andthe associated transactions then reveal information that may be used by otherfirms, which might eventually follow the pioneering firms without incurringthe latter’s costs.13 As a result, the followers obtain important benefits fromthe first movers’ initial investments and devalue the potential benefits fromtheir searches (see, for example, Rauch 1996; Álvarez 2007). This is particu-larly true when companies attempt to enter a new export market or to trade anew product.14 Private returns from these exporting activities would thus belower than the corresponding social returns, and investment in their devel-opment would then be sub-optimally low (Westphal 1990).
However, the existence of a case for public intervention does not in itselfmean that intervention is warranted. Its social costs need to be factored in.Besides the need to consider the implied opportunity costs, care must betaken not to underestimate obvious risks of resource diversion associatedwith potential rent-seeking activities as well as capture of the responsibleagency by specific interest groups. Intervention would be advisable only ifit would improve social welfare, ie if potential social benefits exceed corre-sponding social costs.15
As for benefits, activities undertaken by export promotion organisationscan be viewed as a means of subsidising searches that counter the disincen-tives arising from potential free riding (Rauch 1996). These actions can helpattenuate information problems. More precisely, trade assistance initiatives
11Information asymmetries on product quality may also create a case for trade policies(see, for example, Grossman 1989; Bagwell 1991). The same may also hold for externalitiesoriginated from managerial practices, training activities, technological change and pro-duction linkages (see, for example, Álvarez and López 2006; Edwards 1993; Feder 1983;Kessing 1967; Westphal 1990).
12Firms may learn about export opportunities from other firms through employee circu-lation, customs documents, customer lists and other referrals (Rauch 1996).
13Several studies present evidence on spillovers (Aitken et al 1997; Álvarez et al 2007;Greenaway et al 2004; Koenig et al 2010). Nevertheless, further research is required todetermine the specific channels through which these spillovers take place (eg employmentcirculation) and thus whether they are actually spillovers and not potentially confound-ing effects, as well as the extent to which their magnitude can justify export promotionpolicies.
14See Hausmann and Rodrik (2003) and Álvarez et al (2007). In Hausmann and Rodrik’s(2003) model, investment in developing new export activities is too low ex ante and entryis too high ex post.
15Determining the extent to which this is actually the case requires a study of its own.
Assessing the Impact of Trade Promotion in Latin America 43
can lower the fixed costs that firms incur when exporting for the first timeand in entering specific new markets by reducing those costs associated withinformation gathering, eg carrying out overseas market studies on prices,product standards and potential buyers (Wagner 1995; Roberts and Tybout1997). As a result, trade promotion organisations can potentially facilitate theinternationalisation of companies and specifically their penetration into newcountry and/or product markets.
But is this actually the case? This simple answer to this question is that, sofar, we do not know much. Information on how effectively programmes aremanaged by responsible entities seems necessary, since these programmesare costly and are just one of the possible alternative applications of gener-ally scarce (and for the most part, public) resources. This chapter intends topresent evidence in this regard.
Among other things, the effectiveness of export promotion will hinge uponthe relevant macroeconomic and sectoral policies, the institutional attributesof the organisations (eg reporting schemes, norms that govern the selectionand promotion of personnel, network of external offices, etc) and their incen-tives structures and the specific kinds of promotion activities performed andinstruments applied. In this chapter we take the first two sets of factors—macroeconomic and sectoral policies and institutional attributes—as contex-tual conditioning elements to be controlled for, and take a detailed look at theimpacts of programmes. Specifically, in this chapter we summarise the resultsof a series of assessments of the direct effects of these programmes on firms’export outcomes in several Latin American countries which were recently car-ried out by the Integration and Trade Sector of the Inter-American Develop-ment Bank (Volpe Martincus 2010). We first review the existing evidence andpoint out the main weaknesses of current measurement strategies; we thenelaborate on how these can be overcome by applying econometric methodsfrom the impact-evaluation literature on appropriate and comprehensive datasets. We close by discussing the potential limitation of this approach andadvancing future lines of research in this area.
2 THE IMPACT OF TRADE PROMOTION ON FIRMS’EXPORT PERFORMANCE: WHAT DID WE KNOW?
There are two main sources of estimates of impacts of trade promotionactions on firms’ export performance: organisations’ own assessments andresults from academic research. Most export promotion organisations gen-erally rely on client satisfaction surveys and calculations based on firm-levelcustoms data to assess the effects of their actions. Surveys primarily providethese organisations with qualitative indications on how they are doing. Butthe usefulness of this information is doubtful because evaluations based onnon-objective data may be easily biased (see, for example, Klette et al 2000).
44 Where to Spend the Next Million?
In addition, these studies are generally carried out by professional evaluatorswho work on commission and risk losing future clients if they provoke strongcriticism.
In some cases, these surveys ask the managers of firms about the volumeof incremental sales associated with the assistance received from the organi-sation. These quantitative measures of the effects of their activities also haveseveral weaknesses (see, for example, Klette et al 2000). First, it could be pre-sumed that the managers would exaggerate the size of the pay-off becausethat would increase chances that the programme would continue.16 Second,individual case studies may have high marginal costs per case and may not berepresentative. Specifically, the response rate may be, and in fact is, markedlyuneven and, on average, relatively low. Third, managers may not necessarilyprovide an accurate estimate of the pay-offs from a certain trade promotionactivity because they must address counterfactual questions that are similarto those the econometricians must deal with, and may even have less infor-mation than the latter on the outcome of competing programmes and firms.
While lack of objective information is not an issue when comprehensivefirm-level customs data are available, organisations with access to this datado not properly exploit them to overcome the limitations of survey-basedevaluations. The most common practice can be called direct imputation. Here,entities directly take the sum of the values of exports or compute the changein this value for those firms that they have assisted, attributing the exportoutcomes of these firms—and the resulting expansion of national exports—as their contributions. These figures are likely to overestimate the impact ofexport promotion support, as it is implicitly assumed that these foreign salesor the increment of these sales would not have taken place in the absence ofthis support. This is evidently a questionable assumption.
On the other hand, until very recently, only a few studies in the empiricaltrade literature have used data at the firm level to evaluate more rigorously theimpact of public policies on firm export behaviour. Two careful studies havebeen carried out focusing on activities undertaken by Chile’s national exportpromotion organisation, PROCHILE (Álvarez and Crespi 2000; Álvarez 2004).These studies conclude that instruments managed by this organisation had apositive and direct effect on the number of destination markets to which firmsexport and, indirectly, after a period of four years, on product diversification.Furthermore, whereas trade shows and trade missions do not significantlyaffect the probability that firms become permanent exporters, exporter com-mittees do have such effects. Results for the USA indicate that average states’expenditures on export promotion per firm do not significantly influence theprobability that they will export (Bernard and Jensen 2004). In Ireland, grants
16On the other hand, in some countries it has been reported that sometimes exportersunder-declare sales abroad, anticipating that this information might be used for tax pur-poses.
Assessing the Impact of Trade Promotion in Latin America 45
aimed at increasing investment in technology, training and physical capital,when large enough, appear to be effective in increasing exports of firms thatare already exporting, but are not effective in encouraging new firms to enterinternational markets (Görg et al 2008). While insightful, all these studies con-centrate just on the manufacturing sector or are based on small samples offirms.17 Moreover, they do not fully identify the specific channels throughwhich export promotion may affect exports.18
Summing up, some organisations perform their own impact evaluations.In doing this, they rely primarily on information collected from firms par-ticipating in export promotion activities that they organise and/or automat-ically attribute to these activities the level and/or the change of the value ofexports of firms receiving assistance. Both strategies have clear methodologi-cal flaws, which make their results highly questionable. Moreover, the existingacademic literature virtually ignores developing countries and activities otherthan manufacturing, and here generally using only small samples of firms.Our understanding of the effects of trade promotion actions has been at leastlimited and, in particular, there has been a clear need to provide export pro-motion organisations with a set of analytical tools to help them evaluate theseactions and better allocate funds to maximise their effectiveness. The subse-quent sections introduce a first systematic attempt to fill these analytical andoperational gaps.
17Specifically, Bernard and Jensen (2004) examine a sample of 13,550 US manufacturingplants over the period 1984–92, whereas Görg et al (2008) analyse a sample of 11,730manufacturing firm–year observations in Ireland over the period 1983–2002 (ie an averageof 587 firms per year). Álvarez and Crespi (2000) consider a sample of 365 Chilean firmsout of a population of 7,479 exporting firms over the period 1992–6, while Álvarez (2004)investigates a sample of 295 Chilean manufacturing firms.
18Some papers examine the effects of regional and national expenditures on trade pro-motion on aggregate trade outcomes. States’ export promotion spending has been reportedto have positively affected total states’ exports in the USA. In particular, it is estimated thatan increase in manufacturing promotion expenditures of US$1 would generate an addi-tional US$432 of manufacturing exports (Coughlin and Cartwright 1987). Recent evidenceconsistently shows that the size of the budget of export promotion organisations is pos-itively related to countries’ total exports in a cross-section of countries. For the medianorganisation, for each US$1 spent on trade promotion, exports would increase by US$40(Lederman et al 2006). It has been also shown that official export credit guarantees arepositively associated with the volume of exports in Germany (Moser et al 2008). Severalother papers, mainly from the business economics literature, also investigate the impact oftrade promotion on export performance. However, most of these contributions, besidestheir exclusive focus on developed countries, use highly specific, geographically and/orsectorally limited samples, or just look at a single or a few specific programmes. Hence, itwould be virtually impossible to generalise from these analyses. In addition, endogenousselection of firms into trade assistance or its specific programmes is almost never takeninto account. As a result, impact estimates are likely to be severely biased.
46 Where to Spend the Next Million?
3 PRODUCING MORE RELIABLE ESTIMATES
Assessing the impact of public programmes is essentially a counterfactualanalysis in which causal inference about the effect of these programmesrequires determining how participants would have performed if they had notparticipated. The fundamental problem of impact evaluation is that, while exante each of the potential levels of exports is latent and could be observed,ex post only exports corresponding to participation or non-participation areobserved. The other outcome is counterfactual and unobservable by defini-tion, as is the difference between a firm’s exports if it uses the services pro-vided by the export promotion organisation relative to what its exports wouldbe in the absence of these services. As a consequence, the counterfactual out-come must somehow be recovered from the data available. Constructing avalid control group to get a proper counterfactual may turn out to be a chal-lenging task. The most obvious candidates are those firms that have not beenserved by the export promotion organisations. Thus, if we are interested inthe average assistance effect on firms’ total exports, the mean exports of thosefirms that have not been assisted by the organisation could be used.
However, firms receiving assistance can hardly be considered randomdraws, ie there may be non-random differences between assisted and non-assisted firms that may lead to potentially different export outcomes. Fail-ure to account for these differences would clearly produce biased estimatedimpacts. In particular, if assisted firms are systematically better than non-assisted firms along specific dimensions not controlled for in the analysis, theestimates would overstate the causal effect of export promotion assistance.
In the empirical analysis whose results are presented below, observabledifferences among companies are accounted for using rich information onfirm characteristics to reweight the unconditional differences among exportoutcomes. Nevertheless, as discussed later, upward biases are a potential riskinherent to these kinds of evaluation approaches, which unfortunately cannotbe fully ruled out.
Alternative non-experimental methods have been proposed in the litera-ture to control for firms’ differing characteristics and thereby to constructthe correct sample counterpart for the missing information on the out-comes had the firms not received trade support services. Two of these meth-ods are difference-in-differences and matching difference-in-differences. Thedifference-in-differences estimator uses repeated observations on individuals(firms in this case) to measure the difference between the before and afterchange in exports for assisted firms and the corresponding change for non-assisted firms (Smith 2000; Jaffe 2002). The latter change serves here as anestimate of the true counterfactual, ie the export results that the firms in thetreatment group would have achieved if they had not received trade promo-tion support, which makes it possible to identify temporal variations in out-comes that are not due to having received assistance (Abadie 2005). Therefore,
Assessing the Impact of Trade Promotion in Latin America 47
by comparing the aforementioned changes, the difference-in-differences esti-mator permits controlling for observed and unobserved time-invariant firmcharacteristics as well as time-varying factors common to both assisted andcontrol firms that might be correlated with participation in export promotionprogrammes and export outcomes (see, for example, Galiani et al 2008).
Matching consists of pairing each assisted firm with the more similar mem-bers of the non-assisted group on the basis of their observable characteris-tics, and then estimating the impact of the assistance by comparing exportsof matched assisted and non-assisted firms. This method is based on themain identifying assumption that selection into assistance occurs only onthese observable characteristics of firms.19 Due to data limitations, the ana-lyst may not observe several characteristics. Consequently, systematic differ-ences between the outcomes of assisted and non-assisted firms may persisteven after conditioning on observable factors and the assumption that thereis no selection on unobservables can be restrictive.
However, under certain conditions, selection on an unobservable deter-minant can be allowed for if matching is combined with difference-in-dif-ferences.20 This is the matching difference-in-differences estimator (Heckmanet al 1997, 1998; Abadie 2005; Smith and Todd 2005a). This estimator com-pares the before and after change in exports of assisted firms with that ofmatched non-assisted firms, so that imbalances in the distribution of covari-ates between both groups are accounted for and time-invariant effects areeliminated. Both procedures rely for identification on the assumption thatthere are no time-varying unobserved effects influencing selection into pro-
19See, for example, Heckman and Robb (1985) and Heckman et al (1998). Formally, match-ing is based on two assumptions. First, conditional on a set of observables, the non-treatedexports are independent of the participation status (conditional independence assump-tion). The rationale is that firms that are similar in terms of the characteristics determiningtheir selection into a trade assistance programme and potential export outcomes shouldhave similar exports when participating, so that the differences in exports between par-ticipating and non-participating firms could be used as an estimate of the average effectof assistance if enough pairs of similar firms exist (Rubin 1974; Frölich 2004). Second,all firms have a counterpart in the non-assisted population, and any firm is a possibleparticipant (common support). Together, both assumptions are called strong ignorability.Under these conditions, experimental and non-experimental analyses identify the sameparameter. For additional details see, for example, Rosenbaum and Rubin (1983), Heck-man et al (1997, 1998,1999), Angrist and Krueger (1999), Blundell and Costa Dias (2002)and Caliendo and Kopeinig (2008). Firms differ across multiple dimensions. Thus, match-ing firms may imply a potentially important dimensionality problem. In order to reducethis problem, matching is in general performed on the propensity to participate giventhe set of observable characteristics, or propensity score (Rosenbaum and Rubin 1983).Non-participants are then paired with participants that are similar in terms of this scoreaccording to a specific metric. See the appendix for further details.
20In particular, selection on an unobservable determinant is possible as long as thisdeterminant lies on separable individual and/or time-specific components of the errorterm (Blundell and Costa Dias 2002).
48 Where to Spend the Next Million?
motion activities and exports (Heckman et al 1997; Blundell and Costa Dias2002).
The methods described above, as well as some variants of these methods,have been applied on firm-level export data from six Latin American countries:Peru, Costa Rica, Uruguay, Chile, Argentina and Colombia. For each country,the data set consists of two main databases. The first database has highly dis-aggregated export data at the firm level for four to eight years (depending onthe country) over the period 2000–7 from the national customs agencies. Datais reported annually at the firm–product–country level to reveal how much ofa certain product was exported by a given firm to a certain destination marketin a particular year. Each record includes a firm’s identifier, the product code(8-to-10-digit Harmonized System (HS)),21 the country of destination and theexport value in US dollars.22 In all cases the sum of these firms’ exports vir-tually adds up to the total merchandise exports as reported by the nationalcentral banks or the countries’ national statistical offices. Hence, these datasets cover the whole population of exporters and not merely a sample of man-ufacturing firms. This is especially important for most Latin American coun-tries as non-manufacturing activities still account for relatively large sharesof total exports.
The second database consists of lists of firms assisted in each year of therespective sample periods, which were kindly provided by the export pro-motion organisations in the concerned countries. One organisation, PROEX-PORT, has additionally furnished a list of companies using each of its mainservices. Finally, for some countries, additional data has been gathered onexporters, such as employment and location (Peru, Costa Rica and Argentina),starting data (Peru) and sales (Chile). These data, which are from the nationaltax or social security agencies (eg Peru’s National Tax Administration Agency(SUNAT), Costa Rica’s Social Security Administration (CCSS), Argentina’s Fed-eral Administration of Public Revenues (AFIP) and Chile’s Internal RevenueService (SSI)), allowed us to control for the influence of these variables.23
21The MCO Harmonized Commodity Description and Coding System.
22Unfortunately, we do not have the data needed to estimate and explicitly control forfirms’ total factor productivity. Nevertheless, if adding a new destination country or prod-uct requires incurring specific sunk costs of entry, then trading with a larger numberof countries or a larger number of products will reflect higher productivity (Bernard etal 2006). Those export outcome indicators (lagged) are included in the propensity scoreunderlying the estimates presented here. Hence, the role of productivity differences across(groups of) firms, and the possibility that the agency picks ‘winners’, may be at least par-tially accounted for.
23Thus, data on employment only cover formal employment. There is, of course, somerisk of misreporting, which would generate measurement errors. As long as these errorsare systematic across firms, they will be eliminated by the time differentiation imple-mented in the estimation methods used to carry out the evaluations.
Assessing the Impact of Trade Promotion in Latin America 49
These data have been used to assess the impact of trade promotion supporton several firm-level export performance indicators, such as total exports,number of destination countries, number of products exported, averageexports per country, average exports per product and average exports percountry and product.24 Therefore, the main aim of the assessment has beento estimate the direct effect of this support, and not to evaluate it from a socialwelfare point of view.25 Moreover, since the required data were not available,the way export assistance affects other dimensions of firms’ performance—such as productivity, total sales, or profits—could not be examined. For thesame reason, it was not possible to analyse the impact of trade promotionactivities on the overall firm extensive margin (ie the number of exporters).26
In addition, indirect, sometimes non-pecuniary, effects from participating inexport promotion activities, such as fairs and missions (eg testing the mar-ket for product acceptance, intelligence on competitors, morale of staff, etc),cannot be gauged easily and were not explicitly measured (see, for example,Bonoma 1983; Spence 2003; Seringhaus and Rosson 2005).
Finally, it should be stressed that the quantitative outcomes of the assess-ments are not always directly (perfectly) comparable across countries due todifferences in sample periods, coverage of trade support data and sets of con-trol variables (see the appendix for a description of the specific data set usedin each country) and even in specific estimation methods.27 Different estima-tion methods needed to be used in some cases to explore specific impacts of
24The primary focus is on contemporaneous effects. Notice, however, that there can alsobe lagged effects. For instance, business contacts obtained through participation in exportpromotion activities such as missions and fairs may take some time to materialise intoconcrete sales. Some evidence indicates that these effects are present. In the same vein,cumulative effects associated with self-learning and reputation building over time mayalso be present.
25To do so, we would need to contrast the social costs implied by trade promotion poli-cies with the social benefit they may generate. This was beyond the scope of the study.
26Among other things, this analysis would require firm-level data on variables such astotal sales and/or employment for both exporters and non-exporters and a list of non-exporting firms assisted by the export promotion organisations.
27The unavailability of some data prevented us from carrying out the same analysis inall cases. For example, comparisons of different programmes were only possible in thecase of PROEXPORT, since data were not available for other countries’ organisations. Sim-ilarly, examination of how effects of trade promotion vary with firm size as measured byemployment could not be performed for Uruguay, Chile or Colombia. In addition, con-trol variables vary from case to case: for instance, data on employment and age could begathered for the entire population of Peruvian exporters, but similar data could not beobtained for Colombian or Uruguayan exporters. Admittedly, this might potentially createheterogeneous risks of overestimation of the true causal effects among countries. The sizeof the group of beneficiaries of export promotion programmes might also affect estimates,particularly in the cases of Chile and Colombia. These organisations assist a large propor-tion of exporters. As a consequence, trade support-related spillovers would be more likelyand, ceteris paribus, so might therefore be an understatement of the effects of interest.
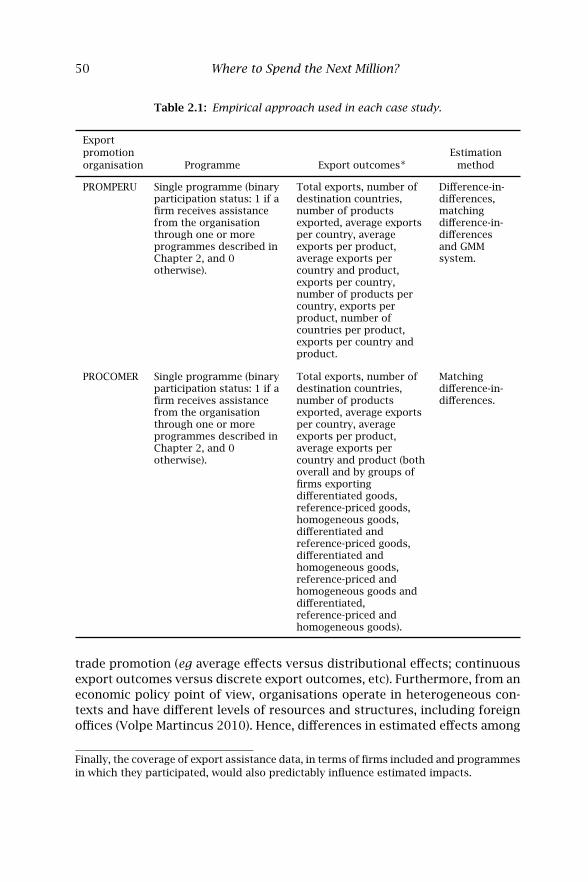
50 Where to Spend the Next Million?
Table 2.1: Empirical approach used in each case study.
Exportpromotion Estimationorganisation Programme Export outcomes∗ method
PROMPERU Single programme (binaryparticipation status: 1 if afirm receives assistancefrom the organisationthrough one or moreprogrammes described inChapter 2, and 0otherwise).
Total exports, number ofdestination countries,number of productsexported, average exportsper country, averageexports per product,average exports percountry and product,exports per country,number of products percountry, exports perproduct, number ofcountries per product,exports per country andproduct.
Difference-in-differences,matchingdifference-in-differencesand GMMsystem.
PROCOMER Single programme (binaryparticipation status: 1 if afirm receives assistancefrom the organisationthrough one or moreprogrammes described inChapter 2, and 0otherwise).
Total exports, number ofdestination countries,number of productsexported, average exportsper country, averageexports per product,average exports percountry and product (bothoverall and by groups offirms exportingdifferentiated goods,reference-priced goods,homogeneous goods,differentiated andreference-priced goods,differentiated andhomogeneous goods,reference-priced andhomogeneous goods anddifferentiated,reference-priced andhomogeneous goods).
Matchingdifference-in-differences.
trade promotion (eg average effects versus distributional effects; continuousexport outcomes versus discrete export outcomes, etc). Furthermore, from aneconomic policy point of view, organisations operate in heterogeneous con-texts and have different levels of resources and structures, including foreignoffices (Volpe Martincus 2010). Hence, differences in estimated effects among
Finally, the coverage of export assistance data, in terms of firms included and programmesin which they participated, would also predictably influence estimated impacts.
Assessing the Impact of Trade Promotion in Latin America 51
Table 2.1: Continued.
Exportpromotion Export Estimationorganisation Programme outcomes∗ method
URUGUAY XXI Single programme (binaryparticipation status: 1 if afirm receives assistancefrom the organisationthrough one or moreprogrammes described inChapter 2, and 0otherwise).
Total exports, number ofdestination countries,number of productsexported, addition of a newexport product, addition ofa new differentiated exportproduct, addition of newdestination country, andaddition of a new OECDdestination country.
Matchingdifference-in-differences andendogenousswitchingbinaryresponsemodel.
PROCHILE Single programme (binaryparticipation status: 1 if afirm receives assistancefrom the organisationthrough one or moreprogrammes described inChapter 2, and 0otherwise).
Total exports, number ofdestination countries,number of productsexported, average exportsper country, averageexports per product,average exports percountry and product, bothoverall and by deciles ofthese variables.
Semiparametricmethod forestimatingquantiletreatmenteffects(combined withdifference-in-differences).
EXPORTAR Single programme (binaryparticipation status: 1 if afirm receives assistancefrom the organisationthrough one or moreprogrammes described inChapter 2, and 0otherwise).
Total exports, number ofdestination countries,number of productsexported, average exportsper country, averageexports per product,average exports percountry and product, bothoverall and by firm sizecategories (small, medium,and large) as defined interms of their number ofemployees.
Difference-in-differences,matchingdifference-in-differences,anddouble-robustestimation.
organisations should be interpreted with extreme caution, because these dif-ferences might be due to various factors, and it is not possible to clearlyestablish the extent to which these various factors are driving them.
4 THE IMPACT OF TRADE PROMOTION ON FIRMS’EXPORT PERFORMANCE: NEW EVIDENCE
This section presents the results of the evaluations of the effects of tradesupport programmes on firms’ export performance in the six Latin American
52 Where to Spend the Next Million?
Table 2.1: Continued.
Exportpromotion Export Estimationorganisation Programme outcomes∗ method
PROEXPORT Multiple programmes(participation statusspecific to counsellingservices, trade agendaservices; trade fair, shows,and mission services; ortheir alternativecombinations).
Total exports, number ofdestination countries,number of productsexported, average exportsper country, averageexports per product,average exports percountry and product, bothoverall and comparingprogrammes tonon-participation and toeach other.
Multipleprogrammematchingdifference-in-differences.
∗Since estimation methods work on differences over time to control for observed and unobservedtime-invariant firm characteristics as well as time-varying factors common to both assisted and con-trol firms that might be correlated with participation in trade promotion programmes and exportoutcomes, estimation effects are in fact measured on the growth of these variables, except for thosediscrete export outcomes examined in the case of Uruguay.
countries listed above. These effects can generally be expected to be heteroge-neous along several dimensions. Specifically, their size is likely to be relatedto the severity of the information problems involved in the specific tradingoperations and/or faced by the firms carrying out these operations. This willbe illustrated next using the experience of the following export promotionorganisations:28
• PROMPEX/PROMPERU (Peru);• PROCOMER (Costa Rica);• URUGUAY XXI (Uruguay);• PROCHILE (Chile);• EXPORTAR (Argentina);• PROEXPORT (Colombia).
4.1 Peru: Extensive Margin or Intensive Margin? 29
Informational obstacles tend to be more important when firms attempt toincrease their number of destination countries or the set of products they sellabroad (extensive margin or diversification) than when they seek to expandexports of goods they have already been trading and/or to countries thatare already among their destination markets (intensive margin or deepening).
28Detailed information on these organisations can be found in Jordana et al (2010) andVolpe Martincus (2010). Tables 2.1 and 2.2 describe each of the programmes in detail.
29This subsection is based on Volpe Martincus and Carballo (2008).
Assessing the Impact of Trade Promotion in Latin America 53
Table 2.2: Datasets.
Country Export data Trade support data Sample period
Peru Firm exportsdisaggregated byproduct (10-digit HS)and destinationcountry
All exporters/allprogrammes
2001–5
Costa Rica Firm exportsdisaggregated byproduct (10-digit HS)and destinationcountry
All exporters/allprogrammes
2001–6
Uruguay Firm exportsdisaggregated byproduct (10-digit HS)and destinationcountry
Exporters interactingclosely with theorganisation(ie face-to-facecontacts)/primarilymissions and fairs
2000–7
Chile Firm exportsdisaggregated byproduct (8-digit HS)and destinationcountry
All exporters/allprogrammes
2002–6
Argentina Firm exportsdisaggregated byproduct (10-digit HS)and destinationcountry
Exporters interactingclosely with theorganisation(ie face-to-facecontacts)/primarilymissions and fairs
2002–6
Colombia Firm exportsdisaggregated byproduct (10-digit HS)and destinationcountry
All exporters/allprogrammes
2003–6
Trade promotion programmes can have varying effects across firms’ exportactivities. In particular, the effect of these programmes will predictably belarger on the extensive margin than on the intensive margin of exports. Wefocused on the case of PROMPEX (currently PROMPERU) to shed light on thisissue.
The overall estimates suggest that participation in activities carried out byPROMPEX/PROMPERU has been associated with an increased rate of growthof firms’ total exports, number of destination countries and number of prod-ucts exported (see Figure 2.1). The rate of growth of exports was 17% higherfor firms assisted by PROMPEX, while those of the number of countries and
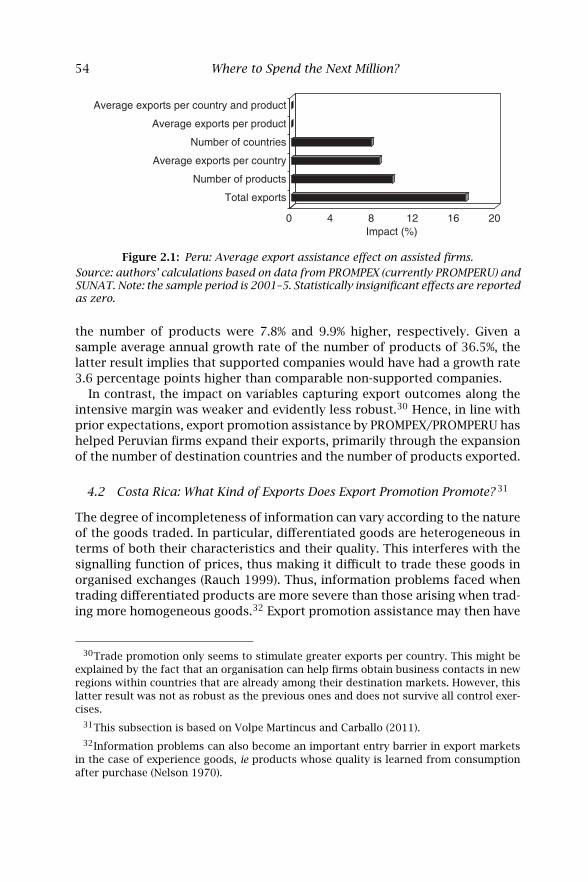
54 Where to Spend the Next Million?
Average exports per country and product
Average exports per product
Number of countries
Average exports per country
Number of products
Total exports
0 4 8 12 16 20Impact (%)
Figure 2.1: Peru: Average export assistance effect on assisted firms.
Source: authors’ calculations based on data from PROMPEX (currently PROMPERU) andSUNAT. Note: the sample period is 2001–5. Statistically insignificant effects are reportedas zero.
the number of products were 7.8% and 9.9% higher, respectively. Given asample average annual growth rate of the number of products of 36.5%, thelatter result implies that supported companies would have had a growth rate3.6 percentage points higher than comparable non-supported companies.
In contrast, the impact on variables capturing export outcomes along theintensive margin was weaker and evidently less robust.30 Hence, in line withprior expectations, export promotion assistance by PROMPEX/PROMPERU hashelped Peruvian firms expand their exports, primarily through the expansionof the number of destination countries and the number of products exported.
4.2 Costa Rica: What Kind of Exports Does Export Promotion Promote? 31
The degree of incompleteness of information can vary according to the natureof the goods traded. In particular, differentiated goods are heterogeneous interms of both their characteristics and their quality. This interferes with thesignalling function of prices, thus making it difficult to trade these goods inorganised exchanges (Rauch 1999). Thus, information problems faced whentrading differentiated products are more severe than those arising when trad-ing more homogeneous goods.32 Export promotion assistance may then have
30Trade promotion only seems to stimulate greater exports per country. This might beexplained by the fact that an organisation can help firms obtain business contacts in newregions within countries that are already among their destination markets. However, thislatter result was not as robust as the previous ones and does not survive all control exer-cises.
31This subsection is based on Volpe Martincus and Carballo (2011).
32Information problems can also become an important entry barrier in export marketsin the case of experience goods, ie products whose quality is learned from consumptionafter purchase (Nelson 1970).
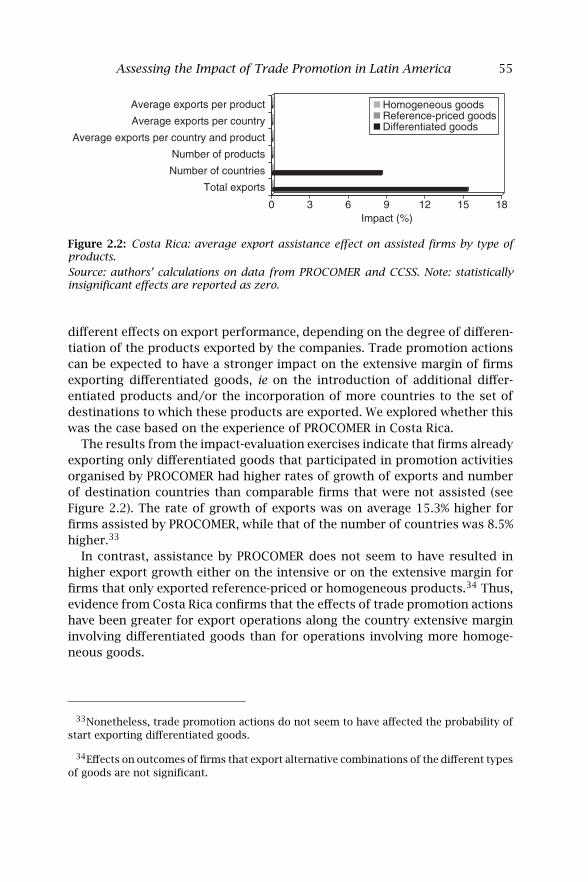
Assessing the Impact of Trade Promotion in Latin America 55
Impact (%)
Total exports
Number of countries
Number of products
Average exports per country and product
Average exports per country
Average exports per product
Differentiated goodsReference-priced goodsHomogeneous goods
1815129630
Figure 2.2: Costa Rica: average export assistance effect on assisted firms by type ofproducts.
Source: authors’ calculations on data from PROCOMER and CCSS. Note: statisticallyinsignificant effects are reported as zero.
different effects on export performance, depending on the degree of differen-tiation of the products exported by the companies. Trade promotion actionscan be expected to have a stronger impact on the extensive margin of firmsexporting differentiated goods, ie on the introduction of additional differ-entiated products and/or the incorporation of more countries to the set ofdestinations to which these products are exported. We explored whether thiswas the case based on the experience of PROCOMER in Costa Rica.
The results from the impact-evaluation exercises indicate that firms alreadyexporting only differentiated goods that participated in promotion activitiesorganised by PROCOMER had higher rates of growth of exports and numberof destination countries than comparable firms that were not assisted (seeFigure 2.2). The rate of growth of exports was on average 15.3% higher forfirms assisted by PROCOMER, while that of the number of countries was 8.5%higher.33
In contrast, assistance by PROCOMER does not seem to have resulted inhigher export growth either on the intensive or on the extensive margin forfirms that only exported reference-priced or homogeneous products.34 Thus,evidence from Costa Rica confirms that the effects of trade promotion actionshave been greater for export operations along the country extensive margininvolving differentiated goods than for operations involving more homoge-neous goods.
33Nonetheless, trade promotion actions do not seem to have affected the probability ofstart exporting differentiated goods.
34Effects on outcomes of firms that export alternative combinations of the different typesof goods are not significant.
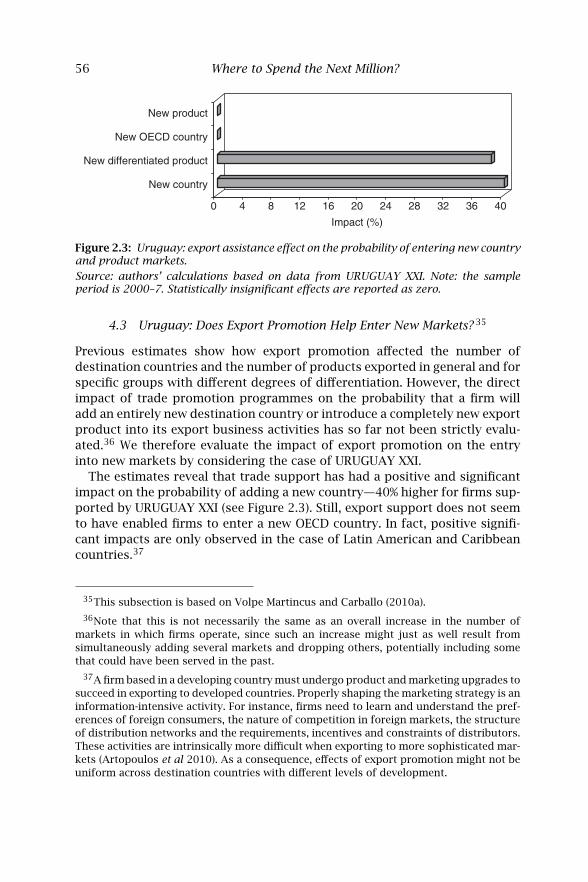
56 Where to Spend the Next Million?
Impact (%)
New country
New differentiated product
New OECD country
New product
0 4 8 12 16 20 24 28 32 36 40
Figure 2.3: Uruguay: export assistance effect on the probability of entering new countryand product markets.
Source: authors’ calculations based on data from URUGUAY XXI. Note: the sampleperiod is 2000–7. Statistically insignificant effects are reported as zero.
4.3 Uruguay: Does Export Promotion Help Enter New Markets? 35
Previous estimates show how export promotion affected the number ofdestination countries and the number of products exported in general and forspecific groups with different degrees of differentiation. However, the directimpact of trade promotion programmes on the probability that a firm willadd an entirely new destination country or introduce a completely new exportproduct into its export business activities has so far not been strictly evalu-ated.36 We therefore evaluate the impact of export promotion on the entryinto new markets by considering the case of URUGUAY XXI.
The estimates reveal that trade support has had a positive and significantimpact on the probability of adding a new country—40% higher for firms sup-ported by URUGUAY XXI (see Figure 2.3). Still, export support does not seemto have enabled firms to enter a new OECD country. In fact, positive signifi-cant impacts are only observed in the case of Latin American and Caribbeancountries.37
35This subsection is based on Volpe Martincus and Carballo (2010a).
36Note that this is not necessarily the same as an overall increase in the number ofmarkets in which firms operate, since such an increase might just as well result fromsimultaneously adding several markets and dropping others, potentially including somethat could have been served in the past.
37A firm based in a developing country must undergo product and marketing upgrades tosucceed in exporting to developed countries. Properly shaping the marketing strategy is aninformation-intensive activity. For instance, firms need to learn and understand the pref-erences of foreign consumers, the nature of competition in foreign markets, the structureof distribution networks and the requirements, incentives and constraints of distributors.These activities are intrinsically more difficult when exporting to more sophisticated mar-kets (Artopoulos et al 2010). As a consequence, effects of export promotion might not beuniform across destination countries with different levels of development.
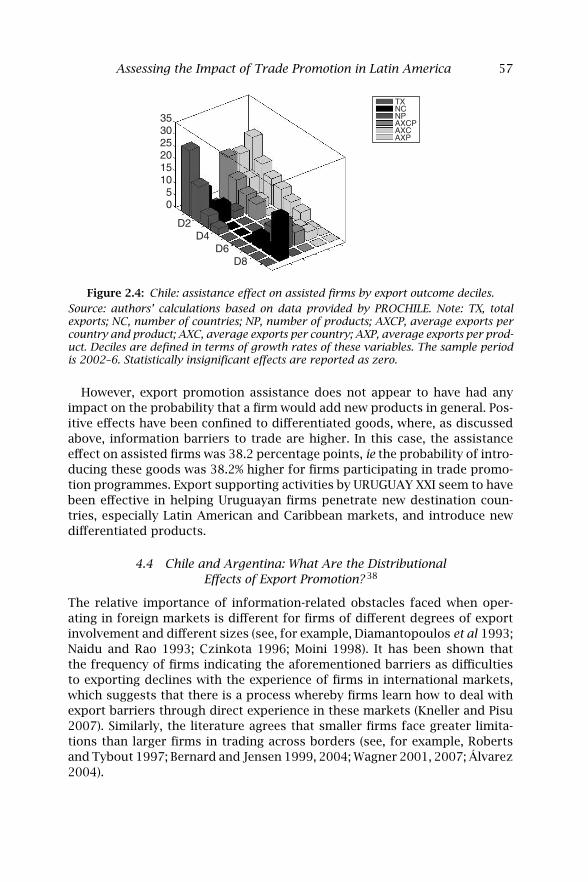
Assessing the Impact of Trade Promotion in Latin America 57
35302520151050
D2D4
D6D8
TXNCNPAXCPAXCAXP
Figure 2.4: Chile: assistance effect on assisted firms by export outcome deciles.
Source: authors’ calculations based on data provided by PROCHILE. Note: TX, totalexports; NC, number of countries; NP, number of products; AXCP, average exports percountry and product; AXC, average exports per country; AXP, average exports per prod-uct. Deciles are defined in terms of growth rates of these variables. The sample periodis 2002–6. Statistically insignificant effects are reported as zero.
However, export promotion assistance does not appear to have had anyimpact on the probability that a firm would add new products in general. Pos-itive effects have been confined to differentiated goods, where, as discussedabove, information barriers to trade are higher. In this case, the assistanceeffect on assisted firms was 38.2 percentage points, ie the probability of intro-ducing these goods was 38.2% higher for firms participating in trade promo-tion programmes. Export supporting activities by URUGUAY XXI seem to havebeen effective in helping Uruguayan firms penetrate new destination coun-tries, especially Latin American and Caribbean markets, and introduce newdifferentiated products.
4.4 Chile and Argentina: What Are the DistributionalEffects of Export Promotion? 38
The relative importance of information-related obstacles faced when oper-ating in foreign markets is different for firms of different degrees of exportinvolvement and different sizes (see, for example, Diamantopoulos et al 1993;Naidu and Rao 1993; Czinkota 1996; Moini 1998). It has been shown thatthe frequency of firms indicating the aforementioned barriers as difficultiesto exporting declines with the experience of firms in international markets,which suggests that there is a process whereby firms learn how to deal withexport barriers through direct experience in these markets (Kneller and Pisu2007). Similarly, the literature agrees that smaller firms face greater limita-tions than larger firms in trading across borders (see, for example, Robertsand Tybout 1997; Bernard and Jensen 1999, 2004; Wagner 2001, 2007; Álvarez2004).
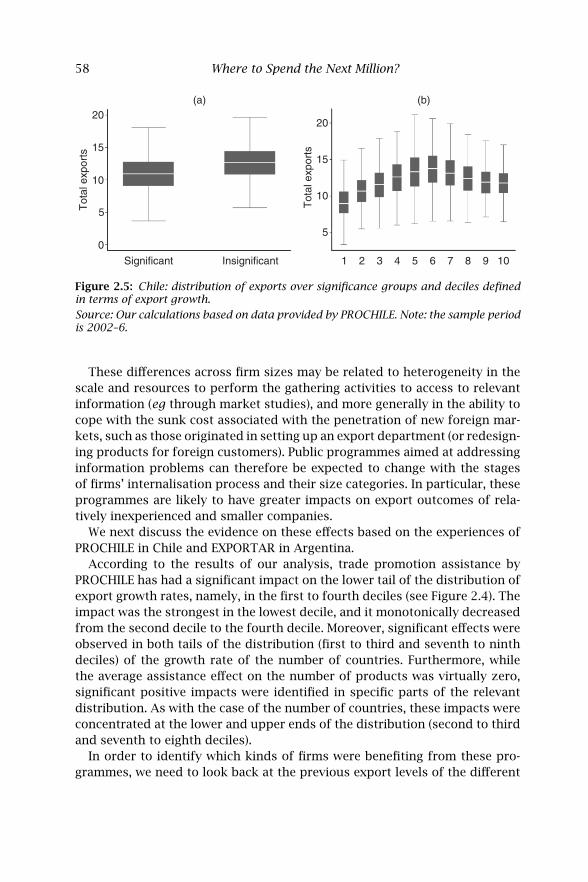
58 Where to Spend the Next Million?
0
5
10
15
20
Tot
al e
xpor
ts
5
10
15
20
Tot
al e
xpor
ts
Significant Insignificant 1 2 3 4 5 6 7 8 9 10
(a) (b)
Figure 2.5: Chile: distribution of exports over significance groups and deciles definedin terms of export growth.
Source: Our calculations based on data provided by PROCHILE. Note: the sample periodis 2002–6.
These differences across firm sizes may be related to heterogeneity in thescale and resources to perform the gathering activities to access to relevantinformation (eg through market studies), and more generally in the ability tocope with the sunk cost associated with the penetration of new foreign mar-kets, such as those originated in setting up an export department (or redesign-ing products for foreign customers). Public programmes aimed at addressinginformation problems can therefore be expected to change with the stagesof firms’ internalisation process and their size categories. In particular, theseprogrammes are likely to have greater impacts on export outcomes of rela-tively inexperienced and smaller companies.
We next discuss the evidence on these effects based on the experiences ofPROCHILE in Chile and EXPORTAR in Argentina.
According to the results of our analysis, trade promotion assistance byPROCHILE has had a significant impact on the lower tail of the distribution ofexport growth rates, namely, in the first to fourth deciles (see Figure 2.4). Theimpact was the strongest in the lowest decile, and it monotonically decreasedfrom the second decile to the fourth decile. Moreover, significant effects wereobserved in both tails of the distribution (first to third and seventh to ninthdeciles) of the growth rate of the number of countries. Furthermore, whilethe average assistance effect on the number of products was virtually zero,significant positive impacts were identified in specific parts of the relevantdistribution. As with the case of the number of countries, these impacts wereconcentrated at the lower and upper ends of the distribution (second to thirdand seventh to eighth deciles).
In order to identify which kinds of firms were benefiting from these pro-grammes, we need to look back at the previous export levels of the different
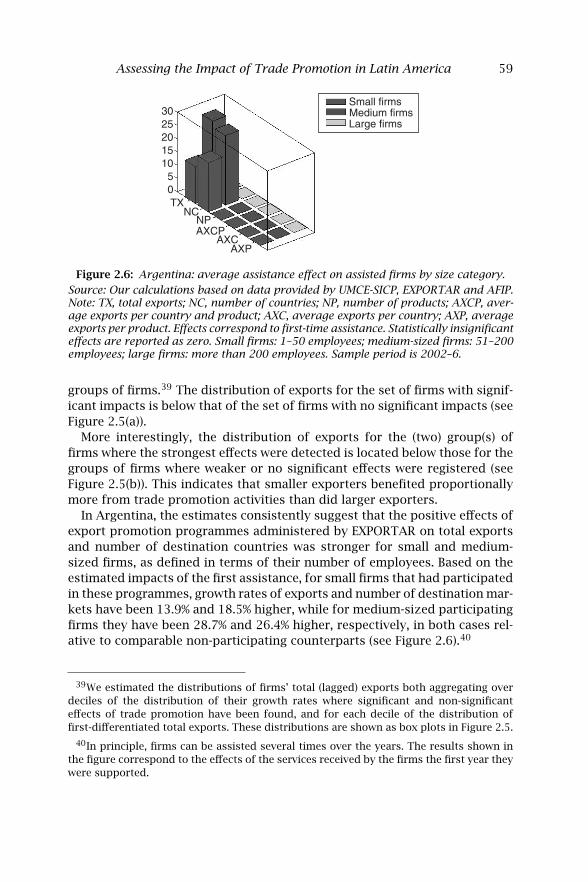
Assessing the Impact of Trade Promotion in Latin America 59
05
1015202530
TXNC
NPAXCP
AXCAXP
Small firmsMedium firmsLarge firms
Figure 2.6: Argentina: average assistance effect on assisted firms by size category.
Source: Our calculations based on data provided by UMCE-SICP, EXPORTAR and AFIP.Note: TX, total exports; NC, number of countries; NP, number of products; AXCP, aver-age exports per country and product; AXC, average exports per country; AXP, averageexports per product. Effects correspond to first-time assistance. Statistically insignificanteffects are reported as zero. Small firms: 1–50 employees; medium-sized firms: 51–200employees; large firms: more than 200 employees. Sample period is 2002–6.
groups of firms.39 The distribution of exports for the set of firms with signif-icant impacts is below that of the set of firms with no significant impacts (seeFigure 2.5(a)).
More interestingly, the distribution of exports for the (two) group(s) offirms where the strongest effects were detected is located below those for thegroups of firms where weaker or no significant effects were registered (seeFigure 2.5(b)). This indicates that smaller exporters benefited proportionallymore from trade promotion activities than did larger exporters.
In Argentina, the estimates consistently suggest that the positive effects ofexport promotion programmes administered by EXPORTAR on total exportsand number of destination countries was stronger for small and medium-sized firms, as defined in terms of their number of employees. Based on theestimated impacts of the first assistance, for small firms that had participatedin these programmes, growth rates of exports and number of destination mar-kets have been 13.9% and 18.5% higher, while for medium-sized participatingfirms they have been 28.7% and 26.4% higher, respectively, in both cases rel-ative to comparable non-participating counterparts (see Figure 2.6).40
39We estimated the distributions of firms’ total (lagged) exports both aggregating overdeciles of the distribution of their growth rates where significant and non-significanteffects of trade promotion have been found, and for each decile of the distribution offirst-differentiated total exports. These distributions are shown as box plots in Figure 2.5.
40In principle, firms can be assisted several times over the years. The results shown inthe figure correspond to the effects of the services received by the firms the first year theywere supported.
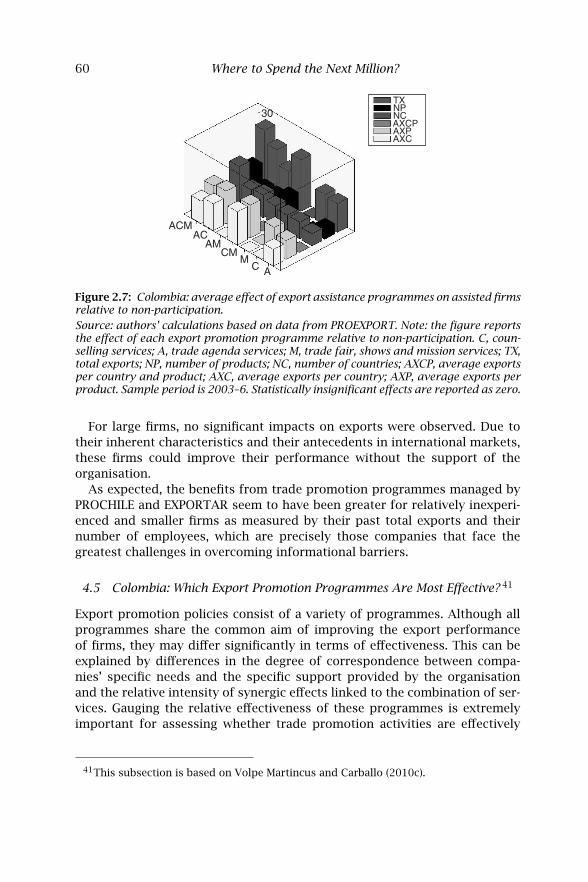
60 Where to Spend the Next Million?
30
ACMAC
AMCM
AM
C
TXNPNCAXCPAXPAXC
Figure 2.7: Colombia: average effect of export assistance programmes on assisted firmsrelative to non-participation.
Source: authors’ calculations based on data from PROEXPORT. Note: the figure reportsthe effect of each export promotion programme relative to non-participation. C, coun-selling services; A, trade agenda services; M, trade fair, shows and mission services; TX,total exports; NP, number of products; NC, number of countries; AXCP, average exportsper country and product; AXC, average exports per country; AXP, average exports perproduct. Sample period is 2003–6. Statistically insignificant effects are reported as zero.
For large firms, no significant impacts on exports were observed. Due totheir inherent characteristics and their antecedents in international markets,these firms could improve their performance without the support of theorganisation.
As expected, the benefits from trade promotion programmes managed byPROCHILE and EXPORTAR seem to have been greater for relatively inexperi-enced and smaller firms as measured by their past total exports and theirnumber of employees, which are precisely those companies that face thegreatest challenges in overcoming informational barriers.
4.5 Colombia: Which Export Promotion Programmes Are Most Effective? 41
Export promotion policies consist of a variety of programmes. Although allprogrammes share the common aim of improving the export performanceof firms, they may differ significantly in terms of effectiveness. This can beexplained by differences in the degree of correspondence between compa-nies’ specific needs and the specific support provided by the organisationand the relative intensity of synergic effects linked to the combination of ser-vices. Gauging the relative effectiveness of these programmes is extremelyimportant for assessing whether trade promotion activities are effectively
41This subsection is based on Volpe Martincus and Carballo (2010c).
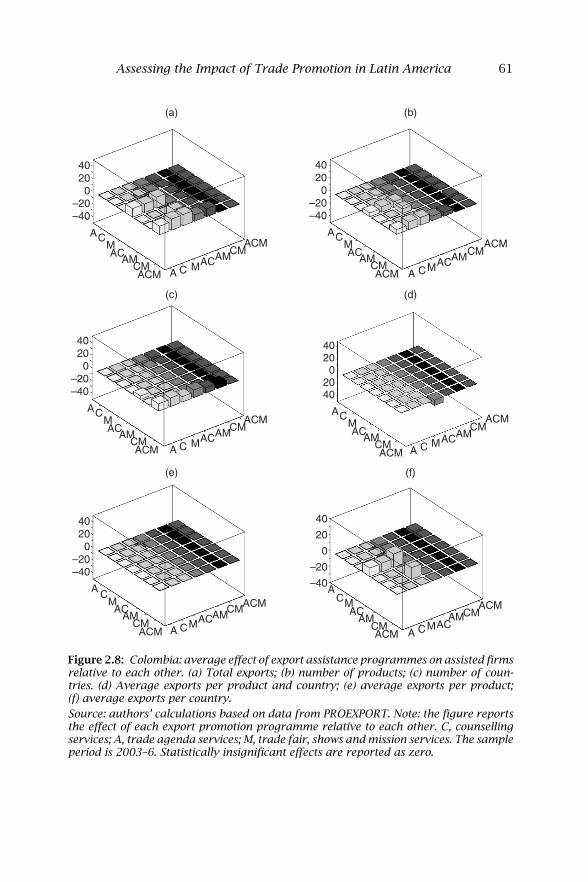
Assessing the Impact of Trade Promotion in Latin America 61
4020
0–20–40
A
A
C
C
M
MAC
ACAM AMCM
CM
ACM
ACM
40200
–20–40
A
A
C
C
M
MAC
ACAM AMCM
CM
ACM
ACM
40200
–20–40
A
A
C
C
M
MAC
ACAM AMCM
CM
ACM
ACM
(a) (b)
(c)
40200
2040
A
A
C
C
M
MAC
ACAM AMCM
CM
ACM
ACM
40200
–20–40
A
A
C
C
M
MAC
ACAM AMCM
CM
ACM
ACMA
A
C
C
M
MAC
ACAM AMCM
CM
ACM
ACM
(d)
(e) (f)
40
20
0
–20
–40
Figure 2.8: Colombia: average effect of export assistance programmes on assisted firmsrelative to each other. (a) Total exports; (b) number of products; (c) number of coun-tries. (d) Average exports per product and country; (e) average exports per product;(f) average exports per country.
Source: authors’ calculations based on data from PROEXPORT. Note: the figure reportsthe effect of each export promotion programme relative to each other. C, counsellingservices; A, trade agenda services; M, trade fair, shows and mission services. The sampleperiod is 2003–6. Statistically insignificant effects are reported as zero.
62 Where to Spend the Next Million?
targeted—in the sense that firms that use a certain service perform better thanif they had used another service—or whether some services are consistentlybetter than others. This information can be valuable in guiding the allocationof public funds devoted to trade promotion in order to maximise their impactand thereby improve existing policies. The case study on Colombia examinedthese programme-specific effects.
The results from our assessment indicate that a combination of thethree basic services—counselling, missions and fairs, and trade agenda—systematically performed better. These bundled services seem to have beenassociated with better export outcomes, primarily in terms of total exportsand number of destination countries, relative to both the non-assistance situa-tion and each of the services individually considered (see Figures 2.7 and 2.8).Firms combining these three services have had significantly higher exportgrowth along the country and product extensive margins than if they had usedeach of these services separately. For these firms, the growth rate of exportswas on average 17.7% higher, the number of countries was 11.7% higher andthe number of products was 11% higher. These firms also exhibit a highergrowth of the number of destination countries (on average, 9.4% higher), whencompared with a situation in which they had used alternative combinationsof two of these three services.
In contrast, trade promotion programmes, either individually or bundled,do not appear to have had significant impacts on average exports per country,average exports per product and average exports per country and product.This is consistent with findings in other countries in the region.
To sum up, an examination of the different promotion programmes carriedout by Colombia’s PROEXPORT reveals that bundled services combining coun-selling, trade agenda and trade missions and fairs—which provide exporterswith a comprehensive support throughout the process of starting export busi-nesses and building up buyer–seller relationships with foreign partners—aremore effective than isolated assistance actions such as trade missions andfairs alone.
Recapitulating
We have applied econometric methods already employed in other public pol-icy fields on highly disaggregated firm-level export and trade support data inorder to analyse the impact of trade promotion programmes managed by rel-evant entities in several Latin American countries on various dimensions offirms’ export performance. From this in-depth analysis at least four generalconclusions can be made.
First, trade assistance effects are predictably greater on the extensivemargin of firms’ exports, ie when firms attempt to increase the numberof destination countries and/or to expand the set of goods exported and,
Assessing the Impact of Trade Promotion in Latin America 63
specifically, when they seek to enter an entirely new country or productmarket.42
Second, export promotion actions are more likely to generate larger exportgains to the extent that products traded are more differentiated, becauseinformation barriers are more important in these cases.
Third, due to the greater limitations they face in accessing relevant exportinformation, small firms with limited previous involvement in internationalmarkets can be expected to benefit more from export assistance.
Fourth, bundled support services provided throughout the export process,from the beginning of the commercial contacts to the establishment of thebusiness relationships, seem to be more effective in enhancing firms’ exportperspectives than individual actions.
Do the previous findings mean that larger companies expanding theirexports of reference-priced goods in their current destination markets shouldnot be supported? Not necessarily. For instance, these firms might generatepositive external reputational effects that benefit trading initiatives of otherfirms. Remember that these and other indirect effects have not been explicitlyconsidered in these evaluations, although ideally they should be taken intoaccount for computing cost-effectiveness ratios.
These facts should therefore be interpreted as general criteria that, alongwith others to be developed through further research and after factoring inimplied relative costs, could be used in designing trade support programmesto maximise their impact.
5 WHAT SHOULD BE CONSIDERED WHENINTERPRETING THE PREVIOUS FINDINGS?
As mentioned above, current impact-evaluation practices of many trade pro-motion organisations have methodological flaws. These evaluations are likelyto misrepresent the real contribution these organisations make to the com-panies’ export growth and thereby to that of the countries. In fact, previousestimates indicate that, over the sample period, the latter strategy would onaverage overestimate these contributions by 5.9 times for PROMPEX (currentlyPROMPERU); 9.4 times for PROCOMER; 7.3 times for URUGUAY XXI; 14.3 timesfor PROCHILE; 5.2 times for EXPORTAR; and 3.7 times for PROEXPORT. Hence,the outputs of these evaluations are not adequate for guiding the strategiesand activities of these organisations as well as the allocation of their scarce
42A simple portfolio argument suggests that if covariance of firm sales across countries isnot perfect, then spreading these sales over a larger number of countries will be associatedwith more stable total sales. This can be expected to result in less likelihood of businessfailure and of abandoning international markets. The final outcome may be increased firmsurvival (Volpe Martincus and Carballo 2009).
64 Where to Spend the Next Million?
resources to these activities to maximise their influence on their countries’export development.
While the methods used to generate previous results allow for substantialimprovements in the accuracy of impact estimates, they are not exemptedfrom limitations. Caution is hence required when interpreting these estimates.First, identification is based on the assumption that time-varying unobservedeffects do not affect selection into support and exports. Admittedly, theremight be time-variant firm-specific factors that lead to improved export per-formance and are not observable to us. This is, for instance, predictably thecase with productivity. While we generally include some firm-level variablesthat at least partially account for productivity differences across groups offirms, these remain imperfect controls. If, after conditioning on these vari-ables, productivity still plays a significant role in determining programme par-ticipation, and is accordingly higher for firms that receive export assistancefrom the organisations, then these procedures would overestimate the truecausal effects of this assistance on export performance. Unfortunately, thispossibility cannot be excluded. But, given the process of selection into tradesupport, the extension of our sample period and the covariates included, wewould expect that, if any, this is not a serious problem.
Second, these evaluation exercises take the main assumptions of the Roy–Rubin model for granted (Roy 1951; Rubin 1974). Cross-market and gen-eral equilibrium effects are assumed away.43 However, these assumptionsare likely to be violated in many contexts. This might happen, for instance,when estimating the effects of foreign acquisitions on wages (see, for exam-ple, Girma and Görg 2007). Evaluation of export promotion policies is, ofcourse, not an exception. As we have said, there may be information exter-nalities associated with exporting activities.44 If these spillovers were linkedto participation in specific export promotion actions, then the outcome dif-ferences between assisted and non-assisted firms corrected by observableheterogeneity across these groups would underestimate the true impact ofthese actions (see, for example, Heckman et al 1999; Miguel and Kremer 2004;Ravallion 2008). Under perfect contemporary dissemination of informationacross firms, this impact would not be statistically different from zero andcould accordingly not be identified. Yet, there might also be negative (pecu-niary) externalities in the form of increased competition. Firms receiving tradeassistance (as well as their followers) may penetrate particular country and/orproduct markets, thereby potentially eroding the position of other domesticfirms already serving these markets. According to informal tests performed in
43Hence, outcomes for each firm do not depend on the overall level of participation inthe activities performed by the agency (Heckman et al 1998).
44Álvarez et al (2007) report evidence in favour of the existence of such spillovers in thecase of Chile. They find that the probability of firms introducing given products to newcountries or different products to the same countries increases with the number of firmsexporting those products and to those destinations, respectively.
Assessing the Impact of Trade Promotion in Latin America 65
some of the case studies, neither self-discovery nor competition effects seemto seriously threaten the validity of the estimation results reported in thischapter. Nonetheless, these phenomena deserve to be explored more thor-oughly in future research.
Third, in several policy areas, interventions are multiple. Support to com-panies is, of course, not an exception. In some countries, firms may get assis-tance from different public and private entities. Regrettably, in these casesthere is no unified register of firms benefiting from various support mea-sures. Thus, it is not possible to account for the influence of interventionsother than trade promotion, with the result that these actions become anunobserved factor. If this factor is time invariant over the sample period,its impact will be automatically controlled for by the estimation procedures,which identify the effects of interest based on the time variation. If firms’participation status in other assistance programmes is instead a time-varyingvariable, we are back to the first scenario described above. Two extreme casescan be considered. If all firms assisted by export promotion organisationsare also simultaneously receiving support through programmes managed byother public or private agencies, and if these programmes have significanteffects on firms’ export performance, then the estimated impacts will over-estimate those of trade promotion activities and will instead reflect the effectsof the combined assistance. In contrast, if no company participating in theseactivities is simultaneously a beneficiary of other support initiatives, then, aslong as these are effective, estimates will understate their true incidence onfirms’ export outcomes. We will return to this issue in the next section.
6 THE WAY AHEAD
Periodic evaluations are necessary for well-informed policy decisions and, inparticular, an indispensable component of the dynamic adjustment of theorganisations to the evolving needs of their services users. The adequacy ofthe design of export promotion activities and the robustness of the evalua-tions of their effectiveness depend on the access to a set of information thatallows for a precise knowledge of the firms. Unfortunately, gathering suchinformation is extremely difficult, even for the export promotion organisa-tions themselves, in some cases because from a legal point of view these areprivate entities.
These organisations need to gain better access to relevant data stored byother public agencies, including national bureaus of statistics, and improvecollaboration to generate new data, all under conditions that ensure strictconfidentiality. Here, strengthened cooperation between public and privateentities would be desirable. The availability of richer and consistent databaseswould make it possible to go beyond the analysis of the effects of trade promo-tion actions on the primary variable of interest: exports. This would facilitate
66 Where to Spend the Next Million?
the examination of their impact on other measures of firm performance suchas productivity.45
Export promotion policies are just one subset of public policy instrumentsthat may affect countries’ profiles in international trade. Strictly conceived,they reduce information and trade costs, thus enabling existing firms enteringinternational markets, as well as current exporters, to diversify their externalsales of the goods they already produce across destination markets. Otherspecific public policies, some of which are becoming increasingly intercon-nected with export promotion in developed countries, would also predictablyhave impacts on countries’ international trade. Thus, business developmentsupport throughout the process of establishing a new company may result inthe emergence of new firms producing new goods, and therefore in productdiversification and export diversification (for example, when properly com-bined with trade promotion).
Provided that the aforementioned databases include lists of beneficiariesof different public support programmes (eg export promotion and innova-tion promotion), it would be possible not only to determine how to improvecoordination under the prevailing conditions, but also to carry out reliableevaluations that consider the existence of other assistance initiatives in whichcompanies participate and assess complementarities and synergies amongthem. Insights into these potential interdependencies would be valuable fordesigning policy instruments and establishing their components and sequenc-ing. These consistent data on the various relevant programmes would allowfor evaluations of their relative merits in terms of a common metric and wouldhelp policymakers better allocate resources.
The results presented in this chapter are based on non-experimental meth-ods. Social experiments can generate further and, under certain conditions,more robust insights into the effects of trade assistance, and therefore appearas the natural next alternative strategy to pursue.
Christian Volpe Martincus is a Senior Economist in the Integration and TradeSector at the Inter-American Development Bank.
REFERENCES
Aakvik, A., T. Holmas, and E. Kjerstad (2003). A low-key social insurance reform-effectsof multidisciplinary outpatient treatment for back pain patients in Norway. Journalof Health Economics 22, 747–62.
45Although still it is disputed in the empirical literature, exporting and expandingexports along the country and product extensive margins may generate positive exter-nalities (ie learning-by-exporting effects), thereby resulting in increased productivity. Inthis way, trade support may potentially end up boosting firms’ productivity.
Assessing the Impact of Trade Promotion in Latin America 67
Aakvik, A., J. Heckman, and E. Vytlacil (2005). Estimating treatment effects for discreteoutcomes when responses to treatment vary: an application to Norwegian vocationalrehabilitation programs. Journal of Econometrics 125, 15–51.
Abadie, A. (2005). Semiparametric difference-in-differences estimators. Review of Eco-nomic Studies, 72(1), 1–19.
Abadie, A., and G. Imbens (2006). On the failure of the bootstrap for matching esti-mators. NBER Technical Working Paper 325.
Aitken, B., G. Hanson, and A. Harrison (1997). Spillovers, foreign investment, andexport behavior. Journal of International Economics 43, 103–132.
Albaum, G. (1983). Effectiveness of government export assistance for US smaller-sizedmanufacturers: some further evidence. International Marketing Review 1(1), 68–75.
Álvarez, R. (2004). Sources of export success in small- and medium-sized enterprises:the impact of public programs. International Business Review 13, 383–400.
Álvarez, R. (2007). Explaining export success: firm characteristics and spillover effects.World Development 35, 377–393.
Álvarez, R., and G. Crespi (2000). Exporter performance and promotion instruments:Chilean empirical evidence. Estudios de Economía 27, 225–241.
Álvarez, R., and R. López (2006). Is exporting a source of productivity spillovers?CAEPR Working Paper 2006-012.
Álvarez, R., H. Faruq, and R. López (2007). New products in export markets: Learningfrom experience and learning from others. Mimeo, Indiana University.
Anderson, J., and E. van Wincoop (2004). Trade costs. Journal of Economic Literature42, 691–751.
Angrist, J., and A. Krueger (1999). Empirical Strategies in Labor Economics, in O. Ashen-felter and D. Card (eds), Handbook of Labor Economics, Elsevier.
Artopoulos, A., D. Friel, and J. Hallak (2010). Challenges of exporting differentiatedproducts to developed countries: the case of SME-dominated sectors in a semi-industrialized country. IDB Working Paper 166.
Athey, S., and G. Imbens (2006). Identification and inference in nonlinear difference-in-differences models. Econometrica 74, 431–497.
Bagwell, K. (1991). Optimal export policy for a new-product monopoly. American Eco-nomic Review 81(5), 1156–1169.
Barrios, S., H. Görg, and E. Strobl (2003). Exporting firms’ export behaviour: R&D,spillovers, and destination market. Oxford Bulletin of Economics and Statistics 65,475–496.
Belderbos, R., and L. Sleuwaegen (1998). Tariff jumping DFI and export substitution:Japanese electronic firms in Europe. International Journal of Industrial Organization16, 601–638.
Bernard, A., and B. Jensen (1999). Exceptional exporter performance: cause, effect, orboth? Journal of International Economics 47, 1–25.
Bernard, A., and B. Jensen (2004). Why some firms export? Review of Economics andStatistics 86, 561–569.
Bernard, A., S. Redding, and P. Schott (2006). Multi-product firms and product switch-ing. NBER Working Paper 12293.
Bertrand, M., E. Duflo, and S. Mullainathan (2004). How much should we trustdifference-in-differences estimates? Quarterly Journal of Economics 119, 249–275.
Blundell, R., and S. Bond (1998). Initial conditions and moment restrictions in dynamicpanel data models. Journal of Econometrics 87, 115–143.
Blundell, R., and M. Costa Dias (2002). Alternative approaches to evaluation in empir-ical microeconomics. CEMMAP Working Paper CWP10/02.
68 Where to Spend the Next Million?
Bonoma, T. (1983). Get more out of your trade shows. Harvard Business Review. http://hbr.org/1983/01/get-more-out-of-your-trade-shows/ar/1.
Branch, A. (1990). Elements of Export Marketing and Management. London, Chapmanand Hall.
Caliendo, M., and S. Kopeinig (2008). Some practical guidance for the implementationof propensity score matching. Journal of Economic Surveys 22, 31–72.
Caminal, R., and X. Vives (1996). Why market shares matter: an information-basedtheory. Rand Journal of Economics 27, 221–239.
Cavusgil, S., and J. Naor (1987). Firm and management characteristics as discrimina-tors of export marketing activity. Journal of Business Research 15(3), 221–235.
Chen, N. (2004). Intra-national versus international trade in the European Union: whydo national borders matter? Journal of International Economics 63, 93–118.
Chen, S., R. Mu, and M. Ravallion (2009). Are there lasting impacts of aid to poor areas?Journal of Public Economics 93, 512–528.
Chiang, S., and R. Masson (1988). Domestic industrial structure and export quality.International Economic Review 29, 261–270.
Chisik, R. (2003). Export industry policy and reputational comparative advantage. Jour-nal of International Economics 59, 423–451.
Combes, P., M. Lafourcade, and T. Mayer (2005). The trade-creating effects of businessand social networks: evidence from France. Journal of International Economics 66,423–451.
Coughlin, C., and P. Cartwright (1987). An examination of state foreign export promo-tion and manufacturing exports. Journal of Regional Science 27, 439–449.
Czinkota, M. (1996). Why national export promotions. International Trade Forum 2,10–13.
Czinkota, M., and D. Ricks (1983). The use of multi-measurement approach in thedetermination of company export priorities. Journal of the Academy of MarketingScience 11, 283–291.
Czinkota, M., and I. Ronkainen (2001). International marketing (Mason, OH: ThomsonSouth-Western).
Diamantopoulos, A., B. Schlegelmich, and Y. Tse. (1993). Understanding the role ofexport marketing assistance: empirical evidence and research needs. European Jour-nal of Marketing 27, 5–18.
Djebbari, H., and J. Smith (2008). Heterogeneous impacts in PROGRESA. Journal ofEconometrics 145, 64–80.
Edwards, S. (1993). Openness, trade liberalization, and growth in developing countries.Journal of Economic Literature 31, 1358–1393.
Egan, M., and A. Mody (1992). Buyer–seller links in export development. World Devel-opment 20, 321–334.
Feder, G. (1983). On exports and economic growth. Journal of Development Economics12, 59–73.
Feenstra, R., and G. Hanson (2004). Intermediaries in entrepot trade: Hong Kong re-exports of Chinese goods. Journal of Economics and Management Strategy 13, 3–35.
Firpo, S. (2007). Efficient semiparametric estimation of quantile treatment effects.Econometrica 75, 259–276.
Frölich, M. (2004). Programme evaluation with multiple treatments. Journal of Eco-nomic Survey 18, 181–224.
Galiani, S., P. Gertler, and E. Schargrodsky (2008). School decentralization: helpingthe good get better, but leaving the poor behind. Journal of Public Economics 92,2106–2120.
Assessing the Impact of Trade Promotion in Latin America 69
Girma, S., and H. Görg (2007). Evaluating the foreign ownership wage premium usinga difference-in-differences matching approach. Journal of International Economics72, 97–112.
Görg, H., M. Henry, and E. Strobl (2008). Grant support and exporting activity. Reviewof Economics and Statistics 90, 168–174.
Gould, D. (1994). Immigrant links to the home country: empirical implications for USbilateral trade flows. Review of Economics and Statistics 76, 302–316.
Greenaway, D., N. Sousa, and K. Wakelin (2004). Do domestic firms learn to exportfrom multinationals? European Journal of Political Economy 20, 1027–1043.
Grossman, G. (1989). Promoting new industrial activities: a survey of recent argumentsand evidence. Mimeo, Woodrow Wilson School, Princeton University.
Hall, P. (1998). Cities in Civilization (Oxford: Blackwell).Han, C., and V. Terpstra (1988). Country-of-origin effects for uni-national and bi-
national products. Journal of International Business Studies 19, 235–255.Hausmann, R., and D. Rodrik (2003). Economic development as self-discovery. Journal
of Development Economics 72, 603–633.Head, K., and J. Ries (1998). Immigration and trade creation: econometric evidence
from Canada. Canadian Journal of Economics 31, 47–62.Head, K., and J. Ries (2001). Overseas investment and firm exports. Review of Interna-
tional Economics 9, 108–122.Heckman, J. (1981). Heterogeneity and state dependence, in S. Rosen (ed), Studies on
Labor Markets. The University of Chicago Press.Heckman, J., and R. Robb (1985). Alternative methods for evaluating the impact of
interventions, in J. Heckman and B. Singer, Longitudinal Analysis of Labor MarketData. New York: Wiley.
Heckman, J., H. Ichimura, and P. Todd (1997). Matching as an econometric evaluationestimator: evidence from evaluating a job training programme. Review of EconomicStudies 64, 605–654.
Heckman, J., H. Ichimura, J. Smith, and P. Todd (1998). Characterizing selection biasusing experimental data. Econometrica 66, 1017–1098.
Heckman, J., R. LaLonde, and J. Smith (1999). The economics and econometrics ofactive labor market programs, in O. Ashenfelter and D. Card (eds), Handbook ofLabor Economics. Elsevier.
Herander, M., and L. Saavedra (2005). Exports and the structure of immigrant-basednetworks: the role of geographic proximity. Review of Economics and Statistics 87,323–335.
Holland, P. (1986). Statistics and causal inference. Journal of the American StatisticalAssociation 81, 945–960.
Huang, R. R. (2007). Distance and trade: disentangling unfamiliarity effects and trans-port cost effects. European Economic Review 51, 161–181.
Hudson, J., and P. Jones (2003). International trade in ‘quality goods’: signalling prob-lems for developing countries. Journal of International Development 15, 999–1013.
Imbens, G. (2004). Nonparametric estimation of average treatment effects under exo-geneity: a review. Review of Economics and Statistics 86, 4–29.
Imbens, G., and J. Wooldridge (2008). Recent developments in the econometrics ofprogram evaluation. IZA Discussion Paper 3640.
Jaffe, A. (2002). Building program evaluation into the design of public research supportprograms. Oxford Review of Economic Policy 18, 22–34.
Johanson, J., and J. Vahlne (1977). The internationalization process of the firm: a modelof knowledge development and increasing foreign market commitments. Journal ofInternational Business Studies 8, 23–32.
70 Where to Spend the Next Million?
Jordana, J., C. Volpe Martincus, and A. Gallo (2010). Export promotion organizations inLatin America and the Caribbean: an institutional portrait. IDB Working Paper 198.
Katsikeas, C. (1994). Export competitive advantages: the relevance of firm character-istics. International Marketing Review 11(3), 33–53.
Katsikeas, C., and R. Morgan (1994). Differences in perceptions of exporting problemsbased on firms size and export experience. European Journal of Marketing 28, 17–35.
Keng, K., and T. Jiuan (1989). Differences between small and medium sized exportingand non-exporting firms: nature or nurture. International Marketing Review 6(4),27–40.
Kessing, D. B. (1967). Outward-looking policies and economic development. The Eco-nomic Journal 77, 303–320.
Klette, T., J. Moen, and Z. Griliches (2000). Do subsidies to commercial R&D reducemarket failures? Microeconomic evaluation studies. Research Policy 29, 471–495.
Kneller, R., and M. Pisu (2007). Export barriers: what are they and who do they matterto? Mimeo, University of Nottingham.
Koenig, P., F. Mayneris, and S. Poncet (2010). Local export spillovers in France. Euro-pean Economic Review 54, 622–641.
Koenker, R., and G. Bassett (1978). Regression quantiles. Econometrica 46, 33–50.Lach, S. (2002). Do R&D subsidies stimulate or displace private R&D? Evidence from
Israel. Journal of Industrial Economics 50, 369–390.Lechner, M. (2002). Program heterogeneity and propensity score matching: an appli-
cation to the evaluation of active labor market policies. Review of Economics andStatistics 84, 205–220.
Lederman, D., M. Olarreaga, and L. Payton (2006). Export promotion agencies: whatworks and what doesn’t. World Bank Policy Research Working Paper 4044.
Leonidou, L. C. (1995). Empirical research on export barriers: review, assessment, andsynthesis. Journal of International Marketing 3, 29–43.
Leonidou, L. C. (2004). An analysis of the barriers hindering small business exportdevelopment. Journal of Small Business Management 42, 279–302.
Leonidou, L. C., and M. Theodosiu (2004). The export marketing information system:an integration of the extant knowledge. Journal of World Business 39, 12–36.
Meyer, B. D. (1995). Natural and quasi-experiments in economics. Journal of Businessand Economic Statistics 13, 151–161.
Miguel, E., and M. Kremer (2004). Worms: identifying impacts on education and healthin the presence of treatment externalities. Econometrica 72, 159–217.
Mesquita Moreira, M., C. Volpe Martincus, and J. Blyde (2008). Unclogging the arteries:the impact of transport costs on Latin American and Caribbean trade. Special Reporton Integration and Trade. David Rockefeller Center for Latin American Studies, Har-vard University, Cambridge, MA.
Moini, A. (1998). Small firms exporting: how effective are government export assistanceprograms? Journal of Small Business Management 36, 1–15.
Moser, C., T. Nestmann, and M. Wedow (2008). Political risk and export promotion:evidence from Germany. The World Economy 31, 781–803.
Naidu, G., and T. Rao (1993). Public-sector promotion of exports: a need-basedapproach. Journal of Business Research 27, 85–101.
Nelson, P. (1970). Information and consumer behavior. Journal of Political Economy78, 311–329.
Pagés-Serra, C. (ed) (2010). The Age of Productivity: Transforming Economies from theBottom Up. Washington, DC: Inter-American Development Bank.
PROEXPORT (2008). Prepare a su empresa para un evento internacional.
Assessing the Impact of Trade Promotion in Latin America 71
Rangan, S. (2000). Search and deliberation in international exchange: microfounda-tions to some macro patterns. Journal of International Business Studies 31, 205–222.
Rangan, S., and R. Lawrence (1999). Search and deliberation in international exchange:learning from international trade about lags, distance effects, and home bias. NBERWorking Paper 7012.
Rauch, J. E. (1996). Trade and search: social capital, sogo shosha, and spillovers. NBERWorking Paper 5618.
Rauch, J. E. (1999). Networks versus markets in international trade. Journal of Inter-national Economics 48, 7–35.
Rauch, J. E., and A. Casella (2003). Overcoming informational barriers to internationalresource allocation: prices and ties. The Economic Journal 113, 21–42.
Rauch, J. E., and V. Trindade (2002). Ethnic Chinese networks in international trade.Review of Economics and Statistics 84, 116–130.
Ravallion, M. (2008). Evaluating anti-poverty programs, in R. Evenson and P. Schultz(eds), Handbook of Development Economics. Amsterdam: North-Holland.
Roberts, M. J., and J. R. Tybout (1997). The decision to export in Colombia: an empiricalmodel of entry with sunk costs. American Economic Review 87, 545–564.
Robins, J., and A. Rotnitzky (1995). Semiparametric efficiency in multivariate regres-sion models for repeated outcomes in the presence of missing data. Journal of theAmerican Statistical Association 90, 106–121.
Rosenbaum, P. R., and D. B. Rubin (1983). The central role of the propensity score inobservational studies for causal effects. Biometrika 70, 41–55.
Rosenbaum, P. R., and D. B. Rubin (1985). Constructing a control group using multi-variate matched sampling methods that incorporate the propensity score. AmericanStatistician 39, 33–38.
Roy, A. D. (1951). Some thoughts on the distribution of earnings. Oxford EconomicPapers 3, 135–146.
Rubin, D. B. (1974). Estimating causal effects of treatments in randomized and non-randomized studies. Journal of Educational Psychology 66, 688–701.
Rubin, D. B. (1980). Comment on ‘Randomization analysis of experimental data: theFisher randomization test’. Journal of the American Statistical Association 75, 591–593.
Seringhaus, R., and P. Rosson (1990). Government Export Promotion: A Global Perspec-tive. London: Routledge.
Seringhaus, R., and P. Rosson (2005). An analysis model of performance measurementof international trade fair exhibitors. Mimeo, Wilfred Laurier University, Waterloo,OT.
Smith, J. (2000). A critical survey of empirical methods for evaluating active labormarket policies. Zeitschrift für Volkswirtschaft and Statistik 136, 247–268.
Smith, J. A., and P. E. Todd (2005a). Does matching overcome Lalonde’s critique ofnonexperimental estimators? Journal of Econometrics 125, 305–353.
Smith, J. A., and P. E. Todd (2005b). Rejoinder. Journal of Econometrics 125, 365–375.Souchon, A., and A. Diamantopoulos (1998). Information utilisation by exporting
firms: conceptualisation, measurement and impact on export performance. In S.Urban and C. Nanopoulos (eds), Information Management. Wiesbaden: Gabler Ver-lag.
Spence, M. M. (2003). Evaluating export promotion programmes: UK overseas trademissions and export performance. Small Business Economics 20(1), 83–103.
Stigler, G. J. (1961). The economics of information. Journal of Political Economy 69,213–225.
72 Where to Spend the Next Million?
Storper, M., and A. Venables (2004). Buzz: face-to-face contact and the urban economy.Journal of Economic Geography 4, 351–370.
Suárez-Ortega, S. (2003), Export barriers: Insights from small and medium-sized firms.International Small Business Journal 21, 403–419.
Tanner, J. (1995). Curriculum guide to trade show marketing. Center for ExhibitionIndustry Research, Baylor University, Waco, TX.
Volpe Martincus, C. (2010). Odyssey in international markets: an assessment of theeffectiveness of export promotion in Latin America and the Caribbean. SpecialReport on Integration and Trade. Inter-American Development Bank, Washington,DC.
Volpe Martincus, C., and J. Carballo (2008). Is export promotion effective in developingcountries? Firm-level evidence on the intensive and extensive margins of exports.Journal of International Economics 76, 89–106. (See also IDB Working Paper 201.)
Volpe Martincus, C., and J. Carballo (2009). Survival of new exporters in developingcountries: does it matter how they diversify? IDB Working Paper 140.
Volpe Martincus, C., and J. Carballo (2010a). Entering new country and product exportmarkets: does export promotion help? Review of World Economics 146, 437–467.(See also IDB Working Paper 203.)
Volpe Martincus, C., and J. Carballo (2010b). Beyond the average effects: the distribu-tional impacts of export promotion programs in developing countries. Journal ofDevelopment Economics 92, 201–214. (See also IDB Working Paper 204.)
Volpe Martincus, C., and J. Carballo (2010c). Export promotion: bundled services workbetter. The World Economy 33, 1718–1756. (See also IDB Working Paper 206.)
Volpe Martincus, C., and J. Carballo (2011). Export promotion activities in devel-oping countries: what kind of trade do they promote? Journal of InternationalTrade and Economic Development, http://www.informaworld.com/10.1080/09638199.2010.500741. (See also IDB Working Paper 202.)
Volpe Martincus, C., J. Carballo, and P. Garcia (2011). Public programs to promotefirms’ exports in developing countries: are there heterogeneous effects by sizecategories? Applied Economics, http://www.informaworld.com/10.1080/00036846.2010.508731. (See also IDB Working Paper 205.)
Wagner, J. (1995). Exports, firm size, and firm dynamics. Small Business Economics 7,29–39.
Wagner, J. (2001). A note on the firm size export relationship. Small Business Economics17, 229–237.
Wagner, J. (2007). Exports and productivity: a survey of the evidence from firm-leveldata. The World Economy 30, 60–82.
Westphal, L. E. (1990). Industrial policy in an export propelled economy: lessons fromSouth Korea’s experience. Journal of Economic Perspectives 4, 41–59.
Young, S. (1995). Export marketing: conceptual and empirical developments. EuropeanJournal of Marketing, 29(8), 7–16.
Assessing the Impact of Trade Promotion in Latin America 73
APPENDIX: EMPIRICAL METHODOLOGY
In this appendix we briefly explain the main estimation methods used to gen-erate the estimates reported in the chapter.46 Let Yit be (the natural logarithmof) firm i’s total exports in year t.47 Each year firm i may either participate inexport promotion programmes (‘1’) or not participate in these programmes(‘0’), but not both. Hence, firm i has two potential export outcomes, Y 1
it and Y 0it ,
which correspond to the participation and non-participation states, respec-tively. Further, let Dit be an indicator codifying information on assistance bythe export promotion organisation. Specifically, Dit takes the value 1 if firm ihas been assisted by the organisation in year t and 0 otherwise.48 In this case,firm i’s observed export outcome can be expressed as follows:49
Yit = DitY 1it + (1−Dit)Y 0
it (2.1)
and the impact of trade support is therefore given by ∆Yit = Y 1it − Y 0
it . Thefundamental problem of causal inference is that it is impossible to observeY 1it and Y 0
it for the same firm. Hence, the population of companies is generallyused to learn about the properties of the potential outcomes and computean average treatment effect. More specifically, when participation in the pro-grammes under consideration is voluntary, it seems more relevant to deter-mine their effects on those firms that participated and accordingly an averagetreatment effect on the treated is estimated:
γ = E(Y 1it | Dit = 1)− E(Y 0
it | Dit = 1) = E(∆Yit | Dit = 1), (2.2)
where E(Y 1it | Xit,Dit = 1) is the expected (average) exports of those firms
that have received export support and E(Y 0it | Xit,Dit = 1) are the expected
exports of these firms had they not been received this support. The parameterγ then measures the average rate of change in exports between these tradesupport statuses (Lach 2002).
Difference-in-differences and matching difference-in-differences are alterna-tive methods for generating an appropriate sample counterpart for the miss-ing information on outcomes had the firms not been assisted, and thereby to
46An explanation of the methods used in robust check exercises such as the dynamicpanel data estimator proposed by Blundell and Bond (1998) or double-robust estimation(see, for example, Robins and Rotznisky 1995; Imbens 2004; Imbens and Wooldridge 2008;Chen et al 2009) can be found in the respective background technical papers (see http://hqdni09/research/book_detail.cfm?lang=en&pub_id=B-648).
47The use of the (natural) logarithm is partially motivated by the scale problem origi-nating in the fact that our binary variable D does not capture the size of the assistance(Lach 2002). The presentation hereafter focuses on firms’ total exports, but mutatis mutan-dis also applies to measures of export performance along the extensive margin and theintensive margin.
48We use the terms assistance, support, participation and treatment interchangeably.49This is the potential outcomes framework due to, among others, Fisher (1935), Roy
(1951) and Rubin (1974).
74 Where to Spend the Next Million?
compute the effect of this assistance. Both procedures rely for identificationon the assumption that there are no time-varying unobserved effects influenc-ing selection into trade promotion programmes and exports (see, for example,Blundell and Costa Dias 2002).
Difference-in-Differences
In general, in order to calculate standard errors, a regression approach isused (Ravallion 2008). Thus, assuming that the conditional expectation func-tion E(Y | X,D) is linear and that unobserved characteristics, µit , can bedecomposed into
• a firm-specific fixed-effect, λi,• a year, common macroeconomic effect, ρt and
• a temporary firm-specific effect, εit ,
leads to the following error-components specification:
Yit = Xitθ + γDit + λi + ρt + εit. (2.3)
This equation is estimated on the whole sample and, to create a commonbefore-treatment period, on the subsamples formed by those firms that werenever previously treated (thus yielding the effect of the first assistance) orthose that were not assisted in the previous period (Lach 2002). Further, esti-mation of Equation (2.3) can potentially be affected by severe serial correlationproblems (Bertrand et al 2004). Standard errors are then estimated allowingfor an unrestricted covariance structure over time within firms, which maydiffer across them (Bertrand et al 2004).
A common treatment-effect (ie γ = γi for all i) assumption underlies Equa-tion (2.3). However, effects can vary across groups of firms. More formally,they are likely to be heterogeneous by observed covariates. Under heterogene-ity, the correct specification of the estimating equation would be (Djebbari andSmith 2008)
Yit = Xitθ + (γ + γXXit)Dit + λi + ρt + εit. (2.4)
Further, Equation (2.3) assumes linearity. This may lead to inconsistencyas a consequence of potential misspecification (see, for example, Meyer 1995;Abadie 2005). Matching difference-in-differences does not impose this func-tional form restriction in estimating the conditional expectation of the out-come variable and therefore generate estimates that are robust to these poten-tial specification errors.
Matching Difference-in-Differences
Formally, the estimator is given by
γ̂MDID =∑
i∈{I1∩S∗}
{∆Yit −
∑j∈{I0∩S∗}
Wij∆Yjt}wij, (2.5)
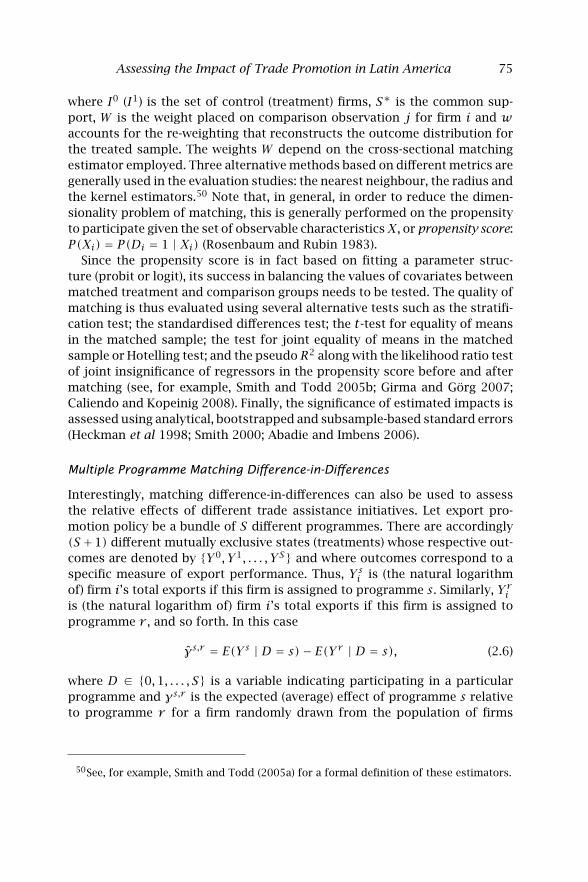
Assessing the Impact of Trade Promotion in Latin America 75
where I0 (I1) is the set of control (treatment) firms, S∗ is the common sup-port, W is the weight placed on comparison observation j for firm i and waccounts for the re-weighting that reconstructs the outcome distribution forthe treated sample. The weights W depend on the cross-sectional matchingestimator employed. Three alternative methods based on different metrics aregenerally used in the evaluation studies: the nearest neighbour, the radius andthe kernel estimators.50 Note that, in general, in order to reduce the dimen-sionality problem of matching, this is generally performed on the propensityto participate given the set of observable characteristicsX, or propensity score:P(Xi) = P(Di = 1 | Xi) (Rosenbaum and Rubin 1983).
Since the propensity score is in fact based on fitting a parameter struc-ture (probit or logit), its success in balancing the values of covariates betweenmatched treatment and comparison groups needs to be tested. The quality ofmatching is thus evaluated using several alternative tests such as the stratifi-cation test; the standardised differences test; the t-test for equality of meansin the matched sample; the test for joint equality of means in the matchedsample or Hotelling test; and the pseudoR2 along with the likelihood ratio testof joint insignificance of regressors in the propensity score before and aftermatching (see, for example, Smith and Todd 2005b; Girma and Görg 2007;Caliendo and Kopeinig 2008). Finally, the significance of estimated impacts isassessed using analytical, bootstrapped and subsample-based standard errors(Heckman et al 1998; Smith 2000; Abadie and Imbens 2006).
Multiple Programme Matching Difference-in-Differences
Interestingly, matching difference-in-differences can also be used to assessthe relative effects of different trade assistance initiatives. Let export pro-motion policy be a bundle of S different programmes. There are accordingly(S +1) different mutually exclusive states (treatments) whose respective out-comes are denoted by {Y 0, Y 1, . . . , Y S} and where outcomes correspond to aspecific measure of export performance. Thus, Ysi is (the natural logarithmof) firm i’s total exports if this firm is assigned to programme s. Similarly, Yriis (the natural logarithm of) firm i’s total exports if this firm is assigned toprogramme r , and so forth. In this case
γ̂s,r = E(Y s | D = s)− E(Yr | D = s), (2.6)
where D ∈ {0,1, . . . , S} is a variable indicating participating in a particularprogramme and γs,r is the expected (average) effect of programme s relativeto programme r for a firm randomly drawn from the population of firms
50See, for example, Smith and Todd (2005a) for a formal definition of these estimators.
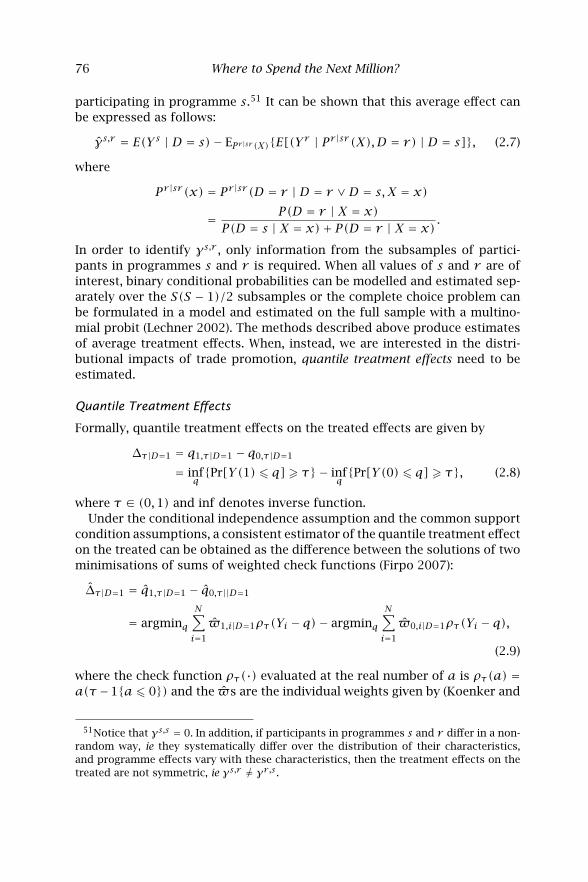
76 Where to Spend the Next Million?
participating in programme s.51 It can be shown that this average effect canbe expressed as follows:
γ̂s,r = E(Y s | D = s)− EPr |sr (X){E[(Y r | Pr |sr (X),D = r) | D = s]}, (2.7)
where
Pr |sr (x) = Pr |sr (D = r | D = r ∨D = s,X = x)
= P(D = r | X = x)P(D = s | X = x)+ P(D = r | X = x) .
In order to identify γs,r , only information from the subsamples of partici-pants in programmes s and r is required. When all values of s and r are ofinterest, binary conditional probabilities can be modelled and estimated sep-arately over the S(S − 1)/2 subsamples or the complete choice problem canbe formulated in a model and estimated on the full sample with a multino-mial probit (Lechner 2002). The methods described above produce estimatesof average treatment effects. When, instead, we are interested in the distri-butional impacts of trade promotion, quantile treatment effects need to beestimated.
Quantile Treatment Effects
Formally, quantile treatment effects on the treated effects are given by
∆τ|D=1 = q1,τ|D=1 − q0,τ|D=1
= infq{Pr[Y(1) � q] � τ} − inf
q{Pr[Y(0) � q] � τ}, (2.8)
where τ ∈ (0,1) and inf denotes inverse function.Under the conditional independence assumption and the common support
condition assumptions, a consistent estimator of the quantile treatment effecton the treated can be obtained as the difference between the solutions of twominimisations of sums of weighted check functions (Firpo 2007):
∆̂τ|D=1 = q̂1,τ|D=1 − q̂0,τ||D=1
= argminq
N∑i=1
�̂1,i|D=1ρτ(Yi − q)− argminq
N∑i=1
�̂0,i|D=1ρτ(Yi − q),
(2.9)
where the check function ρτ(·) evaluated at the real number of a is ρτ(a) =a(τ−1{a � 0}) and the �̂s are the individual weights given by (Koenker and
51Notice that γs,s = 0. In addition, if participants in programmes s and r differ in a non-random way, ie they systematically differ over the distribution of their characteristics,and programme effects vary with these characteristics, then the treatment effects on thetreated are not symmetric, ie γs,r �= γr,s .
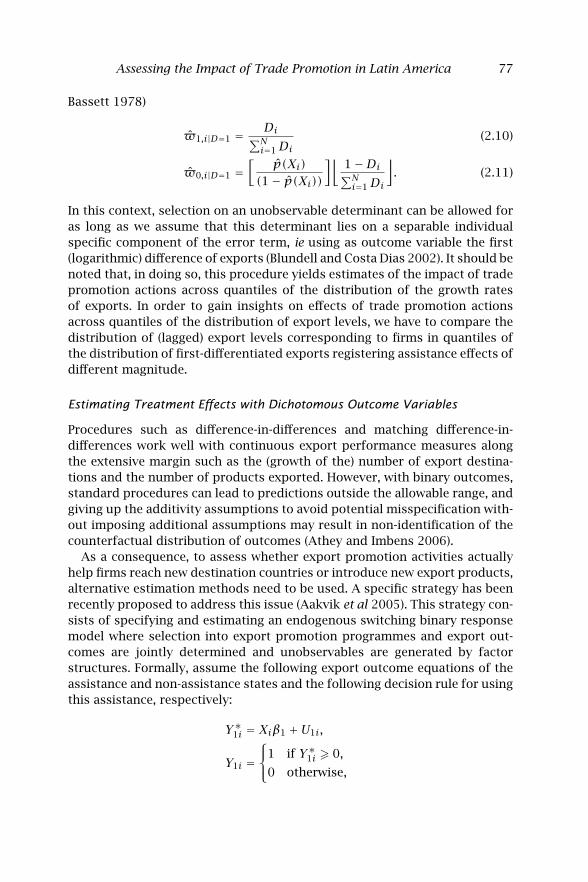
Assessing the Impact of Trade Promotion in Latin America 77
Bassett 1978)
�̂1,i|D=1 = Di∑Ni=1Di
(2.10)
�̂0,i|D=1 =[
p̂(Xi)(1− p̂(Xi))
]⌊1−Di∑Ni=1Di
⌋. (2.11)
In this context, selection on an unobservable determinant can be allowed foras long as we assume that this determinant lies on a separable individualspecific component of the error term, ie using as outcome variable the first(logarithmic) difference of exports (Blundell and Costa Dias 2002). It should benoted that, in doing so, this procedure yields estimates of the impact of tradepromotion actions across quantiles of the distribution of the growth ratesof exports. In order to gain insights on effects of trade promotion actionsacross quantiles of the distribution of export levels, we have to compare thedistribution of (lagged) export levels corresponding to firms in quantiles ofthe distribution of first-differentiated exports registering assistance effects ofdifferent magnitude.
Estimating Treatment Effects with Dichotomous Outcome Variables
Procedures such as difference-in-differences and matching difference-in-differences work well with continuous export performance measures alongthe extensive margin such as the (growth of the) number of export destina-tions and the number of products exported. However, with binary outcomes,standard procedures can lead to predictions outside the allowable range, andgiving up the additivity assumptions to avoid potential misspecification with-out imposing additional assumptions may result in non-identification of thecounterfactual distribution of outcomes (Athey and Imbens 2006).
As a consequence, to assess whether export promotion activities actuallyhelp firms reach new destination countries or introduce new export products,alternative estimation methods need to be used. A specific strategy has beenrecently proposed to address this issue (Aakvik et al 2005). This strategy con-sists of specifying and estimating an endogenous switching binary responsemodel where selection into export promotion programmes and export out-comes are jointly determined and unobservables are generated by factorstructures. Formally, assume the following export outcome equations of theassistance and non-assistance states and the following decision rule for usingthis assistance, respectively:
Y∗1i = Xiβ1 +U1i,
Y1i =⎧⎨⎩
1 if Y∗1i � 0,0 otherwise,
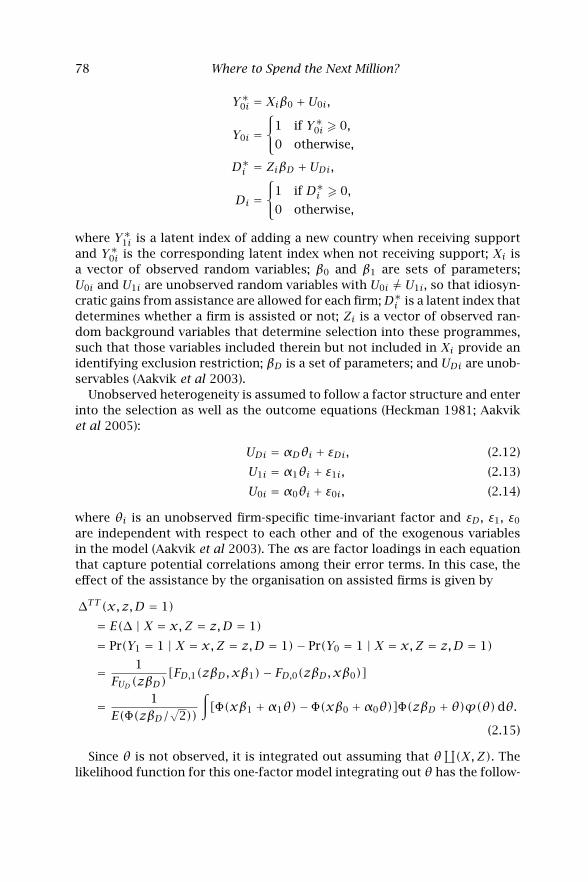
78 Where to Spend the Next Million?
Y∗0i = Xiβ0 +U0i,
Y0i =⎧⎨⎩
1 if Y∗0i � 0,0 otherwise,
D∗i = ZiβD +UDi,
Di =⎧⎨⎩
1 if D∗i � 0,0 otherwise,
where Y∗1i is a latent index of adding a new country when receiving supportand Y∗0i is the corresponding latent index when not receiving support; Xi isa vector of observed random variables; β0 and β1 are sets of parameters;U0i and U1i are unobserved random variables with U0i �= U1i, so that idiosyn-cratic gains from assistance are allowed for each firm;D∗i is a latent index thatdetermines whether a firm is assisted or not; Zi is a vector of observed ran-dom background variables that determine selection into these programmes,such that those variables included therein but not included in Xi provide anidentifying exclusion restriction; βD is a set of parameters; and UDi are unob-servables (Aakvik et al 2003).
Unobserved heterogeneity is assumed to follow a factor structure and enterinto the selection as well as the outcome equations (Heckman 1981; Aakviket al 2005):
UDi = αDθi + εDi, (2.12)
U1i = α1θi + ε1i, (2.13)
U0i = α0θi + ε0i, (2.14)
where θi is an unobserved firm-specific time-invariant factor and εD , ε1, ε0
are independent with respect to each other and of the exogenous variablesin the model (Aakvik et al 2003). The αs are factor loadings in each equationthat capture potential correlations among their error terms. In this case, theeffect of the assistance by the organisation on assisted firms is given by
∆TT (x, z,D = 1)= E(∆ | X = x,Z = z,D = 1)= Pr(Y1 = 1 | X = x,Z = z,D = 1)− Pr(Y0 = 1 | X = x,Z = z,D = 1)
= 1FUD(zβD)
[FD,1(zβD,xβ1)− FD,0(zβD,xβ0)]
= 1
E(Φ(zβD/√
2))
∫[Φ(xβ1 +α1θ)− Φ(xβ0 +α0θ)]Φ(zβD + θ)ϕ(θ)dθ.
(2.15)
Since θ is not observed, it is integrated out assuming that θ∐(X,Z). The
likelihood function for this one-factor model integrating out θ has the follow-
Assessing the Impact of Trade Promotion in Latin America 79
ing form:
L =N∏i=1
∫Pr(Di, Yi | Xi, Zi, θ)ϕ(θ)dϕ,
where Pr(Di, Yi | Xi, Zi, θi) = Pr(Di | Zi, θi)Pr(Yi | Di,Xi, θi). This function’sparameters can be estimated by maximum likelihood and the significance ofthe implied export support effect can be assessed based on bootstrappedstandard errors.

3
Can Matching Grants Promote Exports?Evidence from Tunisia’s FAMEX II
Programme
JULIEN GOURDON, JEAN MICHEL MARCHAT, SIDDHARTH SHARMAAND TARA VISHWANATH1
1 INTRODUCTION
A number of recent firm-level studies suggest that government export pro-motion activities, typically implemented through export promotion agen-cies, can have a positive impact on export performance (see, for example,Álvarez and Crespi 2000, 2004; Volpe Martincus and Carballo 2008; Görg etal 2009). National export promotion agencies have been part of most coun-tries’ national export strategy for a long time. While several past studies criti-cised their efficiency in developing countries, recent research (Lederman et al2010) suggests that, despite heterogeneity across regions, levels of develop-ment and types of instruments proposed, they have—on average—an impor-tant and statistically significant impact on exports. These findings are broadlyconsistent with the common view that firms need assistance in reaching newexport markets because of high information-related entry costs.
However, much remains to be learned about the effectiveness of specificexport promotion instruments used by these agencies (Lederman et al 2010).Most export promotion agencies employ a wide array of instruments, rangingfrom the provision of public goods, such as export markets’ analysis, to tech-nical and financial assistance to individual firms. Participating firms are oftenassisted through multiple instruments, which cannot be disentangled in theavailable data. As a result, we know little about their relative effectiveness.
A recent study of Peru’s national export promotion agency by Volpe Mart-incus and Carballo (2008) finds evidence that firms supported by its activities
1We are grateful Ana M. Fernandes and to the participants at the December 2010 work-shop on ‘Impact Evaluation of Trade Interventions: Paving the Way’ in Washington, DC, forcomments. This study was supported by the Middle East and North Africa Region ImpactEvaluation Initiative of the World Bank.
82 Where to Spend the Next Million?
exhibit significantly better export performance than comparable unsupportedfirms. But, like most such agencies, Peru’s agency uses multiple instruments:it trains inexperienced exporters on the export process, marketing and negoti-ations; it produces markets’ analysis; it provides information on trade oppor-tunities as well as specialised counselling and technical assistance on how totake advantage of these opportunities; it coordinates and supports (and insome cases co-finances) firms’ participation in international trade missionsand trade shows; and it arranges meetings with potential foreign buyers. Inthe absence of data on the types of support received by individual firms, onlythe combined impact of this heterogeneous bundle of promotional activitiescould be measured. Another recent study, on US manufacturing plants byBernard and Jensen (2004), measures the impact of state export promotionexpenditures, but also lacks information on the exact instruments funded bythose expenditures. While they are informative for gauging the usefulness ofinformation-related support activities, the policy recommendations emergingfrom such studies can suffer from a lack of specificity.
In this chapter, we describe the results from an evaluation of a specific typeof export promotion instrument: a matching grant. Starting in 2005, Tunisia’sexport promotion agency provided—through the FAMEX II—more than 1,000firms with export-development assistance on a cost-sharing basis. Under theterms of this programme, the agency would meet 50% of the cost of export-development plans proposed by eligible firms approved for funding after acommittee review.2 We examine the impact of this FAMEX II programme usingfirm-level data collected through a purposely designed survey. The evaluationof the impact of this matching grant was conducted on the suggestion ofWorld Bank colleagues who needed to draw lessons from FAMEX II for thepreparation of a new export-development programme for Tunisia.
To be eligible for a FAMEX II grant, firms proposed export-developmentplans had to specify whether the set of activities aimed at developing newexport products, new export markets and/or export skills in the case offirst-time exporters. Broadly speaking, eligible activities were those whichaddressed informational constraints to entering export markets, such as mar-ket research, training and consulting. Thus, FAMEX was more focused thangeneral-purpose grants for export-development investment, which includetechnology and physical capital investment such as those studied in Görget al (2008) for firms in Ireland. Yet, being a grant, it was also less restrictivethan programmes that directly provide services such as training: firms apply-ing to FAMEX II had some flexibility in defining their export-development plan.Thus, we could expect FAMEX II to have had very different impacts on firmsfrom the direct provision of consulting and other non-financial interventions,which have been the subject of most previous studies.
2FAMEX: Fonds d’Accès aux Marchés d’Exportation or ‘Export Market Access Fund’.
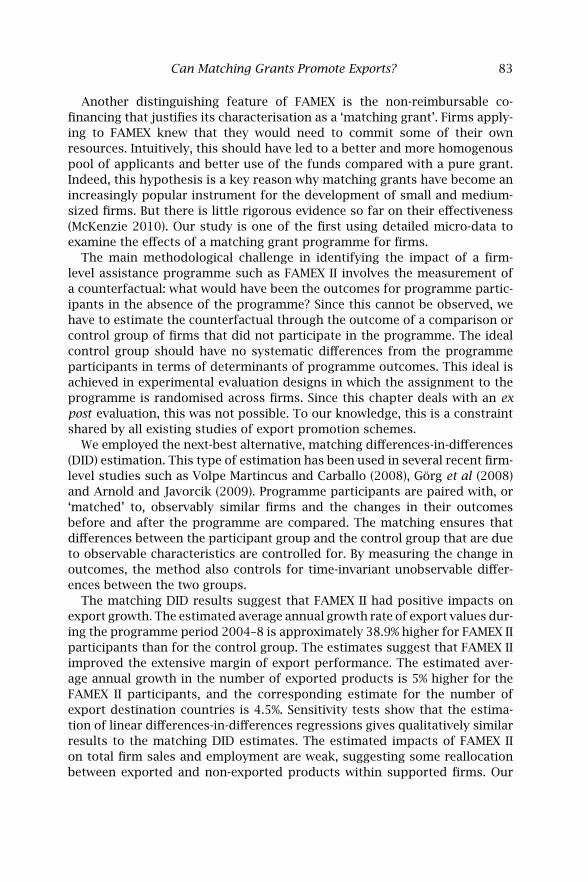
Can Matching Grants Promote Exports? 83
Another distinguishing feature of FAMEX is the non-reimbursable co-financing that justifies its characterisation as a ‘matching grant’. Firms apply-ing to FAMEX knew that they would need to commit some of their ownresources. Intuitively, this should have led to a better and more homogenouspool of applicants and better use of the funds compared with a pure grant.Indeed, this hypothesis is a key reason why matching grants have become anincreasingly popular instrument for the development of small and medium-sized firms. But there is little rigorous evidence so far on their effectiveness(McKenzie 2010). Our study is one of the first using detailed micro-data toexamine the effects of a matching grant programme for firms.
The main methodological challenge in identifying the impact of a firm-level assistance programme such as FAMEX II involves the measurement ofa counterfactual: what would have been the outcomes for programme partic-ipants in the absence of the programme? Since this cannot be observed, wehave to estimate the counterfactual through the outcome of a comparison orcontrol group of firms that did not participate in the programme. The idealcontrol group should have no systematic differences from the programmeparticipants in terms of determinants of programme outcomes. This ideal isachieved in experimental evaluation designs in which the assignment to theprogramme is randomised across firms. Since this chapter deals with an expost evaluation, this was not possible. To our knowledge, this is a constraintshared by all existing studies of export promotion schemes.
We employed the next-best alternative, matching differences-in-differences(DID) estimation. This type of estimation has been used in several recent firm-level studies such as Volpe Martincus and Carballo (2008), Görg et al (2008)and Arnold and Javorcik (2009). Programme participants are paired with, or‘matched’ to, observably similar firms and the changes in their outcomesbefore and after the programme are compared. The matching ensures thatdifferences between the participant group and the control group that are dueto observable characteristics are controlled for. By measuring the change inoutcomes, the method also controls for time-invariant unobservable differ-ences between the two groups.
The matching DID results suggest that FAMEX II had positive impacts onexport growth. The estimated average annual growth rate of export values dur-ing the programme period 2004–8 is approximately 38.9% higher for FAMEX IIparticipants than for the control group. The estimates suggest that FAMEX IIimproved the extensive margin of export performance. The estimated aver-age annual growth in the number of exported products is 5% higher for theFAMEX II participants, and the corresponding estimate for the number ofexport destination countries is 4.5%. Sensitivity tests show that the estima-tion of linear differences-in-differences regressions gives qualitatively similarresults to the matching DID estimates. The estimated impacts of FAMEX IIon total firm sales and employment are weak, suggesting some reallocationbetween exported and non-exported products within supported firms. Our
84 Where to Spend the Next Million?
data do not, unfortunately, allow us to examine if this was accompanied byincreased profits.
Our analysis produces two novel and interesting findings. First, estimatesshow that FAMEX II had a disproportionate impact on first-time exporters,ie firms that started exporting after receiving FAMEX II assistance. Second, ourestimates show that export promotion grants can be effective in promotingexports by services firms. The inclusion of services firms in the analysis isa novel contribution of our study. Together, these findings suggest that theinformational costs of reaching new export markets are higher for servicesfirms and for first-time exporters.
Interestingly, the estimates of the impact of FAMEX II on export growth arehigher than those reported in previous studies of export promotion agencies.This could be because FAMEX was a matching grant, whereas most previousstudies examined programmes that provided a mix of largely non-financialsupport, such as consulting, and a relatively limited grant element, such asfunding for foreign trips. The cost-sharing element might have led to a self-selection of better-performing firms into the programme. Another possibilityis that the FAMEX II programme spent more per recipient than other pro-grammes: the grant could go up to US$100,000 per firm, and the averagesize of the grants actually disbursed was US$70,000. Lacking similar detailson the programmes examined in previous studies, it is impossible to pursuethis argument in depth. At the very least, this finding underscores the needto focus more on the specifics of export promotion instruments in futurestudies.
We would like to emphasise the methodological challenges faced in thisand similar studies, in the hope that it will lead to more serious considera-tion of ex ante evaluation design of trade-related programmes and policies.Some of the key information, such as initial sales and employment, was drawnfrom retrospective data collection and suffered from some non-response andpotential recall bias. Moreover, as explained in greater detail in Section 3,ex post evaluation techniques cannot eliminate bias arising from differencesin the distribution of time-varying unobservable across the participants andthe control group. To give an example of a potential overestimation bias, itcould be that the programme selected firms that would have done better thanothers even without the matching grant (even after conditioning on observ-ables). While we know that there was an application review process, we canonly control for observable rejection crudely. A contrasting possibility is thatthe programme selected those firms most ‘in need’ of support, in which casewe might have underestimated the impact. Yet another concern is that theprogramme could have had spillover effects; indeed, informational spilloversacross exporter have long been theorised about and empirically tested for, andare a key economic justification for subsidies to exporters (see, for example,Krugman 1992; Roberts and Tybout 1997). However, lacking external infor-
Can Matching Grants Promote Exports? 85
mation on the nature of spillovers in our sample, we are uncertain of whatthey imply for our differences-in-differences estimates.3
The rest of this chapter is organised as follows. In Section 2 we describeTunisia’s export promotion scheme. The methodology is described in Sec-tion 3. In Section 4 we describe the survey data, while in Section 5 we presentthe main results. Section 6 concludes.
2 TUNISIA’S EXPORT PROMOTION MATCHING GRANT SCHEME
Matching grants (MGs) are a short-term and temporary mechanism that par-tially finance activities to promote improvements in the private sector. Overthe years, MGs have become a common tool in private sector development(PSD) projects. Since 1994, the World Bank has financed a total of 37 projectswith MG components, of which 22 were still active in 2008 (World Bank 2009).
Despite being commonly used, matching grants face criticisms. These focuson ‘additionality’ (funding activities that firms would have financed anyway)and ‘selectivity’ (failure to establish a distinction between private benefitsand broader economic benefits) issues (Biggs 1999), or the sustainability ofthe support (Phillips 2001).
Although there have been assessments of MGs, there have been fewattempts to assess the instrument with recent impact-evaluation (IE) tech-niques, or, for that matter, many PSD types of interventions. This is changing(McKenzie 2010) as demonstrated by a recent wave of IEs in PSD areas suchas SME support programmes (Tang 2009), rainfall insurance (Giné and Yang2009) and regulatory reforms (Bruhn 2008).
Since 2000, two export development projects have been implemented inTunisia. In addition to activities in the area of trade facilitation and the estab-lishment of a pre-shipment export guarantee facility, both projects imple-mented a matching grant scheme. The FAMEX II programme was jointlyfinanced by the Tunisian government and by the World Bank within the frame-work of the Second Export Development Project (2005–11).4 FAMEX II hadthree components:
• building the capacity of export associations and chambers of commerceto provide export assistance to their members (mainly SMEs);
• strengthening the export consulting sector;
• assisting individual enterprises through matching grants.
This study is focused on the firm-level intervention component of the pro-gramme, FAMEX II.
3One concern is that there may have been spillovers from participants to control firms,which would attenuate the estimated impacts.
4Tunisia’s first export market access fund (FAMEX I) operated between 2000 and 2004.
86 Where to Spend the Next Million?
FAMEX II began in 2005 and provided firms with export-marketing assis-tance on a cost-sharing basis. The stated objective of the export-marketingassistance was to help firms start exporting if they had little or no exportexperience, and either diversify their markets or develop new products if theydid have export experience. The instrument was a non-reimbursable matchinggrant covering 50% of expenditures, up to a maximum of US$100,000 per firm,awarded to selected firms for eligible activities undertaken within the frame-work of an export-development plan. The cost-sharing design was intended tohelp ensure sound project design and implementation and reduce the likeli-hood of misallocation of funds. It was expected that the commitment of firmsto their projects would be significantly increased because of the cost-sharingnature of FAMEX II.
In order to receive a FAMEX II matching grant, interested firms had toprepare an export-development plan specifying a set of activities focusedon developing new export products, new export markets and/or first-timeexporting. Applicants had to demonstrate that they had given serious con-sideration to the feasibility of the proposed activities. The export plan wasassessed by a review committee composed of senior experts from the man-agement team, and the review process included detailed interviews with theapplicants. Upon receiving approval for a grant, firms were required to sign aletter of agreement binding them to present defined deliverables for evalua-tion by the management team. FAMEX II management also helped successfulapplicants refine their export plan, and facilitated technical assistance andtraining during the implementation of the export plan.
Firms had to be larger than a specified size to be eligible for the grant. Theminimum thresholds for eligibility were about US$140,000 and US$70,000 insales, respectively, for manufacturing and services firms. Data from the offi-cial registry of firms in Tunisia indicate that, as of 2004, nearly 6,000 man-ufacturing and 20,000 services firms (out of a total of 60,000 and 436,000,respectively) were eligible to apply to FAMEX II. By December 2009, 1,710applications were submitted to FAMEX II, representing nearly 7% of all eligi-ble firms. Perhaps not surprisingly, services firms were significantly less likelyto express interest in exporting than manufacturing firms: fewer than 3% ofeligible services firms applied to FAMEX II. Moreover, firms that were alreadyexporting were more likely to apply: of the 2000 eligible manufacturing firmsthat were already exporting in 2004, about 20% applied to FAMEX II. By Decem-ber 2009, 1,231 applications (72% of all applicants) had been accepted into theprogramme.
We consider 2008 as the last year of the analysis, given that the surveydata collection began in 2009 at a time when the accounting information forthat year was not yet available. Moreover, in view of the extraordinary circum-stances following the 2009 downturn, it seems appropriate to take 2008 to bethe last year of our study. Hence, we focus on firms that had applied and com-pleted their FAMEX II-funded programme by 2008. Hence, we exclude from the
Can Matching Grants Promote Exports? 87
analysis 429 of the successful applicants who, as of 2008, were still in the mid-dle of their proposed export plan (largely because they had applied towardsthe end of the sample period). We also exclude from the main analysis somesuccessful applicants who dropped out of the FAMEX II programme withoutdisbursement (‘drop-outs’), either because they were deemed by the man-agement to make insufficient progress, or because they voluntarily changedtheir plans.5 Thus, the universe of FAMEX II ‘treated’ firms for the empiri-cal approach based on survey data—including firms which received the grantand firms whose proposed export plan was deemed to have been completedby 2008—consists of 336 firms.
3 EMPIRICAL STRATEGY
We evaluate the impact of FAMEX II by comparing outcomes before and afterthe programme across Tunisian firms that receive this matching grant support(the ‘treatment’ group) and firms that are similar but did not receive the grant(the ‘control’ group). Ideally, these groups should have been ‘identical’ at thestart of the programme, in the sense that outcomes were expected to be sameacross the treatment and control groups in the absence of the grant.
Formally, letDi be an indicator for a firm i receiving the treatment (FAMEX IIsupport). That is, Di = 1 if firm i received support and Di = 0 otherwise. LetY 1i be an outcome of interest (eg total exports) for firm i in period t. LetY 0i be defined as the outcome for firm i had it not received FAMEX support.
We are interested in estimating the difference between the expected (average)outcome for treated firms (Di = 1) when they received FAMEX support andtheir expected outcome in the absence of treatment:6
µ = E(Y 1i | Di = 1)− E(Y 0
i | Di = 1)
Since E(Y 0i | Di = 1) is not observed, the treatment effect is identified through
E(Y 0i | Di = 0), the observed average outcome of firms which did not get
treated. The best-case scenario is one where the outcome without treatmentcan be assumed to be on average unrelated to assignment to treatment. Thatis, E(Y 0
i | Di = 0) = E(Y 0i | Di = 1). This is ensured if assignment to treatment
is random.This best-case scenario is ruled out in our case, as acceptance into FAMEX
was not random: the most promising applicants were systematically morelikely to have been accepted by the senior expert team managing the matchinggrant. In this context, we have to use non-experimental (or ex post ) evaluationtechniques. Such techniques essentially require the identification of a control
5However, these ‘drop-outs’ will be considered as part of the treatment group in somerobustness checks shown in Section 5.
6In the literature, this is known as the average effect of treatment on the treated (ATT).
88 Where to Spend the Next Million?
group that is ‘similar’ to the treatment group, and then compare the treat-ment and control groups after controlling for differences along observabledimensions (such as size, age, sector and the prior exporting status of firms).Implicit behind this approach is the assumption that, once these observablesare controlled for, all of the difference in outcomes across these two groupsof firms is due to their different FAMEX statuses. Formally, we aim to estimate
γ = E(Y 1i | Xi,Di = 1)− E(Y 0
i | Xi,Di = 0),
whereXi is a set of observable firm characteristics. The identification assump-tion is that E(Y 0
i | Xi,Di = 0) = E(Y 0i | Xi,Di = 1).
We implement this evaluation approach using matching combined withdifferences-in-differences estimation, a technique that has been used in anumber of recent firm-level studies (Volpe Martincus and Carballo 2008;Arnold and Javorcik 2009). The differences-in-differences estimation impliesthat we compare the change in outcomes before and after FAMEX II across thetreatment and the control groups. First-differencing, ie the consideration ofthe change in outcomes, accounts for unobserved fixed differences betweenthe two groups of firms. In our preferred strategy, treated firms are ‘matched’with control firms in order to balance the two groups on observable vari-ables. This is done though propensity score matching (PSM), which involvesmatching firms on the probability of treatment based on observables.7 Theunderlying assumption is that, conditional on the propensity score, there areno time-varying unobserved determinants of the outcome that differ system-atically across control firms and treatment firms.8
As a sensitivity check, we show that the results from linear-regression-based differences-in-differences estimation are similar to those from the PSMapproach. Specifically, we regress the change in outcome on observable base-line characteristics Xi and an indicator for treatment:
∆Yi = α+ βXi + γDi + ei.The treatment effect is given by γ. Note that fixed differences across treatmentand control groups are accounted for because the outcome is specified in
7Specifically, every treatment firm was compared with a weighted average of controlfirms: the higher the weights, the closer the control firm’s propensity scores to that of thetreatment firm in question.
8Rosenbaum and Rubin (1983) show that adjusting solely for differences betweentreated and control units in the propensity score removes all biases associated with differ-ences in observables (covariates). Heckman et al (1997) provide more evidence on matchingdifferences-in-differences estimators, decomposing the sources of bias using comparisonswith experimental estimates. Matching methods eliminate the estimation bias due to dif-ferent distributions of the propensity score across control and treatment groups, as wellas that due to non-overlapping supports of the distributions. However, the bias due todifferences in the distribution of time-varying unobservable is not eliminated.
Can Matching Grants Promote Exports? 89
differences. The assumption for unbiased estimation of the treatment effectis that the treatment assignment is uncorrelated with the error term ei.
We also considered using an alternative quasi-random evaluation tech-nique (regression discontinuity approach), but found it to be infeasible. Thisapproach would have involved comparing accepted firms with those that werejust below some threshold for acceptance, the assumption being that the lat-ter are a close approximation to the ideal control group. Regression disconti-nuity relies on being able to identify a sufficient number of ‘marginal’ appli-cants: those considered just good enough to receive the grant according tosome cut-off, with some not winning the grant due to limited funds. This wasnot possible in our case, since we had no objective rating of applications toFAMEX II that could provide for such threshold.9 Rejected applications werejudged by the FAMEX II the senior expert team to have a lower chance of suc-cess than accepted applications, but there is no information on how inferiorthey were judged to be. Moreover, there were too few rejected applications toyield a sufficient sample of marginal applicants.
It is important to note that our control group includes both rejectedapplicants and firms which have never applied to FAMEX II. Including non-applicants in the control group helps to control for time-varying unobserveddeterminants that are common to FAMEX II recipients and other firms (con-ditional on observables).
We could make a case for keeping only rejected applicants to FAMEX IIin the control group: they are more easily comparable with treated firms inthe sense that both groups expressed an interest in the programme and pre-pared an export-development plan for cost-sharing. But the fact that rejectedapplications were rated worse than successful applications suggests that therejected firms are likely to have had worse outcomes than the treated firmseven in the absence of FAMEX II. Thus, comparing the group of treated firmswith a control group including only rejected firms could overstate the impactof the FAMEX II programme. Nevertheless, we present in Section 5 results froma specification where treated firms are compared with rejected firms alone,with the caveat that this specification suffers from small sample size bias.
Including non-applicants to FAMEX II in the control group leads to anotherset of methodological questions, the crucial unknown being their reason fornot applying. If those firms did not apply due to lack of awareness about theprogramme, then there is no obvious bias in using them as the control group.But there are other potential explanations which, if true, could lead to biases inthe estimated effects of FAMEX II. First, some firms with export-developmentplans might not have applied to FAMEX II because they did not need the grantsince they faced no constraints in financing fully their plans (they were able to
9If applicants to FAMEX had been given objective scores and if a sufficient number ofapplicants had been rejected because they were rated just below the acceptance threshold,the regression discontinuity approach could have been followed.
90 Where to Spend the Next Million?
rely on retained earnings or bank credit, for example). Comparing the treatedfirms with such firms could underestimate the effect of the programme, sincesuch firms are likely to have done better than the treated firms in the absenceof the programme.
Second, some firms might not have applied because they had no interest indeveloping their exports. This could lead to an overestimation of the impactof the FAMEX II programme, since such firms would have experienced lowerexport growth than the treated firms even in the absence of the programme.Since the expected net bias is indeterminate, and since limiting the compari-son group to the rejected firms would not necessarily avoid biases, we decidedthat there was more to gain from including non-applicants in the controlgroup than not doing so. But the potential biases should be kept in mindwhen interpreting the results.
4 FIRM-LEVEL SURVEY DATA
We collected primary data on a sample of FAMEX II recipients and non-recipient firms through a firm-level survey conducted in 2009. This effortwas necessary, given that the FAMEX II programme was implemented withoutany baseline data collection on eligible Tunisian firms. Specifically, our sur-vey covered a sample of 420 firms allocated evenly between FAMEX recipients(treated firms) and non-recipients (the control group). In addition, the surveyalso covered random samples of 40 firms rejected by FAMEX and of 40 firmsthat dropped out of FAMEX, leading to a total sample size of 500 firms.
The analysis of prior data from Tunisia’s national statistical institute(L’Institut National de la Statistique (INS)) on formal sector firms indicatedthat, on average, FAMEX II recipients differed from other firms along observ-able dimensions. For example, FAMEX II recipients were more likely to beexporting before the programme and their distribution across industrial sec-tors was different. This implied that a random sample of non-recipient firmswould have differed systematically from a random sample of recipients.Hence, in order to improve the efficiency of our estimation, we attemptedto ‘balance’ the control and treatment samples ex ante in terms of observablecharacteristics. That is, we wanted to ensure that the control sample of non-recipients would look similar—in terms of the distribution of key observablecharacteristics—to a random draw of FAMEX II recipients. We implementedthis through stratified random sampling. The universe of non-recipient firmstaken from the INS 2007 census of firms was grouped into strata based onthree key observable characteristics: size, prior exporting status and sector.Every stratum was allocated a sample size proportional to the number ofFAMEX II recipients in the corresponding recipient stratum. These strata allo-cations were filled through random sampling within every stratum.
The firm-level survey collected data on export volumes, products and desti-nations, as well as sales and employment and other firm characteristics (age,
Can Matching Grants Promote Exports? 91
type of ownership, tenure of the firm manager) for two years: 2004 and 2008.Information on location and sector was also collected for each firm. In theabsence of baseline data, the survey had to rely on retrospective informationfor 2004. This contributed to a less than 100% response rate on some key ques-tions such as those on the number of employees and sales in 2004. Given thatthose retrospective variables were essential for estimating the propensity ofreceiving a FAMEX II grant, non-response reduced the usable data set to 435firms. While we have no reason to believe that the non-response to retrospec-tive information was systematically correlated with unobserved determinantsof export performance, we also cannot discard it as a potential source of bias.
After estimating the propensity scores that will be described in Section 5, inorder to better balance the treatment and control groups on observables wedropped from the sample the FAMEX firms whose observable characteristicswere too extreme and prevented them from being matched to any controlfirms (ie firms outside the region of common support in the propensity scorematching). This resulted in a final sample of 428 firms (195 FAMEX firms and202 untreated firms), for which we present descriptive statistics below.
The distributions of the treatment and control subsamples in terms of theirsector, location, employment and sales categories are presented in Table 3.6.By design, the stratified random sample should have resulted in a balancebetween the subsamples along the stratification variables. But, as describedabove, the final usable sample was a subset of the intended sample, and thisreduced the extent of balance ex post. Thus, while the sectoral distributions ofFAMEX II firms and control firms are shown to be quite similar, they exhibitsome minor differences, such as a lower representation of chemicals and ahigher representation of other services in the FAMEX II subsample. Approx-imately 29% and 19% of the FAMEX II and control subsamples, respectively,consist of services firms. Similarly, there are minor and non-systematic differ-ences across FAMEX II and control subsamples in terms of their distributionsacross sales and employment categories. Since location was not used for strat-ification, there is a larger difference in the distribution of firms by location:compared with the control group, FAMEX II firms are more concentrated inTunis and less so in the eastern region.
Table 3.7 presents the means of other characteristics for the two subsam-ples. On average, most characteristics, such as the year in which the firm wasset up, the years since the current owner has been managing the firm, thefraction of firms which started exporting over the sample period, the fractionof firms which export all their output, and the years of first export, are similaracross FAMEX II firms and control firms. However, the control group includesmore non-exporters than the treated group. Another difference concerns theshare of domestic capital versus foreign capital: FAMEX firms have less for-eign capital than control firms. This suggests one explanation for why firmsapproached FAMEX: they have less access to foreign sources of funds or toforeign networks which could help them exploit new export opportunities.
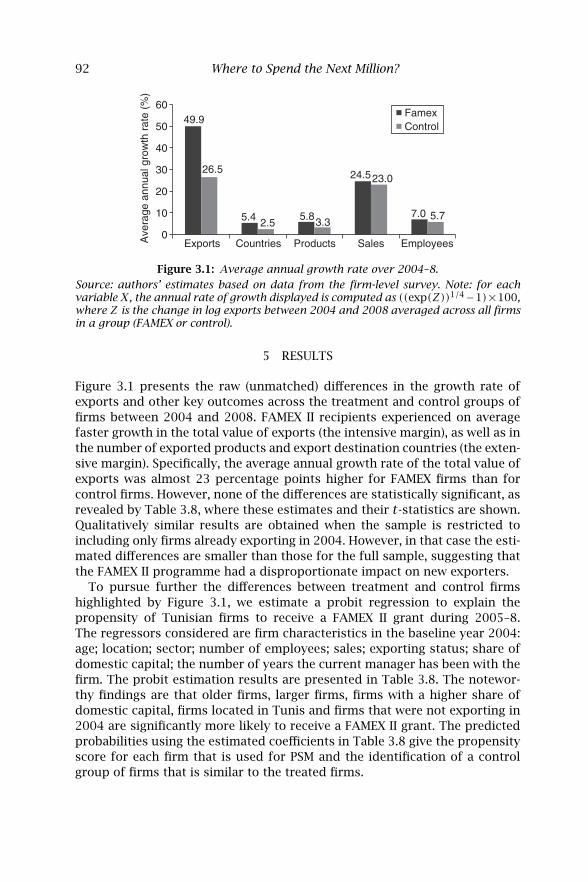
92 Where to Spend the Next Million?
10
0
20
30
40
50
6049.9
26.5 24.5
5.4 2.55.8 5.7
3.3
23.0
7.0
Exports Countries Products Sales Employees
FamexControl
Ave
rage
ann
ual g
row
th r
ate
(%)
Figure 3.1: Average annual growth rate over 2004–8.
Source: authors’ estimates based on data from the firm-level survey. Note: for eachvariable X, the annual rate of growth displayed is computed as ((exp(Z))1/4−1)×100,where Z is the change in log exports between 2004 and 2008 averaged across all firmsin a group (FAMEX or control).
5 RESULTS
Figure 3.1 presents the raw (unmatched) differences in the growth rate ofexports and other key outcomes across the treatment and control groups offirms between 2004 and 2008. FAMEX II recipients experienced on averagefaster growth in the total value of exports (the intensive margin), as well as inthe number of exported products and export destination countries (the exten-sive margin). Specifically, the average annual growth rate of the total value ofexports was almost 23 percentage points higher for FAMEX firms than forcontrol firms. However, none of the differences are statistically significant, asrevealed by Table 3.8, where these estimates and their t-statistics are shown.Qualitatively similar results are obtained when the sample is restricted toincluding only firms already exporting in 2004. However, in that case the esti-mated differences are smaller than those for the full sample, suggesting thatthe FAMEX II programme had a disproportionate impact on new exporters.
To pursue further the differences between treatment and control firmshighlighted by Figure 3.1, we estimate a probit regression to explain thepropensity of Tunisian firms to receive a FAMEX II grant during 2005–8.The regressors considered are firm characteristics in the baseline year 2004:age; location; sector; number of employees; sales; exporting status; share ofdomestic capital; the number of years the current manager has been with thefirm. The probit estimation results are presented in Table 3.8. The notewor-thy findings are that older firms, larger firms, firms with a higher share ofdomestic capital, firms located in Tunis and firms that were not exporting in2004 are significantly more likely to receive a FAMEX II grant. The predictedprobabilities using the estimated coefficients in Table 3.8 give the propensityscore for each firm that is used for PSM and the identification of a controlgroup of firms that is similar to the treated firms.
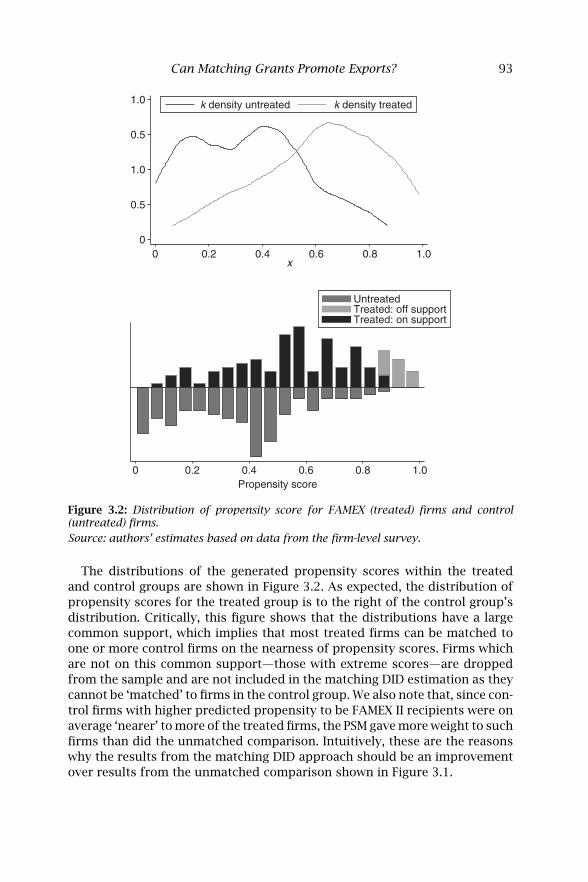
Can Matching Grants Promote Exports? 93
0.5
00
1.0
0.5
1.0 k density untreated k density treated
0.2 0.4 0.6 0.8 1.0x
0 0.2 0.4 0.6 0.8 1.0Propensity score
Untreated
Treated: on supportTreated: off support
Figure 3.2: Distribution of propensity score for FAMEX (treated) firms and control(untreated) firms.
Source: authors’ estimates based on data from the firm-level survey.
The distributions of the generated propensity scores within the treatedand control groups are shown in Figure 3.2. As expected, the distribution ofpropensity scores for the treated group is to the right of the control group’sdistribution. Critically, this figure shows that the distributions have a largecommon support, which implies that most treated firms can be matched toone or more control firms on the nearness of propensity scores. Firms whichare not on this common support—those with extreme scores—are droppedfrom the sample and are not included in the matching DID estimation as theycannot be ‘matched’ to firms in the control group. We also note that, since con-trol firms with higher predicted propensity to be FAMEX II recipients were onaverage ‘nearer’ to more of the treated firms, the PSM gave more weight to suchfirms than did the unmatched comparison. Intuitively, these are the reasonswhy the results from the matching DID approach should be an improvementover results from the unmatched comparison shown in Figure 3.1.
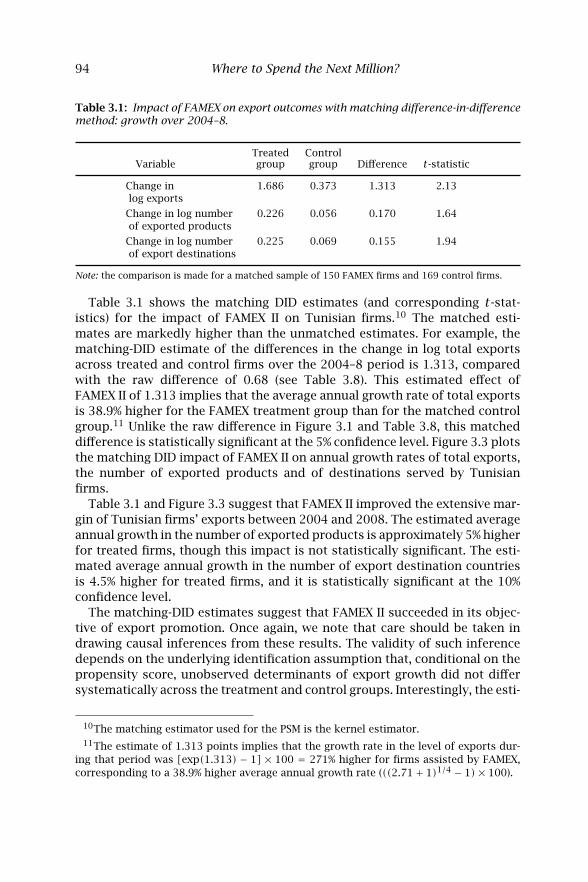
94 Where to Spend the Next Million?
Table 3.1: Impact of FAMEX on export outcomes with matching difference-in-differencemethod: growth over 2004–8.
Treated ControlVariable group group Difference t-statistic
Change in 1.686 0.373 1.313 2.13log exports
Change in log number 0.226 0.056 0.170 1.64of exported products
Change in log number 0.225 0.069 0.155 1.94of export destinations
Note: the comparison is made for a matched sample of 150 FAMEX firms and 169 control firms.
Table 3.1 shows the matching DID estimates (and corresponding t-stat-istics) for the impact of FAMEX II on Tunisian firms.10 The matched esti-mates are markedly higher than the unmatched estimates. For example, thematching-DID estimate of the differences in the change in log total exportsacross treated and control firms over the 2004–8 period is 1.313, comparedwith the raw difference of 0.68 (see Table 3.8). This estimated effect ofFAMEX II of 1.313 implies that the average annual growth rate of total exportsis 38.9% higher for the FAMEX treatment group than for the matched controlgroup.11 Unlike the raw difference in Figure 3.1 and Table 3.8, this matcheddifference is statistically significant at the 5% confidence level. Figure 3.3 plotsthe matching DID impact of FAMEX II on annual growth rates of total exports,the number of exported products and of destinations served by Tunisianfirms.
Table 3.1 and Figure 3.3 suggest that FAMEX II improved the extensive mar-gin of Tunisian firms’ exports between 2004 and 2008. The estimated averageannual growth in the number of exported products is approximately 5% higherfor treated firms, though this impact is not statistically significant. The esti-mated average annual growth in the number of export destination countriesis 4.5% higher for treated firms, and it is statistically significant at the 10%confidence level.
The matching-DID estimates suggest that FAMEX II succeeded in its objec-tive of export promotion. Once again, we note that care should be taken indrawing causal inferences from these results. The validity of such inferencedepends on the underlying identification assumption that, conditional on thepropensity score, unobserved determinants of export growth did not differsystematically across the treatment and control groups. Interestingly, the esti-
10The matching estimator used for the PSM is the kernel estimator.11The estimate of 1.313 points implies that the growth rate in the level of exports dur-
ing that period was [exp(1.313) − 1] × 100 = 271% higher for firms assisted by FAMEX,corresponding to a 38.9% higher average annual growth rate (((2.71+ 1)1/4 − 1)× 100).
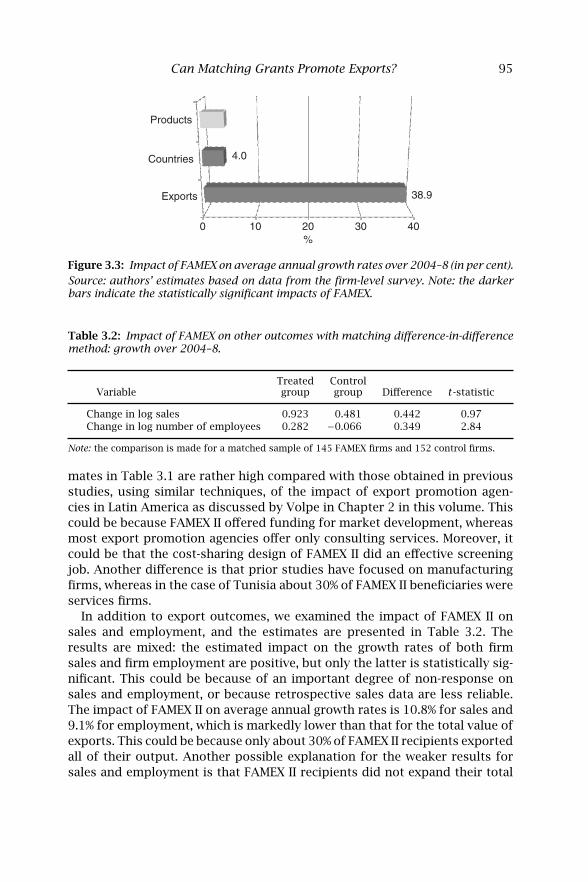
Can Matching Grants Promote Exports? 95
Products
Countries
Exports
4.0
38.9
100 30 4020%
Figure 3.3: Impact of FAMEX on average annual growth rates over 2004–8 (in per cent).
Source: authors’ estimates based on data from the firm-level survey. Note: the darkerbars indicate the statistically significant impacts of FAMEX.
Table 3.2: Impact of FAMEX on other outcomes with matching difference-in-differencemethod: growth over 2004–8.
Treated ControlVariable group group Difference t-statistic
Change in log sales 0.923 0.481 0.442 0.97Change in log number of employees 0.282 −0.066 0.349 2.84
Note: the comparison is made for a matched sample of 145 FAMEX firms and 152 control firms.
mates in Table 3.1 are rather high compared with those obtained in previousstudies, using similar techniques, of the impact of export promotion agen-cies in Latin America as discussed by Volpe in Chapter 2 in this volume. Thiscould be because FAMEX II offered funding for market development, whereasmost export promotion agencies offer only consulting services. Moreover, itcould be that the cost-sharing design of FAMEX II did an effective screeningjob. Another difference is that prior studies have focused on manufacturingfirms, whereas in the case of Tunisia about 30% of FAMEX II beneficiaries wereservices firms.
In addition to export outcomes, we examined the impact of FAMEX II onsales and employment, and the estimates are presented in Table 3.2. Theresults are mixed: the estimated impact on the growth rates of both firmsales and firm employment are positive, but only the latter is statistically sig-nificant. This could be because of an important degree of non-response onsales and employment, or because retrospective sales data are less reliable.The impact of FAMEX II on average annual growth rates is 10.8% for sales and9.1% for employment, which is markedly lower than that for the total value ofexports. This could be because only about 30% of FAMEX II recipients exportedall of their output. Another possible explanation for the weaker results forsales and employment is that FAMEX II recipients did not expand their total
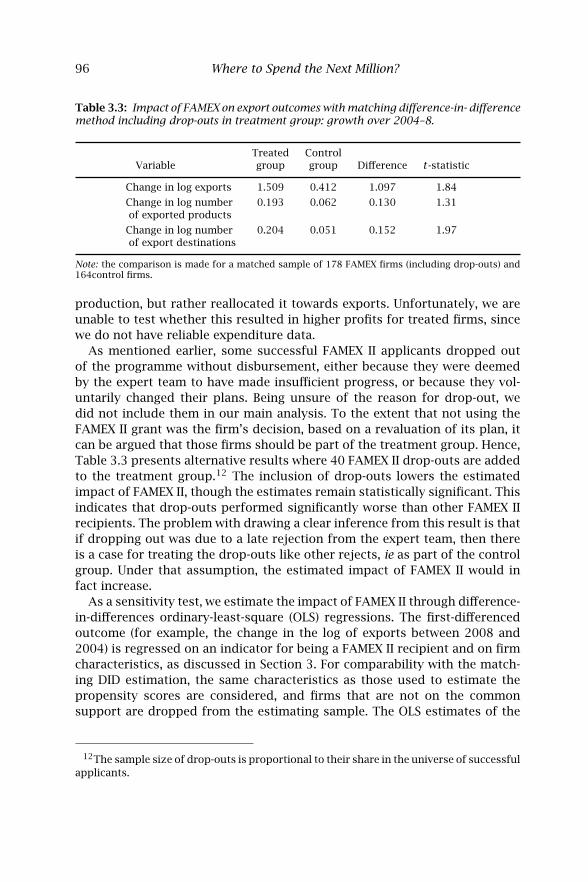
96 Where to Spend the Next Million?
Table 3.3: Impact of FAMEX on export outcomes with matching difference-in- differencemethod including drop-outs in treatment group: growth over 2004–8.
Treated ControlVariable group group Difference t-statistic
Change in log exports 1.509 0.412 1.097 1.84
Change in log number 0.193 0.062 0.130 1.31of exported products
Change in log number 0.204 0.051 0.152 1.97of export destinations
Note: the comparison is made for a matched sample of 178 FAMEX firms (including drop-outs) and164control firms.
production, but rather reallocated it towards exports. Unfortunately, we areunable to test whether this resulted in higher profits for treated firms, sincewe do not have reliable expenditure data.
As mentioned earlier, some successful FAMEX II applicants dropped outof the programme without disbursement, either because they were deemedby the expert team to have made insufficient progress, or because they vol-untarily changed their plans. Being unsure of the reason for drop-out, wedid not include them in our main analysis. To the extent that not using theFAMEX II grant was the firm’s decision, based on a revaluation of its plan, itcan be argued that those firms should be part of the treatment group. Hence,Table 3.3 presents alternative results where 40 FAMEX II drop-outs are addedto the treatment group.12 The inclusion of drop-outs lowers the estimatedimpact of FAMEX II, though the estimates remain statistically significant. Thisindicates that drop-outs performed significantly worse than other FAMEX IIrecipients. The problem with drawing a clear inference from this result is thatif dropping out was due to a late rejection from the expert team, then thereis a case for treating the drop-outs like other rejects, ie as part of the controlgroup. Under that assumption, the estimated impact of FAMEX II would infact increase.
As a sensitivity test, we estimate the impact of FAMEX II through difference-in-differences ordinary-least-square (OLS) regressions. The first-differencedoutcome (for example, the change in the log of exports between 2008 and2004) is regressed on an indicator for being a FAMEX II recipient and on firmcharacteristics, as discussed in Section 3. For comparability with the match-ing DID estimation, the same characteristics as those used to estimate thepropensity scores are considered, and firms that are not on the commonsupport are dropped from the estimating sample. The OLS estimates of the
12The sample size of drop-outs is proportional to their share in the universe of successfulapplicants.
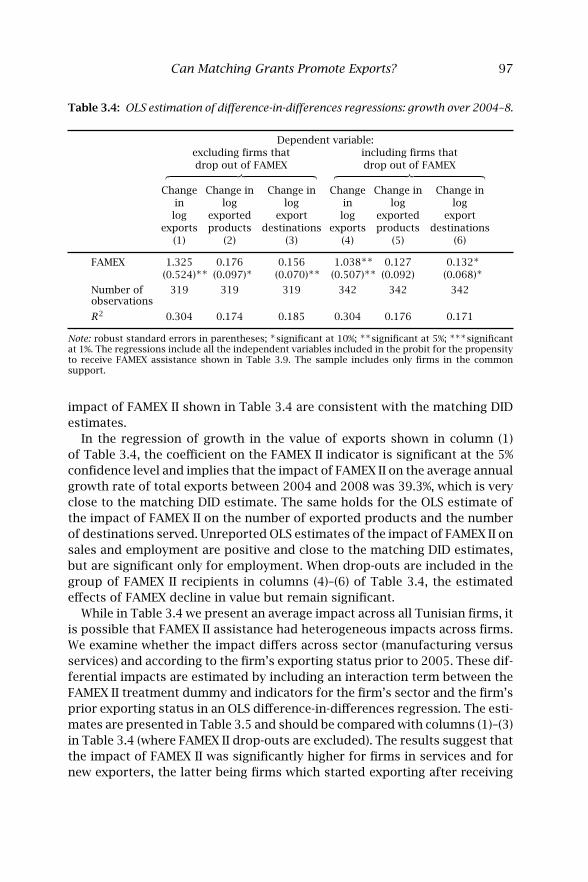
Can Matching Grants Promote Exports? 97
Table 3.4: OLS estimation of difference-in-differences regressions: growth over 2004–8.
Dependent variable:excluding firms that including firms thatdrop out of FAMEX drop out of FAMEX︷ ︸︸ ︷ ︷ ︸︸ ︷
Change Change in Change in Change Change in Change inin log log in log loglog exported export log exported export
exports products destinations exports products destinations(1) (2) (3) (4) (5) (6)
FAMEX 1.325 0.176 0.156 1.038∗∗ 0.127 0.132∗
(0.524)∗∗ (0.097)∗ (0.070)∗∗ (0.507)∗∗ (0.092) (0.068)∗
Number of 319 319 319 342 342 342observations
R2 0.304 0.174 0.185 0.304 0.176 0.171
Note: robust standard errors in parentheses; ∗significant at 10%; ∗∗significant at 5%; ∗∗∗significantat 1%. The regressions include all the independent variables included in the probit for the propensityto receive FAMEX assistance shown in Table 3.9. The sample includes only firms in the commonsupport.
impact of FAMEX II shown in Table 3.4 are consistent with the matching DIDestimates.
In the regression of growth in the value of exports shown in column (1)of Table 3.4, the coefficient on the FAMEX II indicator is significant at the 5%confidence level and implies that the impact of FAMEX II on the average annualgrowth rate of total exports between 2004 and 2008 was 39.3%, which is veryclose to the matching DID estimate. The same holds for the OLS estimate ofthe impact of FAMEX II on the number of exported products and the numberof destinations served. Unreported OLS estimates of the impact of FAMEX II onsales and employment are positive and close to the matching DID estimates,but are significant only for employment. When drop-outs are included in thegroup of FAMEX II recipients in columns (4)–(6) of Table 3.4, the estimatedeffects of FAMEX decline in value but remain significant.
While in Table 3.4 we present an average impact across all Tunisian firms, itis possible that FAMEX II assistance had heterogeneous impacts across firms.We examine whether the impact differs across sector (manufacturing versusservices) and according to the firm’s exporting status prior to 2005. These dif-ferential impacts are estimated by including an interaction term between theFAMEX II treatment dummy and indicators for the firm’s sector and the firm’sprior exporting status in an OLS difference-in-differences regression. The esti-mates are presented in Table 3.5 and should be compared with columns (1)–(3)in Table 3.4 (where FAMEX II drop-outs are excluded). The results suggest thatthe impact of FAMEX II was significantly higher for firms in services and fornew exporters, the latter being firms which started exporting after receiving
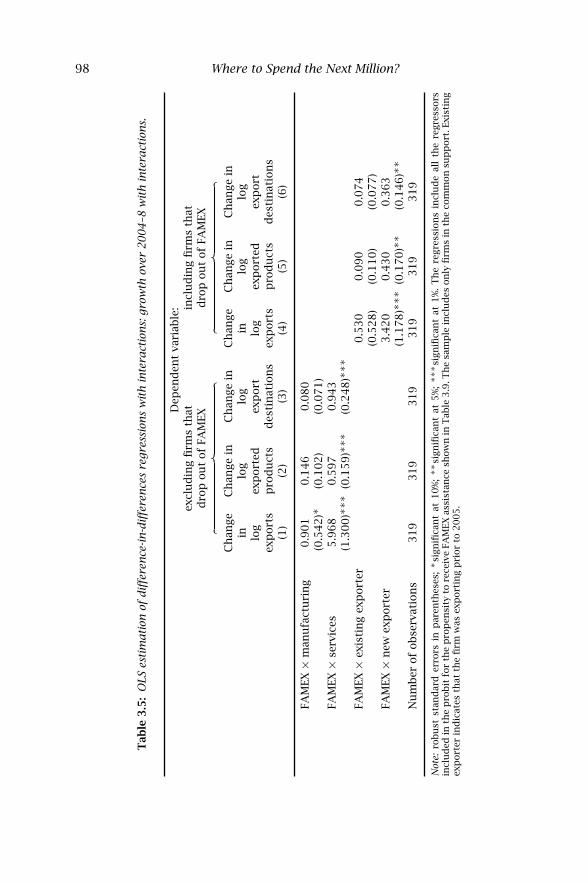
98 Where to Spend the Next Million?
Tab
le3.5
:O
LS
esti
mati
onof
diff
eren
ce-in
-diff
eren
ces
regre
ssio
ns
wit
hin
tera
ctio
ns:
gro
wth
over
2004–8
wit
hin
tera
ctio
ns.
Dep
end
ent
vari
able
:ex
clu
din
gfi
rms
that
incl
ud
ing
firm
sth
atd
rop
ou
tof
FAM
EXd
rop
ou
tof
FAM
EX︷
︸︸︷
︷︸︸
︷C
han
ge
Ch
ange
inC
han
ge
inC
han
ge
Ch
ange
inC
han
ge
inin
log
log
inlo
glo
glo
gex
port
edex
port
log
exp
ort
edex
port
exp
ort
sp
rod
uct
sd
esti
nat
ion
sex
port
sp
rod
uct
sd
esti
nat
ion
s(1
)(2
)(3
)(4
)(5
)(6
)
FAM
EX×
man
ufa
ctu
rin
g0.9
01
0.1
46
0.0
80
(0.5
42)∗
(0.1
02)
(0.0
71)
FAM
EX×
serv
ices
5.9
68
0.5
97
0.9
43
(1.3
00)∗∗∗
(0.1
59)∗∗∗
(0.2
48)∗∗∗
FAM
EX×
exis
tin
gex
port
er0.5
30
0.0
90
0.0
74
(0.5
28)
(0.1
10)
(0.0
77)
FAM
EX×
new
exp
ort
er3.4
20
0.4
30
0.3
63
(1.1
78)∗∗∗
(0.1
70)∗∗
(0.1
46)∗∗
Nu
mb
erof
ob
serv
atio
ns
319
319
319
319
319
319
Not
e:ro
bu
stst
and
ard
erro
rsin
par
enth
eses
;∗
sign
ifica
nt
at10%
;∗∗
sign
ifica
nt
at5%
;∗∗∗
sign
ifica
nt
at1%
.T
he
regre
ssio
ns
incl
ud
eal
lth
ere
gre
ssors
incl
ud
edin
the
pro
bit
for
the
pro
pen
sity
tore
ceiv
eFA
MEX
assi
stan
cesh
ow
nin
Tab
le3.9
.Th
esa
mp
lein
clu
des
on
lyfi
rms
inth
eco
mm
on
sup
port
.Exi
stin
gex
port
erin
dic
ates
that
the
firm
was
exp
ort
ing
pri
or
to2005.
Can Matching Grants Promote Exports? 99
FAMEX II assistance.13 These results suggest that the informational costs ofreaching new export markets are higher for services firms and for first-timeexporters.
6 CONCLUSION
In this chapter, we presented the results from an ex post evaluation ofTunisia’s export promotion programme for firms. Using detailed firm-leveldata collected through a purposely designed survey we employed efficientnon-parametric matching techniques to compare FAMEX II programme recip-ients to observably similar non-recipients, and found that the former experi-enced significantly better export growth after receiving the export assistance.
Our results indicated that the matching grant programme served to increasethe value of exports as well as to expand the extensive margin of exports,namely new exported products and new destinations served between 2004and 2008. Thus, financial assistance can help firms in developing countriesdevelop export markets. Moreover, the results suggest that such grants canhelp both manufacturing and services exporters and are particularly usefulto encourage first-time exporters.
Our study differs from most previous studies in this area in that it measuresthe impact of a single, well-defined export promotion instrument (a matchinggrant), as opposed to a mix of instruments. Similarly focused studies can helpbuild information on the relative effectiveness of such instruments, leading tomore specific policy recommendations. For example, our results suggest thatthe FAMEX II grant worked best for firms which were exporting for the firsttime. It may be that other instruments are more appropriate for experiencedexporters who want to enter new markets or start exporting new products.
Our mixed results for firm-level outcomes such as sales and employmentprevent us from drawing any concrete conclusions on whether the FAMEX IIprogramme helped Tunisian firms grow overall.14 In testing for these impacts,we were constrained by the difficulty of collecting retrospective sales andexpenditures data through firm surveys. As is the case with many similarprogrammes, while grant recipients were obligated to provide data for pro-gramme assessment, non-recipients had no such obligation and were reluc-tant to provide some of the key quantitative information. This experience
13Table 3.10 presents an alternative OLS specification which, in effect, replicates thematching DID approach by using weighted outcomes of untreated firms (weighted by theirdistance to the treated firm in the propensity score). In that case the average FAMEX impactestimate is identical to the matching DID estimate. The estimated differential impacts bysector and prior exporting are similar to those in Table 3.4, although the magnitudes ofthe differences are smaller.
14Moreover, since we could not capture potential spillover effects, we could not do asocial cost–benefit analysis of the programme.
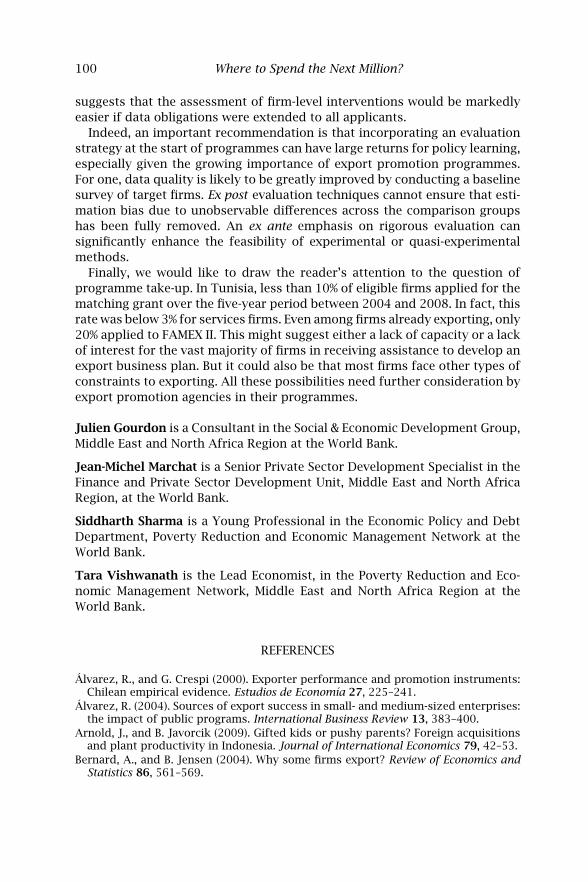
100 Where to Spend the Next Million?
suggests that the assessment of firm-level interventions would be markedlyeasier if data obligations were extended to all applicants.
Indeed, an important recommendation is that incorporating an evaluationstrategy at the start of programmes can have large returns for policy learning,especially given the growing importance of export promotion programmes.For one, data quality is likely to be greatly improved by conducting a baselinesurvey of target firms. Ex post evaluation techniques cannot ensure that esti-mation bias due to unobservable differences across the comparison groupshas been fully removed. An ex ante emphasis on rigorous evaluation cansignificantly enhance the feasibility of experimental or quasi-experimentalmethods.
Finally, we would like to draw the reader’s attention to the question ofprogramme take-up. In Tunisia, less than 10% of eligible firms applied for thematching grant over the five-year period between 2004 and 2008. In fact, thisrate was below 3% for services firms. Even among firms already exporting, only20% applied to FAMEX II. This might suggest either a lack of capacity or a lackof interest for the vast majority of firms in receiving assistance to develop anexport business plan. But it could also be that most firms face other types ofconstraints to exporting. All these possibilities need further consideration byexport promotion agencies in their programmes.
Julien Gourdon is a Consultant in the Social & Economic Development Group,Middle East and North Africa Region at the World Bank.
Jean-Michel Marchat is a Senior Private Sector Development Specialist in theFinance and Private Sector Development Unit, Middle East and North AfricaRegion, at the World Bank.
Siddharth Sharma is a Young Professional in the Economic Policy and DebtDepartment, Poverty Reduction and Economic Management Network at theWorld Bank.
Tara Vishwanath is the Lead Economist, in the Poverty Reduction and Eco-nomic Management Network, Middle East and North Africa Region at theWorld Bank.
REFERENCES
Álvarez, R., and G. Crespi (2000). Exporter performance and promotion instruments:Chilean empirical evidence. Estudios de Economía 27, 225–241.
Álvarez, R. (2004). Sources of export success in small- and medium-sized enterprises:the impact of public programs. International Business Review 13, 383–400.
Arnold, J., and B. Javorcik (2009). Gifted kids or pushy parents? Foreign acquisitionsand plant productivity in Indonesia. Journal of International Economics 79, 42–53.
Bernard, A., and B. Jensen (2004). Why some firms export? Review of Economics andStatistics 86, 561–569.
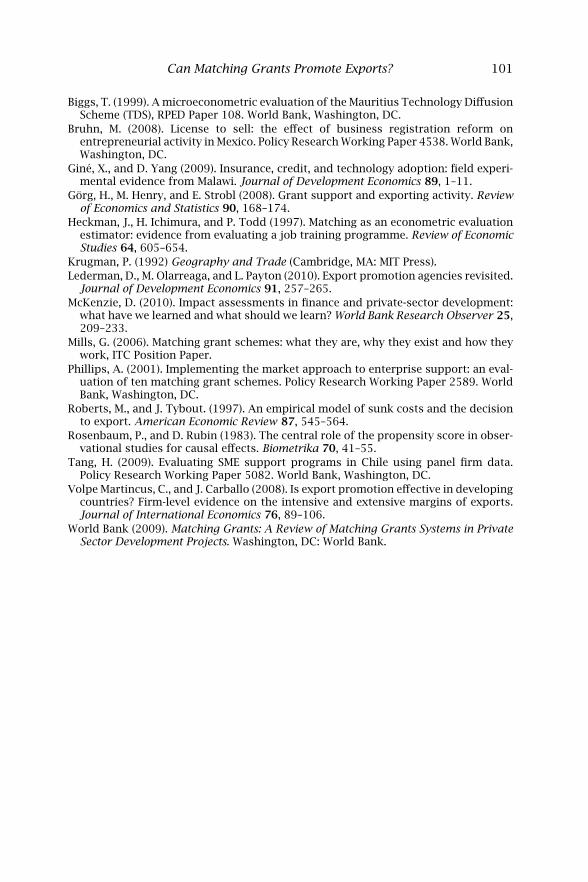
Can Matching Grants Promote Exports? 101
Biggs, T. (1999). A microeconometric evaluation of the Mauritius Technology DiffusionScheme (TDS), RPED Paper 108. World Bank, Washington, DC.
Bruhn, M. (2008). License to sell: the effect of business registration reform onentrepreneurial activity in Mexico. Policy Research Working Paper 4538. World Bank,Washington, DC.
Giné, X., and D. Yang (2009). Insurance, credit, and technology adoption: field experi-mental evidence from Malawi. Journal of Development Economics 89, 1–11.
Görg, H., M. Henry, and E. Strobl (2008). Grant support and exporting activity. Reviewof Economics and Statistics 90, 168–174.
Heckman, J., H. Ichimura, and P. Todd (1997). Matching as an econometric evaluationestimator: evidence from evaluating a job training programme. Review of EconomicStudies 64, 605–654.
Krugman, P. (1992) Geography and Trade (Cambridge, MA: MIT Press).Lederman, D., M. Olarreaga, and L. Payton (2010). Export promotion agencies revisited.
Journal of Development Economics 91, 257–265.McKenzie, D. (2010). Impact assessments in finance and private-sector development:
what have we learned and what should we learn? World Bank Research Observer 25,209–233.
Mills, G. (2006). Matching grant schemes: what they are, why they exist and how theywork, ITC Position Paper.
Phillips, A. (2001). Implementing the market approach to enterprise support: an eval-uation of ten matching grant schemes. Policy Research Working Paper 2589. WorldBank, Washington, DC.
Roberts, M., and J. Tybout. (1997). An empirical model of sunk costs and the decisionto export. American Economic Review 87, 545–564.
Rosenbaum, P., and D. Rubin (1983). The central role of the propensity score in obser-vational studies for causal effects. Biometrika 70, 41–55.
Tang, H. (2009). Evaluating SME support programs in Chile using panel firm data.Policy Research Working Paper 5082. World Bank, Washington, DC.
Volpe Martincus, C., and J. Carballo (2008). Is export promotion effective in developingcountries? Firm-level evidence on the intensive and extensive margins of exports.Journal of International Economics 76, 89–106.
World Bank (2009). Matching Grants: A Review of Matching Grants Systems in PrivateSector Development Projects. Washington, DC: World Bank.
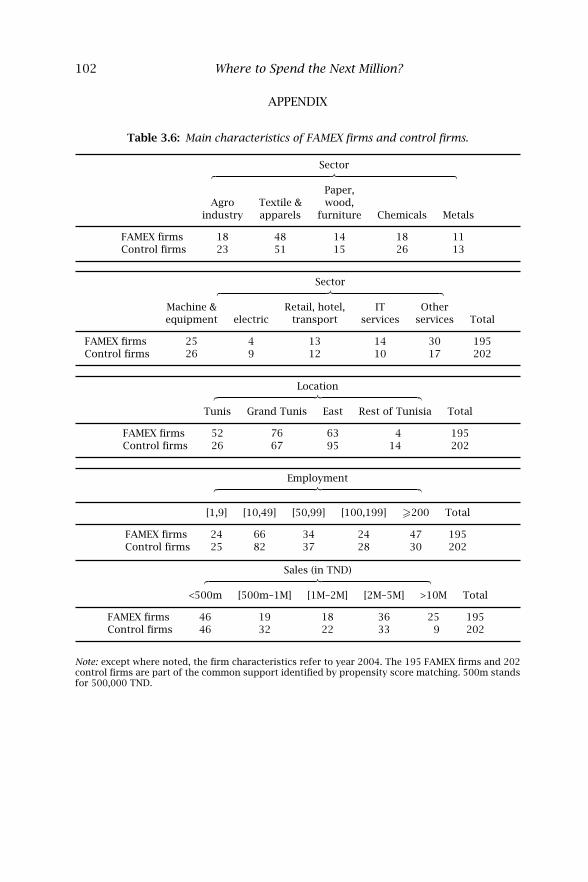
102 Where to Spend the Next Million?
APPENDIX
Table 3.6: Main characteristics of FAMEX firms and control firms.
Sector︷ ︸︸ ︷Paper,
Agro Textile & wood,industry apparels furniture Chemicals Metals
FAMEX firms 18 48 14 18 11Control firms 23 51 15 26 13
Sector︷ ︸︸ ︷Machine & Retail, hotel, IT Otherequipment electric transport services services Total
FAMEX firms 25 4 13 14 30 195Control firms 26 9 12 10 17 202
Location︷ ︸︸ ︷Tunis Grand Tunis East Rest of Tunisia Total
FAMEX firms 52 76 63 4 195Control firms 26 67 95 14 202
Employment︷ ︸︸ ︷[1,9] [10,49] [50,99] [100,199] �200 Total
FAMEX firms 24 66 34 24 47 195Control firms 25 82 37 28 30 202
Sales (in TND)︷ ︸︸ ︷<500m [500m–1M] [1M–2M] [2M–5M] >10M Total
FAMEX firms 46 19 18 36 25 195Control firms 46 32 22 33 9 202
Note: except where noted, the firm characteristics refer to year 2004. The 195 FAMEX firms and 202control firms are part of the common support identified by propensity score matching. 500m standsfor 500,000 TND.
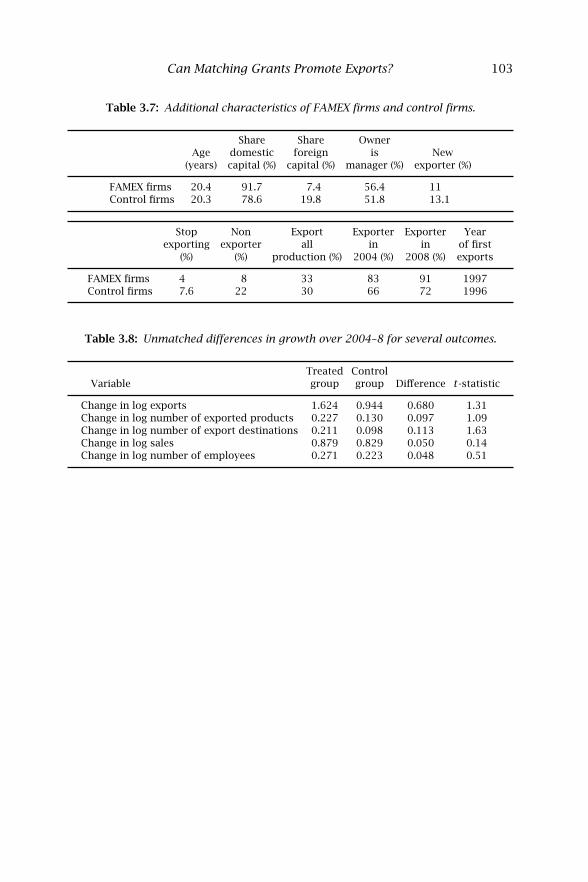
Can Matching Grants Promote Exports? 103
Table 3.7: Additional characteristics of FAMEX firms and control firms.
Share Share OwnerAge domestic foreign is New
(years) capital (%) capital (%) manager (%) exporter (%)
FAMEX firms 20.4 91.7 7.4 56.4 11Control firms 20.3 78.6 19.8 51.8 13.1
Stop Non Export Exporter Exporter Yearexporting exporter all in in of first
(%) (%) production (%) 2004 (%) 2008 (%) exports
FAMEX firms 4 8 33 83 91 1997Control firms 7.6 22 30 66 72 1996
Table 3.8: Unmatched differences in growth over 2004–8 for several outcomes.
Treated ControlVariable group group Difference t-statistic
Change in log exports 1.624 0.944 0.680 1.31Change in log number of exported products 0.227 0.130 0.097 1.09Change in log number of export destinations 0.211 0.098 0.113 1.63Change in log sales 0.879 0.829 0.050 0.14Change in log number of employees 0.271 0.223 0.048 0.51
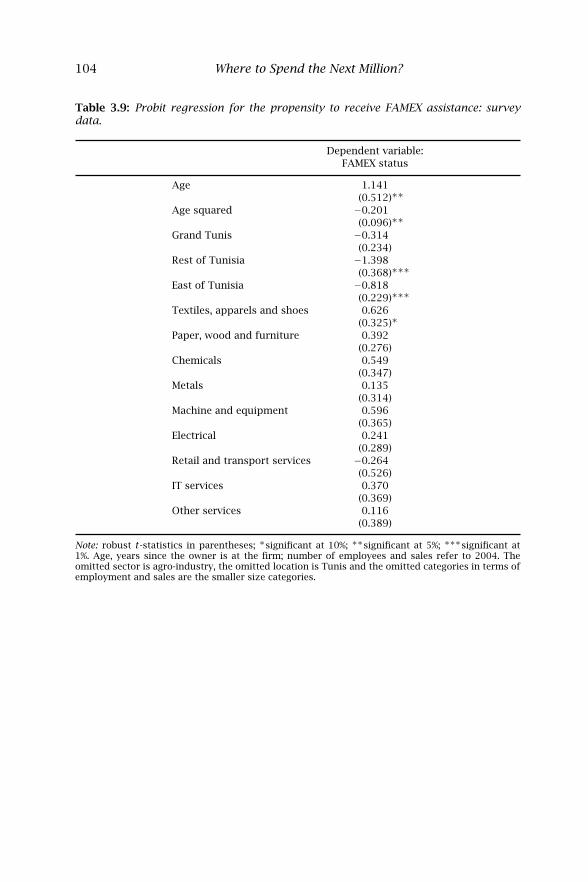
104 Where to Spend the Next Million?
Table 3.9: Probit regression for the propensity to receive FAMEX assistance: surveydata.
Dependent variable:FAMEX status
Age 1.141(0.512)∗∗
Age squared −0.201(0.096)∗∗
Grand Tunis −0.314(0.234)
Rest of Tunisia −1.398(0.368)∗∗∗
East of Tunisia −0.818(0.229)∗∗∗
Textiles, apparels and shoes 0.626(0.325)∗
Paper, wood and furniture 0.392(0.276)
Chemicals 0.549(0.347)
Metals 0.135(0.314)
Machine and equipment 0.596(0.365)
Electrical 0.241(0.289)
Retail and transport services −0.264(0.526)
IT services 0.370(0.369)
Other services 0.116(0.389)
Note: robust t-statistics in parentheses; ∗significant at 10%; ∗∗significant at 5%; ∗∗∗significant at1%. Age, years since the owner is at the firm; number of employees and sales refer to 2004. Theomitted sector is agro-industry, the omitted location is Tunis and the omitted categories in terms ofemployment and sales are the smaller size categories.
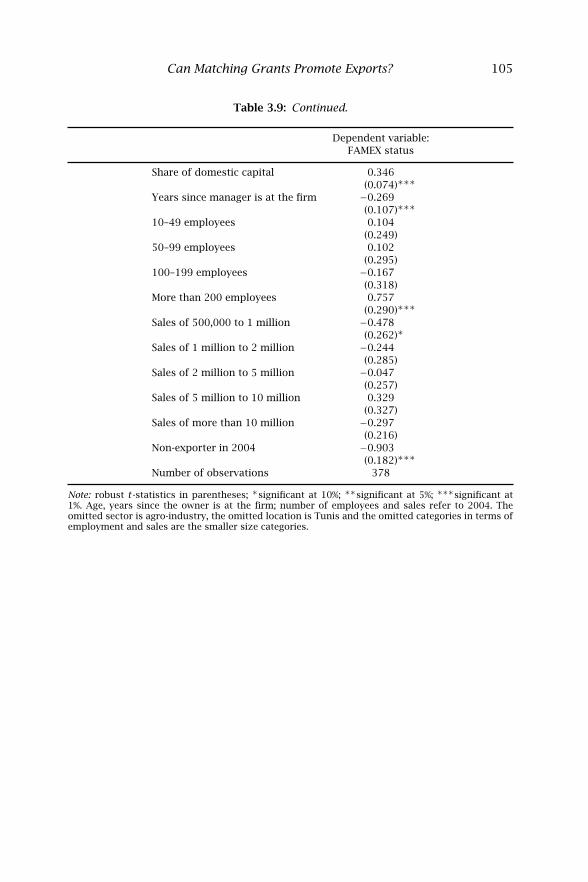
Can Matching Grants Promote Exports? 105
Table 3.9: Continued.
Dependent variable:FAMEX status
Share of domestic capital 0.346(0.074)∗∗∗
Years since manager is at the firm −0.269(0.107)∗∗∗
10–49 employees 0.104(0.249)
50–99 employees 0.102(0.295)
100–199 employees −0.167(0.318)
More than 200 employees 0.757(0.290)∗∗∗
Sales of 500,000 to 1 million −0.478(0.262)∗
Sales of 1 million to 2 million −0.244(0.285)
Sales of 2 million to 5 million −0.047(0.257)
Sales of 5 million to 10 million 0.329(0.327)
Sales of more than 10 million −0.297(0.216)
Non-exporter in 2004 −0.903(0.182)∗∗∗
Number of observations 378
Note: robust t-statistics in parentheses; ∗significant at 10%; ∗∗significant at 5%; ∗∗∗significant at1%. Age, years since the owner is at the firm; number of employees and sales refer to 2004. Theomitted sector is agro-industry, the omitted location is Tunis and the omitted categories in terms ofemployment and sales are the smaller size categories.
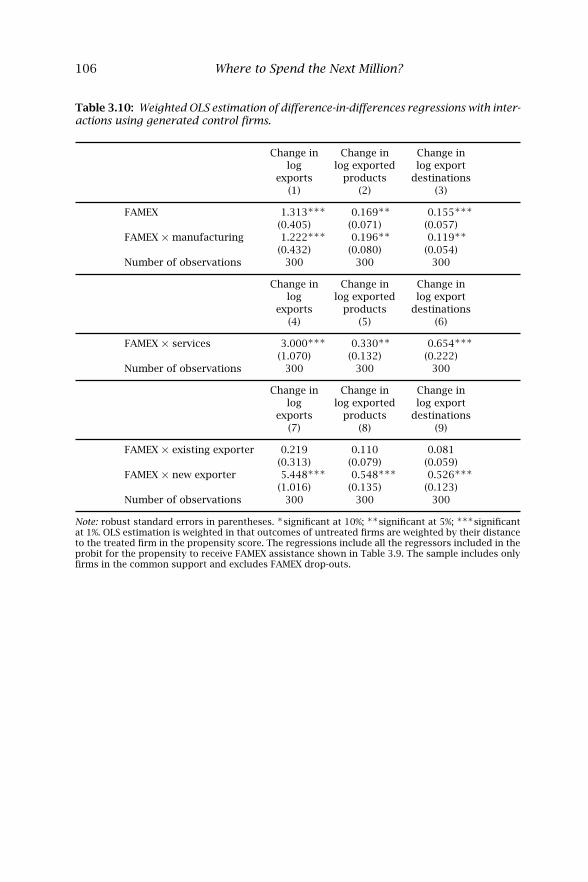
106 Where to Spend the Next Million?
Table 3.10: Weighted OLS estimation of difference-in-differences regressions with inter-actions using generated control firms.
Change in Change in Change inlog log exported log export
exports products destinations(1) (2) (3)
FAMEX 1.313∗∗∗ 0.169∗∗ 0.155∗∗∗
(0.405) (0.071) (0.057)FAMEX × manufacturing 1.222∗∗∗ 0.196∗∗ 0.119∗∗
(0.432) (0.080) (0.054)Number of observations 300 300 300
Change in Change in Change inlog log exported log export
exports products destinations(4) (5) (6)
FAMEX × services 3.000∗∗∗ 0.330∗∗ 0.654∗∗∗
(1.070) (0.132) (0.222)Number of observations 300 300 300
Change in Change in Change inlog log exported log export
exports products destinations(7) (8) (9)
FAMEX × existing exporter 0.219 0.110 0.081(0.313) (0.079) (0.059)
FAMEX × new exporter 5.448∗∗∗ 0.548∗∗∗ 0.526∗∗∗
(1.016) (0.135) (0.123)Number of observations 300 300 300
Note: robust standard errors in parentheses. ∗significant at 10%; ∗∗significant at 5%; ∗∗∗significantat 1%. OLS estimation is weighted in that outcomes of untreated firms are weighted by their distanceto the treated firm in the propensity score. The regressions include all the regressors included in theprobit for the propensity to receive FAMEX assistance shown in Table 3.9. The sample includes onlyfirms in the common support and excludes FAMEX drop-outs.
4
The Use of Experimental Designs in theEvaluation of Trade-Facilitation
Programmes: An Example from Egypt
DAVID ATKIN AND AMIT KHANDELWAL
1 INTRODUCTION
Developing countries are becoming increasingly integrated into the worldeconomy thanks to large declines in transportation costs and a reductionin trade barriers. Yet substantial constraints remain that prevent many firmsin developing countries from successfully expanding and diversifying theirexports. Such constraints include trade financing shortfalls, inadequate prod-uct quality, a lack of relevant certifications required for exporting, insuffi-cient understanding of the preferences of foreign consumers and difficultiesmatching with appropriate foreign buyers. Overcoming these obstacles is theprimary goal of many of the current ‘aid-for-trade’ initiatives.
Unfortunately, we know very little about the relative importance of, andinteraction between, the various constraints holding back developing coun-try enterprises. There has also been no rigorous evaluation of how effectiveexisting aid-for-trade initiatives are at facilitating trade. This chapter lays outthe various methodologies available for performing such an evaluation anddiscusses in detail one such evaluation focusing on handloom producers inEgypt.
1.1 Evaluating Aid for Trade
The aid-for-trade agenda recognises that, in addition to large-scale policyreforms, complementary policies are required to facilitate the participationof developing country firms in the global economy. The aid-for-trade agendafocuses on four key areas.
• Trade policy and regulation: this entails building capacity for developingcountries to participate in formulating, negotiating, and implementingregional and multilateral trade and investment agreements.
108 Where to Spend the Next Million?
• Infrastructure: this area recognises that improvements in infrastructure,such as road construction, and the reduction in costs imposed by roadcheckpoints, power generation and port development are necessary toreduce the costs of trade.
• Productive capacity building: this area aims to increase firms’ capacityto export by bridging gaps in firms’ technical knowledge about foreigntransactions, which range from certifications for export markets andbetter quality control to leveraging global supply chains.
• Adjustment assistance: many countries rely on tariff revenues as animportant source of government revenue. This fact makes it more diffi-cult for countries to lower trade barriers. The aid-for-trade agenda aimsto help countries adjust to liberalisations by improving customs and taxcollections and helping with additional transaction costs.
A common theme in these initiatives is the focus on domestic constraints asbarriers to international trade. The hope of aid-for-trade initiatives is that, byaddressing these four areas, developing countries will be able to take advan-tage of the global reduction in external trade barriers and create successfulexporting businesses. These successful exporters will boost employment, gen-erate foreign exchange reserves and raise domestic growth rates.
But to our knowledge, no rigorous evaluation has yet been conducted on anyof these initiatives. As a result, we are unsure how to design such programmesto guarantee the highest chance of success. For example, it may be critical forexport facilitation initiatives to focus on increasing firms’ understanding ofconsumer preferences and the market structure in the foreign market theyare trying to penetrate, rather than only focusing on reducing blockages atports. Additionally, we know very little about the cost–benefit analysis of suchprogrammes and the potential spillovers to firms and industries not targetedin the initiative.
1.2 The Randomised Control Trial as a Tool for Programme Evaluation
One methodology, the randomised controlled trial (RCT), is well suited toaddressing questions of this type. To understand the advantages of an RCTover ex post econometric analysis, consider how we might evaluate one par-ticular programme that would fall under the aid-for-trade initiative: helpingfirms to obtain proper certifications to export their products. Organisationslike the World Bank or international trade consulting agencies often providethis type of support to small and medium enterprises (SMEs) in developingcountries.
These programmes generally work as follows.
• A consultant who understands a particular industry is assigned to helpSMEs obtain the proper certification to export to foreign markets. Exam-ples of certification might include regulatory forms required for export-ing food products to the European Union.
Experimental Designs 109
• The consultant will identify a set of SMEs that are best positioned tobegin exporting.
• The success of the programme is judged on the success of these SMEsin successfully exporting to foreign markets.
However, such a positive evaluation of the programme may be spurious. TheSMEs that the consultant has chosen to work with were precisely the firmsmost likely to succeed as exporters. These firms will have been chosen for amultitude of reasons, such as:
• they manufacture higher quality products than other firms in thedomestic market;
• they have demonstrated success in the domestic market;
• they presently export to foreign markets with similar characteristics totheir home market (such as quality or design preferences);
• they have skilled and/or motivated managers and owners;
• they are located in or close to the city where the programme is based.
Even in the absence of an export certification programme, exports werelikely to have grown over time for SMEs with these characteristics. The con-sultant chose these firms precisely for this reason: they were the best firmswith the highest growth prospects. Since exports following the programmeare larger than exports prior to the programme, the consultant may want toconclude that the programme was successful. However, without comparisonwith an adequate control group that did not receive assistance, it is impossibleto know the effectiveness and impact of such a programme.
Three non-experimental options are available to evaluate the efficacy ofthe programme. All options involve collecting data on the SMEs’ operationsseveral periods before and after the programme implementation.
1. An evaluation could compare outcomes for similar firms based onobservable characteristics, some of whom received the certification sub-sidy and some of whom did not. This approach is known as a matchingestimator. In practice it is very difficult to locate these similar firms. Inthe extreme, if the consultant selects all the most promising firms toreceive the certification programmes, then no similar firms would exist.Even if only a subset of promising firms are selected, the most promis-ing firms may differ along a number of dimensions, many of which maybe unobservable or immeasurable.
2. An evaluation could study the exports of many firms over time andhope to see a jump in exports for the firms receiving assistance atprecisely the time that the certification programme went into opera-tion. This approach is known as a regression discontinuity. In prac-tice, even if a sharp jump in exports is observed, it is difficult to ruleout other contemporaneous factors that may have boosted exports. For

110 Where to Spend the Next Million?
example, other components of the facilitation programme are usuallyimplemented simultaneously, or trade barriers may have been reducedaround the time of the implementation.
3. An evaluation could combine the methodology of the discontinuity andmatching approaches and look for differential changes in outcomesover time between certified and non-certified firms. With sufficient time-series data, it may be possible to show that exports grew at the same ratein both samples prior to the certification intervention and then divergedafter it. This approach, known as a difference-in-difference estimator,requires many periods of data prior to the intervention in order to ade-quately control for trends in export growth between the two groupsprior to the intervention. Additionally, several periods of data after theintervention are required in order to accurately measure a differentialchange in the growth of exports between the certified and uncertifiedfirms.
The flaws and data needs associated with the three approaches above havemeant that an increasing number of development practitioners are turning toRCTs in order to evaluate programmes that are amenable to such an approach.The methodology generates a set of ideal comparison firms, and is derivedfrom the large literature in medical sciences that uses RCTs to evaluate theeffectiveness of various drugs and medical procedures.
In the certification example, the firms for whom certification is expectedto be most useful are placed in a sample. Half of these viable exporters arethen randomly chosen through a lottery process and placed in the treatmentsample. These treatment firms initially receive the certification programme.The other half of the firms is placed in the control sample.1
The key to the success of an RCT is that the control and treatment groupsare likely to be identical along all characteristics prior to the intervention.Since the two groups were selected at random, a firm in the control groupis just as likely to have a great manager or a low-quality design as a firm inthe treatment group. Therefore, any average differences observed betweenthe two groups after the certification programme can be attributed to thecertification process itself.
1.3 An RCT Design to Evaluate a Trade-Facilitation Programme in Egypt
In this chapter, we discuss an ongoing project that uses an RCT methodologyto study the impacts of a programme designed to link Egyptian microenter-prises with global markets. The issues that arise in evaluating this interven-
1In the interest of fairness, the control group can be promised the certification pro-gramme a short time later. Such a strategy is particularly useful where there are bud-getary or staffing issues that prevent all viable firms from simultaneously being offeredthe programme anyway. We discuss this issue further in Section 3.
Experimental Designs 111
tion are similar to the issues that would arise in many of the aid-for-tradeinitiatives listed earlier.
The motivations for such a study are twofold. First, the study can be viewedas an impact evaluation of a programme that matches microenterprises toUS buyers, improves design quality and offers business training. The secondmotivation is to use an RCT in order to shed light on three central issues ininternational trade:
• does trade increase productivity?
• why do some firms become successful exporters, while others do not?
• how large are the spillovers from exporting?
The last two of these three issues are of special interest to policymakers.Understanding which firms are likely to become successful exporters allowstrade-facilitation programmes to be better targeted. Meanwhile, if the pro-gramme successfully causes firms to start exporting and this phenomenonleads to substantial spillovers in the local economy, this suggests that theremay be larger impacts per dollar spent than simply the direct effects observedamong the treated firms.2
In Section 2 we focus on the ‘ideal’ experiment that can answer these orsimilar questions. The purpose is to think of the ‘best-case’ scenario wherewe have access to adequate resources, the randomisation is acceptable to theprogramme stakeholders and the local context poses no further difficulties.Section 3 will then discuss our attempt to implement this best-case scenariofor a trade-facilitation experiment in Egypt. A number of problems have arisenwhile implementing the experiment, and we will describe how we have workedaround these problems. We will also discuss the common questions and con-cerns brought up in our discussions with potential project partners and howwe have tried to address these.
2 DESIGNING AN RCT THAT EVALUATES THE LINKING OFENTERPRISES TO FOREIGN MARKETS
In this section, we discuss the key factors in designing an RCT to evaluatethe efficacy of trade-facilitation interventions that aim to connect developingcountry enterprises with world markets. This intervention has the followingthree elements.
2Moreover, combined with identifying characteristics associated with firm success,assessing the magnitude and extent of spillovers will provide knowledge about how totarget industrial development programmes spatially. We note that we may not observespillovers if the programme offers similar information (market design help, etc) that thefirms in an area have already received. Therefore, we expect to observe larger spillovers ininstances where the programme successfully removes an exporting constraint.
112 Where to Spend the Next Million?
1. Provision of assistance to match local firms with foreign buyers. Thisprocess involves putting buyers and sellers in contact with one another.Matches could be facilitated through trade show appearances, face-to-face meetings and other networking events, or by directly marketing theenterprises to foreign buyers.
2. Provision of assistance to create designs that are appealing to foreignconsumers. This process involves contracting skilled local or foreigndesigners to work with the local firms in designing new products.
3. Improvements to general business skills through local training pro-grammes.
In the experiment, firms are approached by our project partner to facilitatethe sale of their products to retail clients in the US market. The basic exper-imental design is quite simple. Prior to the intervention, we draw up a list ofviable firms in the region and industry and conduct a baseline survey of thesefirms. This set of firms is called the sample, and the total number of firms isthe sample size. Every firm in this sample should be a firm that the projectis willing to target, and so they are perceived as viable exporters if given thetypes of assistance listed above.
A random set of these sample firms are then approached by the project part-ner and provided with some combination of the three services listed above.This set of chosen firms is known as the treatment group. The firms fromthe sample who are not selected are labelled the control group. We then trackthe progress of all the sample firms over a one- or two-year period. Oncethe evaluation period is complete, the control firms can be provided with theassistance services if desired.
If the randomisation has been done correctly, evaluation is extremely sim-ple. On average, the only difference between firms in the two groups is that thetreatment group received trade assistance; therefore, any difference betweenfirms in the treatment and control groups can be attributed to the trade assis-tance itself. In practice, this comparison is done by comparing means of var-ious firm outcomes between the two groups. Depending on the particularintervention, the outcomes of interest could range from volume of exports,changes in the skill composition of firms’ workforce, product quality, invest-ments in new assets and the number of new clients.
Policymakers may often want to assess the relative efficacy of a set of fea-sible interventions and to determine whether certain interventions requireother accompanying interventions in order to be successful. For example, itis possible that service 3 above—providing business training—has very lowreturns. Meanwhile, design help may be useless unless accompanied by assis-tance in finding new buyers. In order to answer these questions, differentsubsets of treatment firms can be randomly allocated different combinationsof assistance services. If the sample size is large enough, treatment firms can
Experimental Designs 113
be allocated into seven groups, covering every possible combination of at leastone service (1; 2; 3; 1 and 2; 1 and 3; 2 and 3; 1, 2 and 3).3
As before, by comparing means of various firm outcomes between groups,the evaluation can determine the relative effect of additional services as wellas the impact of each service alone. This information can be combined withaccounting estimates of the cost of delivering each service in order to carryout a cost–benefit analysis.
In order to improve the targeting of trade-facilitation programmes, it isimportant to know which types of firm benefit the most from such interven-tions, and which gain relatively little. A well-designed RCT can also reveal thisinformation. If detailed data are collected in the baseline survey on the charac-teristics of each firm (owner’s background, age of firm, number of employees,etc), then it is possible to compare the mean impact for the treatment andthe control group separately for firms with each of these characteristics. Forexample, it may be the case that treatment and control firms are identicalif the owner has no formal education, but the treatment firms grow muchlarger when provided with export assistance if the owner is educated.4 Suchan analysis will provide a list of the characteristics of the firms that are in aposition to gain the most from export facilitation programmes.
Finally, in order to look for spillovers from firms that are offered exportfacilitation assistance to other firms, firms outside the sample that have closelinks with firms inside the sample can also be interviewed (eg they sharesuppliers, the two CEOs speak to each other regularly, they are located next toeach other, etc). Spillovers are identified by comparing the responses of twotypes of firm outside the sample; those firms connected to treatment firmsand those firms connected to control firms. Note that testing for spilloversrequires additional firm surveys beyond the firms assigned to the treatmentand control groups.
One of the most important decisions in designing the RCT is the size of thesample. In general, the larger the sample is, the more likely the RCT is to beinformative. If the programme is successful, the RCT will only provide sup-portive evidence of that success if the standard errors are small enough thatthe experiment reveals statistically significant impacts. However, in practicelarge samples are expensive to survey. In the case of export facilitation pro-grammes, the binding factor will often not be cost, but a shortage of viablefirms to receive the export facilitation services in the first place. If there areonly 50 firms in a particular country who are eligible for facilitation services, it
3An in-depth discussion of how to arrive at the appropriate sample size is beyond thescope of this chapter. We refer the readers to Duflo et al (2006), who discuss in greaterdetail the choice of appropriate sample sizes in experimental samples.
4In practice, rather than comparing means, a regression analysis is performed with adummy treatment variable (‘1’ if offered assistance, ‘0’ if not) interacted with various firmcharacteristics.
114 Where to Spend the Next Million?
is unlikely an RCT will uncover positive treatment effects even for a successfulprogramme.
Unfortunately, deciding on the minimum sample size is more of an artthan a science. The JPAL website5 contains various documents and computerprograms to assist in these decisions, but all methods at some level rely onestimate of variances that are unknown unless there is substantial existingsurvey evidence on similar firms. Given the scarcity of trade-facilitation exper-iments, it may be difficult to obtain estimates of these variances, althoughnon-experimental studies could serve as a rough guide.
In addition to designing the randomisation, the second critical feature ofan RCT is a firm-level survey. Without well-measured firm-level outcomes, itis impossible to identify the changes in these outcomes caused by the trade-facilitation programme. While researchers in labour, health and developmenteconomics now have extensive experience in designing household surveys, theprofession’s experience in collecting firm-level information is relatively thin.Therefore, there are few existing surveys that can be used as templates. Giventhe paucity of experiments within the trade literature, a starting place for thesurvey design, questionnaire and implementation is the small literature thatdocuments field experiments relating to small- and medium-scale enterprises.Good examples are Bloom et al (2011), del Mel et al (2008, 2009), Karlan andValdivia (2011) and Kremer et al (2010). To our knowledge, these referencesare the best sources detailing efforts to collect sensitive information such asfirm-level profits, inventories and assets.
All surveys should be piloted prior to the intervention in order to assess thetime burden on responders, the specificity of key questions, potential recallerrors and the proper units of measurement. For instance, in the handloomweaving sector in Akhmeem, Egypt, we initially piloted questionnaires thatasked weavers about input and output usage in the past 30 days. We quicklylearned that the weavers’ production cycle is linked to raw material that wasre-supplied every 45–60 days, and changed the recall period accordingly.
Some firm-level outcomes, for example, production techniques or invest-ment, may change very rapidly. If understanding the precise timing of thesedecisions is important, monthly or quarterly surveys can be administered.Such frequent surveys also reduce problems with recall error. The trade-off,of course, is the additional costs of carrying out more surveys. The cost ofthese periodic surveys can be reduced if the information can be collected bymobile phone.6
5See http://www.jpal.org.6In Table 4.1, we provide a rough budget that we proposed at the onset of the export
facilitation programme in Egypt. The budget includes an approximate cost of hiring a part-time local research coordinator, a monitoring and evaluation team, data-entry costs (whichcan be offshored to firms in low-wage countries like India or Cambodia) and surveyingequipment (eg GPS devices). Note that the budget can be reduced if the programme wereto be implemented in a lower-waged country than Egypt.
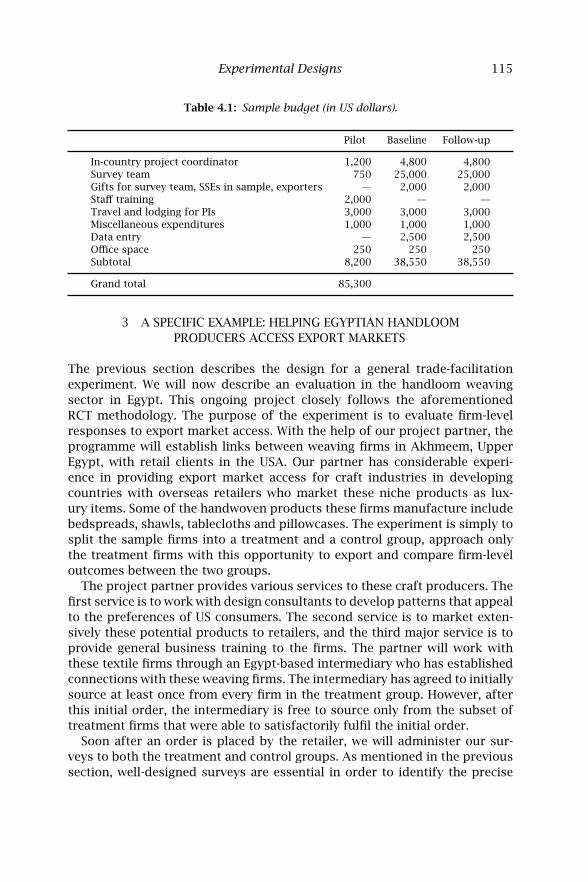
Experimental Designs 115
Table 4.1: Sample budget (in US dollars).
Pilot Baseline Follow-up
In-country project coordinator 1,200 4,800 4,800Survey team 750 25,000 25,000Gifts for survey team, SSEs in sample, exporters — 2,000 2,000Staff training 2,000 — —Travel and lodging for PIs 3,000 3,000 3,000Miscellaneous expenditures 1,000 1,000 1,000Data entry — 2,500 2,500Office space 250 250 250Subtotal 8,200 38,550 38,550
Grand total 85,300
3 A SPECIFIC EXAMPLE: HELPING EGYPTIAN HANDLOOMPRODUCERS ACCESS EXPORT MARKETS
The previous section describes the design for a general trade-facilitationexperiment. We will now describe an evaluation in the handloom weavingsector in Egypt. This ongoing project closely follows the aforementionedRCT methodology. The purpose of the experiment is to evaluate firm-levelresponses to export market access. With the help of our project partner, theprogramme will establish links between weaving firms in Akhmeem, UpperEgypt, with retail clients in the USA. Our partner has considerable experi-ence in providing export market access for craft industries in developingcountries with overseas retailers who market these niche products as lux-ury items. Some of the handwoven products these firms manufacture includebedspreads, shawls, tablecloths and pillowcases. The experiment is simply tosplit the sample firms into a treatment and a control group, approach onlythe treatment firms with this opportunity to export and compare firm-leveloutcomes between the two groups.
The project partner provides various services to these craft producers. Thefirst service is to work with design consultants to develop patterns that appealto the preferences of US consumers. The second service is to market exten-sively these potential products to retailers, and the third major service is toprovide general business training to the firms. The partner will work withthese textile firms through an Egypt-based intermediary who has establishedconnections with these weaving firms. The intermediary has agreed to initiallysource at least once from every firm in the treatment group. However, afterthis initial order, the intermediary is free to source only from the subset oftreatment firms that were able to satisfactorily fulfil the initial order.
Soon after an order is placed by the retailer, we will administer our sur-veys to both the treatment and control groups. As mentioned in the previoussection, well-designed surveys are essential in order to identify the precise
116 Where to Spend the Next Million?
impacts of being provided with a match to a foreign buyer. The survey will askquestions ranging from inventory data, quality issues, employment changesbut also includes impacts at the household level such as schooling decisionsand expenditure information. Naturally, the researcher(s) must decide whichresponses they are most interested in, as the length of the survey increasesresponse burden. Follow up surveys can be shorter and simply collect infor-mation on how key production variables such as inventory and sales havechanged over time. Finally, we will re-survey the firms after approximatelyone year.
This experiment is a straightforward impact evaluation of a programmethat matches Egyptian firms to US buyers, improves design quality and offersbusiness training. More importantly, the RCT can shed light on three centralissues in international trade listed in Section 1.3.
We chose the handloom sector in Egypt for three reasons.
(a) The market structure in the industry is such that there are many smallfirms producing viable export products; therefore, we are able to obtaina large sample of firms.
(b) The handloom technology is simple to understand and similar technolo-gies are used by all firms; therefore, detailed surveys that capture alldimensions of production are feasible to write and later to administer.The more precisely we can measure firm outcomes, the more likely it isthat the true impacts of the programme can be determined. Examples ofsuch industries include garments, textiles, lightly processed food prod-ucts and agriculture.
(c) Our project partner (PP) was implementing a new programme in Egyptthat intended to incorporate the handloom weaving sector. By embark-ing on the evaluation at the programme planning stage, the sample canbe randomised prior to the programme roll out.
In the process of finding a PP, and designing and implementing the experi-ment, we have encountered a number of problems. Here, we list and discussthe issues that have arisen and how we have attempted to resolve them.
3.1 Finding a Project Partner
Carrying out an RCT within the context of international trade depends cru-cially on finding a suitable PP. Unlike other contexts where the researcher(s)can carry out the projects themselves (such as providing cash grants), anexperiment like the one described above relies critically on the PP providingtrade-facilitation services. The PP must therefore agree to and comply withthe study. With enough resources, it would be possible to link the weavers inAkhmeem ourselves by simply purchasing their products outright (and there-fore retaining full control over the experiment). However, in this scenario,such conduct may be unethical if firms are expected to make investments
Experimental Designs 117
based on the expectation of future export orders that we know are not forth-coming. Additionally, conducting a survey within the set of standard markettransactions increases the external validity of the experiment. In our context,the PP primarily serves the role of facilitator/matchmaker between retailersin the USA, intermediaries in the local market and the producers.
3.2 Convincing the PP that an RCT Is Both Desirable and Feasible
The most difficult aspect of conducting an RCT such as the one describedabove is convincing the PP that an RCT is both in their interest and feasible.After explaining the basics of an RCT (perhaps using the certification examplein Section 1 as an illustration) and its advantages over their existing evaluationmethods, PPs typically see the benefits of an RCT. However, our experiencehas been that, typically, the PP’s immediate reaction is that it is impossible tocarry out. They cite a number of reasons.
The RCT May Interfere with the PP’s Targets and/or Funding Requirements
The PP is subject to meeting targets and deadlines set in the programme fund-ing guidelines. These targets often include explicit sales targets, which makesthe PP uneasy about sourcing from an ‘experimental group’ that they believemay not be able to manufacture products up to the required standard. TheRCT therefore threatens the commercial viability of their programme.
This concern is a valid one and should be carefully accounted for in the RCTset-up. One strategy that we proposed is to allow the PP to select who theythink are the best set of initial firms that they can use to generate their initialtargets. These firms must be excluded from the survey sample. The sampleconsists of a second tier of firms who are viable, but of higher risk than thefirst-tier firms. These initial firms can be used to pilot the surveys prior tothe experiment, and so this set-up does provide some benefits. The followingadditional strategies could be tried to reduce the burden on the PP.
(i) If the researchers have enough resources, they may offset the additionalcosts of the experiment by paying for the PP’s time devoted to designingthe experiment and funding the evaluation team.
(ii) It is best to find a new programme that the PP is about to commence,in which they are able to incorporate specifically the RCT. Ideally, theRCT component should be included at the funding stage to ensure maxi-mum buy-in. This ensures that the researchers are involved at the earlierstages of the programme when decisions about the programme timelineare made.
(iii) It is important to stress that the RCT helps the PP in the long run becausethe evidence from the study assists the PP in deciding how to best tar-get their limited resources across multiple services and across differenttypes of firm. Similarly, an RCT can establish the cost effectiveness of
118 Where to Spend the Next Million?
the programme. Such information is becoming increasingly important,as donor agencies are requiring more rigorous evaluation methods forprojects. Hence, positive evidence from the RCT can improve the chanceof the PP receiving future project funding.
(iv) A successful RCT may not require that all firms in the treatment sampleactually receive the full service under evaluation, only that treatmentfirms have a substantially higher chance of benefiting from the treat-ment. For example, if a firm is unable to meet production targets, the PPwould be free to reallocate its orders towards another firm (within thetreatment group).
The Control Group of Firms Is Not Fair or Ethical
There are different strategies to deal with this issue.7 First, PPs usually donot ‘ramp up’ their projects immediately. A set of firms will therefore have tobe excluded from the initial programme implementation and brought in at alater date. The RCT simply asks that, as the PP expands the number of firmsthat the programme reaches, this expansion be done in a randomised way.In this way all the firms eventually receive treatment, but the intervention israndomly staggered over time. In the eyes of the experiment’s subjects, therandom assignment could be viewed as unfair, thus threatening the presenceof the PP in the locality. In practice, the randomisation could be done in a waythat avoids this ‘loss aversion’ by announcing that this programme will beinitially assigned based on the outcomes of a standard lottery. The treatmentfirms were simply lucky in having ‘won’ the right to receive subsidised exportservices immediately. This allocation method is often deemed fair by the localfirms.
What Happens if other Firms Want to Participate? It Seems Unethical to DenyThem Access
If the firms that approach the PP are outside the control group, this is actuallya positive outcome because it implies that information has spilled over tothe firms outside of the sample. It is therefore appropriate, depending onthe question, that these firms be allowed to participate, and importantly, theresearchers collects information on these firms. If firms within the controlgroup wish to participate, this represents a double-edged sword. On the onehand, the fact that firms ask to participate provides evidence that spilloversare occurring and can teach us about how knowledge diffuses among firms,and so this information should be recorded. However, if all control firms askfor and are allowed to receive the treatment, then the randomisation will fail
7We had one experience with an NGO that flat out refused our proposal because of theneed for a control group. There is not much that can be done in such a case.
Experimental Designs 119
entirely, as both the treatment and control firms receive the same services. Ingeneral, contamination of the control group should be strongly discouraged.8
A Sample Frame Does Not Exist
In order to have secured funding, the PP is likely to have some estimate of thesize of the industry under study. Depending on the hypothesis being tested,it is critical to know if these numbers reflect the number of workers or thenumber of managers. Certain industries may have a large number of smallfirms, or a small number of large firms. If the outcomes of interest depend onthe actions of managers rather than workers, then that is the appropriate levelfor the randomisation (eg evaluating capital investment decisions as opposedto the effectiveness of employee contract types). It is important to know theindustry structure prior to designing the experiment.
A typical programme such as the one outlined above may target initiallyone or two pre-selected firms. Then, as the programme expands, additionalfirms are targeted using the firm contacts provided by the initial firms. As aresult, the PP may not have an initial sample frame. In practice, local busi-ness associations, local government offices and intermediaries operating inthe area should be consulted in order to construct the most accurate sampleframe possible, a crucial component in effectively implementing an RCT.
3.3 Ensuring Compliance with the RCT Once the Experiment Has Begun
Once the RCT begins, it is important to ensure that the various agents arecomplying with the experimental design. For instance, our design requiresthat intermediaries purchase from the randomly selected producers and sellto the US retailers. However, these intermediaries may not comply with theRCT and instead allocate orders to some favoured members of the controlgroup.
Possible strategies to ensure compliance are given below.
(i) Intermediaries or other agents motivated by financial profit can beincentivised to comply with the experiment. These agents are in lineto earn substantial profits if the firms they deal with generate suc-cessful exporting relationships. Incentive-compatible contracts shouldbe designed to ensure compliance in exchange for the opportunity toexpand their business.
8If any of the control group firms are provided with the treatment, an evaluation willbe less likely to determine that the project was successful, as the contamination of thetreatment and control groups will attenuate all the results towards finding no effect.
120 Where to Spend the Next Million?
(ii) Effective monitoring guarantees that any non-compliance issues will bequickly spotted and can be dealt with appropriately. Close monitoringmay also discourage some agents from violating the research design ifthey know they will be discovered. Researchers should collect reliableinformation about the operations of the producers. If export productsare visibly different, one option is to do spot checks to ensure that con-trol group firms are not actually producing export products. Anotheroption is to compare the reported sales by the producers with thereported purchases by the retail client and check that these numbersmatch up.
(iii) Another potential source of non-compliance is resistance from theproject coordinators, who are not used to having randomised compo-nents in their projects. It is important that the project coordinators seeand understand the benefits of an effective RCT from the outset. Typi-cally, the project under evaluation will benefit less from the evaluationthan future projects of a similar nature, and so working with a coordi-nator who has vested interests beyond the success of the project underevaluation is important. This point is closely related to (ii) in Section 3.2.
4 CONCLUSION
The suggestions offered in this chapter provide a general framework forthinking about possible evaluations of programmes that fall under the aid-for-trade initiative. This framework will need to be refined for each specific pro-gramme, and these refinements will occur after extensive discussions betweenall agents involved in the evaluations: the researchers, the provider of thetrade-facilitation services, the firms and any relevant governmental or non-governmental organisations.
In all cases, it is essential that the researchers devising an evaluation exper-iment are familiar with the specifics of the programme that will be evaluated,as well as with the local context in which the programme will be implemented.The researchers should visit the potential target firms and meet with thelocal project coordinator. This knowledge and these interactions will allowresearchers to address any constraints that the experiment must work around,as well as focus the experimental design such that it can answer the precisequestions of practitioners and stakeholders.
Amit Khandelwal is the Assistant Professor of Finance and Economics atColumbia University.
David Atkin is Assistant Professor of Economics at Yale University.

Experimental Designs 121
REFERENCES
Bloom, N., B. Eifert, A. Mahajan, D. McKenzie, and J. Roberts (2011). Does managementmatter: evidence from India. NBER Working Paper 16658.
del Mel, S., D. McKenzie, and C. Woodruff (2008). Returns to capital in microenter-prises: evidence from a field experiment. Quarterly Journal of Economics 123, 1329-1372.
del Mel, S., D. McKenzie, and C. Woodruff (2009). Measuring microenterprises profits:must we ask how the sausage is made? Journal of Development 88, 19–31.
Duflo, E., R. Glennerster, and M. Kremer (2006). Using randomization in developmenteconomics research: a toolkit. Mimeo, MIT, Cambridge, MA.
Karlan, D., and M. Valdivia (2011). Teaching entrepreneurship: impact of businesstraining on microfinance clients and institutions. Review of Economics and Statistics93, 510–527.
Kremer, M., J. Lee, J. Robinson, and O. Rostapshova (2010). The return to capital forsmall retailers in Kenya: evidence from inventories. Mimeo, Harvard University.

5
Transport Costs and Firm Behaviour:Evidence from Mozambique and
South Africa
SANDRA SEQUEIRA
1 THE IMPORTANCE OF TRANSPORT COSTS
An extensive trade literature has argued that trade costs are a significantimpediment to trade and economic growth (Frankel and Romer 1999; Hum-mels 1999, 2008; Rodriguez and Rodrik 2000; Obstfeld and Rogoff 2000;Anderson and Wincoop 2004). Although there are many drivers of trade costs,the role played by direct and indirect costs associated with the transportationof goods has received renewed attention in recent years. Following the pro-gressive dismantlement of tariffs in the 1990s and early 2000s, it is increas-ingly argued that transport costs have come to replace tariffs as the mainbarrier to trade in parts of the developing world. The most compelling evi-dence comes from sub-Saharan Africa (SSA) (Hummels 1999, 2007; Hoekmanand Nicita 2008; Freund and Rocha 2010).1
As a result, a significant portion of aid efforts has in recent years beendevoted to reducing trade costs and improving trade logistics.2 The major-ity of these investments have targeted both physical transport infrastructurethrough the rebuilding of railways, roads and ports and the upgrading of
1In 2007, shipping a container from a firm located in the main city of the average countryin sub-Saharan Africa was twice as expensive as shipping it from the US, Brazil or India(World Bank 2007). Shipping from SSA is also more time consuming. In 2007, it took anaverage of 35 days for a firm to get a standard 20-foot container from its warehousethrough the closest port and on a ship. This was twice as long as in Brazil and six timeslonger than in the USA. Djankov et al (2010) suggest that each day the movement of cargois delayed reduces a country’s trade by 1% and distorts the ratio of trade in time-sensitiveto time-insensitive goods by 6%. Similarly, Limão and Venables (2001) estimate that a 10%decline in transport costs for a cross-section of countries worldwide would increase tradeby 25%.
2In 2008, approximately 20% of the World Bank’s budget was spent on transport infra-structure projects in over 35 countries worldwide.
124 Where to Spend the Next Million?
transport bureaucracies. These projects appeal to donors, since they trans-late into divisible and verifiable investments.
However, these projects are seldom guided by rigorous empirical evidenceon how the associated investments can affect the real drivers of transportcosts. In particular, the micro-level mechanisms through which transport caninfluence economic activity by affecting firms and households remain largelyunexplored. Governments in the developing world often struggle with how toprioritise investments in different types of transport infrastructure, and withhow to ensure that these investments are financially sustainable. Both taskswould be greatly assisted by a clear understanding of the impact of invest-ments in different types of transport infrastructure on different economicagents, on different regions and, more broadly, on long-term developmentand growth.
The literature on the drivers of transport costs has developed around twomain approaches. One strand in the literature focuses on the relative impor-tance of hard transport infrastructure, such as the quality of roads, railwaysand ports, while a second strand focuses on soft transport infrastructure,such as the regulation of transport markets, port policies and rules regulatingthe movement of goods across borders. Limão and Venables (2001) argue thatthe quality of hard transport infrastructure accounts for most of SSA’s poortrade performance, as measured by variables such as the density of a coun-try’s road and rail networks. The authors suggest that improving transportinfrastructure from the bottom quarter of countries—primarily from SSA—tothat of the median country in their sample could increase trade by 50%. Buyset al (2006) resort to spatial network analysis to simulate the effects of roadupgrading and suggest that connecting all of SSA’s capitals to population cen-tres with more than 500,000 inhabitants would translate into a US$250 billionincrease in trade volumes over 15 years.
However, decades of large investments in road infrastructure and portupgrading throughout Africa have yet to deliver a proportional decline in thecost of transport or the expected increase in trade volumes associated with areduction in trade costs. As an example, even in a middle-income country likeSouth Africa, which boasts the best road network in the region and some ofthe best equipped ports, expenditures on commercial transport and logisticsare still equivalent to about 15–20% of GDP, which is double the figure forcomparable countries like Brazil and India (CSIR 2005, 2006).
Motivated by this evidence, Raballand and Macchi (2008) argue instead thattransport prices result less from poor transport infrastructure than frominefficiencies in the structure of transport markets. The authors use originaltrucking surveys to measure the costs, rates and performance of the truck-ing industry across Western and Central Africa. They conclude that transportprices charged to business are high, while the actual costs incurred by truckingcompanies in Western Africa to move cargo do not differ greatly from those
Transport Costs and Firm Behaviour 125
faced by a trucking company in the developed world.3 Macchi and Sequeira(2009) provide a point of convergence in these two literatures. They arguethat the poor functioning of the soft infrastructure of ports due to corrup-tion directly affects demand for port services, which in turn has an impact onthe returns to the investments made in the hard infrastructure of the port.
While these studies suggest important correlations, a clear identificationof the determinants of transport costs and of how they affect firm behaviourremains elusive. Undertaking any type of evidence-based policymaking underthese conditions becomes extremely difficult.
The recent surge of impact evaluations in social programmes is beginning tomake inroads into the trade and industrial organisation literatures, with enor-mous potential to widen our understanding of how firms behave in responseto policies aimed at reducing trade costs. The adoption of quasi-experimentaland experimental methods for causal inference can set us on a promising pathtowards understanding these foundational mechanisms. While this optimismshould surely extend to the study of transport policies, the nature of trans-port projects—in hard or soft form—poses an additional set of challengesthat researchers will have to consider.
The first stumbling block is the absence of micro-data on transport costsand prices, before and after investments in transport infrastructure takeplace. With the exception of the trucking data generated in Raballand andMacchi (2008) and Macchi and Sequeira (2009), none of the major develop-ment microdata sets—namely the Living Standards Measurement Survey, theDoing Business and the World Bank’s Enterprise Surveys—currently collectadequate data on transport costs or transport prices at the firm and house-hold level. Data on railway and port tariffs is also proprietary and difficult toobtain, even for the main regional transport corridors in sub-Saharan Africa.
Lack of data creates enormous difficulties not only for researchers’ under-standing of the distribution of direct transport costs and how they affect firmsand households, but also in identifying the indirect economy-wide effects,such as the effect of transport on the geography of business and on patternsof trade and specialisation. It also prevents a clear understanding of how thestructure of transport markets may mediate the cost of transport betweenproviders and end-users.
For example, the absence of micro-data prevents measurement of the extentto which cost savings induced by investments in the quality of roads arepassed on to users of transport services. It also blocks an assessment of howbenefits from investments in railways may have a differential effect on firms,
3This is primarily because the trucking industry in developing countries faces consider-ably lower fixed costs than their counterparts in the developed world, which results froma combination of low wages, low capital costs due to low barriers to entry of second-handvehicles, and high vehicle usage. This is compensated by higher variable costs stemmingfrom high fuel consumption due to age and vehicle fleet condition, as well as higher main-tenance costs.
126 Where to Spend the Next Million?
depending on the fare structures adopted and the allocation of freight toavailable slots in the railway network. Transport is a basic input for most eco-nomic activity, so the range of its impact on socioeconomic, environmentaland political variables is broad, often requiring extensive and costly data-collection efforts.
A second stumbling block that emerges when estimating the magnitude anddistribution of effects that can be attributed to investments in transport infra-structure relates to the endogeneity of project placement, and the absenceof well-defined treatment and comparison regions. The placement of infras-tructural projects is often determined by a complex interplay of political,economic, social and environmental constraints (Robinson and Torvik 2005),which is often inscrutable to the researcher, rendering standard assumptionsof causal inference implausible. As a result, the unobservables that determinethe placement of the infrastructure and affect outcomes are likely to differbetween treatment and comparison regions. Most observational studies willtherefore struggle with eliciting causation. The ideal experimental methodthat would randomly assign regions to treatment and comparison groups, andin the process ensure that pre-treatment characteristics are identical betweenthem, is also unlikely to be feasible for large, often politically sensitive trans-port projects. These challenges extend to evaluations of soft infrastructure,given that rules, regulations and government agencies dealing with the move-ment of cargo across borders are often not amenable to random assignmentat the micro level, or to the creation of comparison groups for the purposesof an impact evaluation.
A third stumbling block associated with the main identification problemidentified above is the lack of a well-defined area of impact, and a clear unitof analysis when estimating the magnitude and distributional effects of trans-port infrastructure. The catchment area of different types of infrastructuralprojects is difficult to define due to spillover and network effects. It is alsochallenging to define the right unit of analysis for different types of invest-ment: transport infrastructure can directly affect households and firms bydetermining mobility costs for both people and goods. But it can also affectbroader geographical areas via an infusion of resources in the form of wages,sourcing of inputs, physical materials and technical capacity for both buildingand maintaining the infrastructure. The mechanisms through which transportprojects create winners and losers are likely to be location, programme andcontext specific, depending on the underlying geography of communities andof economic activity.
A related concern is that we still lack a full understanding of the functionalform of the effects caused by transport infrastructure projects. In most cases,the researcher will face a difficult trade-off between short windows of evalua-tion that fail to capture the full effects of the project and longer windows thatincrease the risk of contamination and other confounding factors affectingtreated or comparison units. While this is a common concern for evaluators,
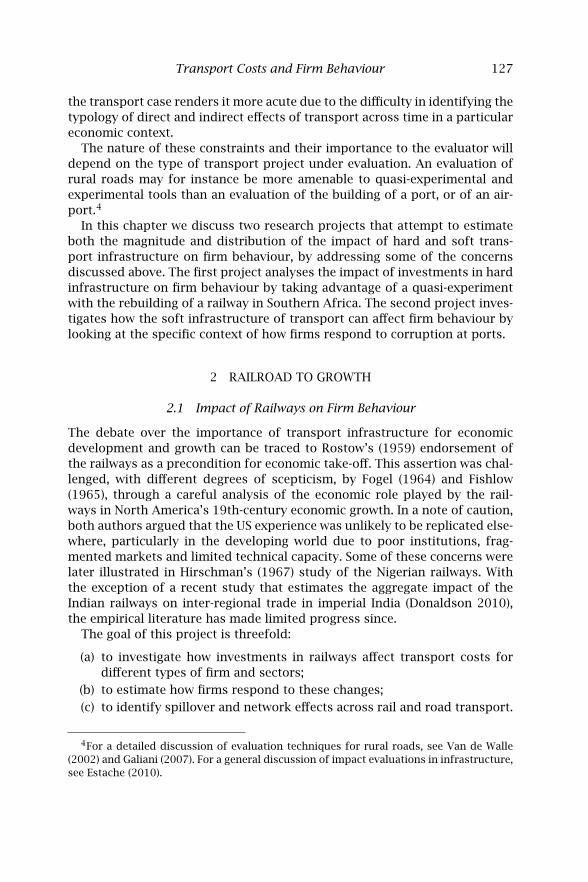
Transport Costs and Firm Behaviour 127
the transport case renders it more acute due to the difficulty in identifying thetypology of direct and indirect effects of transport across time in a particulareconomic context.
The nature of these constraints and their importance to the evaluator willdepend on the type of transport project under evaluation. An evaluation ofrural roads may for instance be more amenable to quasi-experimental andexperimental tools than an evaluation of the building of a port, or of an air-port.4
In this chapter we discuss two research projects that attempt to estimateboth the magnitude and distribution of the impact of hard and soft trans-port infrastructure on firm behaviour, by addressing some of the concernsdiscussed above. The first project analyses the impact of investments in hardinfrastructure on firm behaviour by taking advantage of a quasi-experimentwith the rebuilding of a railway in Southern Africa. The second project inves-tigates how the soft infrastructure of transport can affect firm behaviour bylooking at the specific context of how firms respond to corruption at ports.
2 RAILROAD TO GROWTH
2.1 Impact of Railways on Firm Behaviour
The debate over the importance of transport infrastructure for economicdevelopment and growth can be traced to Rostow’s (1959) endorsement ofthe railways as a precondition for economic take-off. This assertion was chal-lenged, with different degrees of scepticism, by Fogel (1964) and Fishlow(1965), through a careful analysis of the economic role played by the rail-ways in North America’s 19th-century economic growth. In a note of caution,both authors argued that the US experience was unlikely to be replicated else-where, particularly in the developing world due to poor institutions, frag-mented markets and limited technical capacity. Some of these concerns werelater illustrated in Hirschman’s (1967) study of the Nigerian railways. Withthe exception of a recent study that estimates the aggregate impact of theIndian railways on inter-regional trade in imperial India (Donaldson 2010),the empirical literature has made limited progress since.
The goal of this project is threefold:
(a) to investigate how investments in railways affect transport costs fordifferent types of firm and sectors;
(b) to estimate how firms respond to these changes;
(c) to identify spillover and network effects across rail and road transport.
4For a detailed discussion of evaluation techniques for rural roads, see Van de Walle(2002) and Galiani (2007). For a general discussion of impact evaluations in infrastructure,see Estache (2010).
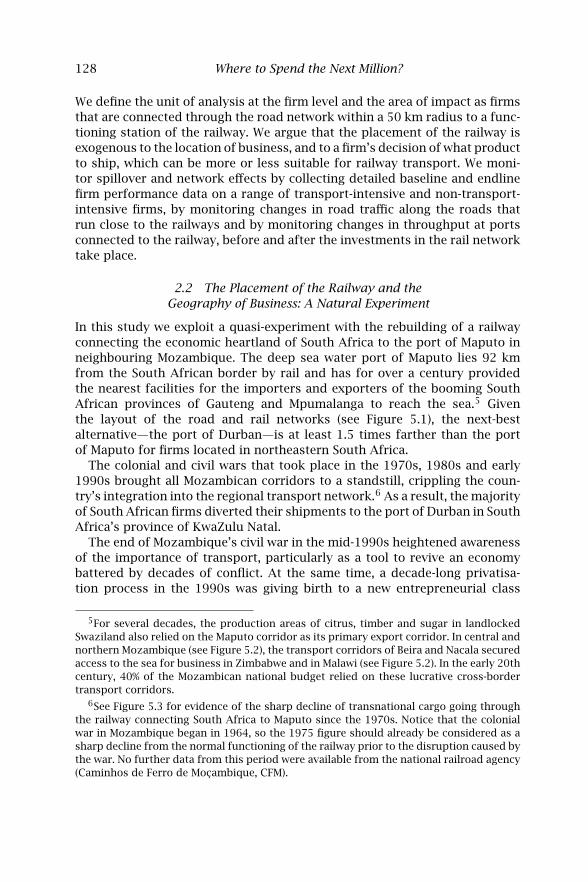
128 Where to Spend the Next Million?
We define the unit of analysis at the firm level and the area of impact as firmsthat are connected through the road network within a 50 km radius to a func-tioning station of the railway. We argue that the placement of the railway isexogenous to the location of business, and to a firm’s decision of what productto ship, which can be more or less suitable for railway transport. We moni-tor spillover and network effects by collecting detailed baseline and endlinefirm performance data on a range of transport-intensive and non-transport-intensive firms, by monitoring changes in road traffic along the roads thatrun close to the railways and by monitoring changes in throughput at portsconnected to the railway, before and after the investments in the rail networktake place.
2.2 The Placement of the Railway and theGeography of Business: A Natural Experiment
In this study we exploit a quasi-experiment with the rebuilding of a railwayconnecting the economic heartland of South Africa to the port of Maputo inneighbouring Mozambique. The deep sea water port of Maputo lies 92 kmfrom the South African border by rail and has for over a century providedthe nearest facilities for the importers and exporters of the booming SouthAfrican provinces of Gauteng and Mpumalanga to reach the sea.5 Giventhe layout of the road and rail networks (see Figure 5.1), the next-bestalternative—the port of Durban—is at least 1.5 times farther than the portof Maputo for firms located in northeastern South Africa.
The colonial and civil wars that took place in the 1970s, 1980s and early1990s brought all Mozambican corridors to a standstill, crippling the coun-try’s integration into the regional transport network.6 As a result, the majorityof South African firms diverted their shipments to the port of Durban in SouthAfrica’s province of KwaZulu Natal.
The end of Mozambique’s civil war in the mid-1990s heightened awarenessof the importance of transport, particularly as a tool to revive an economybattered by decades of conflict. At the same time, a decade-long privatisa-tion process in the 1990s was giving birth to a new entrepreneurial class
5For several decades, the production areas of citrus, timber and sugar in landlockedSwaziland also relied on the Maputo corridor as its primary export corridor. In central andnorthern Mozambique (see Figure 5.2), the transport corridors of Beira and Nacala securedaccess to the sea for business in Zimbabwe and in Malawi (see Figure 5.2). In the early 20thcentury, 40% of the Mozambican national budget relied on these lucrative cross-bordertransport corridors.
6See Figure 5.3 for evidence of the sharp decline of transnational cargo going throughthe railway connecting South Africa to Maputo since the 1970s. Notice that the colonialwar in Mozambique began in 1964, so the 1975 figure should already be considered as asharp decline from the normal functioning of the railway prior to the disruption caused bythe war. No further data from this period were available from the national railroad agency(Caminhos de Ferro de Moçambique, CFM).
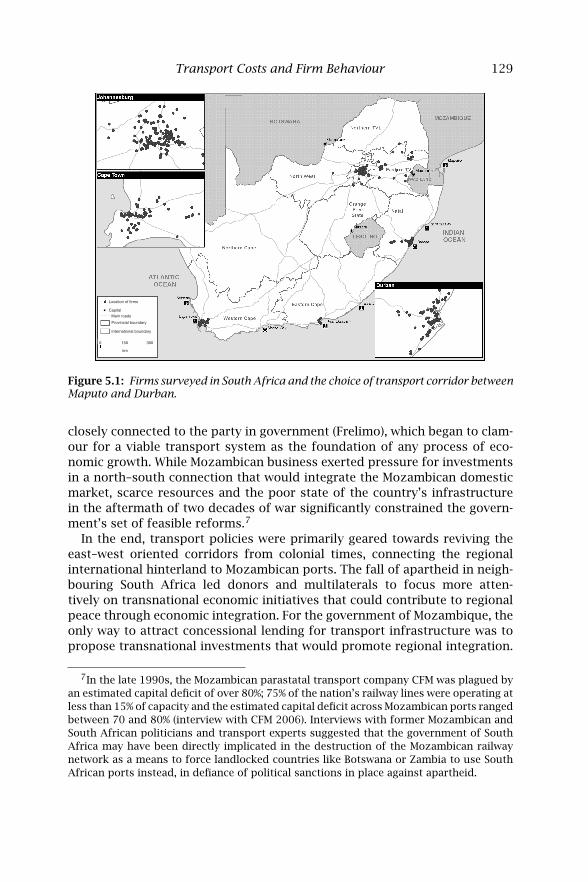
Transport Costs and Firm Behaviour 129
Location of firms
CapitalMain roads
Provincial boundary
International boundary
0 150 300
km
Figure 5.1: Firms surveyed in South Africa and the choice of transport corridor betweenMaputo and Durban.
closely connected to the party in government (Frelimo), which began to clam-our for a viable transport system as the foundation of any process of eco-nomic growth. While Mozambican business exerted pressure for investmentsin a north–south connection that would integrate the Mozambican domesticmarket, scarce resources and the poor state of the country’s infrastructurein the aftermath of two decades of war significantly constrained the govern-ment’s set of feasible reforms.7
In the end, transport policies were primarily geared towards reviving theeast–west oriented corridors from colonial times, connecting the regionalinternational hinterland to Mozambican ports. The fall of apartheid in neigh-bouring South Africa led donors and multilaterals to focus more atten-tively on transnational economic initiatives that could contribute to regionalpeace through economic integration. For the government of Mozambique, theonly way to attract concessional lending for transport infrastructure was topropose transnational investments that would promote regional integration.
7In the late 1990s, the Mozambican parastatal transport company CFM was plagued byan estimated capital deficit of over 80%; 75% of the nation’s railway lines were operating atless than 15% of capacity and the estimated capital deficit across Mozambican ports rangedbetween 70 and 80% (interview with CFM 2006). Interviews with former Mozambican andSouth African politicians and transport experts suggested that the government of SouthAfrica may have been directly implicated in the destruction of the Mozambican railwaynetwork as a means to force landlocked countries like Botswana or Zambia to use SouthAfrican ports instead, in defiance of political sanctions in place against apartheid.
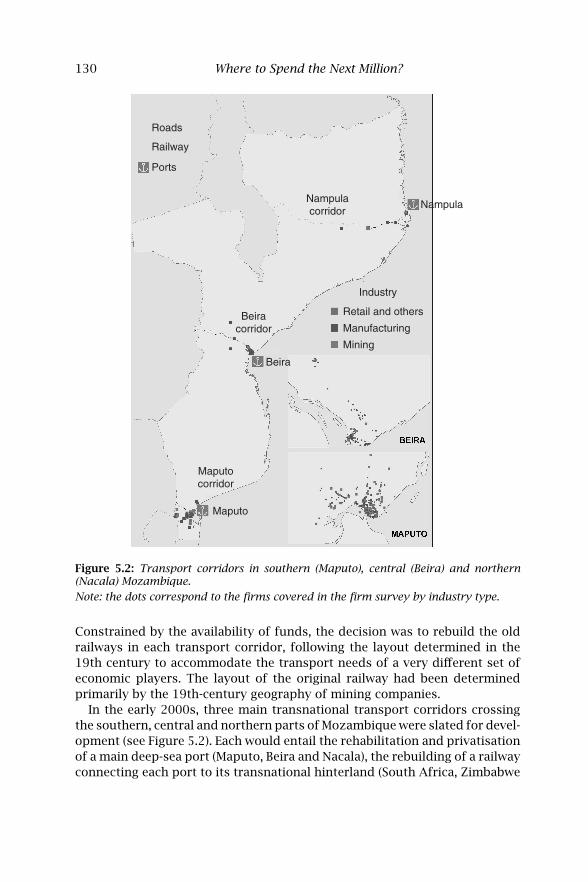
130 Where to Spend the Next Million?
Roads
Railway
Ports
NampulaNampulacorridor
Beira
Beiracorridor
Maputocorridor
Maputo
Industry
Retail and others
Manufacturing
Mining
Figure 5.2: Transport corridors in southern (Maputo), central (Beira) and northern(Nacala) Mozambique.
Note: the dots correspond to the firms covered in the firm survey by industry type.
Constrained by the availability of funds, the decision was to rebuild the oldrailways in each transport corridor, following the layout determined in the19th century to accommodate the transport needs of a very different set ofeconomic players. The layout of the original railway had been determinedprimarily by the 19th-century geography of mining companies.
In the early 2000s, three main transnational transport corridors crossingthe southern, central and northern parts of Mozambique were slated for devel-opment (see Figure 5.2). Each would entail the rehabilitation and privatisationof a main deep-sea port (Maputo, Beira and Nacala), the rebuilding of a railwayconnecting each port to its transnational hinterland (South Africa, Zimbabwe
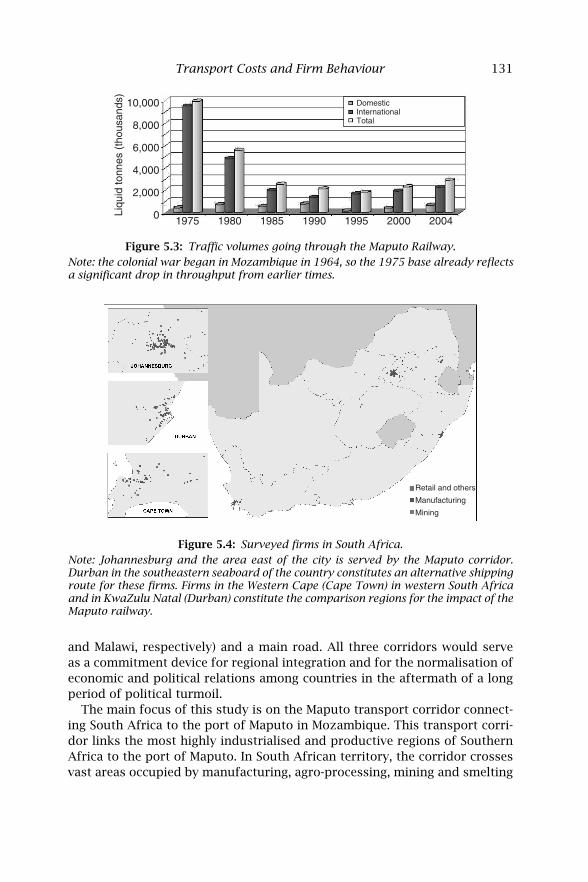
Transport Costs and Firm Behaviour 131
10,000
8,000
6,000
4,000
2,000
0Liqu
id to
nnes
(th
ousa
nds)
1975 1980 1985 1990 1995 2000 2004
DomesticInternationalTotal
Figure 5.3: Traffic volumes going through the Maputo Railway.
Note: the colonial war began in Mozambique in 1964, so the 1975 base already reflectsa significant drop in throughput from earlier times.
Retail and others
Manufacturing
Mining
Figure 5.4: Surveyed firms in South Africa.
Note: Johannesburg and the area east of the city is served by the Maputo corridor.Durban in the southeastern seaboard of the country constitutes an alternative shippingroute for these firms. Firms in the Western Cape (Cape Town) in western South Africaand in KwaZulu Natal (Durban) constitute the comparison regions for the impact of theMaputo railway.
and Malawi, respectively) and a main road. All three corridors would serveas a commitment device for regional integration and for the normalisation ofeconomic and political relations among countries in the aftermath of a longperiod of political turmoil.
The main focus of this study is on the Maputo transport corridor connect-ing South Africa to the port of Maputo in Mozambique. This transport corri-dor links the most highly industrialised and productive regions of SouthernAfrica to the port of Maputo. In South African territory, the corridor crossesvast areas occupied by manufacturing, agro-processing, mining and smelting
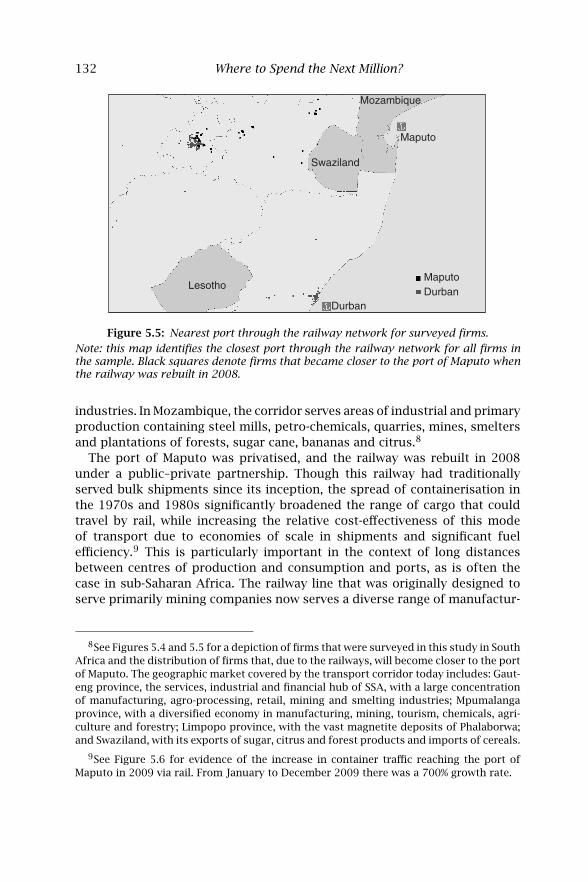
132 Where to Spend the Next Million?
Durban
Maputo
Maputo
DurbanLesotho
Swaziland
Mozambique
Figure 5.5: Nearest port through the railway network for surveyed firms.
Note: this map identifies the closest port through the railway network for all firms inthe sample. Black squares denote firms that became closer to the port of Maputo whenthe railway was rebuilt in 2008.
industries. In Mozambique, the corridor serves areas of industrial and primaryproduction containing steel mills, petro-chemicals, quarries, mines, smeltersand plantations of forests, sugar cane, bananas and citrus.8
The port of Maputo was privatised, and the railway was rebuilt in 2008under a public–private partnership. Though this railway had traditionallyserved bulk shipments since its inception, the spread of containerisation inthe 1970s and 1980s significantly broadened the range of cargo that couldtravel by rail, while increasing the relative cost-effectiveness of this modeof transport due to economies of scale in shipments and significant fuelefficiency.9 This is particularly important in the context of long distancesbetween centres of production and consumption and ports, as is often thecase in sub-Saharan Africa. The railway line that was originally designed toserve primarily mining companies now serves a diverse range of manufactur-
8See Figures 5.4 and 5.5 for a depiction of firms that were surveyed in this study in SouthAfrica and the distribution of firms that, due to the railways, will become closer to the portof Maputo. The geographic market covered by the transport corridor today includes: Gaut-eng province, the services, industrial and financial hub of SSA, with a large concentrationof manufacturing, agro-processing, retail, mining and smelting industries; Mpumalangaprovince, with a diversified economy in manufacturing, mining, tourism, chemicals, agri-culture and forestry; Limpopo province, with the vast magnetite deposits of Phalaborwa;and Swaziland, with its exports of sugar, citrus and forest products and imports of cereals.
9See Figure 5.6 for evidence of the increase in container traffic reaching the port ofMaputo in 2009 via rail. From January to December 2009 there was a 700% growth rate.
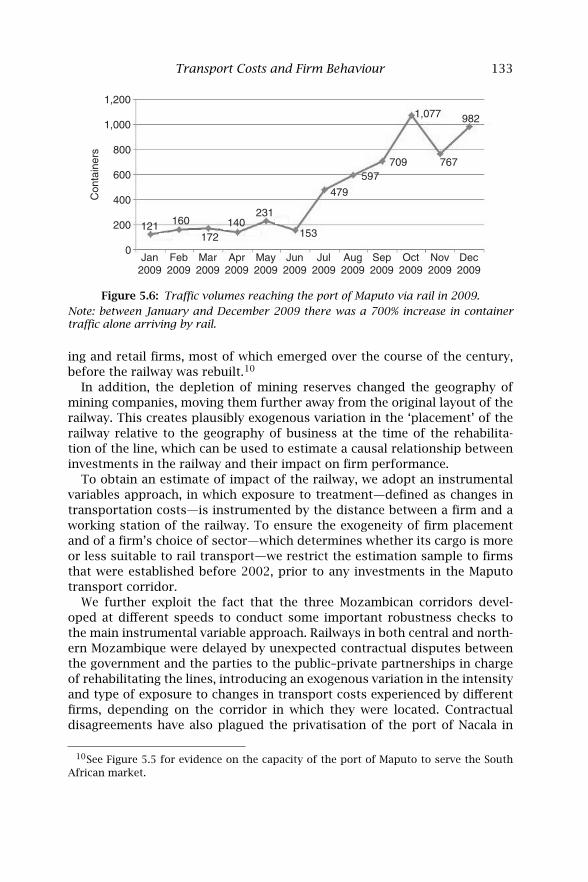
Transport Costs and Firm Behaviour 133
1,200
1,000
800
600
400
200
0
Con
tain
ers
Jan2009
Feb2009
Mar2009
Apr2009
May2009
Jun2009
Jul2009
Aug2009
Sep2009
Oct2009
Nov2009
Dec2009
121 160
172140
231
153
479
597709
1,077
767
982
Figure 5.6: Traffic volumes reaching the port of Maputo via rail in 2009.
Note: between January and December 2009 there was a 700% increase in containertraffic alone arriving by rail.
ing and retail firms, most of which emerged over the course of the century,before the railway was rebuilt.10
In addition, the depletion of mining reserves changed the geography ofmining companies, moving them further away from the original layout of therailway. This creates plausibly exogenous variation in the ‘placement’ of therailway relative to the geography of business at the time of the rehabilita-tion of the line, which can be used to estimate a causal relationship betweeninvestments in the railway and their impact on firm performance.
To obtain an estimate of impact of the railway, we adopt an instrumentalvariables approach, in which exposure to treatment—defined as changes intransportation costs—is instrumented by the distance between a firm and aworking station of the railway. To ensure the exogeneity of firm placementand of a firm’s choice of sector—which determines whether its cargo is moreor less suitable to rail transport—we restrict the estimation sample to firmsthat were established before 2002, prior to any investments in the Maputotransport corridor.
We further exploit the fact that the three Mozambican corridors devel-oped at different speeds to conduct some important robustness checks tothe main instrumental variable approach. Railways in both central and north-ern Mozambique were delayed by unexpected contractual disputes betweenthe government and the parties to the public–private partnerships in chargeof rehabilitating the lines, introducing an exogenous variation in the intensityand type of exposure to changes in transport costs experienced by differentfirms, depending on the corridor in which they were located. Contractualdisagreements have also plagued the privatisation of the port of Nacala in
10See Figure 5.5 for evidence on the capacity of the port of Maputo to serve the SouthAfrican market.
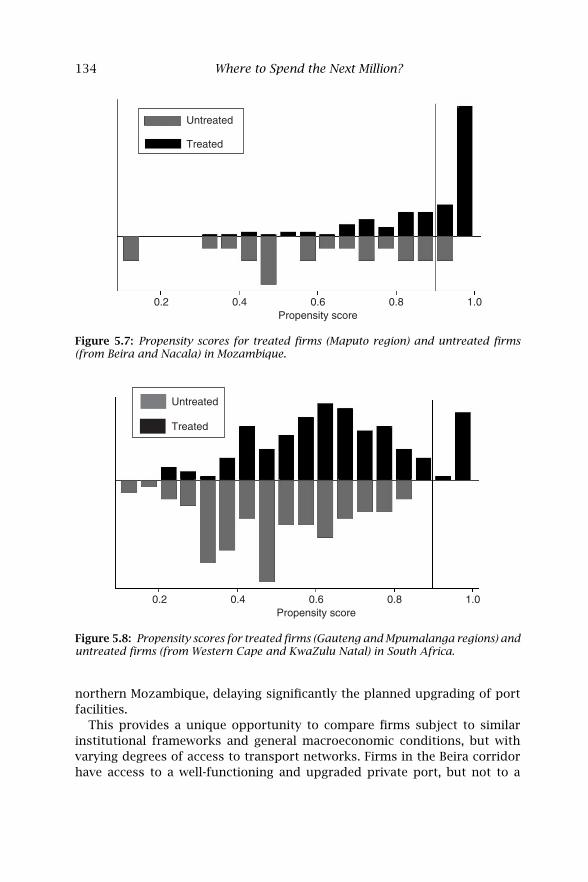
134 Where to Spend the Next Million?
0.2 0.4 0.6 0.8 1.0Propensity score
Untreated
Treated
Figure 5.7: Propensity scores for treated firms (Maputo region) and untreated firms(from Beira and Nacala) in Mozambique.
0.2 0.4 0.6 0.8 1.0Propensity score
Untreated
Treated
Figure 5.8: Propensity scores for treated firms (Gauteng and Mpumalanga regions) anduntreated firms (from Western Cape and KwaZulu Natal) in South Africa.
northern Mozambique, delaying significantly the planned upgrading of portfacilities.
This provides a unique opportunity to compare firms subject to similarinstitutional frameworks and general macroeconomic conditions, but withvarying degrees of access to transport networks. Firms in the Beira corridorhave access to a well-functioning and upgraded private port, but not to a
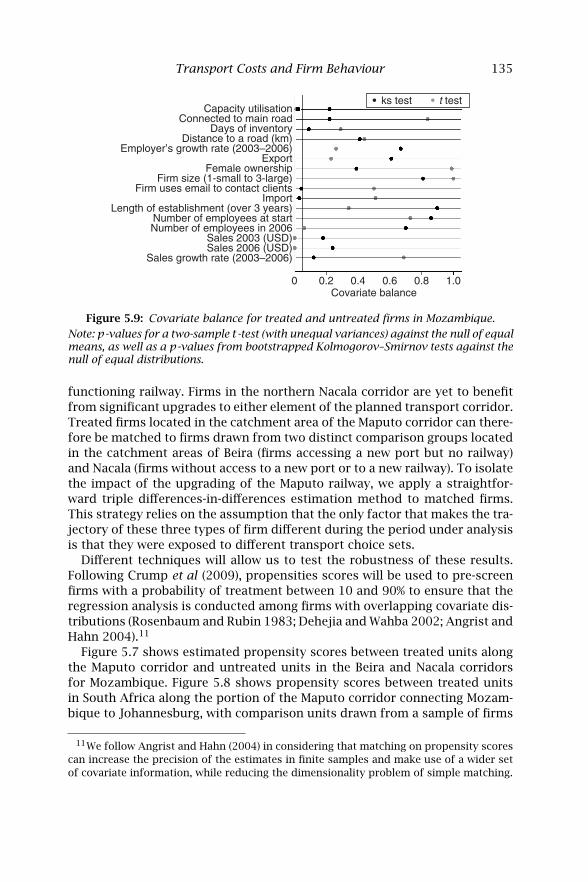
Transport Costs and Firm Behaviour 135
0.2 0.4 0.6 0.8 1.00Covariate balance
ks test t testCapacity utilisation
Connected to main roadDays of inventory
Distance to a road (km)Employer’s growth rate (2003–2006)
ExportFemale ownership
Firm size (1-small to 3-large)Firm uses email to contact clients
ImportLength of establishment (over 3 years)
Number of employees at startNumber of employees in 2006
Sales 2003 (USD)Sales 2006 (USD)
Sales growth rate (2003–2006)
Figure 5.9: Covariate balance for treated and untreated firms in Mozambique.
Note: p-values for a two-sample t-test (with unequal variances) against the null of equalmeans, as well as a p-values from bootstrapped Kolmogorov–Smirnov tests against thenull of equal distributions.
functioning railway. Firms in the northern Nacala corridor are yet to benefitfrom significant upgrades to either element of the planned transport corridor.Treated firms located in the catchment area of the Maputo corridor can there-fore be matched to firms drawn from two distinct comparison groups locatedin the catchment areas of Beira (firms accessing a new port but no railway)and Nacala (firms without access to a new port or to a new railway). To isolatethe impact of the upgrading of the Maputo railway, we apply a straightfor-ward triple differences-in-differences estimation method to matched firms.This strategy relies on the assumption that the only factor that makes the tra-jectory of these three types of firm different during the period under analysisis that they were exposed to different transport choice sets.
Different techniques will allow us to test the robustness of these results.Following Crump et al (2009), propensities scores will be used to pre-screenfirms with a probability of treatment between 10 and 90% to ensure that theregression analysis is conducted among firms with overlapping covariate dis-tributions (Rosenbaum and Rubin 1983; Dehejia and Wahba 2002; Angrist andHahn 2004).11
Figure 5.7 shows estimated propensity scores between treated units alongthe Maputo corridor and untreated units in the Beira and Nacala corridorsfor Mozambique. Figure 5.8 shows propensity scores between treated unitsin South Africa along the portion of the Maputo corridor connecting Mozam-bique to Johannesburg, with comparison units drawn from a sample of firms
11We follow Angrist and Hahn (2004) in considering that matching on propensity scorescan increase the precision of the estimates in finite samples and make use of a wider setof covariate information, while reducing the dimensionality problem of simple matching.
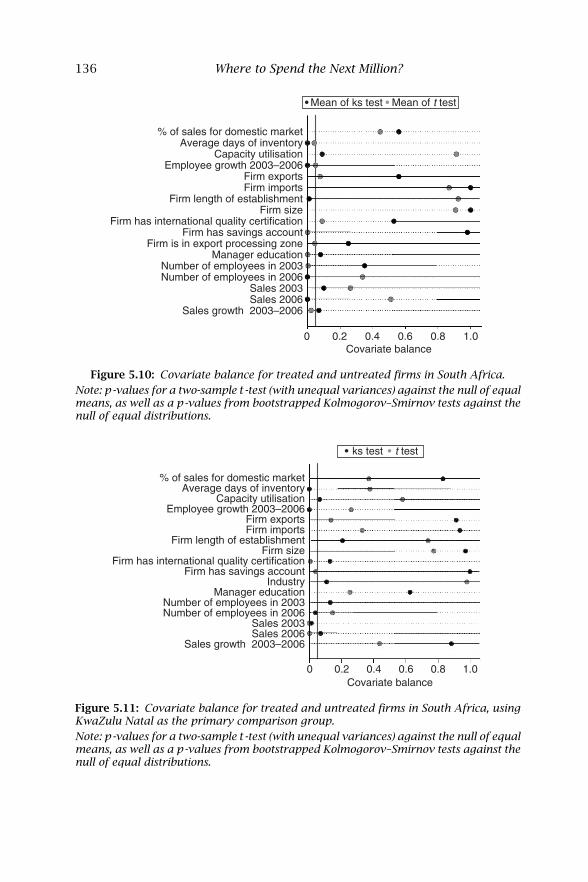
136 Where to Spend the Next Million?
0.2 0.4 0.6 0.8 1.00Covariate balance
% of sales for domestic marketAverage days of inventory
Capacity utilisationEmployee growth 2003–2006
Firm exports
Firm has savings accountFirm has international quality certification
Firm size
Firm is in export processing zoneManager education
Firm importsFirm length of establishment
Number of employees in 2003Number of employees in 2006
Sales 2003Sales 2006
Sales growth 2003–2006
Mean of ks test Mean of t test
Figure 5.10: Covariate balance for treated and untreated firms in South Africa.
Note: p-values for a two-sample t-test (with unequal variances) against the null of equalmeans, as well as a p-values from bootstrapped Kolmogorov–Smirnov tests against thenull of equal distributions.
0.2 0.4 0.6 0.8 1.00Covariate balance
% of sales for domestic marketAverage days of inventory
Capacity utilisationEmployee growth 2003–2006
Firm exports
Firm has savings accountFirm has international quality certification
Firm size
IndustryManager education
Firm importsFirm length of establishment
Number of employees in 2003Number of employees in 2006
Sales 2003Sales 2006
Sales growth 2003–2006
ks test t test
Figure 5.11: Covariate balance for treated and untreated firms in South Africa, usingKwaZulu Natal as the primary comparison group.
Note: p-values for a two-sample t-test (with unequal variances) against the null of equalmeans, as well as a p-values from bootstrapped Kolmogorov–Smirnov tests against thenull of equal distributions.
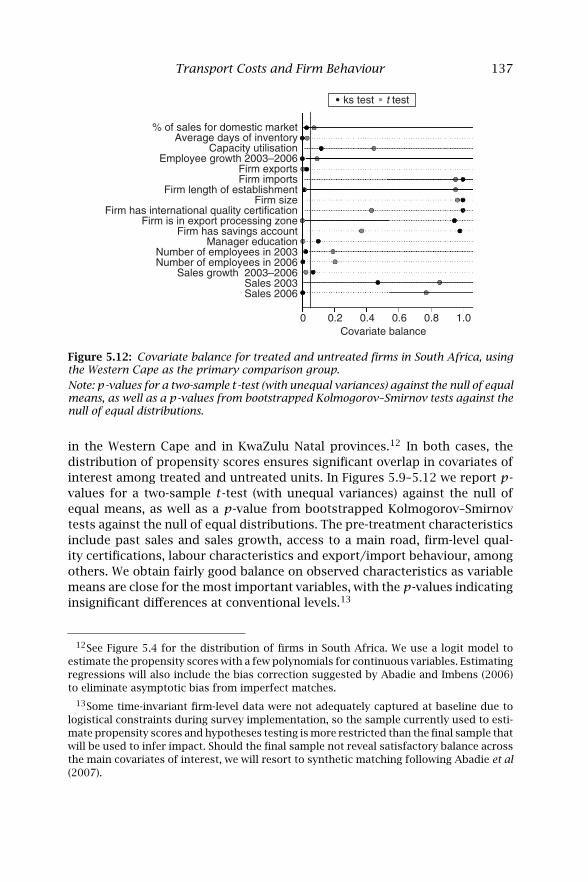
Transport Costs and Firm Behaviour 137
0.2 0.4 0.6 0.8 1.00Covariate balance
% of sales for domestic marketAverage days of inventory
Capacity utilisationEmployee growth 2003–2006
Firm exports
Firm is in export processing zoneFirm has savings account
Firm has international quality certificationFirm size
Manager education
Firm importsFirm length of establishment
Number of employees in 2003Number of employees in 2006
Sales 2003Sales 2006
Sales growth 2003–2006
ks test t test
Figure 5.12: Covariate balance for treated and untreated firms in South Africa, usingthe Western Cape as the primary comparison group.
Note: p-values for a two-sample t-test (with unequal variances) against the null of equalmeans, as well as a p-values from bootstrapped Kolmogorov–Smirnov tests against thenull of equal distributions.
in the Western Cape and in KwaZulu Natal provinces.12 In both cases, thedistribution of propensity scores ensures significant overlap in covariates ofinterest among treated and untreated units. In Figures 5.9–5.12 we report p-values for a two-sample t-test (with unequal variances) against the null ofequal means, as well as a p-value from bootstrapped Kolmogorov–Smirnovtests against the null of equal distributions. The pre-treatment characteristicsinclude past sales and sales growth, access to a main road, firm-level qual-ity certifications, labour characteristics and export/import behaviour, amongothers. We obtain fairly good balance on observed characteristics as variablemeans are close for the most important variables, with the p-values indicatinginsignificant differences at conventional levels.13
12See Figure 5.4 for the distribution of firms in South Africa. We use a logit model toestimate the propensity scores with a few polynomials for continuous variables. Estimatingregressions will also include the bias correction suggested by Abadie and Imbens (2006)to eliminate asymptotic bias from imperfect matches.
13Some time-invariant firm-level data were not adequately captured at baseline due tologistical constraints during survey implementation, so the sample currently used to esti-mate propensity scores and hypotheses testing is more restricted than the final sample thatwill be used to infer impact. Should the final sample not reveal satisfactory balance acrossthe main covariates of interest, we will resort to synthetic matching following Abadie et al(2007).
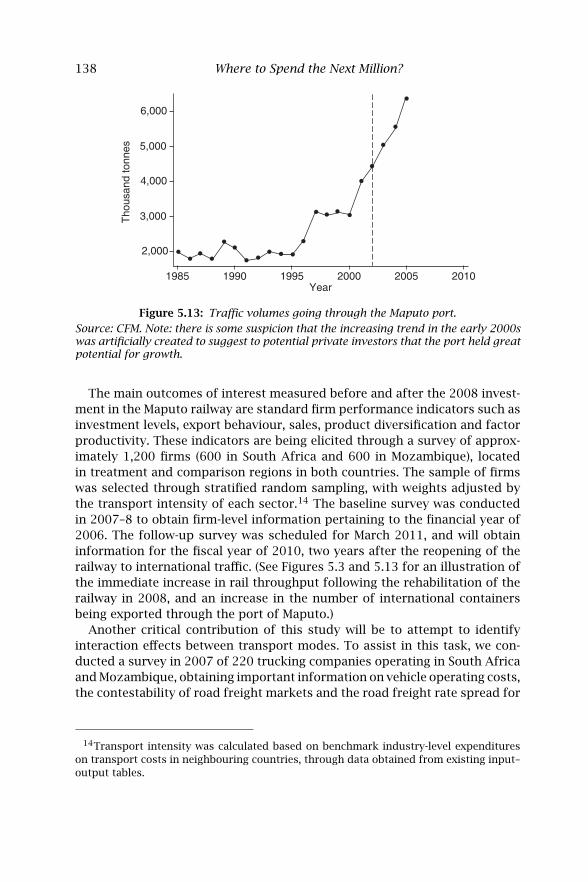
138 Where to Spend the Next Million?
6,000
5,000
4,000
3,000
2,000
Tho
usan
d to
nnes
1985 1990 1995 2000 2005 2010Year
Figure 5.13: Traffic volumes going through the Maputo port.
Source: CFM. Note: there is some suspicion that the increasing trend in the early 2000swas artificially created to suggest to potential private investors that the port held greatpotential for growth.
The main outcomes of interest measured before and after the 2008 invest-ment in the Maputo railway are standard firm performance indicators such asinvestment levels, export behaviour, sales, product diversification and factorproductivity. These indicators are being elicited through a survey of approx-imately 1,200 firms (600 in South Africa and 600 in Mozambique), locatedin treatment and comparison regions in both countries. The sample of firmswas selected through stratified random sampling, with weights adjusted bythe transport intensity of each sector.14 The baseline survey was conductedin 2007–8 to obtain firm-level information pertaining to the financial year of2006. The follow-up survey was scheduled for March 2011, and will obtaininformation for the fiscal year of 2010, two years after the reopening of therailway to international traffic. (See Figures 5.3 and 5.13 for an illustration ofthe immediate increase in rail throughput following the rehabilitation of therailway in 2008, and an increase in the number of international containersbeing exported through the port of Maputo.)
Another critical contribution of this study will be to attempt to identifyinteraction effects between transport modes. To assist in this task, we con-ducted a survey in 2007 of 220 trucking companies operating in South Africaand Mozambique, obtaining important information on vehicle operating costs,the contestability of road freight markets and the road freight rate spread for
14Transport intensity was calculated based on benchmark industry-level expenditureson transport costs in neighbouring countries, through data obtained from existing input–output tables.
Transport Costs and Firm Behaviour 139
different types of cargo.15 A follow-up survey will be conducted in March2011 to identify changes in trucking markets correlated with investments inthe railway. This survey can provide further evidence on cross-price elastici-ties between road and rail transport. Unlike previous studies that extrapolatetransport rates and costs based on small samples of shippers, this data setprovides a more accurate and representative picture of the region’s truckingindustry.
To provide a fuller account of spillover and network effects, trucking datawill be supplemented with road traffic data obtained from the South Africanand Mozambican road agencies. One important consideration is that theimpact of improvements in railway access to the port can reach beyond thefirms that use the railway due to network effects. The high volumes of cargobrought to the port by the railways can boost port throughput above the crit-ical threshold that attracts ship calls and justifies regular dredging to accom-modate larger and more frequent vessels. This can reduce overall shippingcosts for any firm using the port, blurring the distinction between firms thatbenefit directly from the railways by using it, and firms that benefit from therailways due to spillover and network effects.
While this study will be unable to fully distinguish between these twoeffects, we hope to provide evidence of the relative impact of each. We will doso by observing firms’ shipping decisions, their choice of transport mode andthe transport costs they face, before and after the investments in the railwaytake place. To the best of our knowledge, this is the first study to exploit aquasi-experiment to estimate spillover and network effects across transportmodes, using primary data collected at the level of the firm.
3 THE IMPACT OF SOFT TRANSPORT INFRASTRUCTURE ON FIRMS
Soft transport infrastructure can be defined as the network of transportbureaucracies and rules regulating the movement of goods within andacross borders. One of the main challenges of conducting impact evalua-tions on soft transport infrastructure is the difficulty in identifying exoge-nous sources of variation in exposure to a given rule, regulation or transportbureaucracy.
A recent research project described in detail in Sequeira and Djankov (2010)attempts to assess the impact of the functioning of port bureaucracies onfirms. The authors look at the specific context of corruption in ports andhow it affects firm behaviour. The focus on corruption is motivated by the
15All interviews were conducted face to face, in situ; 80% of the respondents were selectedby stratified random sampling of formal trucking companies, and 20% of the respondentswere randomly sampled in the field, in areas where trucks tend to concentrate, such asthe entrances of ports and lorry parks.
140 Where to Spend the Next Million?
seemingly negative correlation between the capacity for a country to controlcorruption in public bureaucracies and the cost of trade, as illustrated byFigure 5.14.16
The setting for this project is identical to that described in Section 2. Priorto the rebuilding of the Maputo railway, the privatisation and rehabilitationof the port of Maputo in 2004 provided a set of South African firms with thechoice between two equidistant ports: Maputo and Durban.17 Since 2004, thebarriers for freight transit along the transnational corridor connecting SouthAfrica to the port of Maputo have been significantly reduced.18
Sequeira and Djankov (2010) began by generating a unique data set ondirectly observed bribe payments to port bureaucracies for a random sam-ple of 1,300 shipments, and concluded that bribes were set according to thetype of product being shipped. To assess the economic costs of corruptionthe authors then observed how bribe schedules at each port distorted twoimportant margins of firm-level decision-making: the choice of port and thedecision to source inputs domestically or internationally. The key identifyingassumption to observe a causal effect between corruption and firm behaviouris that the location of firms and the type of product they ship are arguablyexogenous to the level of corruption at the port of Maputo. The sample offirms under study is restricted to those that began operations in a given sectorbefore 2002 to mitigate the problem of endogenous firm location and productchoice, given that the port of Maputo only became a viable option for SouthAfrican firms when it re-opened to international traffic in 2004. Figure 5.13
16Ports offer a rich setting for studying corruption, as they represent an administrativemonopoly with limited institutional accountability. Clark et al (2004) rely on indirect mea-sures of bribes to argue that corruption is an important source of port inefficiency, andYang (2008a) provides evidence on how corruption in ports is hard to displace. Accordingto the World Bank Enterprise Survey of 2008, in Mozambique alone, over 50% of firmsreported having to pay bribes to transport bureaucracies at ports in 2007.
17Given its strategic location, the port of Maputo has historically been considered a crit-ical part of South Africa’s transport network. The port suffered great losses during theMozambican civil war in the 1980s and 1990s, and reopened to international traffic in 2004under private management. Today, and together with Durban, the port of Maputo servesas the primary transportation route to the sea for the booming South African provinces ofMpumalanga, Gauteng and Kwazulu Natal. There is a third port in the region, the port ofRichards Bay, which is located approximately halfway between Durban and Maputo alongSouth Africa’s eastern seaboard. This port was developed in the late 1970s to serve a selectgroup of private shareholders and is primarily used by large mining conglomerates to shipbulk cargo. Given the restricted access to this port, it is not considered a substitute foreither Durban or Maputo for the type of firms covered in the study.
18For example, there are no visa requirements for truck drivers from either country tooperate along the transnational Maputo corridor.
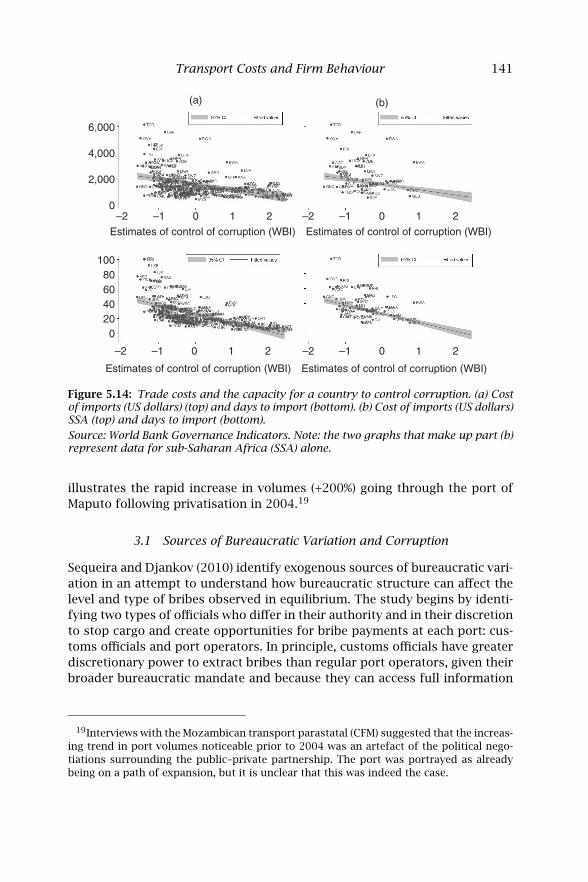
Transport Costs and Firm Behaviour 141
–2 –1 0 1 2 –2 –1 0 1 2
–2 –1 0 1 2–2 –1 0 1 2
Estimates of control of corruption (WBI) Estimates of control of corruption (WBI)
Estimates of control of corruption (WBI) Estimates of control of corruption (WBI)
(a) (b)
0
2,000
4,000
6,000
0
604020
80100
Figure 5.14: Trade costs and the capacity for a country to control corruption. (a) Costof imports (US dollars) (top) and days to import (bottom). (b) Cost of imports (US dollars)SSA (top) and days to import (bottom).
Source: World Bank Governance Indicators. Note: the two graphs that make up part (b)represent data for sub-Saharan Africa (SSA) alone.
illustrates the rapid increase in volumes (+200%) going through the port ofMaputo following privatisation in 2004.19
3.1 Sources of Bureaucratic Variation and Corruption
Sequeira and Djankov (2010) identify exogenous sources of bureaucratic vari-ation in an attempt to understand how bureaucratic structure can affect thelevel and type of bribes observed in equilibrium. The study begins by identi-fying two types of officials who differ in their authority and in their discretionto stop cargo and create opportunities for bribe payments at each port: cus-toms officials and port operators. In principle, customs officials have greaterdiscretionary power to extract bribes than regular port operators, given theirbroader bureaucratic mandate and because they can access full information
19Interviews with the Mozambican transport parastatal (CFM) suggested that the increas-ing trend in port volumes noticeable prior to 2004 was an artefact of the political nego-tiations surrounding the public–private partnership. The port was portrayed as alreadybeing on a path of expansion, but it is unclear that this was indeed the case.
142 Where to Spend the Next Million?
on each shipment and each shipper at all times.20 Regular port operators,on the other hand, have a narrower mandate to move or protect cargo onthe docks, and they lack access to the shipment’s documentation specifyingthe value of the cargo, the client firm and its origin/destination, among othervaluable information.21
The port bureaucracies of Maputo and Durban differed in two importantorganisational features that determined which of the two types of port offi-cials described above had more opportunities for bribe extraction: the highextractive types—customs agents—or the low extractive types—port opera-tors. These differences were driven by the degree of interaction between clear-ing agents and customs officials, and by the type of management overseeingport operations. In Durban, the level of direct interaction between clearingagents and customs’ agents was kept to a minimum since all clearance docu-mentation was processed online. In contrast, the level of interaction in Maputowas high since all clearance documentation was submitted in-person by theclearing agent.22 The close interaction between clearing agents and customsofficials created more opportunities for corrupt behaviour to emerge in cus-toms in Maputo relative to Durban.
In Maputo, port operators were privately managed, but in Durban this wasonly the case for bulk cargo terminals, since container terminals were stillunder public control. Private management in Maputo and in the bulk terminalsin Durban was associated with fewer opportunities for bribe payments dueto better monitoring strategies and stricter punishment practices.23 Theseorganisational features determined that the high extractive types in customshad more opportunities to extract bribes in Maputo, while the low extractivetypes in port operations had more opportunities to extract bribes in Durban.
20Customs officials possess discretionary power to single-handedly decide which cargoto stop and whether to reassess the classification of goods for tariff purposes or to validateprices. They can also threaten to conduct a physical inspection of the shipment, which candelay clearance for up to four days, or arbitrarily request additional documentation fromthe shipper.
21In the sample of 1,300 shipments observed in this study, bribes were paid to differenttypes of port officials: agents in charge of adjusting reefer temperatures for refrigeratedcargo stationed at the port; port gate officials who determine the acceptance of late cargoarrivals; stevedores who auction off forklifts and equipment on the docks; document clerkswho stamp import, export and transit documentation for submission to customs; portsecurity who oversee high-value cargo vulnerable to theft; shipping planners who auctionoff priority slots in shipping vessels; and scanner agents who move cargo through non-intrusive scanning technology (Sequeira and Djankov 2010).
22The level of red tape was, however, similar in both countries. South Africa and Mozam-bique require the same number of documents to process the clearing of goods throughtheir ports (World Bank 2007).
23Interviews with SAPO, Portnet, SARS, Customs and the Maputo Port Development Cor-poration (2006, 2007).
Transport Costs and Firm Behaviour 143
A second important difference between the two port bureaucracies was thatofficials with opportunities to extract bribes differed in their time horizons. Aspart of a comprehensive reform programme triggered by the merging of theCustoms Agency and the Tax Authority in 2006, customs in Maputo adopteda policy of frequently rotating agents across different terminals and ports.While customs officials in Maputo could be in a post for as little as six weeks,port operators in Durban had extended time horizons given the stable supportreceived from dock workers’ unions.24 Sequeira and Djankov (2010) predictthat the higher extractive types with the shortest time horizons—customs’officials in Maputo—would extract higher and more frequent bribes (Cam-pante et al 2009).
An important identifying assumption is that differences in the organisa-tional structure of each port bureaucracy—private versus public managementand the level of technological investment—were not determined by the levelof corruption at each port. In South Africa, dock workers’ unions spearheadeda long and successful fight against the privatisation of port operations, par-ticularly for container terminals. The political strength of the organisation isdeeply rooted in the historical role played in the struggle against apartheid,which culminated in the active participation of labour unions in the tripar-tite political alliance that gave birth to the first post-apartheid government inSouth Africa.25
Bulk terminals in Durban are owned and managed by large mining conglom-erates that successfully negotiated control over their own transport chainswith government. The economic strength of mining groups goes back to the1950s and 1960s, when the mass export of minerals funded South Africa’sImport-Substitution Industrialization (ISI) model of development. In the 1980sand 1990s, as South Africa struggled under the weight of economic sanctions,the export of coal and iron ore became once more the primary sources offoreign exchange, and the largest contributors to GDP. As a result of theireconomic importance across time, private groups were able to develop andmanage all bulk terminals in South Africa’s ports to this day (Feinstein 2005).
As the African National Congress (ANC) secured its grip on power in thelate 1990s, the party began to drift away from its earlier links to the labourmovement. South Africa’s new leadership revealed a more technocratic bent,becoming increasingly concerned with the macro-fundamentals of the econ-omy and sparring frequently with trade unions over economic policy. Newbusiness groups clamoured for the privatisation of port operations, with the
24Information obtained through interviews with the Customs Agency in Maputo, themanagement of port operations in Durban (SAPO), and South African Transport and AlliedWorkers Union (SATAWU), the transport union in Durban.
25SATAWU enlists 82,000 members and is affiliated with the Congress of South AfricanTrade Unions (COSATU). COSATU is an active member in the tripartite political alliancewith the ANC and the Communist Party currently in power. It derives its power from thecapacity to mobilise large masses for electoral turnout (Feinstein 2005).
144 Where to Spend the Next Million?
dual goal of increasing the productivity and reducing the cost of port services.There was a clear understanding that the transport needs of the emergingmanufacturing sector diverged from those of mining and farming, which haddictated past developments in transport policy.
But the privatisation of port operations presented the executive with severalpolitical and financial challenges. For one, ports represented the most prof-itable branch of the transport parastatal’s business. In addition, revenue fromport activities in South Africa was locked into a complex cross-subsidisationscheme to support costly railway operations and a large pension scheme forits workers, which was inherited from the apartheid days.26 The privatisa-tion of ports would challenge this fine balance, while creating unsustainableuproar in one of the ANC’s most powerful bases of popular support. Finally,the port of Durban is nestled in KwaZulu Natal (KZN) province, long a bas-tion of the opposition party (Inkatha Freedom, IFP) and increasingly a swingprovince in post-2000s election cycles. The privatisation of the port of Durbanwould therefore have carried high political risk of costly conflict with labour,just when the ANC sought to gain political control over the region (Gumede2005).
In Mozambique the capital requirements to reverse the derelict state ofthe country’s port infrastructure forced the government to resort to conces-sional lending and to agree to the privatisation of port services. The 1980sand 1990s brought fast-paced technological change driven by containerisa-tion, which significantly altered the production function of ports. Stevedores,who in the past were called upon to coordinate complex processes of loadingand offloading on the docks, became increasingly less important for harbouroperations. New capital-intensive investments required instead a flexible andsmall labour force. While in Durban the strength of dock worker unions hadavoided retrenchments and privatisation, in Maputo there was no traditionof unionised dock workers.27 As a result, the port of Durban has kept con-tainer terminals under public management but bulk terminals under privatemanagement, while the port of Maputo has been entirely under private man-agement.
3.2 Primary Data Collection
This section describes in more detail the empirical setting and the nature ofthe shipment process in South Africa and in Mozambique. By law, no firm ineither country is allowed to interact directly with customs or port operators.Instead, firms have to resort to clearing agents, who specialise in clearing
26Information obtained through interviews with Portnet and Transnet, South Africa.27In the late 1990s, an attempt was made to privatise the Mozambican customs’ agency in
partnership with the British Crown Agents. The partnership ended in 1998, and consistedmostly of a series of nominal reforms and technological upgrades for data management(Interview with Alfandegas de Mocambique 2007).
Transport Costs and Firm Behaviour 145
cargo through the port or border post, mostly through ad hoc, shipment-based contracts. The market for clearing agents is moderately competitivefollowing the deregulation of the trade in the 1980s in South Africa and inthe 1990s in Mozambique. In the sample tracked by Sequeira and Djankov(2010), 80% of firms engaged in direct contracts with clearing agents, 65% ofwhich were for a one-time shipment. Clearing agents play a pivotal role, asthey make all bribe payments to port officials on behalf of client firms.
Sequeira and Djankov (2010) relied on three main sources of primary data.The first source of data was a tracking study designed and implemented bythe International Finance Corporation (IFC) in the ports of Maputo and Dur-ban, and in the border post between South Africa and Mozambique. The IFChired well-established clearing agents to track all bribe payments to officials ina random sample of 1,300 shipments between March 2007 and July 2008.28
Clearing agents agreed to record detailed information on the date, time ofarrival and clearance of each shipment as well as on expected storage costsat the port, the size of the client firm and a wide range of cargo characteris-tics (size, value and product type). They also noted the primary recipients ofbribes, the bribe amounts requested and the reason for a bribe, ranging fromthe need to jump a long queue of trucks to get into the port to evading tar-iffs or missing important clearance documentation. For a random subset ofshipments, the IFC hired local observers who accompanied clearing agentsthroughout the clearing process to verify the accuracy of the data. Theseobservers began shadowing clearing agents several weeks before the track-ing study took place in order to become familiar with all clearing procedures.To avoid any suspicion, the observers were similar in age and appearance toany other clerk who normally assists clearing agents in their interactions withport officials. There was no significant difference between the data reportedwith and without the observer present. Data from this tracking study pro-vided a clear measurement of expected bribes at each port for different typesof shippers and different types of shipments.
The second source of data was an enterprise survey conducted by theauthors in 2007 covering 250 firms located in the overlapping hinterlandof the ports of Durban and Maputo that elicited firms’ responses to bribeschedules at each port. The survey also collected information on firms’ per-ceptions of the quality of each port, their shipping strategies, and on thecharacteristics of their average shipments, such as frequency, size and degreeof urgency proxied by measures of deviation from sector-level firm invento-ries. The sample was stratified by firm size and industry, covering a rangeof both transport-intensive and non-transport-intensive firms. The data werethen used to identify firms’ choices of transport corridor and port, given their
28The sample size was restricted to eight clearing agents, given the illicit nature of thebribe payments and the IFC’s concern with ensuring discretion in the data collection tomaximise its accuracy. More details are available in Sequeira and Djankov (2010).
146 Where to Spend the Next Million?
location, the urgency of their shipments and the characteristics of their cargothat would make them more or less vulnerable to corruption.
The third source of data was a trucking survey, covering a random sampleof 220 trucking companies operating in both the Maputo and Durban cor-ridors, that the authors conducted in order to accurately measure overlandtransport costs in the region. As described in Section 2, this survey eliciteddetailed information on vehicle operating costs, including maintenance andfuel costs, average transit times on each corridor and transport rates chargedto firms.29 The study also collected a range of fees associated with the move-ment of goods to enable an accurate calculation of road transport costs indifferent transport corridors. These data enabled a more precise calculationof transport costs at the firm level.
3.3 Efficiency Costs of Corruption
Sequeira and Djankov (2010) argue that the efficiency costs of corruption willdepend on the structure of the market for bribes, the type of corruption offi-cials engage in and whether and how public officials price discriminate whensetting bribes. Motivated by the literature on market structure and corruption,Sequeira and Djankov (2010) predict that the costs corruption imposes onusers of public services depend on the type of competition port bureaucraciesengage in, and on how front-line officials set bribes. For one, corruption in portbureaucracies can have limited efficiency costs when bureaucrats engage inperfect competition or perfect collusion (Shleifer and Vishny 1993). Whetherthe conditions for perfect competition or perfect collusion hold depends onthe way bureaucracies are organised.
As shown in Table 5.1, the bribe data collected in Sequeira and Djankov(2010) did not support the perfect-competition hypothesis, in which bribeswere competed to zero across ports, or the hypothesis that port bureaucra-cies were able to collude when setting bribes. This non-cooperative outcomein bribe-setting across bureaucracies is likely to be the result of high coordi-nation and communication costs between different levels of bureaucrats indifferent countries, and the fact that price-cutting and any deviation from‘joint monopolist’ prices would not be credible in the face of capacity con-straints that would prevent a single port from serving the entire market.
More importantly, due to the way in which each port bureaucracy was organ-ised, public officials involved in corruption at each port differed in their dis-count rates. Customs officials in Maputo had high discount rates, while portoperators in Durban had low discount rates, implying that deviations from the‘joint monopolist’ bribe level would not be internalised in the same way bythe different bureaucrats. Bribe levels in each port were instead determined by
29These data were validated through ‘mystery client’ exercises through which over 75transport firms were contacted with a request for specific rates for a standard shipmentof goods to and from each port.
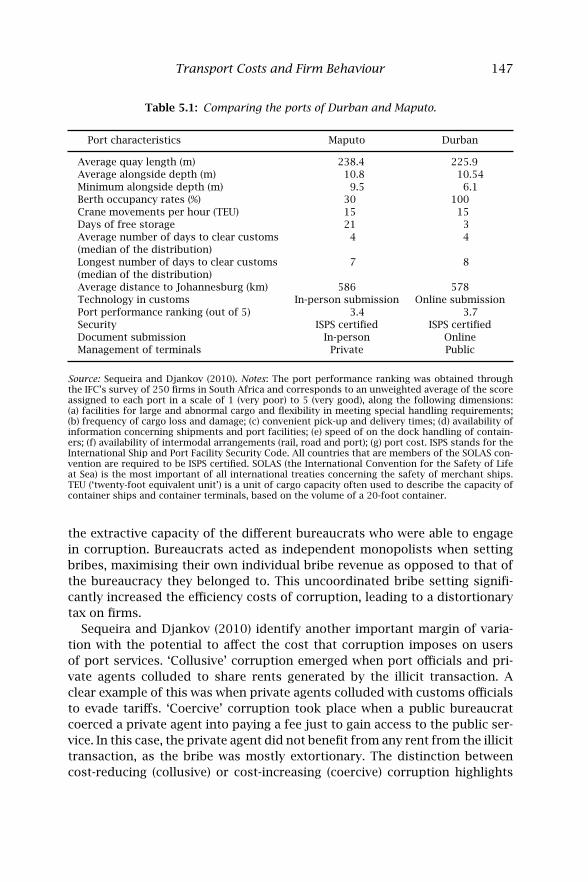
Transport Costs and Firm Behaviour 147
Table 5.1: Comparing the ports of Durban and Maputo.
Port characteristics Maputo Durban
Average quay length (m) 238.4 225.9Average alongside depth (m) 10.8 10.54Minimum alongside depth (m) 9.5 6.1Berth occupancy rates (%) 30 100Crane movements per hour (TEU) 15 15Days of free storage 21 3Average number of days to clear customs 4 4(median of the distribution)Longest number of days to clear customs 7 8(median of the distribution)Average distance to Johannesburg (km) 586 578Technology in customs In-person submission Online submissionPort performance ranking (out of 5) 3.4 3.7Security ISPS certified ISPS certifiedDocument submission In-person OnlineManagement of terminals Private Public
Source: Sequeira and Djankov (2010). Notes: The port performance ranking was obtained throughthe IFC’s survey of 250 firms in South Africa and corresponds to an unweighted average of the scoreassigned to each port in a scale of 1 (very poor) to 5 (very good), along the following dimensions:(a) facilities for large and abnormal cargo and flexibility in meeting special handling requirements;(b) frequency of cargo loss and damage; (c) convenient pick-up and delivery times; (d) availability ofinformation concerning shipments and port facilities; (e) speed of on the dock handling of contain-ers; (f) availability of intermodal arrangements (rail, road and port); (g) port cost. ISPS stands for theInternational Ship and Port Facility Security Code. All countries that are members of the SOLAS con-vention are required to be ISPS certified. SOLAS (the International Convention for the Safety of Lifeat Sea) is the most important of all international treaties concerning the safety of merchant ships.TEU (‘twenty-foot equivalent unit’) is a unit of cargo capacity often used to describe the capacity ofcontainer ships and container terminals, based on the volume of a 20-foot container.
the extractive capacity of the different bureaucrats who were able to engagein corruption. Bureaucrats acted as independent monopolists when settingbribes, maximising their own individual bribe revenue as opposed to that ofthe bureaucracy they belonged to. This uncoordinated bribe setting signifi-cantly increased the efficiency costs of corruption, leading to a distortionarytax on firms.
Sequeira and Djankov (2010) identify another important margin of varia-tion with the potential to affect the cost that corruption imposes on usersof port services. ‘Collusive’ corruption emerged when port officials and pri-vate agents colluded to share rents generated by the illicit transaction. Aclear example of this was when private agents colluded with customs officialsto evade tariffs. ‘Coercive’ corruption took place when a public bureaucratcoerced a private agent into paying a fee just to gain access to the public ser-vice. In this case, the private agent did not benefit from any rent from the illicittransaction, as the bribe was mostly extortionary. The distinction betweencost-reducing (collusive) or cost-increasing (coercive) corruption highlights
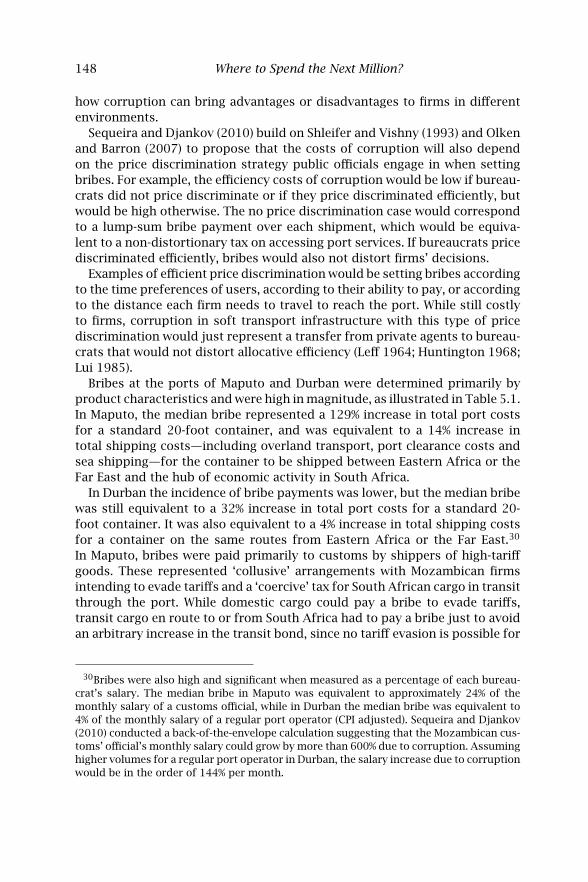
148 Where to Spend the Next Million?
how corruption can bring advantages or disadvantages to firms in differentenvironments.
Sequeira and Djankov (2010) build on Shleifer and Vishny (1993) and Olkenand Barron (2007) to propose that the costs of corruption will also dependon the price discrimination strategy public officials engage in when settingbribes. For example, the efficiency costs of corruption would be low if bureau-crats did not price discriminate or if they price discriminated efficiently, butwould be high otherwise. The no price discrimination case would correspondto a lump-sum bribe payment over each shipment, which would be equiva-lent to a non-distortionary tax on accessing port services. If bureaucrats pricediscriminated efficiently, bribes would also not distort firms’ decisions.
Examples of efficient price discrimination would be setting bribes accordingto the time preferences of users, according to their ability to pay, or accordingto the distance each firm needs to travel to reach the port. While still costlyto firms, corruption in soft transport infrastructure with this type of pricediscrimination would just represent a transfer from private agents to bureau-crats that would not distort allocative efficiency (Leff 1964; Huntington 1968;Lui 1985).
Bribes at the ports of Maputo and Durban were determined primarily byproduct characteristics and were high in magnitude, as illustrated in Table 5.1.In Maputo, the median bribe represented a 129% increase in total port costsfor a standard 20-foot container, and was equivalent to a 14% increase intotal shipping costs—including overland transport, port clearance costs andsea shipping—for the container to be shipped between Eastern Africa or theFar East and the hub of economic activity in South Africa.
In Durban the incidence of bribe payments was lower, but the median bribewas still equivalent to a 32% increase in total port costs for a standard 20-foot container. It was also equivalent to a 4% increase in total shipping costsfor a container on the same routes from Eastern Africa or the Far East.30
In Maputo, bribes were paid primarily to customs by shippers of high-tariffgoods. These represented ‘collusive’ arrangements with Mozambican firmsintending to evade tariffs and a ‘coercive’ tax for South African cargo in transitthrough the port. While domestic cargo could pay a bribe to evade tariffs,transit cargo en route to or from South Africa had to pay a bribe just to avoidan arbitrary increase in the transit bond, since no tariff evasion is possible for
30Bribes were also high and significant when measured as a percentage of each bureau-crat’s salary. The median bribe in Maputo was equivalent to approximately 24% of themonthly salary of a customs official, while in Durban the median bribe was equivalent to4% of the monthly salary of a regular port operator (CPI adjusted). Sequeira and Djankov(2010) conducted a back-of-the-envelope calculation suggesting that the Mozambican cus-toms’ official’s monthly salary could grow by more than 600% due to corruption. Assuminghigher volumes for a regular port operator in Durban, the salary increase due to corruptionwould be in the order of 144% per month.
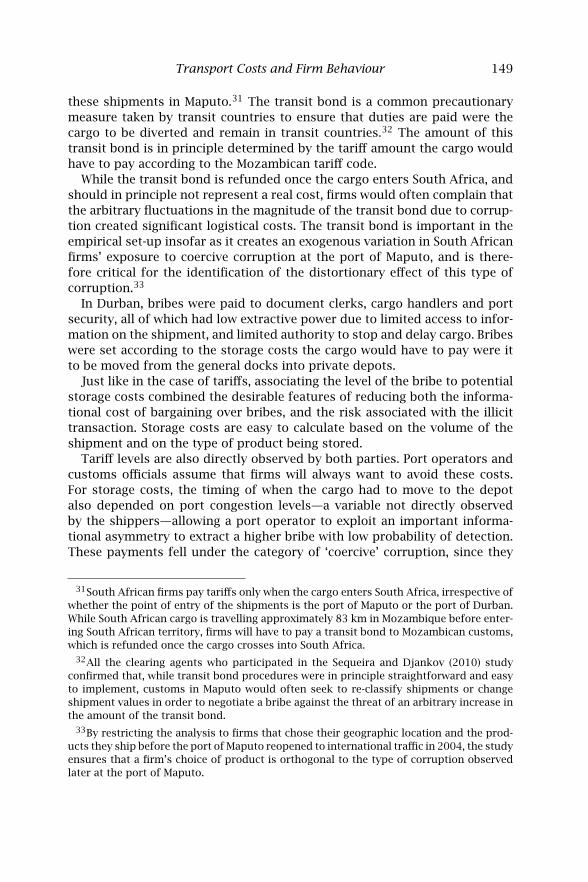
Transport Costs and Firm Behaviour 149
these shipments in Maputo.31 The transit bond is a common precautionarymeasure taken by transit countries to ensure that duties are paid were thecargo to be diverted and remain in transit countries.32 The amount of thistransit bond is in principle determined by the tariff amount the cargo wouldhave to pay according to the Mozambican tariff code.
While the transit bond is refunded once the cargo enters South Africa, andshould in principle not represent a real cost, firms would often complain thatthe arbitrary fluctuations in the magnitude of the transit bond due to corrup-tion created significant logistical costs. The transit bond is important in theempirical set-up insofar as it creates an exogenous variation in South Africanfirms’ exposure to coercive corruption at the port of Maputo, and is there-fore critical for the identification of the distortionary effect of this type ofcorruption.33
In Durban, bribes were paid to document clerks, cargo handlers and portsecurity, all of which had low extractive power due to limited access to infor-mation on the shipment, and limited authority to stop and delay cargo. Bribeswere set according to the storage costs the cargo would have to pay were itto be moved from the general docks into private depots.
Just like in the case of tariffs, associating the level of the bribe to potentialstorage costs combined the desirable features of reducing both the informa-tional cost of bargaining over bribes, and the risk associated with the illicittransaction. Storage costs are easy to calculate based on the volume of theshipment and on the type of product being stored.
Tariff levels are also directly observed by both parties. Port operators andcustoms officials assume that firms will always want to avoid these costs.For storage costs, the timing of when the cargo had to move to the depotalso depended on port congestion levels—a variable not directly observedby the shippers—allowing a port operator to exploit an important informa-tional asymmetry to extract a higher bribe with low probability of detection.These payments fell under the category of ‘coercive’ corruption, since they
31South African firms pay tariffs only when the cargo enters South Africa, irrespective ofwhether the point of entry of the shipments is the port of Maputo or the port of Durban.While South African cargo is travelling approximately 83 km in Mozambique before enter-ing South African territory, firms will have to pay a transit bond to Mozambican customs,which is refunded once the cargo crosses into South Africa.
32All the clearing agents who participated in the Sequeira and Djankov (2010) studyconfirmed that, while transit bond procedures were in principle straightforward and easyto implement, customs in Maputo would often seek to re-classify shipments or changeshipment values in order to negotiate a bribe against the threat of an arbitrary increase inthe amount of the transit bond.
33By restricting the analysis to firms that chose their geographic location and the prod-ucts they ship before the port of Maputo reopened to international traffic in 2004, the studyensures that a firm’s choice of product is orthogonal to the type of corruption observedlater at the port of Maputo.
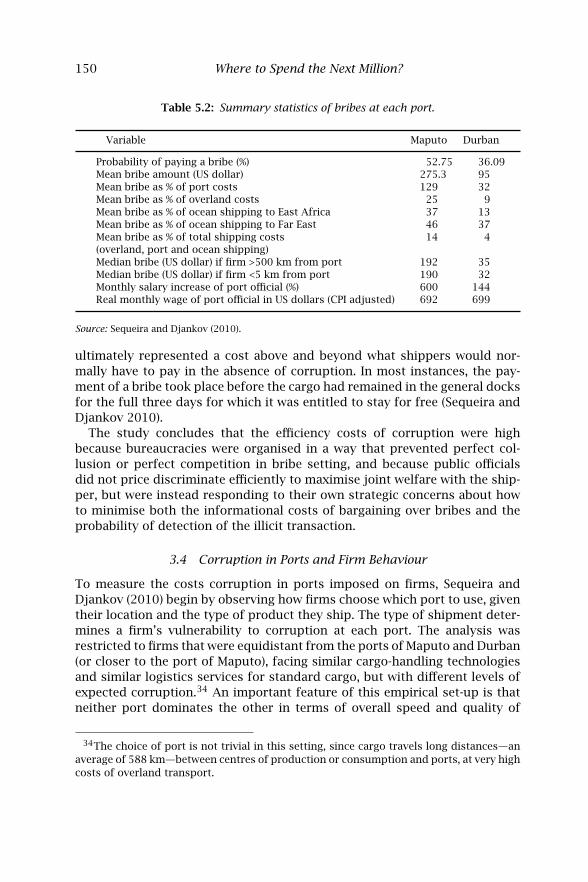
150 Where to Spend the Next Million?
Table 5.2: Summary statistics of bribes at each port.
Variable Maputo Durban
Probability of paying a bribe (%) 52.75 36.09Mean bribe amount (US dollar) 275.3 95Mean bribe as % of port costs 129 32Mean bribe as % of overland costs 25 9Mean bribe as % of ocean shipping to East Africa 37 13Mean bribe as % of ocean shipping to Far East 46 37Mean bribe as % of total shipping costs 14 4(overland, port and ocean shipping)Median bribe (US dollar) if firm >500 km from port 192 35Median bribe (US dollar) if firm <5 km from port 190 32Monthly salary increase of port official (%) 600 144Real monthly wage of port official in US dollars (CPI adjusted) 692 699
Source: Sequeira and Djankov (2010).
ultimately represented a cost above and beyond what shippers would nor-mally have to pay in the absence of corruption. In most instances, the pay-ment of a bribe took place before the cargo had remained in the general docksfor the full three days for which it was entitled to stay for free (Sequeira andDjankov 2010).
The study concludes that the efficiency costs of corruption were highbecause bureaucracies were organised in a way that prevented perfect col-lusion or perfect competition in bribe setting, and because public officialsdid not price discriminate efficiently to maximise joint welfare with the ship-per, but were instead responding to their own strategic concerns about howto minimise both the informational costs of bargaining over bribes and theprobability of detection of the illicit transaction.
3.4 Corruption in Ports and Firm Behaviour
To measure the costs corruption in ports imposed on firms, Sequeira andDjankov (2010) begin by observing how firms choose which port to use, giventheir location and the type of product they ship. The type of shipment deter-mines a firm’s vulnerability to corruption at each port. The analysis wasrestricted to firms that were equidistant from the ports of Maputo and Durban(or closer to the port of Maputo), facing similar cargo-handling technologiesand similar logistics services for standard cargo, but with different levels ofexpected corruption.34 An important feature of this empirical set-up is thatneither port dominates the other in terms of overall speed and quality of
34The choice of port is not trivial in this setting, since cargo travels long distances—anaverage of 588 km—between centres of production or consumption and ports, at very highcosts of overland transport.
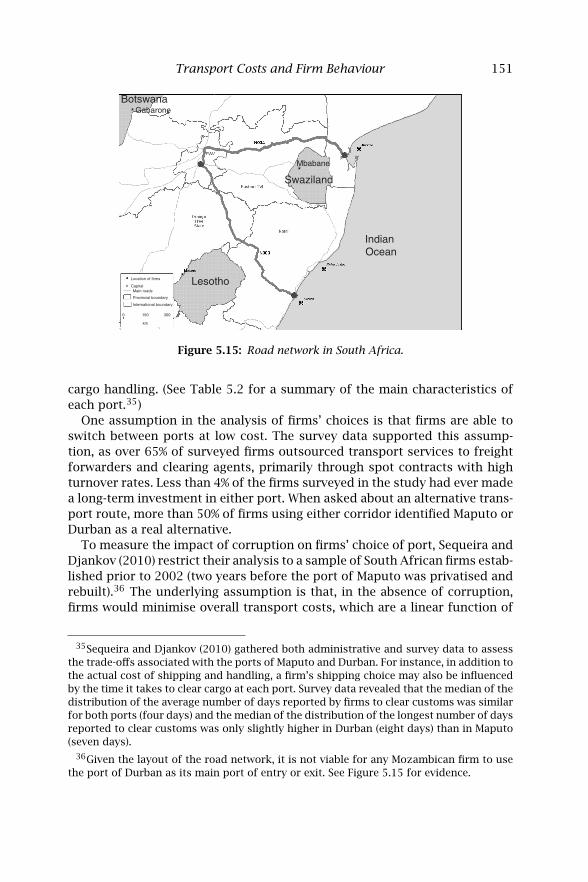
Transport Costs and Firm Behaviour 151
Location of firms
CapitalMain roads
Provincial boundary
International boundary
0 150 300
km
Indian Ocean
Lesotho
Swaziland
Mbabane
BotswanaGabarone
Figure 5.15: Road network in South Africa.
cargo handling. (See Table 5.2 for a summary of the main characteristics ofeach port.35)
One assumption in the analysis of firms’ choices is that firms are able toswitch between ports at low cost. The survey data supported this assump-tion, as over 65% of surveyed firms outsourced transport services to freightforwarders and clearing agents, primarily through spot contracts with highturnover rates. Less than 4% of the firms surveyed in the study had ever madea long-term investment in either port. When asked about an alternative trans-port route, more than 50% of firms using either corridor identified Maputo orDurban as a real alternative.
To measure the impact of corruption on firms’ choice of port, Sequeira andDjankov (2010) restrict their analysis to a sample of South African firms estab-lished prior to 2002 (two years before the port of Maputo was privatised andrebuilt).36 The underlying assumption is that, in the absence of corruption,firms would minimise overall transport costs, which are a linear function of
35Sequeira and Djankov (2010) gathered both administrative and survey data to assessthe trade-offs associated with the ports of Maputo and Durban. For instance, in addition tothe actual cost of shipping and handling, a firm’s shipping choice may also be influencedby the time it takes to clear cargo at each port. Survey data revealed that the median of thedistribution of the average number of days reported by firms to clear customs was similarfor both ports (four days) and the median of the distribution of the longest number of daysreported to clear customs was only slightly higher in Durban (eight days) than in Maputo(seven days).
36Given the layout of the road network, it is not viable for any Mozambican firm to usethe port of Durban as its main port of entry or exit. See Figure 5.15 for evidence.
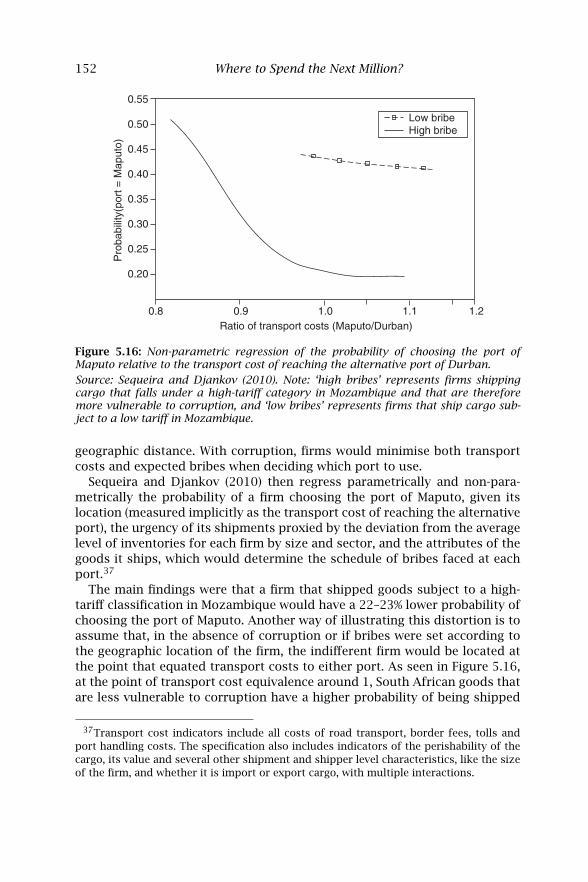
152 Where to Spend the Next Million?
0.20
0.25
0.30
0.35
0.40
0.45
0.50
0.55
0.8 0.9 1.0 1.1 1.2Ratio of transport costs (Maputo/Durban)
Pro
babi
lity(
port
= M
aput
o)Low bribeHigh bribe
Figure 5.16: Non-parametric regression of the probability of choosing the port ofMaputo relative to the transport cost of reaching the alternative port of Durban.
Source: Sequeira and Djankov (2010). Note: ‘high bribes’ represents firms shippingcargo that falls under a high-tariff category in Mozambique and that are thereforemore vulnerable to corruption, and ‘low bribes’ represents firms that ship cargo sub-ject to a low tariff in Mozambique.
geographic distance. With corruption, firms would minimise both transportcosts and expected bribes when deciding which port to use.
Sequeira and Djankov (2010) then regress parametrically and non-para-metrically the probability of a firm choosing the port of Maputo, given itslocation (measured implicitly as the transport cost of reaching the alternativeport), the urgency of its shipments proxied by the deviation from the averagelevel of inventories for each firm by size and sector, and the attributes of thegoods it ships, which would determine the schedule of bribes faced at eachport.37
The main findings were that a firm that shipped goods subject to a high-tariff classification in Mozambique would have a 22–23% lower probability ofchoosing the port of Maputo. Another way of illustrating this distortion is toassume that, in the absence of corruption or if bribes were set according tothe geographic location of the firm, the indifferent firm would be located atthe point that equated transport costs to either port. As seen in Figure 5.16,at the point of transport cost equivalence around 1, South African goods thatare less vulnerable to corruption have a higher probability of being shipped
37Transport cost indicators include all costs of road transport, border fees, tolls andport handling costs. The specification also includes indicators of the perishability of thecargo, its value and several other shipment and shipper level characteristics, like the sizeof the firm, and whether it is import or export cargo, with multiple interactions.
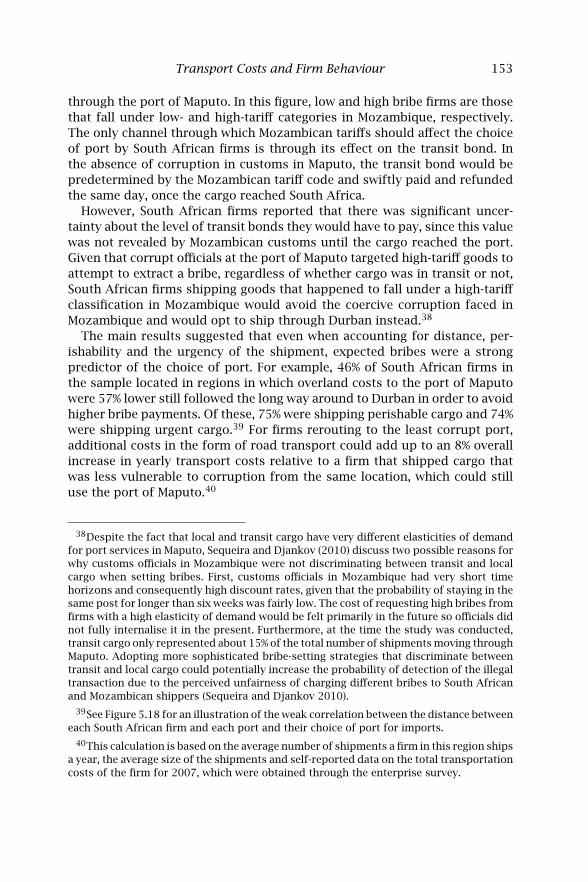
Transport Costs and Firm Behaviour 153
through the port of Maputo. In this figure, low and high bribe firms are thosethat fall under low- and high-tariff categories in Mozambique, respectively.The only channel through which Mozambican tariffs should affect the choiceof port by South African firms is through its effect on the transit bond. Inthe absence of corruption in customs in Maputo, the transit bond would bepredetermined by the Mozambican tariff code and swiftly paid and refundedthe same day, once the cargo reached South Africa.
However, South African firms reported that there was significant uncer-tainty about the level of transit bonds they would have to pay, since this valuewas not revealed by Mozambican customs until the cargo reached the port.Given that corrupt officials at the port of Maputo targeted high-tariff goods toattempt to extract a bribe, regardless of whether cargo was in transit or not,South African firms shipping goods that happened to fall under a high-tariffclassification in Mozambique would avoid the coercive corruption faced inMozambique and would opt to ship through Durban instead.38
The main results suggested that even when accounting for distance, per-ishability and the urgency of the shipment, expected bribes were a strongpredictor of the choice of port. For example, 46% of South African firms inthe sample located in regions in which overland costs to the port of Maputowere 57% lower still followed the long way around to Durban in order to avoidhigher bribe payments. Of these, 75% were shipping perishable cargo and 74%were shipping urgent cargo.39 For firms rerouting to the least corrupt port,additional costs in the form of road transport could add up to an 8% overallincrease in yearly transport costs relative to a firm that shipped cargo thatwas less vulnerable to corruption from the same location, which could stilluse the port of Maputo.40
38Despite the fact that local and transit cargo have very different elasticities of demandfor port services in Maputo, Sequeira and Djankov (2010) discuss two possible reasons forwhy customs officials in Mozambique were not discriminating between transit and localcargo when setting bribes. First, customs officials in Mozambique had very short timehorizons and consequently high discount rates, given that the probability of staying in thesame post for longer than six weeks was fairly low. The cost of requesting high bribes fromfirms with a high elasticity of demand would be felt primarily in the future so officials didnot fully internalise it in the present. Furthermore, at the time the study was conducted,transit cargo only represented about 15% of the total number of shipments moving throughMaputo. Adopting more sophisticated bribe-setting strategies that discriminate betweentransit and local cargo could potentially increase the probability of detection of the illegaltransaction due to the perceived unfairness of charging different bribes to South Africanand Mozambican shippers (Sequeira and Djankov 2010).
39See Figure 5.18 for an illustration of the weak correlation between the distance betweeneach South African firm and each port and their choice of port for imports.
40This calculation is based on the average number of shipments a firm in this region shipsa year, the average size of the shipments and self-reported data on the total transportationcosts of the firm for 2007, which were obtained through the enterprise survey.
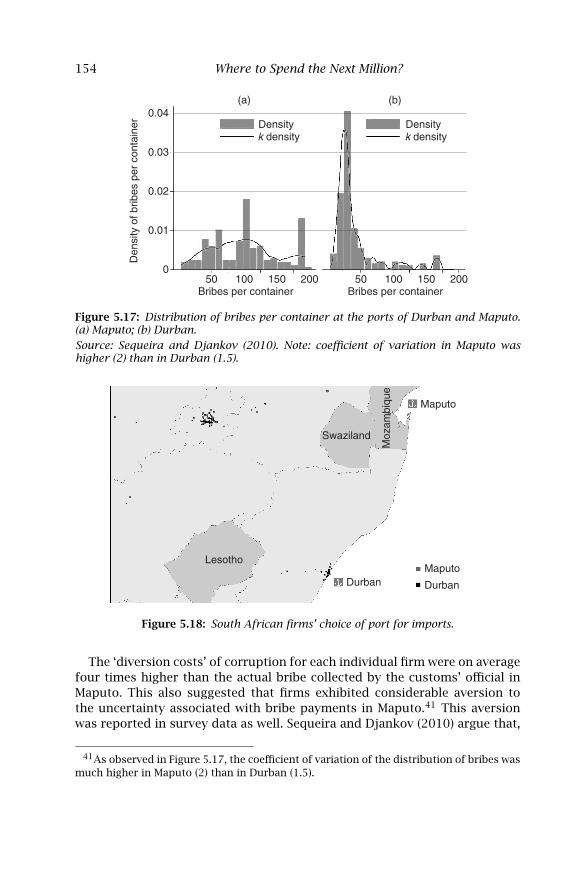
154 Where to Spend the Next Million?
0.01
0.02
0.03
0.04
0
Den
sity
of b
ribes
per
con
tain
er
Bribes per container Bribes per container50 100 150 200 50 100 150 200
(a) (b)
Density Densityk density k density
Figure 5.17: Distribution of bribes per container at the ports of Durban and Maputo.(a) Maputo; (b) Durban.
Source: Sequeira and Djankov (2010). Note: coefficient of variation in Maputo washigher (2) than in Durban (1.5).
Maputo
Maputo
Durban Durban
Lesotho
Swaziland
Moz
ambi
que
Figure 5.18: South African firms’ choice of port for imports.
The ‘diversion costs’ of corruption for each individual firm were on averagefour times higher than the actual bribe collected by the customs’ official inMaputo. This also suggested that firms exhibited considerable aversion tothe uncertainty associated with bribe payments in Maputo.41 This aversionwas reported in survey data as well. Sequeira and Djankov (2010) argue that,
41As observed in Figure 5.17, the coefficient of variation of the distribution of bribes wasmuch higher in Maputo (2) than in Durban (1.5).
Transport Costs and Firm Behaviour 155
in an environment of higher and more unpredictable bribes, the asymmetryof information between firms, clearing agents and port officials about bribepayments became more salient, making firms less able, and less willing, toguarantee the required liquidity of clearing agents (Shleifer and Vishny 1993;Bardhan 1997; Campos et al 1999; Hallward-Driemeier et al 2010).
This study also suggests that the full set of costs imposed by corruption inthe soft infrastructure of transport networks goes well beyond the reroutingcosts of a given firm. Every time a firm rerouted its imports away from themost corrupt port, it imposed a negative externality on other firms. On theone hand it added to congestion in the least corrupt port; on the other hand,it contributed to fewer and more imbalanced cargo flows to the more corruptone, resulting in higher overall transport costs through both corridors. Onthe Maputo corridor imports were more vulnerable to paying high bribes thanwere exports, resulting in more outbound than inbound cargo.
In the trucking survey, Sequeira and Djankov (2010) observed that eventhough the actual costs of operating in either corridor were almost identi-cal for all trucking companies, the absence of a regular flow of outboundcargo along the Maputo corridor resulted in a 70% increase in transportrates charged to firms on that route. Though this difference cannot be solelyattributed to the ‘diversion’ effects of corruption proposed in Sequeira andDjankov (2010), the pattern of bribe payments in Maputo and its effecton South African firms’ demand for the port and corridor is likely to playan important role in this result. These effects can be magnified across theregion given that the South African and Mozambican transport networks alsoserve six landlocked and neighbouring countries in Southern Africa: Malawi,Lesotho, Swaziland, Botswana, Zambia and Zimbabwe.
The study identifies a second type of distortion introduced by corruption inports on firm behaviour: the decision to source inputs domestically or inter-nationally. Decisions on the sourcing of inputs matter not only because theyaffect the productivity of the firm itself, but also because they have significantspillover effects in the whole economy by affecting the nature and the extentof backward and forward linkages between firms. The intuition is straight-forward: all else being equal, if corruption increases the cost of using a port,firms should have an incentive to decrease demand for imported inputs, whilethe opposite should happen when corruption decreases port costs.
The study exploits the fact that, on average, South African firms goingthrough the port of Maputo or Durban only face coercive corruption, whileMozambican firms only face collusive corruption.42 Controlling for severalfirm- and product-level characteristics, the study finds that coercive and col-
42In Durban, South African firms pay coercive bribes to prevent cargo from being movedaround the docks, while in Maputo they pay coercive bribes to avoid the arbitrary increasein the transit bond. Mozambican firms, on the other hand, face collusive corruption inMaputo that allows them to evade tariffs.
156 Where to Spend the Next Million?
lusive corruption have the opposite effect on firms’ sourcing decisions. A one-standard-deviation increase in expected bribes is associated with a 3% (0.089standard deviations) increase in the proportion of inputs sourced domesti-cally for firms facing coercive corruption and a 7% (0.173 standard deviations)decline in the proportion of inputs sourced domestically for firms facing col-lusive corruption. Collusive corruption reduces the relative cost of importedinputs, while coercive corruption increases it. Thus, firms in Mozambique thatcan pay bribes to evade tariffs are less likely to source their inputs domesti-cally, whereas in South Africa, where bribes are paid coercively, providing norent to the shipper, firms are more likely to source domestically.
The empirical set-up prevents the identification of a causal effect betweencorruption at ports and firms’ sourcing decisions, but these results are sugges-tive of how firms may respond to different types of corruption by organisingproduction in ways that increase or decrease demand for the public service.
A natural extension to this research agenda would discuss the effectivenessof different anti-corruption policies in reducing different types of corruption.With some notable exceptions, empirical evidence on the relative success ofdifferent anti-corruption policies is scarce. Both top-down (Olken 2007) andthird-party (Yang 2008) monitoring have been suggested as effective tools toreduce corruption. The effectiveness of other tools discussed in the theoret-ical literature—such as increased wages (Becker and Stigler 1974), technol-ogy, and changes in rules and regulations—has so far received more limitedempirical validation. In recent years, a growing literature has suggested thatthe simplification of tariff codes and the introduction of flat tariff rates couldreduce opportunities for corruption in customs (Fisman and Wei 2007).
However, the net welfare effects from such policies are unclear, as customsofficials may respond by extracting bribes through other means. In an exten-sion of the project described above, Sequeira (2011) tests for this possibilityby exploiting a quasi-experiment taking place in Mozambique to estimate theimpact of a reduction in tariffs on corruption.
Mozambique is one of the founding members of the Southern African Devel-opment Community (SADC), and in 1980 it agreed to a gradual phase-out of alltariffs with neighbouring South Africa. This meant that, in the years in whicha phase-out was scheduled (2008 and 2010), tariffs decreased for a predeter-mined set of products but not for others. This created a natural variation inproduct tariff level that is independent of the level of bribes being paid foreach product.
Using the same methodology as in Sequeira and Djankov (2010), we col-lect data on bribe payments before and after each change in the tariff codetook place, and then apply a straightforward triple difference technique toestimate the impact of changes in tariff levels on the level and distributionof bribes paid by firms. Since we observe the entire chain of clearance at theport of Maputo, we can test if corruption is displaced onto other phases ofthe shipping process. This research project is currently in the field.
Transport Costs and Firm Behaviour 157
4 CONCLUSIONS
In this chapter we have discussed two research projects that attempt to iden-tify the impact of different types of transport costs on firms. The first projectexploits a natural experiment with the rebuilding of a railway in SouthernAfrica to estimate the impact of a reduction of transport costs on firm perfor-mance. The set-up allows for the identification and monitoring of importantspillover and network effects between rail and road transport. To the best ofour knowledge, this represents the first study of the impact of railways onfirms in a contemporary setting, using primary firm-level data from beforeand after the investments take place.
The second project focuses on the impact of the soft infrastructure of trans-port on firms by looking at the specific context of corruption in ports. Thisstudy collected original data on bribe payments by infiltrating observers intotwo competing ports, traced differences in bribe schedules to the organisa-tional structure of each port and measured the impact of corruption at portson firm behaviour by observing how firms adapt their shipping and sourcingdecisions to the type of corruption they face at each port. Both shipping andsourcing decisions are likely to be directly affected by the overall cost of usingeach port.
The preferred estimate of the distortion imposed by corruption is what thestudy labels the ‘diversion’ effect of corruption, when firms travel on aver-age an additional 322 km—more than doubling their transport costs—just toavoid ‘coercive’ corruption at a port. This effect is only observed for firms fac-ing a higher probability of being coerced into a bribe due to the type of productthey ship. Interestingly, the cost for a firm to reroute can be up to four timeshigher than the cost of the actual bribe requested. Survey data revealed thatfirms were willing to incur the higher costs to avoid corruption because of anextreme aversion to the uncertainty surrounding bribe payments at the mostcorrupt port. The uncertainty in Maputo appears to be linked to the short timehorizons of customs officials because of high job turnovers. This result war-rants further investigation and perhaps even explicit testing through experi-mental methods.
Given that corruption at ports directly affects the relative cost of importsby increasing the cost of using the port, firms also seem to respond to differ-ent types of corruption by adjusting their decisions on the sourcing of inputs.The study finds a correlation between cost-reducing ‘collusive’ corruption andincreased usage of the port to import inputs—and between cost-increasing‘coercive’ corruption and a higher proportion of domestic sourcing. Whilethe study falls short of identifying a causal relationship, these correlationssuggest how firms may respond to different types of corruption by organ-ising production in ways that increase or decrease demand for the publicservice.
158 Where to Spend the Next Million?
By observing the entire chain between competing port bureaucracies, front-line bureaucrats setting bribes and users making shipping and sourcing deci-sions, the study provides a full account of the determinants and consequencesof corruption in ports and the many indirect and direct ways in which corrup-tion can affect the economy. Depending on the type of corruption bureaucratsengage in, bribes can generate more or less deadweight loss and reduce tariffrevenue for the government, but also increase or decrease demand for thepublic service, with important implications for economic activity.
In the Southern African corridors, corruption seems to be significantlyreducing demand for the Maputo port, thereby stifling the returns to the mas-sive investments in the hard infrastructure of the corridor that have takenplace in recent years (Macchi and Sequeira 2009). The studies also suggestimportant policy changes to the organisation of ports and to the nature of theinteraction between shippers and port officials that hold potential to reducecorruption, such as reducing the discretion of port officials in the clearanceprocess, and eliminating face-to-face interactions between clearing agents andport officials.
These studies also suggest that more empirical research is needed to under-stand the impact of other types of transport infrastructure—soft, hard andthe interaction between them—on firm behaviour. Longitudinal studies couldalso help clarify the dynamic effects of transport on important dimensionslike firm size, specialisation, location and trade, among others, and theirimplications for long-run economic growth. This research would not onlyprovide fundamental insights into the role of transport in determining themicro-foundations of growth, but also provide invaluable data for effec-tive policymaking, suggesting how investments in different types of trans-port infrastructure, soft and hard, could be prioritised to provide maximumreturns for economic growth.
Sandra Sequeira is a Lecturer in Development Economics at the London Schoolof Economics.
REFERENCES
Abadie, A., and G. Imbens (2006), Large sample properties of matching estimators foraverage treatment effects. Econometrica 74, 235–267.
Abadie, A., A. Diamond, and J. Hainmueller (2007). Synthetic control methods for com-parative case studies: estimating the effect of California’s tobacco control program.NBER Working Paper 12831.
Anderson, J., and E. Wincoop (2004). Trade costs. Journal of Economic Literature 42,691–751.
Angrist, J., and J. Hahn (2004). When to control for covariates? Panel asymptotics forestimates of treatment effects. Review of Economics and Statistics 86(1), 58–72.
Bardhan, P. (1997). Corruption and development: a review of issues. Journal of Eco-nomic Literature 35, 1320–1321.
Transport Costs and Firm Behaviour 159
Becker, G., and G. Stigler (1974). Law enforcement, malfeasance and compensation ofenforcers. Journal of Legal Studies 3, 1–18.
Bertrand, M., S. Djankov, R. Hanna, and S. Mullainathan (2007). Obtaining a driver’slicense in India: an experimental approach to studying corruption. Quarterly Journalof Economics 122, 1639–1676.
Buys, P., U. Deichmann, and D. Wheeler (2006). Road network upgrading and over-land trade expansion in sub-Saharan Africa. World Bank Policy Research WorkingPaper 4097.
Campante, F., D. Chor, and Q. Do (2009). Instability and the incentives for corruption.Economics and Politics 21, 42–92.
Campos, J. Edgardo, D. Lien, and S. Pradhan (1999). The impact of corruption on invest-ment: predictability matters. World Development 27, 1059–1067.
Clark, X., D. Dollar, and A. Micco (2004). Port efficiency, maritime transport costs andbilateral trade. NBER Working Paper W10353.
Crump, R., V. Hotz, G. Imbens, and O. Mitnik (2009). Dealing with limited overlap inestimation of average treatment effects. Biometrika 96(1), 187–199.
CSIR (2005). Study of logistics and transport costs in South Africa. http://www.csir.co.za/sol.
CSIR (2006). Study of logistics and transport costs in South Africa. http://www.csir.co.za/sol.
Dehejia, R., and S. Wahba (2002). Propensity score-matching methods for nonexperi-mental causal studies. Review of Economics and Statistics 84(1), 151–161.
Djankov, S., C. Freund, and C. S. Pham (2010). Trading on time. The Review of Economicsand Statistics 92, 166–173.
Donaldson, D. (2010). Railroads of the Raj: estimating the impact of transportationinfrastructure. Mimeo, MIT, Cambridge, MA.
Estache, A. (2010). A survey of impact evaluation of infrastructure projects, programsand policies. Ecore Discussion Paper.
Feinstein, C. (2005). An Economic History of South Africa: Conquest, Discriminationand Development. Cambridge University Press.
Fishlow, A. (1965). American Railroads and the Transformation of the Antebellum Econ-omy. Harvard University Press.
Fisman, R., and S. Wei (2007). Tax rates and tax evasion: evidence from missing importsin China. Journal of Political Economy 112, 471–500.
Fisman, R., and J. Svensson (2007). Are corruption and taxation really harmful togrowth? Firm-level evidence. Journal of Development Economics 83, 63–75.
Fogel, R. (1964). Railroads and American Economic Growth. Baltimore, MA: Johns Hop-kins Press.
Frankel, J., and D. Romer (1999). Does trade cause growth? The American EconomicReview 89, 379–399.
Freund, C., and N. Rocha (2010). What constrains Africa’s exports? World Bank PolicyResearch Working Paper 5184.
Galiani, S. (2007). Notes for the impact evaluation of the construction and rehabilita-tion of rural roads. World Bank.
Gumede, W. (2005). Thabo Mbeki and the Battle for the Soul of the ANC. Cape Town:Zebra Press.
Hallward-Driemeier, M., G. Khun Jush, and L. Pritchett (2010). Deals versus rules: policyimplementation uncertainty and why firms hate it. NBER Working Paper 16001.
Hirschman, A. (1967). Development Projects Observed. Washington, DC: BrookingsInstitution Press.
160 Where to Spend the Next Million?
Hoekman, B., and A. Nicita (2008). Trade policy, trade costs and developing countrytrade. World Bank Policy Research Working Paper 4797.
Hummels, D. (1999). Toward a geography of trade costs. Mimeo, Purdue University.Hummels, D. (2007). Transportation costs and international trade over time. Journal
of Economic Perspectives 21, 131–154.Huntington, S. P. (1968). Modernization and Corruption: Political Order in Changing
Societies, pp 59–71. New Haven, CT: Yale University Press.Krueger, A. O. (1974). The political economy of the rent-seeking society. American
Economic Review 64, 291–303.Leff, N. H. (1964). Economic development through bureaucratic corruption. American
Behavioral Scientist 8(3), 8–14.Limão, N., and A. Venables (2001). Infrastructure, geographical disadvantage, trans-
port costs, and trade. World Bank Economic Review 15(3), 451–79.Lui, F. (1985). An equilibrium queuing model of bribery. Journal of Political Economy
93, 760–781.Macchi, P., and S. Sequeira (2009). L’infrastructure de transport ‘immaterielle’ des
ports de Maputo et Durban. Afrique Contemporaine 230, 69–82.Obstfeld, M., and K. Rogoff (2000). The six major puzzles in international macro-
economics: is there a common cause? NBER Macroeconomics Annual 15, 339–390.Olken, B. A. (2007). Monitoring corruption: evidence from a field experiment in Indone-
sia. Journal of Political Economy 115, 200–249.Olken, B. A. (2009). Corruption perceptions vs corruption reality. Journal of Public
Economics 93, 950–964.Olken, B. A., and P. Barron (2007). The simple economics of extortion: evidence from
trucking in Aceh. Journal of Political Economy 117, 417–452.Raballand, G. and P. Macchi (2008). Transport prices and costs: the need to revisit
donors’ policies in transport in Africa. Bureau for Research & Economic Analysis ofDevelopment Working Paper 190.
Rauch, J. (1999). Networks versus markets in international trade. Journal of Interna-tional Economics 48, 7–35.
Robinson, J., and R. Torvik (2005). White elephants. Journal of Public Economics 89,197–210.
Rodriguez, F., and D. Rodrik (2000). Trade policy and economic growth: a skeptic’sguide to the cross-national evidence. NBER Macroeconomics Annual 15, 261–325.
Rosenbaum, P. R., and D. Rubin (1983). The central role of the propensity score inobservational studies for causal effects. Biometrika 70, 41–55.
Rostow, W. W. (1959). The stages of economic growth. The Economic History Review12, 1–16.
Sequeira, S. (2011). Tariffs and collusive corruption. Mimeo, London School of Eco-nomics.
Sequeira, S., and S. Djankov (2010). An empirical study of corruption at ports. Mimeo,London School of Economics.
Schelling, T. (1956). An essay on bargaining. The American Economic Review 46, 281–306.
Shleifer, A., and R. W. Vishny (1992). Pervasive shortages under socialism. RAND Jour-nal of Economics 23, 237–246.
Shleifer, A., and R. W. Vishny (1993). Corruption. Quarterly Journal of Economics 108,599–617.
Stigler, G. (1974). A theory of oligopoly. Journal of Political Economy 72, 44–61.Svensson, J. (2003). Who must pay bribes and how much? Evidence from a cross-
section of Firms. Quarterly Journal of Economics 118, 207–230.

Transport Costs and Firm Behaviour 161
Van de Walle, D. (2002). Choosing rural roads investments to help reduce poverty.World Development 30, 575–589.
World Bank (2007). Doing business: how to reform. Report.Yang, D. (2008). Integrity for hire: an analysis of a widespread customs reform. Journal
of Law and Economics 51, 25–57.

6
Half-Baked Interventions: StaggeredPre-Shipment Inspections in the
Philippines and Colombia
MOHINI DATT AND DEAN YANG1
1 INTRODUCTION
Corruption is an endemic problem that is especially prevalent in developingcountries. The impact of corruption on welfare has been a widely debatedtopic among economists: much has been said on the second-best option thatbribery may present in the face of a rigid and inefficient bureaucracy. Notwith-standing the arguments on the allocative efficiency that corruption mightunwittingly lead to, citizens of developing countries who live with the realitiesof corruption would undoubtedly concur that corruption is a nuisance thatneeds to be rooted out.2
Systematic empirical evidence evaluating the effectiveness of policies de-signed to combat corruption is scarce. The seminal theoretical work of Beckerand Stigler (1974) identified a pair of generic remedies for bureaucratic cor-ruption in government: increased monitoring and higher wages.3
But for many reasons anti-corruption reforms may fail. For example, areform that increases monitoring of potentially corrupt officials might fail ifthe monitors are corrupt and thus provide inaccurate information to higherauthorities. In turn, the higher-level officials may also be corrupt and not putthe information gathered to good use; or the monitoring programme maysimply be implemented to demonstrate the government’s anti-corruption cre-dentials What is more, even if enforcers are honest, corrupt officials may find
1For econometric and analytical details of the study, the reader is referred to Yang(2008a) and the working paper version, Yang (2005).
2See Huntington (1968) and Myrdal (1968). For overviews of the relationship betweencorruption and development, and the impact of corruption on welfare, see, for example,Bardhan (1997), Rose-Ackerman (2004) and Sequeira and Djankov (2010).
3Other contributions include Besley and McLaren (1993), Mookherjee and Png (1992,1995) and Polinsky and Shavell (2001).
164 Where to Spend the Next Million?
alternative methods of continuing their corrupt dealings. Therefore, empiricalwork—particularly at the micro level—is necessary to determine the effective-ness of any given anti-corruption effort.
A recent empirical literature sheds light on the impact of monitoring onbureaucratic corruption. In a variety of contexts these studies show thatincreased monitoring—and transparency—plays a positive role in reducingcorruption or cheating.4 Di Tella and Schargrodsky (2003) examine the impactof increased enforcement on corruption in hospital procurement in Argentina.In Uganda, Reinikka and Svensson (2004) find that diversion of governmentfunds intended for education is reduced when intended funding levels arepublicised in newspapers. Nagin et al (2002) use a field experiment to docu-ment the impact of increased monitoring on the opportunistic behaviour oftelephone call centre employees in the USA.
Examining corruption in trade is important, given trade’s potential to actas an engine of growth. Smuggling5 and customs corruption are rife in manycountries, and trade taxes have traditionally been an important source of gov-ernment revenue. In 1995, import duties accounted for an average of 23% ofcentral government tax revenue among non-OECD developing countries, butthe fraction was as high as 31% in the Philippines, 32% in Côte d’Ivoire and 37%in the Dominican Republic (World Bank 2002). Since import tariffs have usu-ally not been totally dismantled in developing countries, customs corruptionin these countries often takes the following form: an importer under-reportsthe value of an incoming shipment in order to pay lower import duties (a prac-tice known as under-invoicing), and customs officials may agree to overlookthe fraudulent declaration in return for bribes.
Several papers have examined the avoidance of taxes on international trade.Pritchett and Sethi (1994) find that collected import duties as a share of importvalue rise less than one-for-one with the tariff rate, and interpret this as evi-dence of tax evasion or avoidance. Fisman and Wei (2004) show that the extentof import under-invoicing rises as the tariff rate rises for Chinese importsfrom Hong Kong. Bernard and Weiner (1990), Hines and Rice (1994) and Claus-ing (2003) examine tax-induced transfer pricing within multinational firms.
The Philippine and Colombian customs reforms examined in Yang (2006,2008a,b), and reviewed in this chapter, reveal are of general interest as exam-ples of a common approach to fighting smuggling and customs corruption:hiring private firms to conduct pre-shipment inspection (PSI) of imports. Manydeveloping country governments use PSI as a solution to fight corruption incustoms. When a government implements a PSI programme, foreign inspec-tors verify the tariff classification and value of individual incoming shipments
4These results are aligned with those of Becker and Stigler (1974).5We use the term ‘smuggling’ here to refer to any illegal means by which an importer
reduces duties paid on a shipment, whether the shipment passes through formal customschannels or not.
Half-Baked Interventions 165
before they leave their country of origin. PSI simply improves the informationavailable to higher-level enforcers, who can use the reports to hold individ-ual customs officials accountable for collecting the correct amount of dutieson shipments. PSI reports may improve the bargaining power of importersagainst customs officials seeking bribes, which could facilitate trade and raisethe total amount of taxable import activity.
While the aforementioned research finds evidence of tax avoidance and eva-sion in the context of international trade, few studies examine the impact ofenforcement on these activities. In nearly all implemented PSI programmes,the responsibility for collecting customs duties remains in the hands of theimporting country’s customs officials, who may choose to ignore PSI reportson specific shipments. PSI programmes can fail to reduce import duty eva-sion if enforcers fail to use the new information available to them in the PSIreports, or if importers can find alternative methods to avoid duties (that mayinvolve avoiding PSI, or bringing shipments into the country outside of formalcustoms channels so that shipments never appear before a customs officer).
Sequeira and Djankov (2010) lament the current lack of research on themechanics of bribe payments and how it may affect firm behaviour. If smug-gling is displaced, where does it go? Empirical analysis on the impact ofenforcement addresses displacement as an aside, at most examining the exis-tence or amount of displacement.6 In this chapter we review evidence on thealternative routes to duty avoidance taken by importers in the Philippines andin Colombia, when enforcement of customs corruption increases.
Studying the impact of enforcement in customs is doubly important for thepublic finances of nearly all developing countries: on the one hand smugglingdrains customs revenue; on the other hand pre-shipment inspections can beexpensive. Anson et al (2006) point out that at 1% of the value of inspectedshipments, and given that customs duty is usually below 10% of import value,PSI fees could come to more than 10% of customs revenue. Ramírez Acuna(1992) and Byrne (1995) evaluate the arguments justifying the use of PSIs,and Goorman and De Wulf (2003) discuss the difficulties encountered by theWTO Agreement on Customs Valuation in developing countries.
Yang (2008b) examines the aggregate, country-level impact of pre-shipmentinspection services worldwide, finding that countries implementing PSI pro-grammes subsequently experience large increases in the growth rate of importduties. The study uses panel data at the country level to examine the rela-tionship between the implementation of PSI programmes and import dutycollections between 1980 and 2000. After the implementation of PSI pro-grammes, import duties increase on average by 15–30 percentage points.Additional evidence suggests that reductions in corruption are the cause ofthe import duty improvements: PSI programmes are accompanied by declinesin under-invoicing and in misreporting of goods classifications in customs.
6See Hesseling (1994) for a review.
166 Where to Spend the Next Million?
From a cross-country perspective, pre-shipment inspections appear to becost-effective: improvements in import duties in the first five years afterprogramme implementation were two-to-three times larger than programmecosts.
However, microeconomic studies of the effects of PSI suggest an ambiguousresult. Anson et al (2006) examine how the introduction of PSI affects incen-tives for under-invoicing and collusive behaviour between importers and cus-toms. They find that, with the introduction of PSI, fraud increased in Argentinaand Indonesia but decreased, albeit not significantly, in the Philippines. Theeffect of PSI was found to be ambiguous, if not perverse, since the resultsfrom the PSI were not corroborated by the government against what customsreported, and the implementation of the PSI in the first place de-motivatedthe customs administration.
Success with PSI is therefore not guaranteed. But examining situationswhere PSI programmes failed to produce the desired results can shed lighton the conditions under which such programmes are likely to succeed. In thischapter we review Yang (2008a), which was a microeconomic empirical studyof PSI programmes in the Philippines, as well as Yang (2006), which conducteda similar analysis for the PSI programme in Colombia. We focus here on theway that the customs reforms in both countries lent themselves to analysisas natural experiments.
Experimental and quasi-experimental methodologies have rarely been usedto evaluate policy interventions to combat corruption. Olken (2007) imple-mented a field experiment examining how different types of monitoring affectcorruption in Indonesian road projects, finding that ‘top-down’ was moreeffective than ‘bottom-up’ monitoring. Bertrand et al (2007) carried out a ran-domised controlled trial on the allocation of driver’s licences in India and thelikelihood of resorting to corruption to obtain the licence.
Sequeira and Djankov (2010) exploited a natural experiment within thewider context of their study of corruption in ports in Southern Africa—specifically, the port of Maputo in Mozambique and the port of Durban inSouth Africa, both of which lead, via two competing transport corridors, to theindustrial, agricultural and mining heartland of South Africa. They modelledtheir difference-in-difference estimation around the event of a 20-percentage-point reduction in tariffs in Mozambique on a selected category of goods.This change affected cargo entering through Maputo in transit to South Africabecause it affected the size of the refundable transit bond that South Africanfirms were forced to pay as insurance against the possibility of cargo beingdiverted and remaining in Mozambique. The valuation of the transit bondwas said to be exploited by customs in Maputo seeking to extract bribes. Theimpact evaluation of Sequeira and Djankov estimated the probability of bribe-paying on goods that received the tariff reduction and those that did not,before and after the reduction took place. The study found that high-tariff
Half-Baked Interventions 167
goods are more likely to lead to a ‘collusive’ form of corruption in the port ofMaputo.
For the purposes of impact evaluation, a standard problem when assessingthe impact of increased enforcement is establishing a credible counterfactual,whereby the causal impact of an enforcement policy can be separated fromtime trends in crime rates, from the impact of other simultaneous enforce-ment efforts, or from reverse causation (higher crime rates leading to moreenforcement). To establish the causal impact of increased enforcement, Yang(2008a) takes advantage of the fact that, for the 28-month period of interest,the Philippines’ PSI programme covered imports from only a subset of coun-tries. Then, during the course of the study period, the Philippine governmentincreased enforcement against duty avoidance for imports from PSI-coveredcountries by expanding inspections to a previously exempt shipment category(shipments below a certain dollar value).
The key element of the identification strategy is the existence of a plausi-ble control category—imports from countries not covered by the PhilippinePSI programme—against which changes in imports from PSI countries canbe compared. Because changes over time in a treatment group are comparedwith corresponding changes in a control group, this difference-in-differenceidentification strategy purges the empirical estimates of time trends in theuse of various duty-avoidance methods, as well as general changes in cus-toms enforcement that should affect imports from all countries equally (suchas changes in legal sanctions against smugglers, salaries of customs officials,etc).
Yang (2008a) finds that, when the Philippine government increased enforce-ment by expanding inspections to low-value shipments, imports from treat-ment countries shifted differentially to an alternative duty-avoidance method:shipping via duty-exempt EPZs. Thus, increased enforcement reduced the tar-geted method of duty avoidance but led to substantial displacement to analternative duty-avoidance method, amounting to 2.7% of total imports fromtreatment countries. The hypothesis that the reform led to zero change intotal duty avoidance cannot be rejected.
Also, displacement was greater for products with higher tariff rates andimport volumes, consistent with the existence of fixed costs of switching toalternative duty-avoidance methods. The revealed preferences of importersin the Philippines had shown that, as long as the minimum value thresholdwas US$5,000, they continued to prefer using the regular import channelsrather than straightaway routing shipments via EPZs when the governmentfirst introduced PSI. Once the minimum value threshold loophole was closed,they were compelled to ship via EPZs and incur the fixed costs associated withthat switch. Thus, society as a whole was worse off: government revenue didnot increase and the importers suffered higher costs.
The analysis finds that when the increase in enforcement is only partial—in that it only addresses a subset of potential methods of avoiding import
168 Where to Spend the Next Million?
duties—there can then be substantial displacement to alternative methods ofavoiding import duties. The PSI experience in the Philippines and in Colombiasuggest that, to be successful, anti-corruption reforms should be ‘broad’ inthe sense of encompassing a wide range of possible alternative methods ofcommitting the illegal activity of interest; otherwise, displacement to alter-native methods can negate the original goals of the reform. Moreover, thedisplacement bears out the second-best theorem, in that addressing only onedistortion of two arguably makes things worse in the continued presence ofthe second distortion.
The remainder of this chapter is organised as follows. In Section 2 wedescribe the pre-shipment inspection reform in the Philippines studied inYang (2008a) and presents an analytical model. In Section 3 we discuss thedata, estimation issues and main findings, and go on to examine the Colom-bian pre-shipment inspection reform. We give our conclusions in Section 4.
2 THE PRE-SHIPMENT INSPECTION REFORM IN THE PHILIPPINES
The government of the Philippines maintained a PSI programme from 1987to 2000. Over the 28-month period that is the focus of Yang’s (2008a) study(November 1989 to February 1992), the Philippines government required PSIon shipments from only a subset of countries rather than from all its tradingpartners. PSI was required on imports from nine countries in Asia: Brunei,Hong Kong, Japan, Indonesia, Malaysia, Singapore, South Korea, Taiwan andThailand. After February 1992, the government decided to extend PSI cover toshipments from all its import partners. The PSI programme was initially imple-mented in a staggered fashion. In the beginning, PSI would only be requiredif shipments from these countries had a declared FOB7 value greater thanUS$5,000. It is often the case that governments require PSI on the goods ofonly certain trade partners, or of only certain value, or on only a certain cate-gorisation of goods, given that if the costs of implementing a PSI programmeare greater than anticipated benefits, PSI is not cost effective.
However, the fallout from such a partial or staggered PSI programme isthat tax evaders could exploit the situation. In the case of the Philippines,importers did seek to take advantage of the US$5,000 threshold to avoidPSI by simply declaring shipment values below that threshold. Anecdotal evi-dence showed that what importers typically did was to split shipments intobatches that could reasonably be declared as valued below US$5,000. In addi-tion, single shipments that were above the threshold in actual value were sim-ply under-invoiced to fall below the threshold. Throughout the year 1990, thegovernment took steps to remove this exemption. On 2 May 1990, it lowered
7The FOB or ‘free-on-board’ value of a shipment is its value excluding the costs of freightand insurance.
Half-Baked Interventions 169
the minimum value threshold to US$2,500. Six months later, on 1 November1990, it lowered the threshold still further, to US$500.
Essentially, the Philippine government was targeting duty avoidance. TheYang (2008a) study examined the likelihood of importers finding alternativemethods of duty avoidance. Importers had two options to avoid duty once thegovernment started to mandate PSI.
• To value shipments below the minimum value threshold and so beexempt from PSI.
• To route imports via an export processing zone where PSI was notrequired. EPZs are especially designed geographic zones where no tradebarriers exist, ie goods are not subject to import tariffs or duties. As theEPZ is designed to be free of all trade barriers, customs inspections areoften perfunctory. Manufacturing firms obtain government licences torelocate to EPZs, where they can freely import raw materials and exportfinished goods. As the purpose of EPZs is to encourage foreign invest-ment, imports required by enterprises in the zones are exempted fromPSI.
2.1 Analytical Model
Given the staggered fashion in which the Philippine government deployedits PSI programme, the policy intervention lent itself to an impact-evaluationanalysis. The reform constituted a quasi-experiment because the increasedenforcement applied only to shipments from a subset of countries (the ninementioned earlier), which form the ‘treatment group’, with shipments fromall other trading partners serving as a ‘control group’. November 1989 istaken as the start of the study period, because six of the treatment countrieswere newly added to the PSI programme in the previous month.8 The end ofthe study period was February 1992, as the PSI programme was extended tocover all countries in March 1992, thus doing away with a control group.9
The Philippine policy intervention to lower the minimum value threshold fur-ther lent itself to difference-in-difference quasi-experimental analysis with theearlier minimum value threshold for PSI inspection of US$5,000 constitut-ing a ‘before’ period (November 1989 to April 1990), and the lowering of the
8As Yang (2008a) details, the countries added to the programme in October 1989 wereBrunei, Indonesia, Malaysia, Singapore, South Korea and Thailand.
9Table 1 in the Appendix of Yang (2005)—the working paper version of Yang (2008a)—provides a detailed description of changes in country coverage and minimum value thresh-olds for the Philippine PSI programme.
170 Where to Spend the Next Million?
threshold to US$500 (December 1990–February 1992) constituting an ‘after’period.10
Though the government phased down the minimum value threshold grad-ually over a six month period from May to November 1990, first loweringthe threshold to US$2500 and then to US$500, for the purpose of an impact-evaluation study, the focus is on just two time periods—when the thresh-old was US$5,000 and when it was lowered to US$500. Intuitively this makessense. The two-time-period focus is aligned with the purpose of the reform,which was to clamp down on the loophole that allowed importers to evadeinspection by splitting shipments into smaller value chunks, and to examinewhat happened when there was an easy loophole (the ‘before’ period), andthen when there was no longer an easy loophole (the ‘after’ period). The pointof interest here is the change in import behaviour once the minimum valuethreshold is lowered.
One possible concern addressed at the outset is selection bias: were thegoods of these nine countries chosen to be subjected to PSIs because itwas expected that imports from these countries would exhibit the observedchanges in duty-avoidance methods that we end up seeing? In other words,would those changes have occurred anyway, even without the increasedenforcement? Would those imports have in any case been rerouted via EPZs?This possibility is difficult to rule out directly; but an indirect test suggeststhat this may not be the case. There is no evidence of differential trends inthe use of the different duty-avoidance methods immediately prior to the pol-icy change in May 1990 when the government started to lower the minimumvalue threshold.11
The data on individual shipments and their characteristics used in Yang(2008a) were obtained from the National Statistics Office of the Philippines.The data set contains information on each shipment that entered the countryvia formal customs procedures, and had hitherto only been used to calculateaggregate Philippine import statistics.
This study’s purpose was not simply to look at changes in the aggregatesum of collected import duties, for which data are freely available in the WorldBank’s annually collected World Development Indicators. Instead, it intendedto examine changes in the behaviour of importers in order to give more
10Changes in PSI rules applied for shipments whose letters of credit were opened afterthe rule change, regardless of whether the arrival date of that shipment in the Philippineswas some weeks later. Therefore, shipments arriving during the month when the thresholdwas first lowered to US$500 may not yet have been subject to the new PSI rules. Novem-ber 1990 is therefore excluded from the ‘after’ period, even though that was when thethreshold was lowered to US$500.
11Conducting a ‘false experiment’, where the ‘before’ period is November 1988–April1989 and the ‘after’ period is November 1989–April 1990, yields a coefficient of interestthat is small and not statistically significant. It appears that there is no shift in imports toalternative methods of duty avoidance. See Yang (2008a) for details.
Half-Baked Interventions 171
nuanced policy recommendations: not just to state that the policy failed, butto examine what piece of the puzzle made it fail. The study aimed to under-stand the ‘mechanics’ of paying bribes and how that affects firm behaviour.12
The empirical analysis therefore gauges the extent to which shipments fromPSI countries shift to alternative methods of duty avoidance in response to thereduction in the minimum value threshold. It tracks changes in the frequencyof the following shipment types from PSI (treatment group) and non-PSI (con-trol group) countries:
1. shipments valued between US$5,000 and US$500;
2. shipments valued under US$500;
3. shipments destined for export processing zones.
The study used the reported declarations of the FOB value of each shipment(reported in nominal US dollars) to determine whether a shipment fell intotype 1 or 2 listed above. The data set also indicates whether a shipment wasdestined for an export processing zone, which is then our type 3.13 The depen-dent variable in the main regressions is the main outcome variable of inter-est defined as the probability of shipments falling under one of the threetypes: shipments valued US$500 < j < US$5,000, shipments valued less thanUS$500, shipments destined for EPZs.14
Yang (2008a) outlines a stylised model of the impact of enforcement oncriminal activity such as smuggling, when enforcement only targets a subsetof methods by which a particular crime can be carried out. According to thatmodel, when alternative ‘lawbreaking’ methods (which in the Philippines PSIexample would be the action of relocating to EPZs)15 involve fixed costs ofentry, crime displacement should respond positively to the size of illicit prof-its threatened by enforcement, with the extent of displacement depending onthe relative fixed and variable costs of the different methods.
12See Sequeira and Djankov (2010) for a detailed study on the mechanics of paying bribes.13The analysis tracks displacement from the first shipment type, valued between
US$5,000 and $500, to the other two types on the list, valued under US$500 or destinedfor EPZs. It is important to avoid double-counting of shipments: valued as type 1 or type 2and destined for EPZs (type 3). Luckily, very few shipments to export processing zones alsofall into one of the type 1 or 2 categories (0.02% of imports by value). Hence, we allocatethese overlapping shipments to type 1 (valued between US$5,000 and US$500) or type 2(valued under US$500). The results are not sensitive to allocating these shipments to theexport processing zone type instead.
14If other unobservable methods of avoiding duty are important, that would understatethe measure of total displacement.
15While, technically, relocating to EPZs is legal, here we refer to it as an ‘alternativelawbreaking’ method to the extent that it moves from illegal duty avoidance via underval-uation to a kind of legal tax avoidance in moving to EPZs, ie importers do not simply startto report shipment values honestly and then pay the required duty; they are still resortingto avoidance of the standard route.
172 Where to Spend the Next Million?
Undervaluation as a means to avoid PSI on imports involved low (thoughnot zero) fixed costs but significant variable costs. Importers would have hadto persuade their suppliers overseas to split shipments into lower-valuedchunks, and might even have had to source out suppliers willing to engagein this subterfuge, ie these would be constraints with some but not substan-tial fixed costs to the importers. But the many different lots of lower-valueshipments would have increased the costs of per-unit packaging and docu-mentation. Also, importers would have had to plan for, and likely even face,the possibility of a corrupt and alert customs official noticing the increasednumber of shipments and hence the undervaluation.
In contrast, the relocation to an EPZ as a route for avoiding PSI on importsis likely to have had high fixed costs and low variable costs. The high fixedcosts would have been in obtaining a government licence, the physical reloca-tion costs and the maintenance of a continued presence in the EPZ, either viatheir own outlets or via firms willing to import on their behalf. But once thissystem was in place, variable costs would have been negligible: shipmentscould enter in any size and valuation, duty-free and largely free of harass-ment by customs officials who would have had fewer tools to leverage in agovernment-mandated free trade zone.
As predicted by this model, displacement in both the Philippines andColombia would be greater when the size of profits from crime displacementwere higher. In the case of the Philippines, the tariff rate and import volume atthe product group level proxy for the size of profits from crime displacement.
3 ESTIMATION AND REGRESSION RESULTS
The Philippines study estimates a separate linear probability model for eachof the three shipment types outlined above, and also does so for a fourthtype: any of the three shipment types that allows avoidance of pre-shipmentinspection. To reiterate, the ‘before’ period is November 1989 to April 1990,when the minimum value threshold for PSIs was US$5,000; and the ‘after’period is December 1990 to February 1992, when the threshold was US$500.
The model examines the probability that imports from country g and prod-uct group h enter the Philippines as shipment type j during period p, denotedPghpj . Tgh is the treatment group and Pp is the treatment period (postreform). The simplest difference-in-difference estimate of the impact of thetreatment (the reduction of the minimum value threshold) on the probabilitythat a shipment enters as shipment type j is estimated using the followingregression equation:
Pjghp = βj0 + βj1TghPp + βj2Tgh + βj3Pp +ujghp. (6.1)
In this difference-in-difference regression, the coefficient on the interactionterm between the treatment group and the treatment period (βj1) is the esti-
Half-Baked Interventions 173
mate of the treatment effect. It captures for shipments from treatment coun-tries the differential change in the likelihood of observing shipment type jin response to a change in enforcement (the reduction of the minimum valuethreshold). The identification assumption is that, without the minimum valuethreshold reduction, changes in the observed frequency of particular ship-ment types over time would have been the same for imports from treatmentand control countries.
Equation (6.1) is estimated using a weighted least squares linear probabil-ity model, with the dependent variable being the fraction of the total value ofimports entering as the particular shipment type. The unit of observation isimports of a given product group by a given country in a given month; prod-uct groups follow the classification in the 21 Harmonized System sections(Harmonized Commodity Description and Coding System, version 1988). Thesample consists of 11,303 observations, where each observation stands for ashipment. Each observation is weighted by mean monthly imports (by value)in the ‘before’ period (November 1989–April 1990) for that particular coun-try/product group, allowing for the coefficients to be interpreted as reflectingthe probability that a particular dollar of imports falls into a shipment type. Itis possible that error terms in Equation (6.1) may be serially correlated amongobservations from the same country; therefore, robust standard errors clus-tered by country of origin of imports are used.
The prediction is that the reduction in the minimum value threshold fromUS$5,000 to US$500 makes import duty evasion on shipments valued abovethat threshold harder. We would therefore expect that when the shipmenttype in question is ‘shipments valued between US$5,000 and US$500’, βj1 < 0,which would show that shipment type had become differentially less common.If displacement occurs to alternative duty-avoidance methods associated withthe other shipment types, we should expect that βj1 > 0 for the other shipmenttypes, which should become differentially more common. These predictionsare indeed borne out in Yang’s (2008a) results.
The results show that the main coefficient of interest, βj1, on the interactionterm Tgh×Pp is negative and highly statistically significant, for shipment type‘valued between US$5,000 and US$500’. That is, between the before periodand the after period it became differentially less likely (in fact less likely by1.7 percentage points) that one dollar of imports from a treatment countryentered into the Philippines in a shipment valued in this category. This resultstrongly suggests that increasing inspection requirements deterred importersfrom valuing their shipments in this category.
So what did importers in the Philippines do instead? The same main coef-ficient of interest, βj1, on the interaction term Tgh × Pp , is positive for ship-ment types ‘valued less than US$500’ and ‘destined for EPZs’, suggesting thatimporters switched to these alternative methods when inspection was rampedup. The coefficient on shipment type ‘destined for EPZs’ is significantly differ-ent from zero, and an interpretation shows that one dollar of imports from a
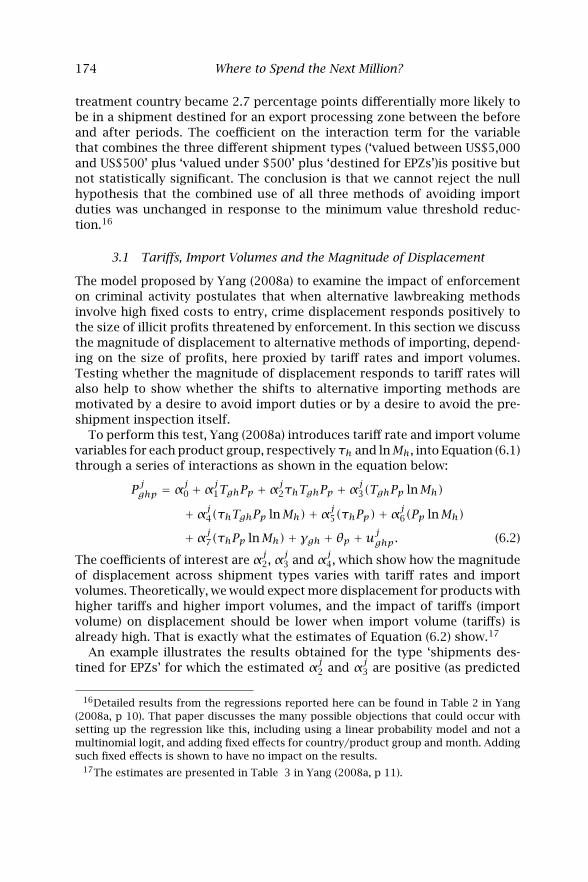
174 Where to Spend the Next Million?
treatment country became 2.7 percentage points differentially more likely tobe in a shipment destined for an export processing zone between the beforeand after periods. The coefficient on the interaction term for the variablethat combines the three different shipment types (‘valued between US$5,000and US$500’ plus ‘valued under $500’ plus ‘destined for EPZs’)is positive butnot statistically significant. The conclusion is that we cannot reject the nullhypothesis that the combined use of all three methods of avoiding importduties was unchanged in response to the minimum value threshold reduc-tion.16
3.1 Tariffs, Import Volumes and the Magnitude of Displacement
The model proposed by Yang (2008a) to examine the impact of enforcementon criminal activity postulates that when alternative lawbreaking methodsinvolve high fixed costs to entry, crime displacement responds positively tothe size of illicit profits threatened by enforcement. In this section we discussthe magnitude of displacement to alternative methods of importing, depend-ing on the size of profits, here proxied by tariff rates and import volumes.Testing whether the magnitude of displacement responds to tariff rates willalso help to show whether the shifts to alternative importing methods aremotivated by a desire to avoid import duties or by a desire to avoid the pre-shipment inspection itself.
To perform this test, Yang (2008a) introduces tariff rate and import volumevariables for each product group, respectively τh and lnMh, into Equation (6.1)through a series of interactions as shown in the equation below:
Pjghp = αj0 +αj1TghPp +αj2τhTghPp +αj3(TghPp lnMh)
+αj4(τhTghPp lnMh)+αj5(τhPp)+αj6(Pp lnMh)
+αj7(τhPp lnMh)+ γgh + θp +ujghp. (6.2)
The coefficients of interest are αj2, αj3 and αj4, which show how the magnitudeof displacement across shipment types varies with tariff rates and importvolumes. Theoretically, we would expect more displacement for products withhigher tariffs and higher import volumes, and the impact of tariffs (importvolume) on displacement should be lower when import volume (tariffs) isalready high. That is exactly what the estimates of Equation (6.2) show.17
An example illustrates the results obtained for the type ‘shipments des-tined for EPZs’ for which the estimated αj2 and αj3 are positive (as predicted
16Detailed results from the regressions reported here can be found in Table 2 in Yang(2008a, p 10). That paper discusses the many possible objections that could occur withsetting up the regression like this, including using a linear probability model and not amultinomial logit, and adding fixed effects for country/product group and month. Addingsuch fixed effects is shown to have no impact on the results.
17The estimates are presented in Table 3 in Yang (2008a, p 11).
Half-Baked Interventions 175
by the theoretical model): for a product group such as HS10, ‘Pulp, paper,paperboard and articles thereof’, whose lnMh is 16.74, near the mean acrossproduct groups, a tariff rate increase of 10 percentage points from its previ-ous level would have led to an increase in displacement to EPZs amountingto 1.6 percentage points of total imports. The coefficients obtained for theshipment type ‘valued between US$5,000 and US$500’ are of the oppositesign relative to those in the shipment type ‘destined for EPZs’, and show thatdisplacement is taking place out of shipments of that type and into shipmentsto EPZs.
The results show that, before the reduction in the minimum value thresh-old, the products most likely to be valued below US$5,000 to avoid PSIs werethose with high tariffs or high import volumes (but that the impact of eitherof these variables singly was lower the higher the level of the other variable).Once the minimum value threshold was lowered, importers shifted the prod-ucts in question away from valuations between US$5,000 and US$500 intoshipments going to EPZs. Thus, higher tariffs and higher import volumesmake it more attractive to displace shipments to alternative methods of dutyavoidance.
3.2 Did the Total Value of Imports and Total Government Revenue Change?
In anticipation of possible objections, the Philippine study also looks at thetotal value of imports originating in the treatment countries and in the con-trol countries. It could be the case that increased enforcement would leadimporters to switch trade partners from treatment to control countries, orindeed to misreport the origin of their shipments—said to come from con-trol countries, when in fact they come from treatment countries. Both theseactions would see imports from treatment countries decline and imports fromcontrol countries go up. However, estimating a regression analogous to Equa-tion (6.1), but where the dependent variable is the natural log of the total valueof imports, shows no such effect. Imports do not decline differentially acrosstreatment and control countries.18
Even by conservative estimates of tariff revenue gains and losses (net ofPSI fees), the minimum value threshold reductions proved to be unprofitablepropositions since they led to significant losses in net revenue for the Philip-pines government.19
On the one hand there were revenue gains from two sources. First, becauseimporters were no longer able to avoid the PSI requirement by valuing ship-ments between US$5,000 and US$500, import duty collections should haveincreased on shipments that would not have been inspected before. Second,
18These results are presented in Table 3 of the appendix of Yang (2005).19See Yang (2008a, Table 4 and Appendix) for details of the calculations showing those
losses.
176 Where to Spend the Next Million?
shipments were not subject to PSI if they were shifted to valuation underUS$500 or to EPZs, and would then have saved the government the cost ofthe inspection fees. The estimated total revenue gains from these two sourcesamounted to roughly US$24.6 million.
On the other hand, the costs to the Philippines government far outweighthese modest revenue gains. First, additional inspection fees of shipmentsvalued between US$500 and US$5,000 would have amounted to US$28 million.Second, losses in import duties due to shifts to valuation under US$500 andshipments routed via EPZs would have totalled US$33.3 million. Therefore,the minimum value threshold reductions led to a net loss of US$36.8 millionfor the Philippine government. Given the magnitude of the estimated grosslosses relative to the gross gains, the overall conclusion should be robust torelatively large changes in the assumptions used for the calculation.
It is possible that the government suspected at the outset of the programmethat this would transpire, but was constrained by a lack of computerised tal-lies of shipments. In addition, it was unclear beforehand what fraction ofshipments under US$5,000 was declared as being in that value range purelyto avoid the PSI requirement. However, the large displacement to EPZs wasprobably unanticipated.
3.3 PSI Reform in Colombia
Yang (2006) conducts another micro-level empirical analysis of the impact ofa PSI reform in Colombia. The implementation of the Colombia pre-shipmentinspections was also done in a way that made analysis amenable to difference-in-difference estimation. The years 1993–1994 constitute the ‘before’ period,prior to the PSI programme. The Colombian government started its PSI pro-gramme in August 1995, taking until March 1996 to finalise the list of prod-ucts for which PSI was required. These years are excluded from the analysis, asthe programme design was still changing. The years 1997–1998 constitute the‘after’ period, when the PSI was fully operational on a subset of products. Dueto broader changes within the Colombian public administration system, thePSI programme was cancelled altogether in July 1999. The treatment groupwas a subset of products on which PSI was required, and the control groupcomprised products for which PSI was not required.
The study takes SITC Rev. 3 product codes20 disaggregated at the four-or five-digit level level as the unit of observation and covers a total of 2,427products and 9,314 units of observation, where an observation is a productat that disaggregated level (explained below) in a given year. Each observationis weighted by the product’s mean annual dollar imports in 1993–1994.
Creating the right treatment and control group in this study was notstraightforward. The treatment group, called ‘PSI products’, comprised an
20Standard International Trade Classification, Revision 3.
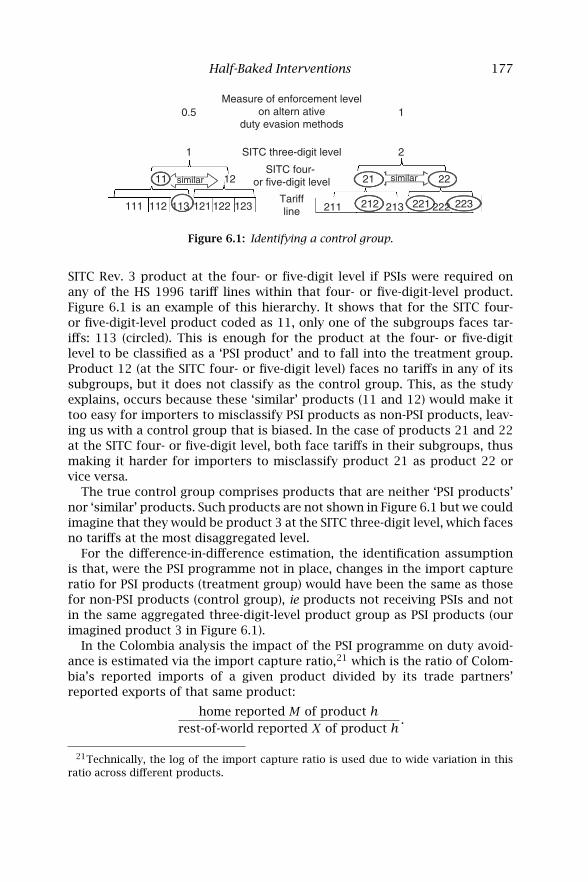
Half-Baked Interventions 177
111 112 121 122 123 211 212 213 222 223Tariffline
similarsimilarSITC four-
or five-digit level12
SITC three-digit level
Measure of enforcement levelon altern ative
duty evasion methods
1
1
2
0.5
113
11 21 22
221
Figure 6.1: Identifying a control group.
SITC Rev. 3 product at the four- or five-digit level if PSIs were required onany of the HS 1996 tariff lines within that four- or five-digit-level product.Figure 6.1 is an example of this hierarchy. It shows that for the SITC four-or five-digit-level product coded as 11, only one of the subgroups faces tar-iffs: 113 (circled). This is enough for the product at the four- or five-digitlevel to be classified as a ‘PSI product’ and to fall into the treatment group.Product 12 (at the SITC four- or five-digit level) faces no tariffs in any of itssubgroups, but it does not classify as the control group. This, as the studyexplains, occurs because these ‘similar’ products (11 and 12) would make ittoo easy for importers to misclassify PSI products as non-PSI products, leav-ing us with a control group that is biased. In the case of products 21 and 22at the SITC four- or five-digit level, both face tariffs in their subgroups, thusmaking it harder for importers to misclassify product 21 as product 22 orvice versa.
The true control group comprises products that are neither ‘PSI products’nor ‘similar’ products. Such products are not shown in Figure 6.1 but we couldimagine that they would be product 3 at the SITC three-digit level, which facesno tariffs at the most disaggregated level.
For the difference-in-difference estimation, the identification assumptionis that, were the PSI programme not in place, changes in the import captureratio for PSI products (treatment group) would have been the same as thosefor non-PSI products (control group), ie products not receiving PSIs and notin the same aggregated three-digit-level product group as PSI products (ourimagined product 3 in Figure 6.1).
In the Colombia analysis the impact of the PSI programme on duty avoid-ance is estimated via the import capture ratio,21 which is the ratio of Colom-bia’s reported imports of a given product divided by its trade partners’reported exports of that same product:
home reported M of product hrest-of-world reported X of product h
.
21Technically, the log of the import capture ratio is used due to wide variation in thisratio across different products.
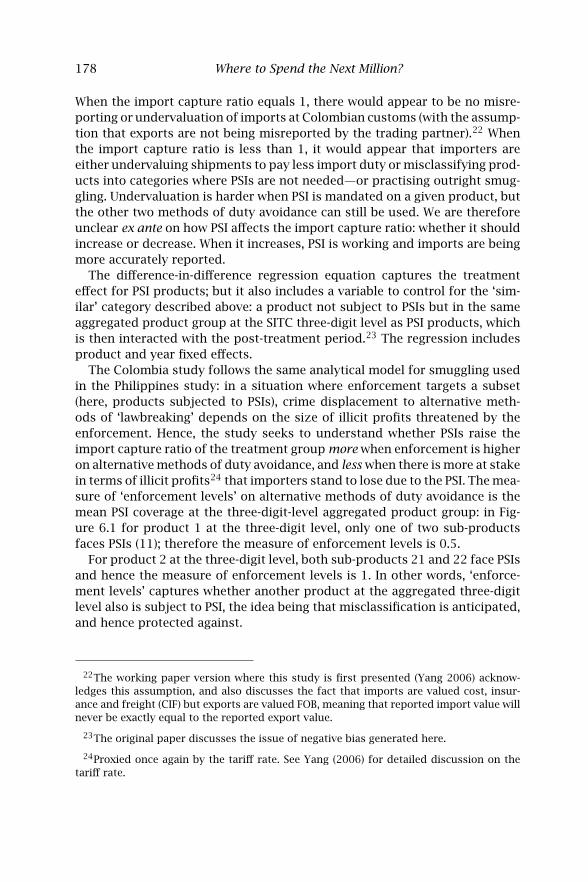
178 Where to Spend the Next Million?
When the import capture ratio equals 1, there would appear to be no misre-porting or undervaluation of imports at Colombian customs (with the assump-tion that exports are not being misreported by the trading partner).22 Whenthe import capture ratio is less than 1, it would appear that importers areeither undervaluing shipments to pay less import duty or misclassifying prod-ucts into categories where PSIs are not needed—or practising outright smug-gling. Undervaluation is harder when PSI is mandated on a given product, butthe other two methods of duty avoidance can still be used. We are thereforeunclear ex ante on how PSI affects the import capture ratio: whether it shouldincrease or decrease. When it increases, PSI is working and imports are beingmore accurately reported.
The difference-in-difference regression equation captures the treatmenteffect for PSI products; but it also includes a variable to control for the ‘sim-ilar’ category described above: a product not subject to PSIs but in the sameaggregated product group at the SITC three-digit level as PSI products, whichis then interacted with the post-treatment period.23 The regression includesproduct and year fixed effects.
The Colombia study follows the same analytical model for smuggling usedin the Philippines study: in a situation where enforcement targets a subset(here, products subjected to PSIs), crime displacement to alternative meth-ods of ‘lawbreaking’ depends on the size of illicit profits threatened by theenforcement. Hence, the study seeks to understand whether PSIs raise theimport capture ratio of the treatment group more when enforcement is higheron alternative methods of duty avoidance, and less when there is more at stakein terms of illicit profits24 that importers stand to lose due to the PSI. The mea-sure of ‘enforcement levels’ on alternative methods of duty avoidance is themean PSI coverage at the three-digit-level aggregated product group: in Fig-ure 6.1 for product 1 at the three-digit level, only one of two sub-productsfaces PSIs (11); therefore the measure of enforcement levels is 0.5.
For product 2 at the three-digit level, both sub-products 21 and 22 face PSIsand hence the measure of enforcement levels is 1. In other words, ‘enforce-ment levels’ captures whether another product at the aggregated three-digitlevel also is subject to PSI, the idea being that misclassification is anticipated,and hence protected against.
22The working paper version where this study is first presented (Yang 2006) acknow-ledges this assumption, and also discusses the fact that imports are valued cost, insur-ance and freight (CIF) but exports are valued FOB, meaning that reported import value willnever be exactly equal to the reported export value.
23The original paper discusses the issue of negative bias generated here.
24Proxied once again by the tariff rate. See Yang (2006) for detailed discussion on thetariff rate.
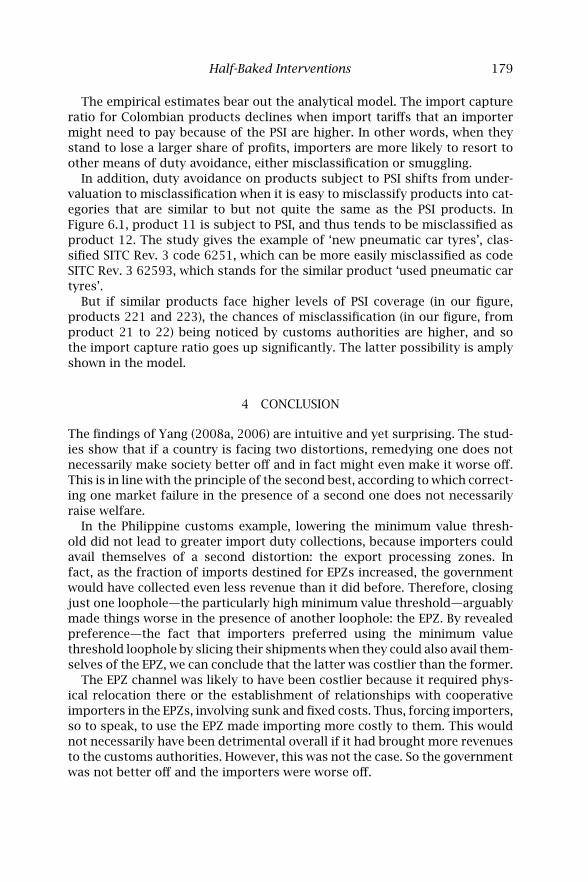
Half-Baked Interventions 179
The empirical estimates bear out the analytical model. The import captureratio for Colombian products declines when import tariffs that an importermight need to pay because of the PSI are higher. In other words, when theystand to lose a larger share of profits, importers are more likely to resort toother means of duty avoidance, either misclassification or smuggling.
In addition, duty avoidance on products subject to PSI shifts from under-valuation to misclassification when it is easy to misclassify products into cat-egories that are similar to but not quite the same as the PSI products. InFigure 6.1, product 11 is subject to PSI, and thus tends to be misclassified asproduct 12. The study gives the example of ‘new pneumatic car tyres’, clas-sified SITC Rev. 3 code 6251, which can be more easily misclassified as codeSITC Rev. 3 62593, which stands for the similar product ‘used pneumatic cartyres’.
But if similar products face higher levels of PSI coverage (in our figure,products 221 and 223), the chances of misclassification (in our figure, fromproduct 21 to 22) being noticed by customs authorities are higher, and sothe import capture ratio goes up significantly. The latter possibility is amplyshown in the model.
4 CONCLUSION
The findings of Yang (2008a, 2006) are intuitive and yet surprising. The stud-ies show that if a country is facing two distortions, remedying one does notnecessarily make society better off and in fact might even make it worse off.This is in line with the principle of the second best, according to which correct-ing one market failure in the presence of a second one does not necessarilyraise welfare.
In the Philippine customs example, lowering the minimum value thresh-old did not lead to greater import duty collections, because importers couldavail themselves of a second distortion: the export processing zones. Infact, as the fraction of imports destined for EPZs increased, the governmentwould have collected even less revenue than it did before. Therefore, closingjust one loophole—the particularly high minimum value threshold—arguablymade things worse in the presence of another loophole: the EPZ. By revealedpreference—the fact that importers preferred using the minimum valuethreshold loophole by slicing their shipments when they could also avail them-selves of the EPZ, we can conclude that the latter was costlier than the former.
The EPZ channel was likely to have been costlier because it required phys-ical relocation there or the establishment of relationships with cooperativeimporters in the EPZs, involving sunk and fixed costs. Thus, forcing importers,so to speak, to use the EPZ made importing more costly to them. This wouldnot necessarily have been detrimental overall if it had brought more revenuesto the customs authorities. However, this was not the case. So the governmentwas not better off and the importers were worse off.
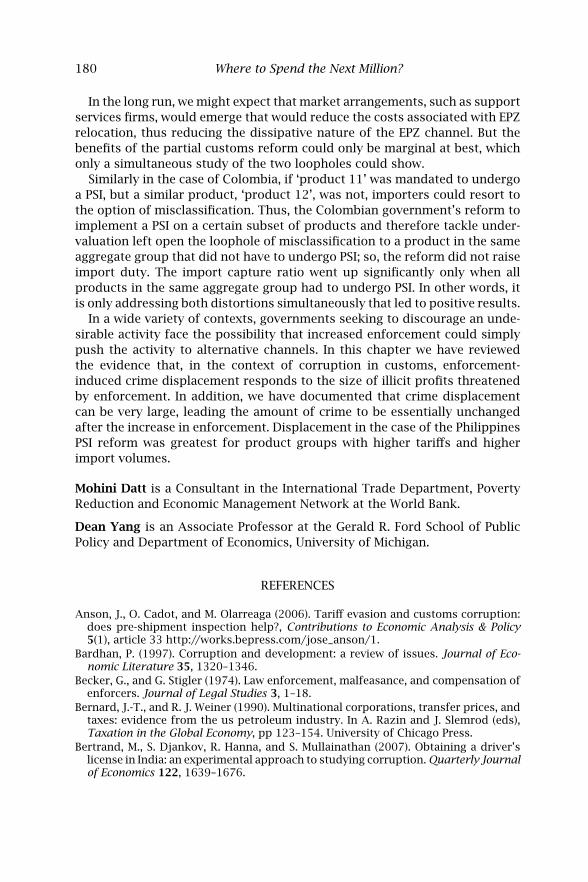
180 Where to Spend the Next Million?
In the long run, we might expect that market arrangements, such as supportservices firms, would emerge that would reduce the costs associated with EPZrelocation, thus reducing the dissipative nature of the EPZ channel. But thebenefits of the partial customs reform could only be marginal at best, whichonly a simultaneous study of the two loopholes could show.
Similarly in the case of Colombia, if ‘product 11’ was mandated to undergoa PSI, but a similar product, ‘product 12’, was not, importers could resort tothe option of misclassification. Thus, the Colombian government’s reform toimplement a PSI on a certain subset of products and therefore tackle under-valuation left open the loophole of misclassification to a product in the sameaggregate group that did not have to undergo PSI; so, the reform did not raiseimport duty. The import capture ratio went up significantly only when allproducts in the same aggregate group had to undergo PSI. In other words, itis only addressing both distortions simultaneously that led to positive results.
In a wide variety of contexts, governments seeking to discourage an unde-sirable activity face the possibility that increased enforcement could simplypush the activity to alternative channels. In this chapter we have reviewedthe evidence that, in the context of corruption in customs, enforcement-induced crime displacement responds to the size of illicit profits threatenedby enforcement. In addition, we have documented that crime displacementcan be very large, leading the amount of crime to be essentially unchangedafter the increase in enforcement. Displacement in the case of the PhilippinesPSI reform was greatest for product groups with higher tariffs and higherimport volumes.
Mohini Datt is a Consultant in the International Trade Department, PovertyReduction and Economic Management Network at the World Bank.
Dean Yang is an Associate Professor at the Gerald R. Ford School of PublicPolicy and Department of Economics, University of Michigan.
REFERENCES
Anson, J., O. Cadot, and M. Olarreaga (2006). Tariff evasion and customs corruption:does pre-shipment inspection help?, Contributions to Economic Analysis & Policy5(1), article 33 http://works.bepress.com/jose_anson/1.
Bardhan, P. (1997). Corruption and development: a review of issues. Journal of Eco-nomic Literature 35, 1320–1346.
Becker, G., and G. Stigler (1974). Law enforcement, malfeasance, and compensation ofenforcers. Journal of Legal Studies 3, 1–18.
Bernard, J.-T., and R. J. Weiner (1990). Multinational corporations, transfer prices, andtaxes: evidence from the us petroleum industry. In A. Razin and J. Slemrod (eds),Taxation in the Global Economy, pp 123–154. University of Chicago Press.
Bertrand, M., S. Djankov, R. Hanna, and S. Mullainathan (2007). Obtaining a driver’slicense in India: an experimental approach to studying corruption. Quarterly Journalof Economics 122, 1639–1676.
Half-Baked Interventions 181
Besley, T., and J. McLaren (1993). Taxes and bribery: the role of wage incentives. TheEconomic Journal 103, 119–141.
Byrne, P. (1995). An overview of privatization in the area of tax administration. Bulletinfor International Fiscal Documentation 49, 10–16.
Clausing, K. (2003). The impact of transfer pricing on intrafirm trade. In J. R. HinesJr (ed), International Taxation and Multinational Activity, pp 173–199. University ofChicago Press.
Di Tella, R., and E. Schargrodsky (2003). The role of wages and auditing during acrackdown on corruption in the city of Buenos Aires. Journal of Law and Economics46, 269.
Fisman, R., and S.-J. Wei (2004). Tax rates and tax evasion: evidence from ‘missingimports’ in China. Journal of Political Economy 112, 471–496.
Goorman, A., and L. De Wulf (2003). Customs valuations under the new WTO rules:problems and possible measures with particular attention for developing countries.Mimeo, World Bank.
Hesseling, R. (1994). Displacement: a review of the literature. In R. V. Clarke (ed), CrimePrevention Studies, Volume 3. Monsey, NY: Criminal Justice Press.
Hines Jr, J. R., and E. Rice (1994). Fiscal paradise: foreign tax havens and Americanbusiness. Quarterly Journal of Economics 109, 149–182.
Huntington, S. P. (1968). Modernization and Corruption: Political Order in ChangingSocieties, New Haven, CT: Yale University Press.
Myrdal, G. (1968). Asian Drama: An Enquiry in the Poverty of Nations, Volume II. NewYork, NY: The Twentieth Century Fund.
Mookherjee, D., and I. P. L. Png (1992). Monitoring vis-à-vis Investigation in enforce-ment of law. American Economic Review 82, 556–565.
Mookherjee, D., and I. P. L. Png (1995). Corruptible law enforcers: how should they becompensated? The Economic Journal 105, 145–159.
Nagin, D., J. Rebitzer, S. Sanders, and L. Taylor (2002). Monitoring, motivation, andmanagement: the determinants of opportunistic behavior in a field experiment.American Economic Review 92, 850–873.
Olken, B. A. (2007). Monitoring corruption: evidence from a field experiment in Indone-sia. Journal of Political Economy 115, 200–249.
Polinsky, A. M., and S. Shavell (2001). Corruption and optimal law enforcement. Journalof Public Economics 81, 1–24.
Pritchett, L., and G. Sethi (1994). Tariff rates, tariff revenue, and tariff reform: somenew facts. World Bank Economic Review 8, 1–16.
Ramírez Acuna, L. (1992). Privatization of tax administration. In R. M. Bird and M.Casanegra de Jantscher (eds), Improving Tax Administration in Developing Coun-tries. Washington, DC: International Monetary Fund.
Reinikka, R., and J. Svensson (2004). Local capture: evidence from a central governmenttransfer program in Uganda. Quarterly Journal of Economics 119, 679–706.
Rose-Ackerman, S. (2004). the challenge of poor governance and corruption. Mimeo,Copenhagen Consensus, Frederiksberg.
Sequeira, S., and S. Djankov (2010). On the waterfront: an empirical study of corruptionin ports. Mimeo, London School of Economics.
World Bank (2002). World Development Indicators 2002. Report. The InternationalBank for Reconstruction and Development/The World Bank, Washington, DC.
Yang, D. (2005). Can enforcement backfire? Crime displacement in the context of cus-toms reform in the Philippines. Gerald R. Ford School of Public Policy Working PaperSeries 02-010, University of Michigan.

182 Where to Spend the Next Million?
Yang, D. (2006). The economics of anti-corruption: lessons from a widespread cus-toms reform. in S. Rose-Ackerman (ed), International Handbook of the Economics ofCorruption. Northampton, MA: Edward Elgar.
Yang, D. (2008a). Can enforcement backfire? Crime displacement in the context ofcustoms reform in the Philippines. Review of Economics and Statistics 90, 1–14.
Yang, D. (2008b). Integrity for hire: an analysis of a widespread customs reform. Jour-nal of Law and Economics 51, 25–57.
7
Reforming Customs byMeasuring Performance:A Cameroon Case Study
THOMAS CANTENS, GAËL RABALLAND, SAMSON BILANGNAAND MARCELLIN DJEUWO1
Des Lupeaulx: After all, though statistics are the childish foible of modernstatesmen, who think that figures are estimates, we must cipher to estimate.Figures are, moreover, the convincing argument of societies based on self-interest and money, and that is the sort of society the Charter has given us, inmy opinion, at any rate. Nothing convinces the ‘intelligent masses’ as muchas a row of figures. All things in the long run, say the statesmen of the Left,resolve themselves into figures. Well then, let us measure.
H. de Balzac (1844, Les Employés [‘Bureaucracy’], Chapter 9)
1 INTRODUCTION
In 2007 Cameroon Customs launched a reform and modernisation initiativemeant to reduce corruption. Fraud and corruption had long stained the admin-istration’s reputation and hindered fulfillment of its mandates. The reformbegan with the installation of Asycuda,2 a customs clearance system thatallowed the administration not only to track the processing of each consign-ment, but also to measure a substantial number of criteria relevant to thereform, such as compliance with the deadline for recording the manifest byconsignees.
1This chapter is based on a revised paper which was previously published in the WorldCustoms Journal 4(2), 55–74. The authors would like to thank Melinda Hollingsworth fortranslating the paper from French into English; they also thank Robert Ireland, Stella Hamilland an anonymous referee for comments and suggestions. The findings, interpretationsand conclusions expressed in this chapter are entirely those of the authors, and do notnecessarily represent the views of the WCO, WCO officials or staff members, or the customsadministrations. Any mistakes are those of the authors.
2Automated SYstem for CUstoms DAta.
184 Where to Spend the Next Million?
For almost two years, upper management and front-line officers in Cam-eroon Customs shared the same reality thanks to ‘figures’ (performance indi-cators) that measured how the reforms initiated by the former were applied bythe latter. But, while the initial quantification phase bore fruit, its impact laterstalled. A possible solution was adopted when, beginning in 2010, CameroonCustoms introduced a system of individual performance contracts to mea-sure the actions and behaviours of customs officers operating at two of theseven Douala port bureaus, using indicators extracted from Asycuda.
The outcomes are encouraging. After more than 10 months of implementa-tion, the Cameroon Customs bureaus in the experimental group have shownbetter results than the control group on indicators related to the reduction ofcorruption, revenue collection, and trade facilitation.
In this chapter we trace the Cameroon reform from the introduction of theperformance indicators to the measured results of performance contracts. InSection 2 we provide an overview of measurement theory and the CameroonCustoms reform. In Section 3 we recount the events and decisions that overthe last four years that gradually led Cameroon Customs to introduce quan-tification of their actions. In Section 4 we discuss the principles of the perfor-mance contracts and describe the indicators and in Section 5 we present theresults. In Section 6 we then describe the difficulties raised by the introduc-tion of performance measurement. Finally, we offer concluding assessmentsin Section 7.
2 NEW PUBLIC MANAGEMENT AND PERFORMANCE CONTRACTS
In Honoré de Balzac’s novel Les Employés about public servants in the 19thcentury, one of the characters, the secretary general of finance, Monsieur DesLupeaulx, admits that figures are important to reform. However, in Balzac’stime, when reform was applied to a ministry, it generally meant that a numberof bureaucrats were themselves réformés, ie ‘reformed’ in the sense of ‘fired’(Ymbert 1825).
Over a century later in the 1970s, the new public management (NPM)approach introduced private sector management techniques into the publicsector. NPM encompasses a heterogeneous range of instruments and ideasthat share the neoliberal critique of the welfare state. Starting as a simpledesire to reduce the power of the state—mainly by privatising its actions inthe social sectors—NPM evolved into a softer version with the introductionof the ‘public entrepreneur’ figure: a public servant who, in order to achieveglobal objectives, enjoys a degree of flexibility in organising their resources.3
3Some preliminary conclusions on the effects of NPM for the USA, the UK, New Zealandand Australia are provided by Mascarenhas (1993), Considine and Lewis (2003) and Julneset al (2001).
Reforming Customs by Measuring Performance 185
In February 2010 Cameroon Customs launched an experiment that sharesa number of mots d’ordre with NPM, namely, ‘autonomy’, ‘performance’ and‘quantification’. This pilot resulted in the implementation of individual per-formance contracts signed between the director general of customs and twokey customs offices in the port of Douala. These contracts represented a newstep in the process of improving performance that had begun three yearsearlier.
Performance contracts are based on the objective measurement of theactions of public servants and financial incentives or career advancementpolicies. In Cameroon, performance contracts aim to encourage customs offi-cials to adopt good professional practices. Indeed, fighting bad practices is akey element in improving customs revenues: corruption has a direct negativeimpact on customs revenues and on competition in the private sector.
The history of Cameroon Customs shows that their public sector has thesame capacity to absorb private sector techniques as countries such as theUSA and the UK, where NPM developed: a pre-shipment inspection company(in place since 1987) was responsible for evaluating imported goods and someexports; public servants, including customs officials, were dismissed and pub-lic sector salaries were cut in the wake of the structural adjustment plans thatCameroon underwent during the 1990s.4
In Cameroon, external constraints such as the structural adjustment haveoften been responsible for imposing techniques from the private sector. Thisis similar to many countries that have seen an evaluation culture imposedfrom outside. The 1990s therefore saw their first deflates in Cameroon cus-toms, a French term coined to describe lay-offs, including voluntary depar-tures, from the public service (Mbonji 1999), which echoes Balzac’s réformés.
Still, the flexibility of Cameroon Customs’ contracts differs from that of theNPM’s ‘public entrepreneur’. Because of the climate of corruption, the directorgeneral knows less than his subordinates do about how or to what extentagents are applying the reforms adopted. This applies to a large number ofadministrations in sub-Saharan Africa (Mbembe 1999; Raffinot 2001; WorldBank 2005).
The contracts also aim to strengthen the hierarchy to achieve reform.The Cameroon experiment does not therefore have the same vision as theNPM policies, which question the Weber model of administration (Rouban1998; Spanou 2003) and result from agency theories based on principal-agentmodels.
Despite its importance in debates about state reform, performance mea-surement in practice is not widespread enough to provide much literatureon the subject (Julnes and Holzer 2001). The impact of incentives policies israrely measured rigorously, and studies evaluating reforms often focus on
4For the development on NPM in the USA and the UK see Merrien (1999) and Considineand Lewis (2003).
186 Where to Spend the Next Million?
public services in social areas, such as health or education, and on front-lineagents (Considine and Lewis 2003). To our knowledge, no project evaluationsof fiscal administrations have been carried out anywhere in the world, muchless in sub-Saharan Africa. In addition, although there are often claims of resis-tance to policies that aim to quantify public actions, there is little researchmeasuring their implementation (Wholey and Hatry 1992). This chapter willpresent the effects of the performance measurement policy in Cameroon Cus-toms by correlating the history of the reform and the figures that measure itsresults.
3 HISTORY OF THE REFORM
3.1 Asycuda Implementation
On 1 January 2007 the head of the IT Division of Cameroon Customs in Doualabecame, in the eyes of his colleagues and of freight forwarders, the agentof a mini-revolution. By disconnecting the Pagode
5 computerised customsclearance system, he put an end to a beleaguered 20-year history of a soft-ware system that processed 90% of customs revenue. The following day helaunched customs activities on Asycuda, a system developed by UNCTAD.6
This seemingly independent IT switchover was in reality the culmination ofan eight-month process to reform customs procedures. From the start, thisact and Asycuda were challenged, since customs revenues represented 27%of national revenues in Cameroon, the public sector was the country’s largestemployer and most consumer products were imported.7
The automation process first abolished the ‘release note’, a process that hadforced customs brokers or importers to return to the customs inspector afterpaying their customs debt in order to obtain the ‘release’. Automation alsoallowed customs officials to concentrate more fully on their core activities.The common customs clearance halls were closed; customs officials no longerjointly managed customs warehouses and areas in the port together with theirprivate owners; and they no longer managed the connections to the customsnetwork. This combination of automation and employee empowerment con-solidated real change. By the end of 2007 all customs officials were awareof the system’s potential with regard to internal auditing of the service, hav-ing themselves been victims of or having exploited it. The cross-checking ofdata now regulated the operational managers’ reports to the director general,
5Procédures Automatisées de Gestion des Opérations de la Douane et du commerceExtérieur (computerised management procedures for customs and external trade oper-ations).
6United Nations Conference for Trade and Development.7The public sector in Cameroon employs 170,000 public servants and military service-
men.
Reforming Customs by Measuring Performance 187
and a drop in revenue could no longer be explained by a decline in economicactivities.
3.2 The Launch of a Measurement Policy:A Key Pillar of the Cameroon Customs Reform
In January 2008 the director general decided to make performance indicatorsa pillar of his reform policy and set up a team of computer experts and cus-toms officials. However, by his not being in the field, his flow of informationfrom operational staff was not complete—especially within a climate of cor-ruption. This situation was made worse by the relocation of the directorategeneral to Yaoundé, more than three hours away from the Douala port by road.The director general’s ‘co-management’ of customs operations, as describedby some senior officers who denounced it in 2006, had at least allowed opera-tors to complain quickly to the superior authority. By relocating, the directorgeneral cut himself off from direct sources of information.
Starting in February 2008, the Director General’s team established 25 indi-cators for the 11 customs offices in Douala. These indicators measured eco-nomic activity from a customs viewpoint: the times taken by customs officialsand brokers to process files, the effectiveness of controls and sensitive pro-cedures and compliance with the customs channels. The full list of indicatorsis presented in Table 7.1.
The indicators are based on the notion that fraud and corruption are neces-sarily linked (Libom et al 2009). After seeing the gains made from automatingprocedures, the next step in revenue capture was to attack corruption. Evalua-tion became institutionalised, making it more effective than sporadic controls,and thus became a ‘social process’ (Varone and Jacob 2004).
By introducing indicators, the director general chose a radically differentcourse from that of his predecessors who managed Pagode. Because it isautomated, no customs clearance system, be it Pagode or Asycuda, cancompete with the vivid imagination and determination of fraudsters. UnderPagode, the development policy sought to strengthen the system perma-nently by detecting frauds on a case-by-case basis. But ultimately, the sys-tem’s complexity created a strong dependence on computer experts. UnderAsycuda, this policy was reversed. The system continues to offer computersecurity designed to identify the actors and their acts. But it is also judgedon its capacity to provide a realistic image of customs clearance in thefield.
In 2008 and 2009 the director general and operational managers met inDouala to examine the monthly report on indicators. This report was dis-tributed to them before the meeting, with each noting their own resultsand the results of their colleagues as well as each unit and each inspec-tor. These meetings gave managers the opportunity to better manage theirsubordinates.
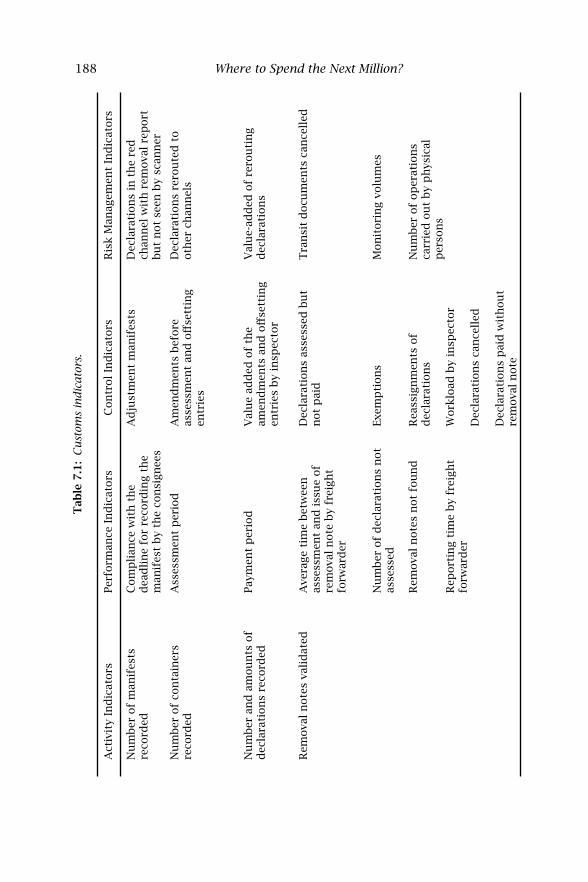
188 Where to Spend the Next Million?T
able
7.1
:C
ust
oms
indic
ato
rs.
Act
ivit
yIn
dic
ators
Per
form
ance
Ind
icat
ors
Con
trol
Ind
icat
ors
Ris
kM
anag
emen
tIn
dic
ators
Nu
mb
erof
man
ifes
tsre
cord
edC
om
pli
ance
wit
hth
ed
ead
lin
efo
rre
cord
ing
the
man
ifes
tb
yth
eco
nsi
gn
ees
Ad
just
men
tm
anif
ests
Dec
lara
tion
sin
the
red
chan
nel
wit
hre
mova
lre
port
bu
tn
ot
seen
by
scan
ner
Nu
mb
erof
con
tain
ers
reco
rded
Ass
essm
ent
per
iod
Am
end
men
tsb
efore
asse
ssm
ent
and
off
sett
ing
entr
ies
Dec
lara
tion
sre
rou
ted
tooth
erch
ann
els
Nu
mb
eran
dam
ou
nts
of
dec
lara
tion
sre
cord
edPay
men
tp
erio
dV
alu
ead
ded
of
the
amen
dm
ents
and
off
sett
ing
entr
ies
by
insp
ecto
r
Val
ue-
add
edof
rero
uti
ng
dec
lara
tion
s
Rem
ova
ln
ote
sva
lid
ated
Ave
rage
tim
eb
etw
een
asse
ssm
ent
and
issu
eof
rem
ova
ln
ote
by
frei
gh
tfo
rwar
der
Dec
lara
tion
sas
sess
edb
ut
not
pai
dT
ran
sit
docu
men
tsca
nce
lled
Nu
mb
erof
dec
lara
tion
sn
ot
asse
ssed
Exem
pti
on
sM
on
itori
ng
volu
mes
Rem
ova
ln
ote
sn
ot
fou
nd
Rea
ssig
nm
ents
of
dec
lara
tion
sN
um
ber
of
op
erat
ion
sca
rrie
dou
tb
yp
hys
ical
per
son
sR
eport
ing
tim
eb
yfr
eigh
tfo
rwar
der
Work
load
by
insp
ecto
r
Dec
lara
tion
sca
nce
lled
Dec
lara
tion
sp
aid
wit
hou
tre
mova
ln
ote
Reforming Customs by Measuring Performance 189
3.3 The Impact of the Measurement Policy
The results from the performance indicators policy were real.8 The tax yieldof a declaration increased consistently: an additional 21% between the firstquarter of 2007 and the second quarter of 2009 despite the tax exemptionmeasures for staple foods adopted in March 2008. For containerised importedgoods for domestic use, the average yield of a declaration increased by 10% in2007.9 Disputed claims increased without any additional pressure on opera-tors: the share of duties and taxes collected following controls rose from 0.75%to 1.02% of revenue. The duties and taxes collected in this way increased by56%, while the number of disputed claims increased by only 12%.
In terms of trade facilitation, 75% of maritime manifests were recorded inthe system 24 hours before the arrival of the vessel, allowing 18% of decla-rations to be submitted before unloading the goods. In the port of Doualabetween 2007 and 2009, the average assessment time of all customs officescollectively was reduced from 1.2 days to 0.8 days.10 The total processing timebetween 2007 and 2009 was reduced from 6.5 days to 5 days.11 Efforts werealso made by the freight forwarders and managers of customs warehousesand customs clearance areas. This significant improvement in processing timefor the maritime professions shows the indirect impacts of the performanceindicators policy.
Backed by performance indicators, customs officials strengthened theircapacity for dialogue with the private sector and weakened the intermedi-ation of the shipping agents. By disseminating some indicators to importersand exporters, the director general was able to demonstrate the responsibilityof all actors in the customs clearance process. As a result, some freight for-warders processing large volumes of goods reduced their intervention timesby half between the beginning of 2008 and the end of 2009.
Other non-quantifiable results pointed to a gradual acceptance of theconstraints linked to performance measurement and its integration into hier-archical reports. At meetings, some operational managers came with their
8All figures are calculated for the import declarations cleared for home use, which rep-resent 80% of declarations in terms of amounts and in numbers at the port of Douala. Thecalculation thus avoids taking account of the different offices for which the remit may havebeen amended or of changes in rules affecting special procedures or procedures specificto public contracts.
9In all offices, the number of items per declaration has not varied significantly; theindicator of average assessment remains relevant over the period.
10The assessment time is the period between the submission of the declaration by thefreight forwarder and assessment by the customs service.
11The total processing time is the total of three periods: assessment period, paymentperiod (period between the assessment by the customs officer and payment by the customsbroker) and removal period (period between payment and obtaining the removal noteissued by the manager of customs clearance warehouses).
190 Where to Spend the Next Million?
laptops, allowing them to view the indicator report directly. Others submit-ted a monthly report matching the indicators with their own data, which theyhad been obliged to collect.
Some indicators even raised questions that forced the heads of operationalservices to conduct their own internal investigations in order to justify results.In one case, where the interpretation of the results continued to oppose thatof the directorate general and operational services, cross-checks revealed thefailings of the pre-shipment inspection provider.
After two years of operation, the directorate general of customs decidedthat the operational services in Douala had had enough time to adopt theperformance measurement techniques, while at the same time a winding downof this policy threatened to combine with the impact of the global financialcrisis of 2008–9. On the one hand, economic activity linked to external tradewas dwindling: exports dropped by 40% between 2008 and 2009, and importsconcomitantly declined. On the other hand, revenue targets continued to grow(by 6% in 2010), while there was a gradual fall in values declared from the endof 2009 onwards. Meanwhile, the level of enforcement in the field by customsofficials seemed to have evened off. While this has little impact on revenue, itremains an indicator of relations between customs officials and users.
4 PERFORMANCE CONTRACTS: A NEW STEP
Over time, the impact of the performance indicators policy seemed to fade.One proposed solution was to move from a purely descriptive performancemeasurement to a prescriptive measurement. At the end of 2009, CameroonCustoms obtained funding and technical assistance from the World Bank andthe World Customs Organization to support the implementation of individualperformance contracts in the port of Douala over a ten-month experimentperiod.
4.1 Principles
During the pilot stage, the performance contracts were launched in two ofthe seven offices in the port of Douala that collect 76% of the port’s revenue.Office DP I handles imports of goods in containers for clearance for homeuse, with the exception of vehicles, has 10 or 11 inspectors and collects 60%of revenue. Office DP V handles imports of vehicles, including in containers,has between five and seven inspectors and collects 16% of revenue.
Like any other contract, the performance contracts formalise an agreementbetween two parties, specifying mutual obligations regarding results. The con-tracts go beyond revenue targets, which are fixed annually for the governmentby Customs. Still, these revenue targets, as well as the distribution of prod-ucts of disputed claims and of protocols, already formed a ‘numbers system’
Reforming Customs by Measuring Performance 191
(Ogien 2010). This situation is common to all fiscal administrations and offersgood potential for measuring performance.
The Cameroon contracts incorporate two specific features that address cor-ruption. First, they are signed between the director general and, individually,the sector head, the two office heads and the customs inspectors. Each com-mits themselves directly to the director general and not to a direct hierarchicalsuperior. Second, the global objectives inherent in every customs administra-tion (trade facilitation and enforcement) are complemented by objectives toabolish bad practices. In very simple terms, the performance contracts aim tourge customs inspectors to clear declarations faster, detect more fraud andgive up bad practices.
Unlike NPM, which seeks to optimise an administration/structure in rela-tion to its objectives (Wholey and Hatry 1992; Strathern 2001), the CameroonCustoms contracts are not based on a relationship between resources allo-cated and services provided. Instead, the goal is for individuals to complywith the formal structure, ie the match between their actions and the rulesof the structure is measured, which reinforces the formal framework anddoes not call into question Weber’s model of organisation of the administra-tion. The contracts evaluate the adherence of individuals to the organisation’srules. However, the principle of rational choice, which assumes that individualbehaviour is guided by individual profit, and which characterises NPM (Mas-carenhas 1993), is pushed to its extreme in Cameroon, by the individualisationof the contracts.12 The system of incentives and sanctions is therefore at theheart of the reform.
A clear distinction needs to be made between sanctions and incentives.Cameroon Customs has long since adopted a policy of financial incentivesvia the distribution of the yield from fines and various memoranda of under-standing with its partner professions (Bilangna 2009; Cantens 2009). Dur-ing meetings with the inspectors and their superiors to draft the contracts,exchanges showed the importance of non-financial incentives. Indeed, giventhe method of distributing the yield from fines, which legally guaranteed eachinspector 10% of the fine imposed with no upper limit, inspectors showed nointerest in additional financial incentives. At any rate, they did not believe thatthe administration could better this 10% any more than it could compensate,in the case of those inspectors who were corrupt, for the profits lost due toethical behaviour.
A number of incentives have been introduced: congratulatory letters;recording the congratulations in agents’ personnel files; easier access to thedirector general through regular meetings; reviewing the professional aspira-tions of successful agents; and training courses.
12The idea of team performance is also present to the extent that indicators targetingthe operation of the team have been introduced for heads of the Customs office and ofthe sector.
192 Where to Spend the Next Million?
Regarding sanctions, the contracts include a process of interviews andwarnings. For agents, the main sanction remains eviction from offices withstrong fiscal potential and where the possibilities of earning money legallythrough disputed claims are high. From this point of view, the threat of sanc-tion by transfer to an office with little earning potential would have a greaterimpact on personal behaviour than the hope of an incentive.
This concurs with the observations of Besley and Ghatak (2005), who foundno evidence that incentives mattered in organisations structured around thenotion of mission rather than of profit. The Cameroon experience rests moreon contractual governance of deviant behaviour (Crawford 2003): five ofthe eight contract indicators relate explicitly to bad practices that must becurtailed, even though the eight indicators are equally split between fourtrade-facilitation indicators and four enforcement indicators (following thetwo cardinal missions of every customs administration). These indicators aredescribed in the following sections.
4.2 The Experimental Protocol and theMeasurement of the Impact of the Pilot
For each objective, a comprehensive review was conducted to determine whichparameters would be taken into account. Once these parameters were defined,the performance contract set a minimum or maximum threshold. This thresh-old is a median calculated on the basis of the declarations processed by theoffices over the previous three years, 2007–2009. The sample covered 74,591declarations for office DP I and 63,761 for office DP V.
Preparations for the deployment of the performance contracts lasted fromSeptember 2009 to February 2010. The inspectors and their managers wereinvolved at all stages of preparations—from the writing up of the contracts tothe choice of indicators and periodic performance reviews. Before the launch,stakeholders were brought together in a contract design workshop. Thisprompted the creation of a unit specifically in charge of the programme, com-prising customs officials and computer staff. During the preparation stage,the contracts did not provoke much debate, given their newness and, aboveall, the distrust of the operational actors. While this eased the signing of thecontracts, the first regular meetings (held every ten days) were tense, manyinspectors having not foreseen the consequences of the contracts. The con-tinuing discord led to a number of amendments in the course of the firstquarterly evaluation.
Indicators were computed every ten days and presented to the inspectorsand to the heads of office by the team in charge of the project.13 Present-ing results to the front-line inspectors was one thing, but monitoring andevaluating the impact of performance contracts on customs efficiency was
13This calculation is performed via an IT application run on the Asycuda database.
Reforming Customs by Measuring Performance 193
another. On the one hand, since revenue collection is the main institutionalobjective of customs, impact monitoring had to detect any negative impacton revenues. On the other hand, in case of positive impact, evaluation had toprovide evidence to convince the political authority to continue supportingsuch an original experiment.
One gold standard of impact evaluation of public aid is the use of an RCT,whose importance has been increasing substantially since the 1960s in thesocial, behavioural and mostly educational fields (Duflo and Kremer 2003;Turner et al 2003). The very principle of a random allocation raises ques-tions about the Cameroon Customs performance contracts. In this context, itwould mean that some front-line inspectors would have been under perfor-mance contracts, while others were not, each group being discriminated in arandomised way.
An RCT was not implemented for the following technical reasons. First,the sample is too small. At Douala Port, the seven customs bureaus are spe-cialised: oil imports; special customs regimes related to public trends; transit;exports; bulk cargo; and the two bureaus under contracts. Types of fraud and,above all, customs practices are so different that it is usually impossible tocompare one bureau to another. In addition, the two bureaus under contractsare the main ones, both in terms of revenue collection and staff. But the staffcomprises at most 10 civil servants; therefore, it is impossible to split onebureau between treated and controlled groups of inspectors.
Second, time was limited. In order to get over the small sample size issue,one solution could have been to organise a turnover within each bureau, whichwould have artificially increased the number of controlled and treated officers.Despite the fact that ‘blinding’ would not have been possible, this turnoverwould have raised some political issues. Indeed, what does ‘treated’ mean? Asalready mentioned, contract incentives are not financial, and rewarding goodperformers with non-financial incentives requires time. A head of customscannot deliver congratulatory letters on a monthly basis nor appoint goodinspectors to better positions every six months. Still, there is no stable core offront-line inspectors: from 2006 to 2010, there were three appointment cycles,whose unpredictability had a major impact on the working environment andpractices (Cantens 2011).
In addition to these technical issues, the experiment did not have to iden-tify the best mechanism because there are not many possible mechanisms inthis field. Moreover, implementing individual contracts corresponded to theperformance measurement policy undertaken in 2008.
The ethical concerns raised by randomised experiments are crucial whenexperiments deal with illegal practices (Farrington 2003): how can the govern-ment and importers accept that bad practices are only partially addressed? Inaddition, when one officer is under contract and supposed to be more efficient,while another in the same bureau is less efficient, it is difficult for importersto predict the quality of the service they will receive.
194 Where to Spend the Next Million?
Finally, evaluation has to unveil an impact on some outcome, but in thiscase, the ‘bad practices’ are difficult to identify. Impact evaluation must takeinto account that any pre-defined quantitative approach cannot guess whatkind of new bad practices could be invented on the field. This is very sim-ilar to what Munane et al (2007, p 311) described in educational research:the ‘non-routine aspects of… practice are especially important to high perfor-mance’. Due to corruption, ex ante design cannot take into account all illegal orinfra-legal possible behaviours. This specific environment—and the fact thatreducing corruption is one major objective of the experiment—decreased thepossible scope for using an RCT to make causality explicit.
Impact evaluation of the Cameroon pilot performance contracts has thusbeen conducted in three stages. First, an extensive analysis of the situa-tion before the experiment was carried out, based on a descriptive statis-tical analysis of the inspectors’ behaviours and qualitative observations. Sec-ond, monthly quantitative monitoring through comparisons between similarperiods before and after the launch of the experiment. This monitoring alsoincluded comparisons with the bureau dedicated to bulk cargo imports. Thecomparison with the evolution of this counterfactual bureau is only feasi-ble for measuring the impact on clearance time, since import procedures aresimilar for the three bureaus. Third, the quantitative appraisal was comparedwith a qualitative one through interviews and observations (during evalua-tion meetings). Moreover, individual interviews of inspectors under contractswere organised with international experts some months after the end of theexperiment.
4.3 The Trade-Facilitation Indicators
Two opposing objectives have been integrated into the performance contracts:releasing the goods more quickly and increasing the numbers of disputedclaims. It is the balance of the two objectives that limits the harmful effects.Trade facilitation alone would not regulate corruption issues, while enforce-ment alone could legitimise corruption.
The first global objective of trade facilitation is the time measured betweenthe declaration’s entry by the customs broker and its assessment by the cus-toms office inspector.14 A study of the sample from the last three years showsthat a large majority of declarations were assessed on the same day or the nextday in both offices. The difference lay at the level of same-day assessment, withDP V processing over 80% of declarations the same day, compared with over64% in DP I. But, by the end of the next day, both offices had assessed over 90%of declarations entered in the system. A second, smaller tranche was clearedby the maximum three-day deadline, by which time 96–97% of declarations
14The times are calculated in terms of full days, excluding only those public holidaysfalling on a Saturday or Sunday.
Reforming Customs by Measuring Performance 195
had been assessed. After this, progress was slower. Thus, the global objectiveof trade facilitation was defined with two measurable indicators: a minimumthreshold of declarations assessed within one day, and a maximum thresholdof declarations assessed within five or more days.
Two potential problems made it necessary to integrate two more indicatorsinto the performance contracts. The first was the non-assessment of declara-tions. Not assessing problematic declarations and leaving them on hold in thesystem artificially reduced the assessment time. The contract has thereforeset a maximum threshold for non-assessed declarations.
The second more complex problem was the speed of assessment andthe offsetting entry. Inspectors chose to offset after assessment rather thanamending the declaration prior to the assessment. This practice concerned80% of adjustments, regardless of control channel, be it physical or docu-mentary. It reduced the assessment time, which therefore no longer showedthe time actually taken by the inspector to carry out the control. This choicewas a bad practice that may be interpreted in two ways, each compatible withthe other:
• once offsetting entries becomes routine, users were at permanent riskof readjustment by the inspector who assessed their declaration;
• by systematically offsetting their adjustments, inspectors ensured thatthey had a maximum number of declarations to process.
Asycuda automatically assigns declarations to inspectors on the basis oftheir workload, calculated on the basis of the numbers of declarations alreadyassigned to them waiting assessment. By carrying out the assessment rapidly,inspectors kept their workload at a low level but were obliged to adjust dec-larations via offsetting entries. Apart from the negative impact on the rele-vance of the assessment time, this practice resulted in competition betweenthe inspectors. On average, in office DP I, the fastest inspector managed toprocess up to six times more declarations a day than the slowest. This com-petition adversely affected the equal treatment of users and could at the sametime induce corruption.
The contracts therefore laid down two indicators. The first, in the perfor-mance contracts for heads of customs offices, required a maximum devia-tion of 1.5 between inspectors’ processing speeds; the head of a customs officecould suspend inspectors who processed declarations too ‘rapidly’. The sec-ond indicator, in the performance contracts for inspectors, set a maximumthreshold for offsetting entries by inspectors who had assessed the declara-tions redirected from the physical inspection channel to the documentarycontrol channel.
4.4 The Fight against Fraud, and Bad Practice Indicators
The second global objective of performance contracts is enforcement. Theamount of duties and taxes raised depends on both on the number of decla-
196 Where to Spend the Next Million?
rations collected and the additional amounts collected following the controls.The green channel is not currently activated, and so all declarations are sub-ject either to documentary controls or to a physical inspection.
The contracts set a global objective for inspectors: a minimum percent-age of amounts of duties and taxes collected following adjustments comparedto the amounts of duties and taxes assessed. However, this objective may beaffected by two biases. The first is the size of the disputed claim. To achievea minimum amount of adjustments, inspectors could increase the number ofsmall disputed claims. Prior analysis had confirmed the average size of dis-puted claims over recent years: in office DP V, 65% of adjustments were below€300 (compared with an average assessment of over €3,000). In office DP I,the red channel (physical inspection) showed a paradox: in numerical terms,low-level adjustments predominated over high-level adjustments in the caseof high-risk declarations. Forty per cent of disputed claims yielded between1% and 5% of the amounts assessed. To remedy this tendency, the contractsset a maximum threshold in numerical terms for small disputed claims anda minimum threshold for the highest disputed claims in the red channel.
The second bias that may affect this objective was linked to the rerout-ing of declarations.15 Rerouting by inspectors is a legitimate action. However,rerouting through the red channel may also be a means of pressuring the user.Thus, it was necessary to monitor the adjustments carried out on those decla-rations rerouted to the red channel. The contracts have not set a limit on thenumber and proportion of declarations rerouted; moreover, the operationalservices already had enough constraints, obliging them to rapidly process low-risk declarations. The only measurable indicator consisted of setting a rate ofadjustment for declarations rerouted to the red channel greater than that forthose declarations that were not rerouted.
5 THE IMPACT OF PERFORMANCE CONTRACTS
5.1 Quantifiable Results
After only 13 weeks of implementation, halfway through the performancecontracts experiment, there were positive results. This testified as much tothe effectiveness of the contracts as to the willingness and growth potential ofthe customs agents. The measurement of the effects is based on a comparisonof various performance indicators before and after the implementation of theperformance contracts experiment in the two treated customs bureaus and insome cases is compared with the performance indicators in the counterfactualbureau, as mentioned in Section 4.2.16
15‘Rerouting’ means the redirection of the declaration to a processing channel other thanthe original channel.
16In each customs bureau, indicators are averaged across inspectors.
Reforming Customs by Measuring Performance 197
The impact on revenues is measured relative to trends in economic activity(for which it is difficult to obtain reliable data in real time). Hence, severalvariables, such as the numbers of imported containers, values declared andthe numbers of items or total tonnage, which can easily be extracted from theAsycuda system, were selected. None of this data gives irrefutable evidencefor economic activity, but rather it points to trends that may help to interpretrevenue developments.
In office DP I, the duties and taxes assessed over the period increased by6.2% in 2010 relative to the contract period in 2009, while the number ofimported containers fell by 3%. The tax yield of the declarations in office DP Irose by 3% over the contract period in 2010 compared with the same periodin 2009. In office DP V, it rose by 23%.17
We then computed the estimated revenue added during the pilot (all otherthings being equal), which is equal to the revenues actually collected dur-ing the experiment minus the number of declarations during the experimentmultiplied by the average taxes and duties of 2009. The estimated additionalrevenues during the experiment are estimated to be €23.3 million (which isabout 3% of the national customs revenue target).
The impact of the performance contracts on customs clearance time hasbeen equally important. The share of declarations assessed by inspectors onthe day they are lodged in the system by brokers was multiplied by 1.3 inoffice DP I (it is now around 84%), by 1.2 in Office DP V (77%) and by 0.9 inthe counterfactual office DP VI (57%). The estimated gain in terms of timeclearance is 8 hours for office DP I and 14 hours for office DP V.
In addition, the variance of time clearance has dramatically decreased sinceApril 2010, and processing speeds have become more homogeneous. Thestandard deviation of daily processing speeds and the difference between thefastest and slowest clearance times have both been halved. Inspectors there-fore no longer engage in stiff competition to process as many declarations aspossible.
The impact on private operators has also been tangible. The time periodbetween the broker’s registration and the customs officer’s assessment hasbeen divided by 2.5 in office DP I and by 2 in office DP V. There had been nosuch evolution after the Asycuda launch.
The impact of the performance contracts on disputed claims is also inter-esting. In office DP V, the impact was substantial since the ratio of taxesadjusted to taxes assessed was multiplied by 1.7. In office DP I, the ratio oftaxes adjusted to taxes assessed was multiplied by 1.003, which is an insignif-
17The results compared the period under contracts from February to November 2010to the same period in 2009. December and January were excluded because of seasonalityconcerns: economic activity increases due to the Christmas period and so does the pressureon customs bureaus to achieve the annual revenue targets, which gives rise to specificprocedures and low activity following Christmas.
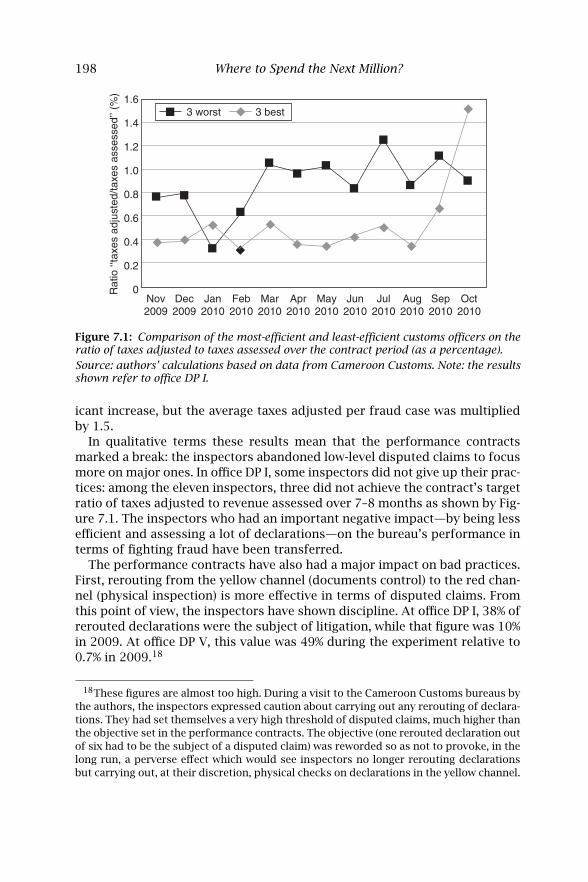
198 Where to Spend the Next Million?
1.6
1.4
1.2
1.0
0.8
0.6
0.4
0.2
0Nov2009
Dec2009
Jan2010
Feb2010
Mar2010
Apr2010
May2010
Jun2010
Jul2010
Aug2010
Sep2010
Oct2010
Rat
io ‘‘
taxe
s ad
just
ed/ta
xes
asse
ssed
’’ (%
)3 worst 3 best
Figure 7.1: Comparison of the most-efficient and least-efficient customs officers on theratio of taxes adjusted to taxes assessed over the contract period (as a percentage).
Source: authors’ calculations based on data from Cameroon Customs. Note: the resultsshown refer to office DP I.
icant increase, but the average taxes adjusted per fraud case was multipliedby 1.5.
In qualitative terms these results mean that the performance contractsmarked a break: the inspectors abandoned low-level disputed claims to focusmore on major ones. In office DP I, some inspectors did not give up their prac-tices: among the eleven inspectors, three did not achieve the contract’s targetratio of taxes adjusted to revenue assessed over 7–8 months as shown by Fig-ure 7.1. The inspectors who had an important negative impact—by being lessefficient and assessing a lot of declarations—on the bureau’s performance interms of fighting fraud have been transferred.
The performance contracts have also had a major impact on bad practices.First, rerouting from the yellow channel (documents control) to the red chan-nel (physical inspection) is more effective in terms of disputed claims. Fromthis point of view, the inspectors have shown discipline. At office DP I, 38% ofrerouted declarations were the subject of litigation, while that figure was 10%in 2009. At office DP V, this value was 49% during the experiment relative to0.7% in 2009.18
18These figures are almost too high. During a visit to the Cameroon Customs bureaus bythe authors, the inspectors expressed caution about carrying out any rerouting of declara-tions. They had set themselves a very high threshold of disputed claims, much higher thanthe objective set in the performance contracts. The objective (one rerouted declaration outof six had to be the subject of a disputed claim) was reworded so as not to provoke, in thelong run, a perverse effect which would see inspectors no longer rerouting declarationsbut carrying out, at their discretion, physical checks on declarations in the yellow channel.
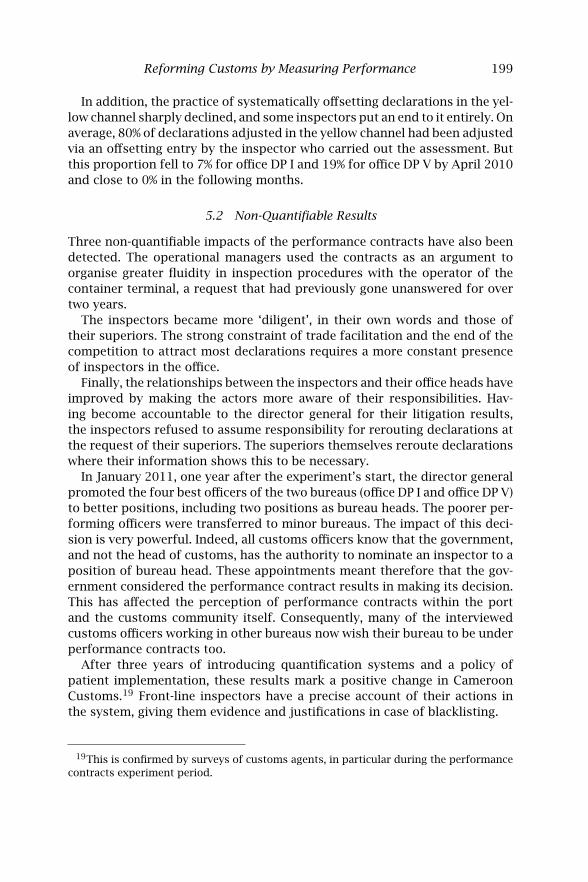
Reforming Customs by Measuring Performance 199
In addition, the practice of systematically offsetting declarations in the yel-low channel sharply declined, and some inspectors put an end to it entirely. Onaverage, 80% of declarations adjusted in the yellow channel had been adjustedvia an offsetting entry by the inspector who carried out the assessment. Butthis proportion fell to 7% for office DP I and 19% for office DP V by April 2010and close to 0% in the following months.
5.2 Non-Quantifiable Results
Three non-quantifiable impacts of the performance contracts have also beendetected. The operational managers used the contracts as an argument toorganise greater fluidity in inspection procedures with the operator of thecontainer terminal, a request that had previously gone unanswered for overtwo years.
The inspectors became more ‘diligent’, in their own words and those oftheir superiors. The strong constraint of trade facilitation and the end of thecompetition to attract most declarations requires a more constant presenceof inspectors in the office.
Finally, the relationships between the inspectors and their office heads haveimproved by making the actors more aware of their responsibilities. Hav-ing become accountable to the director general for their litigation results,the inspectors refused to assume responsibility for rerouting declarations atthe request of their superiors. The superiors themselves reroute declarationswhere their information shows this to be necessary.
In January 2011, one year after the experiment’s start, the director generalpromoted the four best officers of the two bureaus (office DP I and office DP V)to better positions, including two positions as bureau heads. The poorer per-forming officers were transferred to minor bureaus. The impact of this deci-sion is very powerful. Indeed, all customs officers know that the government,and not the head of customs, has the authority to nominate an inspector to aposition of bureau head. These appointments meant therefore that the gov-ernment considered the performance contract results in making its decision.This has affected the perception of performance contracts within the portand the customs community itself. Consequently, many of the interviewedcustoms officers working in other bureaus now wish their bureau to be underperformance contracts too.
After three years of introducing quantification systems and a policy ofpatient implementation, these results mark a positive change in CameroonCustoms.19 Front-line inspectors have a precise account of their actions inthe system, giving them evidence and justifications in case of blacklisting.
19This is confirmed by surveys of customs agents, in particular during the performancecontracts experiment period.
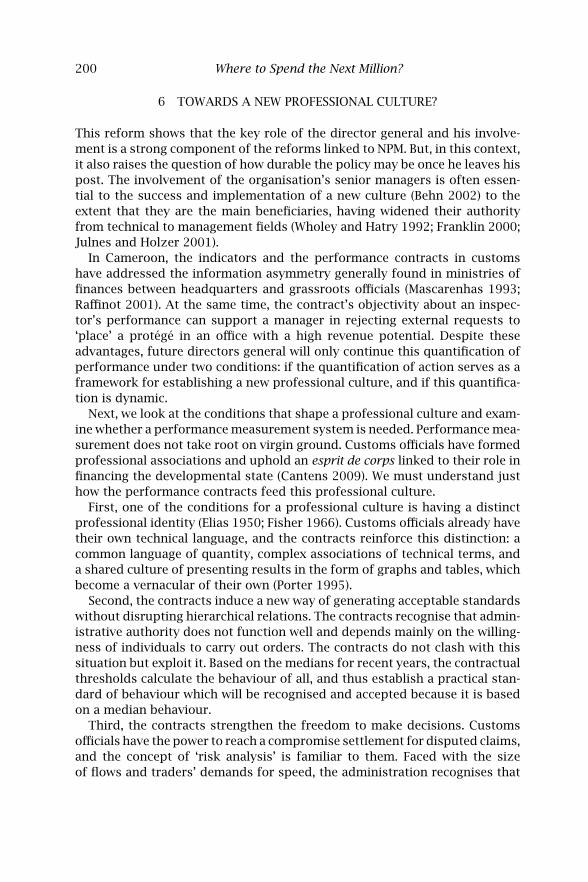
200 Where to Spend the Next Million?
6 TOWARDS A NEW PROFESSIONAL CULTURE?
This reform shows that the key role of the director general and his involve-ment is a strong component of the reforms linked to NPM. But, in this context,it also raises the question of how durable the policy may be once he leaves hispost. The involvement of the organisation’s senior managers is often essen-tial to the success and implementation of a new culture (Behn 2002) to theextent that they are the main beneficiaries, having widened their authorityfrom technical to management fields (Wholey and Hatry 1992; Franklin 2000;Julnes and Holzer 2001).
In Cameroon, the indicators and the performance contracts in customshave addressed the information asymmetry generally found in ministries offinances between headquarters and grassroots officials (Mascarenhas 1993;Raffinot 2001). At the same time, the contract’s objectivity about an inspec-tor’s performance can support a manager in rejecting external requests to‘place’ a protégé in an office with a high revenue potential. Despite theseadvantages, future directors general will only continue this quantification ofperformance under two conditions: if the quantification of action serves as aframework for establishing a new professional culture, and if this quantifica-tion is dynamic.
Next, we look at the conditions that shape a professional culture and exam-ine whether a performance measurement system is needed. Performance mea-surement does not take root on virgin ground. Customs officials have formedprofessional associations and uphold an esprit de corps linked to their role infinancing the developmental state (Cantens 2009). We must understand justhow the performance contracts feed this professional culture.
First, one of the conditions for a professional culture is having a distinctprofessional identity (Elias 1950; Fisher 1966). Customs officials already havetheir own technical language, and the contracts reinforce this distinction: acommon language of quantity, complex associations of technical terms, anda shared culture of presenting results in the form of graphs and tables, whichbecome a vernacular of their own (Porter 1995).
Second, the contracts induce a new way of generating acceptable standardswithout disrupting hierarchical relations. The contracts recognise that admin-istrative authority does not function well and depends mainly on the willing-ness of individuals to carry out orders. The contracts do not clash with thissituation but exploit it. Based on the medians for recent years, the contractualthresholds calculate the behaviour of all, and thus establish a practical stan-dard of behaviour which will be recognised and accepted because it is basedon a median behaviour.
Third, the contracts strengthen the freedom to make decisions. Customsofficials have the power to reach a compromise settlement for disputed claims,and the concept of ‘risk analysis’ is familiar to them. Faced with the sizeof flows and traders’ demands for speed, the administration recognises that
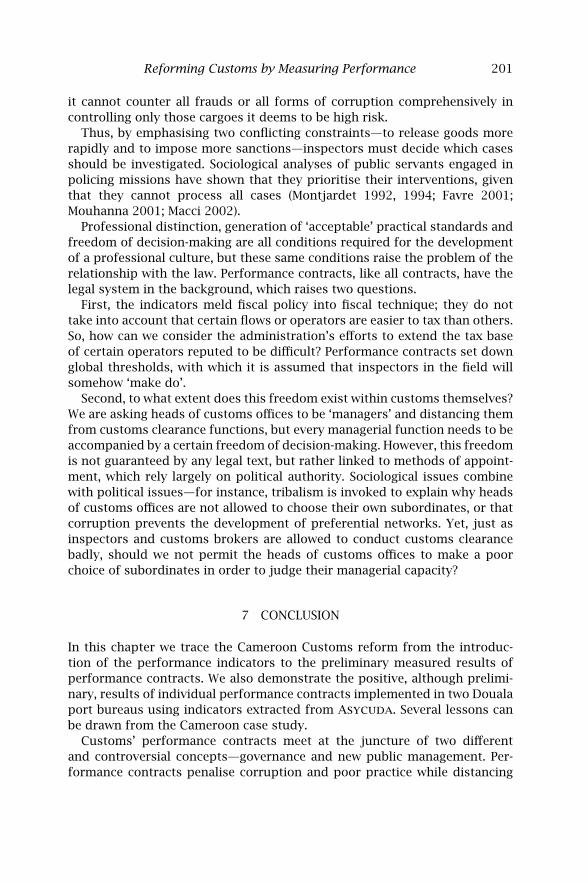
Reforming Customs by Measuring Performance 201
it cannot counter all frauds or all forms of corruption comprehensively incontrolling only those cargoes it deems to be high risk.
Thus, by emphasising two conflicting constraints—to release goods morerapidly and to impose more sanctions—inspectors must decide which casesshould be investigated. Sociological analyses of public servants engaged inpolicing missions have shown that they prioritise their interventions, giventhat they cannot process all cases (Montjardet 1992, 1994; Favre 2001;Mouhanna 2001; Macci 2002).
Professional distinction, generation of ‘acceptable’ practical standards andfreedom of decision-making are all conditions required for the developmentof a professional culture, but these same conditions raise the problem of therelationship with the law. Performance contracts, like all contracts, have thelegal system in the background, which raises two questions.
First, the indicators meld fiscal policy into fiscal technique; they do nottake into account that certain flows or operators are easier to tax than others.So, how can we consider the administration’s efforts to extend the tax baseof certain operators reputed to be difficult? Performance contracts set downglobal thresholds, with which it is assumed that inspectors in the field willsomehow ‘make do’.
Second, to what extent does this freedom exist within customs themselves?We are asking heads of customs offices to be ‘managers’ and distancing themfrom customs clearance functions, but every managerial function needs to beaccompanied by a certain freedom of decision-making. However, this freedomis not guaranteed by any legal text, but rather linked to methods of appoint-ment, which rely largely on political authority. Sociological issues combinewith political issues—for instance, tribalism is invoked to explain why headsof customs offices are not allowed to choose their own subordinates, or thatcorruption prevents the development of preferential networks. Yet, just asinspectors and customs brokers are allowed to conduct customs clearancebadly, should we not permit the heads of customs offices to make a poorchoice of subordinates in order to judge their managerial capacity?
7 CONCLUSION
In this chapter we trace the Cameroon Customs reform from the introduc-tion of the performance indicators to the preliminary measured results ofperformance contracts. We also demonstrate the positive, although prelimi-nary, results of individual performance contracts implemented in two Doualaport bureaus using indicators extracted from Asycuda. Several lessons canbe drawn from the Cameroon case study.
Customs’ performance contracts meet at the juncture of two differentand controversial concepts—governance and new public management. Per-formance contracts penalise corruption and poor practice while distancing
202 Where to Spend the Next Million?
themselves from any origins of corruption. As with a crime or offence (Craw-ford 2003), the contracts allow a return to the idea of a ‘situation of gov-ernance’ (Blundo 2002) and the need for empirical research; corruption is aquestion of opportunities and acts, not of predisposition or specific individu-als. Given their use of a standard calculation method, the contracts thereforeconstitute a policy of corruption prevention and detection.
The fact that this is a pilot and not a vast, structured programme has twoadvantages. First, Cameroon Customs has controlled the risk that a majorconceptual reform might pose to revenue collection. There was no questionthat the contracts would compromise the level of revenues collected. On theother hand, the hierarchy’s commitment to reform is always questioned bygrassroots agents (Behn 2002). The pilot imposed a rapid pace, which urgedthe head of customs to quickly demonstrate that she would fulfil her partof the contracts and convince officers under contracts that she was ready togrant them more flexibility: rewards as well as sanctions.
Wholey and Hatry (1992) defined four conditions for performance measure-ment:
• the right time (not necessarily when drawing up the financial balancesheet);
• a comparison (with the past or with an objective);
• a selection (it is not possible to measure everything);
• low cost.
In the case of Cameroon Customs, we have seen that timing was a keyelement in success: taking time to implement the contracts was the leitmotifof the directors general.
In addition, the indicators of the contracts have always been calculatedon the basis of performances in previous years. The historic dimension isessential—any reform must also help clarify what change it is helping to bringabout. And, finally, in terms of costs, all IT developments specific to perfor-mance measurement have been achieved using free software.
Establishing a policy of indicators and performance contracts has theadvantage of giving more weight to the empirical knowledge of how theadministration actually operates and of offering the framework for its ownevaluation (Varone and Jacob 2004). However, this advantage is often per-ceived as a risk: quantification of public action is a leap into the unknown,and the heads of administration may be afraid of revealing the failings of theirstructure. In a way it is inevitable. The Cameroon pilot is interesting becauseit was done in a context where public servants were all labelled corrupt by thepublic. There was therefore little resistance on their part to investing in a per-formance culture that could prove this to be untrue and that could highlightthe efforts made.
Even if the evaluation of the pilot performance contracts has not adoptedthe gold statistical standards because of the context, doing before–after com-
Reforming Customs by Measuring Performance 203
parisons is feasible and desirable. Performance contracts, as designed in theCameroon case, are not replicable as they are in other contexts; they onlydemonstrate what is possible. We cannot advocate that there is no ‘one sizefits all’ solution in development while, at the same, always be looking for sim-plistic replication. What is replicable—although it is not a new idea—is theintroduction of performance measurement at individual levels based on theexistence of IT systems to fight bad practices and make reforms effective onthe ground.
After almost two years of work on this experiment, we can advocate thequantification of public action in customs (which is useful for impact eval-uation) but we should also advocate the need for a qualitative understand-ing before, during and after the reform in order to evaluate change. Fromour point of view, this is a major difference with most impact evaluation ofdonors’ interventions in trade areas. In customs reforms, as in any adminis-trative reform, we have to understand what makes sense before designing anyreform and evaluation plan. Therefore, empirical knowledge is a pre-requisitefor a positive impact.
Thomas Cantens is a Researcher at the World Customs Organization.
Gael Raballand is the Senior Economist in the Public Sector Reform and Capac-ity Department, Africa Region at the World Bank.
Samson Bilangna is Head of the Cameroon Customs Information TechnologyDivision.
Marcellin Djeuwo is Head of the Cameroon Customs Risk Analysis Unit.
REFERENCES
Behn, R. (2002). The psychological barriers to performance management: or whyisn’t everyone jumping on the performance-management bandwagon? Public Per-formance & Management Review 26, 5–25.
Besley, T., and M. Ghatak (2005). Competition and incentives with motivated agents.American Economic Review 95, 616–636.
Bilangna, S. (2009). La réforme des douanes camerounaises: entre les contrainteslocales et internationales. Afrique Contemporaine 230, 19–31.
Blundo, G. (2002). La gouvernance entre technique de gouvernement et méthoded’exploration empirique. Editorial, Bulletin de l’APAD, no 23–24, http://apad.revues.org/129.
Cantens, T. (2007). La réforme de la douane camerounaise à l’aide d’un logiciel desNations Unies ou l’appropriation d’un outil de finances publiques. Afrique Contem-poraine 223, 289–307.
Cantens, T. (2009). Être chef dans les douanes camerounaises, entre titular chief, idéal-type et big katika. Afrique Contemporaine 230, 83–100.
Cantens, T. (2011). Is it possible to reform a customs administration? The roleof the customs elite on the reform process in Cameroon. UNU WIDER WorkingPaper 2010/118.
204 Where to Spend the Next Million?
Cantens, T., G. Raballand, and S. Bilangna (2010). Reforming Customs by measuringperformance: a Cameroon case study. World Customs Journal 4(2), 55–74.
Considine, M., and J. M. Lewis. (2003). Bureaucracy, network, or enterprise? Comparingmodels of governance in Australia, Britain, the Netherlands, and New Zealand. PublicAdministration Review 63(2), 131-140.
Crawford, A. (2003). Contractual governance of deviant behavior. Journal of Law andSociety 30, 479–505.
de Balzac, H. (1844). Les Employés (1985 edition). London: Folio Society.Duflo, E., and M. Kremer (2003). Use of randomization in the evaluation of devel-
opment effectiveness. Paper prepared for the World Bank Operations EvaluationDepartment (OED) Conference on Evaluation and Development Effectiveness inWashington, DC.
Elias, N. (1950). Studies in the genesis of the naval profession. British Journal of Soci-ology 1(4), 291–309.
Farrington, D. (2003). British randomized experiments on crime and justice. Annalsof the American Academy of Political and Social Science 589, 150–167.
Favre, P. (2001). Around Dominique Monjardet’s ‘Sociologie de la force publique’:recent books and articles in French in the field of sociology of the police. RevueFrançaise de Sociologie 42, (Supplement: An Annual English Selection 2001), 175–186.
Fisher, G. (1966). The foreign service officer. Annals of the American Academy of Polit-ical and Social Science 368, 71–82.
Franklin, A. L. (2000). An examination of bureaucratic reactions to institutional con-trols. Public Performance & Management Review 24(1), 8–21.
Julnes, P.d.L, and M. Holzer (2001). Promoting the utilization of performance mea-sures in public organizations: an empirical study of factors affecting adoption andimplementation. Public Administration Review 61, 693–708.
Libom, M., T. Cantens, and S. Bilangna (2009). Gazing into the mirror: operationalinternal audit in Cameroon Customs. Discussion Paper 8, World Bank, Washington,DC.
Macci, O. (2002). Dominique Monjardet: ce que fait la police, sociologie de la force.Annales Histoire Sciences Sociales 57(6), pp 1718–1721.
Mascarenhas, R. C. (1993). Building an enterprise culture in the public sector: reformof the public sector in Australia, Britain, and New Zealand. Public AdministrationReview 53, 319–328.
Mbembe, A. (1999). Du gouvernement privé indirect. Politique Africaine 73, 103–121.Mbonji, E. (1999). Les ‘déflatés’ du développement. De la tradition de dépendance à
l’autogestion. Bulletin de l’APAD 18, http://apad.revues.org/455.Merrien, F. X. (1999). La Nouvelle Gestion publique: un concept mythique. Lien Social
et Politiques 41, 95–103.Monjardet, D. (1992). Quelques conditions d’un professionnalisme discipliné. Dé-
viance et Société 16, 399–403.Monjardet, D. (1994). La culture professionnelle des policiers. Revue Française de Soci-
ologie 35, 393–411.Mouhanna, C. (2001). Faire le gendarme: de la souplesse informelle a la rigueur bureau-
cratique. Revue Française de Sociologie 42, 31–55.Ogien, A. (2010). La valeur sociale du chiffre. La quantification de l’action publique
entre performance et démocratie. Revue Française de Socio-économie 5(1), 19–40.Porter, T. M. (1995). Trust in Numbers: The Pursuit of Objectivity in Science and Public
Life. Princeton University Press.
Reforming Customs by Measuring Performance 205
Raffinot, M. (2001). ‘Motiver’ et ‘chicoter’: l’économie politique de la pression fiscaleen Afrique subsaharienne. Autrepart 20, 91–106.
Rouban, L. (1998). Les états occidentaux d’une gouvernementalité à l’autre. CritiqueInternationale 1, 131–149.
Spanou, C. (2003). Abandonner ou renforcer l’état wébérien. Revue Française d’Admin-istration Publique 1-2(105), 109–120.
Strathern, M. (2001). Blowing hot and cold. Anthropology Today 17(1), 1–2.Turner, H., R. Boruch, A. Petrosino, J. Lavenberg, D. de Moya, and H. Rothstein
(2003). Populating an international web-based randomized trials register in thesocial, behavioral, criminological, and education sciences. Annals of the AmericanAcademy of Political and Social Science 589, 203–223.
Varone, F., and S. Jacob (2004). Institutionnalisation de l’évaluation et nouvelle gestionpublique: un état des lieux comparatifs. Revue Internationale de Politique Comparée11, 271–292.
Wholey, J., and H. Hatry (1992). The case for performance monitoring. Public Admin-istration Review 52, 604–610.
World Bank (2005). Bâtir des états performants. Créer des sociétés engages. Groupede travail sur le renforcement des capacités en Afrique. Working Paper, World Bank,Washington, DC.
Ymbert, J.-G. (1825). Mœurs administratives, Volume 1. Paris: Ladvocat.

8
Aid for Trade and Export Performance:The Case of Aid in Services
ESTEBAN FERRO, ALBERTO PORTUGAL-PÉREZ AND JOHN S. WILSON1
1 INTRODUCTION
The response of developed countries to the unprecedented global recessionhas placed their budgets under enormous strain. Unfortunately, foreign aidtops the list of expenses to be cut in donor countries, particularly in the eyesof taxpayers. As donors’ willingness to provide foreign aid could fall, even ifits need remains vital, there is a greater necessity to identify the projects thatmore efficiently pursue the intended goals.
Aid for trade has rapidly gained importance in trade and development cir-cles, as well as in the donor community. Despite enjoying preferential marketaccess and facing lower tariffs, several developing countries (especially leastdeveloping countries) have seen their share of world exports diminish overthe past few years. Clearly, the reduction of tariff and non-tariff barriers is anessential condition for export growth, but not a sufficient one. These coun-tries face supply-side constraints that severely limit their ability to reap thebenefits from global trade integration.
Launched at the Hong Kong WTO Ministerial Conference in December 2005,the Aid for Trade (AfT) Initiative aims at helping developing countries, partic-ularly least developing countries (LDCs), to overcome their supply-side con-straints and expand trade. Despite the clearness of this main goal, its assess-ment has been problematic. Evidence on the positive relationship of AfT andexport performance has been found by estimating equations where exportsvariables are on the left-hand side, and AfT variables are on the right-handside, as well as other covariates.
However, potential reverse causality may arise, as AfT may also be deter-mined by trade performance. For instance, if better performing countries tendto receive more aid, estimates of AfT coefficients would be biased upwards.
1We thank Olivier Cadot, Ana Fernandes, Daniel Lederman, Aaditya Mattoo and par-ticipants of the World Bank’s workshop ‘Impact Evaluation of Trade Related Projects:Paving the Way’ for valuable suggestions and comments throughout the preparation ofthis chapter.
208 Where to Spend the Next Million?
In this chapter, we propose a new identification strategy that overcomesthe reverse-causality problem related to the literature on aid. Using input–output data, we exploit the differential service intensities of industrial sectorsto evaluate the impact of aid in five service sectors (transport, communica-tions, energy, banking/financial services and business services) on exportsof downstream manufacturing sectors for 106 countries between 1990 and2008. Our results show that assistance to the energy and banking sectors hasconsistently had a significant and positive impact on downstream manufac-turing exports.
The rest of the chapter is organised as follows: in Section 2 we providea review of the literature on aid and AfT, and in Section 3 we explain ouridentification strategy. In Section 4 we describe our data, and then presentthe results in Section 5. Finally, in Section 6 we give conclusions and discusspotential avenues for further research.
2 LITERATURE REVIEW
Our review is divided into two parts. We start with a brief account of theextensive literature on aid and growth. The second part defines briefly aid fortrade and reviews the literature that is more specific to it.
2.1 Aid and Growth
The literature on the impact of aid on recipient countries’ level of developmentis large and keeps growing; and we provide a small and selective review in thischapter. Unfortunately, the results of the studies have been mixed.2 There isno robust evidence of either a positive or negative correlation between foreignaid inflows and the economic growth of poor countries.
Most studies that find a positive effect between aid and growth show thatthis relation holds only under specific conditions. For instance, Burnside andDollar (2000) stipulate that the quality of institutions in the recipient countryis key for the effectiveness of aid. Dalgaard et al (2004) find that location(geography) is also an important determinant of aid effectiveness. Angelesand Neanidis (2009) show that the structure of social elites plays an importantpart in shaping the effectiveness of aid. Clemens et al (2004) study the effectof a specific type of aid, and discover that short term aid—including budgetand balance-of-payments support, investments in infrastructure and aid forproductive sectors such as agriculture and industry—has a significant positiveeffect on growth.
2See for example Burnside and Dollar (2000); Collier and Dollar (2002); Easterly (2003);Easterly et al (2003); Clemens et al (2005); Bourguignon and Sundberg (2007); Rajan andSubramanian (2008).
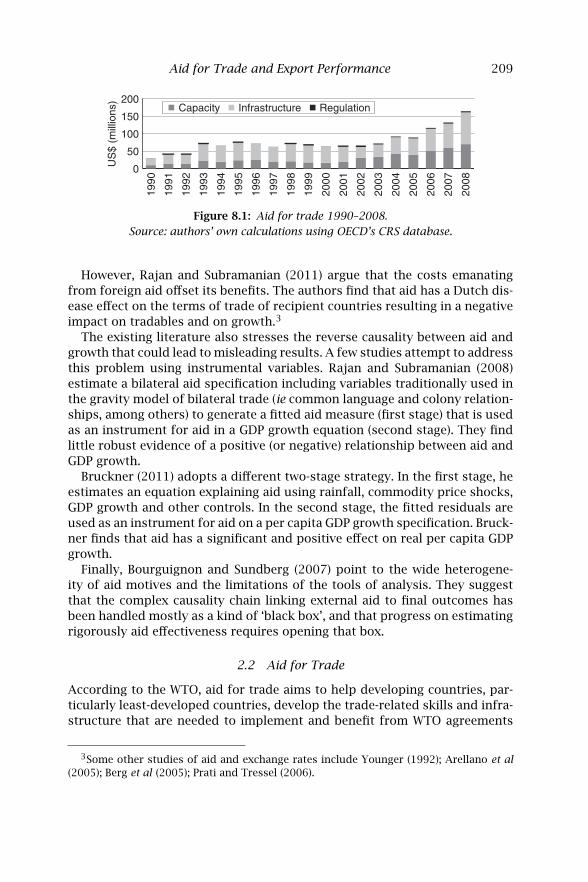
Aid for Trade and Export Performance 209
50
100
150
200
0US
$ (m
illio
ns)
1990
1991
1992
1993
1994
1995
1996
1997
1998
1999
2000
2001
2002
2003
2004
2005
2006
2007
2008
Capacity Infrastructure Regulation
Figure 8.1: Aid for trade 1990–2008.
Source: authors’ own calculations using OECD’s CRS database.
However, Rajan and Subramanian (2011) argue that the costs emanatingfrom foreign aid offset its benefits. The authors find that aid has a Dutch dis-ease effect on the terms of trade of recipient countries resulting in a negativeimpact on tradables and on growth.3
The existing literature also stresses the reverse causality between aid andgrowth that could lead to misleading results. A few studies attempt to addressthis problem using instrumental variables. Rajan and Subramanian (2008)estimate a bilateral aid specification including variables traditionally used inthe gravity model of bilateral trade (ie common language and colony relation-ships, among others) to generate a fitted aid measure (first stage) that is usedas an instrument for aid in a GDP growth equation (second stage). They findlittle robust evidence of a positive (or negative) relationship between aid andGDP growth.
Bruckner (2011) adopts a different two-stage strategy. In the first stage, heestimates an equation explaining aid using rainfall, commodity price shocks,GDP growth and other controls. In the second stage, the fitted residuals areused as an instrument for aid on a per capita GDP growth specification. Bruck-ner finds that aid has a significant and positive effect on real per capita GDPgrowth.
Finally, Bourguignon and Sundberg (2007) point to the wide heterogene-ity of aid motives and the limitations of the tools of analysis. They suggestthat the complex causality chain linking external aid to final outcomes hasbeen handled mostly as a kind of ‘black box’, and that progress on estimatingrigorously aid effectiveness requires opening that box.
2.2 Aid for Trade
According to the WTO, aid for trade aims to help developing countries, par-ticularly least-developed countries, develop the trade-related skills and infra-structure that are needed to implement and benefit from WTO agreements
3Some other studies of aid and exchange rates include Younger (1992); Arellano et al(2005); Berg et al (2005); Prati and Tressel (2006).
210 Where to Spend the Next Million?
and to expand their trade.4 Aid for trade, as defined by the OECD, nearlytripled between 2001 and 2008, as shown in Figure 8.1; however, evidence ofits effectiveness is still scant.
A limited number of studies focus on the impact of aid for trade.5 Bren-ton and von Uexkuhll (2009) analyse the effectiveness of export-developmentprogrammes. Using a difference-in-differences approach, they aim at isolatingthe impact of the policy interventions and draw four main conclusions.
• Most export-development programmes have coincided with or pre-datedstronger export performance.
• Such programmes appear to be more effective where there is alreadysignificant export activity.
• There is some concern about the ‘additionality’ of the programmes assupport may be channelled to sectors that would have prospered any-way.
• Conclusions strongly depend on what we postulate would have hap-pened in the absence of the policy intervention, so the definition of acredible counterfactual is critical for the evaluation of technical assis-tance for exports.
Helble et al (2009) made one of the first attempts to analyse how foreignaid spent on trade facilitation increases trade flows in developing countries.The authors used a gravity model of bilateral trade and found that the bulkof the relationship between aid and trade appears to come from a narrowset of aid flows directed towards trade policy and regulatory reform, ratherthan broader AfT categories directed toward sectoral trade development orinfrastructure development. Other studies on the effect of aid on trade havefound similar positive results to those found by Helble et al (2009), includingCalì and te Velde (2011), the latter being the closest study to our own.
Indeed, Calì and te Velde (2010) evaluate whether AfT has improved exportperformance. They find that AfT facilitation, and to some extent AfT policyand regulations, helps to reduce the cost of trading (in terms of both exportsand imports). In addition, their results suggest that aid to economic infra-structure increases exports, whereas aid to productive capacity appears tohave no significant impact on exports. They correctly point out that AfT ispossibly endogenous to exports, particularly aid to productive capacity. Forinstance, if better performing sectors tended to receive more AfT than othersectors, this would generate an upward bias in the aid coefficient.
To address this endogeneity, Calì and te Velde instrument AfT with indexesmeasuring both the degree of respect for civil and political liberties compiledby Freedom House (2009) and the ‘affinity of nations’ compiled by Gartzke
4See http://www.wto.org/english/tratop_e/devel_e/a4t_e/aid4trade_e.htm.5For and extended review of the literature on the relationship of aid and trade, see
Suwa-Eisenmann and Verdier (2007).
Aid for Trade and Export Performance 211
(2009). They argue that many donors choose recipients based on develop-ment and democratic measures like those captured by those indexes thatcorrelate with aid but not with exports. However, they acknowledge that theirinstruments are not appropriate for sectoral analysis, as they vary only acrosscountry and year, and not across country, sector and year.
We propose an alternative identification strategy that allows us to analysethe impact of sectoral aid. To address reverse causality, we exploit the linksbetween the service sector and the manufacturing sector relying on input–output tables. Although input–output data has not been used in the analy-sis of aid effectiveness so far, we found a number of studies, particularlyin the FDI literature, that use such data. Given the difficulty of finding con-sistent input–output matrices across countries, most studies rely on input–output data from the USA to describe the technological possibilities of firmsin a given economy. Acemoglu et al (2009) investigate how contracting costsand financial development determine the extent of vertical integration acrosscountries. Alfaro and Charlton (2009) use new firm-level data at the four-digitsector level and US input–output tables to classify firms between horizontaland vertical subsidiaries.
The authors find that, at the two-digit industry level, there are consider-ably more horizontal (subsidiaries in the same industry as their parents) thanvertical (subsidiaries that supply their parents with inputs) FDI. However, dis-aggregating to the four-digit level reveals that many of the foreign subsidiariesin the same two-digit industry as their parents are, in fact, located in sectorsthat produce highly specialised inputs to their parents’ production. Thus, con-trary to the conventional wisdom, the authors find that the number of verticalmultinational subsidiaries is larger than commonly thought.
Among the few studies using input–output data for countries other than theUSA, Hummels et al (2001) define a measure of vertical specialisation that cap-tures a country’s role in the fragmentation of production into multiple stagesin multiple locations. They use input–output tables from ten OECD nationsand four other countries to measure a country’s vertical specialisation as itsexports weighted by the share of imported inputs in its total output. Treflerand Zhu (2010) use 20 input–output tables from the Global Trade AnalysisProject (GTAP) to reassess Vanek’s (1968) factor content of trade predictionsin 41 countries.
3 TACKLING REVERSE CAUSALITY: AN IDENTIFICATION STRATEGY
Aid flows are expected to have an impact on exports, but a country’s exportsmay also affect the aid the country receives. It is plausible that donors targetindustries in recipient countries where exports are expanding or declining(see, for example, Brenton and von Uexkuhll 2009).
To address this issue, we propose a new identification strategy. Instead ofdirectly analysing how aid that targets a specific manufacturing sector affects
212 Where to Spend the Next Million?
its own exports, we analyse how aid that targets services—such as bankingand energy services—affects exports of downstream manufacturing makinguse of those services. The following offers an example to illustrate this idea.
The USA is likely to grant a loan to Ecuador to continue developing the cut-flower industry—a major source of export revenue for that country—which islikely to result in greater exports. In this case, exports determine aid flows,and aid also affects exports.
But the USA is less likely to grant a loan to the Ecuadorian governmentto develop the banking or energy sector in order to build up the cut-flowerindustry in the country. In this case exports would not determine aid flowseven though aid to these services will indirectly have an impact on exportsnot only of cut flowers but of all other industries. This link between servicesand manufacturing will help us to quantify the impact of aid on exports.
For our identification strategy, we need to control not only for the aidreceived by each service sector but also for how intensively each manufac-turing sector uses the different services. We use the total input requirementsmatrix to measure the service intensity of each manufacturing sector. Thus,exports are determined by
lnXijt = αij + γit + δjt +∑kβk(ln aidikt intensityijk)+ εijt (8.1)
where Xijt is exports of sector j in country i in year t, aidikt is the amountof aid in service sector k received by country i in year t and intensityijk isthe intensity with which the manufacturing sector j uses service sector k incountry i. We also include country–sector effects, αij , to control for factorssuch as taxes or subsidies specific to a manufacturing sector in a given coun-try. Country–year effects, γit , control for inflation, exchange rates, politicalor economic shocks and climate shocks such as natural disasters. Sector–year effects, δjt , control for shocks specific to a product worldwide in a givenyear, such as any supply or demand shock having an impact on world marketprices.
4 DATA DESCRIPTION
Data is compiled from three main sources. Aid flow data were gathered fromthe OECD’s Creditor Reporting System (CRS); exports, specifically mirroredimports, were taken from UNCTAD’s Comtrade database; and input–outputtables were compiled from the US Bureau of Economic Activity and fromArgentina’s INDEC. Since each of these sources uses different classificationschemes, we first merged all databases together through the concordancesdescribed in Table 8.1, which also describes the five input service sectors andthe nine manufacturing sectors used in our analysis. The final sample consistsof 106 developing countries over the period 1990–2008. Table 8.2 lists all thecountries in the sample.
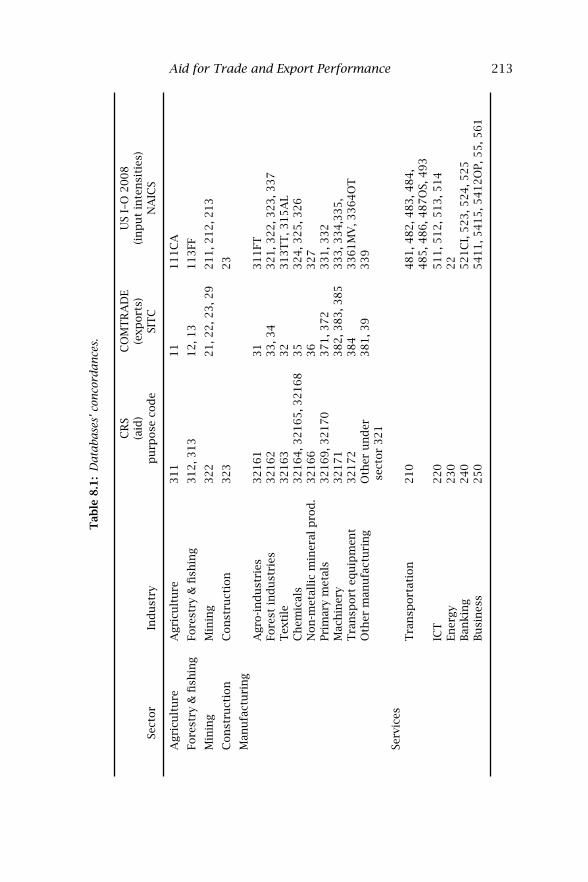
Aid for Trade and Export Performance 213
Tab
le8.1
:D
ata
base
s’co
nco
rdan
ces.
CR
SC
OM
TR
AD
EU
SI–
O2008
(aid
)(e
xport
s)(i
np
ut
inte
nsi
ties
)Se
ctor
Ind
ust
ryp
urp
ose
cod
eSI
TC
NA
ICS
Agri
cult
ure
Agri
cult
ure
311
11
111C
A
Fore
stry
&fi
shin
gFo
rest
ry&
fish
ing
312,3
13
12,1
3113FF
Min
ing
Min
ing
322
21,2
2,2
3,2
9211,2
12,2
13
Con
stru
ctio
nC
on
stru
ctio
n323
23
Man
ufa
ctu
rin
gA
gro
-in
du
stri
es32161
31
311FT
Fore
stin
du
stri
es32162
33,3
4321,3
22,3
23,3
37
Tex
tile
32163
32
313T
T,3
15A
LC
hem
ical
s32164,3
2165,3
2168
35
324,3
25,3
26
Non
-met
alli
cm
iner
alp
rod
.32166
36
327
Pri
mar
ym
etal
s32169,3
2170
371,3
72
331,3
32
Mac
hin
ery
32171
382,3
83,3
85
333,3
34,3
35,
Tra
nsp
ort
equ
ipm
ent
32172
384
3361M
V,3
364O
TO
ther
man
ufa
ctu
rin
gO
ther
un
der
381,3
9339
sect
or
321
Serv
ices
Tra
nsp
ort
atio
n210
481,4
82,4
83,4
84,
485,4
86,4
87O
S,493
ICT
220
511,5
12,5
13,5
14
Ener
gy
230
22
Ban
kin
g240
521C
I,523,5
24,5
25
Bu
sin
ess
250
5411,5
415,5
412O
P,5
5,5
61
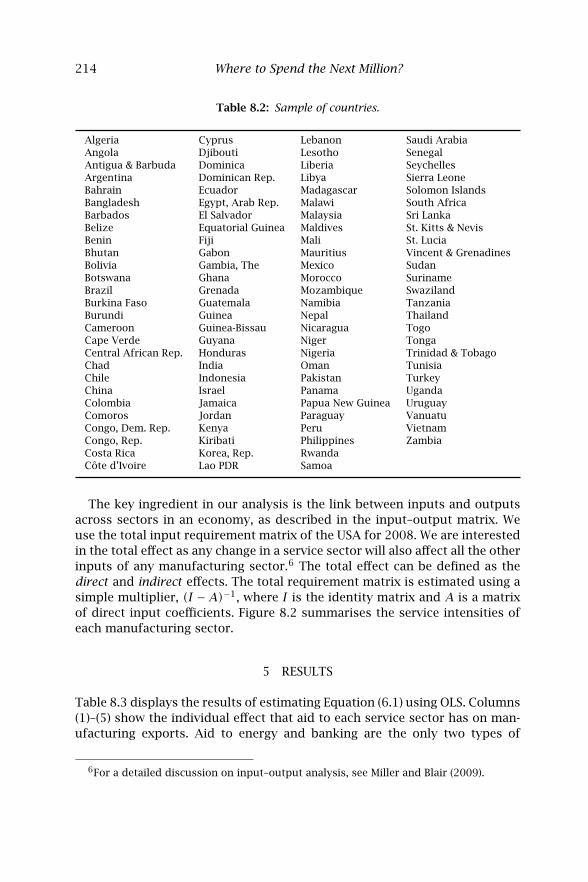
214 Where to Spend the Next Million?
Table 8.2: Sample of countries.
Algeria Cyprus Lebanon Saudi ArabiaAngola Djibouti Lesotho SenegalAntigua & Barbuda Dominica Liberia SeychellesArgentina Dominican Rep. Libya Sierra LeoneBahrain Ecuador Madagascar Solomon IslandsBangladesh Egypt, Arab Rep. Malawi South AfricaBarbados El Salvador Malaysia Sri LankaBelize Equatorial Guinea Maldives St. Kitts & NevisBenin Fiji Mali St. LuciaBhutan Gabon Mauritius Vincent & GrenadinesBolivia Gambia, The Mexico SudanBotswana Ghana Morocco SurinameBrazil Grenada Mozambique SwazilandBurkina Faso Guatemala Namibia TanzaniaBurundi Guinea Nepal ThailandCameroon Guinea-Bissau Nicaragua TogoCape Verde Guyana Niger TongaCentral African Rep. Honduras Nigeria Trinidad & TobagoChad India Oman TunisiaChile Indonesia Pakistan TurkeyChina Israel Panama UgandaColombia Jamaica Papua New Guinea UruguayComoros Jordan Paraguay VanuatuCongo, Dem. Rep. Kenya Peru VietnamCongo, Rep. Kiribati Philippines ZambiaCosta Rica Korea, Rep. RwandaCôte d’Ivoire Lao PDR Samoa
The key ingredient in our analysis is the link between inputs and outputsacross sectors in an economy, as described in the input–output matrix. Weuse the total input requirement matrix of the USA for 2008. We are interestedin the total effect as any change in a service sector will also affect all the otherinputs of any manufacturing sector.6 The total effect can be defined as thedirect and indirect effects. The total requirement matrix is estimated using asimple multiplier, (I −A)−1, where I is the identity matrix and A is a matrixof direct input coefficients. Figure 8.2 summarises the service intensities ofeach manufacturing sector.
5 RESULTS
Table 8.3 displays the results of estimating Equation (6.1) using OLS. Columns(1)–(5) show the individual effect that aid to each service sector has on man-ufacturing exports. Aid to energy and banking are the only two types of
6For a detailed discussion on input–output analysis, see Miller and Blair (2009).
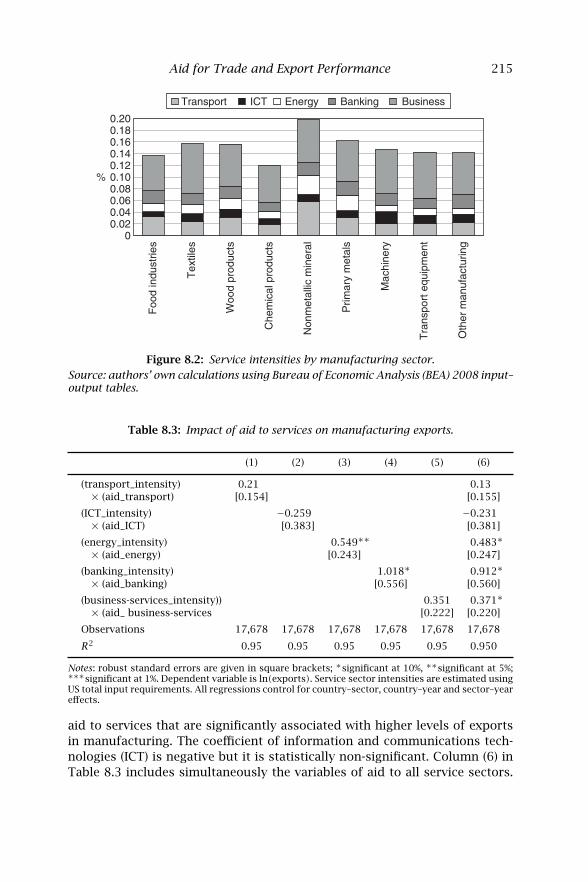
Aid for Trade and Export Performance 215
0.020.040.060.080.100.120.140.160.180.20
0
Foo
d in
dust
ries
Tex
tiles
Woo
d pr
oduc
ts
Che
mic
al p
rodu
cts
Non
met
allic
min
eral
Prim
ary
met
als
Mac
hine
ry
Tra
nspo
rt e
quip
men
t
Oth
er m
anuf
actu
ring
Transport ICT Energy Banking Business
%
Figure 8.2: Service intensities by manufacturing sector.
Source: authors’ own calculations using Bureau of Economic Analysis (BEA) 2008 input–output tables.
Table 8.3: Impact of aid to services on manufacturing exports.
(1) (2) (3) (4) (5) (6)
(transport_intensity) 0.21 0.13× (aid_transport) [0.154] [0.155]
(ICT_intensity) −0.259 −0.231× (aid_ICT) [0.383] [0.381]
(energy_intensity) 0.549∗∗ 0.483∗
× (aid_energy) [0.243] [0.247]
(banking_intensity) 1.018∗ 0.912∗
× (aid_banking) [0.556] [0.560]
(business-services_intensity)) 0.351 0.371∗
× (aid_ business-services [0.222] [0.220]
Observations 17,678 17,678 17,678 17,678 17,678 17,678
R2 0.95 0.95 0.95 0.95 0.95 0.950
Notes: robust standard errors are given in square brackets; ∗significant at 10%, ∗∗significant at 5%;∗∗∗significant at 1%. Dependent variable is ln(exports). Service sector intensities are estimated usingUS total input requirements. All regressions control for country–sector, country–year and sector–yeareffects.
aid to services that are significantly associated with higher levels of exportsin manufacturing. The coefficient of information and communications tech-nologies (ICT) is negative but it is statistically non-significant. Column (6) inTable 8.3 includes simultaneously the variables of aid to all service sectors.
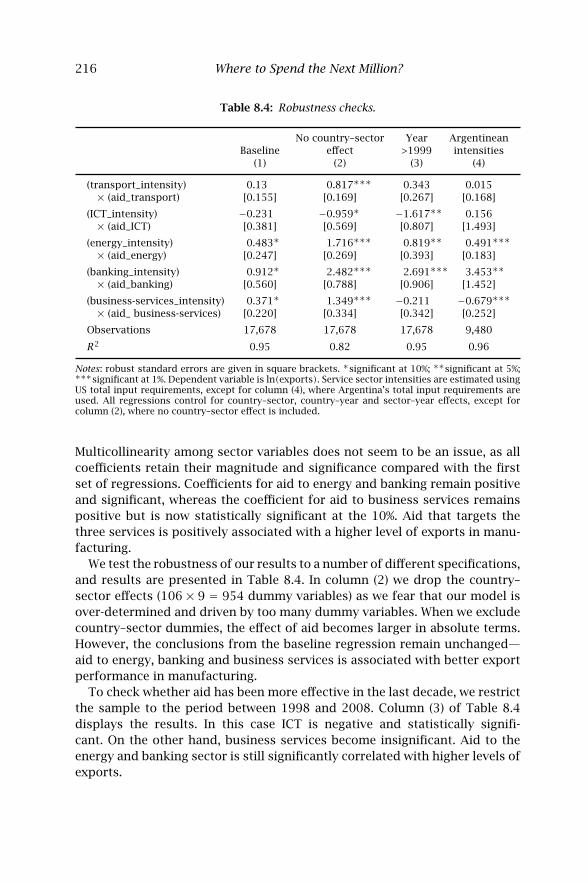
216 Where to Spend the Next Million?
Table 8.4: Robustness checks.
No country–sector Year ArgentineanBaseline effect >1999 intensities
(1) (2) (3) (4)
(transport_intensity) 0.13 0.817∗∗∗ 0.343 0.015× (aid_transport) [0.155] [0.169] [0.267] [0.168]
(ICT_intensity) −0.231 −0.959∗ −1.617∗∗ 0.156× (aid_ICT) [0.381] [0.569] [0.807] [1.493]
(energy_intensity) 0.483∗ 1.716∗∗∗ 0.819∗∗ 0.491∗∗∗
× (aid_energy) [0.247] [0.269] [0.393] [0.183]
(banking_intensity) 0.912∗ 2.482∗∗∗ 2.691∗∗∗ 3.453∗∗
× (aid_banking) [0.560] [0.788] [0.906] [1.452]
(business-services_intensity) 0.371∗ 1.349∗∗∗ −0.211 −0.679∗∗∗
× (aid_ business-services) [0.220] [0.334] [0.342] [0.252]
Observations 17,678 17,678 17,678 9,480
R2 0.95 0.82 0.95 0.96
Notes: robust standard errors are given in square brackets. ∗significant at 10%; ∗∗significant at 5%;∗∗∗significant at 1%. Dependent variable is ln(exports). Service sector intensities are estimated usingUS total input requirements, except for column (4), where Argentina’s total input requirements areused. All regressions control for country–sector, country–year and sector–year effects, except forcolumn (2), where no country–sector effect is included.
Multicollinearity among sector variables does not seem to be an issue, as allcoefficients retain their magnitude and significance compared with the firstset of regressions. Coefficients for aid to energy and banking remain positiveand significant, whereas the coefficient for aid to business services remainspositive but is now statistically significant at the 10%. Aid that targets thethree services is positively associated with a higher level of exports in manu-facturing.
We test the robustness of our results to a number of different specifications,and results are presented in Table 8.4. In column (2) we drop the country–sector effects (106 × 9 = 954 dummy variables) as we fear that our model isover-determined and driven by too many dummy variables. When we excludecountry–sector dummies, the effect of aid becomes larger in absolute terms.However, the conclusions from the baseline regression remain unchanged—aid to energy, banking and business services is associated with better exportperformance in manufacturing.
To check whether aid has been more effective in the last decade, we restrictthe sample to the period between 1998 and 2008. Column (3) of Table 8.4displays the results. In this case ICT is negative and statistically signifi-cant. On the other hand, business services become insignificant. Aid to theenergy and banking sector is still significantly correlated with higher levels ofexports.
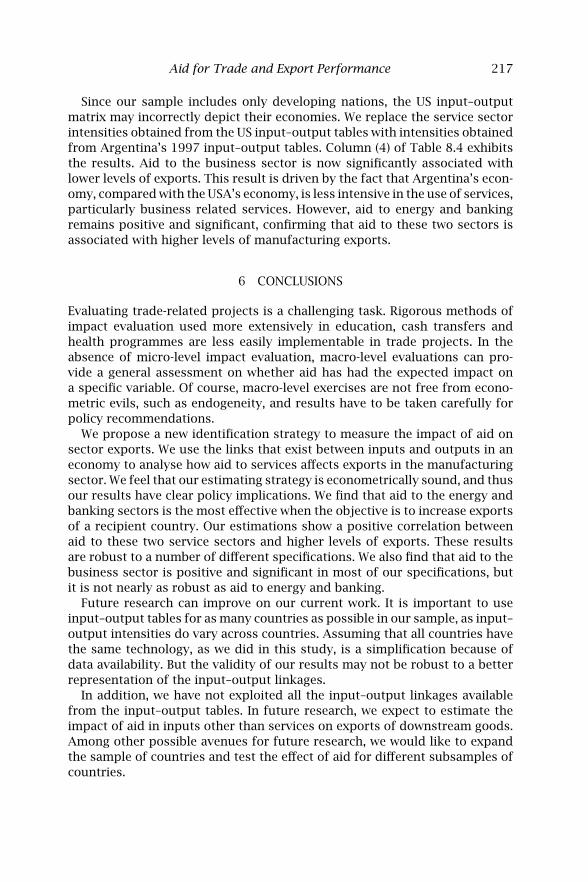
Aid for Trade and Export Performance 217
Since our sample includes only developing nations, the US input–outputmatrix may incorrectly depict their economies. We replace the service sectorintensities obtained from the US input–output tables with intensities obtainedfrom Argentina’s 1997 input–output tables. Column (4) of Table 8.4 exhibitsthe results. Aid to the business sector is now significantly associated withlower levels of exports. This result is driven by the fact that Argentina’s econ-omy, compared with the USA’s economy, is less intensive in the use of services,particularly business related services. However, aid to energy and bankingremains positive and significant, confirming that aid to these two sectors isassociated with higher levels of manufacturing exports.
6 CONCLUSIONS
Evaluating trade-related projects is a challenging task. Rigorous methods ofimpact evaluation used more extensively in education, cash transfers andhealth programmes are less easily implementable in trade projects. In theabsence of micro-level impact evaluation, macro-level evaluations can pro-vide a general assessment on whether aid has had the expected impact ona specific variable. Of course, macro-level exercises are not free from econo-metric evils, such as endogeneity, and results have to be taken carefully forpolicy recommendations.
We propose a new identification strategy to measure the impact of aid onsector exports. We use the links that exist between inputs and outputs in aneconomy to analyse how aid to services affects exports in the manufacturingsector. We feel that our estimating strategy is econometrically sound, and thusour results have clear policy implications. We find that aid to the energy andbanking sectors is the most effective when the objective is to increase exportsof a recipient country. Our estimations show a positive correlation betweenaid to these two service sectors and higher levels of exports. These resultsare robust to a number of different specifications. We also find that aid to thebusiness sector is positive and significant in most of our specifications, butit is not nearly as robust as aid to energy and banking.
Future research can improve on our current work. It is important to useinput–output tables for as many countries as possible in our sample, as input–output intensities do vary across countries. Assuming that all countries havethe same technology, as we did in this study, is a simplification because ofdata availability. But the validity of our results may not be robust to a betterrepresentation of the input–output linkages.
In addition, we have not exploited all the input–output linkages availablefrom the input–output tables. In future research, we expect to estimate theimpact of aid in inputs other than services on exports of downstream goods.Among other possible avenues for future research, we would like to expandthe sample of countries and test the effect of aid for different subsamples ofcountries.
218 Where to Spend the Next Million?
Finally, we stress that results presented here are targeted at stimulatingdiscussion and helping policymakers and stakeholders arrive at a tentativeprioritisation of their efforts regarding AfT. More detailed analysis involvingrigorous impact evaluation of specific projects covering costs and benefitsfor a developing country can help to spend the next million dollars in a wiserway.
Esteban Ferro is a Consultant in the Trade and International Integration Teamof the Development Research Group at the World Bank.
Alberto Portugal-Pérez is an Economist in the Trade and International Inte-gration Team of the Development Research Group at the World Bank.
John S. Wilson is the Lead Economist in the Trade and International Integra-tion Team of the Development Research Group at the World Bank.
REFERENCES
Acemoglu, D., S. Johnson, and T. Mitton (2009). Determinants of vertical integration:financial development and contracting costs. Journal of Finance 64, 1251–1290.
Alfaro, L., and A. Charlton (2009). Intra-industry foreign direct investment. AmericanEconomic Review 99, 2096–2119.
Angeles, L., and K. Neanidis (2009). Aid effectiveness: the role of the local elite. Journalof Development Economics 90, 120–134.
Arellano, C., A. Bulir, T. Lane, and L. Lipschitz (2005). The dynamic implications offoreign aid and its variability. IMF Working Paper 05/119. International MonetaryFund, Washington, DC.
Berg, A., M. Hussain, S. Aiyar, S. Roache, and A. Mahone (2005). The Macroeconomicsof Managing Increased Aid Inflows: Experiences of Low-Income Countries and PolicyImplications Washington, DC: International Monetary Fund.
Bourguignon, F., and M. Sundberg (2007). Aid effectiveness: opening the black box.American Economic Review 97, 316–321.
Brenton P., and E. von Uexkuhll (2009). Product specific technical assistance forexports: has it been effective? The Journal of International Trade and EconomicDevelopment 18, 235–254.
Bruckner, M. (2011). On the simultaneity problem in the aid and growth debate.Research Paper 2011-01, University of Adelaide School of Economics.
Burnside, C., and D. Dollar (2000). Aid, policies, and growth. American EconomicReview 90, 847–868.
Calì, M., and D. te Velde (2011). Towards a quantitative assessment of aid for trade.World Development, forthcoming.
Clemens, M., S. Radelet, and R. Bhavnani (2004). Counting chickens when they hatch:the short-term effect of aid on growth. Working Paper 44, Center for Global Devel-opment, Washington, DC.
Collier, P., and D. Dollar (2002). Aid allocation and poverty reduction. European Eco-nomic Review 46, 1475–1500.
Dalgaard, C., H. Hansen, and F. Tarp (2004). On the empirics of foreign aid and growth.The Economic Journal 114, 191–216.
Aid for Trade and Export Performance 219
Easterly, W. (2003). Can foreign aid buy growth? Journal of Economic Perspectives 17,23–48.
Easterly, W., R. Levine, and D. Roodman (2003). New data, new doubts: revisiting aid,policies, and growth. Working Paper 26, Center for Global Development, Washing-ton, DC.
Freedom House (2009). Freedom in the World country ratings (online database). http://www.freedomhouse.org.
Gamberoni, E., and R. Newfarmer (2009). Aid for trade: matching supply and demand.Working Paper 4991, World Bank Policy Research.
Gartzke, E. (2009). The Affinity of Nations Index 1946–2002, version 4.0 and relateddocuments. http://dss.ucsd.edu/˜egartzke/htmlpages/data.html.
Helble, M., C. L. Mann, and J. S. Wilson (2009). Aid for trade facilitation. WorkingPaper 5064, World Bank Policy Research.
Hummels, D., J. Ishii, and K. Yi (2001). The nature and growth of vertical specializationin world trade. Journal of International Economics 54, 75–96.
Miller, R., and P. Blair (2009). Input–Output Analysis Foundations and Extensions. Cam-bridge University Press.
Mitton, T. (2008). Institutions and concentration. Journal of Development Economics86, 367–394.
Prati, A., and T. Tressel (2006). Aid volatility and Dutch disease. Is there a role formacroeconomic policies? Mimeo, International Monetary Fund, Washington, DC.
Radelet, S., M. Clemens, and R. Bhavnani (2006). Aid and growth: the current debateand some new evidence. In P. Isard, L. Lipschitz, A. Mourmouras and B. Yontcheva(eds), The Macroeconomic Management of Foreign Aid: Opportunities and Pitfalls,pp 43–60. Washington, DC: International Monetary Fund.
Rajan, R., and A. Subramanian (2008). Aid and growth: what does the cross-countryevidence really show? The Review of Economics and Statistics 90, 643–665.
Rajan, R., and A. Subramanian (2011). Aid, Dutch disease, and manufacturing growth.Journal of Development Economics 94, 106–118.
Rajan, R., and L. Zingales (1998). Financial dependence and growth. American Eco-nomic Review 88, 559–586.
Suwa-Eisenmann, A., and T. Verdier (2007). Aid and trade. Oxford Review of EconomicPolicy 23, 481–507.
Trefler, D., and S. Zhu (2010). The structure of factor content predictions. Journal ofInternational Economics 82, 195–207.
Vanek, J. (1968). The factor proportions theory: theN-factor case. Kyklos 21, 749–756.Younger, S. (1992). Aid and Dutch disease: macroeconomic management when every-
body loves you. World Development 20, 1587–1597.
Where to Spend the Next Million? Applying Impact Evaluation to Trade Assistance
edited by Olivier Cadot, Ana M. Fernandes, Julien Gourdon and Aaditya Mattoo
“A welcome trend is emerging towards more clinical and thoughtful approaches to addressing constraints faced by developing countries as they seek to benefit from the gains from trade. But this evolving approach brings with it formidable analytical challenges that we have yet to surmount. We need to know more about available options for evaluating Aid for Trade, which interventions yield the highest returns, and whether experiences in one development area can be transplanted to another. These are some of the issues addressed in this excellent volume.” Pascal Lamy, Director-General, World Trade Organization
“Five years into the Aid for Trade project, we still need to learn much more about what works and what does not. Our initiatives offer excellent opportunities to evaluate impacts rigorously. That is the way to better connect aid to results. The collection of essays in this well-timed volume shows that the new approaches to evaluation that we are applying to education, poverty, or health programs can also be used to assess the results of policies to promote or assist trade. This book offers a valuable contribution to the drive to ensure value for aid money.”Robert Zoellick, President, The World Bank
aa
a
THE WORLD BANK
THE WORLD BANK 9 781907 142390
ISBN 978-1-907142-39-0
Where to Spend the N
ext Million? Applyng Im
pact Evaluation to Trade Assistance