WHERE DO FLINT’S CHILDREN PLAY? CASE REPORT -...
52
WHERE DO FLINT’S CHILDREN PLAY? WHERE DO FLINT’S CHILDREN PLAY? CASE REPORT FLINT, MICHIGAN Evaluation of the Healthy Kids, Healthy Communities National Program December 2009 to December 2013
Transcript of WHERE DO FLINT’S CHILDREN PLAY? CASE REPORT -...

1
WHERE DO FLINT’S CHILDREN PLAY?
WHERE DO FLINT’S CHILDREN PLAY?
CASE REPORT
FLINT, MICHIGAN
Evaluation of the Healthy Kids, Healthy Communities National Program
December 2009 to December 2013
2
WHERE DO FLINT’S CHILDREN PLAY?
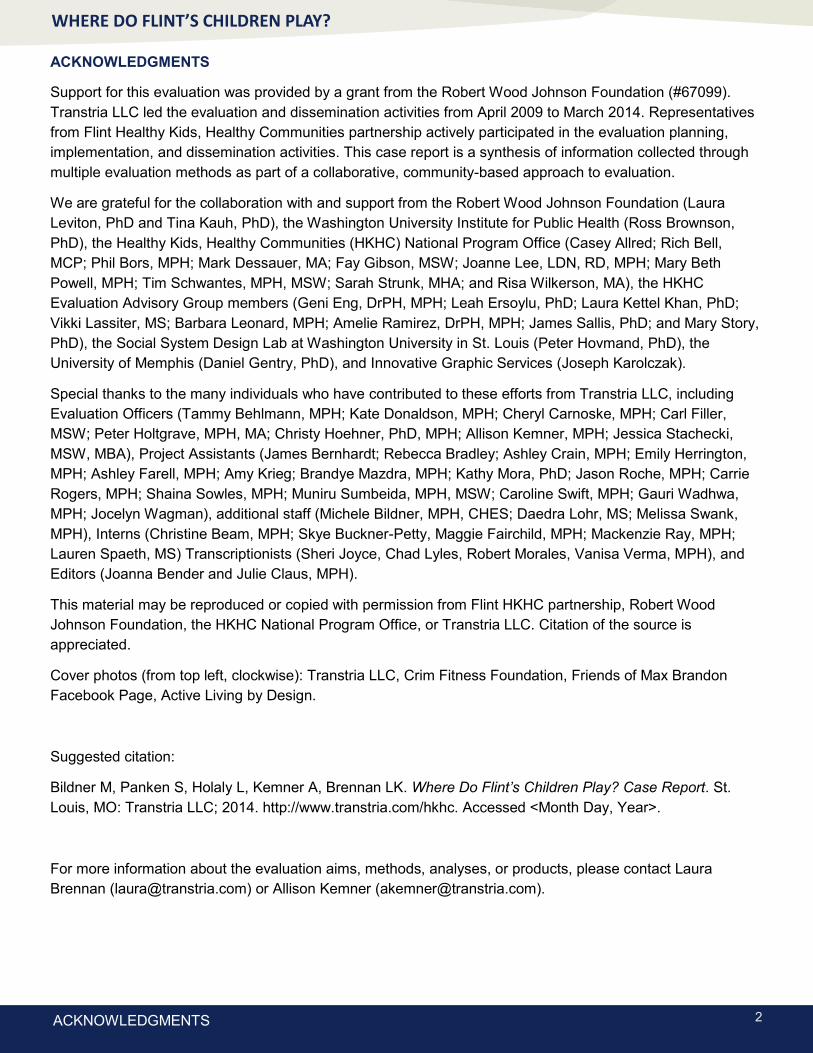
ACKNOWLEDGMENTS
Support for this evaluation was provided by a grant from the Robert Wood Johnson Foundation (#67099).
Transtria LLC led the evaluation and dissemination activities from April 2009 to March 2014. Representatives
from Flint Healthy Kids, Healthy Communities partnership actively participated in the evaluation planning,
implementation, and dissemination activities. This case report is a synthesis of information collected through
multiple evaluation methods as part of a collaborative, community-based approach to evaluation.
We are grateful for the collaboration with and support from the Robert Wood Johnson Foundation (Laura
Leviton, PhD and Tina Kauh, PhD), the Washington University Institute for Public Health (Ross Brownson,
PhD), the Healthy Kids, Healthy Communities (HKHC) National Program Office (Casey Allred; Rich Bell,
MCP; Phil Bors, MPH; Mark Dessauer, MA; Fay Gibson, MSW; Joanne Lee, LDN, RD, MPH; Mary Beth
Powell, MPH; Tim Schwantes, MPH, MSW; Sarah Strunk, MHA; and Risa Wilkerson, MA), the HKHC
Evaluation Advisory Group members (Geni Eng, DrPH, MPH; Leah Ersoylu, PhD; Laura Kettel Khan, PhD;
Vikki Lassiter, MS; Barbara Leonard, MPH; Amelie Ramirez, DrPH, MPH; James Sallis, PhD; and Mary Story,
PhD), the Social System Design Lab at Washington University in St. Louis (Peter Hovmand, PhD), the
University of Memphis (Daniel Gentry, PhD), and Innovative Graphic Services (Joseph Karolczak).
Special thanks to the many individuals who have contributed to these efforts from Transtria LLC, including
Evaluation Officers (Tammy Behlmann, MPH; Kate Donaldson, MPH; Cheryl Carnoske, MPH; Carl Filler,
MSW; Peter Holtgrave, MPH, MA; Christy Hoehner, PhD, MPH; Allison Kemner, MPH; Jessica Stachecki,
MSW, MBA), Project Assistants (James Bernhardt; Rebecca Bradley; Ashley Crain, MPH; Emily Herrington,
MPH; Ashley Farell, MPH; Amy Krieg; Brandye Mazdra, MPH; Kathy Mora, PhD; Jason Roche, MPH; Carrie
Rogers, MPH; Shaina Sowles, MPH; Muniru Sumbeida, MPH, MSW; Caroline Swift, MPH; Gauri Wadhwa,
MPH; Jocelyn Wagman), additional staff (Michele Bildner, MPH, CHES; Daedra Lohr, MS; Melissa Swank,
MPH), Interns (Christine Beam, MPH; Skye Buckner-Petty, Maggie Fairchild, MPH; Mackenzie Ray, MPH;
Lauren Spaeth, MS) Transcriptionists (Sheri Joyce, Chad Lyles, Robert Morales, Vanisa Verma, MPH), and
Editors (Joanna Bender and Julie Claus, MPH).
This material may be reproduced or copied with permission from Flint HKHC partnership, Robert Wood
Johnson Foundation, the HKHC National Program Office, or Transtria LLC. Citation of the source is
appreciated.
Cover photos (from top left, clockwise): Transtria LLC, Crim Fitness Foundation, Friends of Max Brandon
Facebook Page, Active Living by Design.
Suggested citation:
Bildner M, Panken S, Holaly L, Kemner A, Brennan LK. Where Do Flint’s Children Play? Case Report. St.
Louis, MO: Transtria LLC; 2014. http://www.transtria.com/hkhc. Accessed <Month Day, Year>.
For more information about the evaluation aims, methods, analyses, or products, please contact Laura
Brennan ([email protected]) or Allison Kemner ([email protected]).
ACKNOWLEDGMENTS

3
WHERE DO FLINT’S CHILDREN PLAY?
TABLE OF CONTENTS
Background
Community Demographics
Influence of Social Determinants
Where Do Flint’s Children Play? Partnership
Partnership and Community Capacity
Partnership Funding
Community Assessment
Planning and Advocacy Efforts
Healthy Eating and Active Living Strategies
Parks and Play Spaces
Sustainability of the Partnership and Initiative
Tables
Table 1: City of Flint and Neighborhood Demographics
Table 2: Parks Selection Summary Results
Table 3: Community Survey Summary Results
Table 4: Park Use Findings and Recommendations
Table 5: Example Policy Recommendations
Figures
Figure 1: Map of Healthy Kids, Healthy Communities Partnerships
Figure 2: Map of Flint, Michigan’s Parks
Figure 3: Sample GIS Map from Park Equity Assessment
Figure 4: Parks and Play Spaces Infographic
Appendices
Appendix A: Flint, MI Logic Model
Appendix B: Partnership and Community Capacity Survey Results
Appendix C: Partner List
Appendix D: Sources and Amounts of Funding Leveraged
Appendix E: Flint Parks Use: Direct Observation Report
TABLE OF CONTENTS

4
WHERE DO FLINT’S CHILDREN PLAY?
BACKGROUND
Healthy Kids, Healthy Communities National Program
With the goal of preventing childhood obesity, the Healthy Kids, Healthy Communities (HKHC) national program, funded by the Robert Wood Johnson Foundation (RWJF), provided grants to 49 community partnerships across the United States (Figure 1). Healthy eating and active living policy, system, and environmental changes were implemented to support healthier communities for children and families. The program placed special emphasis on reaching children at highest risk for obesity on the basis of race, ethnicity, income, or geographic location.1
Project Officers from the HKHC National Program Office assisted community partnerships in creating and implementing annual workplans organized by goals, tactics, activities, and benchmarks. Through site visits and monthly conference calls, community partnerships also received guidance on developing and maintaining local partnerships, conducting assessments, implementing strategies, and disseminating and sustaining their local initiatives. Additional opportunities supplemented the one-on-one guidance from Project Officers, including peer engagement through annual conferences and a program website, communications training and support, and specialized technical assistance (e.g., health law and policy).
For more about the national program and grantees, visit www.healthykidshealthycommunities.org.
Evaluation of Healthy Kids, Healthy Communities
Transtria LLC and Washington University Institute for Public Health received funding from the Robert Wood Johnson Foundation to evaluate the HKHC national program. They tracked plans, processes, strategies, and
BACKGROUND
Figure 1: Map of Healthy Kids, Healthy Communities Partnerships

5
WHERE DO FLINT’S CHILDREN PLAY?
results related to active living and healthy eating policy, system, and environmental changes as well as influences associated with partnership and community capacity and broader social determinants of health. Reported “actions,” or steps taken by community partnerships to advance their goals, tactics, activities, or benchmarks from their workplans, formed community progress reports tracked through the HKHC Community Dashboard program website. This website included various functions, such as social networking, progress reporting, and tools and resources to maintain a steady flow of users over time and increase peer engagement across communities.
In addition to action reporting, evaluators collaborated with community partners to conduct individual and group interviews with partners and community representatives, environmental audits and direct observations in specific project areas (where applicable), and group model building sessions. Data from an online survey, photos, community annual reports, and existing surveillance systems (e.g., U.S. census) supplemented information collected alongside the community partnerships.
For more about the evaluation, visit www.transtria.com/hkhc.
Flint HKHC Partnership
Where Do Flint’s Children’s Play? was an initiative led by Crim Fitness Foundation (Crim) and Michigan Fitness Foundation (MFF) to help create a safe and maintained park system that provided opportunities for youth and families to be physically active. The partnership and capacity-building strategies of the partnership included:
Friends of Max Brandon: Residents formed a neighborhood group near Max Brandon Park in order to make environmental changes, including building and installing tables and benches, conducting clean-ups and equipment repair, enhancing the existing walking trail, and holding activities in the park. Salem Housing, Inc. (Salem) was contracted to serve as the park champion and Crim with the Flint HKHC partnership transferred leadership skills to the Friends of Max Brandon.
Community Visioning: As part of the assessment phase, several community visioning activities took place including community surveys, youth focus groups, and community conversations. Input to guide the community vision for parks and focus park selection was gathered during Neighborhood Action Sessions that the city of Flint hosted in each of the 9 city wards. This input combined with a community-wide survey and youth focus groups informed focus park selection. Further community conversations (‘Your Park, Your Say’) were hosted with residents and other stakeholders to determine specific needs and actions related to each neighborhood (focus) park. Ongoing community visioning and engagement occurred throughout the project to update the five-year parks and recreation plan (parks plan) and the city’s master plan.
Youth Capacity: In cooperation with Michigan State University and the Boys and Girls Club of Greater Flint, a pilot program was implemented in which local youth learned about planning basics, created 3-D models of their ideas for a local park, and presented their outcomes to local stakeholders.
Political Will: To help residents more effectively navigate city bureaucracy, partnership coordinators and partners routinely met with key policymakers, including city staff, to build stronger relationships and foster political will to support neighborhood residents’ park improvement efforts and better understand the status of the city Parks and Recreation Department (e.g., budget, staff capacity, maintenance plan). As a result, residents became empowered to provide comments on park-related discussions, and they spoke out about their needs and desires for parks in Flint.
Along with partnership and capacity-building strategies, the Flint partnership incorporated assessment and community engagement activities to support the partnership and the healthy eating and active living strategies. The healthy eating and active living strategies of the partnership included:
Parks and Play Spaces: The partnership focused on providing opportunities for Flint children to be physically active outside by initiating community engagement, enhancing park features, and updating the five-year parks plan. Although there are over five dozen parks and green spaces in the city, they are not always maintained, safe places for children and families to be active. Improving the accessibility of Flint’s parks provides an opportunity for children to improve their health.2
See Appendix A and Appendix B for additional information on the partnership’s strategies.
BACKGROUND

6
WHERE DO FLINT’S CHILDREN PLAY?
COMMUNITY DEMOGRAPHICS
Flint, Michigan is located seventy miles west of Lake Huron, 140 miles east of Lake Michigan, and 70 miles northwest of Detroit. It is the seat of Genesee County. The 2010 US Census estimated Flint’s population at 102,434. The median age is 32 with 28% of the population less than 18 years of age. The education levels are low; only 12% of the population earned a bachelor’s degree or higher compared to 22% statewide, and 25% of Flint residents have not earned a high school diploma. In Flint, 28% of families live below the poverty line and 47% of children live in poverty. Of the approximately 15,000 children in the Flint Community Schools, 75% are eligible for free or reduced-priced lunch.
As a result of economic and population decline in the past decade, there has been little resource allocation by
the city of Flint to support healthy eating and active living efforts. However, due to existing efforts in the Flint
community, led and supported by local non-profits and foundations, to address healthy eating and active
living, Flint HKHC was able to narrow its scope to focus on parks. The project area of the Flint HKHC initiative
was the entire city of Flint by catalyzing and implementing change related to park policy and systems
strategies, such as updating the parks plan; while the two focus parks, Max Brandon (48505) and Brennan
(48503) and the surrounding neighborhoods, served as places to pilot park interventions (e.g., physical
improvements, safety initiatives, and activities/events) that could be replicated throughout the city parks
system.
COMMUNITY DEMOGRAPHICS
Figure 2: Map of Flint, Michigan’s Parks3
Table 1: City of Flint and Neighborhood Demographics4
Location Population African
American
Latino White Poverty
Rate
Median Household
Income
Per Capita
Income
Genesee
County
425,790 20.9% 3.1% 75.1% 19.9% $42,730 $22,526
Flint, MI 102,434 37.4% 3.9% 56.6% 39.7% $26,339 $14,606
48503 25,619 49.2% 4.5% 41.4% 32.0% $29,425 $17,759
48505 25,824 81.4% 2.4% 12.6% 41.1% $23,235 $11,616

7
WHERE DO FLINT’S CHILDREN PLAY?
INFLUENCE OF SOCIAL DETERMINANTS
Unemployment
Historically, the job base in Flint was in the auto industry with a recent shift toward jobs in education and healthcare. There was a massive loss of jobs and population decrease with the downturn of the auto industry. The unemployment rate for Flint was 9.7% in May 2013, an improvement since May 2009 when the unemployment rate was 15.4%.5
Housing
Compared to the national average (12.5%), the city of Flint has nearly three times as many vacant properties (34.8%), and the project area surrounding Max Brandon Park is not far behind (30.6%).6 However, improvements have been made to Flint’s downtown over the last seven years. Much of the revitalization in Flint was driven by the local non-profits and the city and paid for with federal grant and foundation funds. Campus housing and mixed use developments have been built, which has increased the number of people living downtown.
School Closures
Flint was designed to have neighborhood schools and parks where children could walk to school and the park. School closures have been occurring frequently in Flint, with approximately 23 closures in the last 10 years. Bunche Elementary (next to Max Brandon Park) closed at the end of the school year in 2012. With school closures, most children are now bussed or driven to school instead of walking due to the increased distance of schools and safety concerns of abandoned homes and blight in the area. The Flint Community Schools are not selling any of the closed school buildings; however, they have leased some of them to organizations like churches.
Theft and Vandalism
Theft and vandalism are major issues within the parks and recreation spaces. Trees, fences, water fountains, manhole covers, and vending machines have all been stolen from parks and recreation facilities. Because the majority of items stolen from parks and recreation facilities were being sold as scrap metal, there has been an effort to track and prohibit these items from being sold. The police department was working with the city to pass ordinances and laws to address the issue. The Parks and Recreation Department is considering painting their fences bright orange in an effort to stop theft or at least the sale of department fences as scrap metal. Park groups (e.g., Friends of Max Brandon) seriously consider these challenges when making decisions about infrastructure improvements to deter theft and vandalism. For example, the Friends of Max Brandon Park intentionally used wooden picnic tables instead of metal to deter thieves.
Public Safety
Public safety continues to be a challenge in Flint. Increases in crime have forced police to prioritize the calls they respond to, leading to very long response times. Patrolling parks and enforcing curfew are not yet seen as priorities. In 2010, the city of Flint used a grant from the Charles Stewart Mott Foundation to reinstitute a community policing strategy—originally developed in the late 1970s in Flint—that relies on neighborhood foot patrols and data-driven crime-fighting. Supplemental strategies for increasing public safety have been to put police mini-stations in each of the city wards to be closer to the community. There are also volunteer patrol cops. Additionally, one of the main reasons that people stated in the HKHC community survey for not using the parks was that they “do not feel safe.” The perceived lack of safety in parks could be enough to deter people from using the parks.
INFLUENCE OF SOCIAL DETERMINANTS
8
WHERE DO FLINT’S CHILDREN PLAY?
FLINT HKHC PARTNERSHIP
A community partnership was created to work on the Flint HKHC project as part of the grant. The Crim Fitness Foundation (Crim) and Michigan Fitness Foundation (MFF) were already working on active living in Flint and partnered to champion the grant. The purpose of the partnership was to make park policy and environmental changes so they would be better used by community members and to create community engagement around the parks.
Lead Agency and Leadership Teams
Crim and MFF were the lead agencies. Crim has been in the community for over 36 years and is a Flint-based organization that focuses on creating active communities through policy and environmental strategies, events, and physical activity and healthy eating programs. Crim has physical activity and nutrition programs in all Flint schools and many other Genesee County schools. Many active living and healthy eating programs are funded by the Ruth Mott Foundation and USDA grants through the Michigan Nutrition Network, as well as other grants and donations. Crim is the lead organization for Safe and Active Genesee for Everyone (SAGE) Coalition, a collaborative of local advocates, non-profit, private, and government organizations working together to advocate for and support active living initiatives that promoted safe opportunities for people to be physically active throughout Genesee County.
MFF, formed in 1994, is a statewide non-profit organization that improves lives and strengthens communities by helping people eat healthy and be physically active. The foundation works to bring about behavior change through programming, special projects, and events that encourage citizens to build physical activity and sound nutrition into their daily routines.2
The Project Director and Project Coordinator roles included facilitation, coordination, setting meetings, and moving the project along. Their roles varied depending on the group with which they were working.
The Project Director has a background in social work, specifically around community organizing. She has served as the Active Living Director for the Crim for five years; she facilitates SAGE and active transportation projects like Safe Routes to School and Complete Streets. She works to ensure that active living programs and projects are incorporated into the city of Flint’s master plan process.
The Project Coordinator has a background in wildlife ecology and urban planning. She has been an employee at MFF for seven years; currently as the Director of Active Communities, where she is involved in active transportation policy and programs.
The Community Outreach Liaison, a part-time staff member, supported the neighborhood-based park groups by attending meetings, taking notes, and ensuring actions were being completed. She also provided outreach to the community about the HKHC project and assisted in updating the parks plan.
See Appendix C for a list of all partners.
Organization and Collaboration
Forming the HKHC partnership facilitated a diverse group of community partners with a variety of technical expertise, experience, and access to community networks coming together to guide project implementation. The partnership initially met monthly as a large group, then transitioned to meeting quarterly. In spring 2011, the partnership decided not to have formal meetings, but instead met on an as-needed basis. The smaller or one-on-one meetings were focused on elements in the workplan that best utilized partners’ time and expertise.
Partnership Champions
Friends of Max Brandon Park
In Max Brandon Park, residents formed a group called “Friends of Max Brandon” to work on beautification and maintenance projects in order to ensure that the park was usable and safe for the community. Members of the Friends of Max Brandon were residents living in the
PARTNERSHIP AND LEADERSHIP PROFILE

9
WHERE DO FLINT’S CHILDREN PLAY?
surrounding neighborhood as well as stakeholders from the faith-based community, non-profit organizations, and key community champions. Community organizations that were involved included AmeriCorps, Regional Flint Juneteenth Committee, and the Genesee Conservation District. The Friends of Max Brandon were championed by Salem Housing, Inc. (Salem), a local community development corporation (CDC). Salem also provides a community tool shed for all community members to use for neighborhood and park clean ups.
One of Friends of Max Brandon’s strengths was its resourcefulness. It was able to secure donated supplies and reuse materials from other projects. Tangible improvements were made to the park: tables and benches were installed, clean-ups were conducted, equipment was repaired, the existing walking trail was enhanced, and activities were held in the park.
Salem Housing, Inc.
Early on, the importance of equipping a local park champion to work with Friends groups was recognized. Crim contracted with Salem, a trusted local CDC located within walking distance of Max Brandon Park, to serve as a park champion for Friends of Max Brandon. Salem allowed the Friends to utilize its space for meetings. Project Coordinators regularly collaborated with Salem staff to help build their facilitation and leadership skills as they worked with Friends of Max Brandon. A transition plan, focused on building-capacity, was put into place to strategically transfer leadership of Friends from HKHC leaders to Salem staff and volunteer community members. Community engagement and capacity-building have strengthened the infrastructure needed to truly integrate project activities into the fabric of the community and sustain the project.
T.R. Harris/South Parks Neighborhood Association
T.R. Harris, another local CDC, championed efforts around Brennan Park on the south side of Flint. T.R. Harris is located in the Brennan Senior Center which is adjacent to the park and where residents met and engaged in a more than year-long planning process resulting in a neighborhood plan that included recommendations for improvements in 3 parks (including Brennan Park). The Southside Neighborhood Plan served as the guiding document for parks improvements in Brennan Park.
Park Tenders Program (Adopt-a-Park)
In cooperation with the HKHC partnership, other local partners explored a formal Flint Adopt-a-Park program comprised of volunteers who were committed to making and keeping parks clean and safe in the city of Flint. The Park Tenders Program was established by Keep Genesee County Beautiful, a program of the United Way of Genesee County, to provide support to community residents in adopting their neighborhood park. Residents and community groups who cared for their neighborhood park received park planning support and funds to implement their prioritized environmental improvements. The Park Tenders Program did not include HKHC focus parks, but was a complementary initiative and utilized information that was gathered during the HKHC assessment phase, such as results from the community-wide survey, amenity assessment, and park plan template.
University of Michigan-Flint Outreach Center for Applied Environmental Research
A strong academic partnership with the University of Michigan-Flint Outreach Center for Applied Environmental Research played a critical role in leading many of the assessment and evaluation activities for the Flint HKHC partnership.
Boys and Girls Club of Greater Flint
To build youth capacity for parks and planning work, a youth planning pilot project was implemented in cooperation with Michigan State University and the Boys and Girls Club of Greater Flint where local youth participated in a four-week program to learn about planning basics, created visual models of their ideas for Max Brandon Park, and presented their outcomes to local stakeholders.
PARTNERSHIP AND LEADERSHIP PROFILE
“I live in the community, and I wanna see the community develop in a more viable, stable place for our senior and children alike, and I'm a senior myself and I donate my time as often as I can. Make it a livable and safe place for children to play and students to walk.”
-Community Member
10
WHERE DO FLINT’S CHILDREN PLAY?
PARTNERSHIP FUNDING
The Crim, through the HKHC initiative, provided stipends between $1,000-2,000 a year to community partners championing park efforts. These included Salem and T.R. Harris. Funds supported Salem to serve as the coordinating entity for the Friends of Max Brandon, and two former AmeriCorps members were transitioned into paid staff. A sample of the funding generated is highlighted below. See Appendix D for sources and amounts of funding leveraged for Flint HKHC.
Parks Funding
The state of Michigan provided grant funding for development in certain parks in the city of Flint. In addition, Michigan Department of Natural Resources funding was secured for trails (non-motorized paths). In order to be eligible for state funding on some projects, the city needs an up-to-date parks and recreation master plan, thus it was essential that the HKHC partnership helped catalyze the 5-year update to the city of Flint parks plan.
The Parks and Recreation Department administrative division was responsible for the overall accountability of the department’s general fund operating budget and the parks millage funds. This division was responsible for payroll/personnel services for full-time, part-time, and seasonal employees.6
Park Millage Funds: This fund is a property tax assessment that serves as the main funding source for the city of Flint parks. Due to Flint’s declining population, the amount of funding generated through the millage changed yearly and continually decreased.
Matched Funds
Ruth Mott Foundation provided matched funding which was used to make physical improvement to Max Brandon Park (e.g., pavilion maintenance, picnic tables).
Genesee Conservation District provided funds for tree removal in Max Brandon Park.
Community Foundation of Greater Flint allocated funds to be used for summer youth programming in the parks.
Budgetary Challenges
Parks suffered in the wake of budget cuts; the department was left without adequate resources and staff to
operate effectively, in large part due to
population loss and the resultant declining tax
base. There were city-wide lay-offs in June
2012 of 150 employees. The city previously
employed thousands of people and recently
only employed between five and six hundred.
Due to inadequate staffing and resources, the
department has been outsourcing/contracting
a large amount of work (e.g., grounds
maintenance, community center operations, or janitorial services).
PARTNERSHIP FUNDING
“It [population] just continues to dwindle year after year after
year. It’s very unfortunate where we are right now. We had
180, 190 thousand people and now we’re down to just 100.
That’s a huge tax base that we’ve lost out on right there.”
-Community Member

11
WHERE DO FLINT’S CHILDREN PLAY?
COMMUNITY ASSESSMENT
A multi-component approach was used to evaluate parks in Flint starting with a process to select focus parks. To develop criteria for focus park selection, a variety of assessments were used. Community engagement, surveys, and youth focus groups were used to gather information about Flint residents’ attitudes and behaviors related to parks. A park equity assessment was conducted to understand population demographics in relationship to park space need in the community. Data analysis of the Flint “Speak to Your Health” survey highlighted residents’ health status and neighborhood environment characteristics. Other assessment activities included a park amenity assessment, direct observation to look at park usage, policy analysis to examine the current status of Flint parks policies, and key informant interviews with city officials. All assessments informed park policy recommendations that were shared with local stakeholders and decision-makers to help guide the update of the parks plan and city master plan
Selection of Focus Parks
In determining which parks to focus HKHC efforts, a park selection scoring sheet was developed by the HKHC Partnership to rate each park according to a variety of factors. The maximum score that a park could receive was nine points (one point for each criterion). The criterion were: existing amenities, presence of youth under 18, proximity to a school, active neighborhood groups, safety, neighborhood environment, health status, and community engagement of youth and adults. Location was also used as a criterion to ensure parks were chosen throughout the city. See Table 2 for selection criteria results.
Community Engagement Sessions/Youth Focus Groups: There were several opportunities for residents and other partners to share feedback about the potential focus parks. The HKHC Project Director facilitated youth focus groups with youth from Big Brothers Big Sisters and the Boys and Girls Club of Greater Flint in order to hear their perspectives on Flint parks. More than 30 youth participated in the focus groups. Additionally, through the Neighborhood Action Planning Sessions, residents shared their perspectives on parks; these results were included in the focus park selection process. After focus parks were identified, residents and other stakeholders were also engaged to plan potential park improvements at those parks.
Surveys: A community-wide survey was conducted to determine attitudes of and behaviors in parks, perception of park safety, travel behaviors to access parks, and parks currently utilized by residents. As mentioned above, these data informed the process to select focus parks. Hard copies and an online version of the survey were developed. More than 700 people responded and over 500 were Flint residents. Participants were given incentive cards upon survey completion that were used to collect (optional) contact
COMMUNITY ASSESSMENT
Table 2: Parks Selection
Summary Results
Park Name Total
Points
Bassett 7
Brennan* 6
Broome 7
Cook 5
Flint Park Lake 7
Hasselbring 5
Longway 4
Mann Hall 4
Max Brandon* 8
Mott 6
Whaley 7
*HKHC focus parks Source: HKHC Dashboard
Table 3: Community Survey Summary Results
Question Response Rate
Close to home 48.60% Why do you use City of Flint parks?
Like [being] outside 47.90%
Why don’t you use City of Flint parks? Safety 31.60%
Nothing to do 16.80%
Is there a safe route via walking or biking to get to parks in your neighborhood?
Yes 54.90%
Don’t know 21.70%
What activities in City of Flint parks would you like to participate in?
Activities 51.40%
Clubs 36.10%
De-stressing 48.60%
How important do you think creating and maintaining a vibrant parks system are as part of the economic revitalization in the City of Flint?
Very important 54.70%

12
WHERE DO FLINT’S CHILDREN PLAY?
COMMUNITY ASSESSMENT
information for future engagement. In addition to these data being integrated into the focus park selection process, See Table 3 for a sample of results.
Equity Assessment: The park equity assessment utilized a methodology developed by the Trust for Public Land to examine the whether the distribution of parks met the need in the community. The analysis included using Geographic Information Systems (GIS) technology to map the location of parks in Flint and view overlays of demographic information collected from U.S. Census. This equity assessment was first completed with 2000 census data and then revised using the 2010 census data. Results indicated that parks were well-distributed across the city, serving 80% of the total population. Furthermore, 60% of people were within walking distance of a neighborhood park. See Figure 3 for a sample GIS map from the equity assessment.
Speak To Your Health! Community Survey: The Prevention Research Center (PRC) of Michigan designed, conducted, and analyzed their biennial “Speak To Your Health!” community survey. The data from this survey encompassed a wide range of issues related to individual and community health in Flint and Genesee County, Michigan. Analyzing the results from key questions (e.g., physical activity levels, mental health stressors, and neighborhood environment characteristics) from the 2007 and 2009 surveys helped the HKHC partnership understand the health status of residents in relationship to where they lived. GIS analysis was conducted to examine the relationship between residents’ health status and the parks in their neighborhoods. In addition, during the second year of the HKHC project, staff worked with the PRC of Michigan to develop park-specific questions for the “Speak to Your Health!” survey (conducted in Flint and Genesee County) to track attitudes and behaviors related to using parks for physical activity. These questions will remain in the survey and allow for data regarding parks to continue to be collected beyond the grant period.
Based on the focus park selection scoring sheet, Max Brandon Park was the top scoring park. Several other parks were scored similarly, which required HKHC partnership members to vote to select the final three focus parks: Max Brandon Park located in Northwest Flint, Whaley Park located in Northeast Flint, and Brennan Park located in southeast Flint. HKHC partners came to a consensus that the location of the three parks was geographically different enough to consider these parks as viable finalists. Note: after discussions with HKHC advisory members and other local stakeholders, it was determined that Whaley Park would not be considered a focus park. Identifying an existing active partner for that park was a "deal breaker" criterion during the focus park selection process and despite initial information to the contrary, there were no active groups/individuals operating in or near the park; if this had been known at the time, Whaley would not have been selected as a focus park.
Amenity Assessment
The University of Michigan - Flint Center for Applied Environmental Research (CAER) used the Physical Activity Resource Assessment (PARA) to complete the first ever amenity assessment to inventory and document existing facilities in and condition of all 63 parks in Flint. Additionally, park amenity assessments were incorporated into the Park Tenders information packet that was given to each volunteer community group. To make the assessment more accessible, interested stakeholders were able to download individual park assessments from the HKHC webpage.
Key Informant Interviews
Interviews were held with the Parks Director and other key partners to understand their perspective related to personnel, funding, and culture. This information fed into policy recommendations for the parks plan update.
Figure 3: Sample GIS Map from Park
Equity Assessment7

13
WHERE DO FLINT’S CHILDREN PLAY?
COMMUNITY ASSESSMENT
Park Use
To better understand the HKHC project’s impact on park use, project staff, AmeriCorp members, and community residents were trained by Transtria LLC to observe park users while they participated in physical activities in four Flint parks, two control and two intervention parks. During the scan, observers tallied activity levels by age groups (i.e., children, adolescents, or adults). All people were accounted for as either participating in very active, moderate, or sedentary behaviors. In addition to identifying the number of individuals at each activity level, observers reported specific activities (e.g., walking or basketball) by age groups. Mapping data (i.e., setting, location, type of park area, condition of the area, any permanent modifications, and surface) were also collected on the park areas being observed (see Appendix E for the full report). See Table 4 for key findings and recommendations.
Policy Analysis
The city of Flint has a rich history of supporting a vibrant parks system; however, due to decades of population loss resulting from the decline of the manufacturing industry, municipal revenue also decreased and funding for parks and recreations suffered; thus, a park policy analysis was conducted to provide policy recommendations to revitalize and sustain a thriving parks system into the future.
Crim partnered with University of Michigan - Flint CAER to use the Trust for Public Land’s 7 Healthy Habits for an Excellent Park System to review the existing city of Flint’s park policies. Also, HKHC staff developed policy questions for the Flint Parks Director and conducted an interview to answer queries related to personnel, funding, and cultural influences. University of Michigan - Flint CAER drafted a written report with recommendations. See Table 5 for example recommendations.8
All assessment results were used in future park planning efforts (e.g., updating the parks plan); plus, the analyses helped identify links between the built environment and physical activity, providing the opportunity to advocate for park improvements and/or development.
Table 5: Example Policy Recommendations8
Measure of City Park Excellence Recommendation for the City of Flint Department of Parks and Recreation
1. Clear Expression of Purpose Update the mission and vision of the department to align with current goals and community needs.
2. Ongoing Planning and Community Involvement
Update the City of Flint 5-Year Parks and Recreation Plan in conjunction with the development of the Flint Comprehensive Master Plan.
3. Sufficient Assets in Land, Staffing, and Equipment to Meet the System’s Goals
Examine and adjust parks and recreation budget allocations to align with the department’s mission, vision, and core services.
4. Equitable Park Access
Work in partnership with the Risk Management Division (ADA compliant infrastructure and facilities), City of Flint Transportation Department, and Genesee County Metropolitan Planning Commission (complete street improvements) to address inclusive recreation practices and connect residents to parks and recreation facilities across the city.
5. User Satisfaction Develop mechanisms to measure park user satisfaction and identify a point person to collect feedback and disseminate findings.
6. Safety from Physical Hazards and Crime
Coordinate the development of volunteer services, community policing, programming, and improvements to support increased perceptions of safety in parks.
7. Benefits for the City beyond the Boundaries of the Park
Advance partner efforts to coordinate programming or events in the parks that attract residents and visitors and prove to be beneficial to both quality of life and the local economy.
Table 4: Park Use Findings and Recommendations
Key Finding Recommendation
Flint parks that experience investment have more use than parks that do not.
Investing in parks can increase opportunities for Flint residents to use parks to be active, gather with family and friends, and de-stress from daily life.
People are more physically active in Flint parks that experience investment.
Investing in park facilities that encourage physical activity, such as walking paths and playgrounds, will help people lead more active, healthy lives

14
WHERE DO FLINT’S CHILDREN PLAY?
PLANNING AND ADVOCACY EFFORTS
Community Outreach and Engagement
To ensure that a full range of voices was helping to guide parks work, community engagement was integrated throughout project implementation. In addition to the qualitative assessment techniques mentioned in the assessment section (e.g., surveys and focus groups), a variety of community engagement approaches were used:
Neighborhood Action Planning Sessions: There were three visioning sessions held in each of the nine city wards in Flint during February and March, 2010. People were asked three parks-related questions at the sessions:91) Which City of Flint Parks do you use and why? 2) Which City of Flint Parks do you not use and why? 3) Which City of Flint Parks have the most potential for youth and families to be active? Information gathered from these sessions helped inform focus park selection.
Park Specific Visioning Sessions: A community conversation (visioning session) process was developed in conjunction with Salem to use for discussions related to focus parks and other key parks (e.g., those part of the Park Tenders Program). The ‘Your Park, Your Say’ community conversations were held with residents to revisit existing park plans, generate new ideas, and vote on prioritized activities. After the initial community conversation, participants created an action plan based on the priority activities.
Park Tenders Program (Adopt-a-Park): Keep Genesee County Beautiful facilitated the Parks Tenders Program that complemented the HKHC efforts. This program used the community planning processes and the work plan template developed by HKHC staff and partners to support other local parks beyond the HKHC focus parks. The Park Tenders Program also helped engage more people to become park advocates within the city of Flint, and many of these stakeholders participated in the update of the parks plan. Trust in the community engagement process for the updated parks plan helped catalyze involvement in providing recommendations for the city master plan.
Youth Parks Planning Program: To build youth capacity for parks and planning work, a youth planning pilot project was implemented in the summer of 2012 in cooperation with Michigan State University and the Boys and Girls Club of Greater Flint where local youth participated in a 4-week program to learn about planning basics, create 3-D models of their ideas for a local park, and present their outcomes to local stakeholders.
Advocacy
The HKHC partnership leaders recognized that establishing relationships with community members was essential to producing policy, practice, and environmental changes in the parks.
Edible Flint!: Flint HKHC partners joined forces with Edible Flint!, a healthy eating coalition, to advance policy recommendations that benefited both parks and urban agriculture. Urban agriculture and healthy eating were two of the topics addressed by the parks advisory committee for the city master plan; thus, people working on parks were advocating for healthy eating policy and vice versa.
Political Support and Parks and Recreation Open Space Advisory Committee: The HKHC leadership and residents engaged political officials in relevant issues of the project and felt they had political support. Assessment data and policy recommendations coupled with capacity-building efforts equipped residents with needed information so that they could effectively advocate for park changes and community-driven goals in the parks plan and city master plan. More residents began to engage in discussions about parks at the city level and attend public hearings. Key Flint HKHC partners and residents were asked to serve on the advisory committees for the parks plan and city master plan.
Challenges
The challenges related to planning and advocacy for the Flint HKHC partnership varied. One challenge was navigating the unique political climate in Flint. Because Flint was identified as being in financial crisis, the governor appointed an emergency manager to run the city. This meant that for most of the grant period, local policymakers (e.g., mayor, city council) did not have real decision-making power; they were essentially figureheads. Thus, the city was not truly under local control. Luckily, the emergency manager appointed did not interfere with the implementation of existing planning and policy initiatives; therefore, HKHC partners were able to help catalyze initiatives like the update to the parks plan or creating a new city master plan. Crim and other HKHC partners developed a good relationship with the emergency manager, and key information about parks work (including results from assessments and community engagement) were shared with the emergency manager. This helped to keep the manager connected to the project so that he could advocate on behalf of the parks work being done.
PLANNING AND ADVOCACY EFFORTS

15
WHERE DO FLINT’S CHILDREN PLAY?
PARKS AND PLAY SPACES
The over-arching goal of this project was to improve access to, maintenance of, and overall usability of parks and green space in Flint to provide safe, inviting, and low-cost places for youth and adults to be physically active. According to the Flint HKHC partnership, the main goals of the project were to: 1) create a replicable process that emphasized community engagement to develop model parks in resource-limited communities, 2) build community-capacity to equip and empower people to catalyze positive changes in parks, 3) advance policies and plans that provided the support structure for park improvements, and 4) develop the infrastructure to sustain parks work into the future. To achieve these goals, the Flint HKHC partnership utilized a range of policy, practice, and environmental change strategies that were developed based on assessments and data analysis, policy review, existing best practices, and meaningful community engagement.
Policy, Practice, and Environmental Changes
In 2012, the city of Flint started the process of updating the parks plan and developing a new city master plan. HKHC project leaders, in coordination with the city, spearheaded town hall-style visioning sessions to create goals and objectives for the updated parks plan that resulted in large turnouts because of the time and effort to build relationships with residents. This helped catalyze a seed change in the city’s community engagement efforts related to parks work. In addition to facilitating numerous community engagement sessions, key HKHC partners (including residents) served on the advisory committees for the parks plan and city master plan, ensuring that active living and healthy eating components were incorporated into both of this guiding plans.
The HKHC partnership also worked on implementing environmental changes in two parks, Max Brandon and Brennan Parks. Accomplishments in Max Brandon Park included:
painted sharrows and installed wayfinding (1/4-mile markers) signage on a 1 1/4 mile path;
repainted playground equipment;
installed multiple new playground surfaces and woodchips were among the materials used;
placed boulders around parking lot areas and near a neighborhood opening to the park to restrict car access, allow for pedestrian traffic, and to prevent dumping;
cleaned up the dumping site;
installed a new roof on one of the pavilions;
built and installed numerous picnic tables and benches;
repaired swings;
installed two horseshoe pits;
installed a new park sign; and
received funding for tree removal planned in summer 2014.
Brennan Park achievements included renovation of a baseball field.
Complementary Programs/Promotions
PACES (Parents and Children Exercising Simultaneously) Day
Crim hosted PACES Day, a free, fun day of games and activities for parents and children,2 in spring 2012 and 2013 in Max Brandon Park. The event promoted simple and inexpensive activities using Frisbees, Hula
PARKS AND PLAY SPACES
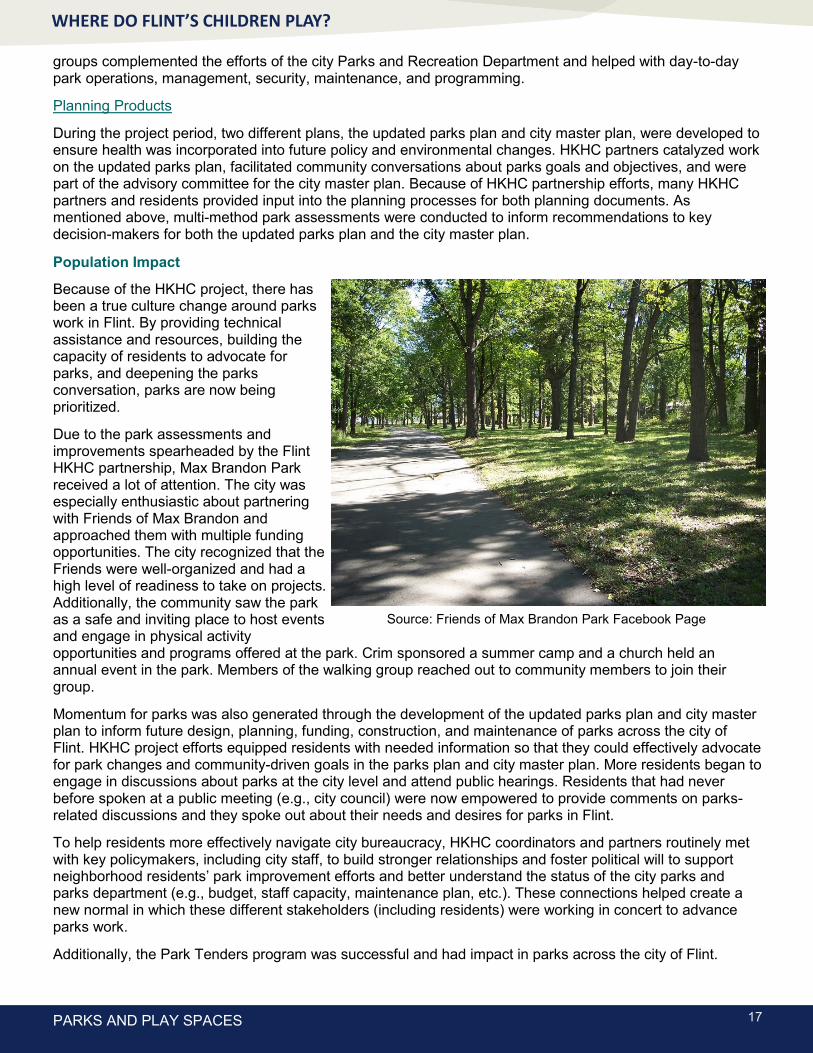
Source: Friends of Max Brandon Park Facebook Page

16
WHERE DO FLINT’S CHILDREN PLAY?
Hoops, sidewalk chalk, and jump ropes to encourage residents to make use of parks throughout the city and educate residents on low cost physical activities they could engage in on a regular basis.
Communications
The partnership instituted new communication tools for Friends of Max Brandon Park, including a Facebook page and regular stories in the community newspaper.
Partner Organizations
Friends of Max Brandon participated in the "Be the Church" day and worked with community members to make some of the park improvements (environmental changes). Friends of Max Brandon and other Flint residents re-painted playground equipment, installed new playground surfaces, and removed trash and vegetation.
To complement Flint HKHC efforts, HKHC partners submitted a grant proposal to local funders to provide summer youth programming in one of the parks. This program is important to encourage park use, build advocacy for park improvements, and increase safety.
Implementation
Community engagement was held strategically throughout the entire Flint HKHC project period. The ‘Your Park, Your Say’ community engagement sessions were held with residents and other stakeholders at the selected focus parks to create action plans that focused on priority park issues raised by the community. To accomplish work in priority areas, Flint HKHC leaders met with community champions and partners to help guide project implementation. They also communicated regularly with youth groups that participated in focus groups or other project components to provide an opportunity for youth input and action on project implementation.
Park Tenders Program (Adopt-a-Park)
The Park Tenders Program (Adopt-a-Park), funded through a grant from the Ruth Mott Foundation, was an opportunity for the Parks and Recreation Department to work with Keep Genesee County Beautiful. Each Park Tenders group was required to create a mini-park plan that included actions for physical improvements, safety, and activities. If groups maintained their park, they were awarded funds that could be used toward amenities in the park. Due to extenuating circumstances, some groups dropped out of the program after installing their amenities. Groups were initially required to mow and clean up the park, as well as run programs; however, some groups struggled to secure a large enough volunteer pool to take on mowing responsibilities and the Parks and Recreation Department had to contract to have those parks mowed. The Park Tenders Program has learned from these initial challenges and adapted the program to include different levels of park adoption.
Friends of Max Brandon
Friends of Max Brandon Park spearheaded numerous park improvements (see the Policy, Practice, and Environmental Changes section above). Members of this volunteer group checked on the park multiple times a week.
Park Partners
Because city funding for parks was scarce, innovative partnerships were developed to take on parks work. A wide range of organizations and stakeholders stepped up to ensure that parks in Flint were being revitalized to move towards vibrant parks system that serves as an asset to the community. Some of the partners included: Boys and Girls Club of Greater Flint, YMCA, the Flint Police Activity League, Flint Downtown Development Authority, the Baseball and Softball Commission, Salem, Keep Genesee County Beautiful, Northern Alumni Class of 1974, the Ruth Mott Foundation, T.R. Harris, Community Foundation of Greater Flint, Genesee County Parks, and Flint neighborhood associations/block clubs. These organizations and
PARKS AND PLAY SPACES
“We’ll never run out of facilities or parks, but if we can
continue to keep our good relationships with Crim, Boys
and Girls Club, Police Activities League, and all those
type of groups, the better off we’re gonna be until we
figure out what’s gonna take place.”
-Community Member
17
WHERE DO FLINT’S CHILDREN PLAY?
groups complemented the efforts of the city Parks and Recreation Department and helped with day-to-day park operations, management, security, maintenance, and programming.
Planning Products
During the project period, two different plans, the updated parks plan and city master plan, were developed to ensure health was incorporated into future policy and environmental changes. HKHC partners catalyzed work on the updated parks plan, facilitated community conversations about parks goals and objectives, and were part of the advisory committee for the city master plan. Because of HKHC partnership efforts, many HKHC partners and residents provided input into the planning processes for both planning documents. As mentioned above, multi-method park assessments were conducted to inform recommendations to key decision-makers for both the updated parks plan and the city master plan.
Population Impact
Because of the HKHC project, there has been a true culture change around parks work in Flint. By providing technical assistance and resources, building the capacity of residents to advocate for parks, and deepening the parks conversation, parks are now being prioritized.
Due to the park assessments and improvements spearheaded by the Flint HKHC partnership, Max Brandon Park received a lot of attention. The city was especially enthusiastic about partnering with Friends of Max Brandon and approached them with multiple funding opportunities. The city recognized that the Friends were well-organized and had a high level of readiness to take on projects. Additionally, the community saw the park as a safe and inviting place to host events and engage in physical activity opportunities and programs offered at the park. Crim sponsored a summer camp and a church held an annual event in the park. Members of the walking group reached out to community members to join their group.
Momentum for parks was also generated through the development of the updated parks plan and city master plan to inform future design, planning, funding, construction, and maintenance of parks across the city of Flint. HKHC project efforts equipped residents with needed information so that they could effectively advocate for park changes and community-driven goals in the parks plan and city master plan. More residents began to engage in discussions about parks at the city level and attend public hearings. Residents that had never before spoken at a public meeting (e.g., city council) were now empowered to provide comments on parks-related discussions and they spoke out about their needs and desires for parks in Flint.
To help residents more effectively navigate city bureaucracy, HKHC coordinators and partners routinely met with key policymakers, including city staff, to build stronger relationships and foster political will to support neighborhood residents’ park improvement efforts and better understand the status of the city parks and parks department (e.g., budget, staff capacity, maintenance plan, etc.). These connections helped create a new normal in which these different stakeholders (including residents) were working in concert to advance parks work.
Additionally, the Park Tenders program was successful and had impact in parks across the city of Flint.
PARKS AND PLAY SPACES
Source: Friends of Max Brandon Park Facebook Page

18
WHERE DO FLINT’S CHILDREN PLAY?
Challenges
Funding for park improvements was a challenge. Though there was a need and interest to make improvements, the city did not have enough funds to cover improvements for all city parks or even the staff to maintain parks. Another influence on limited funding was the many competing priorities in Flint, such as crime, economic development, and workforce development, which often collectively superseded efforts to improve parks in the city.
Lessons Learned
The Flint HKHC project provided a valuable opportunity for project partners to better understand what worked and what needed to be improved during project development and implementation. The main lessons learned included: 1) investing in meaningful community engagement at multiple levels and through multiple avenues was essential for success, 2) layering capacity-building into community engagement created the foundation for long-lasting change, 3) intentionally planning early for sustainability resulted in more effective project implementation and created the foundation for future parks work, 4) using social, environmental, and economic sustainability strategies in tandem ultimately helped parks work become integrated into the community culture, 5) ensuring a high level of transparency in parks work was essential to help both residents and the city work toward the same goals with a common understanding, 6) recognizing that the community partnership structure needed to evolve over time ensured that project and community needs were effectively met, and 7) employing different strategies in each focus park based on unique needs allowed for solutions that had longevity.
Sustainability
The HKHC partnership provided technical assistance to many community members working in Flint parks. Typically community members contact Crim, then partnership members in turn provided resources or support for the community members. The Friends of Max Brandon group organized to empower community residents to create safe, maintained, and used parks. The collaboration between the Friends of Max Brandon, Salem, and Crim was a very successful technical assistance and community engagement model designed to build capacity in the community. Finally, the adoption of the updated parks master plan and the parks chapter in the city master plan created guiding principles to inform future planning, funding, development, and maintenance of parks in Flint.
See Figure 4: Parks and Play Spaces Infographic for more information on parks and play spaces in Flint.
PARKS AND PLAY SPACES

19
WHERE DO FLINT’S CHILDREN PLAY?
PARKS AND PLAY SPACES
Figure 4: Parks and Play Spaces Infographic
20
WHERE DO FLINT’S CHILDREN PLAY?
SUSTAINABILITY
SUSTAINABILITY OF THE PARTNERSHIP AND INITIATIVE
Crim and MFF created a foundation for sustaining the partnership’s work after the HKHC funding ends. The Crim hosted a LISC AmeriCorps to assist in researching best practices and provide technical assistance to community members working on parks, and helping the Crim implement the parks plan and city master plan. In addition, a sustainability workshop with HKHC partners and community residents was facilitated by staff from Active Living By Design.
Staff Roles and Responsibilities
The role of the Flint HKHC leadership shifted in the last year of the grant. Originally, the leadership worked directly with the community through community engagement, outreach activities, and meeting facilitation. Now, its priority is to ensure sustainability of the HKHC project by empowering community members to carry on the work. Moving beyond the HKHC funding period, the HKHC leadership team will develop its role in the implementation of the city master plan, which was approved in 2013. HKHC partners were instrumental in constructing the parks chapter of the city master plan and worked to ensure parks were represented well in the plan. Due to the work of the HKHC partnership, partners became passionate about parks work and are committed to continuing to revitalize Flint parks.
The leadership pointed out several changes over the last year of the Flint HKHC initiative that have influenced their work in a positive way. First, a transition plan focusing on capacity-building was put into place to strategically transfer leadership of the Friends of Max Brandon from HKHC leaders to Salem staff and volunteer community members. This has resulted in local park champions leading the Friends. Second, being involved in the process of developing the city master plan and working with city leadership on the plan helped the HKHC partnership achieve policy and environmental changes that they may not have otherwise achieved. Third, the HKHC leaders mentioned the enthusiasm that the new Chief Planning Officer at the city brought to the master plan and to the work of the HKHC partnership.
Because the HKHC project focused only on active living, project staff joined forces with Edible Flint! A healthy eating coalition to explore how to weave together parks and urban agriculture to improve residents’ access to healthy food. As a result, healthy eating food policy language was incorporated into the city master planning process along with the parks work.
An important component of sustainability of the HKHC project is community involvement. The HKHC partnership has observed that Flint community members are passionate about preserving, maintaining, and improving the city’s parks. It speculates that this high level of community involvement will continue.
Future Funding
The Crim plans to support this work financially through its active living efforts, which are funded locally by the Ruth Mott Foundation. Funding was secured for the 2014 fiscal year to provide a small amount of staff time to determine key park activities related to the master plan and seek out additional funding. The Crim’s LISC AmeriCorps member completed the KaBOOM! Playful Cities designation. The playful cities designation will allow the city of Flint to continue to address opportunities and barriers to play, map all of the playgrounds in Flint, and be eligible for more grant opportunities through KaBOOM! The city of Flint, Keep Genesee County Beautiful, and local parks groups will continue to prioritize parks work and explore innovative funding solutions.

21
WHERE DO FLINT’S CHILDREN PLAY?
REFERENCES
1. Healthy Kids, Healthy Communities National Program Office. Home and About. 2009. http:// www.healthykidshealthycommunities.org/. Accessed January 1, 2014.
2. Crim Fitness Foundation. Flint Healthy Kids, Healthy Communities: Sparking Community Change in Parks. n.d. http://www.sparkflintparks.org. Accessed January 10, 2014.
3. Healthy Kids, Healthy Communities National Program Office. Flint, Michigan. 2013. http:// www.healthykidshealthycommunities.org/communities/flint-mi. Accessed January 1, 2014.
4. United States Census Bureau. 2007-2011 American Community Survey. 2014. http://www.census.gov/ acs. Accessed February 15, 2014.
5. United Sates Department of Labor. Bureau of Labor Statistics. 2013. http://www.bls.gov/web/metro/laummtrk.htm. Accessed July 2014.
6. Rowe Incorporated. Draft City of Flint Parks and Recreation Master Plan. 2007. http://www.cityofflint.com/ parks/pdf/RecPlanUpdate%20.pdf. Accessed March 3, 2014.
7. Department of Earth and Resource Science, University of Michigan, Flint. City of Flint—City Park System Park Mapping and Equity Assessment. 2013. http://www.crim.org/activeliving/KidsPlayFiles/ CityofFlintParksEquityAssessment2012.pdf. Accessed February 16, 2014.
8. University Outreach, University of Michigan, Flint. City of Flint: Flint Parks Policy Review. 2012. http:// www.crim.org/parksreports. Accessed February 16, 2014.
9. Crim Fitness Foundation. Draft Results from Community Engagement. 2010. http://www.crim.org/ activeliving/CommunityEngagementResults.pdf. Accessed February 28, 2014.
REFERENCES

22
WHERE DO FLINT’S CHILDREN PLAY?
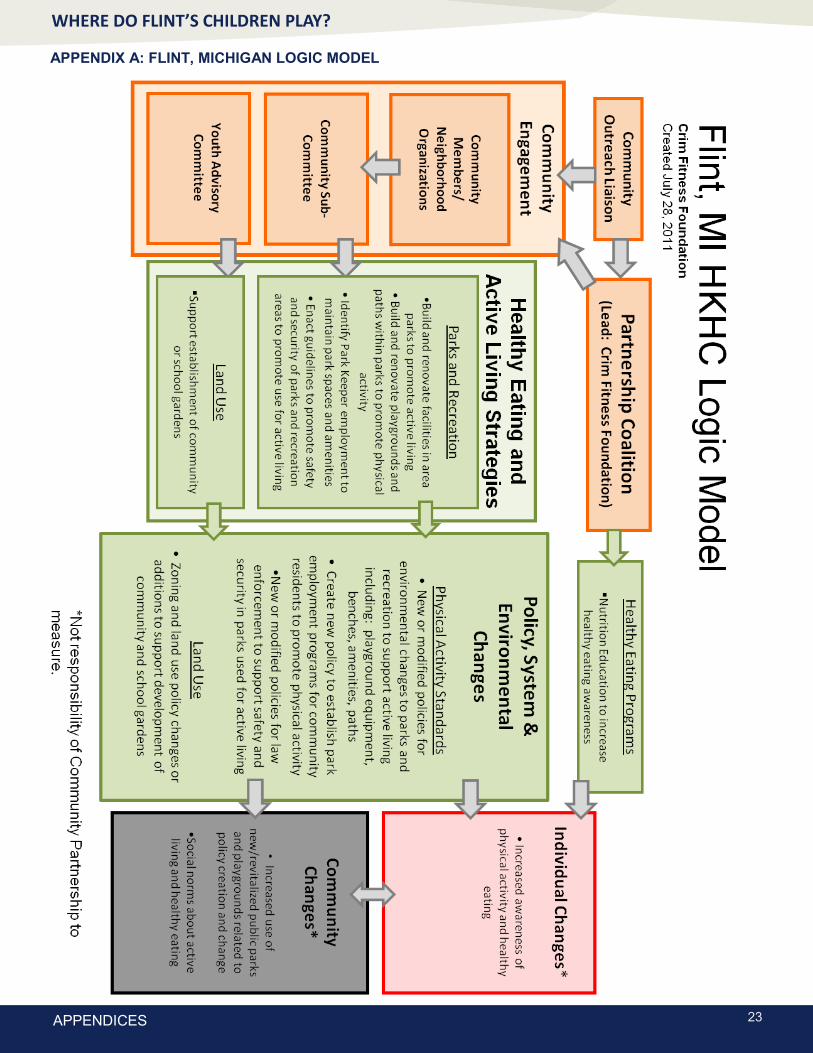
APPENDIX A: FLINT, MICHIGAN LOGIC MODEL
In the first year of the grant, this evaluation logic model identified short-term, intermediate, and long-term
community and system changes for a comprehensive evaluation to demonstrate the impact of the strategies
to be implemented in the community. This model provided a basis for the evaluation team to collaborate with
the Flint HKHC partnership to understand and prioritize opportunities for the evaluation. Because the logic
model was created at the outset, it does not necessarily reflect the four years of activities implemented by the
partnership (i.e., the workplans were revised on at least an annual basis).
Parks and Play Spaces: The partnership focused on providing opportunities for Flint children to be physically active outside by initiating community engagement, enhancing park features, and updating the five-year parks and recreation master plan. Although there were over five dozen parks and green spaces in the city, they were not always maintained, safe places for children and families to be active. Improving the accessibility of Flint’s parks provides an opportunity for children to improve their health.2
APPENDICES
23
WHERE DO FLINT’S CHILDREN PLAY?
APPENDIX A: FLINT, MICHIGAN LOGIC MODEL
APPENDICES

24
WHERE DO FLINT’S CHILDREN PLAY?
Partnership and Community Capacity Survey
To enhance understanding of the capacity of each community partnership, an online survey was conducted with project staff and key partners involved with Flint’s Healthy Kids, Healthy Communities partnership during the final year of the grant. Partnership capacity involves the ability of communities to identify, mobilize, and address social and public health problems.1-3
Methods
Modeled after earlier work from the Prevention Research Centers and the Evaluation of Active Living by Design,4 an 82-item partnership capacity survey solicited perspectives of the members of the Flint’s Healthy Kids, Healthy Communities partnership on the structure and function of the partnership. The survey questions assisted evaluators in identifying characteristics of the partnership, its leadership, and its relationship to the broader community.
Questions addressed respondents’ understanding of Flint’s Healthy Kids, Healthy Communities in the following areas: structure and function of the partnership, leadership, partnership structure, relationship with partners, partner capacity, political influence of partnership, and perceptions of community members. Participants completed the survey online and rated each item using a 4-point Likert-type scale (strongly agree to strongly disagree). Responses were used to reflect partnership structure (e.g., new partners, committees) and function (e.g., processes for decision making, leadership in the community). The partnership survey topics included the following: the partnership’s goals are clearly defıned, partners have input into decisions made by the partnership, the leadership thinks it is important to involve the community, the partnership has access to enough space to conduct daily tasks, and the partnership faces opposition in the community it serves. The survey was open between September 2013 and December 2013 and was translated into Spanish to increase respondent participation in predominantly Hispanic/Latino communities.
To assess validity of the survey, evaluators used SPSS to perform factor analysis, using principal component analysis with Varimax with Kaiser Normalization (Eigenvalue >1). Evaluators identified 15 components or factors with a range of 1-11 items loading onto each factor, using a value of 0.4 as a minimum threshold for factor loadings for each latent construct (i.e., component or factor) in the rotated component matrix.
Survey data were imported into a database, where items were queried and grouped into the constructs identified through factor analysis. Responses to statements within each construct were summarized using weighted averages. Evaluators excluded sites with ten or fewer respondents from individual site analyses but included them in the final cross-site analysis.
Findings
Structure and Function of the Partnership (n=5 items)
A total of 11 individuals responded from Flint’s Healthy Kids, Healthy Communities partnership. Of the sample, 7 were female (64%) and 4 were male (36%). Respondents were between the ages of 26-45 (6, or 55%), 46-65 (4, or 36%), or over 66 (1, or 9%). Survey participants were also asked to provide information about race and ethnicity. Respondents identified with one or more from the following race and ethnicity categories: African American, American Indian/Alaskan Native, Asian, Native Hawaiian/Pacific Islander, White, Other race, Hispanic or Latino, Not Hispanic or Latino, Ethnicity unknown/unsure, or Refuse to provide information about race or ethnicity. Of the 11 responses, 45% were White, and 55% were African American. No other races or ethnicities were identified.
Respondents were asked to identify their role(s) in the partnership or community. Of the 19 identified roles, seven were representative of the Community Partnership Lead (37%) and six were Community Partnership Partners (31%). Three respondents self-identified as Community Partnership Leaders (16%), three (16%) as other roles not specified in the response options. Individuals participating in the survey also identified their organizational affiliation. Two respondents indicated affiliation to each of the following organization types: faith- or community-based organization (2, or 18%), local government agency (city, county) (2, or 18%), neighborhood organization (2, or 18%), and advocacy organization (2, or 18%). Two respondents (18%) self-identified with other types of organizations. The remaining one respondent associated to child care or
APPENDICES
APPENDIX B: PARTNERSHIP AND COMMUNITY CAPACITY SURVEY RESULTS
25
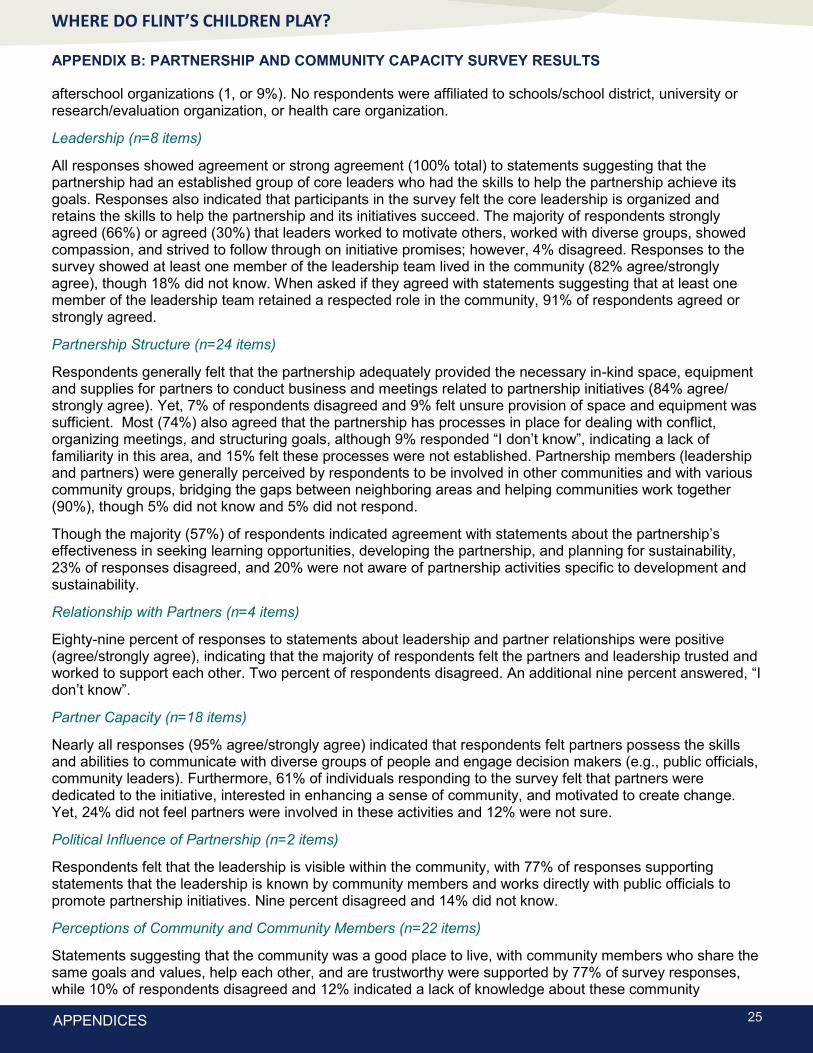
WHERE DO FLINT’S CHILDREN PLAY?
afterschool organizations (1, or 9%). No respondents were affiliated to schools/school district, university or research/evaluation organization, or health care organization.
Leadership (n=8 items)
All responses showed agreement or strong agreement (100% total) to statements suggesting that the partnership had an established group of core leaders who had the skills to help the partnership achieve its goals. Responses also indicated that participants in the survey felt the core leadership is organized and retains the skills to help the partnership and its initiatives succeed. The majority of respondents strongly agreed (66%) or agreed (30%) that leaders worked to motivate others, worked with diverse groups, showed compassion, and strived to follow through on initiative promises; however, 4% disagreed. Responses to the survey showed at least one member of the leadership team lived in the community (82% agree/strongly agree), though 18% did not know. When asked if they agreed with statements suggesting that at least one member of the leadership team retained a respected role in the community, 91% of respondents agreed or strongly agreed.
Partnership Structure (n=24 items)
Respondents generally felt that the partnership adequately provided the necessary in-kind space, equipment and supplies for partners to conduct business and meetings related to partnership initiatives (84% agree/strongly agree). Yet, 7% of respondents disagreed and 9% felt unsure provision of space and equipment was sufficient. Most (74%) also agreed that the partnership has processes in place for dealing with conflict, organizing meetings, and structuring goals, although 9% responded “I don’t know”, indicating a lack of familiarity in this area, and 15% felt these processes were not established. Partnership members (leadership and partners) were generally perceived by respondents to be involved in other communities and with various community groups, bridging the gaps between neighboring areas and helping communities work together (90%), though 5% did not know and 5% did not respond.
Though the majority (57%) of respondents indicated agreement with statements about the partnership’s effectiveness in seeking learning opportunities, developing the partnership, and planning for sustainability, 23% of responses disagreed, and 20% were not aware of partnership activities specific to development and sustainability.
Relationship with Partners (n=4 items)
Eighty-nine percent of responses to statements about leadership and partner relationships were positive (agree/strongly agree), indicating that the majority of respondents felt the partners and leadership trusted and worked to support each other. Two percent of respondents disagreed. An additional nine percent answered, “I don’t know”.
Partner Capacity (n=18 items)
Nearly all responses (95% agree/strongly agree) indicated that respondents felt partners possess the skills and abilities to communicate with diverse groups of people and engage decision makers (e.g., public officials, community leaders). Furthermore, 61% of individuals responding to the survey felt that partners were dedicated to the initiative, interested in enhancing a sense of community, and motivated to create change. Yet, 24% did not feel partners were involved in these activities and 12% were not sure.
Political Influence of Partnership (n=2 items)
Respondents felt that the leadership is visible within the community, with 77% of responses supporting statements that the leadership is known by community members and works directly with public officials to promote partnership initiatives. Nine percent disagreed and 14% did not know.
Perceptions of Community and Community Members (n=22 items)
Statements suggesting that the community was a good place to live, with community members who share the same goals and values, help each other, and are trustworthy were supported by 77% of survey responses, while 10% of respondents disagreed and 12% indicated a lack of knowledge about these community
APPENDICES
APPENDIX B: PARTNERSHIP AND COMMUNITY CAPACITY SURVEY RESULTS

26
WHERE DO FLINT’S CHILDREN PLAY?
attributes. Respondents also strongly supported suggestions that community members help their neighbors, but may take advantage of others if given the opportunity (92% agree/strongly agree). In contrast, respondents were less convinced that community members would intervene on behalf of another individual in their community in cases of disrespect, disruptive behavior, or harmful behavior. While 58% agreed or strongly agreed, 21% disagreed/strongly disagreed. Twenty-one percent of responses indicated that some respondents did not know how community members would act in these situations.
Most survey participants (82%) felt community members were aware of the partnership’s initiatives and activities; however, 18% did not know if community members were aware. The majority of respondents (45%) did not feel that the partnership equally divides resources among different community groups in need (e.g., racial/ethnic minorities, lower income), though 27% agreed and felt resources were equally distributed. Eighteen percent of respondents were not sure about how resources were distributed.
Overall, respondents agreed or strongly agreed that partners and members of the community maintained active involvement in partnership decisions and activities (92%), and also agreed that partners and residents have the opportunity to function in leadership roles and participate in the group decision-making process (94%).
References
1. Goodman RM, Speers MA, McLeroy K, et al. Identifying and defining the dimensions of community capacity to provide a basis for measurement. Health Educ Behav. Jun 1998;25(3):258-278.
2. Israel BA, Schulz AJ, Parker EA, Becker AB. Review of community-based research: assessing partnership approaches to improve public health. Annu Rev Public Health. 1998;19:173-202.
3. Roussos ST, Fawcett SB. A review of collaborative partnerships as a strategy for improving community health. Annu Rev Public Health. 2000;21:369-402.
4. Baker E, Motton F. Is there a relationship between capacity and coalition activity: The road we’ve traveled. American Public Health Association 131st Annual Meeting. San Francisco, CA; 2003.
APPENDICES
APPENDIX B: PARTNERSHIP AND COMMUNITY CAPACITY SURVEY RESULTS

27
WHERE DO FLINT’S CHILDREN PLAY?
APPENDICES
APPENDIX B: PARTNERSHIP AND COMMUNITY CAPACITY SURVEY RESULTS

28
WHERE DO FLINT’S CHILDREN PLAY?
APPENDICES
APPENDIX B: PARTNERSHIP AND COMMUNITY CAPACITY SURVEY RESULTS

29
WHERE DO FLINT’S CHILDREN PLAY?
APPENDICES
APPENDIX B: PARTNERSHIP AND COMMUNITY CAPACITY SURVEY RESULTS

30
WHERE DO FLINT’S CHILDREN PLAY?
APPENDICES
APPENDIX B: PARTNERSHIP AND COMMUNITY CAPACITY SURVEY RESULTS

31
WHERE DO FLINT’S CHILDREN PLAY?
*Denotes lead agency for the grant
APPENDIX C: FLINT HKHC PARTNERSHIP LIST
APPENDICES
Members of Where Do Flint’s Children Play?
Organization/Institution Partner
Non-Profit Organizations
Crim Fitness Foundation*
Michigan Fitness Foundation*
Salem Housing, Inc. Community Development Corporation
T.R. Harris
The Disability Network
YMCA of Greater Flint
Colleges/Universities
University of Michigan - Flint Center for Applied Environmental
Research
University of Michigan School of Public Health Prevention
Research Center
Foundations The Ruth Mott Foundation
Community Foundation of Greater Flint
Government Organizations
City of Flint—Parks and Recreation Department
City of Flint—Transportation Department
Flint City Council
Flint Planning Commission
Genesee County Health Department
Genesee County Parks and Recreation Commission
Community-Based
Organizations
Friends of Max Brandon
Friends of the Flint River Trail
Safe and Active Genesee for Everyone (SAGE) Coalition
Keep Genesee County Beautiful
Youth Organizations
Big Brothers/Big Sisters of Greater Flint
Boys and Girls Club of Greater Flint
Priority Children
Schools Flint Community Schools

32
WHERE DO FLINT’S CHILDREN PLAY?
APPENDIX D: SOURCES AND AMOUNTS OF FUNDING LEVERAGED
APPENDICES

33
WHERE DO FLINT’S CHILDREN PLAY?
APPENDIX D: SOURCES AND AMOUNTS OF FUNDING LEVERAGED
APPENDICES

34
WHERE DO FLINT’S CHILDREN PLAY?
APPENDIX D: SOURCES AND AMOUNTS OF FUNDING LEVERAGED
APPENDICES

35
WHERE DO FLINT’S CHILDREN PLAY?
APPENDIX D: SOURCES AND AMOUNTS OF FUNDING LEVERAGED
APPENDICES
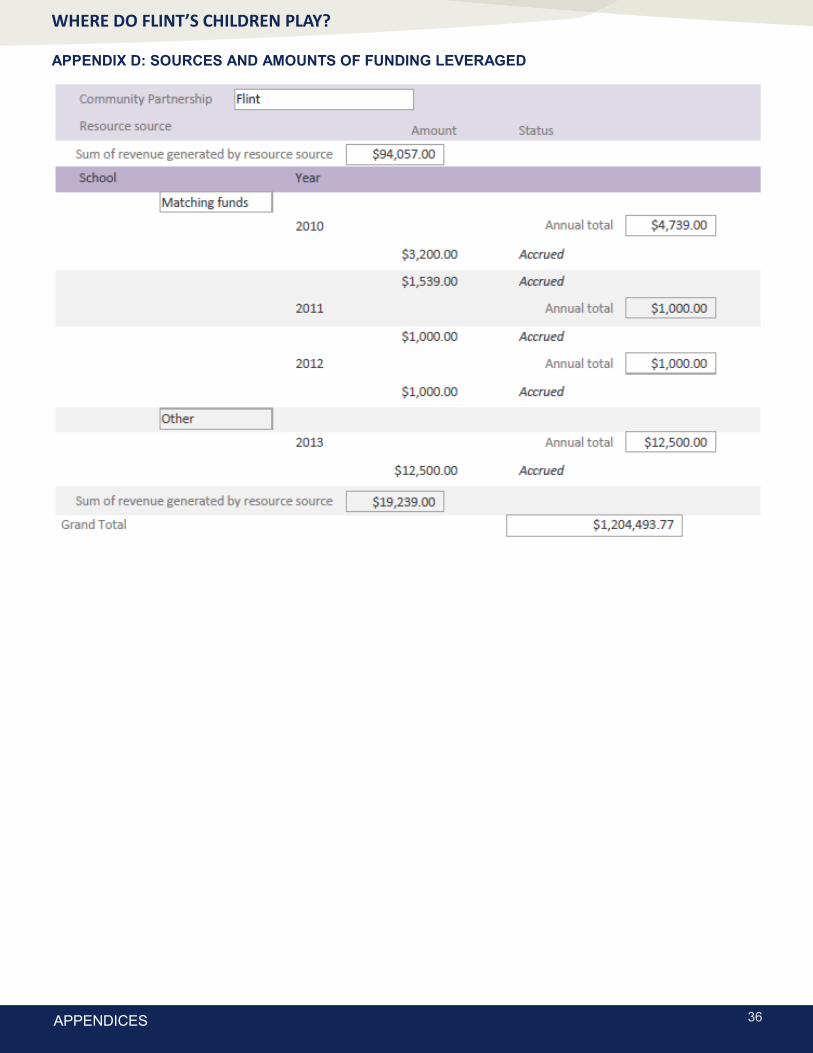
36
WHERE DO FLINT’S CHILDREN PLAY?
APPENDIX D: SOURCES AND AMOUNTS OF FUNDING LEVERAGED
APPENDICES
37
WHERE DO FLINT’S CHILDREN PLAY?
APPENDIX E: FLINT PARKS USE: DIRECT OBSERVATION REPORT
APPENDICES

1
Flint, Michigan
Park Direct Observations
Summary Report
Prepared by Transtria LLC

2
Table of Contents
Executive Summary .........................................................................................................................3
Background ......................................................................................................................................5
Methods............................................................................................................................................5
Results ..............................................................................................................................................7
Activity Levels by Age ....................................................................................................................7
Activity Levels by Park ...................................................................................................................8
Types of Activity by Age ...............................................................................................................10
Types of Activity by Park ..............................................................................................................11
Intervention and Comparison Parks ...............................................................................................13
Appendix: Parks and Play Spaces Direct Observation Tool ..........................................................15

3
Executive Summary
BACKGROUND
Healthy Kids, Healthy Communities (HKHC) is a national program of the Robert Wood
Johnson Foundation whose primary goal is to implement healthy eating and active living policy-
and environmental-change initiatives that can support healthier communities for children and
families across the United States. For more information about HKHC, please visit
www.healthykidshealthycommunities.org. Transtria LLC, a public health evaluation and
research consulting firm located in St. Louis, Missouri, is leading the evaluation and
dissemination activities. For more information about the evaluation, please visit
www.transtria.com.
In order to better understand the impact of their work on park use, Flint, Michigan, one of
the 49 HKHC sites and led by the Crim Fitness Foundation, chose to participate in the enhanced
evaluation data collection activities. Flint completed this evaluation for their park renovations
strategy using the direct observation method.
METHODS
The Parks and Play Spaces Direct Observation Tool was used to collect data (see
Appendix). An Evaluation Officer from Transtria LLC trained members of Flint’s community
partnership on proper data collection methods using the tool who then collected all data.
Observers collected data for a total of 120 minutes per park per day. During the scan, the
observer completed the observation tool by tallying activity levels by age groups (i.e., children =
aged 3-12 years; adolescents = aged 13-18 years; adults = aged 19+ years). All people were
accounted for as either participating in very active, moderate, or sedentary behaviors. In addition
to identifying the number of individuals at each activity level, observers reported the activity
codes by age groups (e.g., “Walking” or “Basketball”). The activity code “No Identifiable
Activity” was used to indicate no movement (over 95% of these codes were correlated with
sedentary observations). The activity code “None of the Above” was used when an individual
was engaging in an activity not included in the other activity codes (e.g., biking).
RESULTS
Prevalence of activity
Level of Activity
Adults (aged 19 and over) were the most sedentary (55.3%) of all ages and least likely to
be engaged in moderate or very active behavior.
Adolescents (aged 13-18) were the greatest share of observations across all three age
groups engaged in very active behavior (16.2%).
Children (aged 3-12) were the most likely (58.1%) to be engaged in moderate level activity
of all ages.
Max Brandon and Whaley had the two highest rates of moderate level activity observations
(64.8% and 54.3%, respectively) and the lowest sedentary percentage of sedentary

4
observations (26.2% and 35.0%, respectively. This was also true for children in the two
parks. Bassett was the most sedentary (88.8%) of all parks.
Adults were least sedentary in Max Brandon (27.8%) and Whaley (49.1%), but more than
two-thirds of all adults were sedentary in Brennan (75.0%) and Bassett (89.7%).
Type of Activity
“Walking” was the most common activity across all ages (33.4%).
Children were often (26.7%) engaged in “No Identifiable Activity,” an analogue for
sedentary level activity (see methods section), followed by “Walking” (24.1%) and “Other
Playground Games” (21.6%). Adolescents were most likely to be “Walking” (29.3%)
followed by “No Identifiable Activity” (22.4%).
The only identifiable activity adults engaged in over 10% of the time was “Walking”
(41.7%).
“No identifiable activity,” often synonymous for sedentary activity, was the most frequent
single activity code for most parks across all ages with the exception of Bassett park.
Max Brandon had the highest rate of walkers (32.9% of children, 31.3% of adolescents,
and 50.2% of adults) and “Other Playground Games” (26.0% of children, 22.0% of
adolescents, and 5.4% of adults) across almost all ages in all parks. Children in Bassett,
however, were almost exclusively engaged in “Other Playground Games” (85.7%).
The only universal activities observed across all four parks were “Other Playground
Games” and “Walking” (excluding “No Identifiable Activity” and “None of the Above”).
Intervention and comparison parks
Level of Activity
Intervention parks (Max Brandon and Bassett) had lower levels of sedentary activity
(32.4%) than comparison parks (Whaley and Brennan; 53.6%).
Intervention parks had higher rates of moderate activity (59.4%) than comparison parks
(37.9%).
Very active behavior rates were almost identical in both intervention (8.2%) and
comparison (8.5%) parks.
Type of Activity
Intervention parks had a greater percentage of individuals engaged in “Other Playground
Games” (28.8%) while both comparison and intervention parks had a large rate of
observations of individuals “Walking” across all ages.

5
Background
BACKGROUND
Healthy Kids, Healthy Communities (HKHC) is a national program of the Robert Wood
Johnson Foundation whose primary goal is to implement healthy eating and active living policy-
and environmental-change initiatives that can support healthier communities for children and
families across the United States. HKHC places special emphasis on reaching children who are
at highest risk for obesity on the basis of race/ethnicity, income and/or geographic location. For
more information about HKHC, please visit www.healthykidshealthycommunities.org.
Flint, Michigan is one of 49 HKHC communities and is led by the Crim Fitness
Foundation. Flint focuses its work on healthy eating and active living strategies around parks and
recreation with the end goal of improving park conditions and park access through policy and
environmental changes.
Transtria LLC, a public health evaluation and research consulting firm located in St.
Louis, Missouri, is leading the evaluation and dissemination activities from April 2010 to March
2014. For more information about the evaluation, please visit www.transtria.com.
In order to better understand the impact of their work on park use, Flint chose to
participate in the enhanced evaluation data collection activities. This supplementary evaluation
focuses on the six cross-site HKHC strategies: park and play spaces, street design, farmers’
markets, corner stores, physical activity standards in childcare settings, and nutrition standards in
childcare settings. Communities may use two main evaluation methods: direct observation and/or
environmental audits. Tools and training are provided by Transtria staff (see
www.transtria.com/hkhc). Flint completed this evaluation for their park renovations strategy
using the direct observation method.
Methods
The Parks and Play Spaces Direct Observation Tool was used to collect data (see
Appendix). The tool and protocol were adapted from the System for Observing Play and Leisure
Activity (SOPLAY) and System for Observing Play and Recreation in Communities (SOPARC)
tools, protocols, and operational definitions. An Evaluation Officer from Transtria LLC trained
members of Flint’s community partnership on proper data collection methods using the tool.
Three individuals collected all observation data while an additional trained community member
collected the mapping data.
Observers collected data for a total of 120 minutes per park per day. The 120 minute
observation was divided into one or two intervals, depending on the size of the park (i.e., a large
park was divided into two areas, each observed for 60 minutes). The observers scanned the park
area for one minute and then took a one minute break to record observations for the duration of
each observation period. During the scan, the observer completed the observation tool by tallying
activity levels by age groups (i.e., children = aged 3-12 years; adolescents = aged 13-18 years;
adults = aged 19+ years). All people were accounted for as either participating in very active,
moderate, or sedentary behaviors.

6
• Sedentary behaviors are defined as activities in which people are not moving (e.g.
standing, sitting, playing board games).
• Moderate intensity behaviors require more movement but no strenuous activity (e.g.
walking, biking slowly).
• Very active behaviors show evidence of increased heart rate and inhalation rate (e.g.
running, biking vigorously, playing basketball).
In addition to identifying the number of individuals at each activity level, observers
reported the activity codes by age groups. Activity codes are shown below:
The activity code “No Identifiable Activity” was used to indicate no movement (over
95% of these codes were correlated with sedentary observations). The activity code “None of the
Above” was used when an individual was engaging in an activity not included in the other
activity codes (e.g., biking).
Data were collected on eleven days between July 13, 2012 and August 23, 2012 by the
observers in order to collect data prior to the start of the school year. Data were collected at least
once on each day of the week, with data being collected on a Sunday, Tuesday, Thursday, and
Saturday two separate times (e.g., Sunday morning and Sunday afternoon or Tuesday morning
and afternoon). All observations occurred between 6:56 AM and 7:17 PM. On each day of data
collection, two observers collected data in each of the four parks. Three of the four parks (Max
Brandon, Whaley, and Bassett) were divided into two park areas for data collection while the last
park (Brennan) was small enough to be observed without subdivision; each day, seven parks
areas were observed cumulatively.
In addition to observation data, mapping data were collected on the park areas being
observed. These data were collected once by an auditor for each of the seven park areas
observed. The auditor recorded the setting, location, type of park area, condition of the area, any
permanent modifications (the specific permanent alterations present that assist children in
participating in physical activity such as lines painted on courts or basketball poles and nets; this
does not include temporary improvements such as chalk lines and portable nets.), the presence of
overlap modifications (e.g., the space has multiple improvements that overlap but cannot be used
simultaneously such as a space that is used for both volleyball and basketball), and the surface
type (e.g., gravel, grass).
All data were entered and reviewed for errors. The method of data quality control chosen
was to have a single point of entry with visual spot-checking. Based on the quantity of data, it
was determined that 10% of the observation data would be checked for accuracy. A total of
13,214 data points were checked and 97 errors were found (99.26% correct). Data quality
control measures were also performed on the mapping data. Due to the small quantity of
mapping data, all data points were checked. A total of 220 data points were checked and 2 errors
were found (99.09% correct). All errors were recorded and corrected.
No Identifiable Activity Aerobics Baseball/Softball Basketball
Dance Football Gymnastics Martial Arts
Racquet Sports Soccer Swimming Weight Training
Other Playground Games Walking Jogging/Running None of the Above

7
0%
10%
20%
30%
40%
50%
60%
Sedentary Moderate Very Active
Figure 1: Activity Level by Age (n=7186)
Children
Adolescents
Adults
Table 1: Overall Activity Level (n=7186)
Children Adolescents Adults Total
Sedentary 34.7% 30.8% 55.3% 41.9%
Moderate 58.1% 52.9% 40.7% 49.8%
Very Active 7.2% 16.2% 4.0% 8.3%
Results
There were 3,953 observation periods throughout the four parks (Brennan, Whaley, Max
Brandon, and Bassett). The weather was generally fair during observations: 87.6% of
observations occurred in good weather and 12.4% of observations occurred in poor weather, with
good weather requiring both 60-90 degree temperatures and sunny conditions and poor weather
reflecting any amount of rain and temperatures below 60 degrees and exceeding 90 degrees.
Activity Levels by Age
Observers rated the
activity level of each child,
adolescent, or adult during
the minute observation
period. There were a total
of 7,186 observations rated
during all observation
periods; however, this does not indicate that there were over 7,000 unique individuals in the
parks. Rather, there were 7,186 observations of individuals. It is likely that the unique number of
observed individuals is a small fraction of the number of observations and that most observations
were repetitive observations of the same individuals.
The results, Table 1 above, show that almost half (49.8%) of all observations rated in the
four parks were participating in moderate activity. Only 8.3%, however, were engaged in very
active activity and the
remainder (41.9%) was
observed as sedentary
(sitting, standing). There
were differences by age as
well. Specifically, adults
were the most likely to be
sedentary (55.3%) while
adolescents were most
likely to be very active
(16.2%) and children were
most likely to be moderate
(58.1%). Conversely,
adolescents were least likely to be sedentary (30.8%) while adults were the least likely to be
engaged in moderate activity (40.7%) and very active behavior (4.0%).
Key Takeaways
Adults (aged 19 and over) were the most sedentary (55.3%) of all ages and
least likely to be engaged in moderate or very active behavior.
Adolescents (aged 13-18) were the greatest share of observations across all
three age groups engaged in very active behavior (16.2%).
Children (aged 3-12) were the most likely (58.1%) to be engaged in moderate
level activity of all ages.

8
0%
10%
20%
30%
40%
50%
60%
70%
Whaley
(n=417)
Max
Brandon
(n=1488)
Brennan
(n=490)
Bassett
(n=14)
Figure 2: Child Activity Level by Park
Sedentary
Moderate
Very Active
0%
20%
40%
60%
80%
100%
Whaley
(n=71)
Max
Brandon
(n=943)
Brennan
(n=811)
Bassett
(n=77)
Figure 3: Adolescent Activity Level by Park
Sedentary
Moderate
Very Active
Table 2: Overall Activity Level by Park
Whaley Max
Brandon
Brennan Bassett
Sedentary 35.0% 26.2% 59.5% 88.8%
Moderate 54.3% 64.8% 32.7% 10.9%
Very Active 10.7% 9.1% 7.7% 0.3%
Activity Levels by Park
The four parks had
different rates of
sedentary, moderate,
and very active.
Whaley had the
highest rate of
observations who
were very active (10.7%) while Basset had the lowest (0.3%). The greatest percentage of
observations engaged in moderate level activity was seen in Max Brandon (64.8%) and again the
lowest percentage was seen in Bassett (10.9%). Sedentary rates were greatest in Bassett (88.8%)
and lowest in Max Brandon (26.2%). Examining each park’s overall activity levels in the
following charts shows significant differences by age.
Children’s activity levels were
highest in Whaley and Max
Brandon parks. Whaley (as
shown above) had the second
lowest rates of sedentary
observations but the lowest rate
of sedentary children. Bassett,
however, had the highest
percentage of sedentary
observations overall and
sedentary children – though the
extremely small number of
observations (14) caution against
reading overly into these results. Max Brandon, however, had the lowest rate of very active
children – barely registering on the chart but coming in at 0.1% (2 very active child observations
out of 1488 total observations in Max Brandon).
Adolescents, though, were
most active in Max Brandon
Park with over 20% of
adolescent observations being
rated as very active. Max
Brandon also had the lowest
rate of sedentary adolescents
and second highest rate of
moderate activity adolescents.
Whaley had the highest
percentage of moderate
activity adolescents and
second lowest sedentary but
had no very active adolescents. Again Bassett has the greatest rate of sedentary adolescents, least
moderate level adolescents, and no adolescents engaged in very active behavior. About half of

9
0%
10%
20%
30%
40%
50%
60%
70%
80%
90%
Whaley
(n=289)
Max
Brandon
(n=1133)
Brennan
(n=1151)
Bassett
(n=302)
Figure 4: Adult Activity Level by Park
Sedentary
Moderate
Very Active
adolescent observations in
Brennan were sedentary,
followed by almost 40%
engaged in moderate
activity while the remainder
(11.3%) was engaged in
very active types of
physical activity.
Adults, as noted above
(Figure 4) in the overall
activity levels are
consistently the most
sedentary across all four
parks. In Bassett, there were a total of 10.3% of observations of moderate activity results with
the remaining 89.7% of sedentary adults. Brennan had the second most sedentary adult
observations (75.0%), followed by Whaley (49.1%) and Max Brandon (27.8%). Max Brandon
did have the greatest percent of adults engaged in both moderate (62.9%) and very active (9.3%)
behaviors.
Key Takeaways
Max Brandon and Whaley had the two highest rates of moderate level
activity observations (64.8% and 54.3%, respectively) and the lowest
sedentary percentage of sedentary observations (26.2% and 35.0%,
respectively. This was also true for children in the two parks. Bassett was
the most sedentary (88.8%) of all parks.
Adults were least sedentary in Max Brandon (27.8%) and Whaley
(49.1%), but more than two-thirds of all adults were sedentary in Brennan
(75.0%) and Bassett (89.7%).

10
0%
5%
10%
15%
20%
25%
30%
35%
Walking No
Identifiable
Activity
None of the
Above
Other
Playground
Games
Basketball
Figure 5: Activity Codes by Age (n=2173)
Children
Adolescents
Adults
Table 4: Activity Codes by Age
Children Adolescents Adults Total
Walking 24.1% 29.3% 41.7% 33.4%
No Identifiable
Activity
26.7% 22.4% 21.4% 23.2%
None of the
Above
10.3% 18.1% 24.4% 18.6%
Other Playground
Games
21.6% 14.8% 3.5% 11.8%
Basketball 12.1% 9.8% 2.6% 7.3%
Jogging/Running 4.5% 3.5% 2.9% 3.5%
Weight Training 0.0% 0.0% 3.0% 1.4%
Football 0.0% 1.7% 0.0% 0.4%
Baseball/Softball 0.6% 0.4% 0.0% 0.3%
Dance 0.0% 0.0% 0.2% 0.1%
Aerobics 0.0% 0.0% 0.1% 0.0%
Type of Activity by Age
Observers identified
what activities children,
adolescents, and adults were
engaged in during the one
minute observation period.
Activity codes are not linked to
specific activity levels – in other
words, we are unable to tell if a
child playing basketball was
playing at a moderate or very
active level. Results do indicate
what sort of activities in which
observed individuals were
participating.
The most common activity code for all observations in the four parks was “Walking”
(33.4%) while the next two were “No Identifiable Activity” (23.2%) and “None of the Above”
(18.6%). Among children, however, the most common activity code was “No Identifiable
Activity.” In fact, the percentage of adults “Walking” (41.7%) skewed the results sharply as
shown (Figure 5).
Key Takeaways
“Walking” was the most common activity across all ages (33.4%).
Children were often (26.7%) engaged in “No Identifiable Activity,” an
analogue for sedentary level activity (see methods section), followed by
“Walking” (24.1%) and “Other Playground Games” (21.6%). Adolescents
were most likely to be “Walking” (29.3%) followed by “No Identifiable
Activity” (22.4%).
The only identifiable activity adults engaged in over 10% of the time was
“Walking” (41.7%).

11
Table 5: Child Activity Code by Park
Max
Brandon
Whaley Brennan Bassett
No Identifiable
Activity
32.9% 20.0% 24.2% 0.0%
Walking 30.8% 26.2% 16.0% 0.0%
Other Playground
Games
26.0% 18.5% 13.9% 85.7%
None of the Above 8.9% 10.8% 11.7% 14.3%
Baseball/Softball 0.7% 1.5% 0.0% 0.0%
Basketball 0.3% 6.2% 31.2% 0.0%
Jogging/Running 0.3% 16.9% 3.0% 0.0%
Table 6: Adolescent Activity Codes by Park
Max
Brandon
Whaley Brennan Bassett
Walking 31.3% 37.5% 29.8% 5.7%
Other Playground
Games
22.0% 6.3% 11.5% 14.3%
No Identifiable
Activity
17.6% 12.5% 19.8% 80.0%
None of the Above 12.1% 41.7% 20.6% 0.0%
Jogging/Running 8.8% 0.0% 0.8% 0.0%
Football 4.9% 0.0% 0.0% 0.0%
Basketball 3.3% 2.1% 17.5% 0.0%
Table 7: Adult Activity Code by Park
Max
Brandon
Whaley Brennan Bassett
Walking 50.2% 31.3% 40.8% 14.1%
No Identifiable
Activity
21.7% 31.9% 17.9% 8.1%
None of the Above 8.9% 35.5% 31.0% 77.8%
Weight Training 5.6% 0.0% 0.0% 0.0%
Other Playground
games
5.4% 0.0% 3.3% 0.0%
Jogging/Running 5.4% 0.0% 0.0% 0.0%
Basketball 2.8% 0.0% 6.0% 0.0%
Aerobics 0.2% 0.0% 0.0% 0.0%
Baseball/Softball 0.0% 1.2% 0.0% 0.0%
Dance 0.0% 0.0% 1.1% 0.0%
Type of Activity by Park
The observed activities
differed from park to park. In
the above chart (Table 5)
summarizing child activity
codes by park, “Walking” is
the second most common
activity in Max Brandon, the
most common activity in
Whaley, the third most
common in Brennan but not
seen at all in Bassett. And
while all parks had some children engaged in other playground games (slides, jungle gyms, etc.),
Bassett had the most: almost all (85.7%) of observed children were playing other playground
games. Since no identifiable activity generally indicated observed individuals either standing or
sitting around (effectively sedentary), it follows that this is one of the highest rated activities
across the four parks. Bassett, per results from above, had an extremely low rate (0%) of children
engaged in “No Identifiable Activity”, however there was a total of 14 observations of children
in Bassett (7 engaged in sedentary activity, 6 engaged in moderate, and 1 very active). Likely the
sedentary observations were of
children engaged in a
playground game but not
moving – perhaps waiting their
turn to climb the slide.
Adolescents appeared
to spend more time “Walking”
than children – in fact, in half
of the parks, “Walking” was
the most frequently observed
activity by adolescents and the
second most frequent activity
observed in a third park
(Whaley).
Adults were observed
“Walking” more frequently
than any other age group.

12
However, “Walking” was the only the most observed activity in 2 of the parks (Max Brandon
and Brennan). The most frequently observed activity for adults in both Whaley and Bassett was
none of the above (35.5% and 77.8% respectively).
Key Takeaways
“No identifiable activity,” often synonymous for sedentary activity, was the
most frequent single activity code for most parks across all ages with the
exception of Bassett park.
Max Brandon had the highest rate of walkers (32.9% of children, 31.3% of
adolescents, and 50.2% of adults) and “Other Playground Games” (26.0% of
children, 22.0% of adolescents, and 5.4% of adults) across almost all ages in
all parks. Children in Bassett, however, were almost exclusively engaged in
“Other Playground Games” (85.7%).
The only universal activities observed across all four parks were “Other
Playground Games” and “Walking” (excluding “No Identifiable Activity”
and “None of the Above”).

13
Table 8: Activity Level by Intervention
Activity Level in Comparison Parks (n=3229)
Children Adolescents Adults Overall
Sedentary 34.5% 46.8% 69.8% 53.6%
Moderate 46.6% 42.7% 29.5% 37.9%
Very Active 18.9% 10.4% 0.7% 8.5%
Activity Level in Intervention Parks (n=3957)
Children Adolescents Adults Total
Sedentary 34.8% 17.0% 40.8% 32.4%
Moderate 65.0% 61.8% 51.8% 59.4%
Very Active 0.2% 21.3% 7.3% 8.2%
Table 9: Child Activity Code by Intervention
Comparison
(n=361)
Intervention
(n=306)
No Identifiable Activity 22.7% 31.4% Baseball/Softball 0.6% 0.7% Basketball 22.2% 0.3% Other Playground Games 15.5% 28.8% Walking 19.7% 29.4% Jogging/Running 8.0% 0.3% None of the Above 11.4% 9.2%
Table 10: Adolescent Activity Code by Intervention
Comparison
(n=300)
Intervention
(n=217)
No Identifiable Activity 18.7% 27.6% Basketball 15.0% 2.8% Football 0.0% 4.1% Other Playground Games 10.7% 20.7% Walking 31.0% 27.2% Jogging/Running 0.7% 7.4% None of the Above 24.0% 10.1%
Intervention and Comparison Parks
Two of the parks, Max Brandon and Bassett, were designated intervention parks because
of the investment by HKHC in Max Brandon and Keep Genesee County Beautiful in Bassett.
Whaley and Brennan parks were designed comparison parks as they lacked such support.
When overall activity
levels are compared,
comparison parks (Whaley
and Brennan) have a higher
rate of sedentary (53.6%)
observations than in
intervention parks (32.4%),
lower rate of moderate
(37.9%) than intervention
parks, but a similar
percentage of very active
observations in both the
intervention and comparison parks (8.2% and 8.5%, respectively). In Table 8, above, there are
some differences by age. Children and adolescents are less sedentary in the intervention parks
(Max Brandon and Bassett) than in comparison parks. However, the largest percentage of very
active children was in the comparison
parks (18.9%). And on the other side,
the highest percentage of sedentary
adults (69.8%) was in the comparison
parks as well.
The intervention parks had
similar percentages of children engaged
in “No Identifiable Activity” as the
comparison parks (22.7% and 31.4%),
as well as adolescents (comparison
parks with 18.7% and intervention
parks with 27.6%) and adults (24.6% of comparison park activity codes and 18.1% of
intervention park activity codes). The other codes hinted at the potential differences in
infrastructure or preferences by individuals living around the parks. One of the most popular
activities by children and adolescents in comparison parks were “Basketball” and “Walking”
(22.2% and 19.7% in children and
15.0% and 31.0% in adolescents);
while in the intervention parks
“Other Playground Games” and
“Walking” took the top places
(28.8% and 29.4% for children and
20.7% and 27.2% for adolescents) –
see Tables 9 and 10.
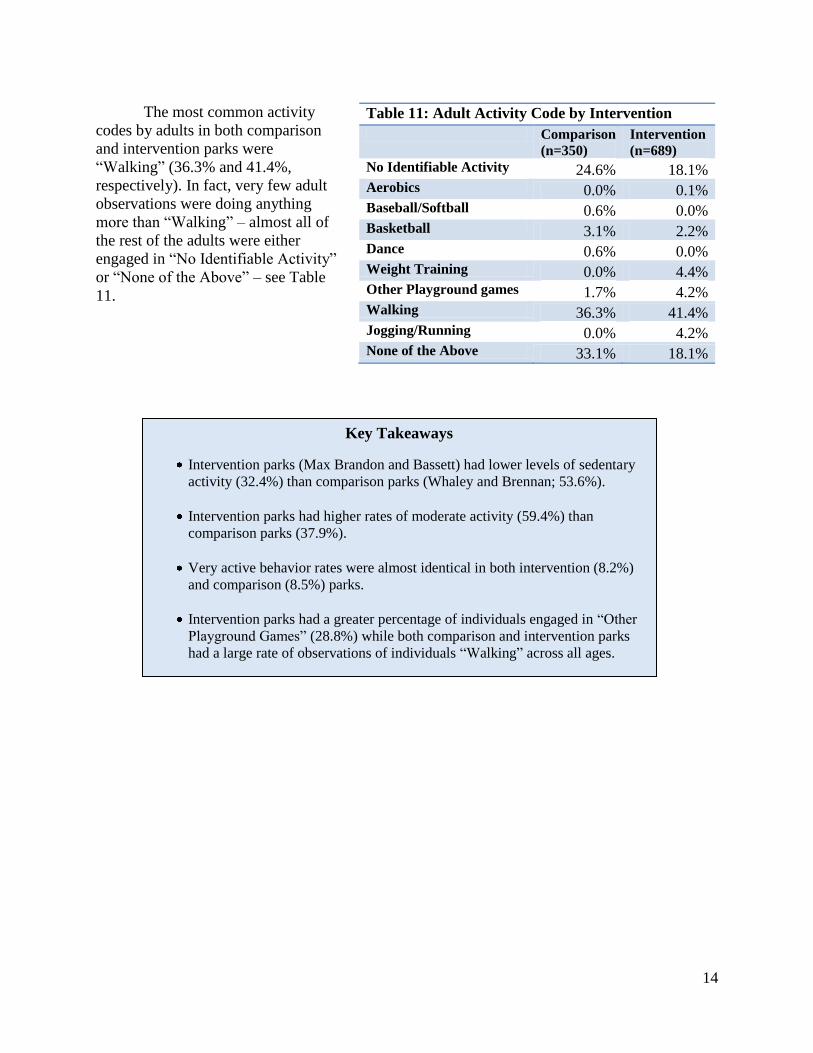
14
Table 11: Adult Activity Code by Intervention
Comparison
(n=350)
Intervention
(n=689)
No Identifiable Activity 24.6% 18.1% Aerobics 0.0% 0.1% Baseball/Softball 0.6% 0.0% Basketball 3.1% 2.2% Dance 0.6% 0.0% Weight Training 0.0% 4.4% Other Playground games 1.7% 4.2% Walking 36.3% 41.4% Jogging/Running 0.0% 4.2% None of the Above 33.1% 18.1%
The most common activity
codes by adults in both comparison
and intervention parks were
“Walking” (36.3% and 41.4%,
respectively). In fact, very few adult
observations were doing anything
more than “Walking” – almost all of
the rest of the adults were either
engaged in “No Identifiable Activity”
or “None of the Above” – see Table
11.
Key Takeaways
Intervention parks (Max Brandon and Bassett) had lower levels of sedentary
activity (32.4%) than comparison parks (Whaley and Brennan; 53.6%).
Intervention parks had higher rates of moderate activity (59.4%) than
comparison parks (37.9%).
Very active behavior rates were almost identical in both intervention (8.2%)
and comparison (8.5%) parks.
Intervention parks had a greater percentage of individuals engaged in “Other
Playground Games” (28.8%) while both comparison and intervention parks
had a large rate of observations of individuals “Walking” across all ages.
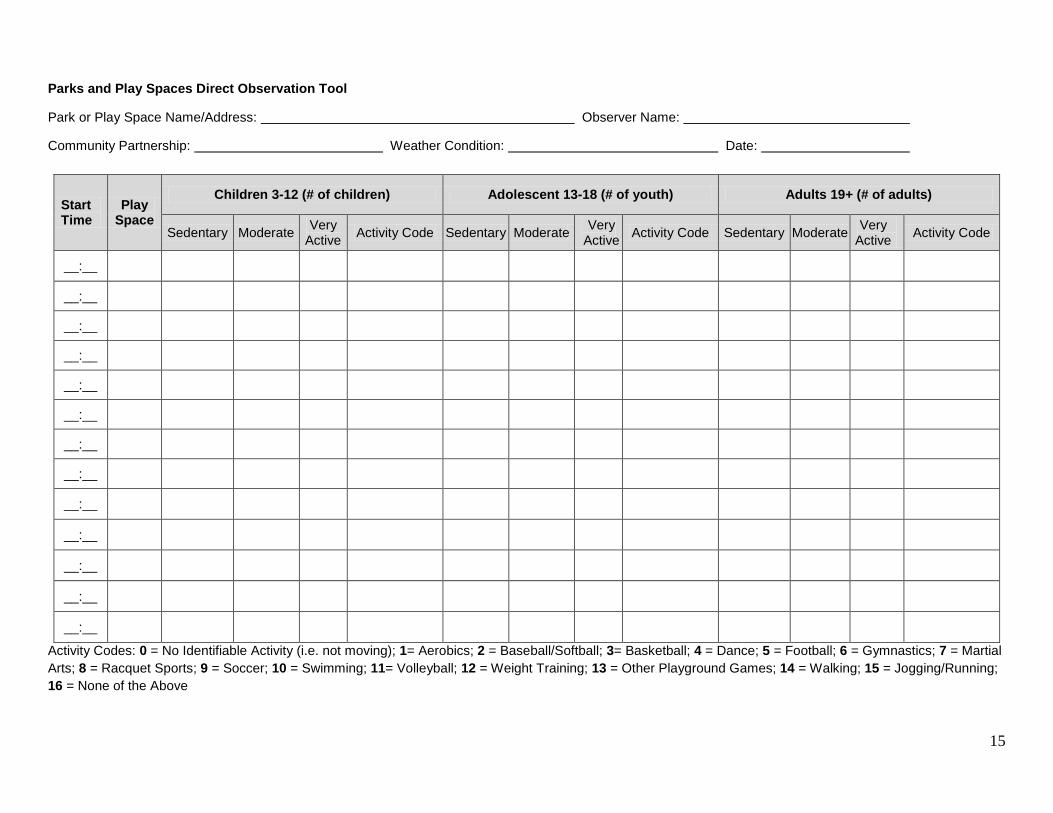
15
Parks and Play Spaces Direct Observation Tool
Park or Play Space Name/Address: Observer Name:
Community Partnership: Weather Condition: Date:
Start Time
Play Space
Children 3-12 (# of children) Adolescent 13-18 (# of youth) Adults 19+ (# of adults)
Sedentary Moderate Very
Active Activity Code Sedentary Moderate
Very Active
Activity Code Sedentary Moderate Very
Active Activity Code
__:__
__:__
__:__
__:__
__:__
__:__
__:__
__:__
__:__
__:__
__:__
__:__
__:__
Activity Codes: 0 = No Identifiable Activity (i.e. not moving); 1= Aerobics; 2 = Baseball/Softball; 3= Basketball; 4 = Dance; 5 = Football; 6 = Gymnastics; 7 = Martial
Arts; 8 = Racquet Sports; 9 = Soccer; 10 = Swimming; 11= Volleyball; 12 = Weight Training; 13 = Other Playground Games; 14 = Walking; 15 = Jogging/Running;
16 = None of the Above