
WHEN THE LIGHTS GO OUT MAXWELL IRVINE GUILDFORD OCTOBER 2005.
35
WHEN THE LIGHTS GO OUT WHEN THE LIGHTS GO OUT MAXWELL IRVINE GUILDFORD OCTOBER 2005
-
Upload
natalie-baker -
Category
Documents
-
view
213 -
download
0
Transcript of WHEN THE LIGHTS GO OUT MAXWELL IRVINE GUILDFORD OCTOBER 2005.

WHEN THE LIGHTS GO OUTWHEN THE LIGHTS GO OUT
MAXWELL IRVINE
GUILDFORD
OCTOBER 2005

POWER TO THE PEOPLE: POWER TO THE PEOPLE: NUMBERS COUNTNUMBERS COUNT
POWER TO THE PEOPLE: POWER TO THE PEOPLE: NUMBERS COUNTNUMBERS COUNT
Energy is quite simply the single most important commodity for our existence and the survival of our society and our civilization.
Ensuring an adequate, safe, sustainable and secure supply should be our highest national priority. It is easy to forget this in times of abundance.

POWER TO THE PEOPLE: POWER TO THE PEOPLE: NUMBERS COUNTNUMBERS COUNT
‘Power to the people’ is not a call for political revolution but it is a call for urgent political action.
No amount of political wishful thinking will resolve the issues. This is a quantitative as well as qualitative set of issues and ‘numbers count’

CAVEATCAVEAT
These are my personal views. My Committee’s Report is due in June 2006.
I am on a steep learning curve and am open to conversion.
Because of time, I will concentrate on the Global picture as a back drop to the discussion session.

CURRENT UK POLICYCURRENT UK POLICY
Current policy is enshrined in the 2003 White Paper ‘Our Energy Future: creating a low carbon economy’.
No new nuclear stations in the forseeable future.
Heavy dependence on ‘renewables’.Replacement of domestic fossil fuels by
imported gas.

OUR ENERGY FUTURE:OUR ENERGY FUTURE:
. “This is not a White Paper; it is a Green Paper with a broad yellow stripe” (House of Commons Select Committee).
“ We have met no one outside Government who believes these figures” (House of Lords Select Committee)
“ …that is why it is a political aspiration and not a policy target” (Energy adviser DTI)
ENERGY DEMAND ENERGY DEMAND DRIVERSDRIVERS
People use energy – more people require more energy.
The more people do, the more energy they require. Economic development feeds on energy.
The more severe the climate the greater the need for energy.
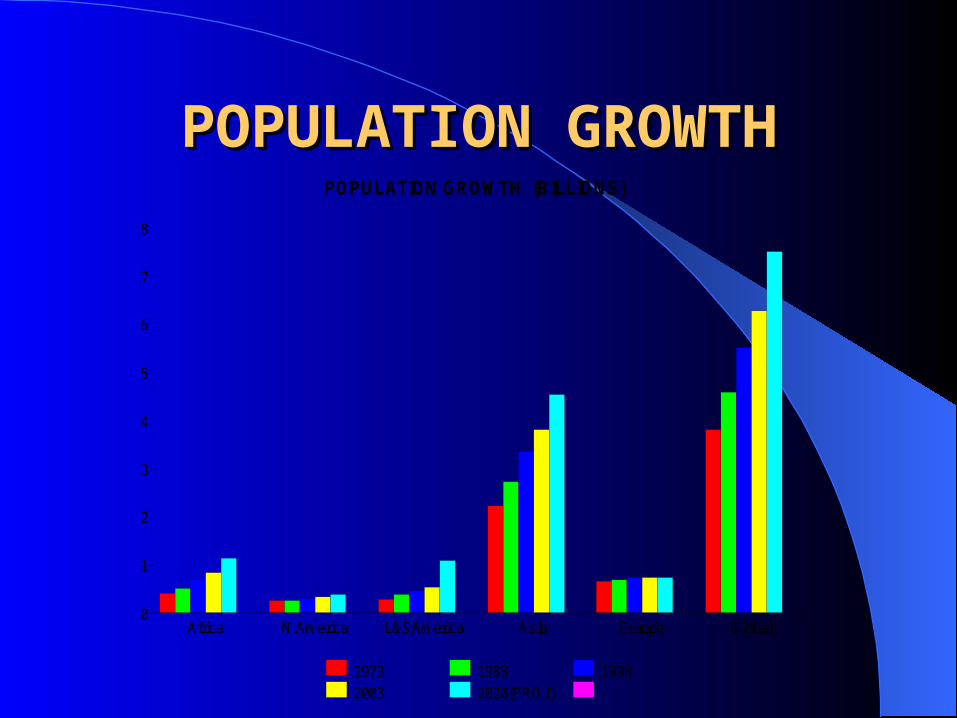
POPULATION GROWTHPOPULATION GROWTHPOPULATION GROWTH (BILLIONS)
0
1
2
3
4
5
6
7
8
Africa N.America L&SAmerica Asia Europe Global
1973 1983 19932003 2020(PROJ)

POPULATION GROWTHPOPULATION GROWTH
1950-2000 the population grew from 2.4 billion to over 6 billion.
2000 – 2020 the UN is projecting a growth to 7.5 billion.
By 2050 the UN predicts a global population of 9 billion (260 people for every square mile of dry land.

POPULATION GROWTHPOPULATION GROWTH
Europe and North America have stable populations. They produce and consume half the World’s energy.
The developing World has a rapidly expanding population and economic growth.
China and India (1/3 of global population) are experiencing double digit economic growth.

ENERGY GROWTHENERGY GROWTH
1950 – 2000 energy demand quadrupled.2000 – 2050 it is expected to double

TOTAL PRIMARY ENERGY SUPPLYGLOBAL
HYDRO 2.2%NUCLEAR 6.8%
BIOMASS 10.9%
OIL 34.9%
COAL 24.8%
GAS 21.2%
TOTAL PRIMARY ENERGY SUPPLY 2002

OECD 52.2
L&S AMER 4.4
ASIA 23.8
FORM USSR 9.1
MID EAST 4.2AFRICA5.3
TOTAL PRIMARY ENERGY SUPPLY % BY REGION 2002

COAL 20.8
HYDRO 2.0OTHER 0.7
NUCLEAR 11.1
GAS 21.9BIOMASS 3.3
OIL 40.4
TOTAL PRIMARY ENERGY SUPPLY BY OECD COUNTRIES 2002

TOTAL PRIMARY ENERGY TOTAL PRIMARY ENERGY SUPPLYSUPPLY
Fossil fuels account for 80.9% of all global energy supply. 83.1% in OECD.
Biomass ( all non fossilised hydrocarbons, including waste) accounts for 10.9% globally but only 3.3% in OECD
Others (wind, waves, tides, solar, geothermal etc) account for <0.5%
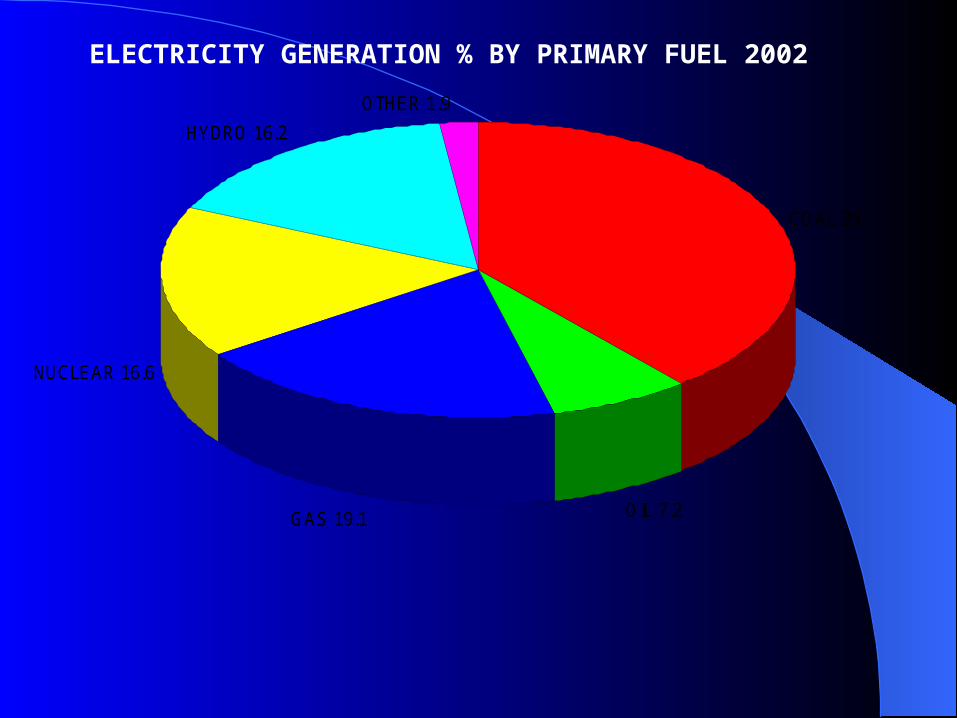
COAL 39
OIL 7.2GAS 19.1
NUCLEAR 16.6
HYDRO 16.2
OTHER 1.9
ELECTRICITY GENERATION % BY PRIMARY FUEL 2002

FINAL ENERGY CONSUMPTION
COAL 7.1
GAS 16.2
OIL 43.0
BIOMASS 14.1
ELEC 16.1OTHER 3.5
GLOBAL % 2002

FINAL ENERGY CONSUMPTIONBY REGION
OECD 52.1
ASIA 23.6
AFRICA 5.7
MID EAST 4.1
L&S AMER 5.0
FORM USSR 8.6
% 2002
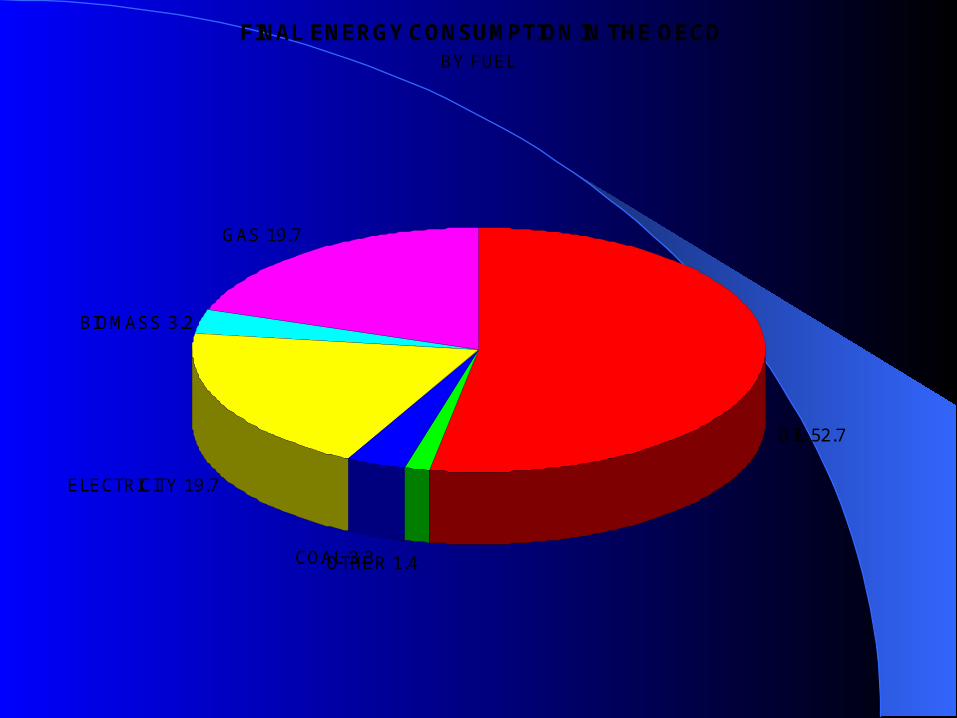
FINAL ENERGY CONSUMPTION IN THE OECDBY FUEL
OIL 52.7
OTHER 1.4COAL 3.3
ELECTRICITY 19.7
BIOMASS 3.2
GAS 19.7
ENERGY CONSUMPTIONENERGY CONSUMPTION
Two thirds of all electricity is generated by burning fossil fuels (more than a third by coal)
Direct burning of fossil fuels accounts for two thirds of all final energy consumption
In the OECD more than three quarters of final energy consumption comes as fossil fuels (mostly oil)
Consumption matches supply

SUSTAINABILITYSUSTAINABILITY
Two issues – availability and impact of use

0
50
100
150
200
250
COAL OIL GAS TOTAL
CURRENT +1%PA +2%PA
YEARS TO EXHAUSTION OF PROVEN GLOBAL FOSSIL FUEL RESERVES AT CURRENT CONSUMPTION AND WITH 1% AND 2% GROWTH RATES
FOSSIL FUEL EXHAUSTIONFOSSIL FUEL EXHAUSTION
Current proven reserves of all fossil fuels will be exhausted in just over 50 years if current trends continue.
New reserves will be found, new technologies will lead to greater depletion efficiency and as costs rise uneconomic fields will become viable.
However, oil and gas finds have lagged behind field exhaustion for nearly twenty years.
Costs are now rising steeply (>100%pa)

ENVIRONMENTAL IMPACTENVIRONMENTAL IMPACT
Concerns about coal go back to the Industrial Revolution.
Particulate omission (smoke banned 1960s)
Acid rain (sulphur emissions controlled 1970s)
Emission controls cost money – coal consumption peaked in1980s
ENVIRONMENTAL IMPACTENVIRONMENTAL IMPACT
Now the concern is global warming (carbon gasses emitted by all hydrocarbon burning)
The Kyoto agreement requires all signatories to reduce carbon emissions in stages until 2050 (UK by 60%)
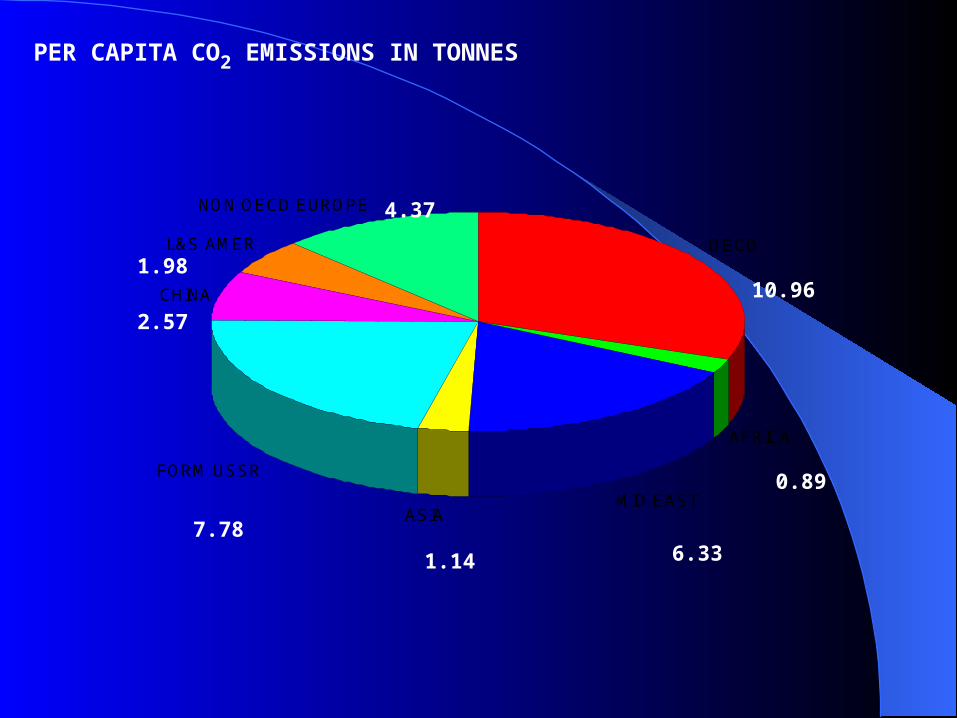
OECD
AFRICA
MID EASTASIA
FORM USSR
CHINA
L&S AMER
NON OECD EUROPE
10.96
0.89
6.331.14
7.78
2.57
1.98
4.37
PER CAPITA CO2 EMISSIONS IN TONNES

PROBLEMPROBLEM
Currently 80% of all energy comes from fossil fuels.
Global energy demand is expected to double by 2050.
Environmental and availability issues would suggest that fossil fuel consumption should halve by 2050
If the above is accepted then fossil fuels will only contribute 20% of energy by 2050.

OPTIONSOPTIONS
Savings and efficiency 20% Fossil fuels 20% Hydroelectricity < 5% Biomass <10% Alternatives < 10% New technologies: No fusion before 2050;
hydrogen net energy consumer Nuclear: under current global policies <10%

PROBLEMPROBLEM
At the most optimistic, there is a 25% energy
gap by 2050.

PROBLEMPROBLEM
RISING FOSSIL FUEL PRICES COULD DESTABILISE WORLD ECONOMIES – WORLD RECESSION SAVES FUEL
THE CHINESE HAVE REPLACED THE USA AS THE FINANCIAL DRIVERS OF THE WORLD ECONOMY
INTERNATIONAL COMPETITION FOR FOSSIL FUELS COULD BREED POLITICAL INSTABILITY AND TERRORISM
FOSSIL FUELS IN POLITICALLY UNSTABLE TERRITORIES (INVESTMENT?)

PROBLEM UKPROBLEM UK
NORTH SEA GAS <15 YEARS (NORWAY)-DECLINING
NORTH SEA OIL<10 YEARS-DECLINING DOMESTIC COAL UNECONOMIC NO MORE HYDROELECTRICITY WIND AND MARINE POWER < 50% OF
ELECTRICITY (<10% OF ENERGY) BY 2050 NUCLEAR TO BE PHASED OUT (CURRENTLY
25% OF ELECTRICITY) BY 2030

PROBLEM UKPROBLEM UK
THE GRID!!!KYOTO???????
UK NUCLEARUK NUCLEAR
CORWM DESPERATE SHORTAGE OF TECHNICAL
CAPACITY INTERNATIONAL MARKET FOR ENERGY
PLANTS WILL BE EXTREMELY COMPETITIVE (>160 NUCLEAR PLANTS ON ORDER)
NON CARBON PRODUCING ELECTRICITY GENERATION ON A VAST SCALE THE ONLY SOLUTION (HYDROGEN)

CONCLUSIONSCONCLUSIONS
Investment decisions are needed in the next 2-3 years (Number 10 has promised a nuclear decision in this session of Parliament)
The biggest obstacle to efficient energy use is conflicting Government bureaucracies
To implement an energy strategy we require an non departmental Energy Agency
Otherwise…..