When Can We Trust Our Memories? Quantitative and ...
178
Washington University in St. Louis Washington University Open Scholarship Arts & Sciences Electronic eses and Dissertations Arts & Sciences Spring 5-15-2015 When Can We Trust Our Memories? Quantitative and Qualitative Indicators of Recognition Accuracy Kurt Andrew DeSoto Washington University in St. Louis Follow this and additional works at: hps://openscholarship.wustl.edu/art_sci_etds Part of the Psychology Commons is Dissertation is brought to you for free and open access by the Arts & Sciences at Washington University Open Scholarship. It has been accepted for inclusion in Arts & Sciences Electronic eses and Dissertations by an authorized administrator of Washington University Open Scholarship. For more information, please contact [email protected]. Recommended Citation DeSoto, Kurt Andrew, "When Can We Trust Our Memories? Quantitative and Qualitative Indicators of Recognition Accuracy" (2015). Arts & Sciences Electronic eses and Dissertations. 494. hps://openscholarship.wustl.edu/art_sci_etds/494
Transcript of When Can We Trust Our Memories? Quantitative and ...
Washington University in St. LouisWashington University Open Scholarship
Arts & Sciences Electronic Theses and Dissertations Arts & Sciences
Spring 5-15-2015
When Can We Trust Our Memories? Quantitativeand Qualitative Indicators of Recognition AccuracyKurt Andrew DeSotoWashington University in St. Louis
Follow this and additional works at: https://openscholarship.wustl.edu/art_sci_etds
Part of the Psychology Commons
This Dissertation is brought to you for free and open access by the Arts & Sciences at Washington University Open Scholarship. It has been acceptedfor inclusion in Arts & Sciences Electronic Theses and Dissertations by an authorized administrator of Washington University Open Scholarship. Formore information, please contact [email protected].
Recommended CitationDeSoto, Kurt Andrew, "When Can We Trust Our Memories? Quantitative and Qualitative Indicators of Recognition Accuracy"(2015). Arts & Sciences Electronic Theses and Dissertations. 494.https://openscholarship.wustl.edu/art_sci_etds/494
WASHINGTON UNIVERSITY IN ST. LOUIS
Department of Psychology
Dissertation Examination Committee: Henry Roediger, Chair
Carl Craver Ian Dobbins
Mark McDaniel Kathleen McDermott
When Can We Trust Our Memories? Quantitative and Qualitative Indicators of Recognition Accuracy
by Kurt Andrew DeSoto
A dissertation presented to the Graduate School of Arts & Sciences
of Washington University in partial fulfillment of the
requirements for the degree of Doctor of Philosophy
May 2015 St. Louis, Missouri

© 2015, Kurt Andrew DeSoto

ii
Table of Contents
List of Figures ................................................................................................................................. v
List of Tables ............................................................................................................................... viii
Acknowledgments ........................................................................................................................... x
Abstract ........................................................................................................................................ xiii
Chapter 1: Introduction ................................................................................................................... 1
1.1 Should We Trust Our Memories? ......................................................................................... 1
1.2 Confidence as an Indicator of Recognition Accuracy .......................................................... 4
1.2.1 A Brief History of Confidence Ratings ......................................................................... 5
1.2.2 Different Relations Between Confidence and Accuracy ............................................... 6
1.2.3 Explanations of the Confidence-Accuracy Relation .................................................... 10
1.3 False Recall and Recognition of Category Members ......................................................... 18
1.3.1 Categorized Lists in the Literature ............................................................................... 18
1.3.2 Prior Research: False Recognition of Category Members ........................................... 23
1.3.3 Prior Research: A Revised Categorized List Procedure .............................................. 27
1.3.4 Summarizing the Confidence-Accuracy Relation ....................................................... 29
1.4 The Remember/Know/Guess Judgment as an Indicator of Recognition Accuracy ............. 30
1.4.1 The Remember/Know/Guess Procedure ....................................................................... 32
1.4.2 The Continuous Dual-Process Model of Remember/Know Judgments ....................... 34
Chapter 2: Experiment 1 ............................................................................................................... 43
2.1 Method ................................................................................................................................ 46
2.1.1 Subjects ........................................................................................................................ 47
2.1.2 Materials ...................................................................................................................... 47
2.1.3 Design and Procedure .................................................................................................. 47
2.2 Results ................................................................................................................................. 50
2.2.1 Effects of Presentation Modality ................................................................................. 50
2.2.2 Probabilities of Remembering, Knowing, and Guessing .............................................. 52
2.2.3 Remembering, Knowing, and Guessing and Response Frequency .............................. 54
2.2.4 Old/New Recognition Accuracy .................................................................................. 58
iii
2.2.5 Logistic Regression ...................................................................................................... 60
2.3 Discussion ........................................................................................................................... 61
Chapter 3: Experiment 2 ............................................................................................................... 62
3.1 Method ................................................................................................................................ 64
3.1.1 Subjects ........................................................................................................................ 65
3.1.2 Materials and Design ................................................................................................... 65
3.1.3 Procedure ..................................................................................................................... 66
3.2 Results ................................................................................................................................. 67
3.2.1 Calculating the Confidence-Accuracy Relation ........................................................... 67
3.2.2 Probabilities of Remembering, Knowing, and Guessing .............................................. 71
3.2.3 Old/New Recognition Accuracy .................................................................................. 75
3.2.4 Confidence-Accuracy Correlations .............................................................................. 79
3.3 Discussion ........................................................................................................................... 84
Chapter 4: Experiment 3 ............................................................................................................... 87
4.1 Method ................................................................................................................................ 88
4.1.1 Subjects ........................................................................................................................ 89
4.1.2 Materials and Design ................................................................................................... 89
4.1.3 Procedure ..................................................................................................................... 89
4.2 Results ................................................................................................................................. 90
4.2.1 Probabilities of Remembering, Knowing, and Guessing .............................................. 90
4.2.2 Old/New Recognition Accuracy .................................................................................. 92
4.2.3 Source Accuracy .......................................................................................................... 95
4.2.4 Confidence-Old/New Accuracy Correlations .............................................................. 97
4.2.5 Confidence-Source Accuracy Correlations .................................................................. 99
4.3 Discussion ......................................................................................................................... 101
Chapter 5: Experiment 4 ............................................................................................................. 103
5.1 Method .............................................................................................................................. 104
5.1.1 Subjects ...................................................................................................................... 104
5.1.2 Materials and Design ................................................................................................. 104
5.1.3 Procedure ................................................................................................................... 104

iv
5.2 Results ............................................................................................................................... 106
5.2.1 Old/New Recognition Accuracy ................................................................................ 107
5.2.2 Source Accuracy ........................................................................................................ 110
5.2.3 Confidence-Accuracy Correlations ............................................................................ 113
5.3 Discussion ......................................................................................................................... 114
Chapter 6: General Discussion .................................................................................................... 115
6.1 Summary of Findings ........................................................................................................ 115
6.2 Evaluating the Continuous Dual-Process Model .............................................................. 119
6.3 Implications of Quantitative and Qualitative Indicators ................................................... 123
6.4 Continued Questions and Future Directions ..................................................................... 124
6.5 Epilogue: Confidence and Accuracy ................................................................................ 126
References ................................................................................................................................... 129
Appendix A ................................................................................................................................. 141
Appendix B ................................................................................................................................. 145
Appendix C ................................................................................................................................. 149
Appendix D ................................................................................................................................. 155
K. Andrew DeSoto’s Curriculum Vitae ...................................................................................... 158
v
List of Figures
Figure 1.1: A recreation of the item types used by Tulving (1981). Subjects studied a series of pictures (top), then at test, a target (A) was paired with one of three types of lure (A’, B’, or X; bottom). Subjects were told to choose the studied picture. .........................................................................................................................16
Figure 1.2: The between-events confidence-accuracy correlations for targets (top panel) and strongly related lures (lures of response frequency 1-5; bottom panel) in Experiments 1 and 2 of Roediger and DeSoto (2014a). Each point represents an individual item. .......................................................................................................26
Figure 1.3: Between-events confidence-accuracy correlations for the same 240 category items when they were studied (targets; top panel) and nonstudied (related lures; bottom panel) in Experiment 1 of DeSoto and Roediger (2014). Each point represents an individual item. .............................................................................29
Figure 1.4: A depiction of the Wixted and Mickes (2010) continuous dual-process model. Reprinted with permission from Wixted, J. T., & Mickes, L. (2010). A continuous dual-process model of remember/know judgments, Psychological Review, 117, 1025-1054. Washington, DC: American Psychological Association. ..................................................................................................................36
Figure 1.5: General predictions provided by the continuous dual-process model. ........................37
Figure 1.6: The critical results of Ingram et al. (2012). Reprinted with permission from Ingram, K. M., Mickes, L., & Wixted, J. T. (2012). Recollection can be weak and familiarity can be strong. Journal of Experimental Psychology: Learning, Memory, and Cognition, 38, 325-339. Washington, DC: American Psychological Association. ..........................................................................................39
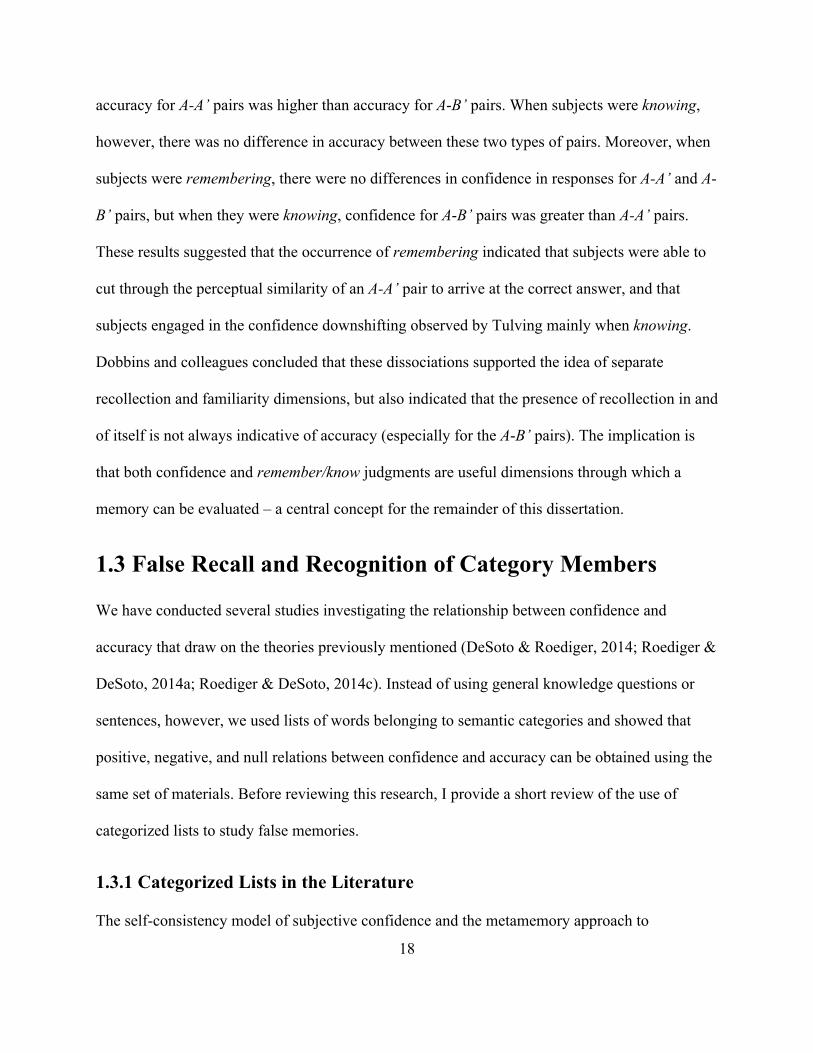
Figure 1.7: The response scale used by Ingram et al. (2012). Subjects made confidence ratings and remember/familiar judgments for each item at the same time. .................41
Figure 2.1: Proportions of remembering, knowing, and guessing as a function of response frequency for correct recognition and false recognition. Best fitting linear functions (see Table 2.4) are indicated by the dotted lines. .........................................55
Figure 2.2: Number of correctly recalled words and intrusions in an unpublished study using a cued recall version of the categorized list procedure. .....................................58
Figure 2.3: Accuracy for responses assigned remember, know, and guess judgments in Experiment 1. Error bars show the 95% confidence interval of the mean. The number of observations of each response type are presented in parentheses. .............60

vi
Figure 3.1: Calibration in Experiment 1 of DeSoto and Roediger (2014) as a function of item type. Error bars show the 95% confidence interval of the mean. The number of observations are presented beside each point. ............................................70
Figure 3.2: Confidence as a function of remember, know, and guess judgment in Experiment 2. Error bars show the 95% confidence interval of the mean. .................74
Figure 3.3: Calibration in Experiment 2 as a function of item type. Error bars show the 95% confidence interval of the mean. The number of observations are presented beside each point. ........................................................................................76
Figure 3.4: Calibration in Experiment 2 for responses assigned remember, know, and guess judgments. Error bars show the 95% confidence interval of the mean. The number of observations are presented beside each point. .....................................78
Figure 3.5: The between-events confidence-accuracy plot for remembered, known, and guessed items. Each point represents the average confidence assigned to an item and the average accuracy of that item. Linear trendlines are included. ...............84
Figure 4.1: Calibration in Experiment 3 as a function of item type. Error bars show the 95% confidence interval of the mean. The number of observations are presented beside each point. ........................................................................................93
Figure 4.2: Old/new calibration in Experiment 3 for responses assigned remember, know, and guess judgments. Error bars show the 95% confidence interval of the mean. The number of observations are presented beside each point. ..........................95
Figure 4.3: Source calibration in Experiment 3 for responses assigned remember, know, and guess judgments. Error bars show the 95% confidence interval of the mean. The number of observations are the same as those depicted in Figure 4.2.................................................................................................................................96
Figure 4.4: The between-events confidence-source accuracy plot for remembered, known, and guessed items. Each point represents the average confidence assigned to an item and the average source accuracy of that item. Linear trendlines are included. .....................................................................................................................101
Figure 5.1: An illustration of the four conditions in Experiment 4. ............................................105
Figure 5.2: Old/new accuracy as a function of old/new confidence in Experiment 4 for responses assigned remember, know, and guess judgments. .....................................108
Figure 5.3: Source accuracy as a function of source confidence in Experiment 4 for responses assigned remember, know, and guess judgments. .....................................110
Figure 5.4: Source accuracy as a function of old/new confidence in Experiment 4 for responses assigned remember, know, and guess judgments. .....................................113

vii
Figure 6.1: The between-subjects old/new confidence-old/new accuracy correlation across all items in five experiments, N = 294. ...........................................................127
Figure C.1: Predicted accuracy (via logistic regression) as a function of remember, know, or guess judgment and confidence rating in Experiment 2. .......................................151
Figure C.2: Predicted old/new accuracy as a function of remember, know, or guess judgment and confidence rating in Experiment 3. .....................................................152
Figure C.3: Predicted source accuracy as a function of remember, know, or guess judgment and confidence rating in Experiment 3. .....................................................153

viii
List of Tables
Table 2.1: Response rates in Dewhurst’s (2001) Experiment 2. ....................................................46
Table 2.2: Proportions with which item types were called “old” in the audio and visual presentation conditions in Experiment 1. Standard errors of the mean are presented in parentheses. .............................................................................................51
Table 2.3: Proportions of remembering, knowing, and guessing for the three different item types on the recognition test in Experiment 1. Standard errors of the mean are presented in parentheses. ..............................................................................53
Table 2.4: Correlations between response frequency of items and response proportion for both correct and false recognition. A negative correlation indicates that the response type was greater for high response frequency items than low response frequency items. *p < .01. .............................................................................56
Table 3.1: Probabilities of remembering, knowing, and guessing for the three item types in Experiment 2, as well as confidence ratings provided with those responses. Standard errors of the mean are presented in parentheses. ..........................................72
Table 3.2: Confidence-accuracy correlations for the three item types. Between-units correlations calculated using Pearson r, within-units correlations calculated with Goodman-Kruskal γ. *p < .05 **p < .01 ............................................................81
Table 3.3: Confidence-accuracy correlations for remembered, known, and guessed memories as a function of remember/know/guess judgment. Between-units correlations calculated using Pearson r, within-units correlations calculated with Goodman-Kruskal γ. *p < .05 **p < .01 ..............................................................82
Table 4.1: Probabilities of remembering, knowing, and guessing for the three item types in Experiment 3, as well as confidence ratings provided with those responses. Standard errors of the mean are presented in parentheses. ..........................................91
Table 4.2: Confidence-old/new accuracy correlations for the three item types in Experiment 3. Between-units correlations calculated using Pearson r, within-units correlations calculated with Goodman-Kruskal γ. *p < .05 **p < .01 ................98
Table 4.3: Confidence-old/new accuracy correlations for remembered, known, and guessed memories in Experiment 3. Between-units correlations calculated using Pearson r, within-units correlations calculated with Goodman-Kruskal γ. *p < .05 **p < .01 ........................................................................................................98
Table 4.4: Confidence-source accuracy correlations for remembered, known, and guessed memories in Experiment 3. Between-units correlations calculated using

ix
Pearson r, within-units correlations calculated with Goodman-Kruskal γ. *p < .05 **p < .01 ..............................................................................................................100
Table D.1: Old/new confidence-old/new accuracy correlations by group for the three item types in Experiment 4. Between-units correlations calculated using Pearson r, within-units correlations calculated with Goodman-Kruskal γ. *p < .05 **p < .01...............................................................................................................................155
Table D.2: Old/new confidence-old/new accuracy correlations by group for the three response types in Experiment 4. Between-units correlations calculated using Pearson r, within-units correlations calculated with Goodman-Kruskal γ. Due to counterbalancing, within-events correlations could not be calculated. *p < .05 **p < .01 ..............................................................................................................156
Table D.3: Source confidence-source accuracy correlations by group for the three response types in Experiment 4. Between-units correlations calculated using Pearson r, within-units correlations calculated with Goodman-Kruskal γ. Due to counterbalancing, within-events correlations could not be calculated. *p < .05 **p < .01 ..............................................................................................................157

x
Acknowledgments
This dissertation and my graduate education were made possible through the considerable
contributions of many colleagues, friends, and family members.
First, I thank Roddy Roediger for six excellent years of instruction, mentorship, and
collaboration. The role he has played in my development as a scientist, student, employee, and
individual cannot be understated. I have learned much through observing his knowledge,
diplomacy, and craft in action. Thank you, Roddy, for inviting me into your lab and seeing me
through. It has been an honor to be your student.
I thank Kathleen McDermott, Ian Dobbins, Mark McDaniel, and Carl Craver, the members of
my dissertation committee, for their helpful guidance and advice throughout this project and
other projects. It is clear that their research, teaching, and service help make Washington
University great. Thanks also go to Simine Vazire and Larry Jacoby for their involvement on
earlier committees. I also recognize Chris Ball and Jeanine Stefanucci, my undergraduate
mentors, for encouraging me to pursue graduate education in cognitive psychology.
I am especially grateful to the graduate students, postdoctoral scientists, and research staff
members who have shared space with me in the Roediger Memory Lab since 2009, including
Andrew Butler, Franklin Zaromb, Pooja Agarwal, Yana Weinstein, Megan Smith, John
Nestojko, Victor Sungkhasettee, Jason Finley, Meghan McDoniel, Allison Obenhaus, and Lena

xi
Abel. I also thank Jane McConnell, Jean Ortmann, Brittany Butler, and Julie Gray for research
and administrative support. Special thanks also go to the members of the McDermott Memory &
Complex Cognition Lab for their collegiality and insight.
I thank the Washington University undergraduate honors students, independent study students,
and research assistants who I have had the privilege to work with while in graduate school,
including Paige Madara, Zoe Tabachnick, Robyn Husa, Harry Kainen, Scarlet Zhang, Cecilia
Votta, Aleks Husic, Marie Bissell, Deniz Ariturk, Katie Greenberg, and Christian Gordon.
More generally, I am appreciative of all the members of the Behavior, Brain, & Cognition
program of the Psychology Department, and the rest of the Department’s faculty, students, staff,
and leadership. I cannot imagine a better place to work and study.
Huge thanks go to Kurt DeSoto and Donna DeSoto, my parents, and Aimee DeSoto, my sister,
for teaching me the cardinal virtues of hard work, balance, patience, and empathy. The
commitments they have made to my education have not been easy ones. I am also grateful to my
grandparents, Frank Marcinkowski and Dolores Marcinkowski, and the rest of my extended
family, for their encouragement and wisdom provided from afar.
I appreciate the companionship of my good friends in St. Louis who have proven themselves to
be talented scholars, skilled professionals, and, most importantly, excellent people. Thanks for
being with me here; I will miss all of you. In particular, I would like to thank my coworker
Adam Putnam for being an excellent role model, accomplice, and friend.

xii
Last, I extend my deepest thanks and love to Becky Koenig, who alone carried the psychological
and emotional weight of this challenging process when I could not. Thanks, Becky, for your
companionship and support from both near and far. Here’s to many past and future years of
synergistic ecphory.
This research was supported generously by an American Psychological Association Dissertation
Research Award, a Washington University in St. Louis Department of Psychology Dissertation
Research Award, a Washington University Dean’s Dissertation Fellowship, and a collaborative
activity grant awarded to Roddy Roediger from the James S. McDonnell Foundation.
Andy DeSoto
Washington University in St. Louis
May 2015

xiii
ABSTRACT OF THE DISSERTATION
When Can We Trust Our Memories?
Quantitative and Qualitative Indicators of Recognition Accuracy
by
Kurt Andrew DeSoto
Doctor of Philosophy in Psychology
Washington University in St. Louis, 2015
Professor Henry L. Roediger, III, Chair
In this dissertation, I present a quartet of experiments that studied confidence ratings and
remember/know/guess judgments as indicators of recognition accuracy. The goal of these
experiments was to examine the validity of these quantitative and qualitative measures of
metacognitive monitoring and to interpret them using the continuous dual-process model of
signal detection (Wixted & Mickes, 2010).
In Experiment 1, subjects heard or read items belonging to categorized lists and took an old/new
recognition test over studied and new items while making remember/know/guess judgments after
each recognition decision. Consistent with prior literature, remember judgments were more
likely to be accurate than know judgments, and knows more accurate than guesses. Subjects were
more likely to commit remember false alarms to nonstudied category members of higher
response frequency for a category (e.g., eagle) than to items of lower response frequency (e.g.,
ostrich), although the overall proportion of false remembering was lower than the proportion
often found using associative false memory procedures (e.g., Roediger & McDermott, 1995).
Presentation modality did not affect recognition performance.

xiv
In Experiment 2, subjects provided both confidence ratings and remember/know/guess judgments
following recognition decisions in an otherwise similar procedure. Overall, accuracy correlated
with both confidence and remember/know/guess judgment, and remembered memories rated
with high confidence were more accurate than either high confidence or remembered memories
alone. These results suggested that confident retrieval of episodic and contextual information
supported accurate recognition decisions. I also calculated confidence-accuracy correlations
using four methods and found that confidence and accuracy were correlated for remembered and
known memories, but that no correlation was found for guesses.
In Experiment 3, subjects studied category items in different screen positions (instead of in the
center of the screen, as in the prior experiments). On the recognition test following, subjects were
tested on whether items presented were old or new and also reported the screen position in which
items were presented (i.e., a test of source memory). Confidence ratings followed these
recognition + source decisions. A similar relationship was found between confidence ratings and
remember/know/guess judgments when predicting both old/new recognition accuracy and source
accuracy. This result contradicts predictions made by the continuous dual-process model, which
states that only remember judgments and not confidence ratings should indicate source accuracy.
Experiment 4 was conducted to replicate and extend results of Experiment 3 and to examine the
effects of the order of judgments provided during the test. In this experiment, subjects were
asked to make old/new recognition decisions, old/new confidence ratings, source decisions,
source confidence ratings, and remember/know/guess judgments, with test order counterbalanced
among four between-subjects conditions. In this study, I found that the relationship between
confidence and old/new and source accuracy as a function of remember/know/guess judgment

xv
was similar regardless of condition, reproducing the observations of Experiment 3. These results
were also inconsistent with predictions made by the continuous dual-process model and
suggested that the results of Experiment 3 were not due to confounding effects of judgment
order.
Taken together, the results of these four experiments suggest that confidence and
remember/know/guess judgments are valuable when used jointly and that both contribute
individually as indicators of recognition accuracy. The results show that the continuous dual-
process model of signal detection is a helpful way to consider the interaction of confidence
ratings and remember/know/guess judgments, but they also imply that additional research is
necessary to evaluate how the present results fit with the model. In particular, Experiments 3 and
4 failed to obtain Wixted and Mickes’ (2010) finding of higher source accuracy for remember
responses than for knows and guesses regardless of level of confidence.
The practical message is that researchers and rememberers should consider both quantitative and
qualitative characteristics of a memory when attempting to infer its accuracy.

1
Chapter 1: Introduction
A fundamental characteristic of our memories is our belief in them. When we look back at our
lives and remember the people we have met, the skills we have learned, the events we have
experienced, and the facts we have been taught, we usually have faith that what comes to mind is
what truly occurred. Although we recognize that the quality of our memories varies – graduating
from kindergarten may be hazy, whereas our first kiss leaves an imprint like a flashbulb – we
assume that the details we are able to remember are correct. Our everyday lives function under
the trust that this is so.
1.1 Should We Trust Our Memories?
Often, when we are confident in our memories, it turns out that they are correct. A long history
of psychology research, however, reveals that our memories can sometimes lie to us, too. It turns
out that the confidence with which we hold our memories can sometimes be misguided and have
no bearing on truth. Even more concerning is that there are times when we are very confident in
our memories of events that never happened. We are sometimes so certain of these memories, in
fact, that we even believe we can remember specific details surrounding them – perhaps details
of sound or color. Understanding these illusions of remembering, called false memories, and
their relationship with the subjective experiences of the rememberer is the central topic of this
dissertation.
Psychological researchers have long known that memory’s reconstructive nature contributes to
false memories. This area of research began with the work of Bartlett (1932) and continues today
(see Roediger & DeSoto, 2015, for a review). The neuropsychologist Hebb (1949) likened the

2
process of remembering to that of a paleontologist reconstructing a dinosaur – just like a
paleontologist makes use of individual fossils to make an inference about the whole beast,
humans have a tendency to embellish, extrapolate, and guess when remembering. Similarity and
confusion can also play a role in false memories, too; sometimes we remember or recognize
something that is like, but not quite the same as, something we have previously learned or
experienced. In general, these processes of reconstruction and similarity matching work to the
benefit of memory – we are normally more correct than not – but they also produce errors (see
Roediger, 1996).
The fallible nature of memory has been well documented in the scientific literature. Google
Scholar estimates that since I began my graduate training in psychology in 2009, over 300
articles have been published with the phrase “false memory” in the title and nearly 7,500 with it
in the text. Despite this wealth of research, however, the general public appears relatively under-
informed about the existence and frequency of false memories. In a 2011 telephone survey study
conducted by Simons and Chabris, 63% of a representative sample of the U.S. population agreed
with the statement Human memory works like a video camera, accurately recording the events
we see and hear so that we can review and inspect them later. Similarly, 48% of Americans
agreed with the statement Once you have experienced an event and formed a memory of it, that
memory does not change. In contrast, the disagreement of a group of psychologists who took the
same survey was nearly unanimous.
The lack of awareness of the reconstructive nature of memory has significant implications for
domains such as education, medicine, business, and law. The case of Antonio Beaver is one
example of these implications. Beaver, a St. Louis-area man, spent 10 years in prison as a result
3
of a confident eyewitness misidentification. The Innocence Project, a group dedicated to
assisting wrongfully convicted individuals, describes on its website how in 1996 a woman was
carjacked by a man wielding a screwdriver. She escaped unharmed and helped police construct a
composite sketch of her attacker. About a week later, police presented her with a live lineup of
four people, yet only one in the lineup, Beaver, came close to matching the sketch. The victim
said she was “90% sure” that Beaver was the perpetrator, and then changed to “100% sure” after
investigating the lineup more closely (see Wixted, Mickes, Clark, Gronlund, & Roediger, 2014,
for a discussion of how confidence ratings change over time). That confident identification was
enough evidence for an 18-year prison sentence. Ten years into Beaver’s sentence, however,
DNA testing of evidence found at the original crime scene identified another man, already in
prison, as the actual attacker, and Beaver was released. In this case, the cost of a high confidence
false memory was 10 years of a person’s life. Cases like these make it clear that there is a
continued need to investigate confidence ratings and other indicators of memory accuracy.
This dissertation presents a research program conducted with the primary goal of assessing how
individuals can determine whether the memories they hold are likely to be accurate or inaccurate.
First, I review the psychological variable of confidence, which can be considered a quantitative
measure of memory, and describe research my colleagues and I and others have conducted on the
relationship between confidence and accuracy. I then describe the remember/know/guess
judgment, a method of investigating the qualitative nature of memories, and discuss recent
research that has attempted to combine these two judgments.
Next, I report four experiments carried out to further develop and extend knowledge of these
quantitative and qualitative indicators of recognition accuracy. In Experiment 1, I applied the

4
remember/know/guess procedure to a false memory procedure we have used in prior work
(DeSoto & Roediger, 2014). I compared false memories arising in this procedure to false
memories that arise in other procedures (e.g., the Deese-Roediger-McDermott procedure; DRM;
Roediger & McDermott, 1995), and also tested differences in responding as a function of the
modality in which items were studied (e.g., visual vs. auditory). Experiment 2 was aimed at
collecting both confidence ratings and remember/know/guess judgments in the same procedure
and relating the results to a recent theoretical model of recognition memory (Wixted & Mickes,
2010). In Experiments 3 and 4, I extended the previous procedures, testing individuals’ memory
for both old/new recognition but also for source details (specifically, the location in which items
were presented). To foreshadow, these four studies agreed in showing that both confidence
ratings and remember/know/guess judgments are useful indicators of memory accuracy. The
results also implied that the continuous dual-process model is useful for understanding the
confidence-accuracy relationship, although certain aspects of the model were not verified.
1.2 Confidence as an Indicator of Recognition Accuracy
When individuals attempt to determine the accuracy of a memory, they engage in a process
called memory monitoring (Nelson & Narens, 1990). Memory monitoring is a type of
introspection that involves analytic considerations about the nature of memories retrieved as well
as the application of heuristics and cues. In the psychology laboratory, the monitoring process is
studied through the use of subjective reports: Subjects make a memory decision (e.g., “I believe I
studied this item earlier in the experiment”), and then they answer one or more questions about
that decision.
One heuristic used in memory monitoring is subjective confidence, sometimes called certainty,

5
which is defined as the subjective sense of sureness that a memory report is accurate (Dunlosky
& Metcalfe, 2009). These self-intuitive ratings have a long history and continue to be employed
in research studies today.
1.2.1 A Brief History of Confidence Ratings
Theorists have been interested in the topic of subjective confidence for millennia. Aristotle, as an
example, examined the relation between confidence and human virtue. To him, consistent with
his concept of the golden mean, confidence was undesirable in excess but was a notable quality
when occurring in moderation. In one translation of his Rhetoric, Aristotle is attributed as saying,
“When in danger at sea, people may feel confident about what will happen either because they
have no experience of bad weather, or because their experience gives them the means of dealing
with it” (Roberts, 1924/1984).
Because there was no discipline called psychology in Aristotle’s time, however, the empirical
study of confidence took more than 2,000 years to develop. It was not until the 1800s that the
study of confidence ratings came into the mainstream thanks to the work of psychophysics
researchers. One of the earliest papers in the confidence literature is an 1885 monograph written
by Peirce and Jastrow. In this research, coincidentally published in the same year as
Ebbinghaus’s (1885/1913) landmark work on memory, subjects estimated the magnitude of
pressures placed upon their fingertips. After making an estimate, subjects were then asked to rate
how high or low their confidence was on a numeric scale. Perhaps surprisingly, the way in which
confidence ratings are collected has not much changed in 130 years.
In contrast, scientific understanding and use of confidence has grown considerably. In the
modern era, retrospective confidence ratings are commonly used in the areas of judgment and
6
decision-making (e.g., Gigerenzer, Hoffrage, & Kleinbölting, 1991; Lichtenstein, Fischhoff, &
Phillips, 1982; Tversky & Kahneman, 1974) as well as by signal detection theorists (e.g.,
Lockhart & Murdock, 1970; Yonelinas & Parks, 2007). Confidence ratings also are frequently
employed within the psychological subfield of metacognition (e.g., Flavell, 1979; Hart, 1965;
Nelson & Narens, 1990). Tulving and Madigan anticipated a renaissance of introspective
techniques when they urged in their 1970 paper, “Why not start looking for ways of
experimentally studying… one of the truly unique characteristics of human memory: its
knowledge of its own knowledge” (p. 477). Fittingly, research conducted in this tradition has
emphasized that the degree to which confidence is associated with accuracy is of great
theoretical interest. This perspective is illustrated by Nelson and Narens (1990), who wrote,
“Introspection can be examined as a type of behavior so as to characterize both its correlations
with some objective behavior… and its distortions” (p. 128).
We can apply Nelson and Narens’ (1990) suggestion to the issue of confidence as an indicator of
memory accuracy. When is confidence related to accuracy? When is this relationship distorted?
1.2.2 Different Relations Between Confidence and Accuracy
Researchers have disagreed about the nature of the relationship between confidence and accuracy
and the usefulness of confidence in real-world situations (e.g., eyewitness testimony scenarios).
Cognitive psychologists have reported that confidence and accuracy generally are related –
namely, that memory decisions made with higher confidence are more likely to be accurate than
decisions made with lower confidence (see Dunlosky & Metcalfe, 2009, chs. 6, 8). In contrast,
forensic psychologists often have argued that the association between confidence and accuracy is
either weak or nonexistent (e.g., Odinot, Wolters, & van Koppen, 2008; V. L. Smith, Kassin, &

7
Ellsworth, 1989). In a 2012 review, however, we (Roediger, Wixted, & DeSoto) observed that
the confidence-accuracy relationship is complex: One can analyze the same dataset in several
different ways and arrive at divergent conclusions about the nature of this relationship. In this
section, I discuss these differing accounts of the confidence-accuracy relation and how they can
be resolved.
Positive Confidence-Accuracy Relations
Cognitive psychologists believe that confidence and accuracy are usually related. This
assumption goes back quite a while: Over a century ago, Dallenbach (1913) observed, “The
degree of certainty of [a subject’s] replies bears a direct relation to the fidelity of the answer” (p.
335). In an experiment that led to this conclusion, Dallenbach gave subjects one minute to study
a picture of a man and woman sitting at a table drinking tea. He then tested the subjects at
different time intervals ranging from immediately to 45 days after the initial study session. The
test contained a series of questions that each corresponded to a detail of the photo. After subjects
answered a question, they indicated their confidence. Dallenbach found that when subjects were
more confident when responding to a test question, they were less likely to produce an error (and
thus were more likely to be correct). Put differently, confidence in this experiment was directly
related to accuracy.
One hundred years later, scholars continue to claim that confidence and accuracy are positively
related. Dunlosky and Metcalfe (2009), in their excellent primer on metamemory, stated, “The
relative accuracy of people’s confidence is high. Higher confidence ratings almost inevitably
mean that [an] item had been previously presented” (p. 176). This perspective is borne from
early research investigating tip-of-the-tongue states and feelings of knowing (Hart, 1967) and

8
strength-trace theories of memory (e.g., King, Zechmeister, & Shaughnessy, 1980). Dunlosky
and Metcalfe’s dictum is also implicit in other theories of recognition memory, as suggested by
Wixted and Mickes (2010) – who we will return to later – who said, “Memories are said to be
strong when they are associated with relatively high confidence, high accuracy, and fast reaction
times” (p. 1025). According to these researchers, confident memories are often accurate ones.
Drawing on this scientific opinion, as well as on some degree of common sense, the U.S.
Supreme Court decided to accept confidence of eyewitness identifications as evidence in a court
of law in Neil v. Biggers (1972), ruling, “The factors to be considered in evaluating the
likelihood of misidentification include… the level of certainty demonstrated by the witness at the
confrontation,” that is, the meeting of the witness and the suspect in court. In this landmark case,
the Supreme Court decided that because “[the victim] testified… that there was something about
[the suspect’s] face ‘I don’t think I could ever forget… we find no substantial likelihood of
misidentification.”
In sum, many experimental psychologists and those in the justice system assume a strong
relation between confidence and accuracy.
Null Confidence-Accuracy Relations
One hundred years of cognitive psychology research is directly contradicted, however, by a just-
as-lengthy investigation spearheaded by forensic psychologists who have been critical of the
assumptions made by cognitive psychologists and the justice system. These researchers, who
often study police lineups, eyewitness identification, and face recognition, have long stated that
the relation between confidence and accuracy is actually quite poor. This theorizing dates back to
the days of Münsterberg (1908), who wrote in his famous book On the Witness Stand:

9
In some Bowery wrangle, one witness was quite certain that a rowdy had taken a beer-mug and kept it in his fist while he beat with it the skull of his comrade; while others saw that the two were separated by a long table, and that the assailant used the mug as a missile, throwing it a distance of six or eight feet.
This colorful quote illustrates the reconstructive nature of memory: Here, two individuals are
quite confident that two different events occurred, and it is unlikely that both accounts are true
(although admittedly more possible in this example than in others). Accordingly, Münsterberg’s
subsequent case studies and empirical investigations, often conducted as classroom
demonstrations, failed to find a relationship between confidence and accuracy.
Modern research conducted by forensic and social psychologists has corroborated early theories
about the weak confidence-accuracy relation. In many of the studies conducted in these
traditions, subjects see a scene unfold before them in which a perpetrator commits a staged or
real crime (as recorded by a security camera, etc.), wait a period of time, and then are asked to
make an identification from a real or simulated lineup. Subjects rate their confidence following
the identification, and it rarely corresponds with accuracy (for a critique of the statistic
improperly used to calculate the confidence-accuracy relation in many of these studies, called the
point-biserial correlation, see Juslin, Olsson, & Winman, 1996; Roediger et al., 2012).
Results like these have led forensic researchers to make bold claims such as, “Common sense
and the Supreme Court notwithstanding, confidence is not a useful indicator of the accuracy of a
particular witness or of the accuracy of particular statements made by the same witness” (V. L.
Smith et al., 1989, p. 358), and that confidence “should never be allowed as evidence in the
courtroom” (Odinot et al., 2008, p. 513). Clearly, these opinions are different from the ones
listed earlier, and these two sets of researchers might disagree on the validity of confidence

10
ratings in laboratory tasks, forensic contexts, and other real-life situations.
Negative Confidence-Accuracy Correlations
Sometimes, confidence is such a poor indicator of accuracy that it correlates negatively with
accuracy. In these cases, the more confident an individual is, the less likely he or she is to be
accurate. I will describe several of these cases in greater detail in upcoming sections.
So, what is the relation between confidence and accuracy? The reports just described make it
seem as if there is no general answer, or that the relations obtained depend on the materials that
are used, the research tradition employed, or perhaps the scenario to which confidence ratings are
being applied. Indeed, this question as worded is too broad to answer. Nevertheless, three lines
of research have made good progress of understanding the characteristics that make confidence-
accuracy relations more lawful than they appear at first glance.
1.2.3 Explanations of the Confidence-Accuracy Relation
The seemingly contradictory literature suggests, at least initially, that there is no clear answer as
to whether confidence and accuracy are strongly or weakly related. Nevertheless, several groups
of researchers have been successful at exploring descriptors of the magnitude and direction of the
confidence-accuracy relation. Three recent approaches to understanding differences in the
confidence-accuracy relation are the self-consistency model of subjective confidence (Koriat,
2012), the metamemory approach to confidence (Brewer & Sampaio, 2006; 2012; Brewer,
Sampaio, & Barlow, 2005; Sampaio & Brewer, 2009), and our research using categorized list
procedures (DeSoto & Roediger, 2014; Roediger & DeSoto, 2014a; Roediger & DeSoto, 2014c;
Roediger et al., 2012). Although these three lines of work emerge from different motivations and
employ different materials, they agree on a basic account of when confidence and accuracy are

11
related and when they are not.
The Self-Consistency Model of Subjective Confidence
The self-consistency model of subjective confidence and the related consensuality principle
proposed by Koriat (2008, 2012) state that confidence is only sometimes related to accuracy.
Koriat and his colleagues, over decades of rigorous investigation, observed that higher
confidence is not always assigned to the memory response that is correct. Rather, confidence
corresponds with the memory response that is most likely to be chosen among subjects (referred
to by Koriat as the majority response or consensual response). When the consensual response is
the correct one, then, confidence is usually positively related to accuracy. When the consensual
response is the incorrect one, on the other hand, or when there is no consensual response,
confidence is not related to accuracy.
For example, if subjects study the word cardinal among a list of unrelated words and see
cardinal on an easy recognition test (e.g., after a short delay), a correct response of “old” is more
common than an incorrect response of “new.” When a response is consensual – that is, others
agree – it also tends to be rated with higher confidence. Therefore, because “old” is the
consensual response – cardinal is a consensually correct item – responses of “old” are also
assigned higher confidence ratings than responses of “new.” Thus, a positive confidence-
accuracy correlation emerges for cardinal. Because many cognitive psychologists use
straightforward materials in their research, that is, materials in which most items are
consensually correct, these researchers often find that confidence and accuracy are related.
In contrast, sometimes the consensual response in a memory procedure is the incorrect one, and a
given item may be consensually wrong. For example, after seeing a minute of crime footage, if a

12
lineup is constructed that includes a lure face very similar to the perpetrator shown in the video
and does not include the actual perpetrator, subjects may be more likely than not to identify the
lure. In these cases, the incorrect response – the consensual one – is assigned higher confidence
ratings, on average, than the nonconsensual (but correct) response, and a negative confidence-
accuracy correlation results. This negative correlation means that when people are more
confident in their response, they are more likely to be committing a memory error.
Koriat (2008) provided an empirical demonstration of the self-consistency model. He presented
subjects with a wide range of general knowledge questions and collected confidence ratings after
each response. Some of these questions were consensually correct, and some were consensually
wrong. For example, the question What is the name of India’s ‘holy’ river? was a consensually
correct question because most subjects were able to come up with an answer that was also the
correct one (The Ganges). On the other hand, the question The island of Corsica belongs to what
country? was classified as a consensually wrong question because subjects usually responded
incorrectly (saying Italy instead of France). Other questions had no consensual response. Koriat
calculated gamma correlations (one way of measuring the confidence-accuracy association,
resulting in a statistic that ranges from -1.00 to 1.00 in the same way as the Pearson r) for the
different types of question and found that gamma was positive for the consensually correct
questions (γ = .47, indicating a positive association between confidence and accuracy), negative
for the consensually wrong questions (γ = -.24), and null for questions without a consensual
response (γ = .04). Across all items, gamma was also positive (γ = .24), but weaker than gamma
for the consensually correct questions analyzed alone.
Koriat’s (2012) model provides a unifying explanation for the contradictions described in the

13
preceding sections. When researchers conduct studies using materials for which correct answers
are more common than errors, positive confidence-accuracy relations are obtained. In contrast,
when researchers conduct studies using materials for which incorrect answers are more likely,
weak or even negative confidence-accuracy relations can be shown (for recent research using
this theory, see Koriat & Sorka, 2015).
The Metamemory Approach to Confidence
The metamemory approach to confidence, proposed by Brewer, Sampaio, and their colleagues
(Brewer & Sampaio, 2006; 2012; Brewer et al., 2005; Sampaio & Brewer, 2009), provides a
similar account to predict when confidence and accuracy will be related. In one study, Sampaio
and Brewer (2009) had subjects study different sentences (e.g., The tornado picked up the elm
tree) and then take a recognition test over studied and nonstudied sentences. Subjects were given
instructions to only respond “old” if the sentence presented at test was exactly the same as the
one that was studied – in other words, that responses should be based on literal, surface structure
memory. Subjects made confidence ratings after each response.
Sampaio and Brewer (2009) found that subjects were highly likely to recognize the studied
sentences correctly on a final test. Subjects were also tested on another class of sentences,
however, called deceptive sentences. These sentences were similar to the studied sentences,
except that certain critical words or phrases were replaced with synonyms. When subjects saw
these sentences on the test, they were likely to recognize them, even though they were never
studied (i.e., were not the verbatim originals). (Note that these sentences were predicted to be
deceptive a priori.) For example, if subjects studied the sentence The narcotics officer pushed the
doorbell, they often recognized the sentence The narcotics officer rang the doorbell, even though

14
the latter sentence was never presented verbatim (and might not be accurate – for instance, in this
example, the doorbell might have been broken). In this case, subjects made the pragmatic
inference that pushing the doorbell caused it to ring.
Brewer and colleagues analyzed the confidence-accuracy relationship for the nondeceptive and
deceptive sentences separately and found a modest gamma correlation between confidence and
accuracy for nondeceptive sentences (γ = .26), but a negative correlation for deceptive ones (γ = -
.44), similar to the pattern obtained by Koriat (2008). Similar findings were also obtained using
recall tests (Brewer et al., 2005) and forced choice recognition tests (Brewer & Sampaio, 2006;
Sampaio & Brewer, 2009). In 2012, Brewer and Sampaio conceptually replicated these results
using tests of geographical knowledge, too (e.g., Is Windsor, Ontario south of Milwaukee,
Wisconsin? – a puzzle left to the reader).
These findings led Sampaio and Brewer (2009), like Koriat (2012), to hypothesize that the
magnitude and direction of the confidence-accuracy relation is a function of the items studied
and tested. Summing things up, they wrote:
We believe that the accuracy of memory confidence judgments depends on the distribution of materials that has been experienced previously and on the makeup of the items being tested. Thus, with a list of nondeceptive items, one can have a strong positive relationship between confidence and accuracy. With a list including a mixture of deceptive and nondeceptive items, one can have no relationship between confidence and accuracy. With a list of only deceptive items, one can have a strong negative relation between confidence and accuracy. (p. 162)
As should be clear, the metamemory approach and self-consistency model proposed by Koriat
(2012) tell the same general story. Although the theoretical explanations of why some items are
deceptive and some items are not differ, these two theories make similar claims about the
confidence-accuracy relation. In short, when a test is made up of nondeceptive (or consensually

15
correct) items, the confidence-accuracy correlation is positive. When a test is made up of
deceptive (or consensually wrong) items, the relation is weakly negative. When a test contains
both nondeceptive and deceptive items, the confidence-accuracy relation tends to be modestly
positive.
A limitation of the self-consistency and metamemory accounts is that they do not provide causal
accounts of the confidence-accuracy relation – rather, they provide a description of when
confidence and accuracy do and do not correlate. Nevertheless, this general characterization is a
helpful way to describe positive, null, and negative correlations.
Other Confidence-Accuracy Inversions
Other researchers have also found negative relationships between confidence and accuracy. In an
early example, Tulving (1981) asked subjects to study a series of complex scenic pictures, such
as a city skyline or a farm among fields. Subjects studied one half of each scenic image (either
the left or the right half), which was termed A. On a subsequent two-alternative forced choice
recognition test, subjects were shown the studied picture (A) and one of three possible lures. The
lures were either (1) the nonstudied half of the studied picture displayed (called A’), (2) the
nonstudied half of another studied picture (B’), or (3) half of a nonstudied picture (X). Subjects
rated confidence after each decision. See Figure 1.1 for an illustration of these different item
types.

16
Figure 1.1: A recreation of the item types used by Tulving (1981). Subjects studied a series of pictures (top), then at test, a target (A) was paired with one of three types of lure (A’, B’, or X; bottom). Subjects were told to choose the studied picture.
Tulving (1981) found that subjects’ confidence was lowest when they were deciding between the
highly similar pairs (A-A’). This is because when subjects were asked to discriminate between
two highly similar, confusable pictures, subjects realized that the decision was tricky and
adjusted their confidence ratings downward accordingly. It turned out that recognition
performance was not lowest for these high similarity pairs, however – in fact, subjects were
worse at identifying A when it was presented in an A-B’ pair. Because these items were not
perceptually similar, however (only ecphorically similar, to use Tulving’s phrase), subjects did
not reduce their confidence when responding. Thus, for A-A’ pairs, subjects had lower
confidence and higher accuracy relative to A-B’ pairs, for which higher confidence and lower
17
accuracy followed.
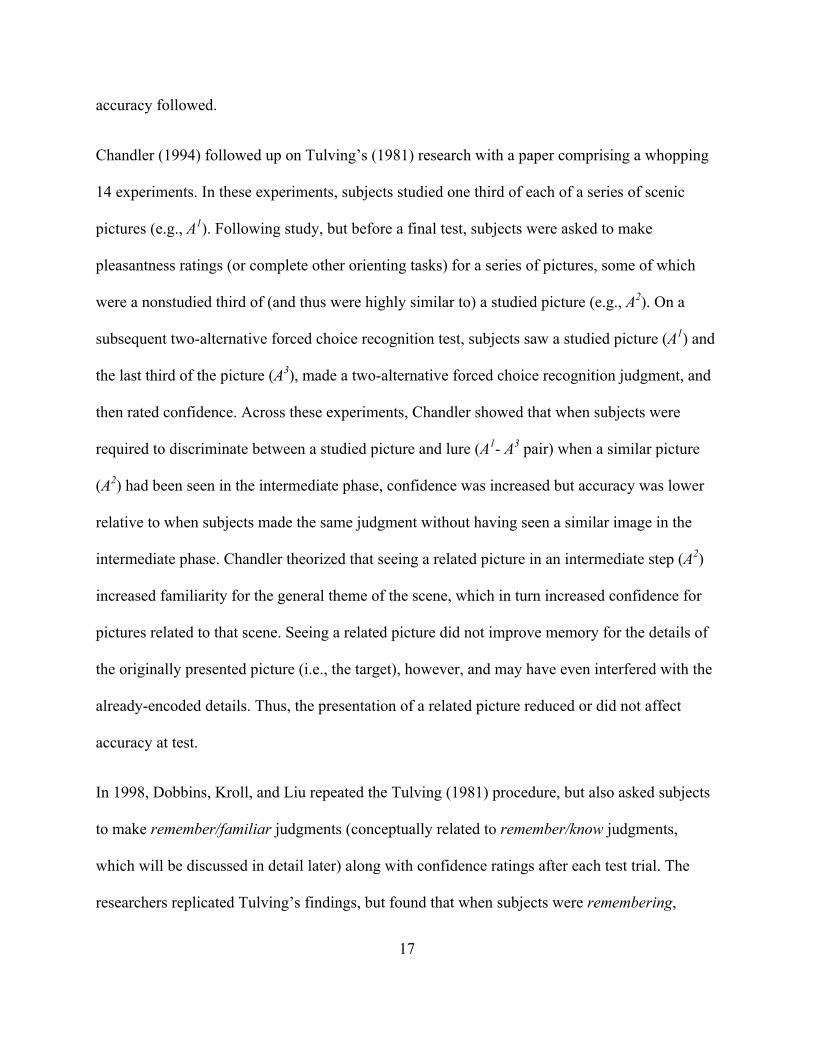
Chandler (1994) followed up on Tulving’s (1981) research with a paper comprising a whopping
14 experiments. In these experiments, subjects studied one third of each of a series of scenic
pictures (e.g., A1). Following study, but before a final test, subjects were asked to make
pleasantness ratings (or complete other orienting tasks) for a series of pictures, some of which
were a nonstudied third of (and thus were highly similar to) a studied picture (e.g., A2). On a
subsequent two-alternative forced choice recognition test, subjects saw a studied picture (A1) and
the last third of the picture (A3), made a two-alternative forced choice recognition judgment, and
then rated confidence. Across these experiments, Chandler showed that when subjects were
required to discriminate between a studied picture and lure (A1- A3 pair) when a similar picture
(A2) had been seen in the intermediate phase, confidence was increased but accuracy was lower
relative to when subjects made the same judgment without having seen a similar image in the
intermediate phase. Chandler theorized that seeing a related picture in an intermediate step (A2)
increased familiarity for the general theme of the scene, which in turn increased confidence for
pictures related to that scene. Seeing a related picture did not improve memory for the details of
the originally presented picture (i.e., the target), however, and may have even interfered with the
already-encoded details. Thus, the presentation of a related picture reduced or did not affect
accuracy at test.
In 1998, Dobbins, Kroll, and Liu repeated the Tulving (1981) procedure, but also asked subjects
to make remember/familiar judgments (conceptually related to remember/know judgments,
which will be discussed in detail later) along with confidence ratings after each test trial. The
researchers replicated Tulving’s findings, but found that when subjects were remembering,
18
accuracy for A-A’ pairs was higher than accuracy for A-B’ pairs. When subjects were knowing,
however, there was no difference in accuracy between these two types of pairs. Moreover, when
subjects were remembering, there were no differences in confidence in responses for A-A’ and A-
B’ pairs, but when they were knowing, confidence for A-B’ pairs was greater than A-A’ pairs.
These results suggested that the occurrence of remembering indicated that subjects were able to
cut through the perceptual similarity of an A-A’ pair to arrive at the correct answer, and that
subjects engaged in the confidence downshifting observed by Tulving mainly when knowing.
Dobbins and colleagues concluded that these dissociations supported the idea of separate
recollection and familiarity dimensions, but also indicated that the presence of recollection in and
of itself is not always indicative of accuracy (especially for the A-B’ pairs). The implication is
that both confidence and remember/know judgments are useful dimensions through which a
memory can be evaluated – a central concept for the remainder of this dissertation.
1.3 False Recall and Recognition of Category Members
We have conducted several studies investigating the relationship between confidence and
accuracy that draw on the theories previously mentioned (DeSoto & Roediger, 2014; Roediger &
DeSoto, 2014a; Roediger & DeSoto, 2014c). Instead of using general knowledge questions or
sentences, however, we used lists of words belonging to semantic categories and showed that
positive, negative, and null relations between confidence and accuracy can be obtained using the
same set of materials. Before reviewing this research, I provide a short review of the use of
categorized lists to study false memories.
1.3.1 Categorized Lists in the Literature
The self-consistency model of subjective confidence and the metamemory approach to

19
confidence imply that the materials matter when it comes to investigating the confidence-
accuracy relationship. Koriat (2008) stressed this perspective when he said:
[My] results highlight the theoretical benefits that ensue from a deliberate inclusion of nonrepresentative items (see Roediger, 1996). It is this inclusion that allows dissociating the effects of correctness from those of consensuality, thus providing some clues into the mechanism underlying the successful monitoring of one’s own performance.” (p. 954)
As previously suggested, however, basic list-learning procedures used in the cognitive laboratory
tend to be mostly straightforward, whereas forensic and social psychology procedures are often
deceptive or tricky for subjects. Studying positive and negative confidence-accuracy correlations
in the laboratory requires a compromise – a procedure that elicits sufficient numbers of both true
and false memories (i.e., offers both nondeceptive and deceptive items at test).
Fortunately, cognitive psychologists have several procedures in their toolkit that meet this
requirement, including the Deese-Roediger-McDermott procedure (DRM procedure; Deese,
1959; Roediger & McDermott, 1995), which celebrates its 20th anniversary this year. In the
DRM procedure, subjects study items that are related associatively to a critical word that is never
presented. Subjects usually recall or recognize the studied items on a subsequent recall or
recognition test correctly. In many cases, however, subjects also intrude or falsely recognize the
critical word, even though it was never studied. Experiment 1 of Roediger and McDermott’s
study showed that subjects were often confident when remembering the critical word, and
Experiment 2 demonstrated that, surprisingly, subjects could remember contextual details about
the moment in which the critical word was presented – although this moment never actually
occurred. Although the DRM procedure results in both true and false memories, the number of
false memory observations available is relatively low, with only one possible per list in the

20
standard version of the procedure. This makes the DRM procedure less effective at exploring the
confidence-accuracy correlation (although see Roediger & DeSoto, 2014c, for a reanalysis of the
original DRM data that shows a confidence-accuracy inversion for critical lures).
False memory has been investigated with materials other than associative (e.g., DRM-type) lists,
however. The use of categorized lists is also popular in false memory research and is possibly
more effective at studying the confidence-accuracy relation. In procedures using categorized
materials, instead of studying words that are related associatively, subjects study items belonging
to different semantic categories. For example, a subject may study a series of birds (e.g.,
cardinal, eagle, oriole, and bluejay) and attempt to remember them later. Researchers have
observed in a variety of cases that category members that were never studied are sometimes
recalled or recognized on a later test, much like how critical lures are remembered in the DRM
procedure (although the nature of these false memories differ, and will be discussed later).
Categorized lists are unique due to the way they are structured. Researchers compiling
categorized list norms (i.e., material sets; e.g., Battig & Montague, 1969) ask subjects to name as
many members of different categories as possible. Once these data have been collected,
researchers rank-order each category item by the frequency with which it was provided by
subjects. For example, in the Birds list, eagle is the bird mentioned most commonly by subjects,
whereas raven is in the 20th position (usually items that are provided extremely infrequently are
included in the norms but not ranked). List position in norming studies is referred to as response
frequency rank or sometimes output dominance; therefore, items that subjects frequently produce
are said to be high in response frequency, whereas items produced infrequently are low in
response frequency. This means that the position of an item in a categorized list is a meaningful

21
value. In contrast, the order of items in the DRM procedure is less meaningful (although often
items in these lists are presented in order of associative strength to the critical word).
Like the critical items in DRM, category items that are high in response frequency are recalled or
recognized even when they are never presented. Meade and Roediger (2006, 2009) had subjects
study lists of category items with the top five items in terms of response frequency removed. In
one experiment, several tests followed this study phase. First, subjects took a category cued
recall test in which they were asked to name as many studied items as possible from provided
categories. There were frequent intrusions of high response frequency items. Next, subjects took
a free recall test in which they were also asked to provide remember/know judgments (Rajaram,
1993; Tulving, 1985). There were additional intrusions of high response frequency items;
moreover, subjects indicated (by providing remember judgments) that they had access to
contextual and episodic details about the presentation of some items that were never studied
(although know responses, indicating familiarity in the absence of recollection, were provided
most often). In another experiment, Meade and Roediger also collected confidence ratings and
found that high confidence was often associated with intrusions of high response frequency
items.
Dewhurst and colleagues (2001; Dewhurst & Anderson, 1999; Dewhurst & Farrand, 2004;
Dewhurst, Bould, Knott, & Thorley, 2009) also investigated memory for category items. In one
study (Dewhurst, 2001), subjects studied items of varying response frequency from different
categories. On a subsequent recognition test, subjects were tested on words they had studied as
well as lure items both higher and lower in response frequency than the studied items. Dewhurst
observed that subjects were much more likely to commit a false alarm to lures of high response

22
frequency than low response frequency. In a later study, Dewhurst and Farrand (2004) conducted
a similar experiment but asked subjects to provide introspective reports when responding to
items on the test. The language associated with false alarms to high response frequency category
items hinted that at encoding, some subjects covertly generated category items related to the ones
that were studied. This observation led Dewhurst to propose a generation mechanism as an
explanation for false alarms to category items. According to Dewhurst, when subjects study
category items, they covertly generate related category members, and are more likely to generate
items higher in response frequency than lower. On a final test, source monitoring errors are
likely to occur in which subjects confuse the words they actually studied with the ones they
generated. This results in an increased number of false alarms, especially for lures high in
response frequency.
S. M. Smith and colleagues (S. M. Smith, Gerkens, Pierce, & Choi, 2002; S. M. Smith, Tindell,
Pierce, Gilliland, & Gerkens, 2001; S. M. Smith, Ward, Tindell, Sifonis, & Wilkenfeld, 2000)
also conducted research using categorized lists. In the paper by S. M. Smith and colleagues
(2000), subjects studied categorized lists with the first item removed. Subjects were given a
recall test either after each list or after all the lists had been learned. When a test was given
immediately after a list’s presentation, intrusions were infrequent; however, after all lists had
been learned, intrusion likelihood increased considerably. Experiment 2 took a finer-grained
approach. S. M. Smith and colleagues (2000) noted, “The use of categorized study lists makes
it… possible to systematically observe the effects of gradations in the strength of items from the
category rather than limiting the focus to the single most dominant one” (p. 389). With this in
mind, they had subjects study either the even or the odd items from normed categorized lists and
afterwards had subjects recall as many items as possible. They then examined the correlations

23
between an item’s response frequency and the likelihood that it was recalled correctly or intruded
at test.
S. M. Smith and colleagues (2000) observed that response frequency was a significant predictor
of both correct recall and intrusions. Namely, after studying category items, subjects were more
likely to correctly recall and intrude items that were higher in response frequency than lower.
Other analyses conducted showed that these relationships were driven by response frequency
even when accounting for things like typicality (i.e., the degree to which an item is prototypical
of a given family). Analyses I conducted several years ago (DeSoto, 2011) also showed that
response frequency has an effect on the likelihood of intrusions above and beyond the effects of
word frequency, as well. S. M. Smith and colleagues hypothesized that items high in response
frequency were high in accessibility and familiarity, and that these characteristics led to the
increased number of both true and false memories.
In sum, research conducted using categorized lists reveals the flexibility and utility of these
materials. Although the false memories they evoke are not as strong or as compelling as those
produced by associative lists, they are effective materials with which the relationship between
confidence and accuracy can be explored.
1.3.2 Prior Research: False Recognition of Category Members
We have built upon the research of Dewhurst, S. M. Smith, and their colleagues to develop an
updated categorized list procedure that is an effective tool to study confidence-accuracy relations
in the laboratory. This tool has also helped to address the issue of positive, null, and negative
correlations often found between confidence and accuracy.

24
In our first experiment on the topic (Roediger & DeSoto, 2014a), we were interested primarily in
seeing if positive, negative, and null correlations between confidence and accuracy could be
obtained using a single set of items. As mentioned previously, doing so required some items at
test that were likely to be nondeceptive and some that were likely to be deceptive. With this aim,
we presented subjects with 150 items taken from items 6-20 in the category norms belonging to
10 categorized lists (i.e., in a fashion similar to Meade & Roediger, 2006; 2009). Thus, these
items were neither high in response frequency (e.g., carrot) for a given category (e.g., A
Vegetable), nor low in response frequency (e.g., artichoke) – so they were words like pea,
cabbage, and pepper. The words were presented over headphones by category in random order.
After a five-minute distractor task, subjects were given a 300-item recognition test composed of
the 150 targets, 50 strongly related lures (items 1-5 from the 10 lists), 50 weakly related lures
(items 21-25 from the lists), and 50 unrelated lures taken from nonstudied categories. Subjects
responded “old” or “new” to the word on the screen, then rated their confidence in that decision
on a scale from 0 (not at all confident) to 100 (entirely confident).
Subjects were highly likely to recognize items 1-5 on the recognition test, even though they were
not presented, replicating the results of Meade and Roediger (2006, 2009). When subjects
committed false alarms to these items, they did so with disproportionately high confidence – a
rating of 68, on average, on the 100-point scale (meanwhile, actual targets were identified with
an average of 84 confidence).
We analyzed the correlation between confidence and accuracy in a number of different ways, to
be described in a later section, and observed a modest correlation between confidence and
accuracy across methods of analysis. When we broke down these analyses by item type,

25
however, we discovered two distinct patterns, illustrated in the two panels of Figure 1.2. The
correlation between confidence and accuracy was positive for targets (the nondeceptive items),
as shown in the top panel, but for strongly related lures, those of response frequency 1-5, there
was a striking negative relation between confidence and accuracy when using items as the unit of
analysis (shown in the top panel). This meant that subjects were likely to identify these items as
studied – even though they never were – and that subjects also provided higher confidence
ratings when they said “old” to these items rather than “new.” Put differently, the items that
subjects were more likely to commit false alarms to were also rated with higher confidence, on
average. These findings agreed with expectations generated from the self-consistency model
(Koriat, 2012) and the metamemory approach (Brewer & Sampaio, 2012). Moreover, the
patterns were consistent with both the cognitive and forensic literatures – that is, they
demonstrated simultaneous positive, negative, and null correlations between confidence and
accuracy.

26
Figure 1.2: The between-events confidence-accuracy correlations for targets (top panel) and strongly related lures (lures of response frequency 1-5; bottom panel) in Experiments 1 and 2 of Roediger and DeSoto (2014a). Each point represents an individual item.
This experiment demonstrated that different correlations between confidence and accuracy are
possible as a function of the way analyses are conducted. We concluded that the similarity of the
strongly related lures to the items that were studied drove the high false alarm rates and
confidence ratings for these items.
In follow-up analyses, we (Roediger & DeSoto, 2014a) observed that the false alarm
.00
.50
1.00
.50
1.00
0 25 50 75 100
Acc
urac
y
Confidence
Related Lures Targets
r = .67
r = -.39

27
probabilities for items 1-5 appeared to follow a roughly linear pattern, with false alarms to items
of response frequency 1 more frequent than those of response frequency 2, and so on (r = -.23).
This hint of a pattern led us to design a revised categorized list procedure that enabled us to
explore false alarm rates and their relationship with response frequency with greater power. This
categorized list procedure was used in the four experiments reported in this dissertation.
1.3.3 Prior Research: A Revised Categorized List Procedure
In this revised categorized list procedure (DeSoto & Roediger, 2014), instead of studying items
of intermediate response frequency taken from the middle of categorized lists, subjects studied
either the even or the odd-ranked items (in terms of response frequency rank) from each list,
following the same general procedure as described above (and similar to S. M. Smith et al.,
2000). In Experiment 1 of DeSoto and Roediger (2014), we used 12 lists containing 20 items
each, meaning that each subject studied 120 items total (10 odd or 10 even items from each of
the 12 categories). After a short distractor task, subjects took a recognition test over 360 items:
the 120 targets, 120 related lures (the even items if subjects studied the odds, and vice versa), and
120 unrelated lures from a number of other categories. Subjects made old/new recognition
decisions and rated their confidence on a 0-100 scale.
Our general findings were consistent with our earlier paper (Roediger & DeSoto, 2014a): False
alarms to items from studied categories were common. Because we could calculate hit and false
alarm probabilities for each response frequency position (1-20), unlike in the previous
experiments, we were able to examine the relationship between response frequency and hit and
false alarm rates. We discovered that there was not much effect of response frequency on hit rate,
but there was a striking influence of response frequency on the false alarm rate: Subjects were

28
much more likely to commit false alarms to items of higher response frequency than lower
response frequency, as confirmed by a strong negative correlation between the two variables (r =
-.90).
The confidence data showed a similar pattern: Subjects were more confident in their false alarms
to higher response frequency category members than in their false alarms to lower ones.
Additionally, when subjects committed a false alarm to a related lure, they rated it with higher
confidence than they did when they correctly rejected a related lure. These findings, taken
together, depict a double jeopardy situation for the related lures: Not only were subjects more
likely to commit false alarms to higher response frequency items, but they also did so with
higher confidence. Using the terminology of Brewer and Koriat, these high response frequency
items were deceptive, and also consensually wrong (at least in terms of confidence, if not false
alarm proportion).
We also calculated confidence-accuracy correlations in a number of different ways, and like the
results to the earlier experiments (Roediger & DeSoto, 2014a), a modest positive confidence-
accuracy correlation for all items hid two different underlying correlations, illustrated by Figure
1.3. The relation between confidence and accuracy for targets was strongly positive, whereas the
relation between confidence and accuracy for related lures was, according to one type of
analysis, negative. These findings replicated our earlier results and supported the idea that when
similar, related, or deceptive items are analyzed separately, confidence-accuracy dissociations
emerge.

29
Figure 1.3: Between-events confidence-accuracy correlations for the same 240 category items when they were studied (targets; top panel) and nonstudied (related lures; bottom panel) in Experiment 1 of DeSoto and Roediger (2014). Each point represents an individual item.
1.3.4 Summarizing the Confidence-Accuracy Relation
The previous discussion and examples illustrate that confidence is, in general (i.e., across all
items), a reasonably valid predictor of accuracy. Still, confidence is imperfect when it comes to
certain cases where inferences are drawn, items seem deceptively fluent, or similarity problems
arise (see Roediger & DeSoto, 2014c). We offered an explanation of the imperfect relation
between confidence and accuracy when we wrote (DeSoto & Roediger, 2014):
.00
.50
1.00
.50
1.00
0 25 50 75 100
Acc
urac
y
Confidence
Related Lures Targets
r = .61
r = -.26

30
Confidence-accuracy inversions will occur when information cued by lures on a recognition test overlaps considerably with the information about events stored in memory … matching is indicative of a correct retrieval, so people rely on the degree of match as indication of both correctness and confidence. False memories arise in part when lures resemble target events either perceptually or conceptually, and thus the match between cue and trace information signals that the event has been experienced previously when it has not. (p. 786)
In sum, confidence is a generally valid indicator of accuracy in many situations, but in certain
conditions when similarity between studied items and lures is high (i.e., when the studied item-
lure overlap is great), high confidence false alarms can occur. Is there a measure of memory
monitoring that is less susceptible to these effects of similarity? The next section discusses a
candidate for consideration.
1.4 The Remember/Know/Guess Judgment as an Indicator of Recognition Accuracy
Taken together, the results of Koriat (2012), Brewer and Sampaio (2012), DeSoto and Roediger
(2014), and related studies establish that the confidence-accuracy correlation is positive when a
recognition test contains nondeceptive or consensually correct items, or when an analysis is
conducted on a type of nondeceptive item. Such materials may be straightforward sentences,
easy general knowledge questions, or unrelated (or otherwise nondeceptive) word lists. Likewise,
the confidence-accuracy correlation is negative when the test (or analysis) is over deceptive or
consensually wrong items, such as deceptive sentences, misleading general knowledge questions,
or highly similar lures. Tests or analyses conducted over items that do not have a consensual
response or over deceptive and nondeceptive items mixed together results in a weak or null
confidence-accuracy correlation.
Unfortunately for the subject participating in an experiment, or the witness selecting a suspect

31
from a police lineup, it is difficult to discern the deceptiveness of an item on a test or the overall
composition of a test list. Without knowing this information, then, it is difficult or even
impossible for a rememberer to know whether confidence is likely to be valid. Therefore, it is of
theoretical and applied interest to examine other ways through which subjects might determine
whether they should trust their confidence in a particular memory – or, in a sense, trust the
persuasive yet subjective experience of a perceptual or conceptual match.
We (DeSoto & Roediger, 2014) believe that this match between studied items and items on a test
gives rise to confidence ratings. Because confidence ratings are reported using a continuous
numerical scale, they can be considered to be a quantitative report of the strength of evidence (or
degree of match) experienced during recognition. Importantly, however, memories differ in ways
that are not only quantitative but qualitative, too. This difference is a core premise of dual-
process theories of memory (Jacoby, 1991; Tulving, 1985) and other aspects of cognition (e.g.,
Kahneman, 2003; Sloman, 1996). According to dual-process memory theorists, remembering can
be supported by familiarity, a bottom-up process stemming from perceptual or conceptual
fluency, or by recollection, a top-down process requiring the use of cognitive control and
indicating retrieval of contextual or episodic detail (see Yonelinas, 2002, for a review, and
Craver, Kwan, Steindam, & Rosenbaum, 2014, for a recent neuropsychological perspective).
These two processes are assumed to operate independently of one another.
Confidence ratings are limiting, in this respect, because they do not reflect the separate
contributions of recollection and familiarity experienced by the rememberer. If subjects have
insight into whether they are remembering based on recollection or familiarity, perhaps they can
judge the accuracy of their memories more effectively.

32
Experiment 3 of my master’s thesis (DeSoto, 2011) offered a hint that subjects can make use of
qualitative bases of memory (i.e., recollection and familiarity) when responding to deceptive
materials. In this experiment, subjects were presented with study or study-test repetitions of to-
be-learned category items. When subjects studied items, took a recognition test over them, and
then studied them again, confidence-accuracy correlations were higher on a final test as
compared to when subjects only studied the material once or twice. The second recognition test
repetition was assumed to increase the amount of episodic information and source detail
available to subjects at test (that is, it was assumed to increase recollection; see Benjamin, 2001).
Additionally, the test repetition was also assumed to orient subjects to the composition of the test
and deceptive quality of some lure items.
Improved memory monitoring after the second test, as evidenced by the improved confidence-
accuracy correlations, suggested that an increase in recollective information available to subjects
in the study-test repetition group reduced errors for items that were deceptive for subjects in
other groups. As mentioned, however, this evidence was indirect; direct investigation of the
qualitative nature of remembering requires the use of qualitative measures of memory
monitoring instead of, or in addition to, quantitative measures (i.e., confidence ratings).
1.4.1 The Remember/Know/Guess Procedure
A measure of metacognitive monitoring that describes the qualitative nature of remembering –
that is, one that describes contributions of recollection and familiarity to memory – was first
proposed (although for a slightly different purpose) by Tulving (1985) and remains popular
today: the remember/know procedure (see also Rajaram, 1993) and its variant, the
remember/know/guess procedure (e.g., Gardiner, 1988; Gardiner & Java, 1990; Gardiner,

33
Ramponi, & Richardson-Klavehn, 1998). In its most common version, subjects are asked to
make a memory monitoring judgment each time they recognize an item on a recognition test
(although the remember/know procedure can be used with other kinds of tests as well; e.g.,
McDermott, 2006; Mickes, Seale-Carlisle, & Wixted, 2013; Tulving, 1985). Subjects are
instructed that if they can remember the episodic and contextual details of the moment a
recognized item was presented, they should respond remember; otherwise, if the memory
retrieved provides merely a general sense that the item was studied, they should respond know.
Subjects respond guess when they are just guessing that an item is old. As initially conceived,
remember/know judgments serve as an index of whether memories are episodic or semantic in
nature, respectively (see Tulving, 1972); a more modern view, however, is that these judgments
relate to multiple memory processes (e.g., Jacoby, 1991; Yonelinas, 2002). Specifically,
remember judgments are thought to indicate the contribution of recollection to the recognition
response, whereas know judgments signify familiarity (or perceptual or conceptual fluency) in
the absence of recollection. (For an excellent review of dual-process theories, see the recent book
edited by Lindsay, Kelley, Yonelinas, & Roediger, 2014, especially chapters by Dobbins, 2014,
and Yonelinas, Goodrich, & Borders, 2014.)
Following from these ideas, it is of interest to examine the degree to which remembering,
knowing, and guessing are associated with the likelihood that a memory decision is correct.
Similarly, it is also useful to investigate the interaction between recognition memory, confidence,
and remembering, knowing, and guessing. In the case that items that are remembered are, on
average, more likely to be accurate than items that are known, remembering can be taken as
additional evidence of truth, and can be weighted as such. Moreover, if confidence for items that
are remembered is more predictive of accuracy than confidence for items that are known,

34
someone who has subjective experience of remembering and is confident in his or her decision
should be more comfortable trusting his or her confidence than someone who only has an
experience of knowing. It is possible that if an individual can take into account both quantitative
and qualitative variables when making a recognition decision – both confidence and subjective
sense of remembering – memory monitoring could be improved.
Very few researchers have collected confidence ratings and remember/know/guess judgments in
the same experiment, however, so the relationship between the trio of memory accuracy,
confidence, and remembering, knowing, and guessing is underexplored in the literature (although
see Dobbins et al., 1998; Rotello & Zeng, 2008; Wixted & Mickes, 2010). The reason for this is
that the general assumption historically has been that confidence and remember/know judgments
measure the same construct (i.e., reflect two points on a continuum; a weak trace strength
hypothesis; Gardiner & Java, 1990), so there is no reason to collect both measures (but see
Rajaram, 1993, for an early rebuttal). Work by Wixted, Mickes, and colleagues (Ingram, Mickes,
& Wixted, 2012; Mickes et al., 2013; Wixted & Mickes, 2010), however, provides recent
evidence that confidence and remember/know/guess judgments are dissociable, meaning that
remember and know judgments can both be made with either high or low confidence. The
implication is that both confidence and remember/know/guess judgments bear on recognition
accuracy.
1.4.2 The Continuous Dual-Process Model of Remember/Know Judgments
The continuous dual-process model of signal detection, proposed by Wixted and Mickes in 2010,
is one recent attempt to synthesize remember/know/guess judgments with confidence ratings.
According to this model, the strength of evidence a subject experiences when remembering

35
reflects a combination of both recollection (i.e., remembering) and familiarity (knowing). When
this combination produces a high strength of evidence, the memory is likely to be true (i.e., is
likely to have occurred), but when the combination produces little strength of evidence, the
memory is probably false (i.e., nonexperienced). This combination of recollection and familiarity
corresponds to, and is indexed by, the confidence ratings provided by a rememberer, such that
high confidence is more likely to be associated with true memories, whereas low confidence is
not. Put differently, old/new recognition is supported by a combination of recollection and
familiarity, and confidence ratings are theorized to capture this combination.
When a subject is asked to make a remember/know/guess judgment, however, he or she must
untangle the recollection and familiarity experienced and assess each separately. First, the
amount of recollection experienced is polled. According to the continuous dual-process model,
recollection is assumed to be continuous, which means that all memories contain varying degrees
of recollection (see also Slotnick, Jeye, & Dodson, 2014). This stance contrasts with other
current theories of signal detection (e.g., Yonelinas, 2002), which establish that recollection is
dichotomous (e.g., all-or-none). Thus, in order to assess recollection, the rememberer must
compare the strength of recollection experienced to an internal decision criterion. If the strength
of recollection exceeds this criterion, a remember response is provided. If the strength of
recollection does not exceed the criterion, the rememberer next compares the strength of
familiarity experienced to a second internal criterion. Familiarity is also assumed to be
continuous (as it is in most models of signal detection). If familiarity exceeds this criterion, a
know response is made. If not, a guess response is provided (see Figure 4 of Wixted & Mickes,
2010, p. 1033, for a helpful illustration, which is reproduced as Figure 1.4 here).

36
Figure 1.4: A depiction of the Wixted and Mickes (2010) continuous dual-process model. Reprinted with permission from Wixted, J. T., & Mickes, L. (2010). A continuous dual-process model of remember/know judgments, Psychological Review, 117, 1025-1054. Washington, DC: American Psychological Association.
The basics of this model make straightforward predictions regarding the relationship between
confidence and old/new recognition memory performance. Namely, old/new recognition
memory is supported by a combination of remembering and knowing. Because confidence
ratings index the recollection-familiarity combination, old/new recognition accuracy should thus

37
be correlated with confidence ratings, regardless of the degree to which remembering or knowing
are influencing the confidence rating. On a test where episodic or source information is required
for successful performance, however, such as a source memory test, only remembering should
indicate accuracy, and confidence should play a reduced role. A simplified illustration of these
predictions is found in Figure 1.5.
Quantitative Strength of Evidence Low Confidence High Confidence
Qua
lity
of E
vide
nce Re
mem
ber
Low old/new accuracy High source accuracy
High old/new accuracy High source accuracy
Kno
w
Low old/new accuracy Low source accuracy
High old/new accuracy Low source accuracy
Gue
ss
Low old/new accuracy Low source accuracy
Figure 1.5: General predictions provided by the continuous dual-process model.
To test the assumptions of the continuous dual-process model, Wixted and Mickes (2010)
conducted a study in which subjects studied 128 unrelated words (from a pool of 256) that were
presented at the top or bottom of the screen and in red or blue font. Following study, subjects
took a test over the 128 targets and 128 lures. After making old/new recognition decisions,
subjects rated their confidence and were asked to make remember/know/guess judgments for all
items called “old.” After the remember/know/guess judgment, subjects indicated the screen
position and presentation color of words thought to be old.

38
Wixted and Mickes (2010) found that confidence was related to old/new recognition accuracy
for both remember and know judgments. Figure 1.6 summarizes the general pattern of findings
(showing data from Ingram et al., 2012, but the overall pattern was similar in this study).
Responses rated with higher confidence were more accurate, meaning that importantly, high
confidence know responses were more likely to be accurate than lower confidence remember
responses (see the filled points in panels A, B, and C). In contrast, remember responses predicted
greater source memory performance than knows regardless of level of confidence (mostly seen in
panel A), evidencing that remembering is a more important predictor of source accuracy than
confidence. These results were taken as support that confidence ratings and
remember/know/guess judgments index separate aspects of memory – strength and content,
respectively.

39
Figure 1.6: The critical results of Ingram et al. (2012). Reprinted with permission from Ingram, K. M., Mickes, L., & Wixted, J. T. (2012). Recollection can be weak and familiarity can be strong. Journal of Experimental Psychology: Learning, Memory, and Cognition, 38, 325-339. Washington, DC: American Psychological Association.
In a similar study, Ingram et al. (2012) also assessed the predictions of the continuous dual-
process model. In their Experiment 1, subjects studied 128 unrelated words, which were
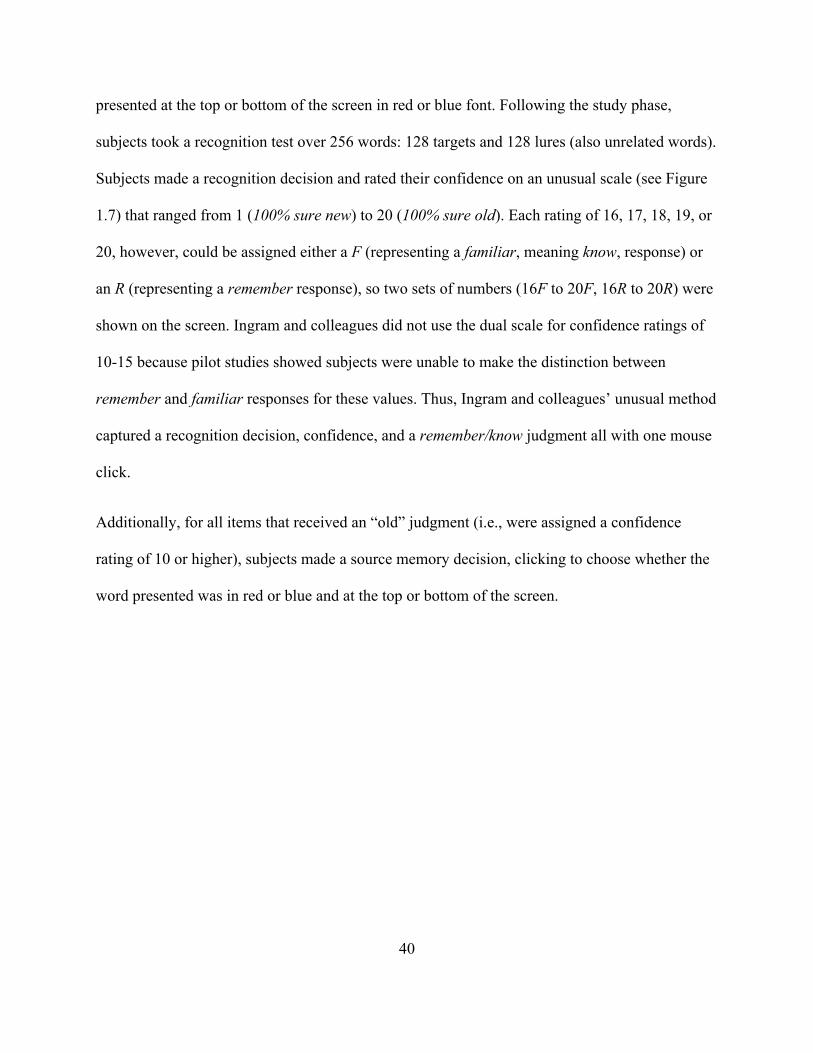
40
presented at the top or bottom of the screen in red or blue font. Following the study phase,
subjects took a recognition test over 256 words: 128 targets and 128 lures (also unrelated words).
Subjects made a recognition decision and rated their confidence on an unusual scale (see Figure
1.7) that ranged from 1 (100% sure new) to 20 (100% sure old). Each rating of 16, 17, 18, 19, or
20, however, could be assigned either a F (representing a familiar, meaning know, response) or
an R (representing a remember response), so two sets of numbers (16F to 20F, 16R to 20R) were
shown on the screen. Ingram and colleagues did not use the dual scale for confidence ratings of
10-15 because pilot studies showed subjects were unable to make the distinction between
remember and familiar responses for these values. Thus, Ingram and colleagues’ unusual method
captured a recognition decision, confidence, and a remember/know judgment all with one mouse
click.
Additionally, for all items that received an “old” judgment (i.e., were assigned a confidence
rating of 10 or higher), subjects made a source memory decision, clicking to choose whether the
word presented was in red or blue and at the top or bottom of the screen.

41
Figure 1.7: The response scale used by Ingram et al. (2012). Subjects made confidence ratings and remember/familiar judgments for each item at the same time.
Ingram and colleagues (2012) confirmed the predictions made by the continuous dual-process
model. First, they found that on average, items that received an R response were more likely to
be higher in confidence and accuracy (accuracy = .93, confidence = 19.2) than items that
received an F response (accuracy = .80, confidence = 18.5). This is a finding common to most
studies. When confidence was controlled for by only examining maximum-confidence responses,
however, old/new recognition accuracy was the same; in other words, subjects who responded
with 20 confidence were equally likely to be correct regardless of whether a 20R (accuracy =
.97) or 20F (accuracy = .95) was chosen (although perhaps a ceiling effect was in play here; see
Figure 1.6, panels A and B). Source memory, however, was significantly greater for 20R
responses (source accuracy = .82) than 20F (source accuracy = .58) responses (with chance =
.50; see Figure 1.6, panels A and B). In a critical test of the continuous dual-process model,
lower confidence R responses showed greater source accuracy than the maximum confidence K

42
responses (see Figure 1.6, panel A). Thus, these findings favor the continuous dual-process
model and also contradict the notion of a single dimension (with low confidence and know
responses on one end and high confidence and remember responses on the other).
In conclusion, Wixted and Mickes (2010) and Ingram et al. (2012) showed the value of
collecting confidence ratings and remember/know/guess judgments in the same procedure. The
continuous dual-process model they proposed offers a potential theoretical foundation for the
investigation of qualitative and quantitative indicators of recognition accuracy. One potential
limitation of the research conducted on the continuous dual-process model thus far, however, is
that the studies have been conducted using only unrelated word lists, meaning that they lack the
“deliberate inclusion of nonrepresentative items” recommended by Koriat (2008, p. 954). Would
the results of Wixted, Mickes, Ingram, and colleagues generalize beyond procedures using
unrelated words? As stated earlier, the theoretical and practical implications of deceptive items
are also important. It is unclear, and critical, whether the continuous dual-process model
accurately describes the relationship between confidence, remember/know/guess, and accuracy
when factors like similarity are at play, as they are in the DeSoto and Roediger (2014)
categorized list procedure. Would using this procedure lead to similar results, even for deceptive
materials?
To address these concerns, I conducted a series of four experiments with the overarching goals
of: (1) bridging a connection between confidence-accuracy studies using deceptive and
nondeceptive materials with the continuous dual-process model, (2) assessing confidence ratings
and remember/know/guess judgments, as well as the combination of these two ratings, as
indicators of recognition accuracy, and (3) evaluating these findings in light of the continuous

43
dual-process model. Achieving these goals first required adapting the DeSoto and Roediger
(2014) procedure to collect remember/know/guess judgments, which was necessary for further
experiments.
Chapter 2: Experiment 1
In the DeSoto and Roediger (2014) paper, we characterized the patterns of confidence that arise
when subjects study category items of varying response frequency and are tested on targets and
lures that also vary in response frequency. I designed Experiment 1 of this dissertation to be a
companion study to the DeSoto and Roediger experiments, investigating the qualitative nature of
memories arising in the procedure (similar to the difference between Experiment 1 and
Experiment 2 of Roediger & McDermott, 1995). To that end, in this experiment, I collected
remember/know/guess judgments instead of confidence ratings; the eventual goal was to
combine confidence ratings and remember/know/guess judgments into the same procedure. In
Experiment 1, I also investigated the effects of presentation modality (audio vs. visual) on test
performance, as explained below.
Thus, Experiment 1 was aimed at answering answer three questions: (1) Was there an effect of
presentation modality on responding (and false alarm proportion, specifically)? (2) What were
the rates of remembering, knowing, and guessing in the experiment, and how did these differ as a
function of response frequency? (3) What is the relation between remember/know/guess and
accuracy in the categorized list procedure?
In Experiment 1, I examined whether false alarms to category items are more or less common
when the items are read versus heard during the study phase (i.e., presented via visual or auditory

44
modalities). Research using the DRM procedure has shown that when associative lists are heard
at study, more false memories occur than when they are read at study, assuming the test is a
visual one (see Gallo, McDermott, Percer, & Roediger, 2001; Kellogg, 2001; Pierce, Gallo,
Weiss, & Schacter, 2005; R. E. Smith & Hunt, 1998). Little research has investigated the effects
of presentation modality on false memories for categorized lists, however.
To investigate this issue, I introduced a manipulation in which subjects were presented with
categorized items via audio presentation (over headphones), as in previous experiments (e.g.,
DeSoto & Roediger, 2014; Roediger & DeSoto, 2014a), or visually (on a computer screen). In
studies using the DRM procedure, it is assumed that false memories are reduced in visual study
conditions because subjects are better at metacognitive monitoring following visual study than
audio study (e.g., Gallo et al., 1998), and that subjects “use the lack of visual details to reject
critical lures only when these lures were presented visually at test” (p. 351). There was no reason
a priori to assume that the circumstances would be any different with categorized lists as
compared to associative lists. Given the literature, then, I hypothesized that false alarms would
occur more frequently when words were presented auditorily rather than visually.
Aside from the theoretical purpose of this manipulation, a practical aim of testing modality
effects was to determine whether the categorized list procedure was equally viable with both
auditory and visual presentation. Testing source memory, which I did in Experiments 3 and 4,
would be more straightforward if I could use a visual study phase instead of an auditory study
phase.
Experiment 1 was also aimed at investigating the rates of remembering, knowing, and guessing
and the relationship between remember/know/guess judgments and recognition accuracy.

45
Research by Dewhurst (2001), described earlier, informed my expectations of the patterns of
remembering, knowing, and guessing that would occur. Dewhurst, in his second experiment, also
had subjects study category items of varying response frequency. Following study, subjects took
a recognition test over targets and lures that were either high in response frequency, low in
response frequency, or unrelated to any studied categories. Dewhurst found that category items
produced both correct and false recognition. Targets generally received remember responses
(around 47% of the time), whereas lures received a mixture of remember, know, and guess
responses (about 12% of lures were assigned each judgment).
Dewhurst (2001) examined remember/know/guess patterns as a function of response frequency
and found that subjects made more correct remember responses (i.e., remember hits) to low
frequency items than high frequency items, and more correct know responses to high frequency
items than low frequency items. On the other hand, both incorrect remember and know responses
(i.e., false alarms) were more common to high frequency lures than low frequency lures. These
findings are reproduced in Table 2.1.
Dewhurst theorized that these results emerged because subjects covertly generated associates to
studied category members at encoding and committed source memory errors on the recognition
test, misidentifying items generated during encoding as items that were actually studied.
46
Table 2.1: Response rates in Dewhurst’s (2001) Experiment 2.
Item Type Total “Old” Remember Know Guess
High Frequency Targets .70 .44 .17 .08
Low Frequency Targets .66 .51 .11 .04
High Frequency Lures .36 .10 .14 .13
Low Frequency Lures .12 .01 .07 .03
Unrelated Lures .05 .00 .03 .02
Although Dewhurst (2001) explored remember/know/guess rates for category items, the
procedure he used did not permit him to examine response proportions over the wide range of
response frequency values in the way that S. M. Smith et al. (2000) did (or as we did in DeSoto
& Roediger, 2014). By applying remember/know/guess judgments to the DeSoto and Roediger
(2014) procedure, I attempted to replicate Dewhurst (2001) with a wider range of response
frequency values (i.e., items 1-20 from the norms).
2.1 Method
In Experiment 1, subjects studied items of varying response frequency taken from semantic
categories. Half of subjects heard the words read over headphones, whereas the other half of
subjects saw the words on a computer screen. Following study, subjects took a recognition test
on three types of items: (1) studied items, (2) nonstudied items from studied categories, and (3)
nonstudied items from nonstudied categories. For each item on the recognition test, subjects
decided whether the item was old (i.e., studied) or new (i.e., nonstudied). Following each
recognition decision of “old,” subjects made a remember/know/guess judgment for that item.
47
2.1.1 Subjects
Sixty-four subjects from the Washington University in St. Louis psychology pool participated,
including 23 men and 41 women (mean age = 19.45, SD = 1.55, min age = 18, max = 23).
Subjects received $10 or credit toward a psychology course requirement in exchange for their
participation. I determined sample size before collecting data using recent similar studies as a
guide. The institutional review board at Washington University in St. Louis approved all of the
experiments reported in this dissertation, and all subjects were treated according to the American
Psychological Association’s ethical guidelines.
2.1.2 Materials
I used the stimuli from the DeSoto and Roediger (2014) paper, which are presented in Appendix
A: 12 lists of 20 categorized words, ordered by response frequency, and an additional 120 items
taken from 12 other categories.
For counterbalancing purposes, from these 12 lists I constructed two sets of items. One set
contained the items of even-numbered response frequency position from the first six categorized
lists and the items in odd-numbered positions from the second six categorized lists. The second
set contained the alternate items: the odd items from the first six categorized lists and the even
items from the second six. Thus, each set contained every other item, in terms of response
frequency, from each original category.
All experiments in the dissertation were programmed in Adobe Flash (Weinstein, 2012).
2.1.3 Design and Procedure
The experiment consisted of three phases: (1) study, (2) distractor, and (3) recognition test.
48
Subjects were assigned randomly to one of two counterbalancing groups. Subjects in the first
counterbalancing group were assigned to study the items from the first item set, while subjects in
the second counterbalancing group studied as targets the items from the second item set.
To investigate effects of presentation modality on recall proportions, subjects were assigned to
one of two study groups. In the audio presentation group, 36 subjects listened over headphones
to a recording of a female voice reading the 12 category names and corresponding items.
Subjects heard a category name (e.g., A Bird), and after a four-second pause heard the
corresponding 10 items from that category, one item presented every two seconds. The 36
subjects in the visual presentation group saw the words on the computer screen instead: the
category name for four seconds, followed by one item per two seconds with a 500 millisecond
interstimulus interval – a blank screen – between presentations.
In both groups, category items were presented in random order. Once all items from a category
were presented, the procedure was repeated with another category, chosen randomly from those
remaining, until all categories had been presented. Data collection for the audio presentation
subjects was completed before data collection for the visual presentation subjects.
After the study phase, subjects completed a five-minute distractor task intended to eliminate
short-term memory effects. In this task, subjects were asked to recall as many United States
presidents as possible by typing their names into a box on the computer screen (see Roediger &
DeSoto, 2014b).
Immediately following the distractor task, subjects read instructions adapted from Gardiner,
Ramponi, and Richardson-Klavehn (1998) explaining and describing how to make
remember/know/guess judgments. See Appendix B for a copy of these instructions. Subjects

49
were instructed to respond remember when they were able to call to mind something they
remembered thinking about when they heard the word, and know when nothing came to mind but
the word still seemed familiar from the study phase. Subjects were told to respond guess if they
did not remember the word and it did not seem familiar, but they still wanted to guess it was a
studied word.
After subjects read these instructions, the experimenter read aloud a script that reviewed and
reinforced the meaning of each judgment. This script is contained in Appendix B. After reading
these instructions, the experimenter asked for and answered any questions subjects had about the
procedure and distinctions between remembering, knowing, and guessing. Once no more
questions remained, subjects were permitted to proceed with the recognition test phase. The
experimenter remained in the room until the remember/know/guess instructions had been given,
but remained available throughout the remainder of the study.
In the recognition test phase, subjects took a recognition test over 360 items which were
presented one at a time and randomly ordered for each subject: 120 targets, 120 related lures, and
120 unrelated lures. The targets were the 120 studied items from the 10 categories that had been
studied by the subjects. The related lures were the 120 items from the 10 categories that had not
been studied by subjects; these items were the targets for subjects in the alternate
counterbalancing group. The 120 unrelated lures were 10 items each from 12 nonstudied
categories.
For each item on the recognition test, subjects made one or two sequential judgments: (1) an
old/new recognition decision, and, if the recognition decision was “old,” (2) a
remember/know/guess judgment. Subjects indicated with a mouse click whether they believed

50
each item to be old (i.e., studied) or new (i.e., nonstudied), and then, if their recognition decision
was “old,” made a remember/know/guess judgment with a mouse click. Subjects who made a
recognition decision of “new” did not make a remember/know/guess judgment and proceeded
immediately to the recognition decision for the next word.
All subjects were tested in testing rooms individually or in groups up to five. The experiment
took approximately 45 minutes to complete.
2.2 Results
Experiment 1 was aimed at testing effects of presentation modality, rates of remembering,
knowing, and guessing overall and as a function of response frequency, and assessing the
remember/know/guess-accuracy relationship.
2.2.1 Effects of Presentation Modality
First, I explored how presentation modality affected the way that individuals responded to items
on the test. The key issue was whether the likelihood of saying “old” to the three different item
types (targets, related lures, and unrelated lures) differed as a function of experimental group
(audio presentation vs. visual presentation). These data are contained in Table 2.2, and show that
response proportions were roughly the same across conditions.

51
Table 2.2: Proportions with which item types were called “old” in the audio and visual presentation conditions in Experiment 1. Standard errors of the mean are presented in parentheses.
Item Audio “Old” Rate Visual “Old” Rate
Targets .67 (.04) .75 (.02)
Related Lures .27 (.04) .30 (.03)
Unrelated Lures .07 (.02) .06 (.01)
To investigate differences in “old” proportions as a function of condition statistically, three
planned comparison between-subjects t-tests were conducted for each item type. These t-tests did
not detect significant differences in “old” proportion (i.e., hits) for targets, t(62) = 1.77, p =.08 –
although the effect was marginally significant – or in old proportion for related lures (i.e., false
alarm proportion), t(62) = 0.59, p = 0.56, or unrelated lures, t(62) = 0.70, p = 0.49, between
groups. The marginally significant result for targets is in a direction consistent with the modality
effect literature – perhaps subjects were slightly better at monitoring visual targets at test when
they were presented visually at study (in a sense, a transfer appropriate processing-type effect).
Overall, though, no significant differences in “old” proportion for specific item types were
detected as a function of presentation modality.
I also conducted an independent-samples t-test to examine differences in d’, a measure of
memory discrimination, between conditions. Subjects showed numerically better discrimination
between targets and all lures in the visual condition (M = 1.75) than in the audio condition (M =
1.65), but the t-test did not indicate a statistically significant difference, t(62) = 0.66, p = .51. No
differences were found between conditions in c, a measure of bias, either, t(62) = 1.18, p = .24.
Thus, in Experiment 1, audio presentation did not lead to more false alarms than visual

52
presentation. This outcome differs from the usual finding when associative lists are presented in
the two different modalities – in these cases, false alarms in the audio condition outnumber false
alarms in the visual condition. In one of the few papers comparing modality effects for
associative and categorized lists, Pierce and colleagues (2005) found more false alarms for audio
than for visual presentation in categorized lists. They used a categorized list procedure in which
only the item of highest response frequency was absent at study and present at test, unlike in this
experiment, however, where alternating items were studied and all were tested. It is possible that
the procedural differences accounts for varying outcomes in the two experiments. To explore this
possibility, I examined the false alarm proportions to the top two items in terms of output
dominance (two instead of one due to the way counterbalancing occurred) in both visual and
audio groups. False alarm proportion for the top two items appeared higher in the visual
condition (M = .40) than in the audio condition (M = .35) – a finding in the opposite direction of
the expected one – but an independent-samples t-test did not identify a statistically significant
difference, t(62) = 0.76, p = .45.
Given these findings, I combined the audio presentation group and visual presentation groups for
all subsequent analyses, and used visual presentation in Experiments 2, 3, and 4.
2.2.2 Probabilities of Remembering, Knowing, and Guessing
Next, I investigated the proportions with which targets, related lures, and unrelated lures were
called “old,” and the proportions with which remember, know, and guess judgments were
provided following “old” responses. These data are presented in Table 2.3. The table shows that
“old” decisions were most common for targets, less common for related lures, and even less
common for unrelated lures. More specifically, remember responses appeared most frequently

53
for targets, whereas the most common response was less clear for related and unrelated lures.
These results mirror the findings of Dewhurst (2001), shown in Table 2.1.
Table 2.3: Proportions of remembering, knowing, and guessing for the three different item types on the recognition test in Experiment 1. Standard errors of the mean are presented in parentheses.
Item Type Total “Old” Remember Know Guess
Targets .71 (.02) .39 (.03) .21 (.02) .11 (.01)
Related Lures .28 (.02) .04 (.01) .10 (.02) .14 (.02)
Unrelated Lures .07 (.01) .01 (.00) .03 (.01) .03 (.01) To determine statistically the differences in proportion of remembering, knowing, and guessing
to the three different item types, a 3 (item type: target, related lure, unrelated lure) x 3 (response
type: remember, know, guess) repeated-measures ANOVA was conducted on response
proportion. This ANOVA revealed a significant interaction, F(4, 252) = 58.57, p < .001, η2p =
.48. Tests of simple effects and subsequent Bonferroni-corrected post-hoc comparisons holding
item type constant detected more remembering than knowing and more knowing than guessing
for targets, but less remembering than either knowing or guessing for both related and unrelated
lures. Holding response type constant, remember and know responses were more common for
targets than related lures, and more common for related lures than unrelated lures. Guess
responses were most frequently assigned to related lures, then targets, then unrelated lures (all
significant Fs > 10.97, all significant ps < .001).
To summarize, targets received remember judgments most frequently, but lures received know
and guess judgments most frequently. Subjects were most likely to retrieve episodic and
contextual details when presented with words that had been presented. Additionally, subjects
responded “old” more regularly to targets than either type of lure.

54
The low proportion of false remembering in this procedure is of theoretical interest as it differs
considerably from proportions of false remembering for associative (i.e., DRM-type) lists.
Roediger and McDermott (1995) found that an “old” responses followed by a remember
judgment occurred around 50% of the time a critical lure was encountered; in contrast, in this
experiment, a remember response was assigned to a related lure approximately 4% of the time
(and only 1% of the time for unrelated lures). This finding suggests potential qualitative
differences in the nature of false memories evoked by categorized versus associative lists, or
perhaps different mechanisms through which these errors arise (for a discussion, see Knott,
Dewhurst, & Howe, 2012; Park, Shobe, & Kihlstrom, 2005). As Dewhurst (2001) found,
however, cases of false remembering do tend to occur to items higher in response frequency.
This is illustrated in the following section.
2.2.3 Remembering, Knowing, and Guessing and Response Frequency
Dewhurst (2001) reported proportions of remembering, knowing, and guessing for items both
high and low in frequency. The procedure used in Experiment 1 permitted investigation of
remembering, knowing, and guessing proportions across a wider and gradated range of response
frequency values than Dewhurst used. These response proportions as a function of response
frequency are shown in Figure 2.1.

55
Figure 2.1: Proportions of remembering, knowing, and guessing as a function of response frequency for correct recognition and false recognition. Best fitting linear functions (see Table 2.4) are indicated by the dotted lines.
The relationship between response proportion and response frequency were assessed with
Pearson correlations, which are shown in Table 2.4. The figure and table indicate together that
for correct recognition, remembering was more frequent for low response frequency items (i.e.,
those less frequently mentioned by subjects in norming studies) than high response frequency
items, and guessing was more common for high response frequency items than low response
frequency items. In contrast, in false recognition, subjects were more likely to respond remember
.00
.25
.00
.25
.50
1 2 3 4 5 6 7 8 9 10 11 12 13 14 15 16 17 18 19 20
Res
pons
e Pr
opor
tion
Response Frequency
Remember Know Guess
correct recognition false recognition

56
and know to items high in response frequency than low in response frequency.
Table 2.4: Correlations between response frequency of items and response proportion for both correct and false recognition. A negative correlation indicates that the response type was greater for high response frequency items than low response frequency items. *p < .01.
Correct Recognition False Recognition
Remember -.91* -.88*
Know -.20* -.71*
Guess -.70* -.43* The variance in response rate as a function of response frequency is low here (e.g., response
frequency 1 remember hit proportion = .35, response frequency 20 remember hit proportion =
.46), which inflates the magnitude of the correlations, but response frequency is nevertheless a
reasonable predictor of that variance.
Again, the findings reported here are consistent with Dewhurst’s (2001) observations. Both
Dewhurst’s study and Experiment 1 showed greater correct remembering for lower frequency
than higher frequency words, an effect that is similar to the influence of (printed) word frequency
on recognition memory (e.g., Balota & Neely, 1980). Similarly, both Dewhurst’s study and
Experiment 1 showed greater false remembering for higher frequency than lower frequency
words. Perhaps, as Dewhurst theorized, category associates are generated at encoding, and words
of higher response frequency are more likely to be generated than words of lower response
frequency and falsely recognized at the time of test (an extended discussion of this theory is
provided in DeSoto, 2011).
Another explanation is that unique and unusual items — those lower in response frequency —
may more readily engender item-level processing that keeps responding accurate; however,

57
processes that lead to false alarms may be more likely for those items that are more frequent,
dominant, or accessible within the category (see McDaniel & Bugg, 2008, for a framework that
may explain these data).
These data can be contrasted with data from a pilot study we conducted in which 40 subjects
studied category items and then took a category cued recall test and provided confidence ratings.
The results are depicted in Figure 2.2. This figure shows that both correct recalls and intrusions
were more frequent for items of higher response frequency than those of lower response
frequency, which is a different pattern than the one that emerges for old/new recognition.

58
Figure 2.2: Number of correctly recalled words and intrusions in an unpublished study using a cued recall version of the categorized list procedure.
2.2.4 Old/New Recognition Accuracy
I turn next to average accuracy for remember, know, and guess judgments to assess the
remember/know/guess judgment’s validity in monitoring memory accuracy. Figure 2.3 shows
accuracy for these three judgment types – that is, the accuracy for “old” recognition decisions
assigned one of these three judgments (e.g., the number of correct remember responses divided
by the total number of remember responses). This is a type of output-bound scoring (Koriat &
Goldsmith, 1996), showing, for instance, the proportion of correct remember responses
0
50
100
150
200
1 2 3 4 5 6 7 8 9 10 11 12 13 14 15 16 17 18 19 20
Num
ber o
f Res
pons
es
Response Frequency
Correct Recall Intrusions

59
(remember hits) out of all the remember responses provided.
As the figure shows, the accuracy for remembered responses was greater than the accuracy for
know responses, and the accuracy for knows was greater than the accuracy for guesses. These
observations were confirmed by a within-subjects ANOVA, F(2, 122) = 182.025, p < .001, η2p =
.75, and subsequent pairwise comparisons (all ps < .001).
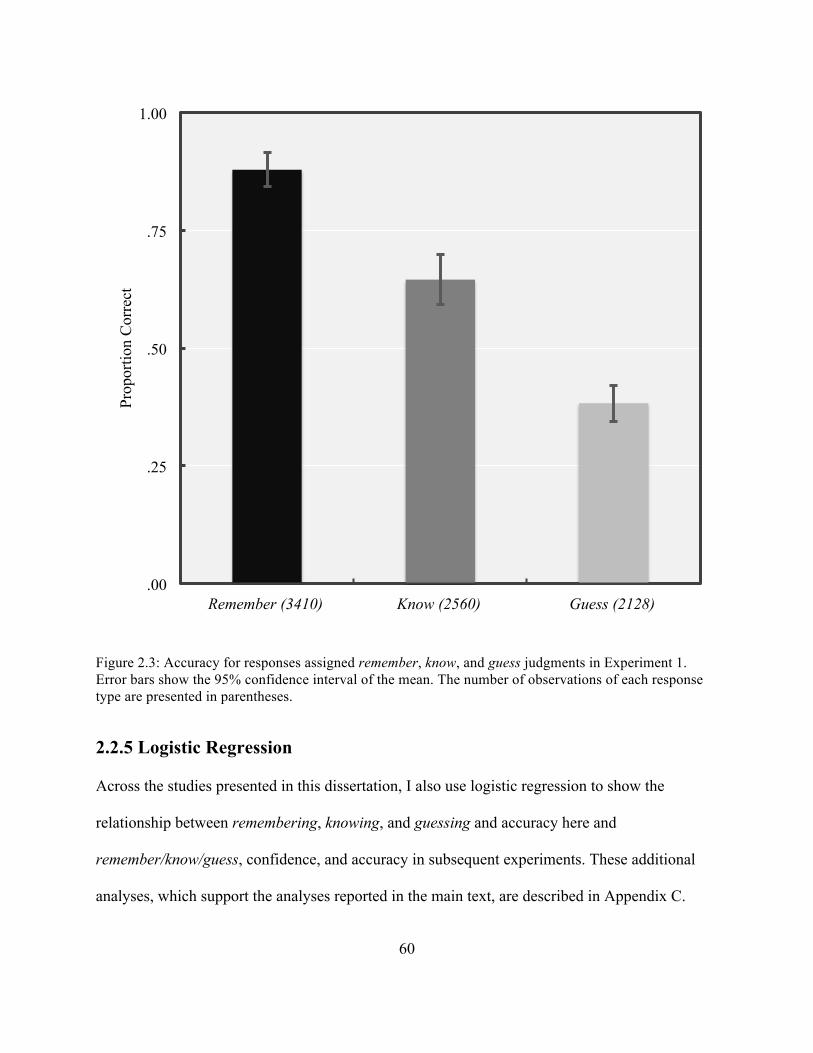
60
Figure 2.3: Accuracy for responses assigned remember, know, and guess judgments in Experiment 1. Error bars show the 95% confidence interval of the mean. The number of observations of each response type are presented in parentheses.
2.2.5 Logistic Regression
Across the studies presented in this dissertation, I also use logistic regression to show the
relationship between remembering, knowing, and guessing and accuracy here and
remember/know/guess, confidence, and accuracy in subsequent experiments. These additional
analyses, which support the analyses reported in the main text, are described in Appendix C.
.00
.25
.50
.75
1.00
Remember (3410) Know (2560) Guess (2128)
Prop
ortio
n C
orre
ct
61
2.3 Discussion
Experiment 1 was aimed at investigating effects of presentation modality and also the rates of
remember/know/guess judgments and how these judgments related to recognition accuracy. I
found that there was no difference in hit or false alarm rates when words were presented visually
versus when they were presented auditorily. My results also replicated the findings of Dewhurst
(2001): False remembering in this procedure was rare, and more common for items of higher
output dominance than lower output dominance. Overall, remember responses were more
accurate than knows, and knows more accurate than guesses.
Experiment 1 did not demonstrate effects of presentation modality on responding. As stated
earlier, for categorized lists, modality effects have been found using experiments where only the
item of highest response frequency is withheld from study and presented at test. My analyses did
not observe a modality effect for even the highest output dominance items, however. Pierce et al.
(2005) proposed that modality effects are caused by differences in monitoring processes that
occur at the time of test. It is possible that requiring subjects to make remember/know/guess
judgments standardized (or even altered) the way subjects in both groups made recognition
decisions, thereby eliminating the modality effect.
Nevertheless, these results are surprising, especially considering that research has found that
remember/know/guess judgments tend to emphasize modality differences rather than attenuate
them. As an example, R. E. Smith, Hunt, and Gallagher (2008) presented DRM lists via auditory
and visual modalities and found that recognition performance was similar between modalities
(i.e., no modality effect appeared) when subjects did not take a recall test before the recognition
test, as occurs in some versions of modality effect experiments. Contradicting the present

62
findings, however, in a follow-up study, the researchers found that asking subjects to make
remember/know/guess judgments at test made the modality effects reappear. Likewise, Mulligan,
Besken, and Peterson (2010) had subjects study unrelated word lists in different modalities and
found that differences did not emerge on standard old/new recognition tests without
remember/know/guess judgments, but that differences did appear when remember/know/guess
judgments were required. Thus, these findings remain a theoretical puzzle.
The previous discussions of confidence ratings and remember/know/guess judgments suggest
that both reports reveal rememberers’ abilities to monitor between accurate and inaccurate
memories. Can memory monitoring be improved even further by combining the two judgments?
As others (e.g., Dobbins et al., 1998; Wixted and Mickes, 2010) have suggested, there is
theoretical utility to doing so. Wixted and Mickes wrote, “The attempt to understand memory in
terms of either strength or content is misplaced because both ideas are needed” (2010, p. 1025),
referring to confidence ratings and remember/know/guess judgments, respectively.
In sum, Experiment 1 established that remember/know/guess judgments are viable in the
categorized list procedure used by DeSoto and Roediger (2014), and that this procedure can be
implemented successfully using either an auditory or visual study phase. In Experiment 2, I take
Wixted and Mickes’ (2010) recommendation into account and combine confidence ratings and
remember/know/guess judgments into the same procedure, investigating the relationship between
both strength and content of recognition memory for category items.
Chapter 3: Experiment 2
In Experiment 2, I integrated both confidence ratings and remember/know/guess judgments into

63
the DeSoto and Roediger (2014) categorized list procedure. Doing so allowed the investigation
of the ways that confidence, remember/know/guess, and old/new recognition accuracy interact.
The central aim of this study was to investigate the relationship between confidence and
accuracy as a function of remember/know/guess judgment. I did so using two different methods:
four types of confidence-accuracy correlations (introduced by Roediger et al., 2012) and
calibration plots.
The effect that the qualitative nature of memory (i.e., remembering, knowing, or guessing) has on
the relationship between confidence and accuracy is unclear, and has not been much studied
(although see Dobbins et al., 1998; Wixted & Mickes, 2010). According to predictions from the
continuous dual-process model, items that are remembered are more likely to be higher in
strength of evidence than items that are known, and thus items that receive remember responses
on a test should be higher in confidence and accuracy than items that are known overall. Ingram
and colleagues (2012) and others have obtained this finding with unrelated words.
The continuous dual-process model predicts that when confidence is controlled for, however,
there should be no differences in the confidence-accuracy relationship for remember judgments
compared to know judgments. This is because both recollection and familiarity contribute to
old/new accuracy, and confidence ratings describe the magnitude of this contribution. Thus,
items that are responded to with higher confidence, regardless of whether they are assigned
remember or know judgments, should be more accurate. Put differently, according to the
continuous dual-process model, the remember versus know distinction is irrelevant for old/new
recognition accuracy (when confidence is controlled for; see Figure 1.5).
I also predicted that increases in confidence should be tied to increases in accuracy of similar
64
magnitude regardless of whether a memory is remembered or known. Although this is not
explicitly stated by the continuous dual-process theory, it is a reasonable expectation: Because
recollection and familiarity combine to support old/new recognition accuracy, and because this
combination is indexed by confidence ratings, confidence should correlate with accuracy
regardless of what processes feed into the strength of evidence experienced. Put a different way,
the continuous dual-process model makes the claim that recollection + familiarity = confidence =
accuracy. If this statement is true, confidence corresponds with accuracy to the same degree
regardless of the specific degrees of recollection and familiarity. (This equation changes when
source memory is tested instead of old/new recognition – for more, see Experiments 3 and 4).
To test these hypotheses, I collected both confidence ratings and remember/know/guess
judgments after recognition decisions in the categorized list procedure. In subsequent analyses, I
subdivided all “old” recognition memory decisions by whether they were accompanied by
remember, know, or guess judgments. My prediction, based off the continuous dual-process
model, was that despite higher overall accuracy for remember responses compared to know
responses, the confidence-accuracy correlation for remember responses would be no different
than the confidence-accuracy correlation for know responses. I expected guess judgments to not
show much of a relationship between confidence and accuracy, since guessing is, by definition,
guessing.
3.1 Method
In Experiment 2, I used the same design as in Experiment 1 but introduced confidence ratings
into the procedure to accompany the remember/know/guess judgments. Subjects studied different

65
category items and were tested on studied and nonstudied items. On the following recognition
test, subjects made old/new recognition decisions and then rated their confidence in their
recognition decision using a sliding scale. Following the confidence rating, subjects made
remember/know/guess judgments for items called “old.”
3.1.1 Subjects
I recruited 64 subjects from the Washington University in St. Louis psychology experiment
subject pool. There were 17 men, 46 women, and one subject who selected “other/prefer not to
respond” when asked about gender (mean age = 20.38, SD = 1.88, min age = 18, max = 28). I
determined sample size before collecting data by using the number of subjects in Experiment 1
as a guide. Subjects received $10 or credit for a psychology course requirement in exchange for
their participation.
3.1.2 Materials and Design
Materials were the same as in Experiment 1, but to shorten the experiment, two lists were
eliminated: A Four-Legged Animal and A Part of the Human Body (see Appendix A). These lists
were chosen because they produced the lowest false alarm proportions in Experiment 1. This left
a stimulus set of 200 potential targets and related lures. To maintain equivalent proportions of
related lures and unrelated lures, 20 unrelated lures were also removed from the stimulus set,
leaving 100 remaining (Appendix A shows which unrelated lures were removed).
As in Experiment 1, two between-subjects counterbalancing groups, randomly assigned, were
employed. Thirty-two subjects participated in each group. Subjects in the first group studied the
even response frequency items from half the lists and the odd response frequency items from the
other half. The second counterbalancing group studied the alternate items.
66
In Experiment 2, unlike in Experiment 1, all items were presented visually.
3.1.3 Procedure
As in Experiment 1, Experiment 2 consisted of three phases: (1) study, (2) distractor, and (3)
recognition test. In the study phase, subjects studied the 100 targets, presented in the center of
the computer screen (as in the visual presentation group in Experiment 1). The distractor task
also proceeded as it had in Experiment 1.
The recognition test included two or three sequential steps for each item: (1) recognition
decision, (2) confidence rating, and, if necessary, (3) remember/know/guess judgment. For each
item on the recognition test, subjects indicated whether they believed the item to be old or new.
Next, subjects reported how confident they were that their recognition decision was correct. A
slider appeared on the screen ranging from 0 (not at all confident) to 100 (entirely confident;
DeSoto, 2014); subjects clicked on the slider head, which had a default position of 50, and
dragged it to the desired point on the scale. They then clicked a button to submit their confidence
rating. Last, subjects who responded “old” during the recognition decision step made a
remember/know/guess judgment. Subjects who made a recognition decision of “new” did not
make a remember/know/guess judgment and proceeded immediately to the recognition decision
for the next word.
This procedure is different from the one used by Ingram et al. (2012), who collected confidence
ratings, remember/know/guess judgments, and recognition decisions with one click (Figure 1.7).
I chose to collect the judgments sequentially to keep data collection consistent with prior
categorized list procedure studies and also to avoid any unexpected consequences of using this
unusual scale.

67
Subjects were tested in groups of one to five. The experiment took less than an hour for most
subjects to complete.
3.2 Results
3.2.1 Calculating the Confidence-Accuracy Relation
Before describing the results of Experiment 2, I will outline the different ways the confidence-
accuracy relationship will be calculated throughout the three remaining dissertation experiments.
I will use two general types of analysis: confidence-accuracy correlations and calibration plots.
Four Kinds of Confidence-Accuracy Correlation
Roediger and DeSoto (2014a) and DeSoto and Roediger (2014) calculated confidence in three of
the ways discussed in a chapter by Roediger et al. (2012). We call these three methods the
between-events, between-subjects, and within-subjects confidence-accuracy correlations. The
between-events (or between-items) confidence-accuracy correlation asks the question, “Are
items that are remembered with greater confidence also more likely to be remembered
accurately?” This (often unreported) correlation is calculated by taking the average confidence
and average accuracy (i.e., hit proportion or correct rejection proportion) for each individual
item, then calculating a Pearson correlation (r) among those items.
The between-subjects correlation, on the other hand, asks, “Are subjects who are more confident
also more accurate?” This is a question more typical for the domains of metacognition and law.
This correlation is calculated by taking the average confidence and average accuracy for each
subject averaged across items and then obtaining the Pearson correlation among the subjects.
Lastly, the within-subjects confidence-accuracy correlation is what metacognitive researchers

68
often call resolution (Nelson, 1984). It measures the correspondence between confidence and
accuracy within each individual subject by asking the question, “On average, when individual
subjects are more confident on a given response, are they also more likely to be accurate?”
Instead of being calculated with a Pearson correlation, resolution is calculated with the
Goodman-Kruskal gamma (γ). These gamma correlations are averaged over subjects for
subsequent analysis (note that the use of gamma has certain disadvantages; see Benjamin &
Diaz, 2008).
One new way to calculate confidence-accuracy correlations that I will use in this dissertation, not
included in the Roediger et al. (2012) chapter, I call the within-events correlation.1 This
correlation applies the machinery of gamma correlations to individual items, instead of
individual subjects, to ask the question, “On average, when individual (or specific) items are
responded to with more confidence, are they more likely to be responded to accurately?” This is
a valuable correlation to consider because it can help identify the items that are most deceptive
(or consensually wrong) within the materials used. As I will show, these results in the aggregate
are very similar to the results of the within-subjects correlations.
Although these correlations all address similar questions about the relationship between
confidence and accuracy, and although they are likely to be interrelated, they need not agree
(although I will show that they usually do). Considering confidence-accuracy correlations in
these different ways allows a more thorough investigation of complexities involved.
1 Thanks to Jason Finley for contributing this idea.

69
Calibration Plots
Another way of showing the relation between confidence and accuracy is through the use of a
calibration plot (e.g., Lichtenstein et al., 1982). Calibration plots depict the average accuracy for
responses assigned certain ranges (or bins) of confidence ratings (e.g., showing average accuracy
for all judgments assigned a confidence rating of, say, 80-100). The calibration plots I will
present in this dissertation are obtained by combining all items for all subjects. To provide an
example of a calibration plot, as well as a comparison condition for later analyses, I reanalyzed
the data from Experiment 1 of DeSoto and Roediger (2014) and present them in a calibration plot
shown in Figure 3.1.

70
Figure 3.1: Calibration in Experiment 1 of DeSoto and Roediger (2014) as a function of item type. Error bars show the 95% confidence interval of the mean. The number of observations are presented beside each point.
This figure shows average accuracy for the three different item types used in our experiment
across different levels of confidence. Inspection of this plot confirms the story told by the
correlational data reported in the summary of this research presented earlier.
In this study, we found that for targets, when confidence was higher, so too was accuracy (i.e.,
hit proportion). On the other hand, for related lures, responses made with greater confidence
.00
.25
.50
.75
1.00
0-19 20-39 40-59 60-79 80-100
Prop
ortio
n C
orre
ct
Confidence
Targets Related Lures Unrelated Lures
491 537 1263 1230 1759
397
718 1516
1409
1240
273
362
935
808
2902

71
were less likely to be correct (i.e., more likely to receive false alarms). This pattern of over- and
under-confidence can be described as a hard-easy effect (Suantak, Bolger, & Ferrell, 1996), that
is, a likelihood to overestimate the difficulty of easy tasks and underestimate the difficulty of
hard tasks. For unrelated lures, however, the correct rejection proportion was near ceiling
regardless of the level of confidence provided. Combining across all item types, however – an
analysis that is not plotted here – confidence was only weakly associated with accuracy, with the
strongest association at the upper half of the confidence scale. Average proportion correct was
.68, .65, .66, .71, and .86 for confidence ratings of 0-19, 20-39, 40-59, 60-79, and 80-100,
respectively.
In the results to Experiment 2, I will also show calibration plots for old/new accuracy as a
function of item type, as above, but will also show calibration plots that depict accuracy by
confidence as a function of remember, know, and guess judgment.
3.2.2 Probabilities of Remembering, Knowing, and Guessing
Table 3.1 presents the probabilities with which subjects responded remember, know, and guess to
targets, related lures, and unrelated lures on the recognition test in Experiment 2, and the
confidence ratings provided with those judgments. A 3 (item type: target, related lure, unrelated
lure) x 3 (response type: remember/know/guess) repeated-measures ANOVA was conducted on
response proportion and revealed a significant interaction, F(4, 252) = 110.88, p < .001, η2p =
.64. Tests of simple main effects and subsequent Bonferroni-corrected post-hoc comparisons
holding item type constant detected more remembering than knowing and more knowing than
guessing for targets, but less remembering than either knowing or guessing for both related and
unrelated lures, on average, an identical pattern to what was shown in Experiment 1. Holding
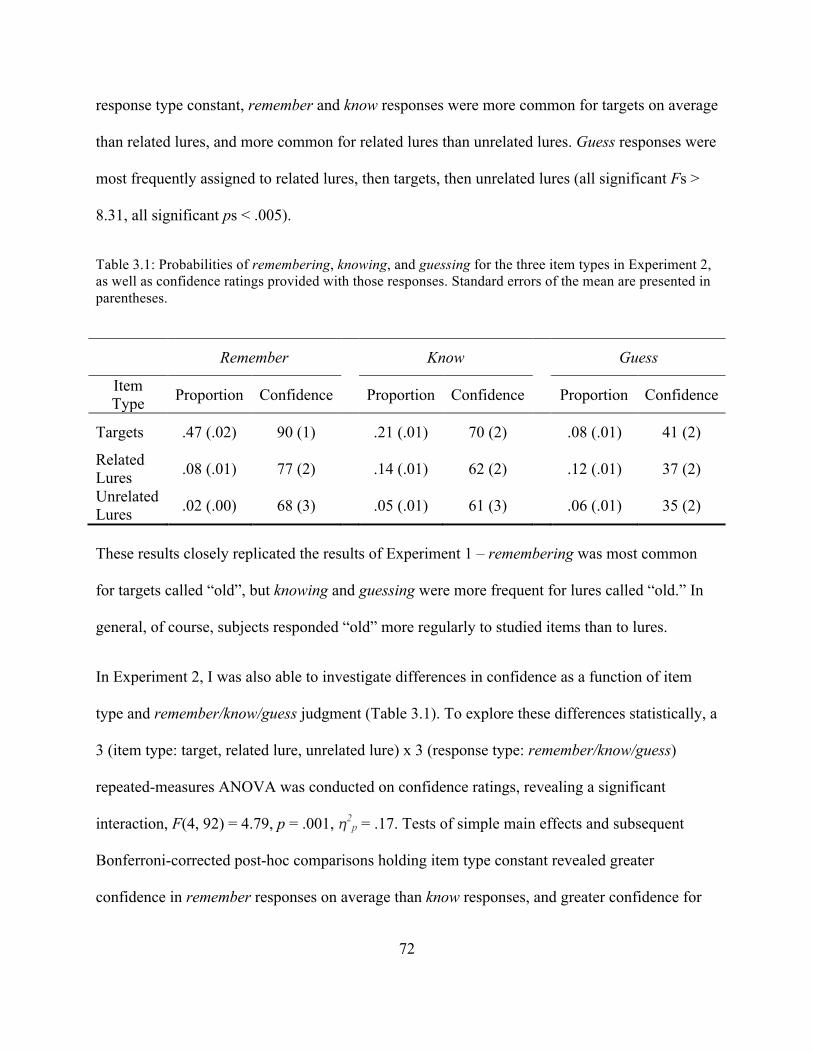
72
response type constant, remember and know responses were more common for targets on average
than related lures, and more common for related lures than unrelated lures. Guess responses were
most frequently assigned to related lures, then targets, then unrelated lures (all significant Fs >
8.31, all significant ps < .005).
Table 3.1: Probabilities of remembering, knowing, and guessing for the three item types in Experiment 2, as well as confidence ratings provided with those responses. Standard errors of the mean are presented in parentheses.
Remember Know Guess
Item Type Proportion Confidence Proportion Confidence Proportion Confidence
Targets .47 (.02) 90 (1) .21 (.01) 70 (2) .08 (.01) 41 (2)
Related Lures .08 (.01) 77 (2) .14 (.01) 62 (2) .12 (.01) 37 (2)
Unrelated Lures .02 (.00) 68 (3) .05 (.01) 61 (3) .06 (.01) 35 (2)
These results closely replicated the results of Experiment 1 – remembering was most common
for targets called “old”, but knowing and guessing were more frequent for lures called “old.” In
general, of course, subjects responded “old” more regularly to studied items than to lures.
In Experiment 2, I was also able to investigate differences in confidence as a function of item
type and remember/know/guess judgment (Table 3.1). To explore these differences statistically, a
3 (item type: target, related lure, unrelated lure) x 3 (response type: remember/know/guess)
repeated-measures ANOVA was conducted on confidence ratings, revealing a significant
interaction, F(4, 92) = 4.79, p = .001, η2p = .17. Tests of simple main effects and subsequent
Bonferroni-corrected post-hoc comparisons holding item type constant revealed greater
confidence in remember responses on average than know responses, and greater confidence for

73
knows than guesses to both targets and related lures, on average. For unrelated lures, guess
confidence was significantly lower than remember and know confidence. Holding response type
constant, both remembers and knows to targets were more confident on average than remembers
and knows to related lures, and those were more confident than remembers and knows to
unrelated lures. Meanwhile, confidence in guesses was greater for targets than for unrelated lures
(all significant Fs > 7.51, all significant ps < .002). Thus, confidence is greatest at the top left of
the table and decreases as it moves right (i.e., to know and guess) and down (i.e., to related lures
and unrelated lures). It is illustrated in Figure 3.2.

74
Figure 3.2: Confidence as a function of remember, know, and guess judgment in Experiment 2. Error bars show the 95% confidence interval of the mean.
These confidence results accord with the results provided in Table 2.3 (as well as the response
probabilities presented in the same table, roughly). The finding that confidence for “old”
responses to targets is greater than confidence for false alarms to related and unrelated lures is
consistent with our prior work (e.g., DeSoto & Roediger, 2014). Meanwhile, the observation that
remember confidence was the greatest also agrees with the continuous dual-process model and
other research (e.g., Mickes, Wais, & Wixted, 2009; Wixted & Mickes, 2010).
0
25
50
75
100
Remember Know Guess
Con
fiden
ce
Response Type
Target Related Lure Unrelated Lure

75
3.2.3 Old/New Recognition Accuracy
Calibration in Experiment 1 as a function of item type is shown in Figure 3.3. This figure depicts
the probabilities that responses to targets, related lures, and unrelated lures were correct for
different levels of confidence. As the figure shows, accuracy increased with confidence for all
item types. Comparing this result to Figure 3.1, calibration by item type in DeSoto and Roediger,
2014, Experiment 1, shows that the pattern for related lures in Experiment 2 of this dissertation is
different from what we obtained in earlier research – specifically, accuracy in responses to
related lures increased with increased in accuracy, rather than decreased. This point is curious,
and worthy of additional investigation; it is possible that the addition of remember/know/guess
judgments to the categorized list procedure caused the difference. Perhaps subjects become
additionally reliant on recollection over familiarity when making memory decisions, for instance,
or are less susceptible to tricky deceptive items when they must analyze the basis of their
decision carefully. These effects may be similar to the weak effects of providing a warning in the
DRM paradigm (e.g., McDermott & Roediger, 1998), with remember/know/guess instructions
serving to heighten subjects’ awareness of the possibility of making errors. I hope to investigate
this issue in follow-up research. In the interim, however, because related lure accuracy does not
decrease with confidence, the confidence-accuracy correlation should not be expected to be
negative for these items when these correlations are computed in the following section. Yet, the
confidence-accuracy correlation for related lures is weaker than the correlation for the other item
types, as I will show in the following section.

76
Figure 3.3: Calibration in Experiment 2 as a function of item type. Error bars show the 95% confidence interval of the mean. The number of observations are presented beside each point.
Figure 3.4 shows calibration curves as a function of remember/know/guess judgments (in
contrast to Figure 3.3, which shows calibration as a function of item type – thus, these two
figures cannot be compared directly). This figure illustrates the relationship between confidence
and accuracy as a function of whether recognition decisions were labeled remember, know, or
guess.
For each point on the calibration curve, I calculated the corresponding value in the following
.00
.25
.50
.75
1.00
0-19 20-39 40-59 60-79 80-100
Prop
ortio
n C
orre
ct
Confidence
Targets Related Lures Unrelated Lures
1110 286
1015 1342 1723
2034
466
1230 1462 1739
1503
266
668 882
3474
77
way: First, I took all recognition responses within a given range of confidence ratings. Then, I
counted the total number of correct recognition responses (i.e., hits, given that the analysis was
over remember/know/guess judgments) within that confidence bracket. Last, I divided that
number by the total number of responses (i.e., hits and false alarms). As an example, in
Experiment 2, there were 2881 times that an individual said “old,” rated confidence between 80
and 100, and assigned a remember judgment. A total of 2606 of these were accurate (hits) –
about .90 correct.

78
Figure 3.4: Calibration in Experiment 2 for responses assigned remember, know, and guess judgments. Error bars show the 95% confidence interval of the mean. The number of observations are presented beside each point.
Inspection of Figure 3.4 reveals several patterns of interest. First, confidence is associated with
accuracy for remembering and knowing, meaning that for both response types increases in
confidence are associated with increases in accuracy, especially at the higher end of the
confidence scale. Additionally, throughout the range of confidence ratings, controlling for
confidence, remember responses are more accurate than know responses, and know responses are
more accurate than guess responses. In fact, guess responses do not much differ from 33%
.00
.25
.50
.75
1.00
0-19 20-39 40-59 60-79 80-100
Prop
ortio
n C
orre
ct
Confidence
Remember Know Guess
14 98
192 482
2881
47 313
596 813
840
332
576 469 269
61

79
accuracy overall, regardless of the confidence rating assigned – they really appear to be guesses.
Put differently, the calibration data reveal two main effects – remembering is more likely to be
accurate (M = .82) than knowing (M = .52) and knowing more accurate than guessing (M = .31),
and judgments made with higher confidence (according to 20-point bins) are more likely to be
correct than those made with lower confidence, too (Ms = .49, .63, .70, .75, and .89, working up
the scale). These were independently confirmed through two within-subjects ANOVAs, one for
accuracy and one for confidence, F(2, 124) = 152.63, p < .001, η2p = .71 for accuracy and F(4,
208) = 49.161, p < .001, η2p = .49 for confidence, with subjects as the unit of analysis. In sum,
combining confidence ratings with remember/know/guess judgments provides more information
about subsequent accuracy more than when confidence or a remember/know/guess judgment is
provided alone. The high confidence remember responses (M = .90 correct) were more accurate
than high confidence knows (M = .74) or guesses (M = .39), although not many high confidence
guess responses were provided.
3.2.4 Confidence-Accuracy Correlations
We have remarked in other publications (e.g., Roediger & DeSoto, 2014c) that a potential
criticism of current work investigating the confidence-accuracy relation is that researchers
generally assess the confidence-accuracy relation in only one way. Therefore, along with
calibration curves, I also analyzed the Experiment 2 data using the three types of confidence-
accuracy correlations described by Roediger et al. (2012). As mentioned earlier, the between-
events correlation (sometimes called the between-items correlation) indexes whether items that
are responded to with greater confidence are also responded to with greater accuracy. The
between-subjects correlation describes the degree to which subjects who are more confident are

80
also more accurate. The within-subjects correlation (a measure of resolution) describes whether
judgments made with greater confidence were likelier to be accurate for individuals on average.
For the first time I also present a within-events (or within-items) correlation, which describes the
degree to which responses to individual items were more likely to be accurate when they were
made more confidently, on average. Between-subjects and between-events correlations are
computed with the Pearson r, whereas within-subjects and within-events correlations are
computed with the Goodman-Kruskal γ.
Table 3.2 contains the four correlations for each of the three different classes of item on the
recognition test. Within an item class, the correlations agree: The confidence-accuracy
correlations are strongly positive for targets, but generally weakly positive for related lures. The
correlations for unrelated lures occupy an intermediate position. This table generally replicates
our earlier findings (DeSoto & Roediger, 2014), except that the related lure correlations that
were negative in that paper are null or weakly positive here, as discussed in the prior section.
Again, it is possible that the introduction of the remember/know/guess judgment helped to
prevent against the confidence-accuracy inversion for these items.
Also note that the contents of Table 3.2 are consistent with the results displayed graphically in
Figure 3.3.
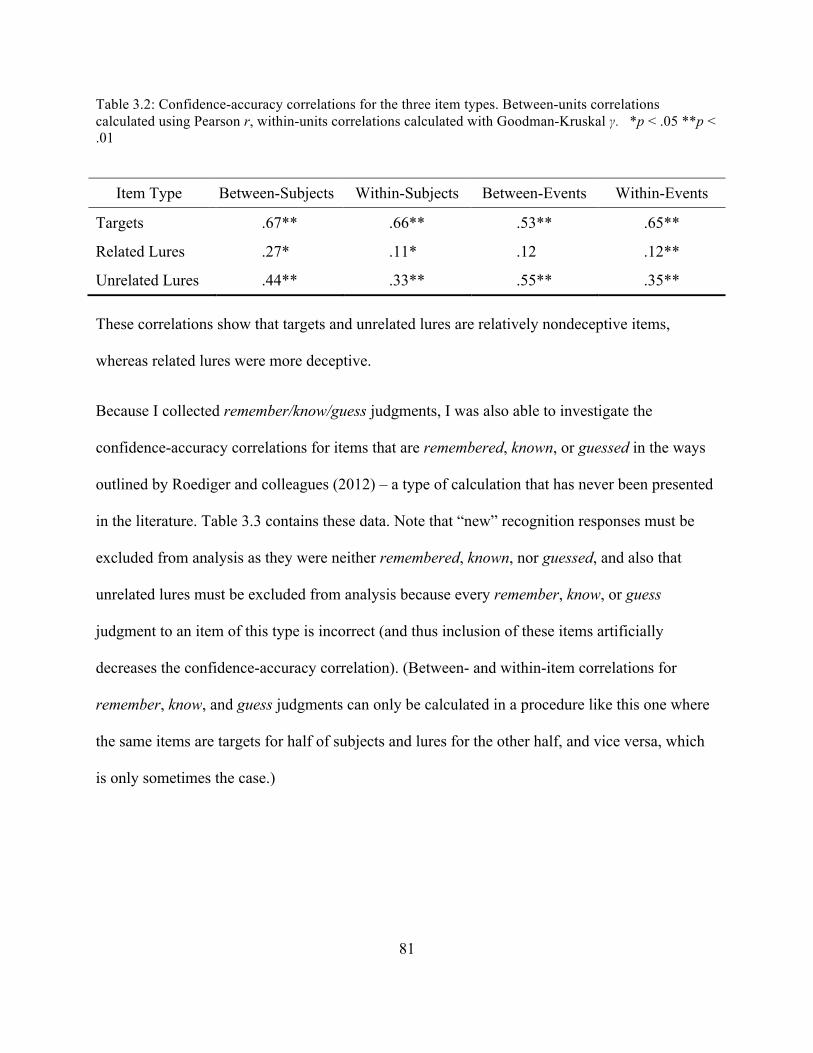
81
Table 3.2: Confidence-accuracy correlations for the three item types. Between-units correlations calculated using Pearson r, within-units correlations calculated with Goodman-Kruskal γ. *p < .05 **p < .01
Item Type Between-Subjects Within-Subjects Between-Events Within-Events
Targets .67** .66** .53** .65**
Related Lures .27** .11** .12** .12**
Unrelated Lures .44** .33** .55** .35** These correlations show that targets and unrelated lures are relatively nondeceptive items,
whereas related lures were more deceptive.
Because I collected remember/know/guess judgments, I was also able to investigate the
confidence-accuracy correlations for items that are remembered, known, or guessed in the ways
outlined by Roediger and colleagues (2012) – a type of calculation that has never been presented
in the literature. Table 3.3 contains these data. Note that “new” recognition responses must be
excluded from analysis as they were neither remembered, known, nor guessed, and also that
unrelated lures must be excluded from analysis because every remember, know, or guess
judgment to an item of this type is incorrect (and thus inclusion of these items artificially
decreases the confidence-accuracy correlation). (Between- and within-item correlations for
remember, know, and guess judgments can only be calculated in a procedure like this one where
the same items are targets for half of subjects and lures for the other half, and vice versa, which
is only sometimes the case.)

82
Table 3.3: Confidence-accuracy correlations for remembered, known, and guessed memories as a function of remember/know/guess judgment. Between-units correlations calculated using Pearson r, within-units correlations calculated with Goodman-Kruskal γ. *p < .05 **p < .01
Between-Subjects Within-Subjects Between-Events Within-Events
Remember .72** .44** .52** .57**
Know .68** .25** .47** .41**
Guess .19** .06** .06** .05** The table shows that when subjects responded with a remember or know judgment, there was a
positive association between confidence and accuracy. In contrast, when subjects were guessing,
the relationship between confidence and accuracy was nonsignificant. A critical test of the results
was to compare the correlations of remember and know responses. On one hand, Fisher r-to-z
tests failed to identify significant differences between the between-subjects (z = 0.43, p = .67)
and the between-events (z = 0.66, p = .51) confidence-accuracy correlations for remembered
versus known memories. On the other hand, though, there were significant differences between
the within-subjects (paired-samples t[51] = 2.37, p = .022) and the within-items (paired-samples
t[171] = 4.58, p < .001) confidence-accuracy correlations for remembered versus known
memories. These differences may emerge partially as a function of the sensitivity of the different
tests (i.e., Fisher r-to-z vs. paired-samples t-test). Numerically, however, all know correlations
are lower than remember correlations – a finding that will be repeated in the later studies.
As a visual illustration of the confidence-accuracy correlation as a function of remembering,
knowing, and guessing, examine Figure 3.5, which presents a scatterplot depicting one of the
four correlations analyzed – the between-events correlation (i.e., the third column of Table 3.3).
This figure, which shows average confidence and average accuracy assigned to individual items,
shows that as responses move from guess to know to remember, they generally increase in both

83
confidence and accuracy. At the same time, though, variability exists within the
remember/know/guess options – although there is remarkably little overlap, on average, among
the three. This lack of overlap is a hint, perhaps best saved for future investigations, that at least
in this procedure confidence and remember/know/guess represent (or function on) the same
continuum.

84
Figure 3.5: The between-events confidence-accuracy plot for remembered, known, and guessed items. Each point represents the average confidence assigned to an item and the average accuracy of that item. Linear trendlines are included.
Last, logistic regression analyses are shown in Appendix C.
3.3 Discussion
Experiment 2 had several main findings. First, as Experiment 1 demonstrated, remembering was
most common for targets whereas knowing and guessing were most common for related and
unrelated lures. These findings diverge from the common finding using associative lists, where
.00
.25
.50
.75
1.00
0 25 50 75 100
Prop
ortio
n C
orre
ct
Confidence
Remember Know Guess
r = .06
r = .47
r = .52
85
false remembering is frequent for nonpresented associates.
The comparatively low remember false alarm rate hints at differences between the processes that
engender false recognition in categorized lists versus associative lists. Dewhurst (2001) stated
that false alarms to category members arise due to generation processes that occur at study and
subsequent source memory errors, but such errors would be predicted to be remember-type
errors, rather than the know and guess errors found in this study. An alternative account is
provided by S. M. Smith et al. (2001), who hypothesized that false memories that occur for
associative lists are caused by processing that occurs during study, whereas false memories that
occur for categorized materials are caused through contributions of semantic knowledge at test.
Although S. M. Smith et al. (2001) did not collect remember/know/guess judgments in their
study, their account is consistent with the high probabilities of false knowing and guessing
occurring here. If subjects bring semantic knowledge to bear when making recognition decisions,
recollection should be less likely to be present. Rather, familiarity should play a greater role.
Experiment 2 also showed the relationship between confidence and remember/know/guess
responses in predicting accuracy. In it, I found that decisions made with higher confidence were
more likely to be accurate – consistent with the continuous dual-process model – and that
remember responses were more likely to be accurate than knows, and knows more than guessing,
even when controlling for level of confidence. As discussed earlier, this finding is not as
predicted by the continuous dual-process model. Even Wixted and Mickes (2010) found higher
old/new accuracy for remember judgments than for know judgments in one of their studies,
though, even when controlling for confidence. They suggested this pattern appeared because
subjects were asked to make source decisions prior to making old/new recognition decisions. In

86
Experiment 2 of this dissertation, however, no source decisions were collected, hinting that
another explanation may be necessary.
I also calculated the confidence-accuracy correlation in the four ways detailed by Roediger et al.
(2012), applying these correlations for the first time to remember/know/guess judgments. In all
cases, the confidence-accuracy correlation for remember responses was numerically (statistically
significant or nonsignificant depending on method of analysis) greater than the correlation for
knows, and the confidence-accuracy correlations for know responses were always significantly
greater than the correlations for guesses. This new analysis is one way of showing that
confidence is more meaningful, or predictive, in a state of remembering than in a state of
knowing or guessing. The implication here is that each unit of confidence in a remember state
carries more information about likely old/new accuracy than in other states.
The practical implication of this finding is that it may provide rememberers with an additional
mechanism through which they can evaluate potential recognition accuracy. Given two know
decisions of 25 and 75 confidence and two remember decisions of 25 and 75 confidence, it is
likely that a larger difference in probability correct exists for the remember decisions. Could
rememberers use such a heuristic when making recognition decisions? Recognition performance
appears strikingly resistant to such tools (e.g., memory recommendations; Selmeczy & Dobbins,
2013), so more study is necessary.
In sum, Experiment 2 found that remember, know, and guess judgments all showed different
relationships between confidence and accuracy, a result not immediately accounted for by the
continuous dual-process model. A large component of the model, however, makes predictions
for performance on source memory tasks. To continue to evaluate the model, a version of the

87
categorized list procedure containing a source memory component was necessary. Experiment 3
was designed for this purpose.
Chapter 4: Experiment 3
Experiment 2 was partially consistent with Wixted and Mickes’ (2010) continuous dual-process
model of signal detection because it showed that confidence correlated with old/new recognition
accuracy for both remember and know responses. On the other hand, remember old/new
accuracy was greater than know accuracy when controlling for confidence (see Figure 3.4), and
the confidence-accuracy correlation was greater for remember responses than know responses,
two findings not expected given the model. Experiment 3 was designed to investigate the
relationship between confidence ratings and remember/know/guess judgments in indicating
source accuracy in addition to old/new recognition accuracy. The prediction made by the
continuous dual-process model was that remember judgments should provide greater source
accuracy than know or guess judgments, regardless of the level of confidence provided.
This pattern is illustrated by the empirical results of Wixted, Mickes, Ingram, and colleagues,
who found that remember responses made with lower confidence were always higher in source
accuracy compared to know responses made with higher confidence. In a summary, Ingram et al.
(2012) wrote (p. 335), “The key finding was that remember judgments made with relatively low
confidence and low old-new accuracy were consistently associated with higher source accuracy
than [know] judgments made with higher confidence and higher old-new accuracy.” I sought to
replicate this finding here. In the categorized list procedure used here, are remember judgments
made with low confidence consistently associated with higher source accuracy than know

88
judgments?
The goal of Experiment 3 was to obtain the same general pattern of results obtained by Ingram et
al. (2012) and characterized in the above quote. To do this, I employed a similar procedure to
that of Experiment 2, but had subjects study items in different screen positions instead of in the
center of the screen, as in Experiments 1 and 2. On the recognition test, subjects made both
old/new recognition decisions and source decisions. They also made confidence ratings and
provided remember/know/guess judgments (an old/new recognition + source test). Drawing on
the claims made by the continuous dual-process model, I expected to find the pattern observed in
Experiment 2 regarding the relationship between confidence and old/new recognition accuracy,
but I expected a different pattern for the confidence-source accuracy correlation. Specifically, I
expected to find that judgments assigned remember would be higher in source accuracy
regardless of confidence rating, when compared to judgments assigned know or guess. Moreover,
I expected a positive confidence-source accuracy correlation for remember judgments, but a null
confidence-source accuracy correlation for both know and guess judgments. I predicted this
because if only remember judgments are assumed to carry (or denote the existence of) sufficient
source information, knows and guesses should show less variance in source performance and
thus negligible correlations between confidence and source accuracy.
4.1 Method
In Experiment 3, instead of viewing category items in the center of the computer screen, subjects
studied items that were presented in either the top left or the bottom right of the computer screen.
Following the study phase, subjects took an old/new recognition + source memory test in which
they indicated if the test item was old or new and, if old, where they had seen the word presented

89
on the screen. Subjects then rated their confidence in their recognition + source decision using a
sliding scale and, finally, made remember/know/guess judgments for items called “old.”
4.1.1 Subjects
Sixty-four subjects were recruited from the Washington University in St. Louis psychology
experiment subject pool. There were 22 men and 42 women (mean age = 20.91, SD = 2.51, min
age = 18, max = 29). Sample size was determined before collecting data using the previous two
studies as a guide.
4.1.2 Materials and Design
Materials (see Appendix A) and counterbalancing procedures were the same as in Experiment 2.
4.1.3 Procedure
Like the prior experiments, Experiment 3 consisted of three phases. These were: (1) study, (2)
distractor, and (3) old/new recognition + source memory test. In the study phase, subjects studied
the 100 targets in a similar way as did subjects in Experiment 2. In a departure from the
Experiment 2 procedure, however, five items from each category were selected randomly by the
computer program to be presented at the top left corner of the computer screen during study,
whereas the remaining five items were presented at the bottom right corner of the computer
screen. The order of items appearing in the top left and bottom right was randomized within
categories. Thus, for each category subjects saw the category name in the center of the screen
followed by the even or odd response frequency items from that category, presented in random
order, five in the top left and five in the bottom right.
The recognition test included two or three sequential steps, depending on how subjects

90
responded: (1) old/new recognition + source decision, (2) confidence rating, and, if necessary,
(3) remember/know/guess judgment. For each item on the recognition test, subjects chose
whether the item was: (1) presented at the top left of the screen earlier in the experiment, (2)
presented in the bottom right, or (3) new (i.e., nonstudied) by clicking one of three buttons on the
computer screen. Following the old/new recognition + source decision, subjects reported how
confident they were that their old/new recognition + source decision was correct. Last, subjects
who responded that the word was presented in the top left or bottom right of the screen during
the old/new recognition + source decision step made a remember/know/guess judgment for that
item.
4.2 Results
4.2.1 Probabilities of Remembering, Knowing, and Guessing
Table 4.1 presents the probabilities that remember, know, and guess judgments were assigned to
the three different item types on the recognition test, and the confidence with which these ratings
were assigned. Overall, the table appears similar to the Experiment 2 data presented in Table 3.3.
That is, remembering was most common for targets, followed by knowing and guessing, whereas
knowing and guessing were more common for lures than remembering was. In general, subjects
responded “old” more often to targets than related lures and unrelated lures.

91
Table 4.1: Probabilities of remembering, knowing, and guessing for the three item types in Experiment 3, as well as confidence ratings provided with those responses. Standard errors of the mean are presented in parentheses.
Remember Know Guess
Item Type Proportion Confidence Proportion Confidence Proportion Confidence
Targets .42 (.02) 78 (2) .25 (.01) 55 (2) .11 (.01) 34 (2)
Related Lures .07 (.01) 62 (3) .17 (.02) 46 (2) .17 (.01) 33 (2)
Unrelated Lures .03 (.01) 49 (4) .06 (.01) 44 (3) .07 (.01) 30 (2)
A 3 (item type: target, related lure, unrelated lure) x 3 (response type: remember/know/guess)
repeated-measures ANOVA was conducted on response proportion, revealing a significant
interaction, F(4, 252) = 96.39, p < .001, η2p = .61. Tests of simple main effects and subsequent
Bonferroni-corrected post-hoc comparisons holding item type constant detected more
remembering than knowing and more knowing than guessing for targets, but less remembering
than either knowing and guessing for both related and unrelated lures – the same patterns shown
in Experiments 1 and 2. Holding response type constant, remembering and knowing were most
common for targets, then related lures, then unrelated lures. Guess responses were more
frequently assigned to related lures than the other two item types (all significant Fs > 6.76, all
significant ps < .003).
To investigate differences in confidence, a 3 (item type: target, related lure, unrelated lure) x 3
(response type: remember/know/guess) repeated-measures ANOVA was conducted on
confidence rating, revealing a significant interaction, F(4, 88) = 10.91, p < .001, η2p = .33. Tests
of simple main effects and subsequent Bonferroni-corrected post-hoc comparisons holding item
type constant revealed greater confidence in remember responses on average than know

92
responses, and greater confidence for knows than guesses. The same pattern occurred for related
lures. For unrelated lures, know and guess confidence was significantly lower than remember
confidence. These patterns are consistent with the results of Experiment 2. Holding response
type constant, both remembers and knows to targets were more confident on average than
remembers and knows to related lures, and those were more confident than remembers and
knows to unrelated lures. Meanwhile, confidence in guesses was greater for both targets and
related lures than it was for unrelated lures (all significant Fs > 6.18, all significant ps < .004).
These findings all conform generally to previous results. In the categorized list procedure, targets
receive remembers and lures receive knows and guesses. Remembers to targets were assigned the
highest confidence ratings, whereas guesses to unrelated lures received the lowest confidence.
Subjects appeared to respond in Experiment 3 in a similar way as they did in Experiments 1
(with respect to response rates) and Experiment 2 (with respect to response rates and confidence
ratings).
4.2.2 Old/New Recognition Accuracy
Figure 4.1 depicts the confidence-old/new recognition accuracy relationship using a calibration
plot. It is interesting to see that overall calibration has improved even further (compare to Figure
3.3) – for related lures, confidence ratings over 50 are reasonably appropriate for the resulting
level of accuracy. It is possible that having subjects make source decisions (or providing access
to additional source information like screen position) decreased the likelihood of high confidence
errors to related lures further. Perhaps when presented with a deceptive related lure on the
screen, subjects were unable to recollect screen position and thus were more likely to respond
correctly “new.” In fact, subjects are more accurate than they expect to be for all item types at

93
the lower end of the confidence scale (i.e., exhibiting underconfidence), which can be attributed
to the “easy” component of the hard-easy effect.
Figure 4.1: Calibration in Experiment 3 as a function of item type. Error bars show the 95% confidence interval of the mean. The number of observations are presented beside each point.
I also constructed calibration plots to investigate the relation between confidence and accuracy
for memories that were judged remember, know, and guess, in the same way shown in Figure
3.4. These calibration plots are shown in Figure 4.2. As expected, Figure 3.4 and Figure 4.2
appear very similar. Subjects made remember, know, and guess judgments with all levels of
.00
.25
.50
.75
1.00
0-19 20-39 40-59 60-79 80-100
Prop
ortio
n C
orre
ct (O
ld/N
ew R
ecog
nitio
n)
Confidence
Target Related Lure Unrelated Lure
921
1153
1177
1329 1820
761
984
1227
1184
2242
1166
1529
1516
1190
999

94
confidence (although, intuitively, high confidence knows and low confidence remembers are
rarer).
Responses assigned higher confidence were more likely to be correct than response assigned
lower confidence. Moreover, for a given level of confidence, remember judgments were more
accurate than know judgments, and know judgments more accurate than guesses. The similarities
between these two figures suggest that adding a source component to the memory task did not
greatly change the confidence-accuracy relationship for remember/know/guess judgments, and
confirm the findings of Experiment 2.

95
Figure 4.2: Old/new calibration in Experiment 3 for responses assigned remember, know, and guess judgments. Error bars show the 95% confidence interval of the mean. The number of observations are presented beside each point.
4.2.3 Source Accuracy
Because I collected source memory decisions in addition to old/new recognition judgments, I
was also able to investigate the relationship between confidence and source accuracy as a
function of remember/know/guess judgment. These data are shown in Figure 4.3. Surprisingly,
these data follow the same pattern as the old/new recognition data do (as shown in Figure 3.4 for
the prior experiment and Figure 4.2 for the current one). Specifically, source accuracy increased
.00
.25
.50
.75
1.00
0-19 20-39 40-59 60-79 80-100
Prop
ortio
n C
orre
ct (O
ld/N
ew R
ecog
nitio
n)
Confidence
Remember Know Guess
94 319
522
627
1769
438 615
841
693
411
673 778 569
165 36

96
with confidence, and remembers were more accurate than knows, and knows more than guesses.
Figure 4.3: Source calibration in Experiment 3 for responses assigned remember, know, and guess judgments. Error bars show the 95% confidence interval of the mean. The number of observations are the same as those depicted in Figure 4.2.
The results depicted in Figure 4.3 are surprising considering the account provided by Wixted and
Mickes (2010), who observed that remember responses with lower confidence were higher in
source accuracy than know responses provided with higher confidence. This figure shows,
however, that average source accuracy of remember responses of, say, 40-59 confidence – on
average .38 correct – was clearly lower than source accuracy of know responses of 80-100
.00
.25
.50
.75
1.00
0-19 20-39 40-59 60-79 80-100
Prop
ortio
n C
orre
ct (S
ourc
e M
emor
y)
Confidence
Remember Know Guess

97
confidence – on average .61 correct. In fact, know responses of 80-100 confidence – of which
411 occurred in the study (comprising almost 20% of high confidence responses) – were higher
in source accuracy than remember ratings of confidence 0-59. These results also differ from
those of Ingram and colleagues (2012), who also found that lower confidence remember
responses were higher in source accuracy than higher confidence know responses (see Figure 1.6,
panel A).
Moreover, whereas a ceiling effect for high confidence responses is a potential confound when
examining old/new recognition accuracy, ceiling effects do not appear to be in play here. Clear
differences between remembering, knowing, and guessing emerge throughout the range of
confidence values. Both confidence ratings and remember/know/guess judgments appear to
predict source accuracy, even when controlling for confidence or controlling for judgment. The
implications of these results will be described in the Discussion.
4.2.4 Confidence-Old/New Accuracy Correlations
As in Experiment 2, I also computed four types of confidence-accuracy correlation for the three
different item types in the experiment. As Table 4.2 shows, and in agreement with the previous
figures, confidence and accuracy were correlated regardless of method of analysis. These results
are different from the results of prior experiments, where the confidence-accuracy correlation for
related lures was negative or null (and thus agree overall with the calibration plots provided in
Figure 4.1) – in fact, these are the highest confidence-accuracy correlations that have ever been
obtained in a variant of the DeSoto and Roediger (2014) categorized list procedure. It is possible
that asking subjects to make source decisions at the same time as recognition decisions reduced
the average confidence and accuracy of identifications of related lures, thereby increasing the

98
strength of the confidence-accuracy association between these items. This is also consistent with
the paper by Mulligan et al. (2010), who found that the remember/know/guess procedure was
capable of qualitatively changing recognition accuracy.
Table 4.2: Confidence-old/new accuracy correlations for the three item types in Experiment 3. Between-units correlations calculated using Pearson r, within-units correlations calculated with Goodman-Kruskal γ. *p < .05 **p < .01
Item Type Between-Subjects Within-Subjects Between-Events Within-Events
Targets .41** .43** .37** .41**
Related Lures .31** .19** .27** .23**
Unrelated Lures .53** .45** .52** .53** Table 4.3 contains the correlations between confidence and accuracy for memories that were
judged remember, know, and guess. Compare this table to Table 3.3. The two tables are
consistent in showing that the confidence-accuracy association is significantly positive for both
remember and know judgments. Here, though, only the between-events guess correlation is
positive (although only barely so, explaining just 4% of the variance in accuracy). Again, overall,
the confidence-accuracy association was stronger in this experiment than in the previous one.
Table 4.3: Confidence-old/new accuracy correlations for remembered, known, and guessed memories in Experiment 3. Between-units correlations calculated using Pearson r, within-units correlations calculated with Goodman-Kruskal γ. *p < .05 **p < .01
Between-Subjects Within-Subjects Between-Events Within-Events
Remember -.76** -.45** -.56** -.62**
Know -.45** -.28** -.13** -.30**
Guess -.02** -.05** -.21** -.01** I examined differences in the confidence-accuracy correlation as a function of remember versus

99
know judgment, as I did in Experiment 2. Here, a difference was detected between between-
subjects remember and know judgments, as calculated by a Fisher r-to-z test (z = 2.82, p = .005).
A difference was also detected for the between-events correlation (z = 4.98, p < .001). This
means that according to the two between-units methods of analysis, the confidence-accuracy
correlation was stronger for remember responses than know responses.
In terms of within-subjects or within-events analyses, significant differences were obtained
between remember and know judgments for both within-subjects (paired-samples t[53] = 2.41, p
= .02) and within-events analyses (t[164] = 8.83, p < .001). According to these types of analysis,
the remember confidence-accuracy correlations were stronger than the know confidence-
accuracy correlations. These differences emerge even despite potential restriction of range issues
that may occur for remembers (in which, on average, subjects are highly confident and accurate).
Thus, differences in the confidence-accuracy correlation were detected across all four types of
analysis as a function of remember versus know judgment.
4.2.5 Confidence-Source Accuracy Correlations
Because Experiment 3 collected source memory decisions in addition to old/new decisions, the
correlation between confidence and source accuracy can also be computed. This calculation is
not possible as a function of item type (since any response of “old” to a related lure or unrelated
lure is, by definition, incorrect). These correlations can be computed for remember, know, and
guess judgments, however.
These correlations are contained in Table 4.4. This table shows that the correlation between
confidence and source accuracy are positive for both remember and know judgments regardless
of method of analysis, but not significantly different for guesses (at least in three of the four

100
methods of analysis).
Table 4.4: Confidence-source accuracy correlations for remembered, known, and guessed memories in Experiment 3. Between-units correlations calculated using Pearson r, within-units correlations calculated with Goodman-Kruskal γ. *p < .05 **p < .01
Between-Subjects Within-Subjects Between-Events Within-Events
Remember .78** .44** .59** .56**
Know .57** .30** .24** .33**
Guess .01** .03** .09** .03** Statistical differences were found between remember and know correlations for all four types of
analysis. The between-subjects Fisher r-to-z test was significant (z = 2.20, p = .03) as was the
between-events test (z = 4.30, p < .001). Significant differences were also obtained between
remember and know judgments for both within-subjects (paired-samples t[60] = 2.38, p = .02)
and within-events analyses (t[194] = 6.80, p < .001). These results show that the confidence-
accuracy relationship for remember responses was stronger than the relationship for know
responses in Experiment 3 – thus, when an individual is remembering, increases in confidence
are more indicative of increases in accuracy than when an individual is knowing.
Figure 4.4 shows the between-events confidence-source accuracy plot for remember, know, and
guess judgments. This figure appears similar to the plot shown for old/new accuracy in
Experiment 2 (see Figure 3.5).

101
Figure 4.4: The between-events confidence-source accuracy plot for remembered, known, and guessed items. Each point represents the average confidence assigned to an item and the average source accuracy of that item. Linear trendlines are included.
Last, logistic regression analyses are shown in Appendix C.
4.3 Discussion
Experiment 3 replicated the results of Experiments 1 and 2. Similar proportions of remembering,
knowing, and guessing were found to the three different item types among studies, suggesting
that more recollection, as indicated by remember responses, was present for targets than for lures
(and the inverse – that knowing and guessing were more common for lures). As in prior studies,
.00
.25
.50
.75
1.00
0 25 50 75 100
Prop
ortio
n C
orre
ct
Confidence
Remember Know Guess
r = .09
r = .24
r = .59

102
confidence ratings mirrored these response probabilities – on average, remembers to targets were
responded to with greater confidence than guesses to related lures, for example. These results are
one illustration of a general relation between confidence and remember/know/guess judgments.
Additionally, Experiment 3 found that responses assigned remember were higher in old/new
accuracy than responses assigned know, and that know responses were higher in old/new
accuracy than responses assigned guess (shown in Figure 4.2). This was also consistent with
prior studies, although not predicted by the continuous dual-process model. The confidence-
old/new accuracy correlations also agreed with the results of Experiment 2.
The critical findings of Experiment 3, however, were the source memory results. A critical tenet
of the continuous dual-process model is that source accuracy for remember responses should, on
average, be greater than source accuracy for know responses, regardless of the level of
confidence provided. Contrary to this prediction, Experiment 3 found that lower confidence
remembers were lower in source accuracy than higher confidence knows, however (see Figure
4.3). Moreover, although the confidence-source accuracy correlation was greater for remember
responses, the correlation for know responses was still significantly positive, an indication of an
association between strength of knowing and source accuracy.
Why did this study fail to replicate the predictions of the continuous dual-process model? Before
turning to theoretical reasons, a straightforward possibility was that the way that the different
judgments were collected in Experiment 3 influenced the results. Perhaps it was the case that
asking for a recognition decision and a source decision simultaneously, using three buttons, led
to a pattern of results that differed from previous studies exploring the continuous dual-process
model. To eliminate this possibility, I conducted Experiment 4, in which I had subjects make
103
old/new recognition decisions and source decisions separately and also collected confidence
separately for each of these decisions. Additionally, I had subjects make these judgments in
different orders for the purpose of exploring effects of order on results.
Chapter 5: Experiment 4
Experiment 3 showed that confidence correlated with both old/new accuracy as well as source
accuracy, and that for a given level of confidence, a remember judgment was likely to be
associated with both higher old/new and source accuracy than a know judgment assigned the
same level of confidence. This finding was inconsistent with the continuous dual-process model
(Wixted & Mickes, 2010), and I was concerned that the order and manner in which judgments
were collected affected the pattern of the results. In Experiment 3, subjects made old/new
recognition + source decisions, then rated confidence for that combined decision, then made
remember/know/guess judgments. Perhaps it was the case that the combination of judgments or
order led subjects to make confidence ratings based on the old/new component of the old/new
recognition + source decision, completely ignoring any confidence experienced for the source
decision component.
To test for order effects, I conducted a replication of Experiment 3 in which order of judgments
was manipulated. In this experiment, subjects made old/new recognition decisions, old/new
recognition confidence ratings, source memory decisions, source confidence ratings, and
remember/know/guess judgments for each item on the test – one additional judgment for each
“new” item, and four additional judgments (confidence) for each item called “old.” Additionally,
I designed four different experimental groups in which the order of ratings was counterbalanced.

104
If the simultaneous old/new recognition + source decision step was affecting the results, the
prediction was that collecting judgments sequentially would produce data consistent with Wixted
and Mickes’ (2010) findings. (A condition most similar to Wixted and Mickes’ study would
have, for each item, collected an old/new recognition decision with a confidence rating, followed
by a remember/know/guess judgment, followed by a source memory decision.) On the other
hand, if order and manner of judgments did not have an effect, I expected results to replicate the
previous findings.
5.1 Method
5.1.1 Subjects
Ninety-six subjects were recruited from the Washington University in St. Louis psychology
experiment subject pool. There were 37 men, 58 women, and one subject who selected
“other/prefer not to respond” when asked about gender (mean age = 20.13, SD = 2.18, min age =
18, max = 27).
5.1.2 Materials and Design
Materials were the same as in Experiment 3 (see Appendix A).
5.1.3 Procedure
In Experiment 4, subjects were assigned randomly to one of four experimental groups; see
Figure 5.1 for an illustration of the groups. Twenty-four subjects participated in each group. All
groups studied categorized items in the same way that subjects did in Experiment 3 – category by
category, with items appearing in one of two screen corners. The test was different for each
group, however. These four groups will be defined by letters and descriptive labels.

105
Figure 5.1: An illustration of the four conditions in Experiment 4.
In Group A, the all old/new-source-RKG group, subjects made old/new recognition decisions,
followed by 0-100 old/new confidence ratings, for each of the 300 items on the test. Following
this, subjects were presented with the items to which they responded “old,” presented in another
random order. For each of these items, subjects made a source decision (clicking either the
“upper left” or “bottom right” button) followed by a source confidence rating on a scale from 0-
100, then a remember/know/guess judgment for the word.
In Group B, the sequential old/new-source-RKG group, subjects made all of the judgments
sequentially: for each item, an old/new recognition decision, an old/new confidence rating, and
then, if the item was called “old,” a source decision, a source confidence rating, and a

106
remember/know/guess judgment. The procedure then continued for the second item.
Subjects in Group C, the all old/new-RKG-source group, proceeded like subjects in the first
group, but after making old/new recognition decisions and confidence ratings for all words,
subjects made remember/know/guess judgments followed by source decisions and source
confidence ratings for all items called old. The difference between Group A and Group C was
that in Group C, the remember/know/guess judgment preceded the source decision and
confidence rating, rather than followed them.
Those in Group D, called the sequential old/new-RKG-source group, for each item made old/new
recognition decisions, old/new confidence ratings, and, for items called “old,”
remember/know/guess judgments, source decisions, then source confidence ratings. The
procedure for Group D differed from that for Group B in that remember/know/guess judgments
preceded source decisions, rather than followed them. This is the condition that most closely
resembles Wixted and Mickes’ (2010) method.
Thus, in all of these groups judgments were sequential and thus the basis for confidence ratings
was either old/new decision or source decision alone, rather than both, as it was in Experiment 3.
The four conditions tested separately whether having the remember/know/guess judgment prior
to or after source decision would affect the results, and also whether making all old/new
decisions prior to source decisions influenced results.
5.2 Results
The purpose of the four groups tested in Experiment 4 was to determine whether the order of
judgments affected the relationship between old/new confidence and old/new accuracy or the

107
relationship between source confidence and source accuracy. Specifically, I was expecting that
separating the judgments would mirror what Wixted and Mickes (2010) reported for source
memory: An instance where remember responses were always higher in source accuracy than
know responses, regardless of the level of confidence assigned. To foreshadow, none of the four
groups demonstrated this pattern.
5.2.1 Old/New Recognition Accuracy
Figure 5.2 shows the relation between old/new accuracy and confidence as a function of
remember, know, and guess judgment. The results are somewhat noisy, due to limited numbers
of observations in some cells, especially at the lower ranges of the confidence scale (24 subjects
are represented in each calibration plot here, compared to 64 in previous studies). Nevertheless,
all of these figures echo the same gestalt: Old/new accuracy increased with confidence ratings
for memories marked remember, know, and, to a lesser extent, guess. These patterns were also
found in Figure 3.4 and Figure 4.2, which show the corresponding analyses conducted for the
previous experiments.

108
Figure 5.2: Old/new accuracy as a function of old/new confidence in Experiment 4 for responses assigned remember, know, and guess judgments.
Some slight qualitative differences between groups exist. For instance, for Groups A and C, there
were no significant differences between remember and know judgments, in terms of old/new
accuracy, at the highest portions of the scale. This difference did appear in panels B and D,
however. Because of a lack of observation in some subjects’ cells (e.g., only about half the
sample reported any low confidence knows and remembers), overall ANOVAs could not be
conducted on these calibration curves (and those following). In lieu of an ANOVA, I used a
.00
.50
1.00
.50
1.00
0-19 20-39 40-59 60-79 80-100 0-19 20-39 40-59 60-79 80-100
Old
/New
Acc
urac
y
Old/New Confidence
Remember Know Guess
A B
C
D
109
targeted comparison looking at differences between remember and know recognition accuracy at
the 80-100 confidence level. This analysis identified a statistically significant difference in
Group B, paired-samples t(23) = 4.98, p < .001, and a marginally significant difference in Group
D, t(22) = 1.99, p = .059. This comparison was nonsignificant in the other two groups. (T-tests
will be used similarly in subsequent analyses.)
These figures and t-tests show that no differences in old/new accuracy between remember and
know were found at high levels of confidence (80-100) when all old/new judgments were made
before source and recognition judgments (Groups A and C), but when judgments were made
sequentially (Groups B and D), an advantage for remembering emerged.
This pattern fits with the continuous dual-process model. When individuals were unconcerned
about making remember/know/guess judgments and source decisions when making old/new
recognition decisions, as they were in Groups A and C, confidence tracked with accuracy to the
same degree regardless of eventual remember/know/guess judgment. This is consistent with the
idea that confidence ratings pick up an aggregate of recollection and familiarity and correlate
with recognition accuracy.
In Groups B and D, however, the addition of the remember/know/guess judgment for each item
may have encouraged subjects to think about source details, integrating a larger recollection
component or emphasis into their old/new decisions. Therefore, these results may indicate that
although the continuous dual-process model predicts equal accuracy between remember and
know, the reason that this result does not always appear may be due to methodological
differences. Perhaps having to complete remember/know/guess judgments or make source
decisions puts subjects into a type of retrieval mode where even old/new responses and

110
confidence ratings are based on episodic or contextual information.
5.2.2 Source Accuracy
Figure 5.3 shows calibration between source confidence ratings and source accuracy as a
function of remember/know/guess judgment.
Figure 5.3: Source accuracy as a function of source confidence in Experiment 4 for responses assigned remember, know, and guess judgments.
Again, the patterns shown in this figure generally resemble those in Figure 5.3 (and thus also
.00
.50
1.00
.50
1.00
0-19 20-39 40-59 60-79 80-100 0-19 20-39 40-59 60-79 80-100
Sour
ce A
ccur
acy
Source Confidence
Remember Know Guess
A
B
C
D
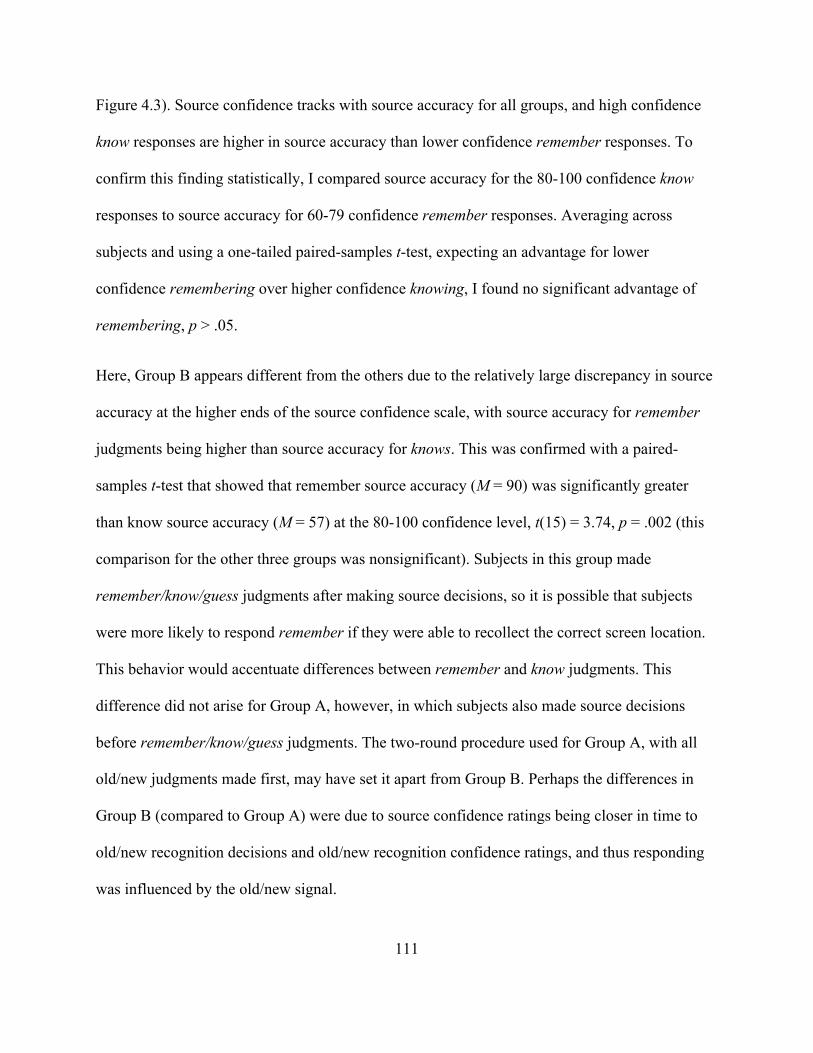
111
Figure 4.3). Source confidence tracks with source accuracy for all groups, and high confidence
know responses are higher in source accuracy than lower confidence remember responses. To
confirm this finding statistically, I compared source accuracy for the 80-100 confidence know
responses to source accuracy for 60-79 confidence remember responses. Averaging across
subjects and using a one-tailed paired-samples t-test, expecting an advantage for lower
confidence remembering over higher confidence knowing, I found no significant advantage of
remembering, p > .05.
Here, Group B appears different from the others due to the relatively large discrepancy in source
accuracy at the higher ends of the source confidence scale, with source accuracy for remember
judgments being higher than source accuracy for knows. This was confirmed with a paired-
samples t-test that showed that remember source accuracy (M = 90) was significantly greater
than know source accuracy (M = 57) at the 80-100 confidence level, t(15) = 3.74, p = .002 (this
comparison for the other three groups was nonsignificant). Subjects in this group made
remember/know/guess judgments after making source decisions, so it is possible that subjects
were more likely to respond remember if they were able to recollect the correct screen location.
This behavior would accentuate differences between remember and know judgments. This
difference did not arise for Group A, however, in which subjects also made source decisions
before remember/know/guess judgments. The two-round procedure used for Group A, with all
old/new judgments made first, may have set it apart from Group B. Perhaps the differences in
Group B (compared to Group A) were due to source confidence ratings being closer in time to
old/new recognition decisions and old/new recognition confidence ratings, and thus responding
was influenced by the old/new signal.

112
In the two previous figures, I showed that old/new confidence relates to old/new accuracy and
source confidence relates to source accuracy for both remember and know judgments. Is there a
relationship between old/new confidence and eventual source decision accuracy? To investigate,
I created a third calibration plot showing the relationship between old/new confidence and source
accuracy. This plot is depicted in Figure 5.4. Clearly, the general pattern shown here is the same
as the ones shown in other figures: an association between confidence and accuracy regardless of
remember/know/guess judgment. As in the prior analysis, however, no groups show better source
memory for lower confidence (60-79) remember judgments compared to higher confidence (80-
100) knows. On the other hand, though, greater differences between remember and know
judgments in predicting accuracy appear in Groups B and D at the highest levels of confidence
(80-100). This different was significant, averaging across subjects, for both Group B, paired-
samples t(23) = 4.77, p < .001, and Group D, t(21) = 2.59, p = .017. These results again show
potential differences in responding that occur when subjects focus only on making old/new
recognition decisions before making remember/know/guess judgments and source decisions –
Groups A and C show a somewhat different pattern from B and D when responding with high
confidence.

113
Figure 5.4: Source accuracy as a function of old/new confidence in Experiment 4 for responses assigned remember, know, and guess judgments.
5.2.3 Confidence-Accuracy Correlations
I also calculated the correlations between old/new confidence and old/new accuracy, source
confidence and source accuracy, and old/new confidence and source accuracy. For descriptive
purposes, I have included these correlations in Appendix D.
In general, these correlations show that the strength of the confidence-accuracy association is
greatest for targets, less for unrelated lures, and weakest for related lures, which agrees with
.00
.50
1.00
.50
1.00
0-19 20-39 40-59 60-79 80-100 0-19 20-39 40-59 60-79 80-100
Sour
ce A
ccur
acy
Old/New Confidence
Remember Know Guess
A
B
C D
114
previous data (DeSoto & Roediger, 2014). More importantly, however, is that both remember
and know responses show positive associations between old/new recognition accuracy and
confidence and source accuracy and confidence. In general, however, this correlation is greater
for remember judgments than know judgments. Across the 24 comparisons shown in Appendix
D, the confidence-accuracy correlation was greater for remember than know 20 times. (Twice,
there was no difference, and twice, there was a know advantage.) These results are significant by
sign test, p < .01.
These results mean that confidence was positively associated with accuracy regardless of
whether a subject was in a state of remembering or a state of knowing. This association was
consistent across type of test, too – old/new recognition versus source. Again, the continuous
dual-process model does not make an explicit statement about the confidence-accuracy
correlation as a function of remember/know/guess, but according to my interpretation it was
expected that the correlation for remembering and knowing would be equal on an old/new task
and that there would be a significant correlation for remembering but not knowing on a source
task. These predictions had slight support from the data – the four cases showing no remember
advantage in the sign test occurred for old/new confidence and accuracy, and all remember
correlations were greater than know correlations for source – but further research will need to
explore the continuous dual-process model’s implications for confidence-accuracy correlations
to evaluate these findings further.
Last, logistic regression analyses are included in Appendix C.
5.3 Discussion

115
In Experiment 4, subjects were presented with categorized items and given a recognition test
where they were required to make old/new recognition decisions, rate old/new confidence, make
source decisions, rate source confidence, and also provide remember/know/guess judgments.
Moreover, four groups of subjects made these ratings in different orders. The aim of the study
was to determine if rating order affected the general pattern of results found in Experiments 1, 2,
and 3.
Figure 5.2, Figure 5.3, and Figure 5.4 convincingly show that the relationship between
confidence and both kinds of accuracy (old/new and source) was consistently positive (i.e.,
increasing) for remember and know judgments. Whether accuracy is different or equal for a
given level of confidence as a function of remember/know/guess judgment varied somewhat
between experimental groups, but the most important finding was that high confidence memories
were higher in accuracy than lower confidence memories. These patterns, unexpectedly, emerged
for both old/new recognition and source decisions.
Chapter 6: General Discussion
The four experiments reported in this dissertation explore the relationship between old/new
recognition memory, source memory, confidence ratings, and remember/know/guess judgments.
The purpose was to ground confidence-accuracy research using deceptive and nondeceptive
materials into a theoretical framework and to assess confidence ratings and
remember/know/guess judgments as indicators of recognition accuracy.
6.1 Summary of Findings
In Experiment 1, I showed that remember/know/guess judgments are valid indicators of the

116
accuracy of recognition decisions in the DeSoto and Roediger (2014) categorized list procedure.
Subjects were likely to assign remember judgments to targets, but they less frequently assigned
them to related or unrelated lures. Similar patterns of responding occurred regardless of whether
items were presented via auditory or visual modalities. Additionally, this experiment showed that
correct recognition was more likely for items of lower response frequency, but that false
recognition was more likely for items of higher frequency, replicating previous research (e.g.,
Dewhurst, 2001). These findings suggest important differences between false memories arising
in categorized versus associative procedures and also contribute to the discussion of modality
effects and how and when they arise, showing that the modality effect, which obtains in the
DRM paradigm, does not extend to categorized lists. Additionally, Experiment 1 also set up the
subsequent experiments.
In Experiment 2, I combined both confidence ratings and remember/know/guess judgments and
showed that both make unique contributions to predicting the accuracy of old/new recognition
judgments. Specifically, high confidence remember responses were more likely to be accurate
than any other type of response, suggesting that confidence ratings and remember/know/guess
judgments may be additive in terms of their predictive capability. This experiment also applied
confidence-accuracy analyses to remember, know, and guess judgments and observed that
confidence and accuracy correlate in states of remembering and knowing, but that the correlation
is stronger when remembering. Confidence did not correlate with accuracy when subjects were
guessing.
In Experiment 3, I tested subjects’ old/new recognition memory but also their source memory, as
well, and found that old/new recognition memory and source memory showed similar

117
relationships with confidence and remember/know/guess judgments, an unexpected result. It was
predicted that all remember responses would show better source accuracy than know and guess
responses, but this did not occur. Rather, in Experiment 3 remember responses were more
accurate than know responses when controlling for confidence in predicting both old/new
recognition and source accuracy. In Experiment 4, a replication and extension of Experiment 3, I
found that these patterns were similar regardless of the order or manner in which judgments were
made.
Several conclusions implications arise from these data. First, at least in this procedure with these
materials, a rememberer ought to trust high confidence memories over memories held with lower
confidence. Second, a rememberer ought to trust recognition decisions based on the experience
of remembering more than those based on knowing or guessing. Third, recognition accompanied
by high confidence and remembering are likely to be most accurate of all – these responses, on
average, were 90% likely to be correct, even with somewhat deceptive materials. These patterns
are similar for old/new memory as well as source memory.
Although the data here are only partially consistent with the continuous dual-process model – to
be discussed in the following section – they suggest that confidence and remember/know/guess
judgments have utility when used jointly. Why are such procedures used so infrequently within
the literature? It is likely that an implicit single-process view – that confidence and
remember/know/guess index the same thing (e.g., Donaldson, 1996; Dunn, 2004) – remains
popular with many memory researchers. Surprisingly, though, evidence against this perspective
dates as far back as Rajaram’s (1993) foundational work on the remember/know/guess procedure
(and is found in the work of others; e.g., Dobbins, Kroll, & Yonelinas, 2004). Other models of
118
signal detection, which assume that recollection is a dichotomous process (e.g., Yonelinas, 2002)
likewise predict that all remembering occurs with high confidence, and thus it is of less interest
to examine how confidence varies within remember responses (only within knows).
Collecting both confidence ratings and remember/know/guess judgments in the same procedure
allowed the computation of confidence-accuracy correlations for memories that are remembered,
known, or guessed, for the first time. My research suggests that confidence is associated with
accuracy when a rememberer is in a state of remembering or knowing (as compared to guessing).
In most cases, the confidence-accuracy association is stronger when subjects are remembering
compared to when they are knowing. It is possible that this occurs because recollection is more
likely to support accurate retrieval than familiarity is, especially when dealing with the
combination of deceptive and nondeceptive items present on the test in this procedure (and not
present in the original continuous dual-process research using unrelated word lists). When
unrelated words are on the test, it is perhaps not as necessary to rely on recollection when
responding – familiarity will do.
One way of thinking about this state of affairs might be as follows. If remembering and knowing
combine to support old/new recognition performance, and both are indexed by confidence, one
would expect no differences between remembering and knowing in the confidence-accuracy
relation. If the base rates of accuracy of remembering and knowing are different, however, this
relationship may be altered. Namely, using unrelated materials, remembering and knowing may
be roughly similar in terms of predicting accuracy (i.e., similar base rates of accuracy). In
contrast, using category materials, as in the current experiments, remembering may be more
likely to support accurate retrieval than knowing. Thus, the relative weights of remembering and
119
knowing would differ in their contribution to predicting accuracy. Perhaps individuals do not
account for these weights when combining recollection and familiarity signals in old/new
recognition.
In sum, our results suggest that when deciding whether to trust our memories, we should
consider our confidence, our qualitative sense of remembering (remember/know/guess), and
perhaps even how these experiences vary from context to context. To return to the original
example, this research suggests that an eyewitness choosing an individual from a lineup ought to
consult both the quantitative and qualitative characteristics of his or her memory. If the
rememberer is confident that the individual committed the crime, and can also recollect episodic
characteristics of how the crime unfolded, an identification may be reasonable. A lack of either
confidence or remembering, however, suggests that the identification should be more tentative.
6.2 Evaluating the Continuous Dual-Process Model
The results reported in this dissertation provide mixed support for the continuous dual-process
model of remember/know/guess judgments, proposed by Wixted and Mickes (2010). Applying
the model to the data presented here, I expected the following findings: (1) evidence of
recollection as a continuous process, (2) greater recognition accuracy for higher compared to
lower confidence responses, (3) greater recognition accuracy for remember responses than know
responses, and knows than guesses, (4) equivalent recognition accuracy as a function of
remember and know judgment when controlling for confidence, and (5) higher source accuracy
for remembers than knows, regardless of confidence. Across the four experiments reported here,
I found support for points (1), (2), and (3), but not for (4) and (5). I go through these expectations
in turn.
120
First, the idea that recollection is a continuous process is supported by the observation that
subjects assigned varying levels of confidence ratings to remember responses. This finding was
shown consistently across Experiments 2 (Figure 3.4), 3 (Figure 4.2), and 4. Note the
observation counts labeled in each figure. In these experiments, subjects appeared to experience
different levels of recollection, which were indexed by different confidence ratings. One question
that arises, however, is what proportion of low confidence remember responses must appear in a
dataset to support this conclusion – in other words, one could point to the large majority of high
confidence remembers as evidence that recollection is dichotomous (as maintained by Yonelinas,
2002).
Second, Experiments 2, 3, and 4 all found that recognition accuracy was greater for higher
relative to lower confidence responses, on average. When remember, know, and guess judgments
and item types are grouped together, this pattern is clear (although differences in this relationship
as a function of remember/know/guess judgment and item type emerged). These findings are
consistent with the continuous dual-process model, which suggests that confidence is, on
average, an indicator of the sum of familiarity and recollection, and is thereby an indicator of
old/new recognition accuracy. The two exceptions to this generalization are guess responses –
for which confidence is not associated with accuracy – and highly related items – for which
confidence and accuracy are weakly associated (and sometimes not associated or even negatively
associated; DeSoto & Roediger, 2014).
Third, across all experiments, differences in old/new recognition accuracy were shown as a
function of remember, know, and guess judgment. Perhaps intuitively, remember responses were
more accurate than knows, and knows more accurate than guesses. This finding is also in support

121
of the continuous dual-process model, which states that on average, remember ratings should be
more accurate (but also greater in confidence) than know responses (which are also lower in
confidence, on average).
Past this point, however, my findings diverge from the predictions of the continuous dual-
process model. Wixted and Mickes (2010) predicted that when confidence is controlled for (i.e.,
given a particular level of confidence), remember responses should have the same old/new
accuracy as know responses. In all the cases reported in this dissertation, however, remember
accuracy was greater than know accuracy when controlling for level of confidence. Despite the
claims of the model, this pattern also appears in several of Wixted and Mickes (2010) and
Ingram et al.’s (2012) studies, as well. Wixted and Mickes warn that under certain conditions,
“Equating for confidence would not necessarily equate for strength... equating for old/new
accuracy in addition to equating for old/new confidence is helpful in this regard” (p. 1048). I did
not equate for old/new accuracy in these dissertation experiments because the initial goal was to
extend the DeSoto and Roediger (2014) categorized list procedure directly. Further tests of the
continuous dual-process model using the categorized list procedure will require an attempt to
equate for old/new accuracy (or at a minimum, additional consideration of this issue).
Second, and more concerning, my experiments failed to find a remember advantage over knows
for source memory accuracy when confidence ratings of 40 or higher were assigned. These
findings were shown in Experiment 3 (and seen in Figure 4.3) and Experiment 4 (Figure 5.3). In
Experiment 3, subjects were asked to click a button that said “top left,” “bottom right,” or “new,”
then make a confidence rating, when making old/new recognition + source decisions. I was
concerned that this hybrid judgment was leading subjects to integrate both old/new signal as well

122
as source signal into their confidence ratings. In Experiment 4, I attempted to eliminate this
potential confound by making all of the judgments sequential and also counterbalancing where
possible with the purpose of examining whether differences in judgment order led to differences
in patterns of results. All four experimental groups, however, failed to show an advantage of
lower confidence remembers over higher confidence knows in terms of source memory, a critical
finding of the Wixted and Mickes (2010) and Ingram et al. (2012) papers.
Why this discrepancy? As mentioned earlier, the experiments reported here did not equate for
old/new accuracy as well as old/new confidence. It is unclear how the patterns of results would
differ if old/new accuracy were equated, but it is likely that the differences would be quantitative
rather than qualitative – that is, the slopes of the remember and know lines in Figure 4.3 and
Figure 5.3 would not differ. If this were the case, however, the finding reported here would be
even more pronounced. The Ingram et al. (2012) study was conducted in the interest of equating
for old/new accuracy – this was the original purpose of the unusual scale used – but in some
ways, the use of this unusual scale introduces as many issues as it solves. When subjects respond
using the Ingram et al. (2012) scale, for instance, are they doing so in ways that parallel decision-
making in standard recognition procedures? Additionally, it seems unusual for the theory to state
that recollection and familiarity occur in tandem but then ask subjects to make a dichotomous
judgment as to whether remembering or knowing is being experienced.
The possibility also exists that the instructions used in this experiment somehow led subjects to
make confidence ratings and remember/know/guess judgments differently than they did in
Wixted and Mickes (2010) and Ingram et al. (2012). Geraci and colleagues examined the
influence of remember/know instructions on task performance in several papers (e.g., Geraci &

123
McCabe, 2006; Geraci, McCabe, & Guillory, 2009; McCabe & Geraci, 2009), and found that the
wording of the remember/know instructions affected responding. Specifically, when instructions
emphasized that know responses should also be high in confidence, standard remember/know
patterns emerged, revealing different qualitative effects of remembering (i.e., a dissociation for
different types of items; see Geraci et al., 2009). When instructions did not emphasize that
knowing should necessarily be highly confident, however, remember/know responses appeared
similar in nature to confidence ratings. In these experiments, confidence language was purposely
removed from the remember/know/guess instructions so that remembering and knowing could be
reported with different levels of confidence. This methodological decision may have had the
counterintuitive side effect of making remember/know/guess judgments more similar to
confidence ratings than they would have been otherwise.
In sum, the experiments reported here only partially agree with the continuous dual-process
model. Additional research will be necessary to continue evaluating this model and how the
present results fit, or do not fit, with its claims. Again, the first step will be an attempt to equate
for old/new accuracy and confidence together. Wixted and Mickes (2010) caution that if the two
have not been equated, “Conclusions should probably be tempered accordingly” (p. 1048).
6.3 Implications of Quantitative and Qualitative Indicators
The findings here suggest that there could be some benefit to training individuals to be sensitive
to qualitative indicators of recognition accuracy when making memory decisions. Some research
has found success in teaching rememberers, mostly older adults, to rely on recollection (Castel,
2007) or even attempting to improve recollection directly (Jennings & Jacoby, 2003). Improving
sensitivity to recollection while engaging in metacognitive monitoring could be another path to

124
the same result.
A potential intervention would be to ask individuals to attempt to retrieve and evaluate source
memory when making memory decisions, with the understanding that the conjunction of high
confidence and retrieval of source details may indicate higher accuracy. This idea is supported
by the results of Experiment 2 (and Experiment 1, in a sense), which found that asking subjects
to make remember/know/guess judgments eliminated the negative confidence-accuracy
correlation for related lures, and by Experiments 3 and 4, which showed that asking subjects to
make remember/know/guess judgments and source memory decisions improved these
correlations further.
These benefits may extend outside of the laboratory to real-world scenarios. In the courtroom, if
a witness expresses high confidence in an identification and is also able to retrieve source details,
perhaps a judge or jury should be swayed to a greater degree than if high confidence were
expressed alone. Likewise, in the classroom, retrieving details of the original encoding episode
may indicate that the sense of high confidence is likely due to the rich memory for that episode
compared to familiarity driven by an event occurring outside of the classroom.
Of course, certain situations do arise where high confidence remember responses turn out to be
false (Arndt, 2012; Roediger & McDermott, 1995). At the very least, these types of errors are
almost certainly less frequent than high confidence or remember errors alone. Future research
may want to investigate when rememberers can trust experiences of high confidence
remembering.
6.4 Continued Questions and Future Directions

125
Although the four experiments reported in this dissertation are largely consistent, they do raise
several important issues for future research. First, and as I have discussed previously (DeSoto,
2011), the exact mechanism through which false alarms arise in the categorized list procedure
remains in question. Dewhurst (2001) proposed a covert generation mechanism at encoding that
leads to failures of source monitoring at study, but it stands to reason from that theory that such
errors would result in high rates of false remembering, as opposed to higher rates of false
knowing and guessing, as was discovered in this study. Rather, it appears that false alarms may
arise due to semantic memory processes at test rather than generation at encoding, which is
consistent with the account proposed by S. M. Smith et al. (2002). According to this account, the
structure of categorized lists guides true and false recognition of category items. This account
also meshes with the theorizing of Tulving (1985), who suggested that know responses reflect
output from semantic memory.
Another goal is better understanding the statements that each of the four types of confidence-
accuracy correlation make about the association between confidence and accuracy in studies.
Although we have argued that these correlations need not agree, it is important to develop this
statement and explore when these correlations agree and when they do not (as well as the relative
frequencies of agreement and disagreement). It would also be worthwhile to determine which
correlations are best for which purposes. For instance, sorting items by within-items gamma
would allow ordering of items from the most deceptive to the least deceptive – this is easier done
with within-items correlations than between-items correlations, for instance, because gamma
provides a single index of deceptiveness. Although this was not done in the studies reported here,
it is a potential analysis for follow-up research. It is likely that resolution for individual items
would correlate well with response frequency.

126
A final and clearly quite important objective for future study is continued evaluation of the
continuous dual-process model. The research presented here largely comes from the
metacognition tradition, so it would be of benefit for researchers wielding traditional signal
detection methods to also investigate the discrepancies reported here; the publications that have
cited the continuous dual-process model generally have not been evaluative in nature. Perhaps
use of other integrative models of signal detection (e.g., the two-stage dynamic signal detection
model, which integrates decisions, response times, and confidence – but not
remember/know/guess judgments – Pleskac & Busemeyer, 2010) would assist.
6.5 Epilogue: Confidence and Accuracy
This line of research began with the central question: What is the relationship between
confidence and accuracy? As a final perspective, I took the average confidence and accuracy for
every subject who participated in Experiments 1 and 2 of DeSoto and Roediger (2014) and
Experiments 2, 3, and 4 of this dissertation – 294 individuals in all. The average confidence and
average accuracy scores of these 294 subjects are depicted in Figure 6.1. As the figure shows, the
correlation between confidence and accuracy with subject as the unit of analysis is modestly
positive, r = .47. A final word could be that confidence and accuracy are related.

127
Figure 6.1: The between-subjects old/new confidence-old/new accuracy correlation across all items in five experiments, N = 294.
As my colleagues and I have shown, however, this relationship is more complex than it appears.
Although a natural reaction to this complexity might be to toss out confidence ratings from
classrooms, courtrooms, and laboratories entirely, confidence ratings are simple, intuitive metrics
that indeed correlate with accuracy a great deal of the time. For the subjective feeling of
confidence to be maximally useful, though, we must be better informed about when we can trust
our feelings of confidence, whether strong or weak.
.00
.25
.50
.75
1.00
0 25 50 75 100
Acc
urac
y
Confidence
r = .47

128
Pairing the remember/know/guess procedure with our prior work on the confidence-accuracy
correlation sheds insight on how qualitative bases of memory (i.e., recollection vs. familiarity;
remembering vs. knowing), when combined with confidence, are able to predict our accuracy. I
have shown that although remembering is more often associated with accurate memories than
knowing, it is also the case that remember responses show a stronger confidence-accuracy
correlation than knows or guesses – a pattern that emerges for both old/new recognition but also
source recognition. Thus, for the rememberer, being able to simulate episodically a prior event is
more telling of a memory’s veridicality than thinking, “I just know I know it,” even when those
episodic details are not relevant to the purpose of retrieval.
In sum, although most of the time our memories are relatively trustworthy, confidence in false
memories can have negative consequences. These consequences range from awkward (thinking
your new colleague’s name is Adam and not Andy) to embarrassing (mixing up the critical result
of a study during a presentation) to terrible (putting an innocent person like Antonio Beaver in
prison for a decade). Integrating remember/know/guess judgments into procedures using
confidence ratings allows simultaneous investigation of the quantitative and qualitative processes
supporting memory retrieval.

129
References
Arndt, J. (2012). False recollection: Empirical findings and their theoretical implications. In B.
H. Ross (Ed.), Psychology of learning and motivation (Vol. 56, pp. 81-124). New York,
NY: Academic Press.
Balota, D. A., & Neely, J. H. (1980). Test-expectancy and word-frequency effects in recall and
recognition. Journal of Experimental Psychology: Human Learning and Memory, 6, 576-
587.
Bartlett, F. C. (1932). Remembering: An experimental and social study. Cambridge, UK:
Cambridge University Press.
Battig, W. F., & Montague, W. E. (1969). Category norms of verbal items in 56 categories: A
replication and extension of the Connecticut category norms. Journal of Experimental
Psychology, 80, 1-46.
Benjamin, A. S. (2001). On the dual effects of repetition on false recognition. Journal of
Experimental Psychology: Learning, Memory, and Cognition, 27, 941-947.
Benjamin, A. S., & Diaz, M. (2008). Measurement of relative metamnemonic accuracy. In J.
Dunlosky & R. A. Bjork (Eds.), Handbook of memory and metamemory (pp. 73-94). New
York, NY: Psychology Press.
Bransford, J. D., & Franks, J. J. (1971). The abstraction of linguistic ideas. Cognitive
Psychology, 2, 331-350.
Brewer, W. F., & Sampaio, C. (2006). Processes leading to confidence and accuracy in sentence
recognition: A metamemory approach. Memory, 14, 540-552.
130
Brewer, W. F., & Sampaio, C. (2012). The metamemory approach to confidence: A test using
semantic memory. Journal of Memory and Language, 67, 59-77.
Brewer, W. F., Sampaio, C., & Barlow, M. R. (2005). Confidence and accuracy in the recall of
deceptive and nondeceptive sentences. Journal of Memory and Language, 52, 618-627.
Castel, A. D. (2007). The adaptive and strategic use of memory by older adults: Evaluated
processing and value-directed remembering. In A. S. Benjamin & B. H. Ross (Eds.), The
psychology of learning and motivation (Vol. 48, pp. 225-270). London, UK: Academic
Press.
Chandler, C. C. (1994). Studying related pictures can reduce accuracy, but increase confidence,
in a modified recognition test. Memory & Cognition, 22, 273-280.
Craver, C. F., Kwan, D. K., Steindam, C., & Rosenbaum, R. S. (2014). Individuals with episodic
amnesia are not stuck in time. Neuropsychologia, 57, 191-195.
Dallenbach, K. M. (1913). The relation of memory error to time interval. Psychological Review,
20, 323-337.
Deese, J. (1959). On the prediction of occurrence of particular verbal intrusions in immediate
recall. Journal of Experimental Psychology, 58, 17-22.
DeSoto, K. A., & Roediger, H. L. (2014). Positive and negative correlations between confidence
and accuracy for the same events in recognition of categorized lists. Psychological
Science, 25, 781-788.
DeSoto, K. A. (2011). Often wrong but never in doubt: Categorized lists produce confident false
memories. Unpublished master’s thesis, Washington University in St. Louis, MO.

131
DeSoto, K. A. (2014). Confidence ratings in cognitive psychology experiments: Investigating the
relationship between confidence and accuracy in memory. SAGE research methods cases.
New York, NY: SAGE Publications.
Dewhurst, S. A. (2001). Category repetition and false recognition: Effects of instance frequency
and category size. Journal of Memory and Language, 44, 153-167.
Dewhurst, S. A., & Anderson, S. J. (1999). Effects of exact and category repetition in true and
false recognition memory. Memory & Cognition, 27, 665-673.
Dewhurst, S. A., & Farrand, P. (2004). Investigating the phenomenological characteristics of
false recognition for categorised words. European Journal of Cognitive Psychology, 16,
403-416.
Dewhurst, S. A., Bould, E., Knott, L. M., & Thorley, C. (2009). The roles of encoding and
retrieval processes in associative and categorical memory illusions. Journal of Memory
and Language, 60, 154-164.
Dobbins, I. G. (2014). Forecasting versus fitting, dissociating versus describing: Celebrating
Larry Jacoby’s methodological approach to understanding recognition. In D. S. Lindsay,
C. M. Kelley, A. P. Yonelinas, & H. L. Roediger (Eds.), Remembering: Attributions,
processes, and control in human memory (pp. 112-132). New York, NY: Psychology
Press.
Dobbins, I. G., Kroll, N. E. A., & Liu, Q. (1998). Confidence-accuracy inversions in scene
recognition: A remember-know analysis. Journal of Experimental Psychology: Learning,
Memory, and Cognition, 24, 1306-1315.
Dobbins, I. G., Kroll, N. E. A., & Yonelinas, A. P. (2004). Dissociating familiarity from
recollection using rote rehearsal. Memory & Cognition, 32, 932-944.

132
Donaldson, W. (1996). The role of decision processes in remembering and knowing. Memory &
Cognition, 24, 523-533.
Dunn, J. C. (2004). Remember-know: A matter of confidence. Psychological Review, 111, 524-
542.
Dunlosky, J., & Metcalfe, J. (2009). Metacognition. New York, NY: SAGE Publications.
Ebbinghaus, H. (1913). Memory: A contribution to experimental psychology. New York, NY:
Teachers College, Columbia University. (Original work published 1885.)
Flavell, J. H. (1979). Metacognition and cognitive monitoring: A new area of cognitive-
developmental inquiry. American Psychologist, 34, 906-911.
Gallo, D. A., McDermott, K. B., Percer, J. M., & Roediger, H. L. (2001). Modality effects in
false recall and false recognition. Journal of Experimental Psychology: Learning,
Memory, and Cognition, 27, 339-353.
Gardiner, J. M. (1988). Functional aspects of recollective experience. Memory & Cognition, 16,
309-313.
Gardiner, J. M., & Java, R. I. (1990). Recollective experience in word and nonword recognition.
Memory & Cognition, 18, 23-30.
Gardiner, J. M., & Java, R. I. (1991). Forgetting in recognition memory with and without
recollective experience. Memory & Cognition, 19, 617-623.
Gardiner, J. M., Java, R. I., & Richardson-Klavehn, A. (1996). How level of processing really
influences awareness in recognition memory. Canadian Journal of Experimental
Psychology, 50, 114-122.
Gardiner, J. M., Ramponi, C., & Richardson-Klavehn, A. (1998). Experiences of remembering,
knowing, and guessing. Consciousness and Cognition, 7, 1-26.

133
Geraci, L., & McCabe, D. P. (2006). Examining the basis for illusory recollection: The role of
remember/know instructions. Psychonomic Bulletin & Review, 13, 466-473.
Geraci, L., McCabe, D. P., & Guillory, J. J. (2009). On interpreting the relationship between
remember-know judgments and confidence: The role of instructions. Consciousness and
Cognition, 18, 701-709.
Gigerenzer, G., Hoffrage, U., & Kleinbölting, H. (1991). Probabilistic mental models: A
Brunswikian theory of confidence. Psychological Review, 98, 506-528.
Hart, J. T. (1965). Memory and the feeling-of-knowing experience. Journal of Educational
Psychology, 56, 208-216.
Hart, J. T. (1967). Memory and the memory-monitoring process. Journal of Verbal Learning and
Verbal Behavior, 6, 685-691.
Hebb, D. O. (1949). The organization of behavior: A neuropsychological theory. New York:
Wiley.
Ingram, K. M., Mickes, L., & Wixted, J. T. (2012). Recollection can be weak and familiarity can
be strong. Journal of Experimental Psychology: Learning, Memory, and Cognition, 38,
325-339.
Jacoby, L. L. (1991). A process dissociation framework: Separating automatic from intentional
uses of memory. Journal of Memory and Language, 30, 513-541.
Jennings, J. M., & Jacoby, L. L. (2003). Improving memory in older adults: Training
recollection. Neuropsychological Rehabilitation, 13, 417-440.
Juslin, P., Olsson, N., & Winman, A. (1996). Calibration and diagnosticity of confidence in
eyewitness identification: Comments on what can be inferred from the low confidence-

134
accuracy correlation. Journal of Experimental Psychology: Learning, Memory, and
Cognition, 22, 1304-1316.
Kahneman, D. (2003). A perspective on judgment and choice: Mapping bounded rationality.
American Psychologist, 58, 697-720.
Kellogg, R. T. (2001). Presentation modality and mode of recall in verbal false memory. Journal
of Experimental Psychology: Human Learning and Memory, 27, 913-919.
King, J. F., Zechmeister, E. B., Shaughnessy, J. J. (1980). Judgments of knowing: The influence
of retrieval practice. The American Journal of Psychology, 93, 329-343.
Knott, L. M., Dewhurst, S. A., & Howe, M. L. (2012). What factors underlie associative and
categorical memory illusions? The roles of backward associative strength and interitem
connectivity. Journal of Experimental Psychology: Learning, Memory, and Cognition,
38, 229-239.
Koriat, A. (2008). Subjective confidence in one’s answers: The consensuality principle. Journal
of Experimental Psychology: Learning, Memory, and Cognition, 34, 945-959.
Koriat, A. (2012). The self-consistency model of subjective confidence. Psychological Review,
119, 80-113.
Koriat, A., & Goldsmith, M. (1996). Monitoring and control processes in the strategic regulation
of memory accuracy. Psychological Review, 103, 490-517.
Koriat, A., & Sorka, H. (2015). The construction of categorization judgments: Using subjective
confidence and response latency to test a distributed model. Cognition, 134, 21-38.
Lichtenstein, S., Fischhoff, B., & Phillips, L. D. (1982). Calibration of probabilities: The state of
the art to 1980. In H. Jungermann & G. De Zeeuw (Eds.), Decision making and change in
human affairs. Amsterdam: D. Reidel.

135
Lindsay, D. S., Kelley, C. M., Yonelinas, A. P., & Roediger, H. L. (2014). Remembering:
Attributions, processes, and control in human memory. New York, NY: Psychology
Press.
Lockhart, R. S., & Murdock, B. B. (1970). Memory and the theory of signal detection.
Psychological Bulletin, 74, 100-109.
McCabe, D. P., & Geraci, L. (2009). The influence of instructions and terminology on the
accuracy of remember-know judgments. Consciousness and Cognition, 18, 401-413.
McDaniel, M. A., & Bugg, J. M. (2008). Instability in memory phenomena: A common puzzle
and a unifying explanation. Psychonomic Bulletin & Review, 15, 237-255.
McDermott, K. B., & Roediger, H. L. (1998). Attempting to avoid illusory memories: Robust
false recognition of associates persists under conditions of explicit warnings and
immediate testing. Journal of Memory and Language, 39, 508-520.
McDermott, K. B. (2006). Paradoxical effects of testing: Repeated retrieval attempts enhance the
likelihood of later accurate and false recall. Memory & Cognition, 34, 261-267.
Meade, M. L., & Roediger, H. L. (2006). The effect of forced recall on illusory recollection in
younger and older adults. American Journal of Psychology, 119, 433-462.
Meade, M. L., & Roediger, H. L. (2009). Age differences in collaborative memory: The role of
retrieval manipulations. Memory & Cognition, 37, 962-975.
Mickes, L., Seale-Carlisle, T. M., & Wixted, J. T. (2014). Rethinking familiarity:
Remember/know judgments in free recall. Journal of Memory and Language, 68, 333-
349.

136
Mickes, L., Wais, P. E., & Wixted, J. T. (2009). Recollection is a continuous process:
Implications for dual-process theories of recognition memory. Psychological Science, 20,
509-515.
Mulligan, N. W., Besken, M., & Peterson, D. (2010). Remember-know and source memory
instructions can qualitatively change old-new recognition accuracy: The modality-match
effect in recognition memory. Journal of Experimental Psychology: Learning, Memory,
and Cognition, 36, 558-566.
Münsterberg, H. (1908). On the witness stand: Essays on psychology and crime. New York, NY:
Doubleday.
Neil v. Biggers, 409 U.S. 188 (1972).
Nelson, T. O. (1984). A comparison of current measures of the accuracy of feeling-of-knowing
predictions. Psychological Bulletin, 95, 109-133.
Nelson, T. O., & Narens, L. (1990). Metamemory: A theoretical framework and some new
findings. In G. H. Bower (Ed.), The psychology of learning and motivation (Vol. 26, pp.
125-173). San Diego, CA: Academic Press.
Odinot, G., Wolters, G., & van Koppen, P. J. (2008). Eyewitness memory of a supermarket
robbery: A case study of accuracy and confidence after three months. Law and Human
Behavior, 33, 506-514.
Park, L., Shobe, K. K., & Kihlstrom, J. F. (2005). Associative and categorical relations in the
associative memory illusion. Psychological Science, 16, 792-797.
Peirce, C. S., & Jastrow, J. (1885). On small differences in sensation. Memoirs of the National
Academy of Sciences, 3, 73-83.

137
Pierce, B. H., Gallo, D. A., Weiss, J. A., & Schacter, D. L. (2005). The modality effect in false
recognition: Evidence for test-based monitoring. Memory & Cognition, 33, 1407-1413.
Pleskac, T. J., & Busemeyer, J. R. (2010). Two-stage dynamic signal detection: A theory of
choice, decision time, and confidence. Psychological Review, 117, 864-901.
Rajaram, S. (1993). Remembering and knowing: Two means of access to the personal past.
Memory & Cognition, 21, 89-102.
Roberts, W. R. (1924/1984). Rhetorica. In W. D. Ross (Ed.), The works of Aristotle translated
into English. Oxford, UK: Clarendon Press.
Roediger, H. L. (1996). Memory illusions. Journal of Memory and Language, 35, 76-100.
Roediger, H. L., & DeSoto, K. A. (2014a). Confidence in memory: Assessing positive and
negative correlations. Memory, 22, 76-91
Roediger, H. L., & DeSoto, K. A. (2014b). Forgetting the presidents. Science, 346, 1106-1109.
Roediger, H. L., & DeSoto, K. A. (2014c). Understanding the relation between confidence and
accuracy in reports from memory. In D. S. Lindsay, C. M. Kelley, A. P. Yonelinas, & H.
L. Roediger (Eds.), Remembering: Attributions, processes, and control in human
memory: Papers in honor of Larry L. Jacoby. New York, NY: Psychology Press.
Roediger, H. L., & DeSoto, K. A. (2015). Psychology of reconstructive memory. In J. D. Wright
(Ed.), International encyclopedia of social and behavioral sciences, 2e. Oxford, UK:
Elsevier.
Roediger, H. L., & McDermott, K. B. (1995). Creating false memories: Remembering words not
presented in lists. Journal of Experimental Psychology: Learning, Memory, and
Cognition, 21, 803.
138
Roediger, H. L., Wixted, J. T., & DeSoto, K. A. (2012). The curious complexity between
confidence and accuracy in reports from memory. In L. Nadel & W. Sinnott-Armstrong
(Eds.), Memory and law (pp. 84-118). Oxford, UK: Oxford University Press.
Rotello, C. M., & Zeng, M. (2008). Analysis of RT distributions in the remember-know
paradigm. Psychonomic Bulletin & Review, 15, 825-832.
Sampaio, C., & Brewer, W. F. (2009). The role of unconscious memory errors in judgments of
confidence for sentence recognition. Memory & Cognition, 37, 158-163.
Selmeczy, D., & Dobbins, I. G. (2013). Metacognitive awareness and adaptive recognition
biases. Journal of Experimental Psychology: Learning, Memory, and Cognition, 39, 678-
690.
Simons, D. J., & Chabris, C. F. (2011). What people believe about how memory works: A
representative survey of the U.S. population. PLoS ONE, 6.
Sloman, S. A. (1996). The empirical case for two systems of reasoning. Psychological Bulletin,
119, 3-22.
Slotnick, S. D., Jeye, B. M., & Dodson, C. S. (2014). Recollection is a continuous process:
Evidence from plurality memory receiver operating characteristics. Memory. doi:
10.1080/09568211.2014.971033
Smith, R. E., & Hunt, R. R. (1998). Presentation modality affects false memory. Psychononomic
Bulletin & Review, 5, 710-715.
Smith, R. E., Hunt, R. R., & Gallagher, M. P. (2008). The effect of study modality on false
recognition. Memory & Cognition, 36, 1439-1449.
139
Smith, S. M., Gerkens, D. R., Pierce, B. H., & Choi, H. (2002). The roles of associative
responses at study and semantically guided recollection at test in false memory: The
Kirkpatrick and Deese hypotheses. Journal of Memory and Language, 47, 436-447.
Smith, S. M., Tindell, D. R., Pierce, B. H., Gilliland, T. R., & Gerkens, D. R. (2001). The use of
source memory to identify one’s own episodic confusion errors. Journal of Experimental
Psychology: Learning, Memory, and Cognition, 27, 362-374.
Smith, S. M., Ward, T. B., Tindell, D. R., Sifonis, C. M., & Wilkenfeld, M. J. (2000). Category
structure and created memories. Memory & Cognition, 28, 386-395.
Smith, V. L., Kassin, S. M., & Ellsworth, P. C. (1989). Eyewitness accuracy and confidence:
Within- versus between-subjects correlations. Journal of Applied Psychology, 74, 356-
359.
Suantak, L., Bolger, F., & Ferrell, W. R. (1996). The hard-easy effect in subjective probability
calibration. Organizational Behavior and Human Decision Processes, 67, 201-221.
Tulving, E. (1972). Episodic and semantic memory. In E. Tulving & W. Donaldson (Eds.),
Organization of Memory (pp. 382-402). New York, NY: Academic Press.
Tulving, E. (1981). Similarity relations in recognition. Journal of Verbal Learning and Verbal
Behavior, 20, 479-496.
Tulving, E. (1985). Memory and consciousness. Canadian Psychology, 26, 1-12.
Tulving, E., & Madigan, S. A. (1970). Memory and verbal learning. Annual Review of
Psychology, 21, 437-484.
Tversky, A., & Kahneman, D. (1974). Judgment under uncertainty: Heuristics and biases.
Science, 185, 1124-1131.

140
Van Overschelde, J. P., Rawson, K. A., & Dunlosky, J. (2004). Category norms: An updated and
expanded version of the Battig and Montague (1969) norms. Journal of Memory and
Language, 50, 289-335.
Weinstein, Y. (2012). Flash programming for the social and behavioral sciences: A
sophisticated guide to online surveys and experiments. Thousand Oaks, CA: SAGE.
Wixted, J. T., & Mickes, L. (2010). A continuous dual-process model of remember/know
judgments. Psychological Review, 117, 1025-1054.
Wixted, J. T., Mickes, L., Clark, S. E., Gronlund, S. D., & Roediger, H. L. (2014). The changing
story of eyewitness confidence and the validity of identification. The Police Chief, 81,
14-15.
Yonelinas, A. P. (2002). The nature of recollection and familiarity: A review of 30 years of
research. Journal of Memory and Language, 46, 441-517.
Yonelinas, A. P., Goodrich, R. I., & Borders, A. A. (2014). Dissociating processes within
recognition, perception, and working memory. In D. S. Lindsay, C. M. Kelley, A. P.
Yonelinas, & H. L. Roediger (Eds.), Remembering: Attributions, processes, and control
in human memory (pp. 83-97). New York, NY: Psychology Press.
Yonelinas, A. P., & Parks, C. M. (2007). Receiver operating characteristics (ROCs) in
recognition memory: A review. Psychological Bulletin, 133, 800-832.
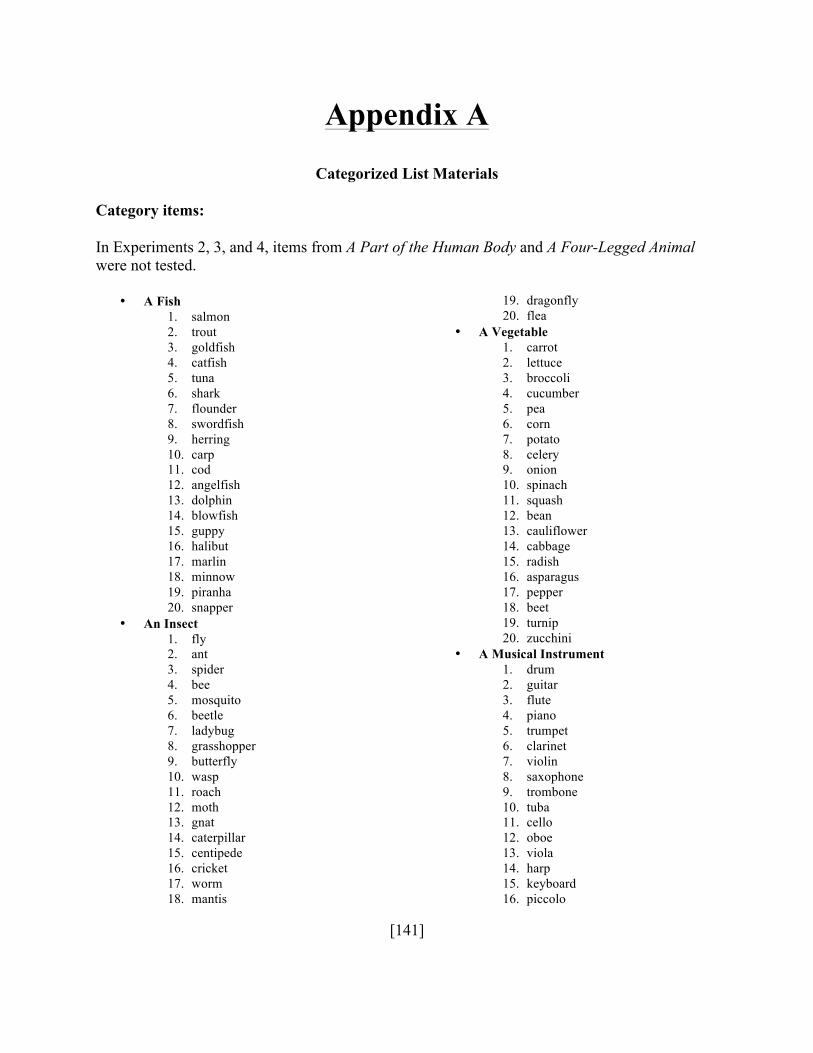
[141]
Appendix A
Categorized List Materials Category items: In Experiments 2, 3, and 4, items from A Part of the Human Body and A Four-Legged Animal were not tested.
• A Fish 1. salmon 2. trout 3. goldfish 4. catfish 5. tuna 6. shark 7. flounder 8. swordfish 9. herring 10. carp 11. cod 12. angelfish 13. dolphin 14. blowfish 15. guppy 16. halibut 17. marlin 18. minnow 19. piranha 20. snapper
• An Insect 1. fly 2. ant 3. spider 4. bee 5. mosquito 6. beetle 7. ladybug 8. grasshopper 9. butterfly 10. wasp 11. roach 12. moth 13. gnat 14. caterpillar 15. centipede 16. cricket 17. worm 18. mantis
19. dragonfly 20. flea
• A Vegetable 1. carrot 2. lettuce 3. broccoli 4. cucumber 5. pea 6. corn 7. potato 8. celery 9. onion 10. spinach 11. squash 12. bean 13. cauliflower 14. cabbage 15. radish 16. asparagus 17. pepper 18. beet 19. turnip 20. zucchini
• A Musical Instrument 1. drum 2. guitar 3. flute 4. piano 5. trumpet 6. clarinet 7. violin 8. saxophone 9. trombone 10. tuba 11. cello 12. oboe 13. viola 14. harp 15. keyboard 16. piccolo

[142]
17. banjo 18. harmonica 19. cymbal 20. tambourine
• A Bird 1. eagle 2. robin 3. bluejay 4. cardinal 5. hawk 6. bluebird 7. crow 8. hummingbird 9. parrot 10. sparrow 11. pigeon 12. seagull 13. dove 14. parakeet 15. falcon 16. canary 17. owl 18. ostrich 19. penguin 20. raven
• An Article of Clothing 1. shirt 2. pants 3. sock 4. underwear 5. shoe 6. hat 7. shorts 8. jacket 9. sweater 10. skirt 11. jeans 12. coat 13. dress 14. glove 15. sweatshirt 16. scarf 17. blouse 18. tie 19. belt 20. undershirt
• A Weather Phenomenon 1. tornado 2. hurricane 3. rain 4. snow 5. hail 6. flood
7. lightning 8. blizzard 9. earthquake 10. sleet 11. monsoon 12. thunder 13. tsunami 14. wind 15. storm 16. typhoon 17. drought 18. cloud 19. sunshine 20. drizzle
• A Sport 1. football 2. basketball 3. soccer 4. baseball 5. tennis 6. hockey 7. swimming 8. golf 9. volleyball 10. lacrosse 11. track 12. rugby 13. softball 14. skiing 15. cheerleading 16. running 17. gymnastics 18. polo 19. racquetball 20. wrestling
• An Occupation or Profession 1. doctor 2. teacher 3. lawyer 4. nurse 5. professor 6. accountant 7. psychologist 8. dentist 9. engineer 10. secretary 11. manager 12. cook 13. firefighter 14. policeman 15. athlete 16. banker 17. carpenter

[143]
18. janitor 19. scientist 20. student
• A Fruit 1. apple 2. orange 3. banana 4. grape 5. pear 6. peach 7. strawberry 8. kiwi 9. pineapple 10. watermelon 11. tomato 12. plum 13. grapefruit 14. mango 15. cherry 16. lemon 17. blueberry 18. cantaloupe 19. raspberry 20. lime
• A Part of the Human Body 1. leg 2. arm 3. finger 4. head 5. toe 6. eye 7. hand 8. nose 9. ear
10. foot 11. mouth 12. stomach 13. heart 14. knee 15. neck 16. brain 17. hair 18. elbow 19. shoulder 20. chest
• A Four-Footed Animal 1. dog 2. cat 3. horse 4. lion 5. bear 6. tiger 7. cow 8. elephant 9. deer 10. mouse 11. pig 12. rat 13. giraffe 14. squirrel 15. rabbit 16. goat 17. zebra 18. moose 19. sheep 20. cheetah
Unrelated lures:
In Experiments 2, 3, and 4, the items in italics were not tested.
• adjective • aluminum • amethyst • anaconda • aspen • axe • barge • battleship • bazooka • blender • brass • butter • cabin
• cabinet • cave • cedar • chapel • cobra • coffee • conjunction • cousin • curry • daughter • day • decade • denim

[144]
• diamond • dogwood • essay • father • ferry • fleece • flyer • futon • garnet • gin • governor • grass • grenade • igloo • iris • island • kayak • ketchup • kilometer • ladle • lawnmower • lead • letter • level • lilac • liquor • magazine • mansion • mayor • micrometer • mile • milk • millimeter • minute • monastery • nail • nanosecond • nickel • niece • noun • nylon • oil • opal • ottoman • palm • pamphlet • petunia
• pick • pitchfork • plow • preposition • president • pronoun • python • raft • rattlesnake • recliner • rifle • river • rock • rose • rum • sanctuary • sander • sapphire • screwdriver • senator • shovel • soda • sofa • son • spruce • stove • sugar • sword • synagogue • temple • tent • tongs • townhouse • treasurer • velvet • vinegar • violet • viper • vodka • week • whisk • whiskey • wine • wool • wrench • yard • zinc
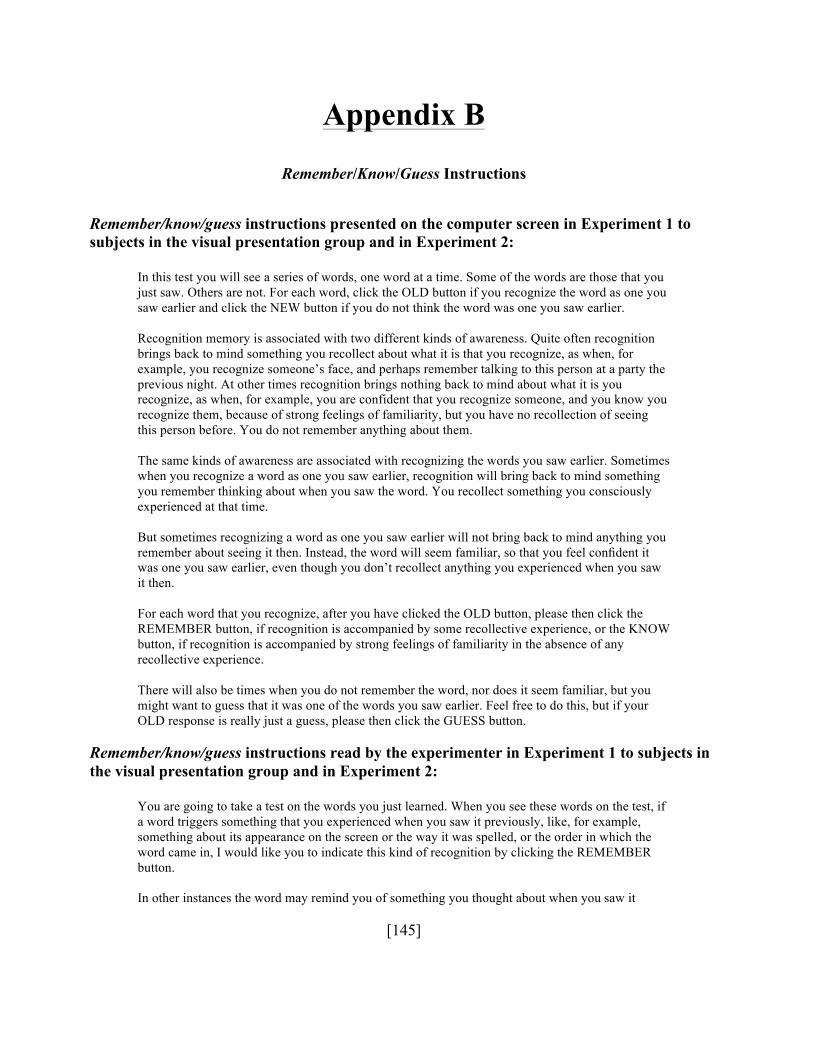
[145]
Appendix B
Remember/Know/Guess Instructions
Remember/know/guess instructions presented on the computer screen in Experiment 1 to subjects in the visual presentation group and in Experiment 2:
In this test you will see a series of words, one word at a time. Some of the words are those that you just saw. Others are not. For each word, click the OLD button if you recognize the word as one you saw earlier and click the NEW button if you do not think the word was one you saw earlier. Recognition memory is associated with two different kinds of awareness. Quite often recognition brings back to mind something you recollect about what it is that you recognize, as when, for example, you recognize someone’s face, and perhaps remember talking to this person at a party the previous night. At other times recognition brings nothing back to mind about what it is you recognize, as when, for example, you are confident that you recognize someone, and you know you recognize them, because of strong feelings of familiarity, but you have no recollection of seeing this person before. You do not remember anything about them. The same kinds of awareness are associated with recognizing the words you saw earlier. Sometimes when you recognize a word as one you saw earlier, recognition will bring back to mind something you remember thinking about when you saw the word. You recollect something you consciously experienced at that time. But sometimes recognizing a word as one you saw earlier will not bring back to mind anything you remember about seeing it then. Instead, the word will seem familiar, so that you feel confident it was one you saw earlier, even though you don’t recollect anything you experienced when you saw it then. For each word that you recognize, after you have clicked the OLD button, please then click the REMEMBER button, if recognition is accompanied by some recollective experience, or the KNOW button, if recognition is accompanied by strong feelings of familiarity in the absence of any recollective experience. There will also be times when you do not remember the word, nor does it seem familiar, but you might want to guess that it was one of the words you saw earlier. Feel free to do this, but if your OLD response is really just a guess, please then click the GUESS button.
Remember/know/guess instructions read by the experimenter in Experiment 1 to subjects in the visual presentation group and in Experiment 2:
You are going to take a test on the words you just learned. When you see these words on the test, if a word triggers something that you experienced when you saw it previously, like, for example, something about its appearance on the screen or the way it was spelled, or the order in which the word came in, I would like you to indicate this kind of recognition by clicking the REMEMBER button. In other instances the word may remind you of something you thought about when you saw it

[146]
previously, like an association that you made to the word, or an image that you formed when you saw the word, or something of personal significance that you associated with the word; again if you can recollect any of these aspects of when the word was first presented I would like you to click the REMEMBER button. Instead, at other times you will see a word and you will recognize it as one you saw earlier, but the word will not bring back to mind anything you remember about seeing it then, the word will just seem extremely familiar. When you feel confident that you saw the word earlier, even though you do not recollect anything you experienced when you aw it, I would like you to indicate this kind of recognition by clicking the KNOW button. With know responses you are sure about seeing the word earlier but cannot remember the circumstances in which the word was presented, or the thoughts elicited when the word was presented. With a guess response, you think it possible that you saw the word but you are not sure that you did. For some reason, you think there was a chance that you saw the word. Some people say ‘‘it looks like one of those words that I could have possibly seen.’’ When you think your response was really just a guess, I would like you to click the GUESS button.
Trial prompts for Experiment 2:
Is the word above OLD or NEW?
How confident are you that the answer you just provided is correct?
Do you REMEMBER, KNOW, or GUESS that the answer was OLD?
Recognition instructions for Experiment 3:
In this test you will see a series of words, one word at a time. Some of the words are those that you just read. Others are not. For each word, click the TOP LEFT button if you recognize the word as one you read in the top left of the screen, BOTTOM RIGHT if you saw it in the bottom right, and NEW button if you do not think the word was one you read earlier. You will then rate your confidence in your decision on a scale from 0 (not at all confident) to 100 (entirely confident). When you say an item is OLD (by clicking TOP LEFT or BOTTOM RIGHT), you will also judge whether you REMEMBER, KNOW, or GUESS that the item is OLD. Next, we describe what those terms mean. Recognition memory is associated with two different kinds of awareness. Quite often recognition brings back to mind something you recollect about what it is that you recognize, as when, for example, you recognize someone’s face, and perhaps remember talking to this person at a party the previous night. At other times recognition brings nothing back to mind about what it is you recognize, as when, for example, you are confident that you recognize someone, and you know you recognize them, because of strong feelings of familiarity, but you have no recollection of seeing this person before. You do not remember anything about them. The same kinds of awareness are associated with recognizing the words you read earlier. Sometimes when you recognize a word as one you read earlier, recognition will bring back to mind something you remember thinking about when you read the word. You recollect something you consciously experienced at that time.

[147]
But sometimes recognizing a word as one you read earlier will not bring back to mind anything you remember about hearing it then. Instead, the word will seem familiar, so that you feel confident it was one you read earlier, even though you don’t recollect anything you experienced when you read it then. For each word that you recognize, please then click the REMEMBER button if recognition is accompanied by some recollective experience, or the KNOW button if recognition is accompanied by strong feelings of familiarity in the absence of any recollective experience. There will also be times when you do not remember the word, nor does it seem familiar, but you might want to guess that it was one of the words you read earlier. Feel free to do this, but if your response is really just a guess, please then click the GUESS button.
Trial prompts for Experiment 3: Was the word presented in the TOP LEFT, BOTTOM RIGHT, or NEW? How confident are you that the answer you just provided is correct? Do you REMEMBER, KNOW, or GUESS that the word was OLD? Study instructions for Experiment 4:
You are going to be presented with 10 word lists, each containing words from a different category. You will first see the name of the category, then each word in the category. Please try your best to learn the words you read. The words will appear in different locations on the screen -- either in the top left of the screen, or the bottom right. Please try your best to remember the location in which word appears. After you have studied all the list items, you will be tested on your memory for each word and your memory for the location on the screen in which each word was presented. You will not need to recall the category names.
Old/new recognition and confidence instructions for Experiment 4:
In this test you will see a series of words, one word at a time. Some of the words are those that you just read. Others are not. For each word, click the OLD button if you recognize the word as one you read earlier, and click the NEW button if you do not think the word was one you read earlier. You will then rate your confidence in your decision about whether the word was old or new on a scale from 0 (not at all confident) to 100 (entirely confident).
Source instructions for Experiment 4:
You will be asked to make additional decisions for words to which you responded OLD. For each word, click the TOP LEFT button if you recognize the word as one you read in the top left of the screen and BOTTOM RIGHT if you saw it in the bottom right. You will then rate your confidence in your decision about whether the word was in the top left or bottom right on a scale from 0 (not at all confident) to 100 (entirely confident).
Remember/know/guess instructions for Experiment 4:

[148]
You will be asked to make additional decisions for words to which you responded OLD. For each word, judge whether you REMEMBER, KNOW, or GUESS that the item is OLD: Recognition memory is associated with two different kinds of awareness. Often, recognition brings back to mind something you recollect about what it is that you recognize, as when, for example, you recognize someone’s face, and perhaps remember talking to this person at a party the previous night. At other times recognition brings nothing back to mind about what it is you recognize, as when, for example, you know you recognize someone because of feelings of familiarity, but you have no recollection of seeing this person before. You do not remember anything about them. The same kinds of awareness are associated with recognizing the words you read earlier. Sometimes when you recognize a word as one you read earlier, recognition will bring back to mind something you remember thinking about when you read the word. You recollect something you consciously experienced at that time. But sometimes recognizing a word as one you read earlier will not bring back to mind anything you remember about hearing it then. Instead, the word will seem familiar, so that you feel it was one you read earlier, even though you don’t recollect anything you experienced when you read it then. Please click the REMEMBER button if recognition is accompanied by some recollective experience, or the KNOW button if recognition is accompanied by strong feelings of familiarity in the absence of any recollective experience. There will also be times when you do not remember the word but you guessed that it was one of the words you read earlier. If your response was really just a guess, click the GUESS button.
Trial prompts for Experiment 4: Is the word OLD or NEW? Was the word presented in the TOP LEFT or BOTTOM RIGHT?
How confident are you about your old/new decision? How confident are you about your top/bottom decision? Do you REMEMBER, KNOW, or GUESS that the word was old?

[149]
Appendix C
Logistic Regression Analyses
Experiment 1
One additional way to examine the relationship between responding and accuracy is through logistic regression. Using logistic regression allows prediction of accuracy as a function of whether a remember, know, or guess was provided in conjunction with the recognition decision. Although these equations are trivial in the case of Experiment 1, I still present them for descriptive purposes and build off of them in the analyses for the subsequent experiments. The overall regression prediction equation is: ln 𝑜𝑑𝑑𝑠 !"##$!% = 2.50 𝑟𝑒𝑚𝑒𝑚𝑏𝑒𝑟 + 1.00 𝑘𝑛𝑜𝑤 + 0(𝑔𝑢𝑒𝑠𝑠)− .48
Thus, the logistic regression prediction equations for remember, know, and guess judgments are as follows: ln(𝑜𝑑𝑑𝑠)!"##$!!!"#"#$"! = 2.02
ln 𝑜𝑑𝑑𝑠 !"##$!!!"#$ = .52
ln(𝑜𝑑𝑑𝑠)!"##$!!!"#$$ = −.48
To convert from log odds to the odds ratio, the antilog function is used. 𝑜𝑑𝑑𝑠!"##$!!!"#"#$"! = exp 2.02 = 7.54
𝑜𝑑𝑑𝑠!"##$!!!"#$ = exp(.52) = 1.68
𝑜𝑑𝑑𝑠!"##$!!!"#$$ = exp(−.48) = .62
To get the predicted probability of a correct response, the odds are divided by 1 + the odds.

[150]
𝑝!"##$!!!"#"#$"! = !.!"!.!"
= .88
𝑝!"##$!!!"#$ = !.!"!.!"
= .63
𝑝!"##$!!!"#$$ = .!"!.!"
= .38
Note that these probabilities align with the accuracy values presented in Figure 2.3, as expected.
Experiment 2
These are the logistic regression equations that predict accuracy as a function of confidence and remember/know/guess judgment in Experiment 2: ln(𝑜𝑑𝑑𝑠)!"##$!!!"#"#$"! = −2.95+ .05(𝑐𝑜𝑛𝑓𝑖𝑑𝑒𝑛𝑐𝑒)
ln 𝑜𝑑𝑑𝑠 !"##$!!!"#$ = −1.90+ .03(𝑐𝑜𝑛𝑓𝑖𝑑𝑒𝑛𝑐𝑒)
ln(𝑜𝑑𝑑𝑠)!"##$!!!"#$$ = −1.04+ .01(𝑐𝑜𝑛𝑓𝑖𝑑𝑒𝑛𝑐𝑒)
These equations show that the degree that confidence contributes to the log odds depends on whether the subject is remembering, knowing, or guessing – and indeed, this interaction is significant in the model, p < .001. Because the accuracy prediction varies as a function of confidence, however, point predictions are not possible. Instead, this relationship can be shown in the following figure. Note its similarity in appearance to Figure 3.4.

[151]
Figure C.1: Predicted accuracy (via logistic regression) as a function of remember, know, or guess judgment and confidence rating in Experiment 2.
Experiment 3
These are the logistic regression equations that predict old/new accuracy as a function of confidence and remember/know/guess judgment in Experiment 2: ln(𝑜𝑑𝑑𝑠)!"##$!!!"#"#$"! = −1.38+ .04(𝑐𝑜𝑛𝑓𝑖𝑑𝑒𝑛𝑐𝑒)
ln(𝑜𝑑𝑑𝑠)!"##$!!!!"# = −.98+ .02(𝑐𝑜𝑛𝑓𝑖𝑑𝑒𝑛𝑐𝑒)
.00
.25
.50
.75
1.00
0 10 20 30 40 50 60 70 80 90 100
Pred
icte
d A
ccur
acy
Confidence
Remember Know Guess
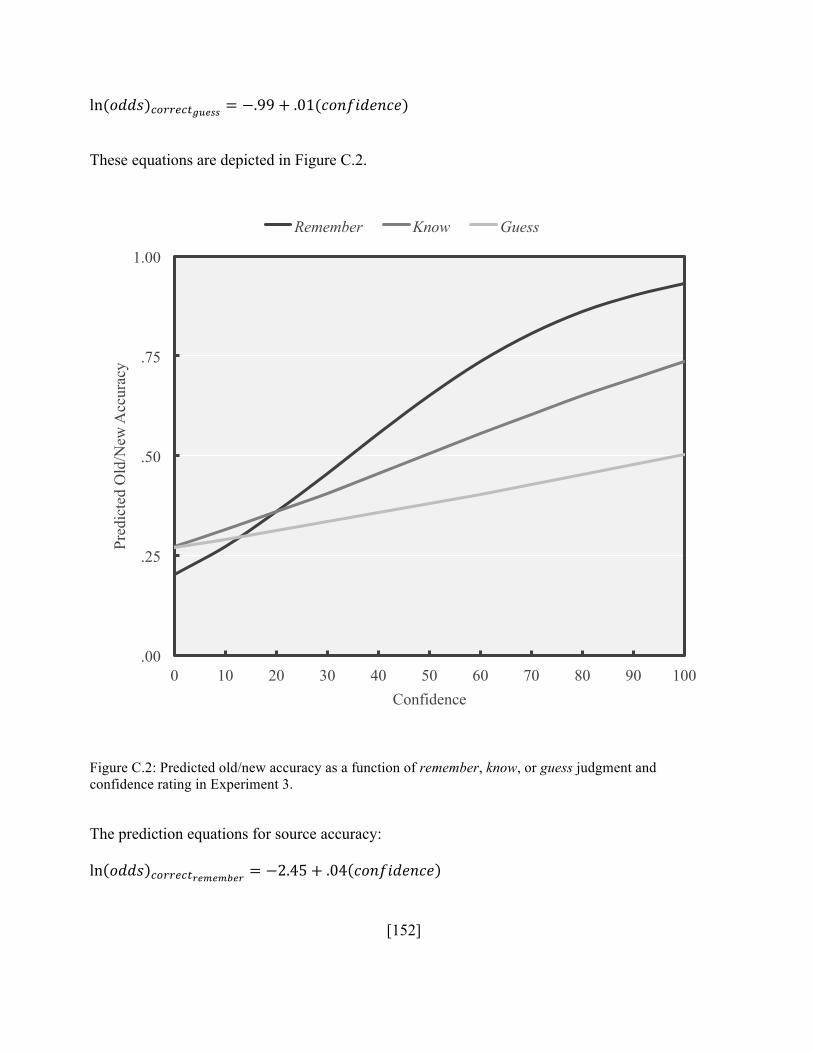
[152]
ln(𝑜𝑑𝑑𝑠)!"##$!!!"#$$ = −.99+ .01(𝑐𝑜𝑛𝑓𝑖𝑑𝑒𝑛𝑐𝑒)
These equations are depicted in Figure C.2.
Figure C.2: Predicted old/new accuracy as a function of remember, know, or guess judgment and confidence rating in Experiment 3.
The prediction equations for source accuracy: ln 𝑜𝑑𝑑𝑠 !"##$!!!"#"#$"! = −2.45+ .04 𝑐𝑜𝑛𝑓𝑖𝑑𝑒𝑛𝑐𝑒
.00
.25
.50
.75
1.00
0 10 20 30 40 50 60 70 80 90 100
Pred
icte
d O
ld/N
ew A
ccur
acy
Confidence
Remember Know Guess

[153]
ln 𝑜𝑑𝑑𝑠 !"##$!!!"#$ = −2.09+ .03 𝑐𝑜𝑛𝑓𝑖𝑑𝑒𝑛𝑐𝑒
ln(𝑜𝑑𝑑𝑠)!"##$!!!"#$$ = −1.87+ .01(𝑐𝑜𝑛𝑓𝑖𝑑𝑒𝑛𝑐𝑒)
These equations are depicted in Figure C.3. Note the similarities in performance between remember and know judgments.
Figure C.3: Predicted source accuracy as a function of remember, know, or guess judgment and confidence rating in Experiment 3.
Overall, an inspection of these two sets of equations shows that they are quite similar, from a descriptive standpoint. Performance is lower for source accuracy than old/new accuracy – hence
.00
.25
.50
.75
1.00
0 10 20 30 40 50 60 70 80 90 100
Pred
icte
d So
urce
Acc
urac
y
Confidence
Remember Know Guess

[154]
the lower intercepts in the second set of equations – but the contribution of confidence to the odds remains approximately the same in all cases – for remember responses, confidence was a greater predictor of eventual accuracy than know, and know more than guess, for both old/new and source confidence.
Experiment 4
In Experiment 4, it was possible to construct logistic regression equations using remember/know/guess, old/new confidence, and source confidence as a predictor of both old/new and source accuracy. For the old/new accuracy prediction equations: ln 𝑜𝑑𝑑𝑠 !!""#$!!"#"#$"!!"#$%&
= −2.79+ .03 𝑐𝑜𝑛𝑓𝑖𝑑𝑒𝑛𝑐𝑒!"#$%& + .02(𝑐𝑜𝑛𝑓𝑖𝑑𝑒𝑛𝑐𝑒!"#$%&)
ln 𝑜𝑑𝑑𝑠 !"##$!!!"#$!"#$%& = −2.56+ .04 𝑐𝑜𝑛𝑓𝑖𝑑𝑒𝑛𝑐𝑒!"#$%& + .01(𝑐𝑜𝑛𝑓𝑖𝑑𝑒𝑛𝑐𝑒!"#$%&)
ln 𝑜𝑑𝑑𝑠 !"##$!!!"#$$!"#$%&= −1.45+ .02 𝑐𝑜𝑛𝑓𝑖𝑑𝑒𝑛𝑐𝑒!"#$%&
These cannot be graphed easily because they include two different variables as predictors. When predicting source accuracy, the following equations are obtained: ln 𝑜𝑑𝑑𝑠 !"##$!!!"#"#$"!!"#$%&
= −3.78+ .03 𝑐𝑜𝑛𝑓𝑖𝑑𝑒𝑛𝑐𝑒!"#$%& + .03(𝑐𝑜𝑛𝑓𝑖𝑑𝑒𝑛𝑐𝑒!"#$%&)
ln 𝑜𝑑𝑑𝑠 !"##$!!!"#$!"#$%& = −3.71+ .03 𝑐𝑜𝑛𝑓𝑖𝑑𝑒𝑛𝑐𝑒!"#$%& + .02(𝑐𝑜𝑛𝑓𝑖𝑑𝑒𝑛𝑐𝑒!"#$%&)
ln 𝑜𝑑𝑑𝑠 !"##$!!!"#$$!"#$%&= −2.13+ .01 𝑐𝑜𝑛𝑓𝑖𝑑𝑒𝑛𝑐𝑒!"#$%&
These equations appear very similar; the coefficients for old/new confidence and source confidence are approximately similar regardless of whether old/new accuracy or source accuracy is the outcome variable. In all these cases, however, the contribution of confidence is numerically greater in a state of remembering than knowing, and knowing than guessing.

[155]
Appendix D
Confidence-Accuracy Correlation Tables for Experiment 4
Table D.1: Old/new confidence-old/new accuracy correlations by group for the three item types in Experiment 4. Between-units correlations calculated using Pearson r, within-units correlations calculated with Goodman-Kruskal γ. *p < .05 **p < .01
Between-Subjects Group A Group B Group C Group D
Targets .19** -.66** .61** .62**
Related Lures .27** -.01** .18** .20**
Unrelated Lures .68** -.21** .54** .45**
Between-Events
Targets -.30** -.49** -.54** .49**
Related Lures -.04** -.16** -.08** .00**
Unrelated Lures -.48** -.12** -.15** .31**
Within-Subjects
Targets .60** -.64** .60** .59**
Related Lures .09** -.05** .06** .08**
Unrelated Lures .46** -.27** .28** .26**
Within-Events
Targets .51** -.62** .61** .65**
Related Lures .11** -.05** .05** .03**
Unrelated Lures .54** -.16** .30** .25**

[156]
Table D.2: Old/new confidence-old/new accuracy correlations by group for the three response types in Experiment 4. Between-units correlations calculated using Pearson r, within-units correlations calculated with Goodman-Kruskal γ. Due to counterbalancing, within-events correlations could not be calculated. *p < .05 **p < .01
Between-Subjects Group A Group B Group C Group D
Remember .72** .57** .83** .69**
Know .56** .64** .81** .75**
Guess .18** .20** .40** .31**
Between-Events
Remember .61** .59** .72** .64**
Know .61** .49** .69** .64**
Guess .49** .06** .30** .34**
Within-Subjects
Remember .41** .48** .54** .49**
Know .62** .26** .48** .31**
Guess .31** .16** .21** .18**

[157]
Table D.3: Source confidence-source accuracy correlations by group for the three response types in Experiment 4. Between-units correlations calculated using Pearson r, within-units correlations calculated with Goodman-Kruskal γ. Due to counterbalancing, within-events correlations could not be calculated. *p < .05 **p < .01
Between-Subjects Group A Group B Group C Group D
Remember .77** .83** .69** .78**
Know .57** .69** .52** .66**
Guess .00** .08** .12** .52**
Between-Events
Remember .73** -.75** .61** .72**
Know .45** -.29** .46** .61**
Guess .37** -.01** .03** .13**
Within-Subjects
Remember .34** .43** .26** -.48**
Know .30** .19** .25** -.30**
Guess .13** .03** .12** -.04**

[158]
K. Andrew DeSoto’s Curriculum Vitae
EDUCATION
Washington University in St. Louis, MO (WUSTL; 2009 – 2015)
• Ph.D. in Psychology, concentration in Behavior, Brain, & Cognition (2015)
• Dissertation: “When can we trust our confident memories? Effects of qualitative and quantitative bases of memory on the confidence-accuracy correlation.”
• M.A. in Psychology, concentration in Behavior, Brain, & Cognition (2011)
• Master’s thesis: “Often wrong but never in doubt: Categorized lists produce confident false memories.”
• Major professor: Henry L. Roediger, III
The College of William & Mary, Williamsburg, VA (2005 – 2009)
• B.S. in Psychology with High Honors, Minor in Computer Science (2009)
• Honors thesis: “Eye movements while zoning out during reading: Implications for mind wandering and metaconsciousness.”
The Thomas Jefferson High School for Science and Technology, Alexandria, VA (2005)
RESEARCH INTERESTS
• Metacognition and metamemory
• Collective and autobiographical memory, memory studies
• Meta-science, methodology, statistics
• The relationship between cognitive psychology and technology
HONORS AND AWARDS
• Dissertation Research Award, American Psychological Association (2014)
• Dissertation Research Award, WUSTL Department of Psychology (2014)
• Dean's Dissertation Fellowship (2014 – 2015)
• Second Place in Social Sciences, WUSTL Annual Graduate Research Symposium (2014)
• Recipient, Society for Computers in Psychology Birnbaum Award (2013)

[159]
• Recipient, Lee and Ann Liberman Graduate Fellowship (2011)
• Honorable Mention, National Science Foundation Graduate Research Fellowship Program (2010)
• WUSTL University Fellowship (2009 – 2010)
• Dean's List, William & Mary (2007 – 2009)
PUBLICATIONS
• Roediger, H. L., & DeSoto, K. A. (2015). The psychology of reconstructive memory. In J. Wright (Ed.), International encyclopedia of the social and behavioral sciences, 2e. Oxford, UK: Elsevier.
• DeSoto, K. A. (2014). Collecting confidence ratings in cognitive psychology experiments: Investigating the relationship between confidence and accuracy in memory. In SAGE research methods cases. Thousand Oaks, CA: SAGE Publications. doi:10.4135/978144627305013507683
• DeSoto, K. A., & Roediger, H. L. (2014). Positive and negative correlations between confidence and accuracy for the same events in recognition of categorized lists. Psychological Science, 25, 781-788. doi:10.1177/0956797613516149
• Roediger, H. L., & DeSoto, K. A. (2014). Confidence in memory: Assessing positive and negative correlations. Memory, 22, 76-91. doi:10.1080/09658211.2013.795974
• Roediger, H. L., & DeSoto, K. A. (2014). Understanding the relation between confidence and accuracy in reports from memory. In D. S. Lindsay, C. M. Kelley, A. P. Yonelinas, & H. L. Roediger (Eds.), Remembering: Attributions, processes, and control in human memory (pp. 347-367). New York, NY: Psychology Press.
• Roediger, H. L., & DeSoto, K. A. (2014). Forgetting the presidents. Science, 346, 1106-1109. doi:10.1126/science.1259627
• Roediger, H. L., Wixted, J. T., & DeSoto, K. A. (2012). The curious complexity between confidence and accuracy in reports from memory. In L. Nadel & W. Sinnott-Armstrong (Eds.), Memory and law (pp. 84-118). Oxford, UK: Oxford University Press. doi:10.1093/acprof:oso/9780199920754.001.0001
TEACHING
• Instructor, Flash Programming for Psychology (2013)
• Instructor, Human Learning and Memory (2012)
• Teaching Assistant, Introduction to Social Psychology (2011)

[160]
• Teaching Assistant, Human Learning and Memory (2010)
• Supervisor, Mind/Brain/Behavior and Independent Study/Honors Undergraduate Projects (2010 – 2015)
• Participant, WUSTL Teaching Citation Program (2010 – 2014)
PRESENTATIONS
• National Conferences
o Roediger, H. L., & DeSoto, K. A. (2014, November). Forgetting the presidents. Talk given at the 55th Meeting of the Psychonomic Society, Long Beach, CA.
o DeSoto, K. A. (2013, November). Collecting confidence ratings in cognitive psychology experiments: Effects of scale and entry method. Poster presented at the Meeting of the Society for Computers in Psychology, Toronto, Ontario, Canada.
o DeSoto, K. A., & Roediger, H. L. (2013, November). Effects of study and test repetitions on false memory for category items. Poster presented at the 54th Meeting of the Psychonomic Society, Toronto, Ontario, Canada.
o DeSoto, K. A., Nestojko, J. F., & Roediger, H. L. (2012, November). Effects of free recall testing on immediate and delayed recognition. Poster presented at the 53rd Meeting of the Psychonomic Society, Minneapolis, MN.
o DeSoto, K. A., & Roediger, H. L. (2012, May). Effects of repeated study and test on recognition memory for categorized lists. Poster presented at the 24th Meeting of the Association for Psychological Science, Chicago, IL.
o DeSoto, K. A., & Roediger, H. L. (2010, November). Confidence and accuracy in recognition memory: positive, negative, and zero correlations. Poster presented at the 51st Meeting of the Psychonomic Society, St. Louis, MO.
o Weinstein, Y., & DeSoto, K. A. (2010, November). Teaching Flash programming for psychology. Poster presented at the 40th Meeting of the Society for Computers in Psychology, St. Louis, MO.
o DeSoto, K. A., & Roediger, H. L. (2010, May). The confidence-accuracy correlation. Poster presented at the 22nd Meeting of the Association for Psychological Science, Boston, MA.
o Ball, C. T., & DeSoto, K. A. (2009, November). Eye movements while zoning out during reading. Paper presented at the 50th Meeting of the Psychonomic Society, Boston, MA.
• Regional and Local Conferences
o DeSoto, K. A., & Roediger, H. L. (2014, February). Collective memory for U.S.
[161]
presidents. Poster presented at the Washington University in St. Louis Graduate Research Symposium, St. Louis, MO.
o Roediger, H. L., & DeSoto, K. A. (2013, May). Confidence and accuracy in reports from memory: Obtaining positive and negative correlations. Paper presented at the Festschrift in Honor of Larry Jacoby, St. Louis, MO.
o DeSoto, K. A. (2011, May). Often wrong but never in doubt: Effects of category typicality on false memory and confidence ratings. Talk given at the Midwestern Psychological Association Conference, Chicago, IL.
o DeSoto, K. A. (2011, February). Often wrong but never in doubt: Typicality relates to confident false memories. Poster presented at the Washington University in St. Louis Graduate Research Symposium, St. Louis, MO.
o DeSoto, K. A. (2010, June). Driving factors of the confidence-accuracy correlation. Paper presented at the Show Me Mental Life Conference, St. Louis, MO.
o DeSoto, K. A. (2010, February). The confidence-accuracy correlation: implications for eyewitness and basic psychological research. Poster presented at the Washington University in St. Louis Graduate Research Symposium, St. Louis, MO.
EDITORIAL ACTIVITIES
• Reviewer, Cognition
• Reviewer, Translational Issues in Psychological Science
• Reviewer, The Psychological Record
• Reviewer, Psychology & Neuroscience
DEPARTMENT, UNIVERSITY, and COMMUNITY SERVICE
• Graduate Student Colloquium Chair, WUSTL Psychology Graduate Student Association (PGSA; 2012 – 2013)
• Campus Representative, Association for Psychological Science Student Caucus (APSSC; 2011 – 2013)
• Membership and Volunteers Officer, APSSC Executive Board (2010 – 2011)
• Social Chair, WUSTL PGSA (2010 – 2011)