WHEELCHAIR PROPULSION ANALYSIS By Liyun Guo...
100
DEVELOPMENT AND TESTING OF A BIOFEEDBACK SYSTEM FOR WHEELCHAIR PROPULSION ANALYSIS By Liyun Guo Dissertation Submitted to the Faculty of the Graduate School of Vanderbilt University In partial fulfillment of the requirements For the degree of DOCTOR OF PHILOSOPHY in MECHANICAL ENGINEERING May, 2012 Nashville, Tennessee Approved: Professor Nilanjan Sarkar Doctor Mark Richter Professor Michael Goldfarb Professor Robert J. Webster, III Professor Paul H. King
Transcript of WHEELCHAIR PROPULSION ANALYSIS By Liyun Guo...
DEVELOPMENT AND TESTING OF A BIOFEEDBACK SYSTEM FOR
WHEELCHAIR PROPULSION ANALYSIS
By
Liyun Guo
Dissertation
Submitted to the Faculty of the
Graduate School of Vanderbilt University
In partial fulfillment of the requirements
For the degree of
DOCTOR OF PHILOSOPHY
in
MECHANICAL ENGINEERING
May, 2012
Nashville, Tennessee
Approved:
Professor Nilanjan Sarkar
Doctor Mark Richter
Professor Michael Goldfarb
Professor Robert J. Webster, III
Professor Paul H. King

ACKNOWLEDGEMENTS
I would first like to thank my advisor, Dr. Nilanjan Sarkar and Dr.
Mark Richter, for their continuous support, excellent advice and constant
encouragement during the time I have been a graduate student at Vanderbilt
University. I also want to thank Max-Mobility for providing me this research
project opportunity.
I am grateful for all of the support that I have received from my family. I
have wonderful and supportive parents who have always encouraged me in
pursuit of my goals. I am also extremely grateful for my wife as she has patiently
supported and encouraged me during my time in graduate school. Without their
support, none of this would have been possible.
I have had the pleasure to work with many outstanding students and
workers in the past 5 years, including Yandong Gao, Yu Tian and Jiashu Sun of
Mechanical Engineering at Vanderbilt University, present and past workers of
Max-Mobility: Adam Karpinski, Russell Rodriguez, Maureen Ann Linden, Andy,
Josh, Ben et al. Last, I would like to thank all wheelchair subjects that
participated in this research.

To my beloved wife, Xing, infinitely supportive
iii
TABLE OF CONTENTS
Page
ACKNOWLEDGEMENTS ......................................................................................ii
Table of Contents ................................................................................................. iii
LIST OF TABLES .................................................................................................vi
LIST OF FIGURES ............................................................................................. viii
I INTRODUCTION ............................................................................................. 1
1.1 Background and motivation ................................................................ 1
1.2 Manual wheelchair propulsion measurement ..................................... 2
1.3 Biofeedback ........................................................................................ 6
1.4 Needs analysis ................................................................................... 9
II THE OPTIPUSH SYSTEM design and validation ......................................... 11
2.1 OptiPush Wheel Components and Structure .................................... 11
2.1.1 Force Sensor ............................................................................. 13
2.1.2 Angle Sensor ............................................................................. 14
2.1.3 Bluetooth module ....................................................................... 15
2.1.4 Printed Circuit Board ................................................................. 16
2.2 OptiPush Software ............................................................................ 20
2.2.1 Bluetooth setting ........................................................................ 21
2.2.2 Offset Removing ........................................................................ 21
2.2.3 Variables ................................................................................... 23
2.2.4 Biofeedback ............................................................................... 27
iv
2.3 System validation.............................................................................. 28
2.3.1 Wheel angle validation .............................................................. 29
2.3.2 Speed validation ........................................................................ 29
2.3.3 Force and Torque validation ...................................................... 31
2.4 Conclusion ........................................................................................ 37
III TESTING THE OPTIPUSH BIOFEEDBACK SYSTEM ............................... 39
3.1 Methods ............................................................................................ 39
3.1.1 Participants ................................................................................ 39
3.1.2 Data Collection .......................................................................... 40
3.1.3 Single-Variable Biofeedback ..................................................... 41
3.1.4 Data Analysis ............................................................................. 44
3.2 Results .............................................................................................. 44
3.2.1 Participants ................................................................................ 44
3.2.2 Viability of Biofeedback ............................................................. 44
3.3 Discussion ........................................................................................ 46
3.4 Conclusions ...................................................................................... 49
IV MULTIVARIABLE BIOFEEDBACK DESIGN & TESTING ........................... 50
4.1 Multivariable biofeedback design ...................................................... 51
4.2 Multivariable biofeedback testing ...................................................... 54
4.2.1 Subjects ..................................................................................... 54
4.2.2 Data Collection .......................................................................... 55
4.2.3 Data Analysis ............................................................................. 59
4.3 Results .............................................................................................. 62

v
4.3.1 Participants ................................................................................ 62
4.3.2 Effects of Education and Multivariable Biofeedback .................. 62
4.4 Discussion ........................................................................................ 64
4.5 Conclusion ........................................................................................ 67
V CONCLUSION AND FUTURE DIRECTIONS .............................................. 68
5.1 Project summary ............................................................................... 68
5.2 System application ............................................................................ 68
5.3 Future Directions .............................................................................. 71
5.4 Conclusion ........................................................................................ 73
Appendix A: MAIN VI FRONT PANEL ................................................................ 75
Appendix B OPTIPUSH TESTING REPORT...................................................... 77
Appendix C TREADMILL VALIDATION .............................................................. 78
REFERENCE LIST ............................................................................................. 84
vi
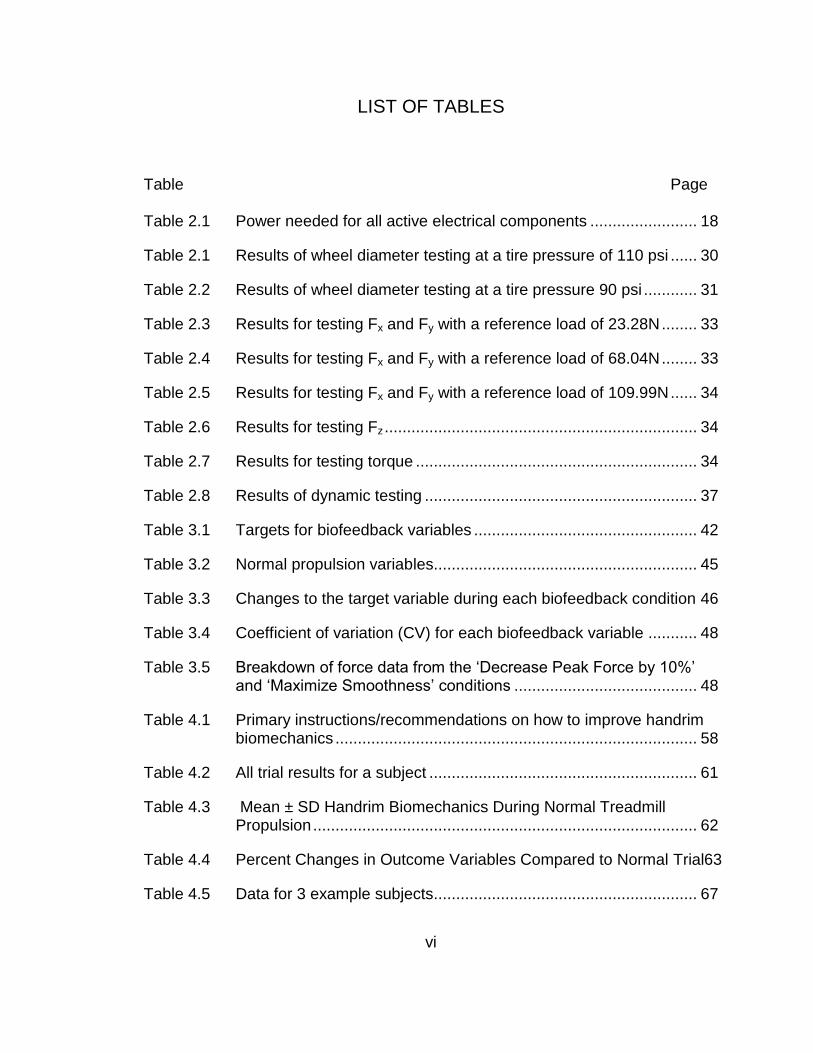
LIST OF TABLES
Table Page
Table 2.1 Power needed for all active electrical components ........................ 18
Table 2.1 Results of wheel diameter testing at a tire pressure of 110 psi ...... 30
Table 2.2 Results of wheel diameter testing at a tire pressure 90 psi ............ 31
Table 2.3 Results for testing Fx and Fy with a reference load of 23.28N ........ 33
Table 2.4 Results for testing Fx and Fy with a reference load of 68.04N ........ 33
Table 2.5 Results for testing Fx and Fy with a reference load of 109.99N ...... 34
Table 2.6 Results for testing Fz ...................................................................... 34
Table 2.7 Results for testing torque ............................................................... 34
Table 2.8 Results of dynamic testing ............................................................. 37
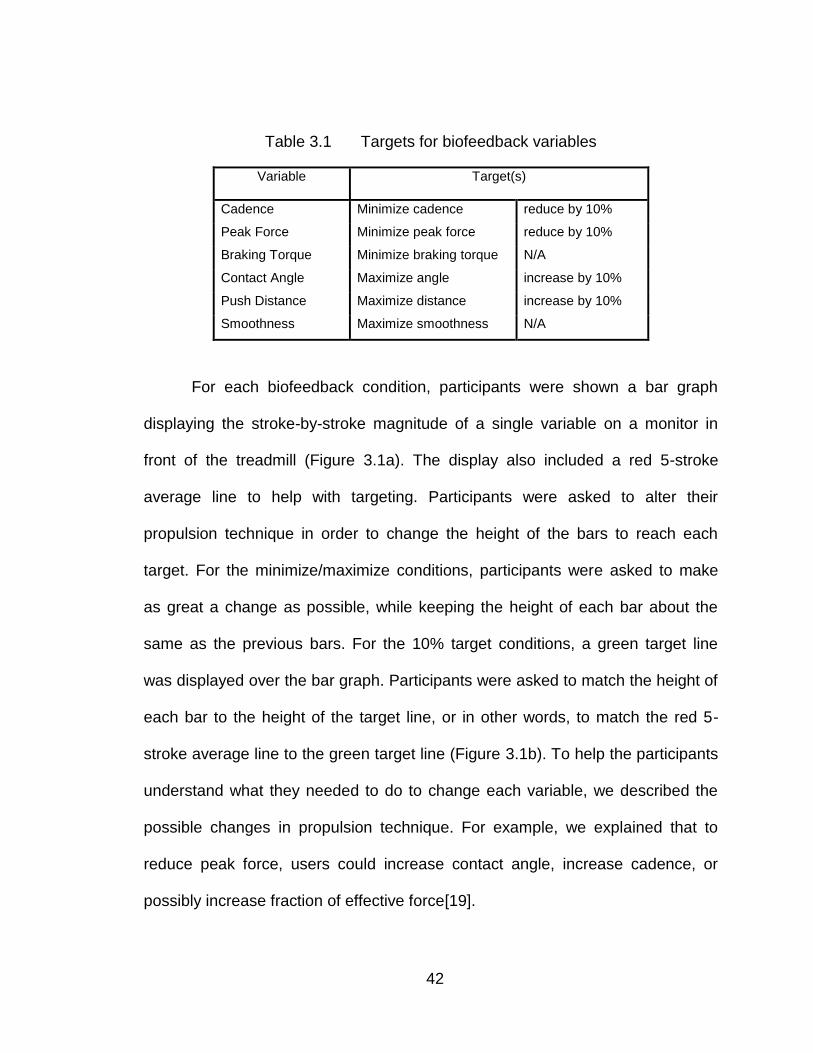
Table 3.1 Targets for biofeedback variables .................................................. 42
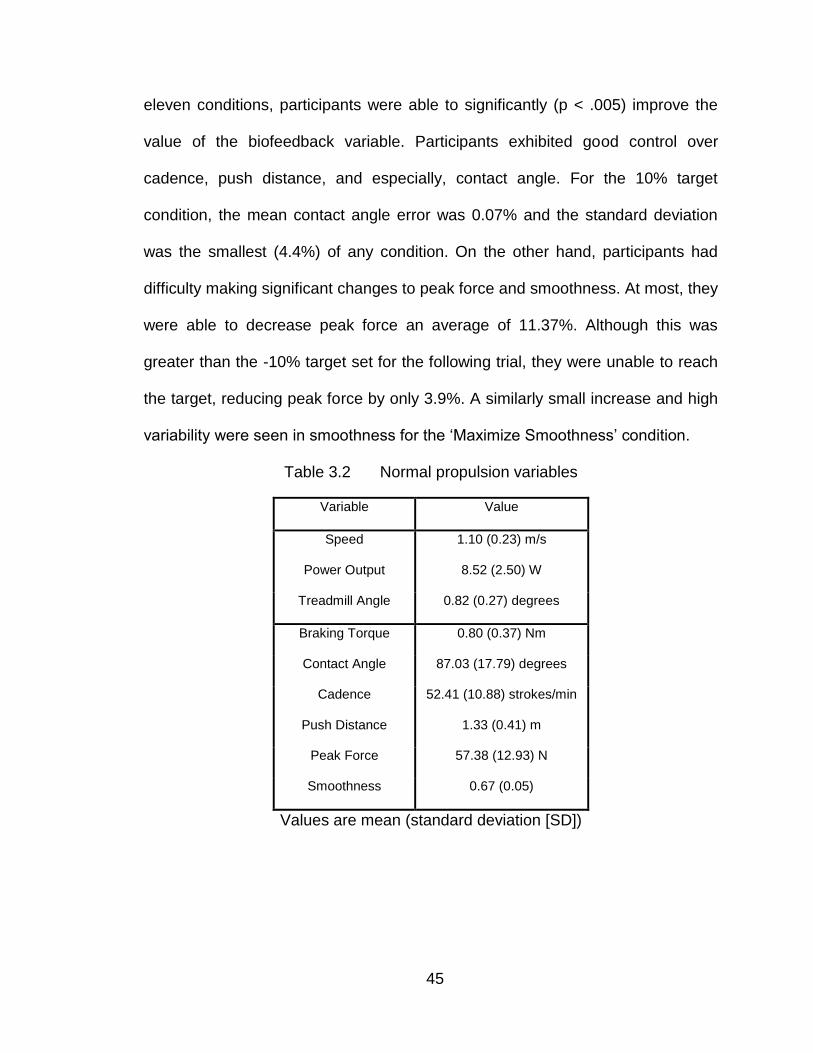
Table 3.2 Normal propulsion variables ........................................................... 45
Table 3.3 Changes to the target variable during each biofeedback condition 46
Table 3.4 Coefficient of variation (CV) for each biofeedback variable ........... 48
Table 3.5 Breakdown of force data from the „Decrease Peak Force by 10%‟ and „Maximize Smoothness‟ conditions ......................................... 48
Table 4.1 Primary instructions/recommendations on how to improve handrim biomechanics ................................................................................. 58
Table 4.2 All trial results for a subject ............................................................ 61
Table 4.3 Mean ± SD Handrim Biomechanics During Normal Treadmill Propulsion ...................................................................................... 62
Table 4.4 Percent Changes in Outcome Variables Compared to Normal Trial63
Table 4.5 Data for 3 example subjects ........................................................... 67

vii
Table 5.1 Comparison of propulsion variables between overground and treadmill ......................................................................................... 69
Table 5.2 Users of OptiPush Biofeedback System ........................................ 71

viii
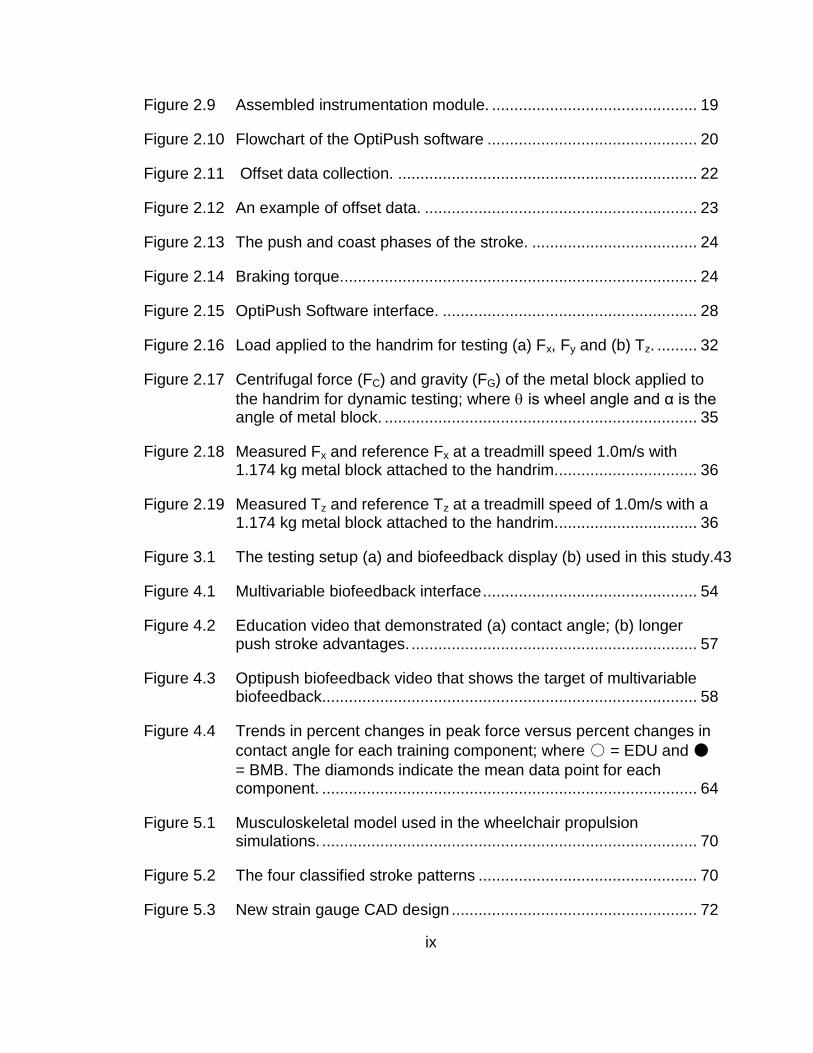
LIST OF FIGURES
Figure Page
Figure 1.1 Schematic drawing of the instrumented wheel described by de Groot et al.[7]. .................................................................................. 2
Figure 1.2 The Mayo Clinic‟s instrumented wheel. ............................................ 3
Figure 1.3 The SmartWheel. ............................................................................ 4
Figure 1.4 The wired version of MAX Mobility‟s propulsiometer. ....................... 4
Figure 1.5 The wireless version of the MAX Mobility with (A) and without (B) attachment of the electrical components and handrim. .................... 5
Figure 1.6 Screen showing the velocity and FEF feedback given to the subjects. ........................................................................................... 7
Figure 1.7 Wheelchair dynamometer with feedback on velocity, power output, and FEF. .......................................................................................... 8
Figure 1.8 SmartWheel biofeedback interface. ................................................. 9
Figure 2.1 Assembly of the OptiPush wheel showing (a) the instrumentation module; (b) the attachment of the handrim and triangle to the IM; (c) the attachment of the wheel to the IMand (d) the OptiPush wheel on the wheelchair. ............................................................................... 12
Figure 2.2 Applied force and torque vector on load cell. ................................. 13
Figure 2.3 Absolute magnetic shaft encoder. .................................................. 15
Figure 2.4 The absolute output of the encoder. .............................................. 15
Figure 2.5 Bluetooth module. .......................................................................... 16
Figure 2.6 Circuit diagram for manipulating load cell output signal; where Vsgn and Vref are the output voltages of the load cell from one channel. 16
Figure 2.7 Circuit diagram for 5V resource by using TL431. ........................... 18
Figure 2.8 Printed circuit board. ...................................................................... 19
ix
Figure 2.9 Assembled instrumentation module. .............................................. 19
Figure 2.10 Flowchart of the OptiPush software ............................................... 20
Figure 2.11 Offset data collection. ................................................................... 22
Figure 2.12 An example of offset data. ............................................................. 23
Figure 2.13 The push and coast phases of the stroke. ..................................... 24
Figure 2.14 Braking torque. ............................................................................... 24
Figure 2.15 OptiPush Software interface. ......................................................... 28
Figure 2.16 Load applied to the handrim for testing (a) Fx, Fy and (b) Tz. ......... 32
Figure 2.17 Centrifugal force (FC) and gravity (FG) of the metal block applied to
the handrim for dynamic testing; where is wheel angle and α is the angle of metal block. ...................................................................... 35
Figure 2.18 Measured Fx and reference Fx at a treadmill speed 1.0m/s with 1.174 kg metal block attached to the handrim................................ 36
Figure 2.19 Measured Tz and reference Tz at a treadmill speed of 1.0m/s with a 1.174 kg metal block attached to the handrim................................ 36
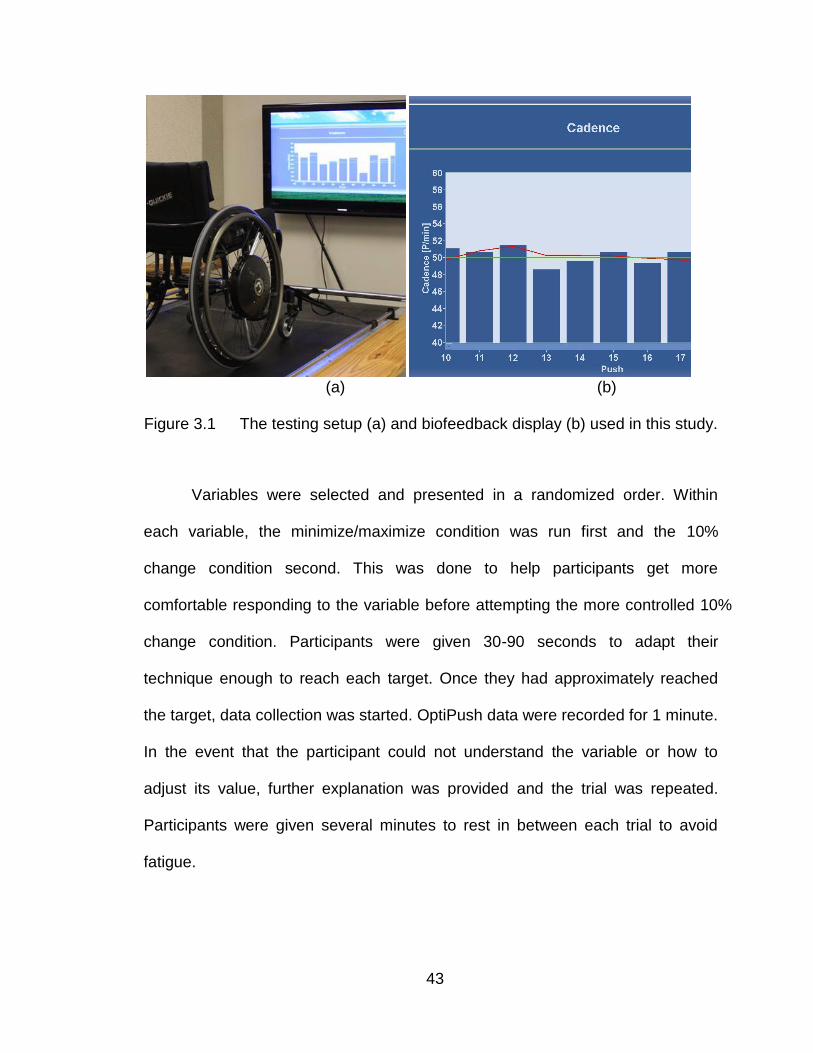
Figure 3.1 The testing setup (a) and biofeedback display (b) used in this study.43
Figure 4.1 Multivariable biofeedback interface ................................................ 54
Figure 4.2 Education video that demonstrated (a) contact angle; (b) longer push stroke advantages. ................................................................ 57
Figure 4.3 Optipush biofeedback video that shows the target of multivariable biofeedback .................................................................................... 58
Figure 4.4 Trends in percent changes in peak force versus percent changes in
contact angle for each training component; where ○ = EDU and ●
= BMB. The diamonds indicate the mean data point for each component. .................................................................................... 64
Figure 5.1 Musculoskeletal model used in the wheelchair propulsion simulations. .................................................................................... 70
Figure 5.2 The four classified stroke patterns ................................................. 70
Figure 5.3 New strain gauge CAD design ....................................................... 72

x
Figure 5.4 The non-linearity near 0V and 5V output ....................................... 73
Figure A-1 Interface of OptiPush software settings. (a) Bluetooth port selection; (b) Bluetooth connection; (c) Client information; (d) Wheel offset removal. ......................................................................................... 75
Figure A-2 Biofeedback interface of OptiPush software .................................. 76
1
CHAPTER I
INTRODUCTION
1.1 Background and motivation
Studies have shown that the manual wheelchair propulsion often results in
pain and injury in the upper extremity (UE). In a study of 239 manual wheelchair
users, Sie et al. found that 64% patients with paraplegia reported UE pain or
injury, most commonly at the shoulder[1]. The presence of UE pain and injury
can severely impact mobility, independence, and the quality of life. Wheelchair
handrim propulsion technique has been found to be an important factor in
explaining UE pain and injury[2-4]. Little is known about how wheelchair users
push, how to optimally propel a wheelchair and how to change wheelchair user‟s
propulsionn pattern to the optimized propulsion. The main reason for the lack of
information is the lack of comprehensive research tools for assessing and
improving wheelchair propulsion. A new research tool as developed here, which
can both measure wheelchair propulsion and provide critical feedback to users
and clinicians, can be used to optimize propulsion technique and hopefully delay
or prevent the development of the UE pain and injury.
2
1.2 Manual wheelchair propulsion measurement
As the study of manual wheelchair propulsion has progressed over the
past 2 decades, so too have the tools used to measure handrim biomechanics.
Van der Woude and colleagues began studying wheelchair propulsion using a
stationary barber chair with test wheels attached[5] and later, in 1990, with a
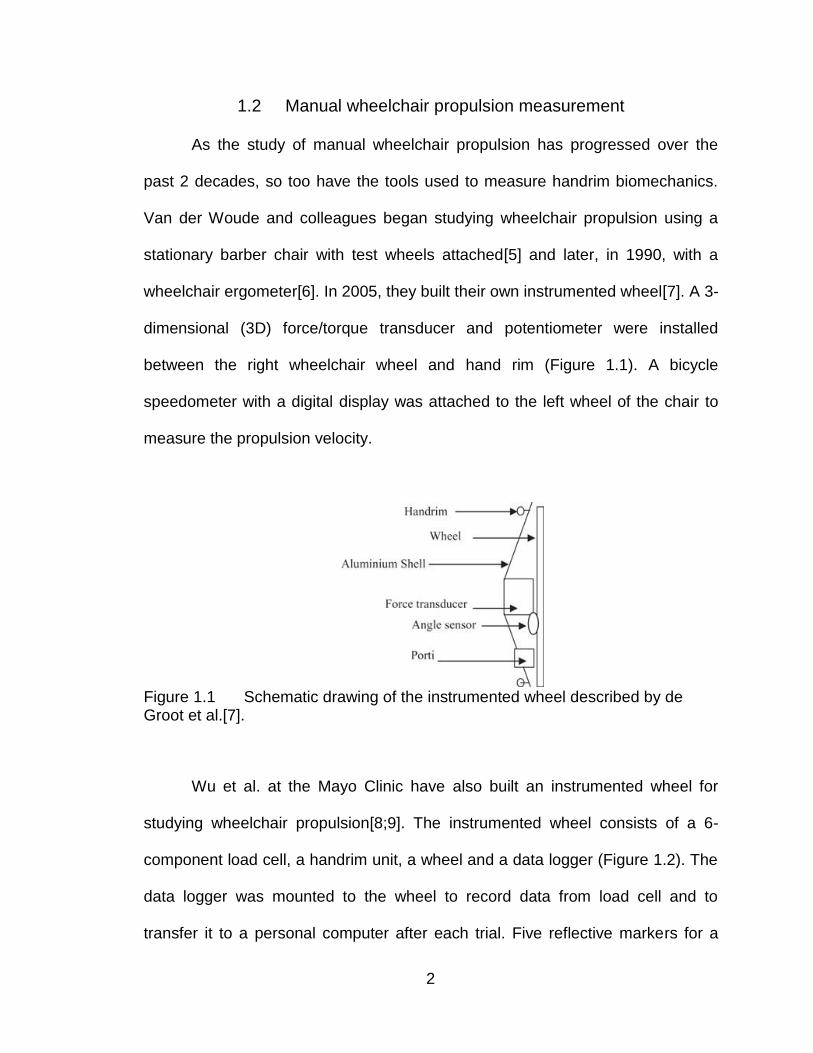
wheelchair ergometer[6]. In 2005, they built their own instrumented wheel[7]. A 3-
dimensional (3D) force/torque transducer and potentiometer were installed
between the right wheelchair wheel and hand rim (Figure 1.1). A bicycle
speedometer with a digital display was attached to the left wheel of the chair to
measure the propulsion velocity.
Figure 1.1 Schematic drawing of the instrumented wheel described by de Groot et al.[7].
Wu et al. at the Mayo Clinic have also built an instrumented wheel for
studying wheelchair propulsion[8;9]. The instrumented wheel consists of a 6-
component load cell, a handrim unit, a wheel and a data logger (Figure 1.2). The
data logger was mounted to the wheel to record data from load cell and to
transfer it to a personal computer after each trial. Five reflective markers for a

3
video-based motion system were placed on the face plate to determine the
orientation and the position of the wheel.
Figure 1.2 The Mayo Clinic‟s instrumented wheel.
Perhaps the most well-known and widely used instrumented wheelchair
wheel, developed by Dr. Rory Cooper and his team at the University of
Pittsburgh, is the SmartWheel[10;10-12]. The SmartWheel measures 3D forces
and torques applied to the handrim using 3 instrumented beams, mounted 120
apart, which connect the handrim to the wheel. Each beam is fitted with two
strain gauge bridges that detect deflection of the beam during handrim loading.
An optical encoder is used to determine the position of the beams. All the signals
are interfaced to an analog-to-digital board and then transferred wirelessly to a
computer. In 2000, the SmartWheel was brought to market. (Figure 1.3) Since
that time, the SmartWheel has been used by a number of researchers to study
manual wheelchair propulsion[13-15].
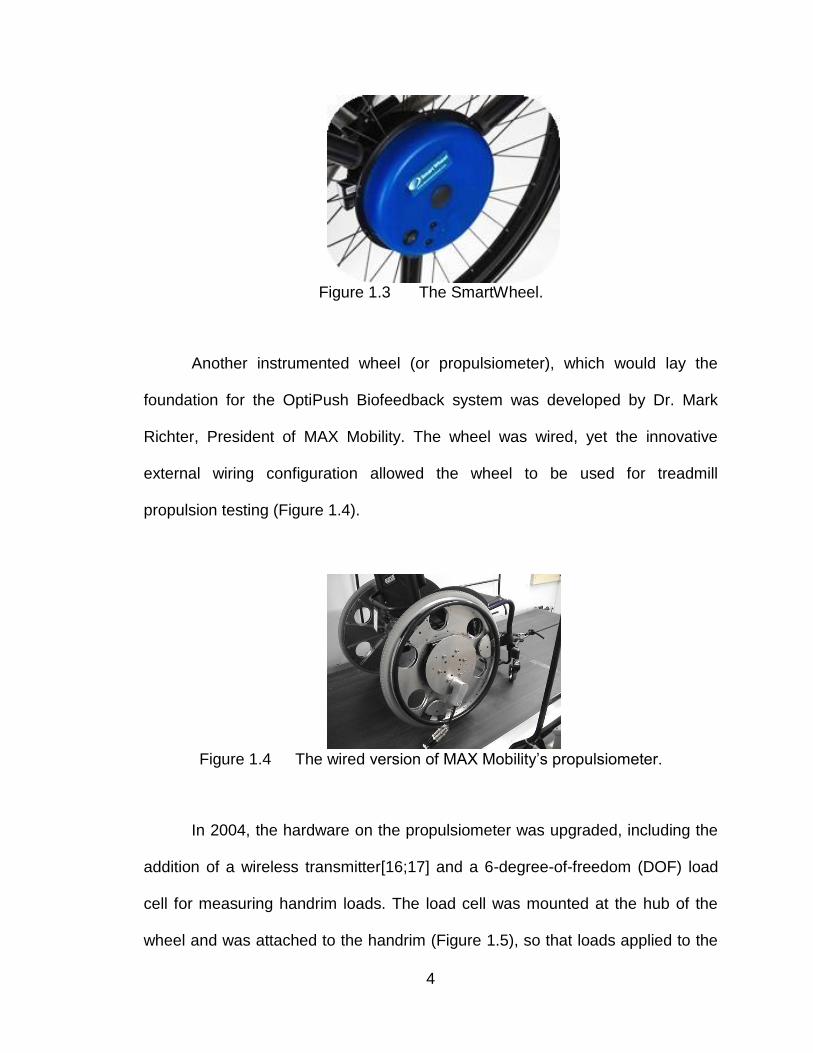
4
Figure 1.3 The SmartWheel.
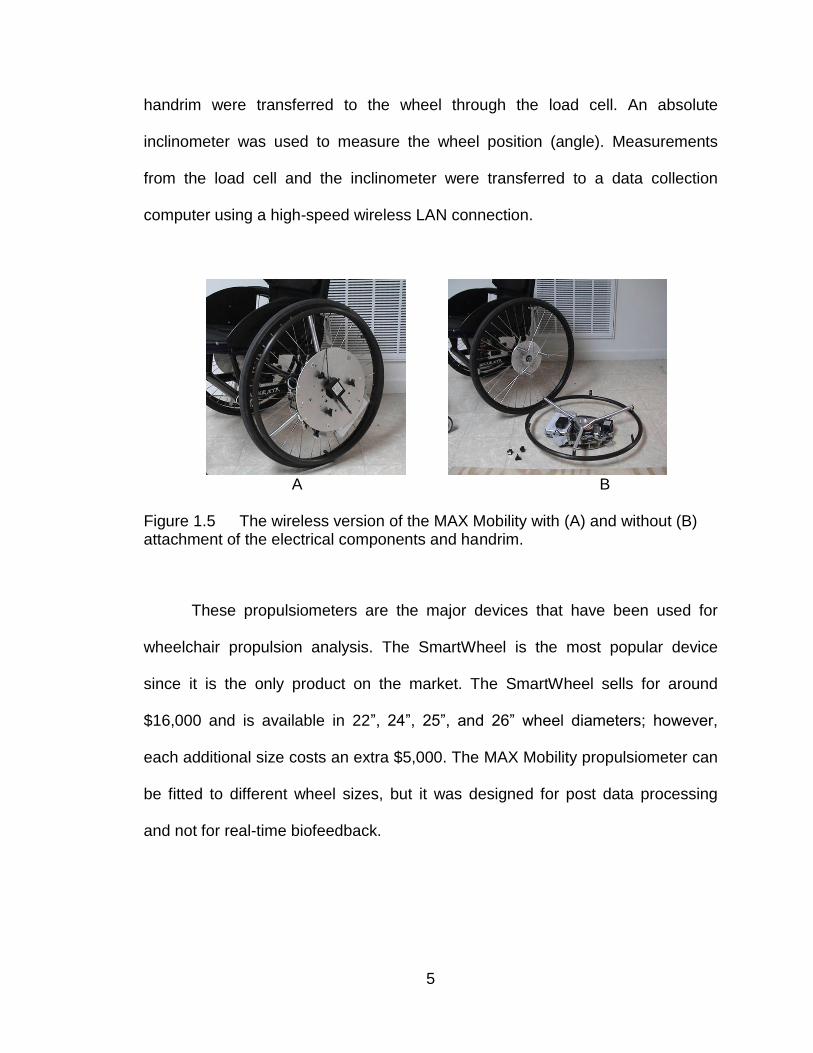
Another instrumented wheel (or propulsiometer), which would lay the
foundation for the OptiPush Biofeedback system was developed by Dr. Mark
Richter, President of MAX Mobility. The wheel was wired, yet the innovative
external wiring configuration allowed the wheel to be used for treadmill
propulsion testing (Figure 1.4).
Figure 1.4 The wired version of MAX Mobility‟s propulsiometer.
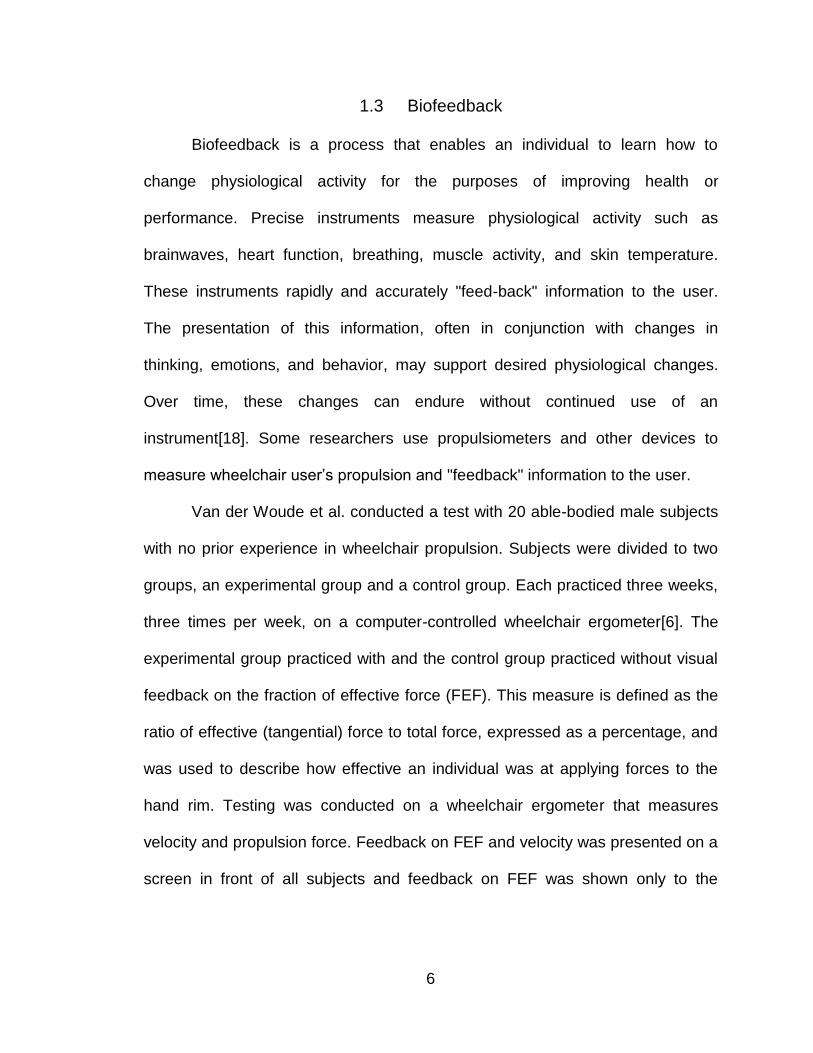
In 2004, the hardware on the propulsiometer was upgraded, including the
addition of a wireless transmitter[16;17] and a 6-degree-of-freedom (DOF) load
cell for measuring handrim loads. The load cell was mounted at the hub of the
wheel and was attached to the handrim (Figure 1.5), so that loads applied to the
5
handrim were transferred to the wheel through the load cell. An absolute
inclinometer was used to measure the wheel position (angle). Measurements
from the load cell and the inclinometer were transferred to a data collection
computer using a high-speed wireless LAN connection.
A B
Figure 1.5 The wireless version of the MAX Mobility with (A) and without (B) attachment of the electrical components and handrim.
These propulsiometers are the major devices that have been used for
wheelchair propulsion analysis. The SmartWheel is the most popular device
since it is the only product on the market. The SmartWheel sells for around
$16,000 and is available in 22”, 24”, 25”, and 26” wheel diameters; however,
each additional size costs an extra $5,000. The MAX Mobility propulsiometer can
be fitted to different wheel sizes, but it was designed for post data processing
and not for real-time biofeedback.
6
1.3 Biofeedback
Biofeedback is a process that enables an individual to learn how to
change physiological activity for the purposes of improving health or
performance. Precise instruments measure physiological activity such as
brainwaves, heart function, breathing, muscle activity, and skin temperature.
These instruments rapidly and accurately "feed-back" information to the user.
The presentation of this information, often in conjunction with changes in
thinking, emotions, and behavior, may support desired physiological changes.
Over time, these changes can endure without continued use of an
instrument[18]. Some researchers use propulsiometers and other devices to
measure wheelchair user‟s propulsion and "feedback" information to the user.
Van der Woude et al. conducted a test with 20 able-bodied male subjects
with no prior experience in wheelchair propulsion. Subjects were divided to two
groups, an experimental group and a control group. Each practiced three weeks,
three times per week, on a computer-controlled wheelchair ergometer[6]. The
experimental group practiced with and the control group practiced without visual
feedback on the fraction of effective force (FEF). This measure is defined as the
ratio of effective (tangential) force to total force, expressed as a percentage, and
was used to describe how effective an individual was at applying forces to the
hand rim. Testing was conducted on a wheelchair ergometer that measures
velocity and propulsion force. Feedback on FEF and velocity was presented on a
screen in front of all subjects and feedback on FEF was shown only to the

7
experimental group (Figure 1.6). The results showed that the experimental group
had a higher mean FEF than the control group[19].
Figure 1.6 Screen showing the velocity and FEF feedback given to the subjects.
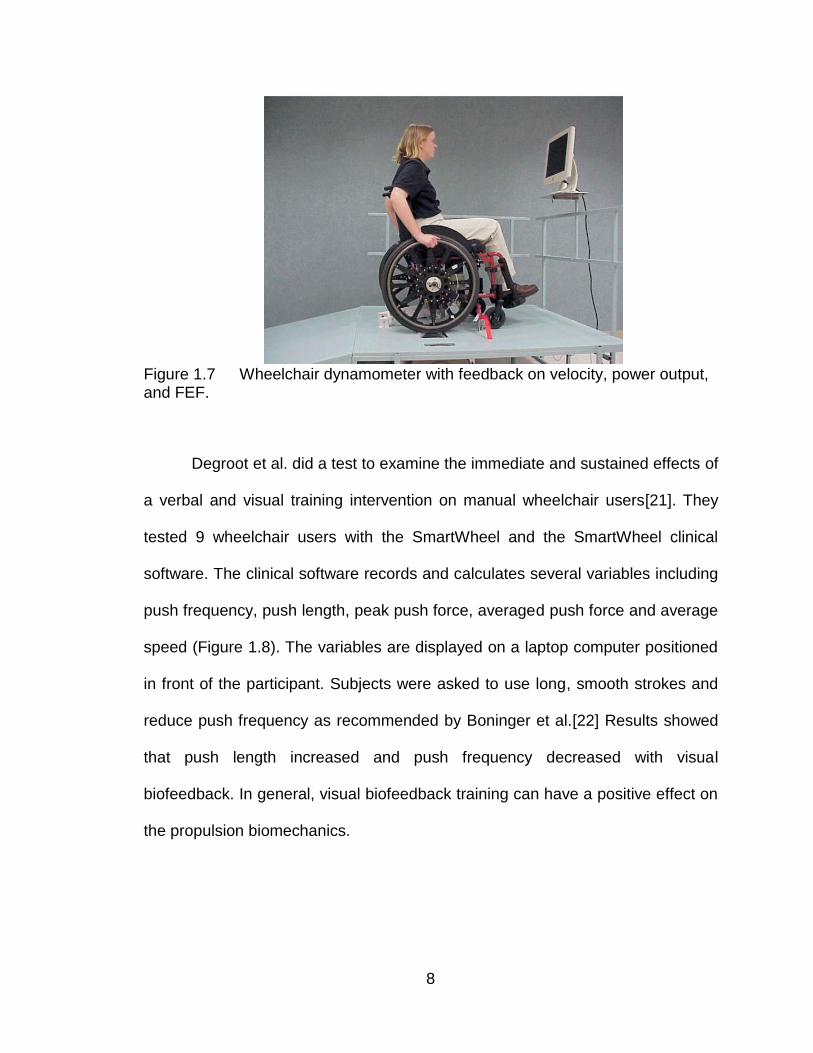
Kotajarvi et al. conducted a similar study to improve FEF with visual
biofeedback[20]. The study included 18 experienced manual wheelchair users
who propelled their own wheelchairs, equipped with a custom-built instrumented
wheel (Figure. 1.2)[8;9], on a wheelchair dynamometer (Figure 1.7). The
dynamometer provided a resistant force to the wheel. A monitor displaying visual
biofeedback data was mounted in front of the subjects. The monitor provided
immediate feedback on the FEF, velocity, and power output during the push
phase of propulsion. All subjects propelled two trials: one with and one without
feedback. In comparing the results, they found that the mean FEF did not change
when experienced wheelchair users received real-time visual feedback.
8
Figure 1.7 Wheelchair dynamometer with feedback on velocity, power output, and FEF.
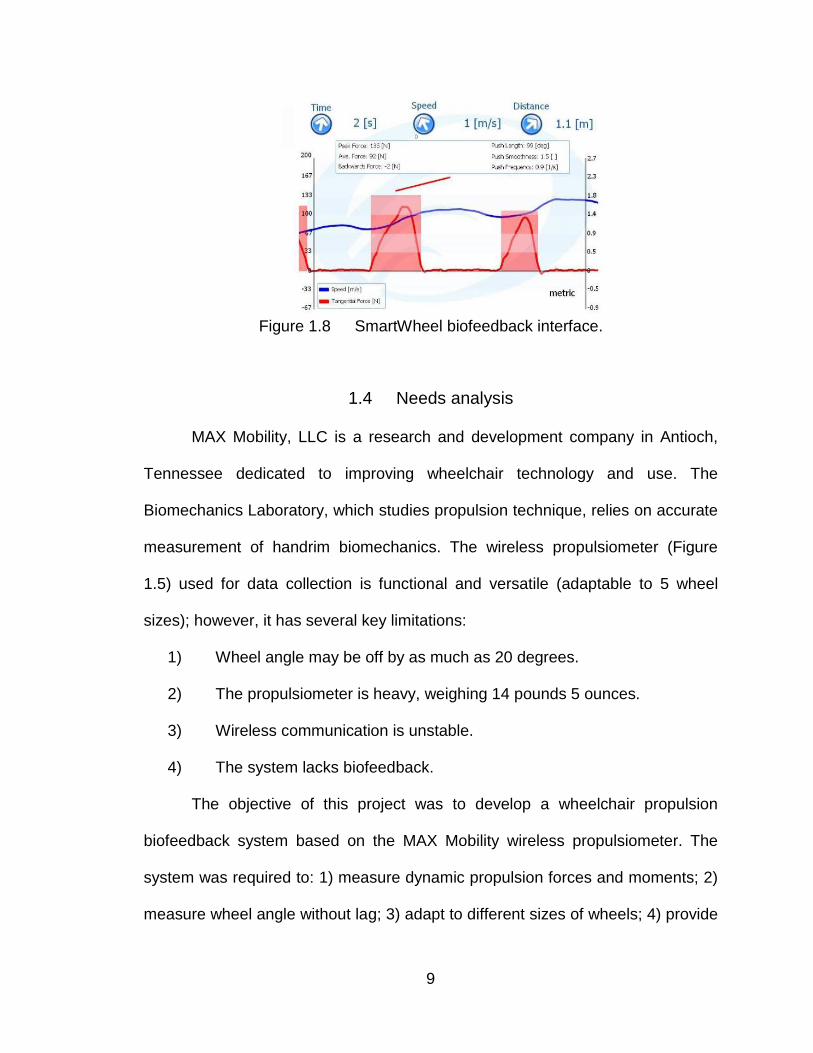
Degroot et al. did a test to examine the immediate and sustained effects of
a verbal and visual training intervention on manual wheelchair users[21]. They
tested 9 wheelchair users with the SmartWheel and the SmartWheel clinical
software. The clinical software records and calculates several variables including
push frequency, push length, peak push force, averaged push force and average
speed (Figure 1.8). The variables are displayed on a laptop computer positioned
in front of the participant. Subjects were asked to use long, smooth strokes and
reduce push frequency as recommended by Boninger et al.[22] Results showed
that push length increased and push frequency decreased with visual
biofeedback. In general, visual biofeedback training can have a positive effect on
the propulsion biomechanics.
9
Figure 1.8 SmartWheel biofeedback interface.
1.4 Needs analysis
MAX Mobility, LLC is a research and development company in Antioch,
Tennessee dedicated to improving wheelchair technology and use. The
Biomechanics Laboratory, which studies propulsion technique, relies on accurate
measurement of handrim biomechanics. The wireless propulsiometer (Figure
1.5) used for data collection is functional and versatile (adaptable to 5 wheel
sizes); however, it has several key limitations:
1) Wheel angle may be off by as much as 20 degrees.
2) The propulsiometer is heavy, weighing 14 pounds 5 ounces.
3) Wireless communication is unstable.
4) The system lacks biofeedback.
The objective of this project was to develop a wheelchair propulsion
biofeedback system based on the MAX Mobility wireless propulsiometer. The
system was required to: 1) measure dynamic propulsion forces and moments; 2)
measure wheel angle without lag; 3) adapt to different sizes of wheels; 4) provide

10
stable wireless communication with a data collection computer; 5) provide real-
time biofeedback of variables; and 6) save data for future processing.
11
CHAPTER II
THE OPTIPUSH SYSTEM DESIGN AND VALIDATION
A system was designed and fabricated to measure manual wheelchair
propulsion, provide biofeedback and optimize propulsion technique. The system
is named OptiPush Biofeedback System. The OptiPush Biofeedback System
consists of two core components; the instrumented wheel, called the OptiPush
Wheel, and the data collection, analysis, and biofeedback software called the
OptiPush Software.
2.1 OptiPush Wheel Components and Structure
The OptiPush Wheel is composed of a handrim, a wheel, a triangular plate,
three beams, three clamps and an Instrumentation Module (IM), which contains
sensors and electrical components (Figure 2.1A). The clamps are attached to the
ends of the triangular plate that is then mounted to the IM. Each beam is slid into
one of the clamps and held secure with the clamp screw. The opposite ends of
the beams are attached directly to the handrim using the preexisting tabs (Figure
2.1B). Different sized handrims can be attached by adjusting the length of the
beams. Once the IM is fitted with the handrim, the wheel is attached to the IM by
screwing the modified hub onto the three standoffs (Figure 2.1C). This design
directs the loads applied to the handrim through the IM and then onto to the
wheel. In addition, the simple assembly procedure allows the user to attach a

12
number of different wheels (and handrims), ranging in diameter from 20 inches
(508 mm) to 26 inches (660 mm).
(a) (b)
(c) (d)
Figure 2.1 Assembly of the OptiPush wheel showing (a) the instrumentation module; (b) the attachment of the handrim and triangle to the IM; (c) the attachment of the wheel to the IMand (d) the OptiPush wheel on the wheelchair.
Once the OptiPush Wheel is assembled, it is attached to the wheelchair
using a split-end axle that expands as the central screw is tightened. A matching
wheel with a weighted disc, corresponding to the weight of the IM, is attached to
the other side of the wheelchair to ensure symmetric wheel weights and inertias.
13
2.1.1 Force Sensor
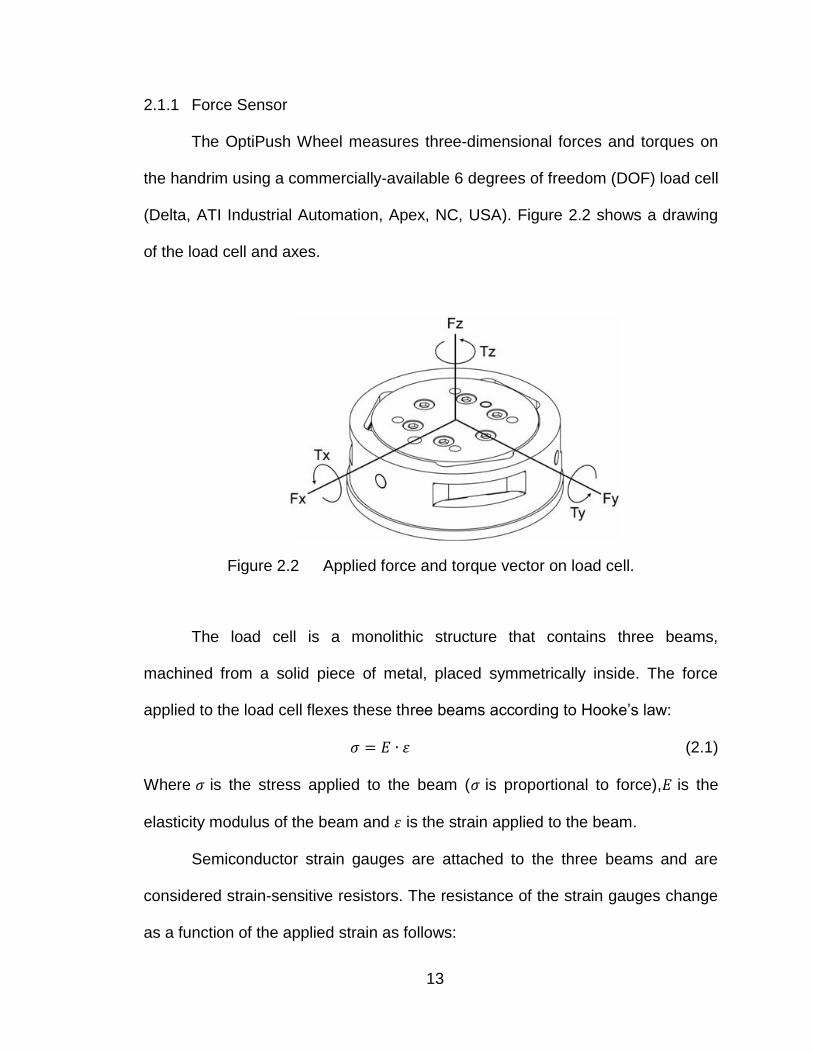
The OptiPush Wheel measures three-dimensional forces and torques on
the handrim using a commercially-available 6 degrees of freedom (DOF) load cell
(Delta, ATI Industrial Automation, Apex, NC, USA). Figure 2.2 shows a drawing
of the load cell and axes.
Figure 2.2 Applied force and torque vector on load cell.
The load cell is a monolithic structure that contains three beams,
machined from a solid piece of metal, placed symmetrically inside. The force
applied to the load cell flexes these three beams according to Hooke‟s law:
(2.1)
Where is the stress applied to the beam ( is proportional to force), is the
elasticity modulus of the beam and is the strain applied to the beam.
Semiconductor strain gauges are attached to the three beams and are
considered strain-sensitive resistors. The resistance of the strain gauges change
as a function of the applied strain as follows:
14
(2.2)
Where is change in resistance of the strain gauge, is the gauge factor of
strain gauge, is the resistance of strain gauge unstrained and is the strain
applied to strain gauge.
The output voltages from the load cell are converted into forces and
torques using a calibration matrix. The load cell had a full mechanical loading
rate of 770N for Fx and Fy, 2310N for Fz and 70 Nm of moment for all directions.
The max amount of error for all axes is 1.5% which is expressed as a percentage
of its full-scale load. The load cell requires ±15V for power and has an output
range of ±5V. The resonant frequency of the load cell is 1500Hz for Fx, Fy, and Tz,
and 1700Hz for Tx, Ty, and Fz. The load cell is mounted to the IM cover and
attached to the load cell inner plate (Figure 2.1 B); therefore, loads applied to the
handrim pass through the load cell and onto the wheel.
2.1.2 Angle Sensor
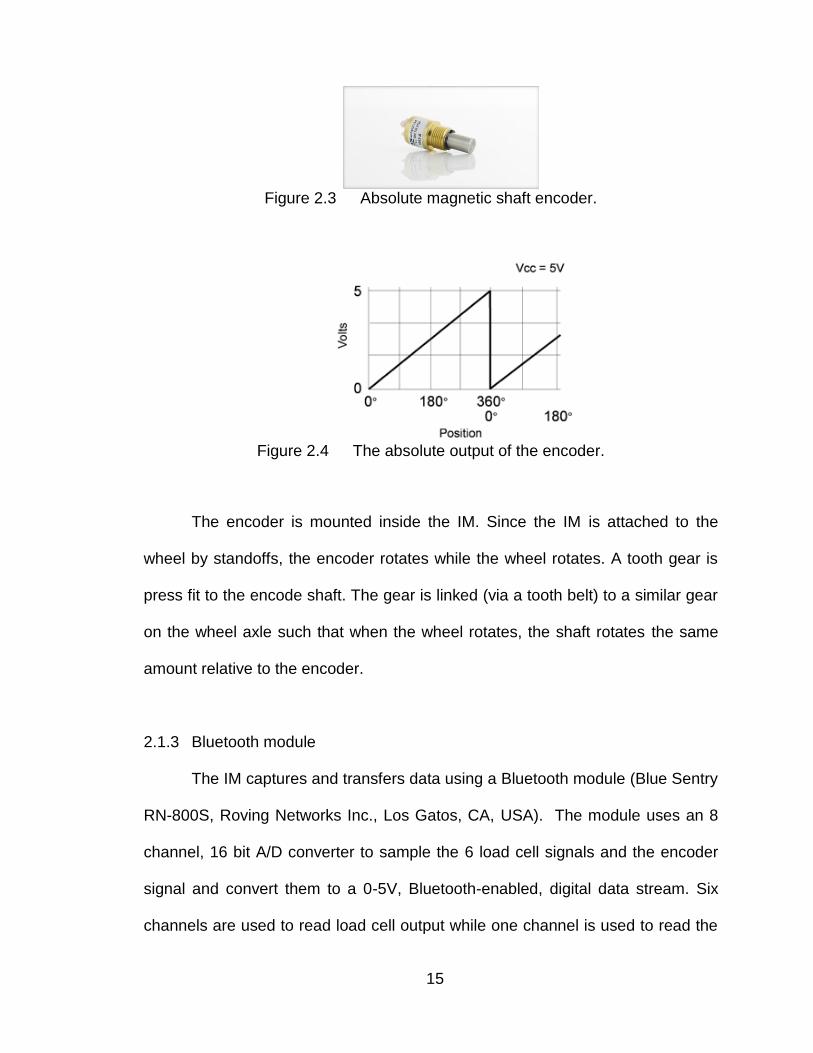
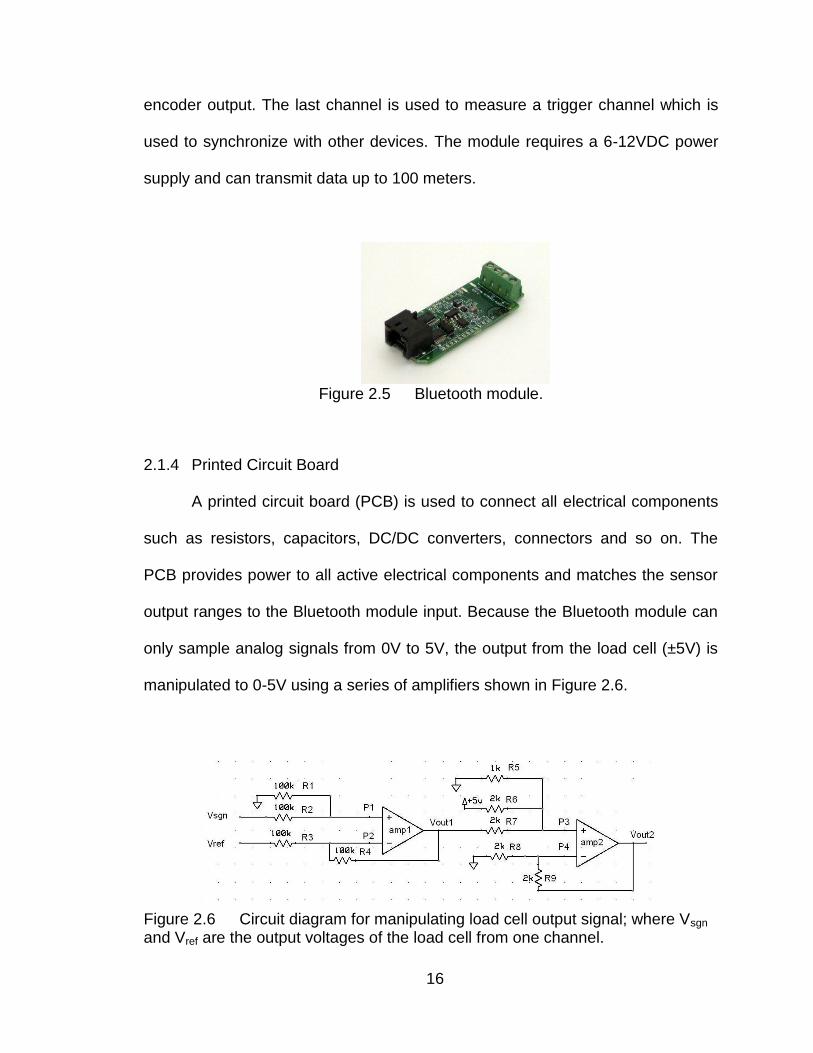
A rotary absolute magnetic shaft encoder (MA3, US Digital, Vancouver,
WA, USA) is used to measure the wheel angle (Figure 2.3). The encoder reports
the shaft position over 360 with no stops or gaps. It has 10-bit resolution and an
analog voltage output of 0-5V that is proportional to absolute shaft position
(Figure 2.4).
15
Figure 2.3 Absolute magnetic shaft encoder.
Figure 2.4 The absolute output of the encoder.
The encoder is mounted inside the IM. Since the IM is attached to the
wheel by standoffs, the encoder rotates while the wheel rotates. A tooth gear is
press fit to the encode shaft. The gear is linked (via a tooth belt) to a similar gear
on the wheel axle such that when the wheel rotates, the shaft rotates the same
amount relative to the encoder.
2.1.3 Bluetooth module
The IM captures and transfers data using a Bluetooth module (Blue Sentry
RN-800S, Roving Networks Inc., Los Gatos, CA, USA). The module uses an 8
channel, 16 bit A/D converter to sample the 6 load cell signals and the encoder
signal and convert them to a 0-5V, Bluetooth-enabled, digital data stream. Six
channels are used to read load cell output while one channel is used to read the
16
encoder output. The last channel is used to measure a trigger channel which is
used to synchronize with other devices. The module requires a 6-12VDC power
supply and can transmit data up to 100 meters.
Figure 2.5 Bluetooth module.
2.1.4 Printed Circuit Board
A printed circuit board (PCB) is used to connect all electrical components
such as resistors, capacitors, DC/DC converters, connectors and so on. The
PCB provides power to all active electrical components and matches the sensor
output ranges to the Bluetooth module input. Because the Bluetooth module can
only sample analog signals from 0V to 5V, the output from the load cell (±5V) is
manipulated to 0-5V using a series of amplifiers shown in Figure 2.6.
Figure 2.6 Circuit diagram for manipulating load cell output signal; where Vsgn and Vref are the output voltages of the load cell from one channel.

17
From the diagram, the voltages at P1 and P2 are:
(2.3)
(2.4)
Since VP1 = VP2 and R1 = R2 = R3 = R4 = 100KΩ, Equations 2.3 and 2.4 can be
expressed as:
(2.5)
The voltages at P3 and P4 are:
(2.6)
Since VP3 = VP4, R5 = 1KΩ, and R6 = R7 = R8 = R9 = 2KΩ, Equations 2.6 and 2.7
can be reduced to:
From Equations 2.5 and 2.8 we calculated Vout as:
The output range for the load cell is ±5V. By applying Equation 2.9, the range of
Vout will be:
18
where Vout matches the input range of the Bluetooth module (0-5V). The voltage
of power needed for all active electrical components are shown in Table 2.1.
Table 2.1 Power needed for all active electrical components
Components Voltage (V) Current (mA)
Load cell ±15 VDC 40
Bluetooth module 6-12VDC 60
Amplifiers ±12-15 VDC 1.4
Absolute encoder 4.5-5.5V 20
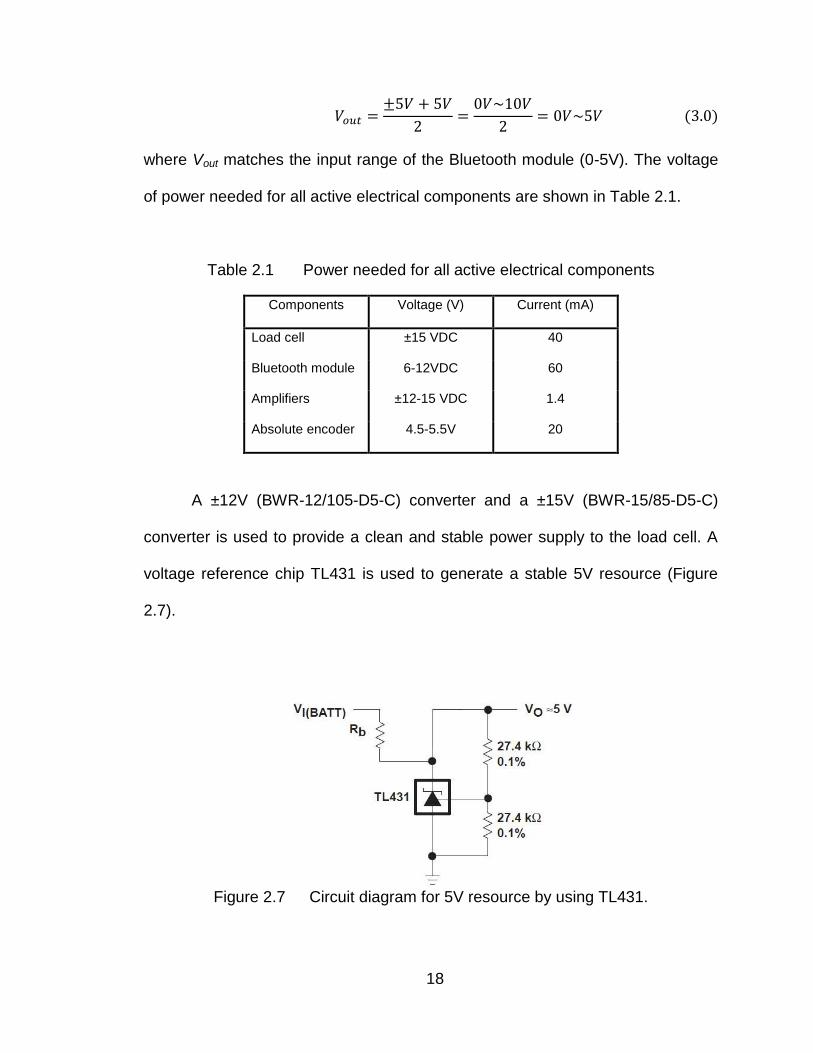
A ±12V (BWR-12/105-D5-C) converter and a ±15V (BWR-15/85-D5-C)
converter is used to provide a clean and stable power supply to the load cell. A
voltage reference chip TL431 is used to generate a stable 5V resource (Figure
2.7).
Figure 2.7 Circuit diagram for 5V resource by using TL431.

19
All components are powered by a 7.4V 2600mAh Li-ion battery. It can be
used for more than three hours before recharging. The PCB also has some
connectors to connect the battery, sensors and Bluetooth module.
The PCB was manufactured by ExpressPCB, which offers freeware to
help design and draw the board. The finale design of the printed circuit board can
be seen in Figure 2.8. The PCB, battery, encoder, Bluetooth module and load
cell are secured inside the instrumentation module housing. The fully assembled
IM can be seen in Figure 2.9.
Figure 2.8 Printed circuit board.
Figure 2.9 Assembled instrumentation module.

20
2.2 OptiPush Software
The OptiPush Software was developed using LabVIEW (National
Instruments Corporation, Austin, TX). A flowchart of the OptiPush Software was
showed in figure 2.10.
Figure 2.10 Flowchart of the OptiPush software
21
2.2.1 Bluetooth setting
A Bluetooth adapter is plugged into a computer to communicate with the
Bluetooth module in the OptiPush Wheel. After connecting to the OptiPush
module, the computer can control the wheel wirelessly. Once a “start” command
is received from the computer, the module begins taking data at a sampling
frequency of 200Hz and transferring them to the computer immediately. Raw
data are recorded as 16-bit binary ranging from 0 to 65535 (representing 0-5V).
Equation 2.10 is used to converter the raw data to voltage output.
2.2.2 Offset Removing
As the OptiPush Wheel rotates, the load cell coordinate system also
rotates, resulting in a dynamic offset due to the weight of the handrim[23]. The
load cell also has an offset due to the error of the electrical components and the
weight of the beams to which the strain gauges are attached. To remove the
offset, data recorded during a free rotation of the wheel are measured, averaged
and subtracted from the propulsion data.
The OptiPush Software converts raw voltage measurements from the
encoder to wheel angle using Equation 2.11.

22
Wheel angle is rounded to the nearest integer angle from 0 to 359. The
software prompts the user to rotate the wheel without loading the handrim. A red
circle is shown to represent the wheel and a needle indicates the current
direction of the wheel (Figure 2.11). As the wheel is rotated, the red dots on the
circle turn green as the system records three measurements of handrim loading
at each wheel angle. After the entire circle is green, the loads at each wheel
angle are averaged and a 7 x 360 matrix is saved to the offset file.
Figure 2.11 Offset data collection.
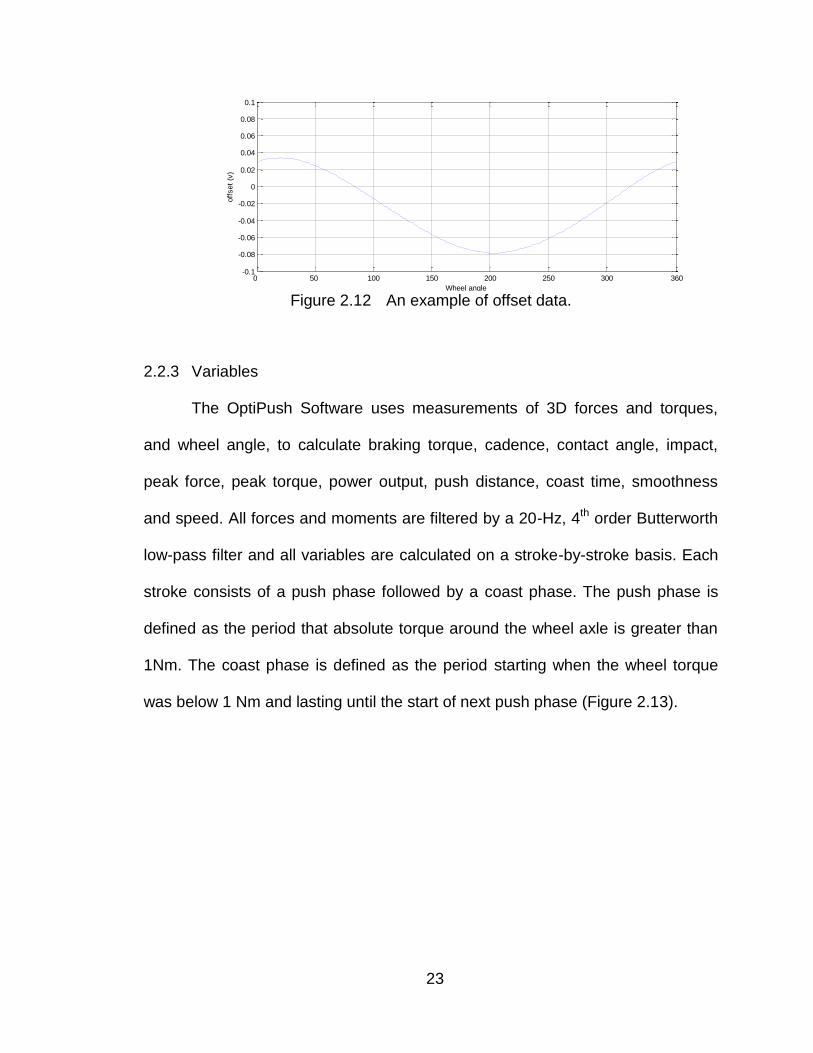
Data in the offset file is subtracted from all subsequent data before it is
converted into handrim forces and torques. An example of offset data, from the in
second column of the offset file, is shown in Figure 2.12.
23
Figure 2.12 An example of offset data.
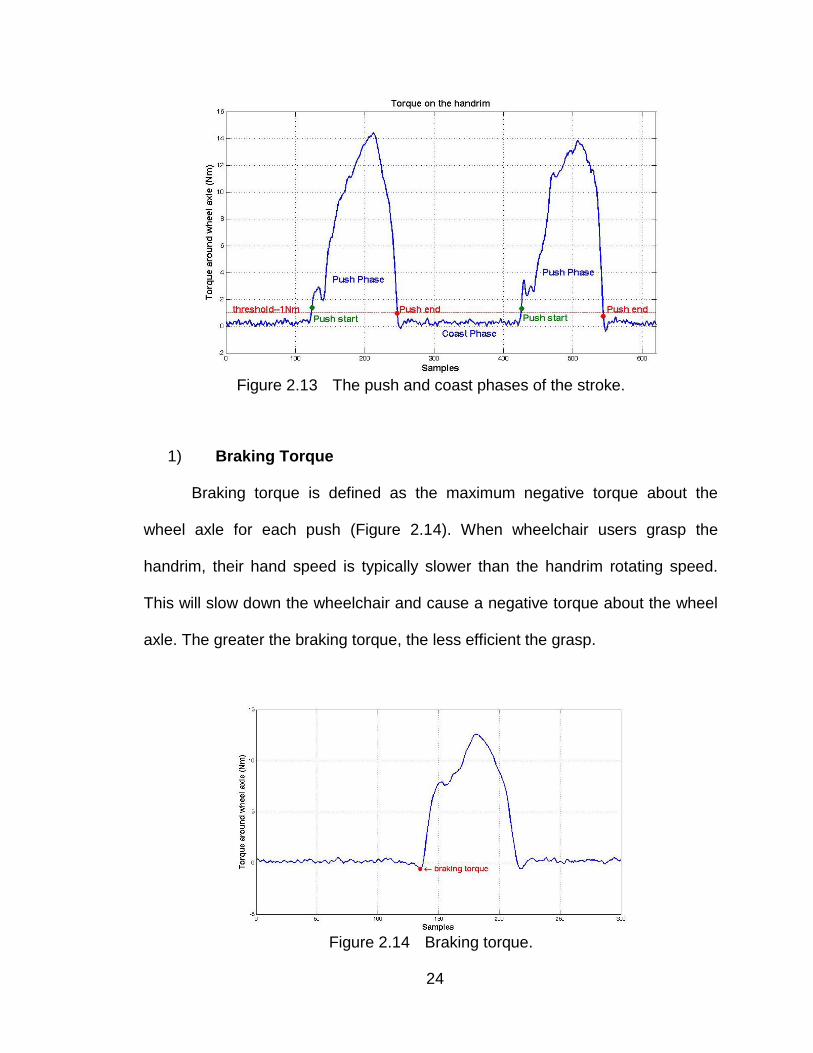
2.2.3 Variables
The OptiPush Software uses measurements of 3D forces and torques,
and wheel angle, to calculate braking torque, cadence, contact angle, impact,
peak force, peak torque, power output, push distance, coast time, smoothness
and speed. All forces and moments are filtered by a 20-Hz, 4th order Butterworth
low-pass filter and all variables are calculated on a stroke-by-stroke basis. Each
stroke consists of a push phase followed by a coast phase. The push phase is
defined as the period that absolute torque around the wheel axle is greater than
1Nm. The coast phase is defined as the period starting when the wheel torque
was below 1 Nm and lasting until the start of next push phase (Figure 2.13).
0 50 100 150 200 250 300 360-0.1
-0.08
-0.06
-0.04
-0.02
0
0.02
0.04
0.06
0.08
0.1
Wheel angle
off
set
(v)
24
Figure 2.13 The push and coast phases of the stroke.
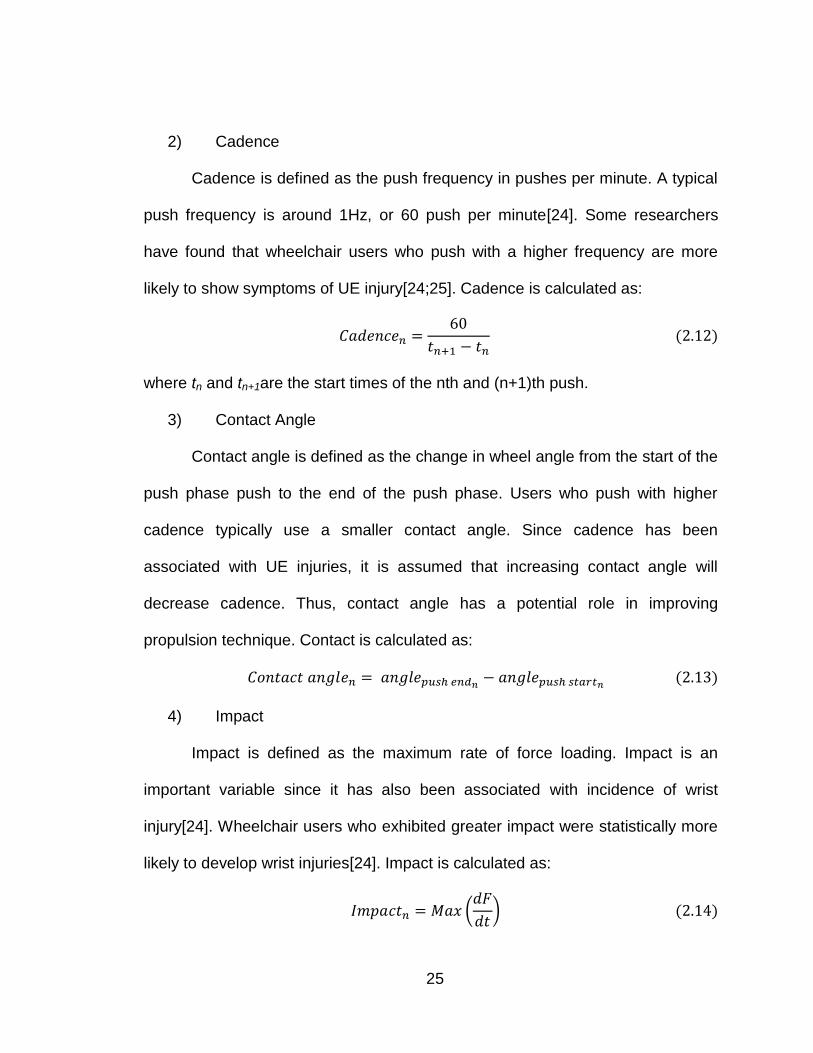
1) Braking Torque
Braking torque is defined as the maximum negative torque about the
wheel axle for each push (Figure 2.14). When wheelchair users grasp the
handrim, their hand speed is typically slower than the handrim rotating speed.
This will slow down the wheelchair and cause a negative torque about the wheel
axle. The greater the braking torque, the less efficient the grasp.
Figure 2.14 Braking torque.
25
2) Cadence
Cadence is defined as the push frequency in pushes per minute. A typical
push frequency is around 1Hz, or 60 push per minute[24]. Some researchers
have found that wheelchair users who push with a higher frequency are more
likely to show symptoms of UE injury[24;25]. Cadence is calculated as:
where tn and tn+1are the start times of the nth and (n+1)th push.
3) Contact Angle
Contact angle is defined as the change in wheel angle from the start of the
push phase push to the end of the push phase. Users who push with higher
cadence typically use a smaller contact angle. Since cadence has been
associated with UE injuries, it is assumed that increasing contact angle will
decrease cadence. Thus, contact angle has a potential role in improving
propulsion technique. Contact is calculated as:
4) Impact
Impact is defined as the maximum rate of force loading. Impact is an
important variable since it has also been associated with incidence of wrist
injury[24]. Wheelchair users who exhibited greater impact were statistically more
likely to develop wrist injuries[24]. Impact is calculated as:
(
)

26
where F is the resultant force applied to the handrim.
5) Peak Force
Peak force is defined as the maximum force magnitude applied to the
handrim for each push during propulsion. As with impact, peak force has been
found to be a predictor of wrist injury[26]. Peak force is calculated as:
(√ )
6) Peak Torque
Peak torque is defined as the maximum moment applied to the handrim
for each push during propulsion. Peak torque is calculated as:
(√ )
7) Power Output
Power output is defined as the average power generated during the push.
Power output reflects the wheelchair user‟s pushing environment. Higher speed
and rolling resistance require more power output. Power output is calculated as:
∑
8) Push distance
Push distance is defined as distance travelled from the start of a push to
the start of the next push. Usually, longer push distance comes with result of
lower cadence which may reduce the change of UE injury. Push distance is
calculated as:
27
where D is the diameter of the wheel.
9) Coast Time
Coast time is defined as time from end of push to the start of next push
and is also referred to as the recovery phase. It is the time when the hand is off
the handrim and the UE is moving backwards in preparation for the next push.
Coast time is calculated as:
10) Smoothness
Smoothness is defined as ratio of the average force of a push to the peak
force of a push. A higher ratio indicates the peak force is close to the average
force, which translates to higher smoothness. Smoothness is calculated as:
∑
(2.20)
11) Speed
Speed is defined as the average speed of a push. Researchers often
provide speed biofeedback to test subjects so that wheelchair users can maintain
a certain speed[20;21]. Speed is calculated as:
2.2.4 Biofeedback
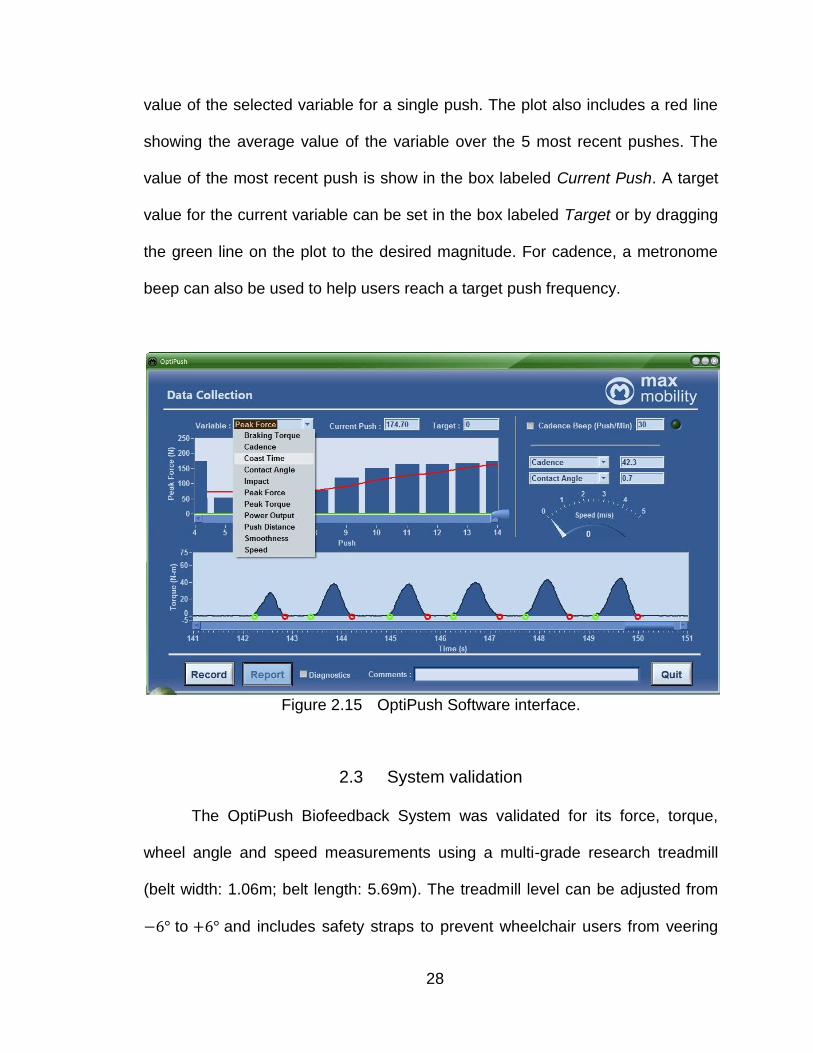
The OptiPush Software provides visual biofeedback for all variables
(Figure 2.15). The variable pull-down menu on the top left can be used to select
which variable is displayed on the upper plot, in which each bar represents the
28
value of the selected variable for a single push. The plot also includes a red line
showing the average value of the variable over the 5 most recent pushes. The
value of the most recent push is show in the box labeled Current Push. A target
value for the current variable can be set in the box labeled Target or by dragging
the green line on the plot to the desired magnitude. For cadence, a metronome
beep can also be used to help users reach a target push frequency.
Figure 2.15 OptiPush Software interface.
2.3 System validation
The OptiPush Biofeedback System was validated for its force, torque,
wheel angle and speed measurements using a multi-grade research treadmill
(belt width: 1.06m; belt length: 5.69m). The treadmill level can be adjusted from
to and includes safety straps to prevent wheelchair users from veering
29
off the belt and from tipping backwards during use. The straps run along linear
bearings so as not limit movement or increase roiling resistance.
2.3.1 Wheel angle validation
A wheelchair with the OptiPushWheel attached to the right side was
secured to the treadmill. The treadmill ran at a constant speed of about 0.7 m/s.
The revolutions of the wheel were counted while the OptiPush Software recorded
wheel angle. The treadmill was stopped after 100 revolutions were counted and
wheel orientation at the stop position was measured. The resulting error in the
wheel angle measurement was:
(
)
2.3.2 Speed validation
Wheelchair speed is calculated using push distance (Equations 2.18 and
2.21), which is determined from wheel angle and wheel diameter. Given the
previous validation of wheel angle, experimental calculations of wheel diameter
were made to validate speed.
30
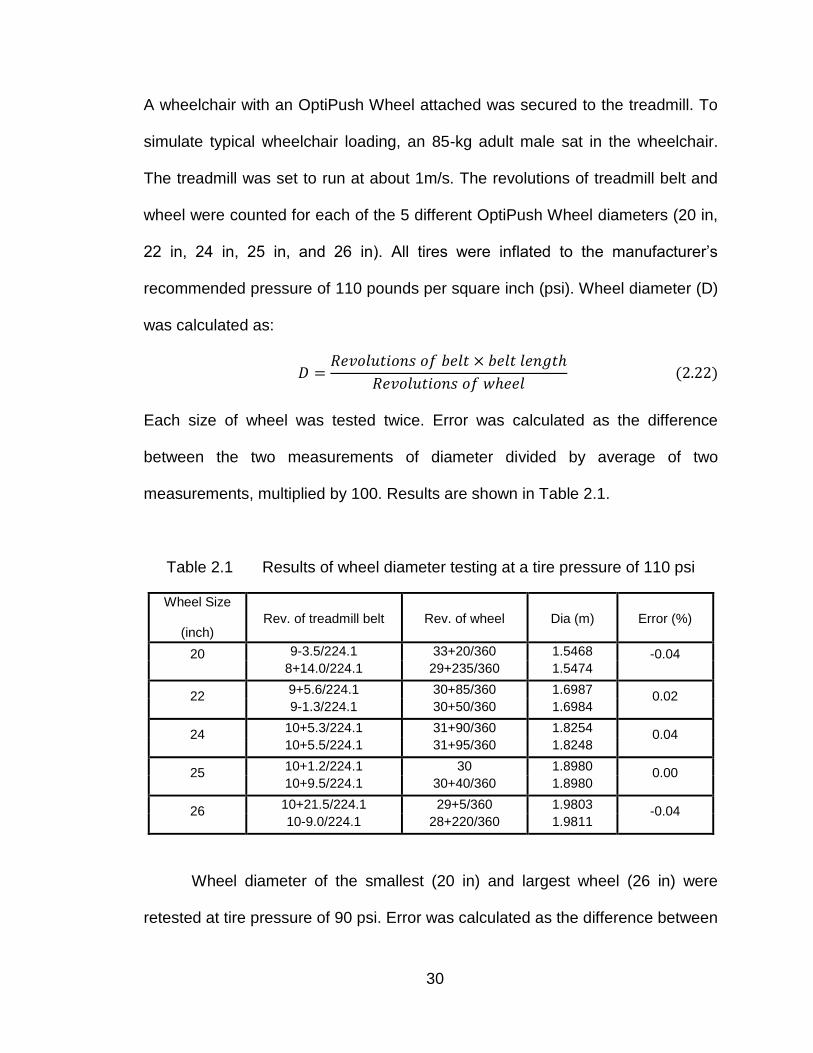
A wheelchair with an OptiPush Wheel attached was secured to the treadmill. To
simulate typical wheelchair loading, an 85-kg adult male sat in the wheelchair.
The treadmill was set to run at about 1m/s. The revolutions of treadmill belt and
wheel were counted for each of the 5 different OptiPush Wheel diameters (20 in,
22 in, 24 in, 25 in, and 26 in). All tires were inflated to the manufacturer‟s
recommended pressure of 110 pounds per square inch (psi). Wheel diameter (D)
was calculated as:
Each size of wheel was tested twice. Error was calculated as the difference
between the two measurements of diameter divided by average of two
measurements, multiplied by 100. Results are shown in Table 2.1.
Table 2.1 Results of wheel diameter testing at a tire pressure of 110 psi
Wheel Size
(inch) Rev. of treadmill belt Rev. of wheel Dia (m) Error (%)
20 9-3.5/224.1 33+20/360 1.5468 -0.04 8+14.0/224.1 29+235/360 1.5474
22 9+5.6/224.1 30+85/360 1.6987
0.02 9-1.3/224.1 30+50/360 1.6984
24 10+5.3/224.1 31+90/360 1.8254
0.04 10+5.5/224.1 31+95/360 1.8248
25 10+1.2/224.1 30 1.8980
0.00 10+9.5/224.1 30+40/360 1.8980
26 10+21.5/224.1 29+5/360 1.9803
-0.04 10-9.0/224.1 28+220/360 1.9811
Wheel diameter of the smallest (20 in) and largest wheel (26 in) were
retested at tire pressure of 90 psi. Error was calculated as the difference between

31
the two measurements of wheel diameter (110 psi and 90 psi) divided by the
initial measurement of wheel diameter (110 psi), multiplied by 100. The results
are shown in Table 2.2.
Table 2.1 and Table 2.2 show that the maximum error in wheel diameter
for the 110 psi and 90 psi conditions is about 0.04% and -0.77%, respectively.
Therefore, tire pressure has little effect on wheel diameter a little. By combining
the results from the tests of wheel angle and wheel diameter, the maximum error
in wheel speed was found to be 0.08% for a tire pressure of 110 psi and 0.81%
for a tire pressure of 90 psi.
Table 2.2 Results of wheel diameter testing at a tire pressure 90 psi
Wheel size
(inch) Rev. of treadmill belt Rev. of wheel Dia (m) Error (%)
20 8+7/224.1 29+220/360 1.5435 -0.21
8-1/224.1 29+200/360 1.5396 -0.50
26 10+7.3/224.1 28+325/360 1.9754 -0.25
10-9/224.1 28+300/360 1.9658 -0.77
2.3.3 Force and Torque validation
Static and dynamic tests were performed to validate the 3D force and
torque measurements from the load cell. For static testing, forces along the fore-
aft (Fx) and superior-inferior (Fy) axes and torque about the medial-lateral (Tz)
axis were tested by mounting the OptiPush wheel vertically. Three reference
loads (23.28 N, 68.04 N and 109.99 N) were suspended from the handrim at
eight different wheel angles ( apart) such that the resultant force of Fx and Fy
32
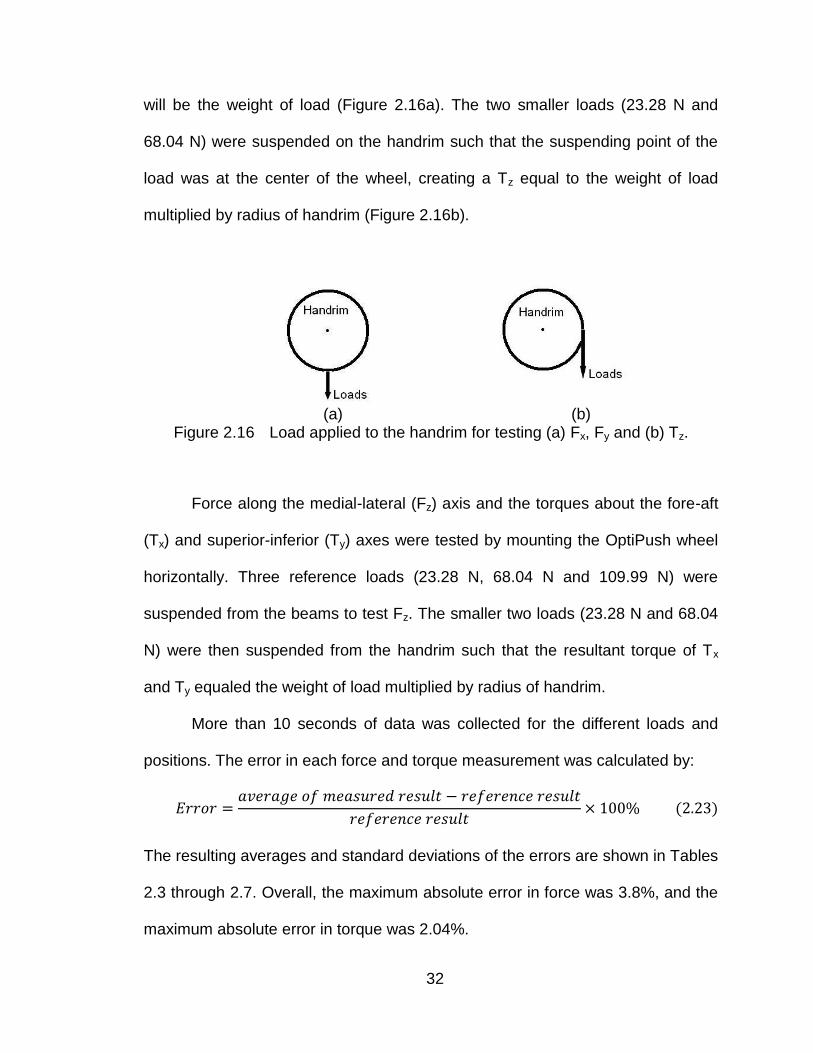
will be the weight of load (Figure 2.16a). The two smaller loads (23.28 N and
68.04 N) were suspended on the handrim such that the suspending point of the
load was at the center of the wheel, creating a Tz equal to the weight of load
multiplied by radius of handrim (Figure 2.16b).
(a) (b)
Figure 2.16 Load applied to the handrim for testing (a) Fx, Fy and (b) Tz.
Force along the medial-lateral (Fz) axis and the torques about the fore-aft
(Tx) and superior-inferior (Ty) axes were tested by mounting the OptiPush wheel
horizontally. Three reference loads (23.28 N, 68.04 N and 109.99 N) were
suspended from the beams to test Fz. The smaller two loads (23.28 N and 68.04
N) were then suspended from the handrim such that the resultant torque of Tx
and Ty equaled the weight of load multiplied by radius of handrim.
More than 10 seconds of data was collected for the different loads and
positions. The error in each force and torque measurement was calculated by:
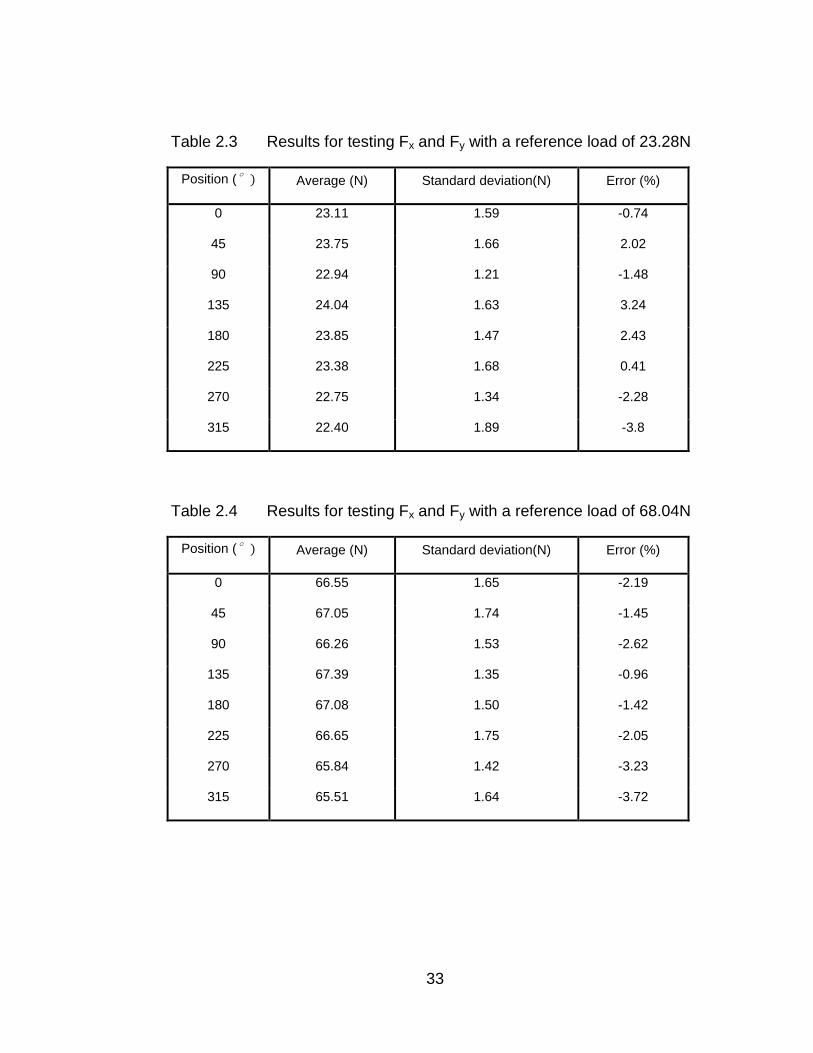
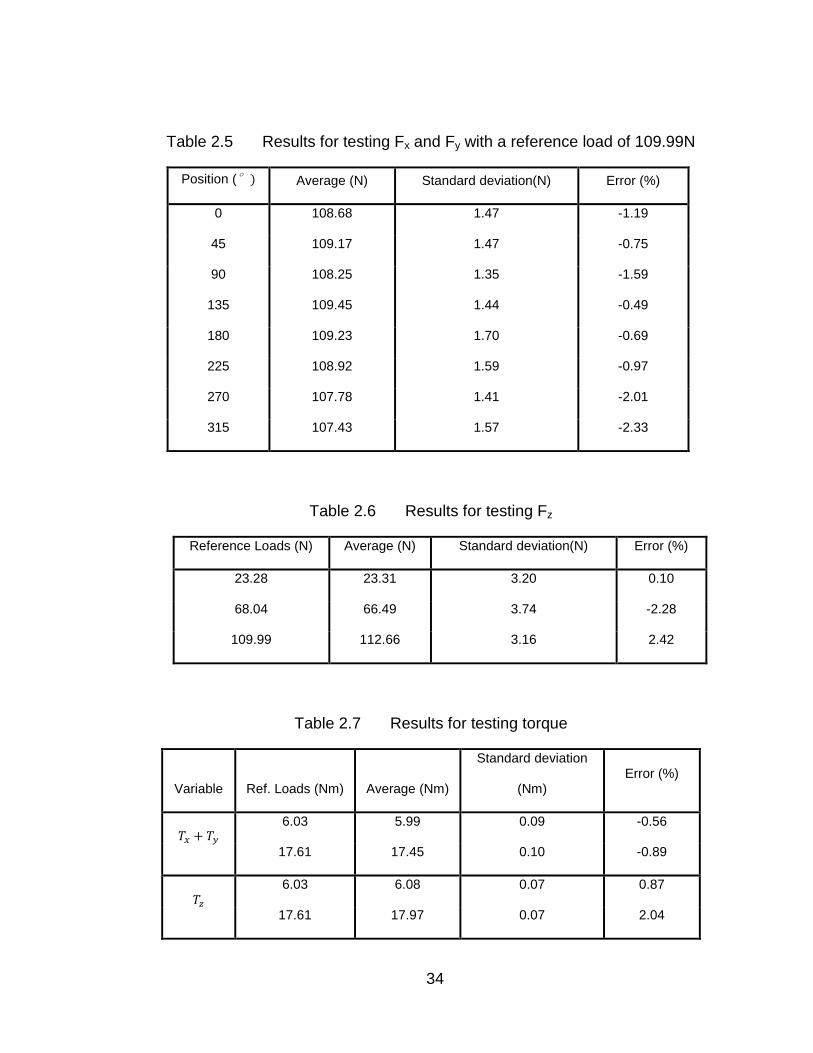
The resulting averages and standard deviations of the errors are shown in Tables
2.3 through 2.7. Overall, the maximum absolute error in force was 3.8%, and the
maximum absolute error in torque was 2.04%.
33
Table 2.3 Results for testing Fx and Fy with a reference load of 23.28N
Position (° Average (N) Standard deviation(N) Error (%)
0 23.11 1.59 -0.74
45 23.75 1.66 2.02
90 22.94 1.21 -1.48
135 24.04 1.63 3.24
180 23.85 1.47 2.43
225 23.38 1.68 0.41
270 22.75 1.34 -2.28
315 22.40 1.89 -3.8
Table 2.4 Results for testing Fx and Fy with a reference load of 68.04N
Position (° Average (N) Standard deviation(N) Error (%)
0 66.55 1.65 -2.19
45 67.05 1.74 -1.45
90 66.26 1.53 -2.62
135 67.39 1.35 -0.96
180 67.08 1.50 -1.42
225 66.65 1.75 -2.05
270 65.84 1.42 -3.23
315 65.51 1.64 -3.72
34
Table 2.5 Results for testing Fx and Fy with a reference load of 109.99N
Position (° Average (N) Standard deviation(N) Error (%)
0 108.68 1.47 -1.19
45 109.17 1.47 -0.75
90 108.25 1.35 -1.59
135 109.45 1.44 -0.49
180 109.23 1.70 -0.69
225 108.92 1.59 -0.97
270 107.78 1.41 -2.01
315 107.43 1.57 -2.33
Table 2.6 Results for testing Fz
Reference Loads (N) Average (N) Standard deviation(N) Error (%)
23.28 23.31 3.20 0.10
68.04 66.49 3.74 -2.28
109.99 112.66 3.16 2.42
Table 2.7 Results for testing torque
Variable Ref. Loads (Nm) Average (Nm)
Standard deviation
(Nm) Error (%)
6.03 5.99 0.09 -0.56
17.61 17.45 0.10 -0.89
6.03 6.08 0.07 0.87
17.61 17.97 0.07 2.04
35
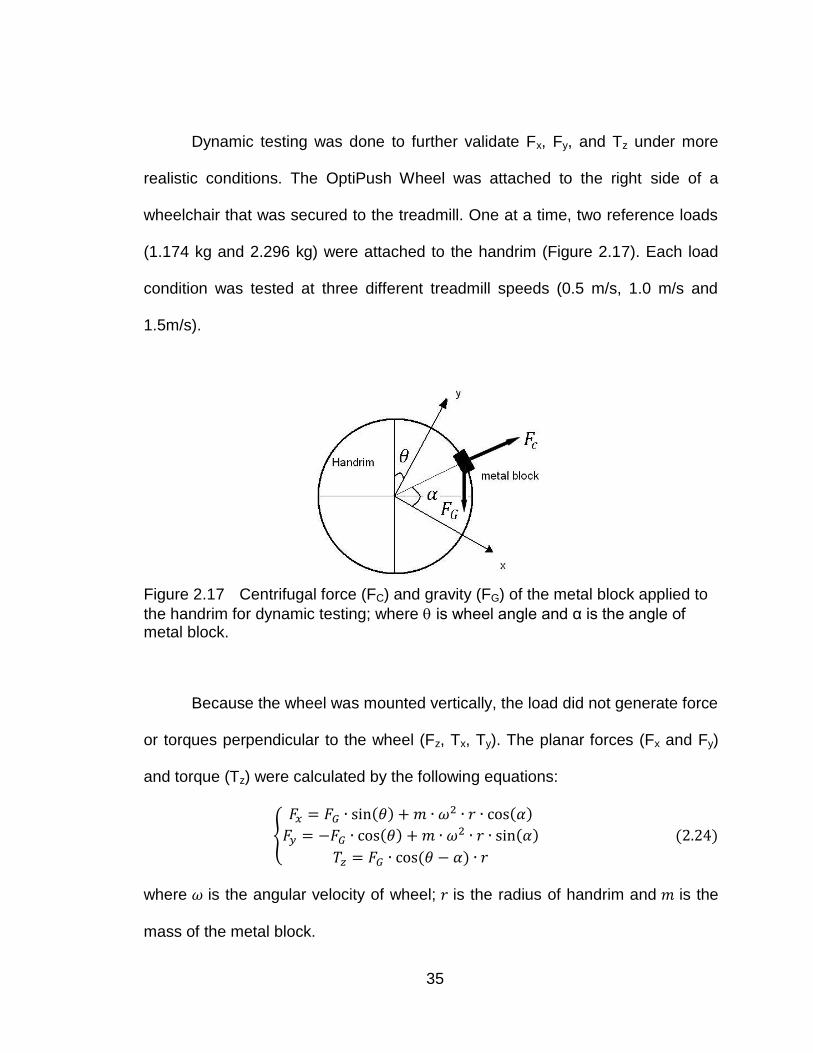
Dynamic testing was done to further validate Fx, Fy, and Tz under more
realistic conditions. The OptiPush Wheel was attached to the right side of a
wheelchair that was secured to the treadmill. One at a time, two reference loads
(1.174 kg and 2.296 kg) were attached to the handrim (Figure 2.17). Each load
condition was tested at three different treadmill speeds (0.5 m/s, 1.0 m/s and
1.5m/s).
Figure 2.17 Centrifugal force (FC) and gravity (FG) of the metal block applied to
the handrim for dynamic testing; where is wheel angle and α is the angle of metal block.
Because the wheel was mounted vertically, the load did not generate force
or torques perpendicular to the wheel (Fz, Tx, Ty). The planar forces (Fx and Fy)
and torque (Tz) were calculated by the following equations:
{
where is the angular velocity of wheel; is the radius of handrim and is the
mass of the metal block.
36
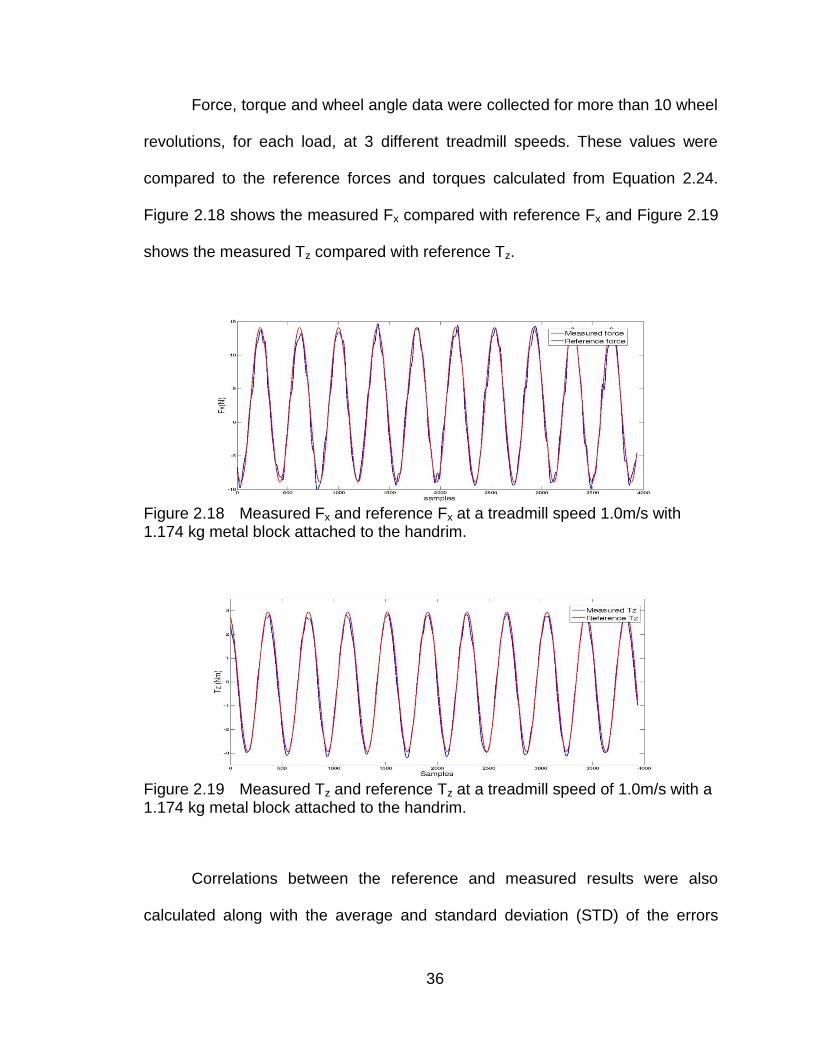
Force, torque and wheel angle data were collected for more than 10 wheel
revolutions, for each load, at 3 different treadmill speeds. These values were
compared to the reference forces and torques calculated from Equation 2.24.
Figure 2.18 shows the measured Fx compared with reference Fx and Figure 2.19
shows the measured Tz compared with reference Tz.
Figure 2.18 Measured Fx and reference Fx at a treadmill speed 1.0m/s with 1.174 kg metal block attached to the handrim.
Figure 2.19 Measured Tz and reference Tz at a treadmill speed of 1.0m/s with a 1.174 kg metal block attached to the handrim.
Correlations between the reference and measured results were also
calculated along with the average and standard deviation (STD) of the errors
37
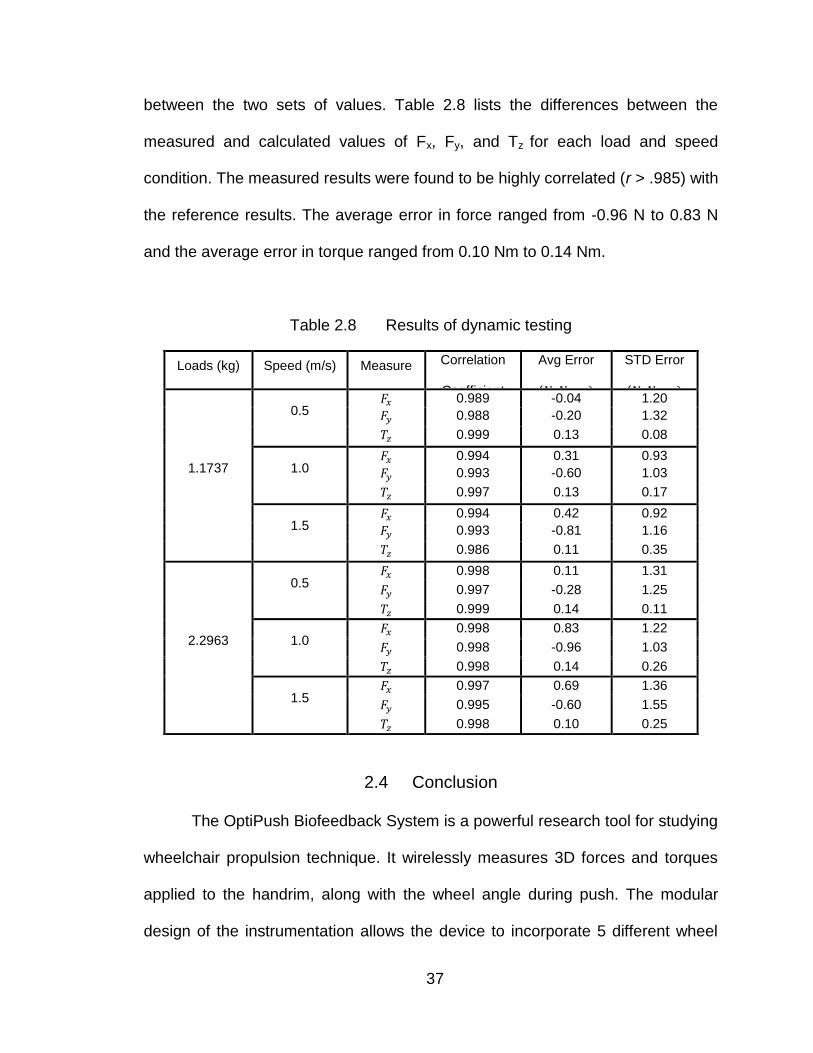
between the two sets of values. Table 2.8 lists the differences between the
measured and calculated values of Fx, Fy, and Tz for each load and speed
condition. The measured results were found to be highly correlated (r > .985) with
the reference results. The average error in force ranged from -0.96 N to 0.83 N
and the average error in torque ranged from 0.10 Nm to 0.14 Nm.
Table 2.8 Results of dynamic testing
Loads (kg) Speed (m/s) Measure Correlation
Coefficient
Avg Error
(
STD Error
(
1.1737
0.5 0.989 -0.04 1.20
0.988 -0.20 1.32
0.999 0.13 0.08
1.0 0.994 0.31 0.93
0.993 -0.60 1.03
0.997 0.13 0.17
1.5 0.994 0.42 0.92
0.993 -0.81 1.16
0.986 0.11 0.35
2.2963
0.5 0.998 0.11 1.31
0.997 -0.28 1.25
0.999 0.14 0.11
1.0 0.998 0.83 1.22
0.998 -0.96 1.03
0.998 0.14 0.26
1.5 0.997 0.69 1.36
0.995 -0.60 1.55
0.998 0.10 0.25
2.4 Conclusion
The OptiPush Biofeedback System is a powerful research tool for studying
wheelchair propulsion technique. It wirelessly measures 3D forces and torques
applied to the handrim, along with the wheel angle during push. The modular
design of the instrumentation allows the device to incorporate 5 different wheel

38
sizes. The accompanying software calculates handrim loading and provides
biofeedback variables to wheelchair users. In validation tests, the system
demonstrated low measurement error in all forces and torques. Overall, the
functionality and accuracy of the system make it valid and useful in studies of
wheelchair propulsion.
39
CHAPTER III
TESTING THE OPTIPUSH BIOFEEDBACK SYSTEM
The OptiPush Biofeedback system is designed for studying manual
wheelchair propulsion technique and training wheelchair users. However, before
developing a training protocol or testing the effects of the biofeedback, we tested
the viability of OptiPush biofeedback system. We hypothesized that wheelchair
users would be able to: 1) interpret the biofeedback and make significant and
targeted changes to the variables, and 2) hit specific, change of the
nominal value as targets for select variables.
3.1 Methods
3.1.1 Participants
Thirty-one individuals were enrolled in this study. To be enrolled,
individuals had to use a manual wheelchair as their primary mode of
transportation, have complete function and sensation in the upper limbs, have no
upper limb pain that would impair propulsion, be able to propel for periods of up
to 5 minutes at a time, and use a manual wheelchair equipped with quick-release
rear wheels. Prior to enrollment, all participants were required to provide
40
informed consent. All study documents and test procedures were approved by
the Western Institutional Review Board (Olympia, WA).
3.1.2 Data Collection
The rear wheels of each participant‟s wheelchair were removed and
replaced with an OptiPush wheel on the right side and an inertia-matched
dummy wheel on the left. Both wheels were the same diameter as the
participant‟s normal rear wheels. With the testing wheels attached, participants
were asked to propel their wheelchair across a low-pile carpet to obtain nominal
propulsion data. Data from two trials, run in opposite directions across the floor,
were processed by the OptiPush software to determine speed, cadence, and
power output on a stroke-by-stroke basis. Participants were then loaded onto the
research treadmill and secured to the frame by attaching the two safety straps to
the front of the wheelchair. The speed of the treadmill was set to match each
participant‟s mean overground speed and the grade was set to elicit the same
power output as overground propulsion. Participants were given several minutes
to get acclimated to pushing on the treadmill. During this time, participants were
also told to try to match their cadence to a metronome set to beep at their
average overground cadence. Once participants were comfortable, a control
(normal propulsion) trial was captured. The trial lasted approximately 1 minute.
Wheel angle and the 3D forces and torques applied to the handrim were
recorded by the OptiPush Software. The mean speed, cadence, and power
output of the trial were checked against the overground means to ensure
41
similarities. If necessary, adjustments were made to the treadmill and the trial
was redone. The control trial served as the reference against which all
biofeedback trial results were compared.
3.1.3 Single-Variable Biofeedback
The OptiPush Software was set to display six biofeedback variables: two
primary variables (cadence and peak force) and four secondary variables
(braking torque, contact angle, push distance, and smoothness). Each of the
primary variables have been linked to upper limb pain and injury[35], while the
secondary variables may provide users with an alternate means of preserving
upper limb health. Targets were created for each biofeedback variable based on
the clinical practice guideline(CPG) recommendations[35]: Use long, smooth
strokes that limit high impacts on the pushrim. The goal of each target was to
reduce strain on the upper limb by reducing cadence and force. Depending on
the variable, this was targeted directly (primary variables) or indirectly (secondary
variables). Participants were asked to decrease cadence, peak force, and
braking torque, and to increase contact angle, push distance, and smoothness.
For most variables, two targets were set: an extreme change (minimize or
maximize the variable) and a subtle change (±10% of the nominal value). A 10%
change seemed like a reasonable target for a future propulsion training program.
Braking torque and smoothness do not typically have large margins for change;
therefore, participants were asked only to improve each variable as much as
possible. Table 3.1 provides the testing target for each variable.
42
Table 3.1 Targets for biofeedback variables
Variable Target(s)
Cadence Minimize cadence reduce by 10%
Peak Force Minimize peak force reduce by 10%
Braking Torque Minimize braking torque N/A
Contact Angle Maximize angle increase by 10%
Push Distance Maximize distance increase by 10%
Smoothness Maximize smoothness N/A
For each biofeedback condition, participants were shown a bar graph
displaying the stroke-by-stroke magnitude of a single variable on a monitor in
front of the treadmill (Figure 3.1a). The display also included a red 5-stroke
average line to help with targeting. Participants were asked to alter their
propulsion technique in order to change the height of the bars to reach each
target. For the minimize/maximize conditions, participants were asked to make
as great a change as possible, while keeping the height of each bar about the
same as the previous bars. For the 10% target conditions, a green target line
was displayed over the bar graph. Participants were asked to match the height of
each bar to the height of the target line, or in other words, to match the red 5-
stroke average line to the green target line (Figure 3.1b). To help the participants
understand what they needed to do to change each variable, we described the
possible changes in propulsion technique. For example, we explained that to
reduce peak force, users could increase contact angle, increase cadence, or
possibly increase fraction of effective force[19].
43
(a) (b)
Figure 3.1 The testing setup (a) and biofeedback display (b) used in this study.
Variables were selected and presented in a randomized order. Within
each variable, the minimize/maximize condition was run first and the 10%
change condition second. This was done to help participants get more
comfortable responding to the variable before attempting the more controlled 10%
change condition. Participants were given 30-90 seconds to adapt their
technique enough to reach each target. Once they had approximately reached
the target, data collection was started. OptiPush data were recorded for 1 minute.
In the event that the participant could not understand the variable or how to
adjust its value, further explanation was provided and the trial was repeated.
Participants were given several minutes to rest in between each trial to avoid
fatigue.
44
3.1.4 Data Analysis
For each condition and each participant, the value of the biofeedback
variable was averaged across all strokes and compared to the mean control
variable. This yielded the mean relative change (%) of each variable. The relative
changes were analyzed with a series of independent samples t-tests. To account
for the 10 individual comparisons, alpha was adjusted to .005.
3.2 Results
3.2.1 Participants
Thirty-one manual wheelchair users (27 males, 4 females) participated in
the study. Twenty-three participants had paraplegia (T3-L1), 1 had tetraplegia
(C6-7 incomplete), 6 had spina bifida (T10-L5), and 1 had cerebral palsy. On
average, the participants were 34.1 9.5 years old and had 15.0 10.2 years of
manual wheelchair experience. Table 3.2 shows the mean variables for normal
wheelchair propulsion (control trial) on the treadmill.
3.2.2 Viability of Biofeedback
For each feedback condition, mean speed decreased, but remained within
0.5% of normal propulsion speed. Changes in power output were less than 5%
(0.45% - 4.93%), except for the „Maximize Contact Angle‟ condition, in which the
power output increased 7.82%. Table 3.3 shows the percent change in each
variable between the biofeedback condition and the control trial. For nine of the
45
eleven conditions, participants were able to significantly (p < .005) improve the
value of the biofeedback variable. Participants exhibited good control over
cadence, push distance, and especially, contact angle. For the 10% target
condition, the mean contact angle error was 0.07% and the standard deviation
was the smallest (4.4%) of any condition. On the other hand, participants had
difficulty making significant changes to peak force and smoothness. At most, they
were able to decrease peak force an average of 11.37%. Although this was
greater than the -10% target set for the following trial, they were unable to reach
the target, reducing peak force by only 3.9%. A similarly small increase and high
variability were seen in smoothness for the „Maximize Smoothness‟ condition.
Table 3.2 Normal propulsion variables
Variable Value
Speed 1.10 (0.23) m/s
Power Output 8.52 (2.50) W
Treadmill Angle 0.82 (0.27) degrees
Braking Torque 0.80 (0.37) Nm
Contact Angle 87.03 (17.79) degrees
Cadence 52.41 (10.88) strokes/min
Push Distance 1.33 (0.41) m
Peak Force 57.38 (12.93) N
Smoothness 0.67 (0.05)
Values are mean (standard deviation [SD])
46
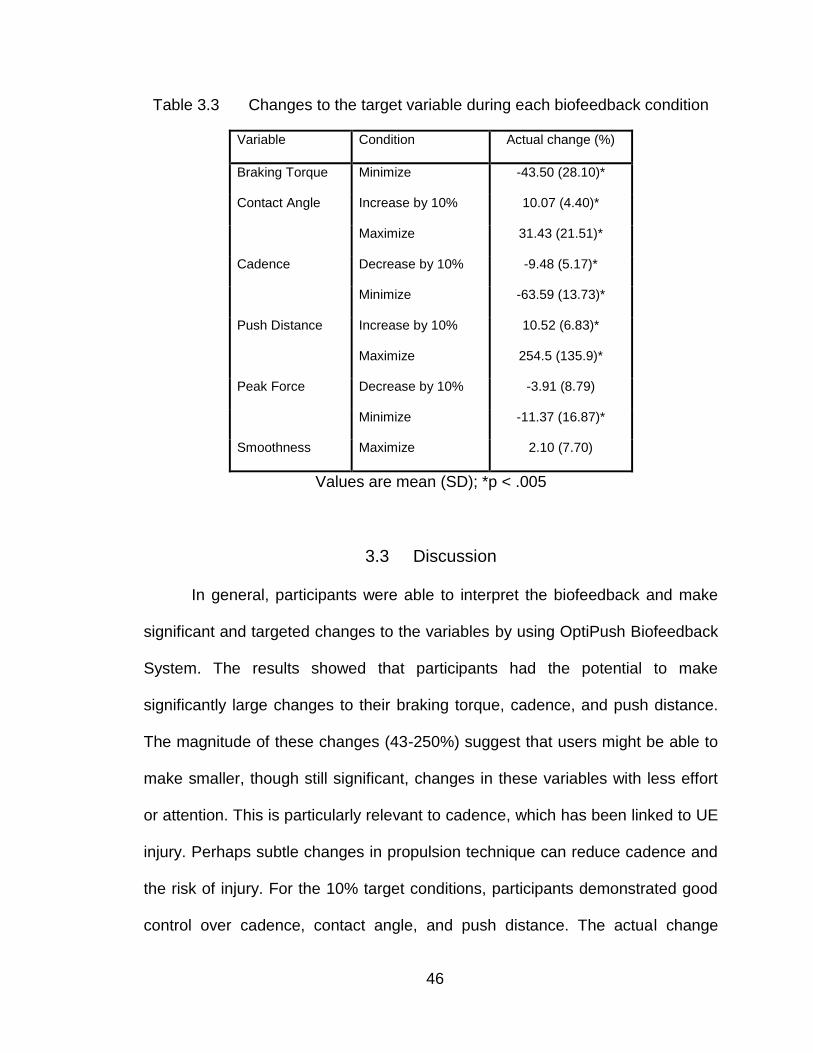
Table 3.3 Changes to the target variable during each biofeedback condition
Variable Condition Actual change (%)
Braking Torque Minimize -43.50 (28.10)*
Contact Angle Increase by 10% 10.07 (4.40)*
Maximize 31.43 (21.51)*
Cadence Decrease by 10% -9.48 (5.17)*
Minimize -63.59 (13.73)*
Push Distance Increase by 10% 10.52 (6.83)*
Maximize 254.5 (135.9)*
Peak Force Decrease by 10% -3.91 (8.79)
Minimize -11.37 (16.87)*
Smoothness Maximize 2.10 (7.70)
Values are mean (SD); *p < .005
3.3 Discussion
In general, participants were able to interpret the biofeedback and make
significant and targeted changes to the variables by using OptiPush Biofeedback
System. The results showed that participants had the potential to make
significantly large changes to their braking torque, cadence, and push distance.
The magnitude of these changes (43-250%) suggest that users might be able to
make smaller, though still significant, changes in these variables with less effort
or attention. This is particularly relevant to cadence, which has been linked to UE
injury. Perhaps subtle changes in propulsion technique can reduce cadence and
the risk of injury. For the 10% target conditions, participants demonstrated good
control over cadence, contact angle, and push distance. The actual change
47
made to each variable was within 0.52% of the target. In particular, the accuracy
and precision with which changes were made to contact angle were impressive.
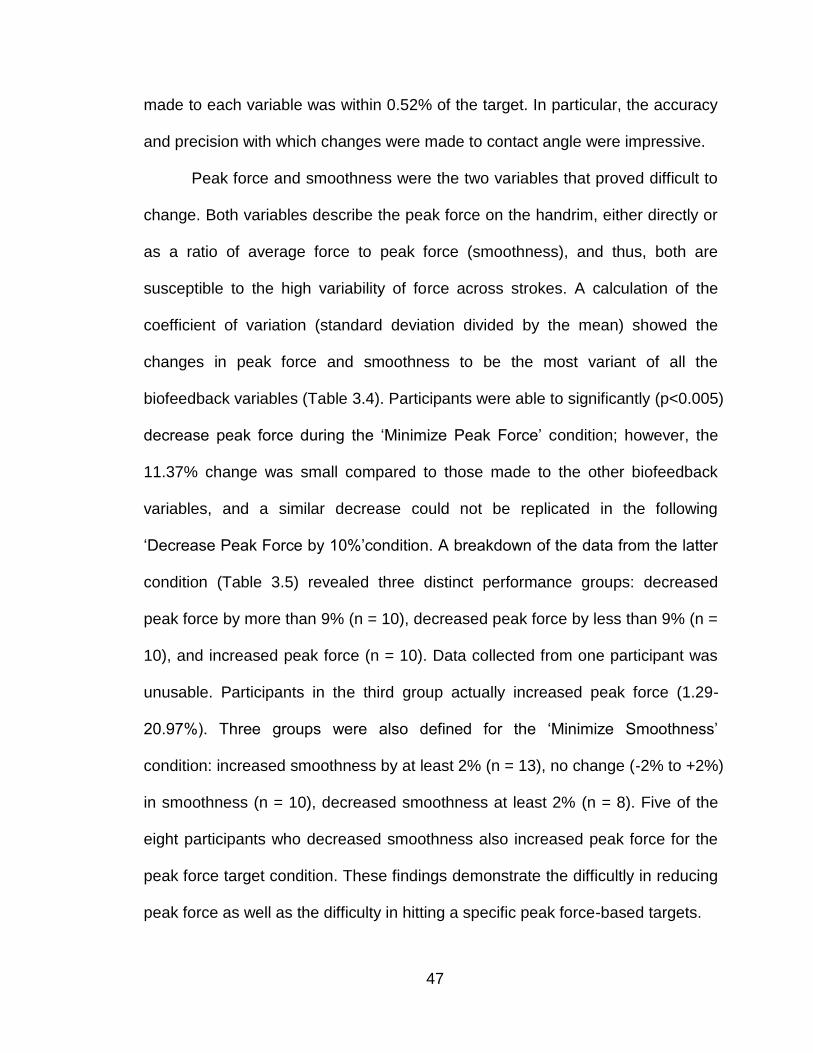
Peak force and smoothness were the two variables that proved difficult to
change. Both variables describe the peak force on the handrim, either directly or
as a ratio of average force to peak force (smoothness), and thus, both are
susceptible to the high variability of force across strokes. A calculation of the
coefficient of variation (standard deviation divided by the mean) showed the
changes in peak force and smoothness to be the most variant of all the
biofeedback variables (Table 3.4). Participants were able to significantly (p<0.005)
decrease peak force during the „Minimize Peak Force‟ condition; however, the
11.37% change was small compared to those made to the other biofeedback
variables, and a similar decrease could not be replicated in the following
„Decrease Peak Force by 10%‟condition. A breakdown of the data from the latter
condition (Table 3.5) revealed three distinct performance groups: decreased
peak force by more than 9% (n = 10), decreased peak force by less than 9% (n =
10), and increased peak force (n = 10). Data collected from one participant was
unusable. Participants in the third group actually increased peak force (1.29-
20.97%). Three groups were also defined for the „Minimize Smoothness‟
condition: increased smoothness by at least 2% (n = 13), no change (-2% to +2%)
in smoothness (n = 10), decreased smoothness at least 2% (n = 8). Five of the
eight participants who decreased smoothness also increased peak force for the
peak force target condition. These findings demonstrate the difficultly in reducing
peak force as well as the difficulty in hitting a specific peak force-based targets.
48
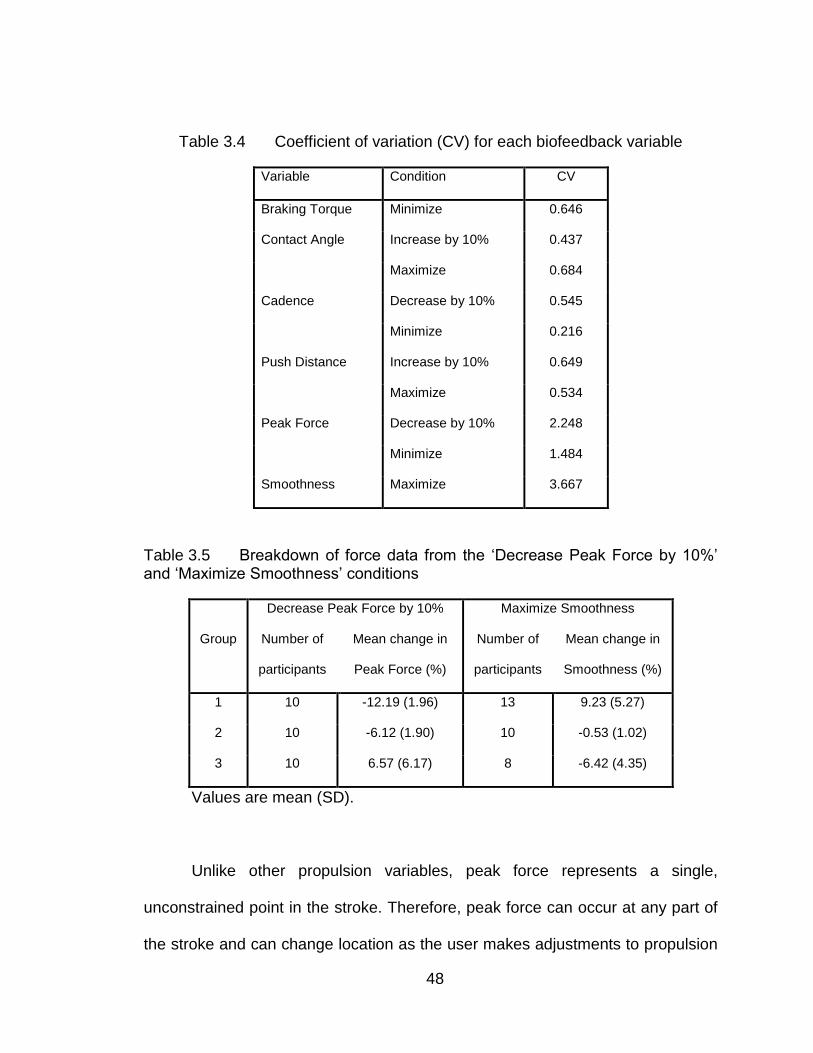
Table 3.4 Coefficient of variation (CV) for each biofeedback variable
Variable Condition CV
Braking Torque Minimize 0.646
Contact Angle Increase by 10% 0.437
Maximize 0.684
Cadence Decrease by 10% 0.545
Minimize 0.216
Push Distance Increase by 10% 0.649
Maximize 0.534
Peak Force Decrease by 10% 2.248
Minimize 1.484
Smoothness Maximize 3.667
Table 3.5 Breakdown of force data from the „Decrease Peak Force by 10%‟ and „Maximize Smoothness‟ conditions
Group
Decrease Peak Force by 10% Maximize Smoothness
Number of
participants
Mean change in
Peak Force (%)
Number of
participants
Mean change in
Smoothness (%)
1 10 -12.19 (1.96) 13 9.23 (5.27)
2 10 -6.12 (1.90) 10 -0.53 (1.02)
3 10 6.57 (6.17) 8 -6.42 (4.35)
Values are mean (SD).
Unlike other propulsion variables, peak force represents a single,
unconstrained point in the stroke. Therefore, peak force can occur at any part of
the stroke and can change location as the user makes adjustments to propulsion
49
technique. This likely increases the difficulty for manual wheelchair users to
control its value. To help manual wheelchair users make more significant
reductions in peak force, additional feedback may be necessary.
3.4 Conclusions
Biofeedback is an effective method of generating improvements in manual
wheelchair handrim biomechanics. Participants were able to use the biofeedback
provided by OptiPush to make significant and controlled changes to cadence,
push distance, and contact angle. Significant changes were also made to braking
torque and peak force; however, the improvements in peak force were limited
and variable. Additional or altered biofeedback is needed to help users increase
smoothness and decrease peak force.
50
CHAPTER IV
MULTIVARIABLE BIOFEEDBACK DESIGN & TESTING
By studying on the effects of single-variable biofeedback, we observed the
ability of subjects to make both large and targeted changes in a number of
propulsion variables, including braking moment, cadence, contact angle, peak
force and push distance and smoothness. Using a real-time, stroke-by-stroke bar
graph, subjects were able to make significant changes to each biofeedback
variable, except for smoothness. Subjects could only increase smoothness by
2%, but in attempting to maximize smoothness, they decreased braking moment
(-20%), cadence (-9%) and impact (-7%), while increasing contact angle (6%)
and push distance (15%). These types of cross-variable interactions allowed
users to make improvements across multiple variables without having to actively
monitor each variable. Unfortunately, no test condition resulted in indirect
improvements to peak force. Peak force could only be reduced when it was the
biofeedback variable, and even then, the improvement was relatively small (11%
decrease). The modest decrease in peak force (-11.3%) also came at the cost of
cadence, which increased by 20%. While single-variable biofeedback can be
beneficial for teaching some aspects of wheelchair use, like maintaining a safe
speed, a multivariable approach is needed to address the negative tradeoffs and
the difficulties in lowering peak force.
51
4.1 Multivariable biofeedback design
Biofeedback is a learning strategy deriving from psychological learning
theory. Its theoretical basis is "operant conditioning" or "learning through
reinforcement" in the tradition of B.F. Skinner [27]. In order to maximize the
effectiveness of biofeedback, Mark Stephen Schwartz, et al. suggests minimizing
the effort required from users [28].
The OptiPush single variable biofeedback interface provides push-to-push
results as a bar chart to users. Some of the variables like speed and cadence
were calculated from over the entire push-recovery cycle. Peak force and contact
angle, however were calculated over the push phase only, allowing for a more
immediate feedback of that information. While providing this information prior to
the next push likely helped improve the user's ability to respond to it before
engaging in the next push, peak force was still found to be difficult if not
impossible for the majority of the users.
It was hypothesized that providing handrim force continuously over the
push would allow the user to better identify with it and control it. There are many
instances in the literature where continuous or moment-to-moment feedback was
found to be an effective approach to either increase or decrease an individual's
force production or muscle activity [29-33]. In particular, Steven Cohen, et al.
compared the effect between continuous reinforcement (feedback) and
52
intermittent reinforcement for muscle activity training [34]. Their results showed
that continuous feedback led to the best performance.
Based on these results, a time-based handrim force profile plot was
developed that refreshed with each push. The approach to focus on one
individual push at a time was chosen to maximize the visual scale of each push
and to emphasize the current push. Internal testing among lab staff and select
pilot users showed considerable promise in improving control of peak force.
However, as was found in the single variable biofeedback results, efforts to
decrease handrim force resulted in increases in cadence.
In an attempt to control both peak handrim force and cadence, the time-
based force graph was positioned next to the bar chart biofeedback display used
in the single variable study. The bar chart was set to cadence and the system
was tested internally. The dual display of force and cadence was too complex to
interpret. With the two independent displays of information, the tendency was to
focus on one display or the other, but watching both was not possible for any of
the internal testers. The results of this round of testing reinforced the need for
biofeedback to minimize the effort required by the individual to interpret it [2].
It was further hypothesized that a biofeedback display that incorporated
both handrim force and cadence information simultaneously would enable users
to achieve the desired performance goals. To achieve this, a metronome beep
was introduced to provide a cadence goal, while visually focusing on the time-
based force graph. Our internal test group evaluated the new audio-visual
biofeedback and found it to be much easier to follow than the dual-display
53
approach. However, it was easy to fall behind and lose timing with the prescribed
frequency.
While the use of audio enabled both force and cadence to be conveyed
simultaneously, the cadence was not actually biofeedback of the user's
performance. It was simply a desired goal. As the user varied cadence, the
metronome beep did not change in response. It was hypothesized that contact
angle might be an effective surrogate to induce changes in cadence. Contact
angle was found to be negatively correlated with cadence in the single variable
study, so increases in contact angle resulted in decreases in cadence. Based on
these results, a new approach was envisioned, where handrim force is plotted as
a function of contact angle, rather than time. With this approach, the user would
be presented with a force-spatial relationship, allowing the two biofeedback
variables to coexist on the same graph.
Based on this idea, a new multi-variable biofeedback design was
developed that combined force and contact angle (Figure 4.1). Each vertical bar
represents the average force over each 3 degrees of contact angle. The bar
graph calculates from push start to push end and refreshes at push start. The
highest bar represents peak force. The number of bars indicates the contact
angle of current push. From this interface, users can interpret at what wheel
angle or at which position on the handrim the peak push force is reached. A
horizontal target line was used to define the maximum acceptable peak force and
a vertical target line was used to determine the smallest acceptable contact angle
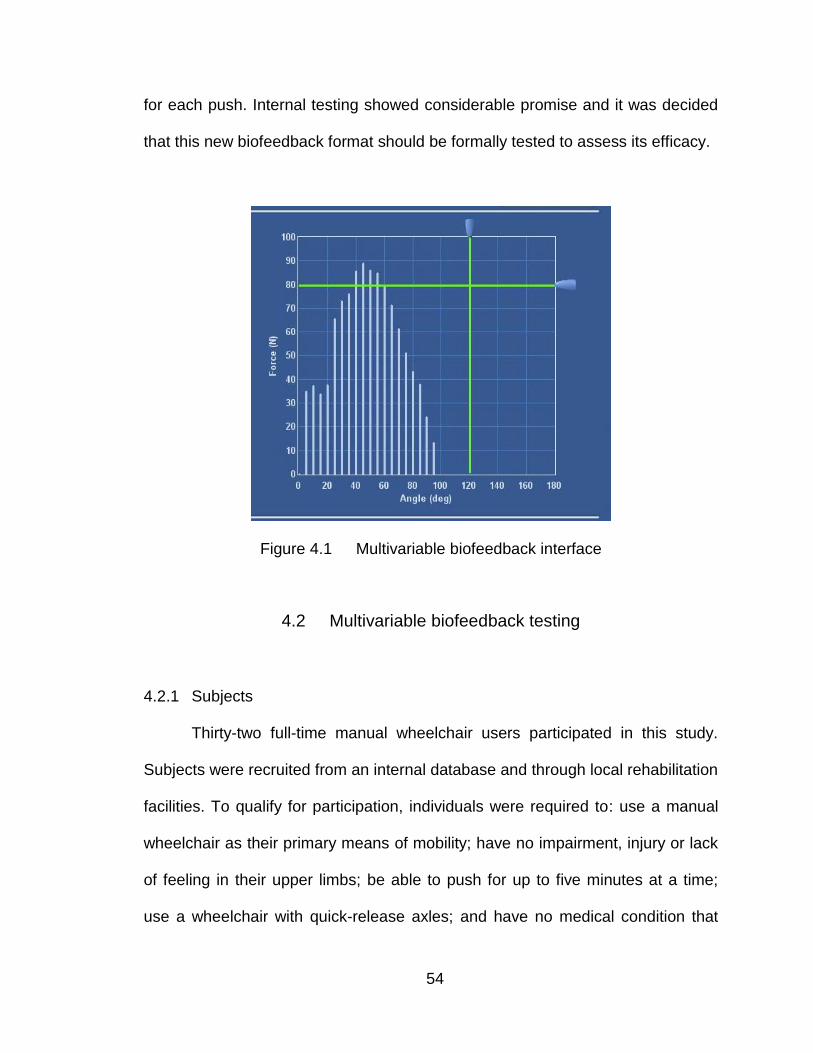
54
for each push. Internal testing showed considerable promise and it was decided
that this new biofeedback format should be formally tested to assess its efficacy.
Figure 4.1 Multivariable biofeedback interface
4.2 Multivariable biofeedback testing
4.2.1 Subjects
Thirty-two full-time manual wheelchair users participated in this study.
Subjects were recruited from an internal database and through local rehabilitation
facilities. To qualify for participation, individuals were required to: use a manual
wheelchair as their primary means of mobility; have no impairment, injury or lack
of feeling in their upper limbs; be able to push for up to five minutes at a time;
use a wheelchair with quick-release axles; and have no medical condition that
55
could be aggravated by propulsion or moderate exercise. All subjects provided
written informed consent prior to enrollment; and all forms and testing procedures
were approved by the Western Institutional Review Board (Olympia, WA).
4.2.2 Data Collection
Each subject completed several forms that addressed personal and injury
information, including date of birth, date of injury, and level of injury. The weight
of the subject and wheelchair were obtained with a wheelchair scale. The rear
wheels were then replaced with a pair of OptiPush wheels, which can record
wheel angle, wheel speed and the tri-axial forces and moments applied to the
handrim at 200 Hz. Left and right side wheel data were recorded by two
individual computers and they started recording data at same time by using an
external trigger. Both wheels were the same diameter as the subject's own
wheels (501mm - 590mm) and were fitted with low-profile tires inflated to 689
kPa (100 psi). Once the wheels were replaced, subjects were secured to a
motor-driven treadmill with a pair of straps attached to the front of the wheelchair.
The straps glide along rails on the side of the treadmill and keep the wheelchair
from rolling off the belt while adding minimal rolling resistance. For all trials, the
treadmill was set to a speed of 1.34 m/s and a grade of 0.5 degrees.
Testing began with a five minute warm-up period to allow subjects to get
comfortable pushing on the treadmill. After a rest period of at least five minutes, a
1-minute normal propulsion trial was completed. During the trial, bilateral handrim
biomechanics were recorded by the two OptiPush wheels. Data were filtered with
56
a 4th order Butterworth digital filter (20 Hz cutoff frequency) and segmented in
push strokes based on moment about the axle. Conditioned force, moment and
wheel angle measurements were used to compute 11 stroke-by-stroke variables.
This investigation focused on 4 outcome variables: contact angle, cadence, peak
force, impact; the latter three of which have been linked to signs of upper limbs
injury[10;10-12]. The normal trial served as the baseline for all subsequent
changes in handrim biomechanics.
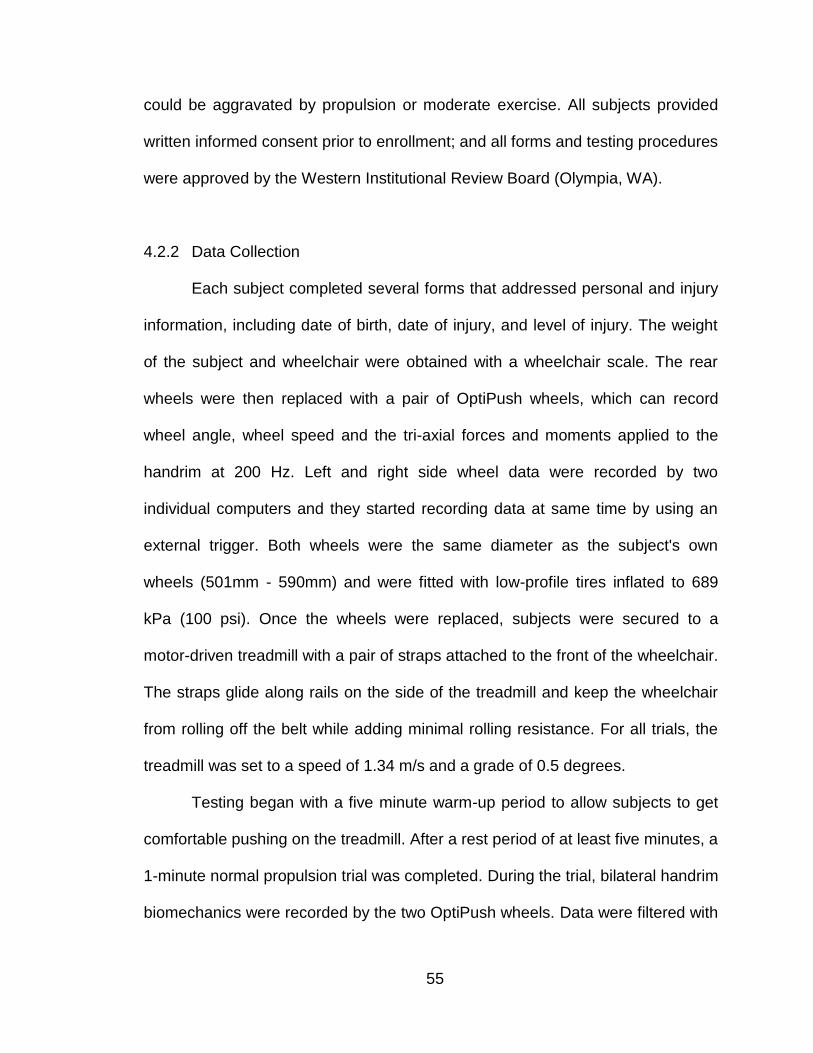
Next, subjects watched an education video (Figure 4.2) that demonstrated
the recommendations of the Clinical Practice Guideline (CPG) [35]. The video
encouraged subjects to spread their push force over a large contact angle - a
technique that can be used to reduce peak force and cadence while holding
speed constant. The video also explained how approaching the handrim from
below can help match the movement of the hand to the arc and rotation of the
handrim. This enables users to reduce impact during initial contact and improve
early push phase efficiency[36]. After watching the video, subjects attempted to
push with longer, smoother, under-rim strokes[36]. Subjects were free to use
either the semicircular or double loop stroke pattern. This education trial lasted
up to 2 minutes. Subjects were given 1 minute to settle into their new push
technique before bilateral handrim biomechanics were recorded for 1 minute.
57
(a) (b)
Figure 4.2 Education video that demonstrated (a) contact angle; (b) longer push stroke advantages.
Subjects then watched a second video describing the multivariable
biofeedback display (Figure 4.3). The values of the target lines for the 2-D
biofeecback were initially set to the average peak force and contact angle from
each subject's normal propulsion trial. As testing progressed, the target lines
were adjusted to promote further improvements after the subject had surpassed
the former goals. Throughout the biofeedback trials, subjects were encouraged to
achieve lower forces by spreading their pushes over a larger contact angle. This
was an individualized process that included specific recommendations based on
trial by trial observations and measurements. Table 4.1 lists the primary
recommendations given to each subject. Beyond stressing the recommendations
of the CPG (Table 4.1, points 1-3), subjects were advised to start the push stroke
by pulling upward on the handrim before pushing forward. This can expedite the
generation of a propulsive moment and help users get more out of the beginning
of the push stroke. It can also eliminate the need for strong triceps contraction, or
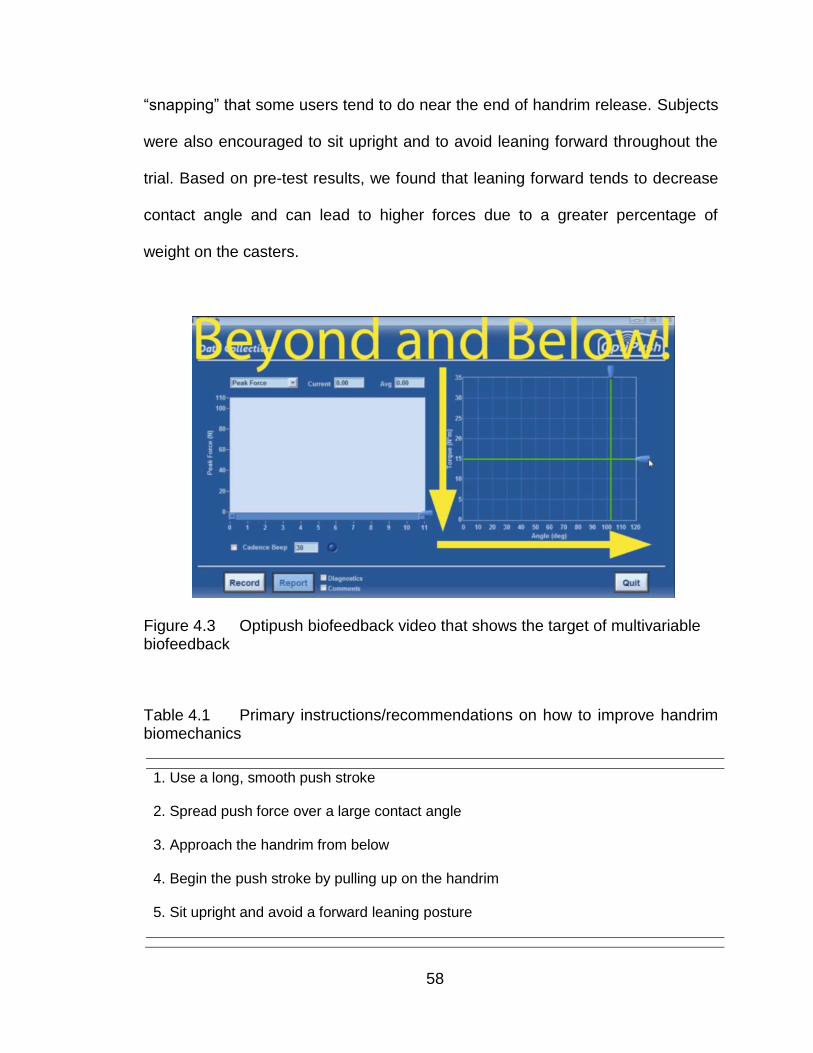
58
“snapping” that some users tend to do near the end of handrim release. Subjects
were also encouraged to sit upright and to avoid leaning forward throughout the
trial. Based on pre-test results, we found that leaning forward tends to decrease
contact angle and can lead to higher forces due to a greater percentage of
weight on the casters.
Figure 4.3 Optipush biofeedback video that shows the target of multivariable biofeedback
Table 4.1 Primary instructions/recommendations on how to improve handrim biomechanics
1. Use a long, smooth push stroke
2. Spread push force over a large contact angle
3. Approach the handrim from below
4. Begin the push stroke by pulling up on the handrim
5. Sit upright and avoid a forward leaning posture
59
When necessary, additional techniques were implemented to promote
improvements. An auditory beep was used to help some subjects maintain
improvements in cadence. For those who had difficulty reducing peak force,
efforts were first focused on minimizing cadence without increasing peak force.
Once subjects were comfortable pushing at the low cadence, they gradually
increased push frequency to help reduce peak force. Testing was completed for
each subject when no further improvements in cadence, peak force and impact
could be made. Across all subjects, the total number of trials ranged from 5 to 15,
including the normal and education trials.
4.2.3 Data Analysis
Both left and right sides stroke-by-stroke values of contact angle, cadence,
peak force and impact were averaged across all strokes within each trial. Three
trials were selected from each subject: the normal trial, the education (EDU) trial,
and the best multi-variable biofeedback (BMB) trial. All trial results for a subject
were shown in Table 4.2. The BMB trial was the trial that resulted in the largest
combined decrease in cadence, peak force, and impact. Trail 5 in table 4.2 was
selected to be the BMB trial. To be considered for the BMB trial, all three values
had to decrease by at least 5%. If a subject was unable to achieve these
improvements, the requirements were loosened to include all trials in which
cadence, peak force and impact decreased by any percentage. If no trials met
these requirements, all trials were considered.
60
Once the BMB trial was selected for each subject, the average values of
contact angle, cadence, peak force and impact were compared with the averages
from the normal trial and the EDU trial. Results were normalized within subject by
computing the relative change (%) in each variable. Percent changes were then
averaged across subjects to determine the overall effect of each training
component (EDU and BMB) and the relative differences between the two
components. Paired t-tests were used to determine the significance of each
percent change. To account for the 12 individual comparisons, alpha was
adjusted to .004. The slope R1 and R2 values for each regression were
determined in Matlab.
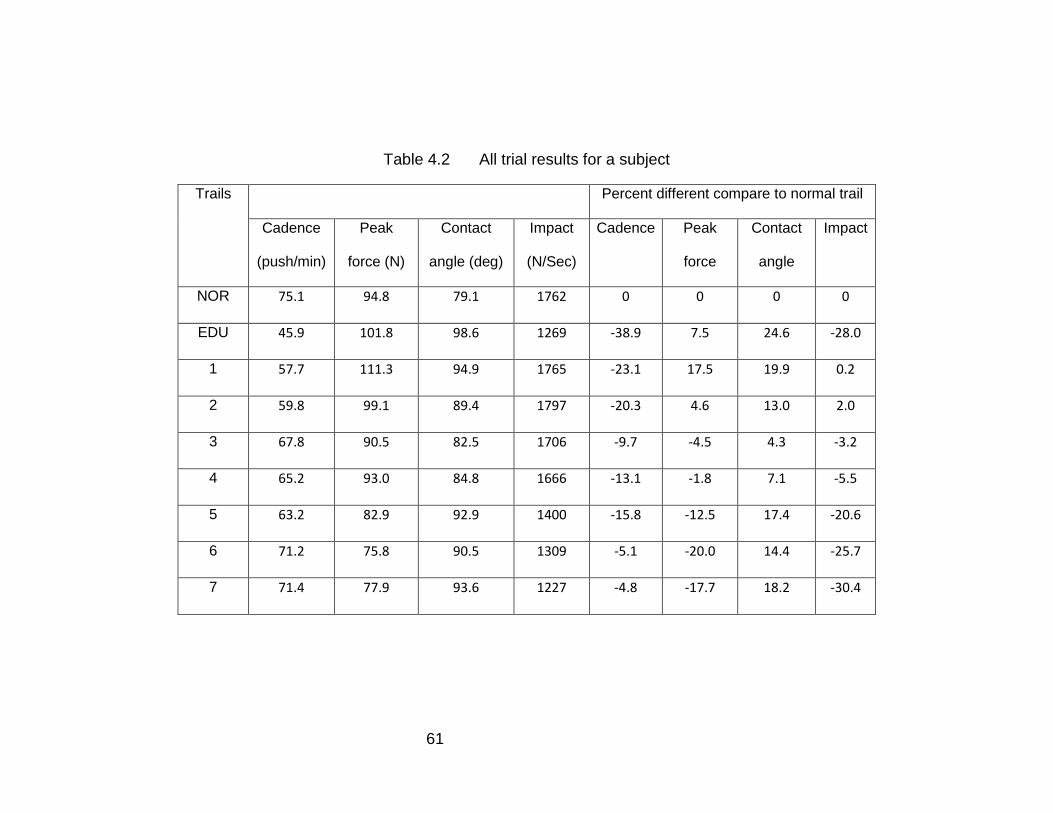
61
Table 4.2 All trial results for a subject
Trails Percent different compare to normal trail
Cadence
(push/min)
Peak
force (N)
Contact
angle (deg)
Impact
(N/Sec)
Cadence Peak
force
Contact
angle
Impact
NOR 75.1 94.8 79.1 1762 0 0 0 0
EDU 45.9 101.8 98.6 1269 -38.9 7.5 24.6 -28.0
1 57.7 111.3 94.9 1765 -23.1 17.5 19.9 0.2
2 59.8 99.1 89.4 1797 -20.3 4.6 13.0 2.0
3 67.8 90.5 82.5 1706 -9.7 -4.5 4.3 -3.2
4 65.2 93.0 84.8 1666 -13.1 -1.8 7.1 -5.5
5 63.2 82.9 92.9 1400 -15.8 -12.5 17.4 -20.6
6 71.2 75.8 90.5 1309 -5.1 -20.0 14.4 -25.7
7 71.4 77.9 93.6 1227 -4.8 -17.7 18.2 -30.4
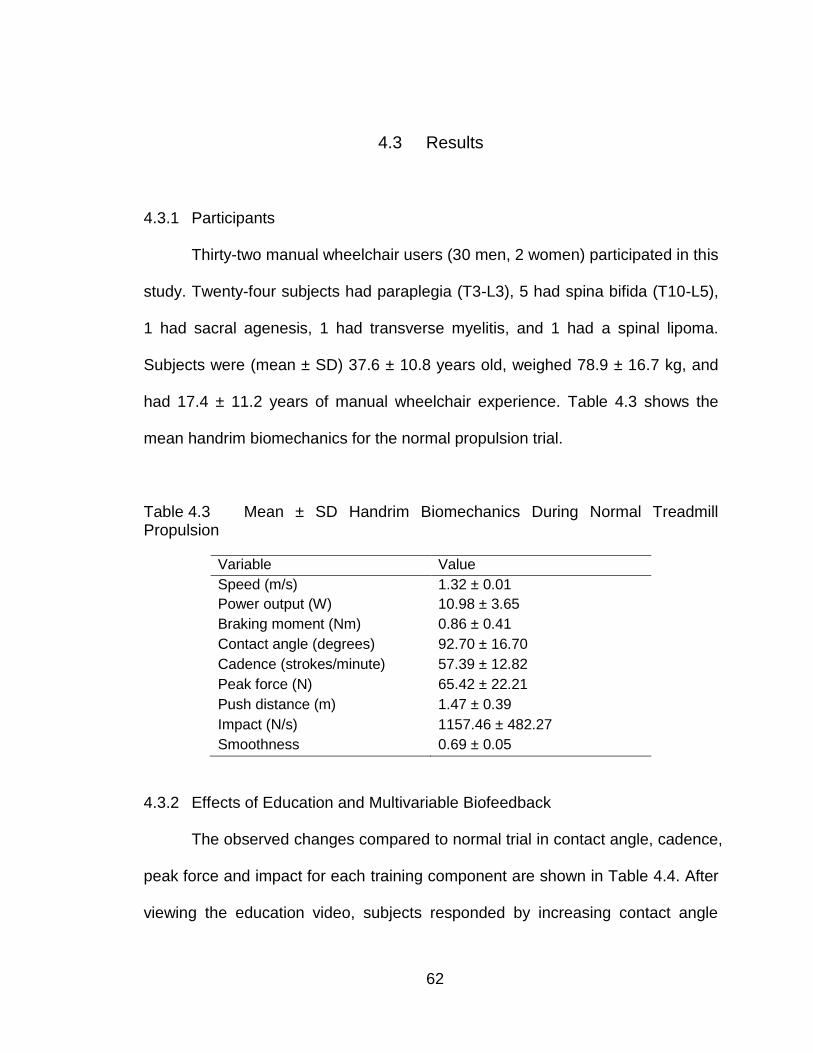
62
4.3 Results
4.3.1 Participants
Thirty-two manual wheelchair users (30 men, 2 women) participated in this
study. Twenty-four subjects had paraplegia (T3-L3), 5 had spina bifida (T10-L5),
1 had sacral agenesis, 1 had transverse myelitis, and 1 had a spinal lipoma.
Subjects were (mean ± SD) 37.6 ± 10.8 years old, weighed 78.9 ± 16.7 kg, and
had 17.4 ± 11.2 years of manual wheelchair experience. Table 4.3 shows the
mean handrim biomechanics for the normal propulsion trial.
Table 4.3 Mean ± SD Handrim Biomechanics During Normal Treadmill Propulsion
Variable Value
Speed (m/s) 1.32 ± 0.01
Power output (W) 10.98 ± 3.65
Braking moment (Nm) 0.86 ± 0.41
Contact angle (degrees) 92.70 ± 16.70
Cadence (strokes/minute) 57.39 ± 12.82
Peak force (N) 65.42 ± 22.21
Push distance (m) 1.47 ± 0.39
Impact (N/s) 1157.46 ± 482.27
Smoothness 0.69 ± 0.05
4.3.2 Effects of Education and Multivariable Biofeedback
The observed changes compared to normal trial in contact angle, cadence,
peak force and impact for each training component are shown in Table 4.4. After
viewing the education video, subjects responded by increasing contact angle
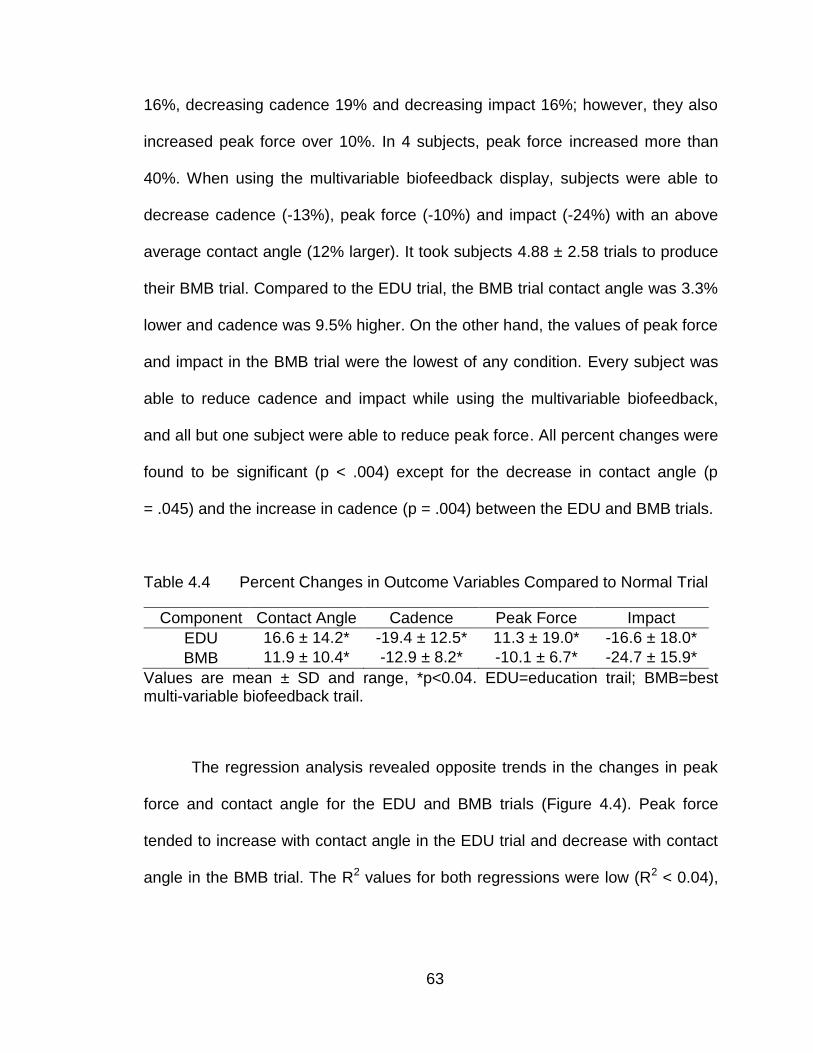
63
16%, decreasing cadence 19% and decreasing impact 16%; however, they also
increased peak force over 10%. In 4 subjects, peak force increased more than
40%. When using the multivariable biofeedback display, subjects were able to
decrease cadence (-13%), peak force (-10%) and impact (-24%) with an above
average contact angle (12% larger). It took subjects 4.88 ± 2.58 trials to produce
their BMB trial. Compared to the EDU trial, the BMB trial contact angle was 3.3%
lower and cadence was 9.5% higher. On the other hand, the values of peak force
and impact in the BMB trial were the lowest of any condition. Every subject was
able to reduce cadence and impact while using the multivariable biofeedback,
and all but one subject were able to reduce peak force. All percent changes were
found to be significant (p < .004) except for the decrease in contact angle (p
= .045) and the increase in cadence (p = .004) between the EDU and BMB trials.
Table 4.4 Percent Changes in Outcome Variables Compared to Normal Trial
Component Contact Angle Cadence Peak Force Impact
EDU 16.6 ± 14.2* -19.4 ± 12.5* 11.3 ± 19.0*
-16.6 ± 18.0*
BMB 11.9 ± 10.4* -12.9 ± 8.2* -10.1 ± 6.7* -24.7 ± 15.9*
Values are mean ± SD and range, *p<0.04. EDU=education trail; BMB=best multi-variable biofeedback trail.
The regression analysis revealed opposite trends in the changes in peak
force and contact angle for the EDU and BMB trials (Figure 4.4). Peak force
tended to increase with contact angle in the EDU trial and decrease with contact
angle in the BMB trial. The R2 values for both regressions were low (R2 < 0.04),
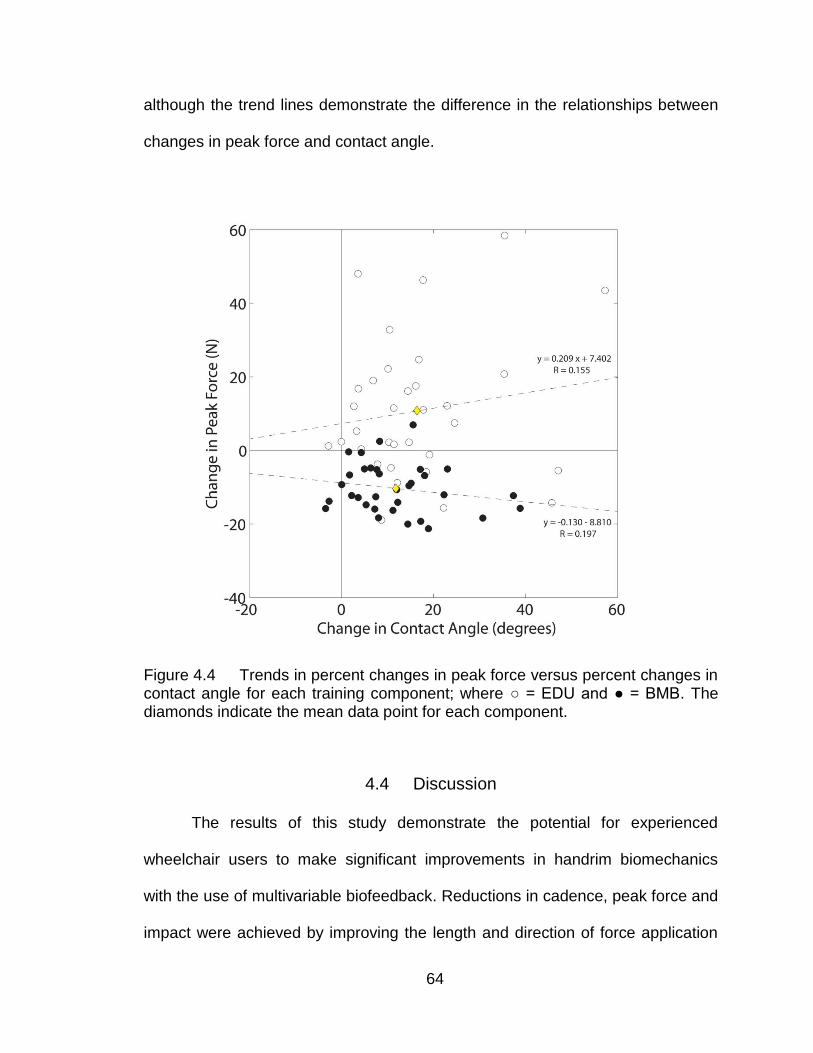
64
although the trend lines demonstrate the difference in the relationships between
changes in peak force and contact angle.
Figure 4.4 Trends in percent changes in peak force versus percent changes in contact angle for each training component; where ○ = EDU and ● = BMB. The diamonds indicate the mean data point for each component.
4.4 Discussion
The results of this study demonstrate the potential for experienced
wheelchair users to make significant improvements in handrim biomechanics
with the use of multivariable biofeedback. Reductions in cadence, peak force and
impact were achieved by improving the length and direction of force application
65
on the handrim. The other critical component was the use of real-time force
feedback. By monitoring continuous force profiles, subjects were able to avoid
the increases in peak force that tend to occur when contact angle is
increased[21]. Not only did subjects avoid increasing peak force, many
decreased peak force by as much as 21%. The decrease was associated with a
more moderate increase in contact angle and a smaller decrease in cadence.
The multivariable biofeedback used in this study was unique in that it
featured a continuous plot of force versus contact angle and included target lines
for each variable. From this interface, users can interpret at what wheel angle or
at which position on the handrim the peak push force is reached and, if
necessary, the amount of change needed to keep peak force below the
maximum force line. At the same time, contact angle was evident by the length of
the force profile or the number of vertical bars. The vertical target line reminded
subjects to extend force application beyond their typical contact angle. The goal
of this study is reducing peak force and cadence concurrently. The Multivariable
biofeedback translated this goal to a simple way which is pushing below and
beyond the two target lines. All these features of the multivariable biofeedback
allow users to interpret the reinforcement (feedback) without too much focus.
Previous multivariable biofeedback displays have consisted of either a
plot-table combination[21] or a discontinuous series of bar graphs[37], both of
which seem to complicate the process of propulsion training. DeGroot et al. [21]
used the SmartWheel Data Viewer to provide real-time feedback to subjects. The

66
Data Viewer includes plots of speed and tangential force along with a numeric
display of time, speed and distance, and a table of current push values. The
display was intended to be viewed by clinicians, who can follow specific variables
of interest, not by users who may be overwhelmed by the amount of information
on screen. The inability of subjects to reduce their peak force using the Data
Viewer may be attributed to the complexity of the display. On the other hand, the
biofeedback display developed by Rice et al.[37] was designed to maximize
learning, focus, and transfer of motor skills. The biofeedback featured a
discontinuous display of bar graphs of speed, contact angle and cadence.
Although the display was consistent with motor learning theory, it would at times
display all three bar graphs at once. The approach may have benefitted from
consolidating contact angle and cadence and including force feedback, which
may have helped reduce peak force.
Despite the overall success, the multivariable biofeedback training did not
help every subject improve. It is important to remember that these results do not
reflect the quality of each subject's propulsion technique, just their ability to
improve. Some subjects began the study with excellent technique and admirable
handrim biomechanics. Table 4.5 shows the data for 3 example subjects. Both
subject 1 and subject 2 achieved small amount of combined reduction in cadence,
peak force and impact. Subject 1 had an excellent propulsion technique with low
peak force and low impact compared to other subjects, for example, subject 3.
So subject 1 was not able to improve with the multivariable biofeedback.
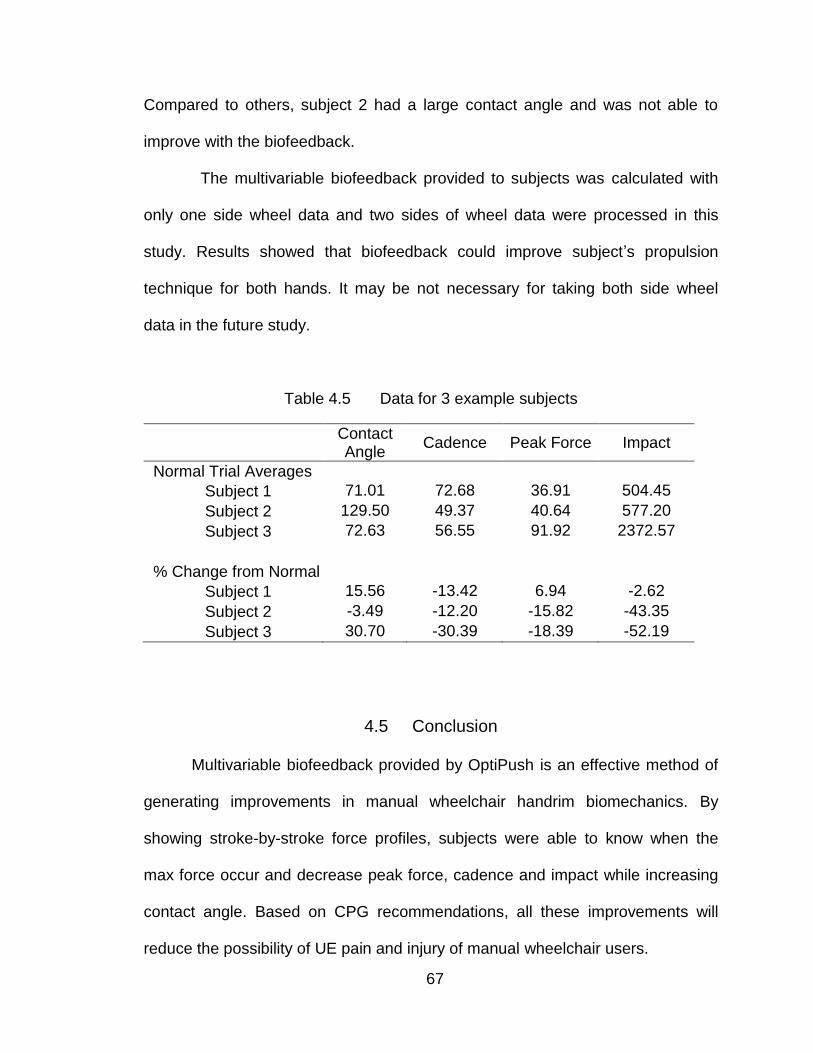
67
Compared to others, subject 2 had a large contact angle and was not able to
improve with the biofeedback.
The multivariable biofeedback provided to subjects was calculated with
only one side wheel data and two sides of wheel data were processed in this
study. Results showed that biofeedback could improve subject‟s propulsion
technique for both hands. It may be not necessary for taking both side wheel
data in the future study.
Table 4.5 Data for 3 example subjects
Contact Angle
Cadence Peak Force Impact
Normal Trial Averages
Subject 1 71.01 72.68 36.91 504.45
Subject 2 129.50 49.37 40.64 577.20
Subject 3 72.63 56.55 91.92 2372.57
% Change from Normal
Subject 1 15.56 -13.42 6.94 -2.62
Subject 2 -3.49 -12.20 -15.82 -43.35
Subject 3 30.70 -30.39 -18.39 -52.19
4.5 Conclusion
Multivariable biofeedback provided by OptiPush is an effective method of
generating improvements in manual wheelchair handrim biomechanics. By
showing stroke-by-stroke force profiles, subjects were able to know when the
max force occur and decrease peak force, cadence and impact while increasing
contact angle. Based on CPG recommendations, all these improvements will
reduce the possibility of UE pain and injury of manual wheelchair users.

68
CHAPTER V
CONCLUSION AND FUTURE DIRECTIONS
5.1 Project summary
In this project, the OptiPush Biofeedback System was designed,
implemented, validated and tested. Physically, the system provides simple
installation on most wheelchairs for a variety of wheel sizes. Functionally, the
system provides acceptable accuracy and low error in measurements of wheel
angle, speed, and handrim loading (in both static and dynamic conditions). The
system calculates several variables that related to propulsion technique and
provides this information to users as a real-time biofeedback. Testing of the
biofeedback revealed a viable means of improving propulsion technique.
Participants were able to make significant and controlled changes to both single
and multi-variables biofeedback.
5.2 System application
The OptiPush biofeecback system is not only a wheelchair propulsion
measurement device but also acts as a training tool that can improve wheelchair
propulsion technique. Besides the work done by this project, the system is also
well used by several other studies.
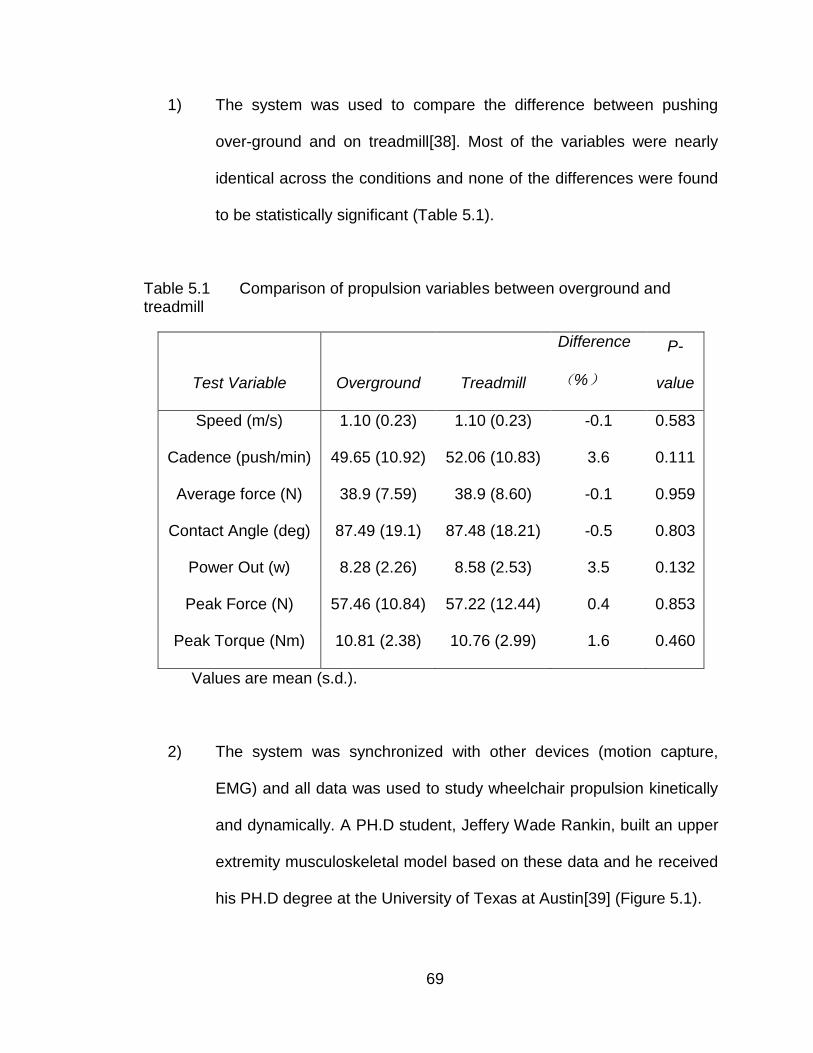
69
1) The system was used to compare the difference between pushing
over-ground and on treadmill[38]. Most of the variables were nearly
identical across the conditions and none of the differences were found
to be statistically significant (Table 5.1).
Table 5.1 Comparison of propulsion variables between overground and treadmill
Test Variable Overground Treadmill
Difference
(%)
P-
value
Speed (m/s) 1.10 (0.23) 1.10 (0.23) -0.1 0.583
Cadence (push/min) 49.65 (10.92) 52.06 (10.83) 3.6 0.111
Average force (N) 38.9 (7.59) 38.9 (8.60) -0.1 0.959
Contact Angle (deg) 87.49 (19.1) 87.48 (18.21) -0.5 0.803
Power Out (w) 8.28 (2.26) 8.58 (2.53) 3.5 0.132
Peak Force (N) 57.46 (10.84) 57.22 (12.44) 0.4 0.853
Peak Torque (Nm) 10.81 (2.38) 10.76 (2.99) 1.6 0.460
Values are mean (s.d.).
2) The system was synchronized with other devices (motion capture,
EMG) and all data was used to study wheelchair propulsion kinetically
and dynamically. A PH.D student, Jeffery Wade Rankin, built an upper
extremity musculoskeletal model based on these data and he received
his PH.D degree at the University of Texas at Austin[39] (Figure 5.1).
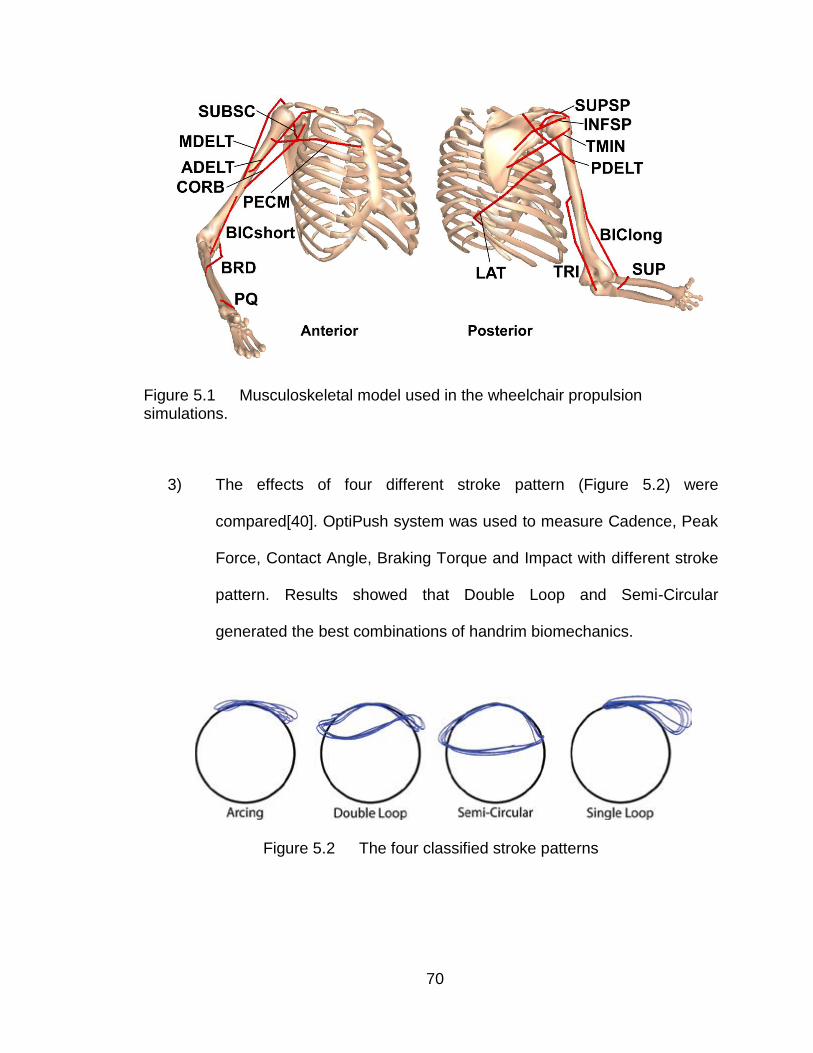
70
Figure 5.1 Musculoskeletal model used in the wheelchair propulsion simulations.
3) The effects of four different stroke pattern (Figure 5.2) were
compared[40]. OptiPush system was used to measure Cadence, Peak
Force, Contact Angle, Braking Torque and Impact with different stroke
pattern. Results showed that Double Loop and Semi-Circular
generated the best combinations of handrim biomechanics.
Figure 5.2 The four classified stroke patterns
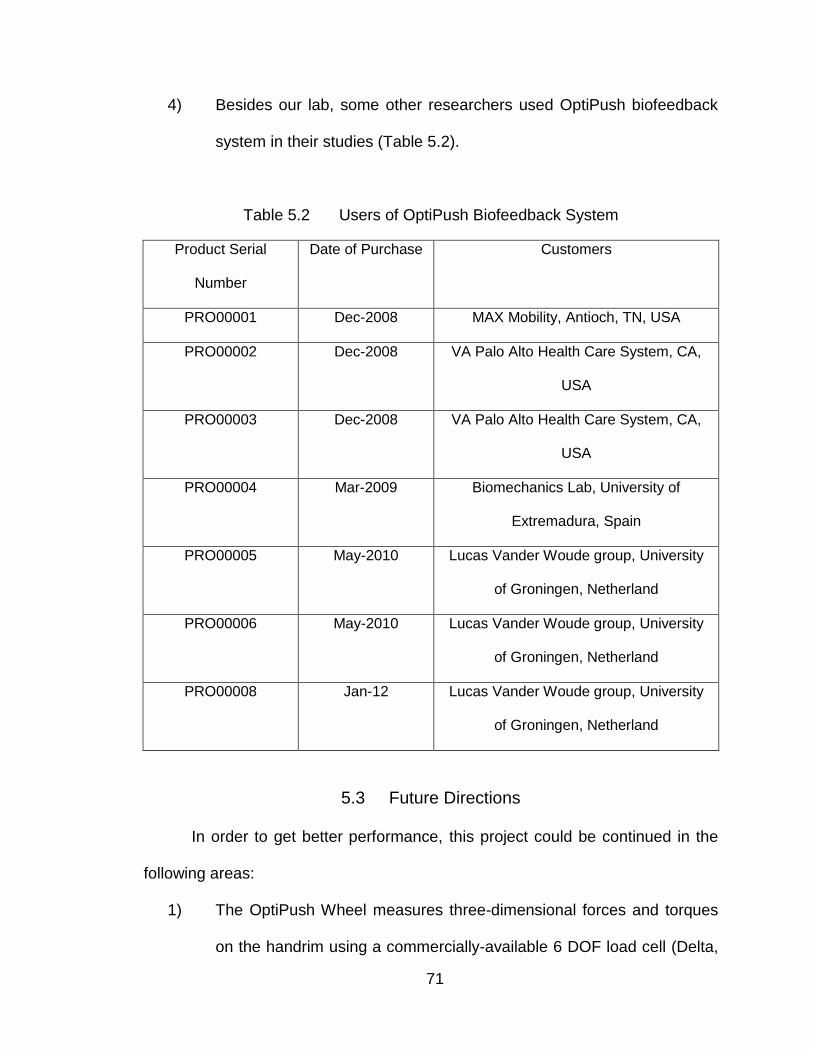
71
4) Besides our lab, some other researchers used OptiPush biofeedback
system in their studies (Table 5.2).
Table 5.2 Users of OptiPush Biofeedback System
Product Serial
Number
Date of Purchase Customers
PRO00001 Dec-2008 MAX Mobility, Antioch, TN, USA
PRO00002 Dec-2008 VA Palo Alto Health Care System, CA,
USA
PRO00003 Dec-2008 VA Palo Alto Health Care System, CA,
USA
PRO00004 Mar-2009 Biomechanics Lab, University of
Extremadura, Spain
PRO00005 May-2010 Lucas Vander Woude group, University
of Groningen, Netherland
PRO00006 May-2010 Lucas Vander Woude group, University
of Groningen, Netherland
PRO00008 Jan-12 Lucas Vander Woude group, University
of Groningen, Netherland
5.3 Future Directions
In order to get better performance, this project could be continued in the
following areas:
1) The OptiPush Wheel measures three-dimensional forces and torques
on the handrim using a commercially-available 6 DOF load cell (Delta,
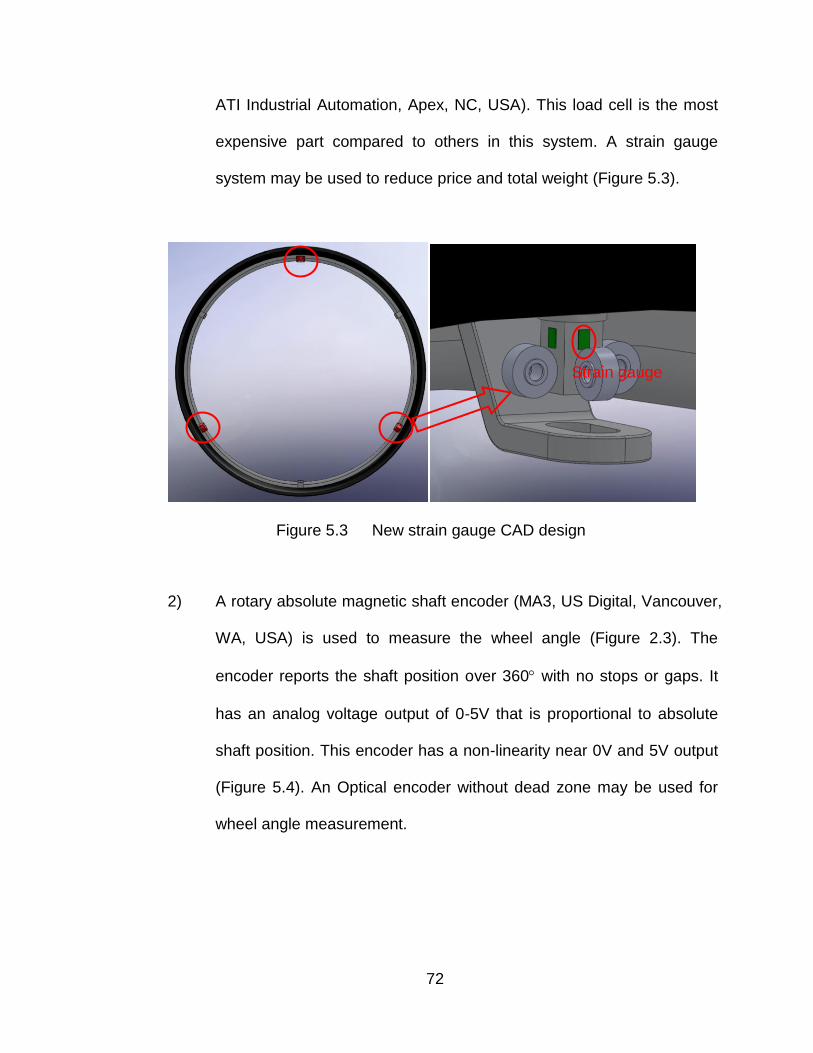
72
ATI Industrial Automation, Apex, NC, USA). This load cell is the most
expensive part compared to others in this system. A strain gauge
system may be used to reduce price and total weight (Figure 5.3).
Figure 5.3 New strain gauge CAD design
2) A rotary absolute magnetic shaft encoder (MA3, US Digital, Vancouver,
WA, USA) is used to measure the wheel angle (Figure 2.3). The
encoder reports the shaft position over 360 with no stops or gaps. It
has an analog voltage output of 0-5V that is proportional to absolute
shaft position. This encoder has a non-linearity near 0V and 5V output
(Figure 5.4). An Optical encoder without dead zone may be used for
wheel angle measurement.
Strain gauge
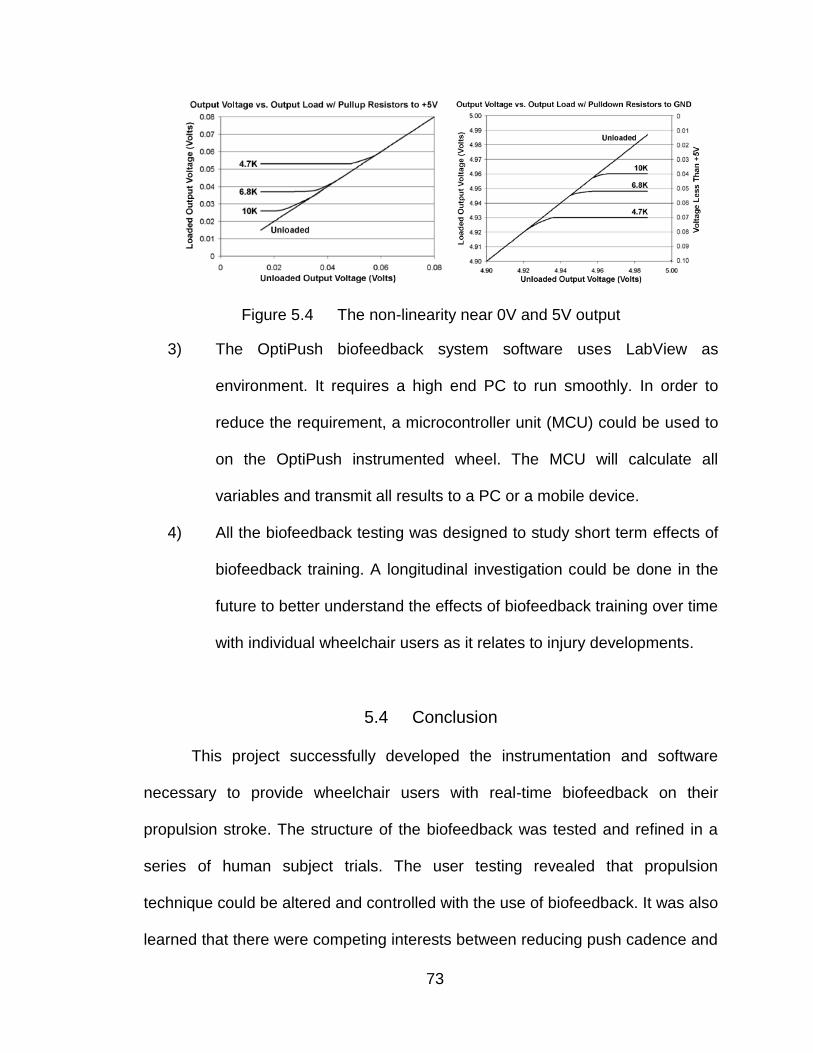
73
Figure 5.4 The non-linearity near 0V and 5V output
3) The OptiPush biofeedback system software uses LabView as
environment. It requires a high end PC to run smoothly. In order to
reduce the requirement, a microcontroller unit (MCU) could be used to
on the OptiPush instrumented wheel. The MCU will calculate all
variables and transmit all results to a PC or a mobile device.
4) All the biofeedback testing was designed to study short term effects of
biofeedback training. A longitudinal investigation could be done in the
future to better understand the effects of biofeedback training over time
with individual wheelchair users as it relates to injury developments.
5.4 Conclusion
This project successfully developed the instrumentation and software
necessary to provide wheelchair users with real-time biofeedback on their
propulsion stroke. The structure of the biofeedback was tested and refined in a
series of human subject trials. The user testing revealed that propulsion
technique could be altered and controlled with the use of biofeedback. It was also
learned that there were competing interests between reducing push cadence and

74
reducing peak handrim force. Repetitive stress injuries are likely influenced by
either the magnitude of the joint loading, the repetition of the joint loading, or both.
Because the exact etiology of overuse injuries in this population is not clear, it is
ideal if both of these factors can be reduced. The final OptiPush biofeedback
design included a multi-variable push stroke graph of peak force verses contact
angle that was shown to enable the user to reduce both their peak handrim force
and their push cadence concurrently. As a result of this accomplishment,
researchers and clinicians around the globe will be able to implement this
approach to further study its potential benefits on upper extremity health. It is
hoped that the results of this project will have a lasting and positive effect on the
quality of life of manual wheelchair users.
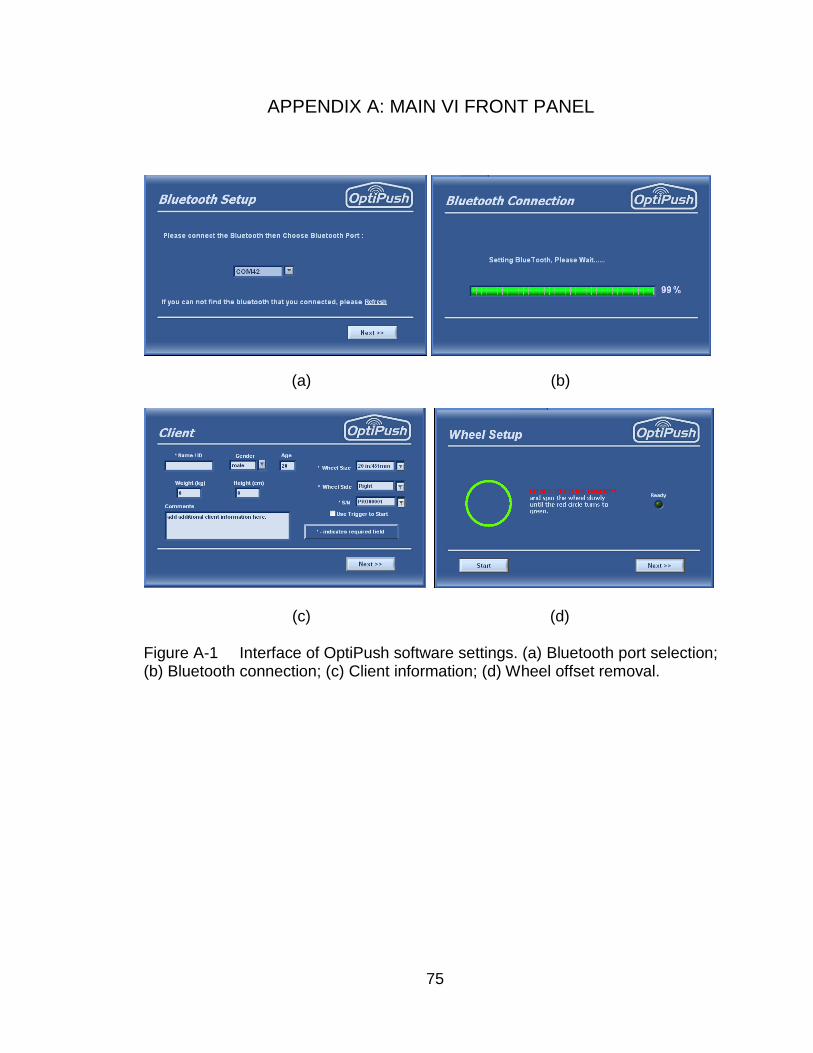
75
APPENDIX A: MAIN VI FRONT PANEL
(a) (b)
(c) (d)
Figure A-1 Interface of OptiPush software settings. (a) Bluetooth port selection; (b) Bluetooth connection; (c) Client information; (d) Wheel offset removal.

76
Figure A-2 Biofeedback interface of OptiPush software
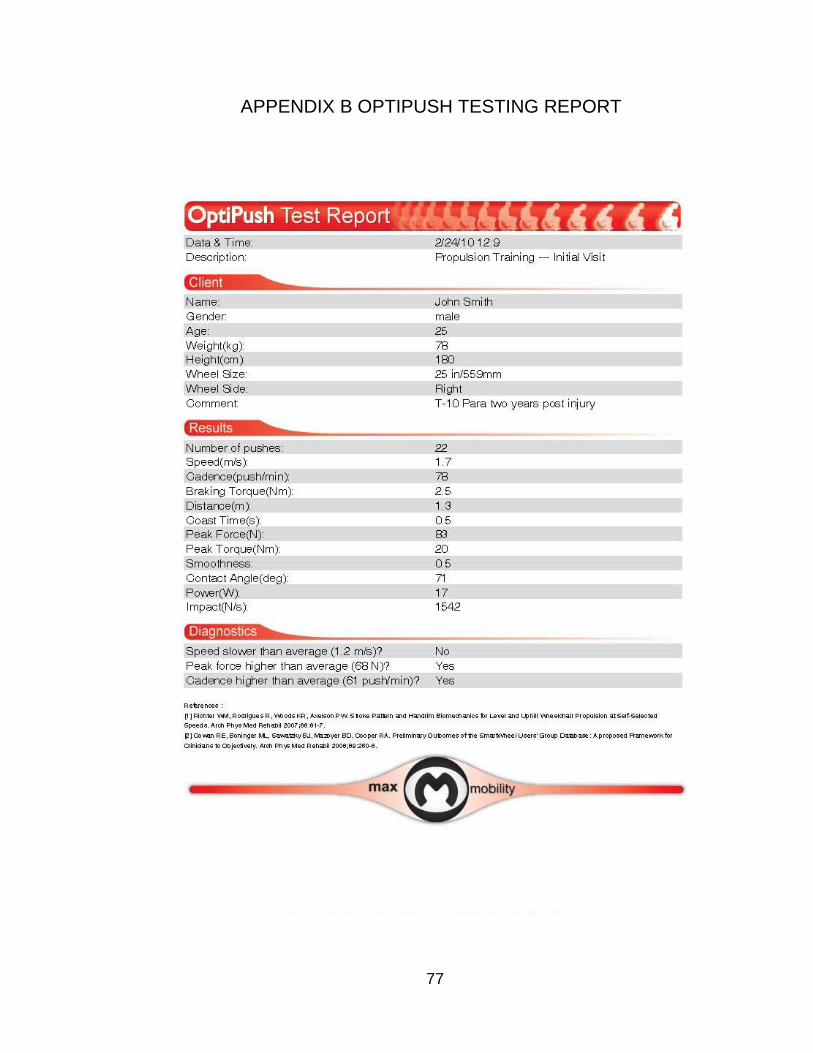
77
APPENDIX B OPTIPUSH TESTING REPORT

78
APPENDIX C TREADMILL VALIDATION
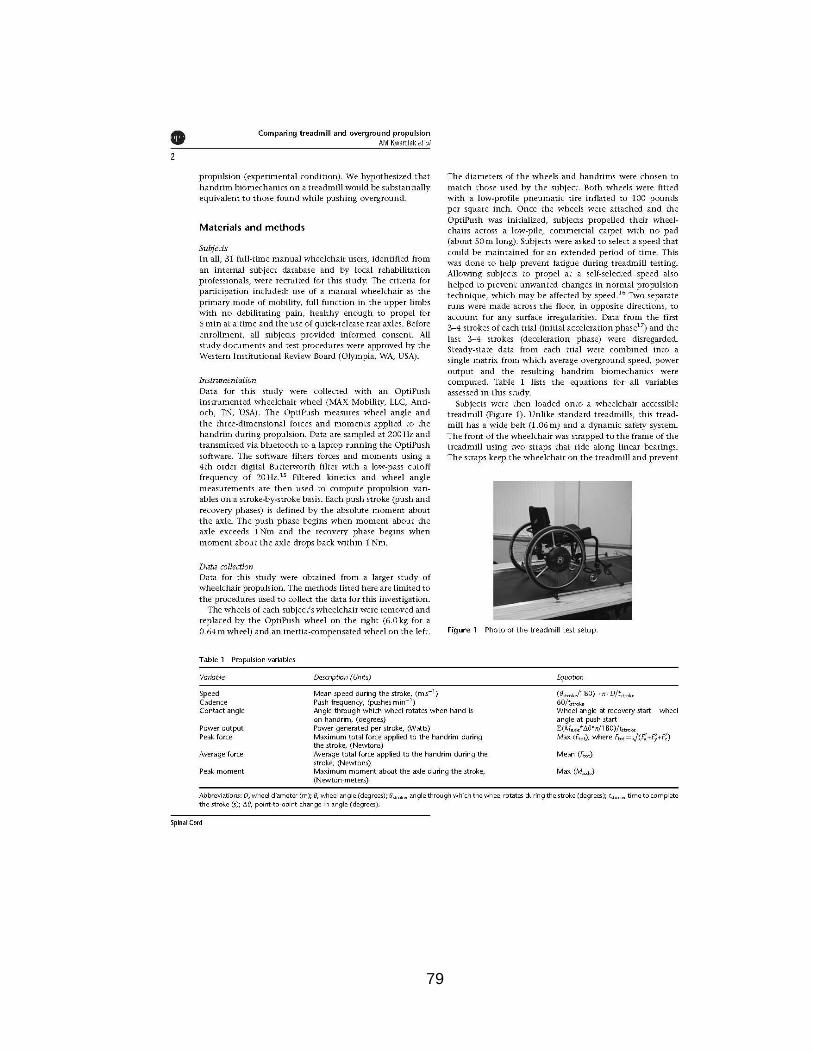
79
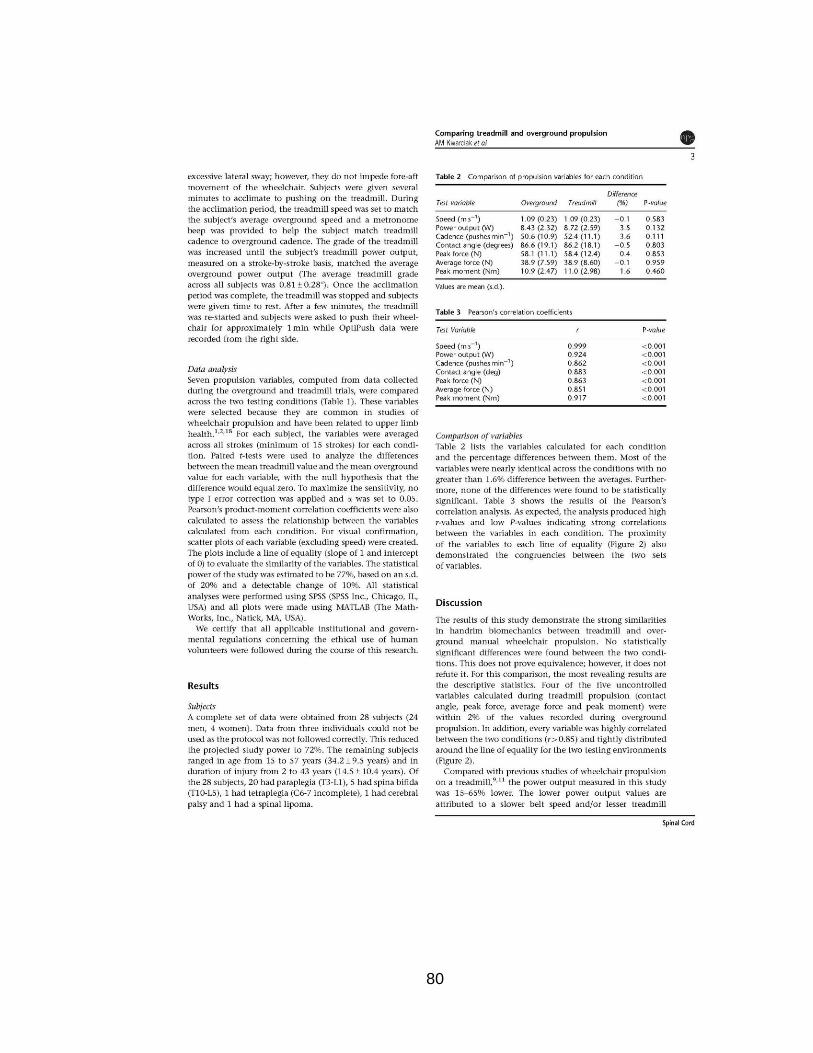
80

81
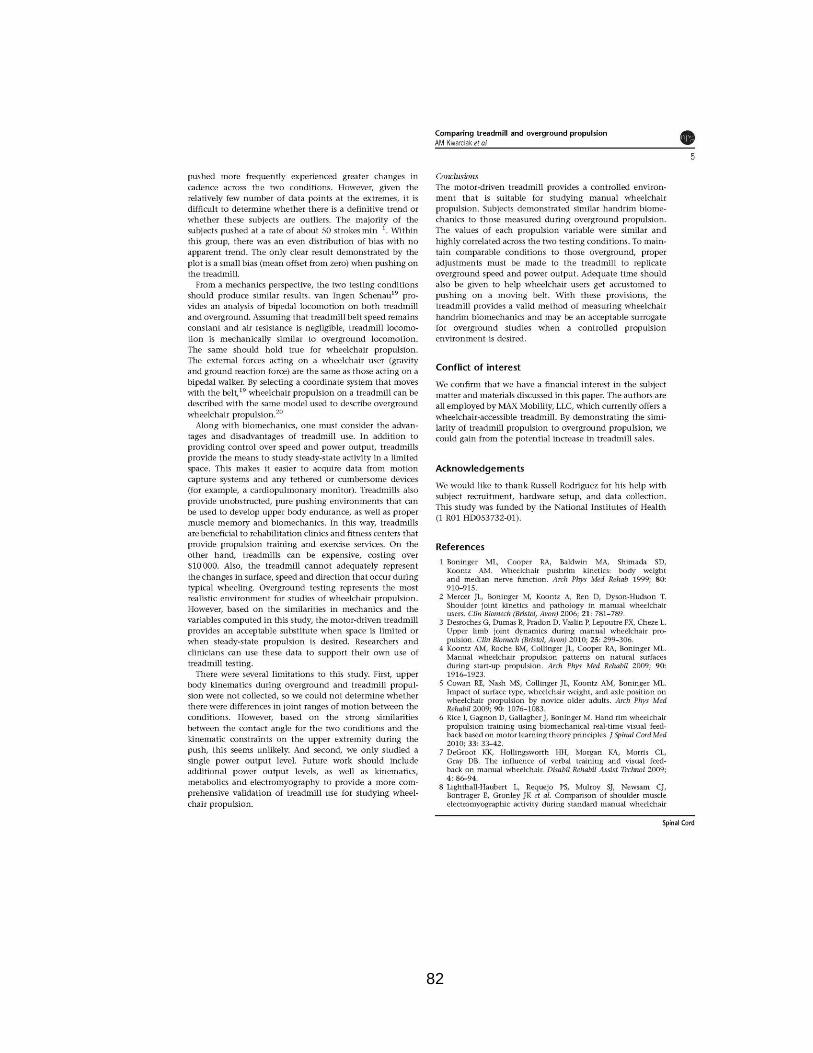
82
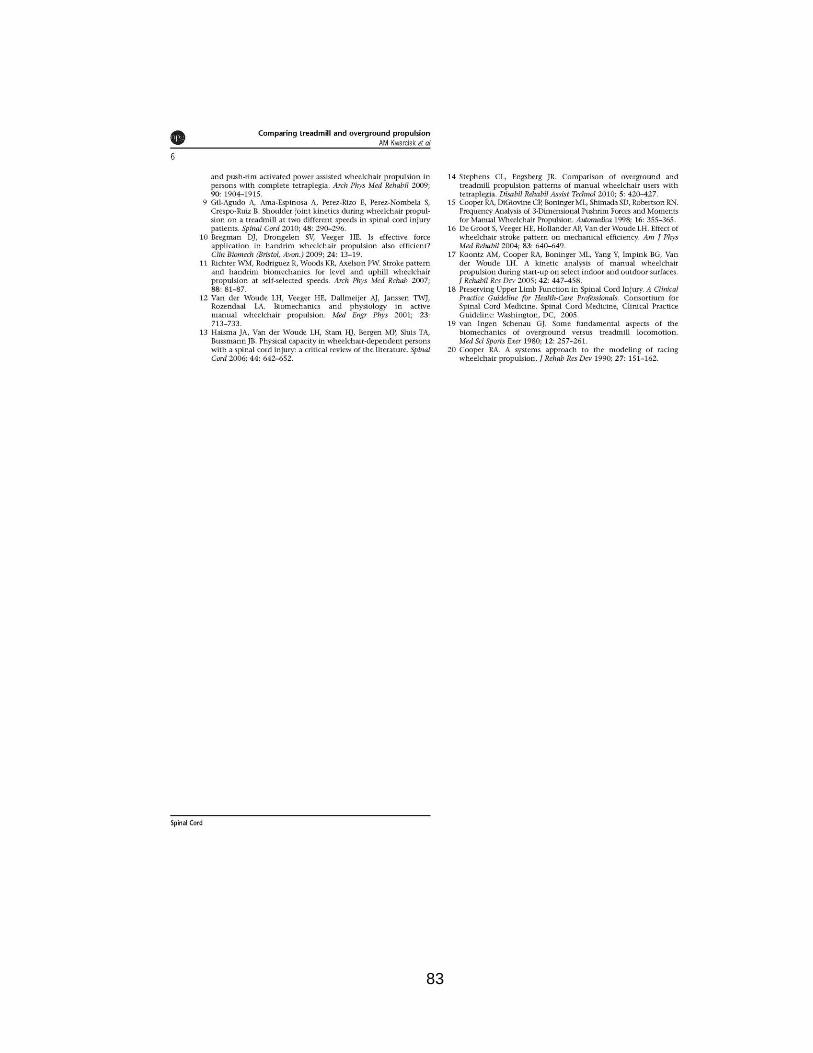
83
84
REFERENCE LIST
1. IH Sie, RL Waters, RH Adkins, and H Gellman (1992): Upper extremity
pain in the postrehabilitation spinal cord injured patient. Arch Phys Med
Rehab 73:44.
2. Cooper, R. A., Boninger, M. L., Shimada, S. D., O'Connor, T. J., and
DiGiovine, C. P. Manual wheelchair user upper extremity pain. 1996.
3. MM Rodgers and MA Finley (2002): Wheelchair propulsion biomechanics
with upper extremity impairment and fatigue. Proceedings of the 2002
World Congress of Biomechanics
4. AM Koontz, ML Boninger, J Towers, RA Cooper, and M Baldwin (1999):
Propulsion forces and MRI evidence of shoulder impairment. Proceedings
of the American Society of Biomechanics 1999 Annual Meeting 296.
5. LH Van der Woude, G de Groot, AP Hollander, GJ van Ingen Schenau,
and RH Rozendal (1986): Wheelchair ergonomics and physiological
testing of prototypes. Ergonomics 29:1561.
6. R Niesing, F Eijskoot, R Kranse, AH den Ouden, J Storm, HEJ Veeger,
LHV van der Woude, and CJ Snijders (1990): Computer-controlled
wheelchair ergometer. Med.Biol.Eng.Comput. 28:329.
7. S De Groot, HE Veeger, AP Hollander, and LH Van der Woude (2005):
Influence of task complexity on mechanical efficiency and propulsion
technique during learning of hand rim wheelchair propulsion. Med Eng
Phys 27:41.
85
8. HW Wu, LJ Berglund, FC Su, B Yu, A Westreich, KJ Kim, and KN An
(1998): An instrumented wheel for kinetic analysis of wheelchair
propulsion. J Biomech Engr 120:533.
9. MB Sabick, BR Kotajarvi, and KN An (2004): A new method to quantify
demand on the upper extremity during manual wheelchair propulsion.
Arch Phys Med Rehabil 85:1151.
10. KT Asato, RA Cooper, RN Robertson, and JF Ster (1993): SMARTWheels:
development and testing of a system for measuring manual wheelchair
propulsion dynamics. IEEE Transactions on Biomedical Engineering
40:1320.
11. RA Cooper, J Ster, III, and T Heil (1991): Development of a New ISO
Wheelchair Two-Drum Tester. Annual International Conference of the
IEEE Engineering in Medicine and Biology Society 13:1867.
12. Cooper, R. A., Asato, K. T., Robertson, R. N., and Ster, J. F. 2-
Dimensional kinetic analysis of manual wheelchair propulsion with an
improved SMARTwheel. 14, 1544-1545. 1992. Paris, France. 14th Annual
IEEE/EMBS International Conference.
13. I Rice, B Impink, C Niyonkuru, and M Boninger (2008): Manual wheelchair
stroke characteristics during an extended period of propulsion. Spinal
Cord.
14. WJ Hurd, MM Morrow, KR Kaufman, and KN An (2008): Wheelchair
propulsion demands during outdoor community ambulation.
J.Electromyogr.Kinesiol.
86
15. RE Cowan, ML Boninger, BJ Sawatzky, BD Mazoyer, and RA Cooper
(2008): Preliminary outcomes of the SmartWheel Users' Group database:
a proposed framework for clinicians to objectively evaluate manual
wheelchair propulsion. Arch.Phys.Med.Rehabil. 89:260.
16. R Rodriguez, WM Richter, KR Woods, and PW Axelson (2004): Reducing
variability in wheelchair propulsion outcomes. RESNA 27th International
Annual Conference
17. WM Richter, R Rodriguez, KR Woods, and PW Axelson (2006): Stroke
pattern and handrim biomechanics for level and uphill wheelchair
propulsion at self-selected speeds. Arch Phys Med Rehab 88:81.
18. MJ Dvorznak, RA Cooper, TJ O'Connor, and ML Boninger (1997): Braking
Study. Rehab R&D Prog Rpts 294.
19. S De Groot, HE Veeger, AP Hollander, and LH Van der Woude (2002):
Consequence of feedback-based learning of an effective hand rim
wheelchair force production on mechanical efficiency. Clin Biomech
17:219.
20. BR Kotajarvi, JR Basford, KN An, DA Morrow, and KR Kaufman (2006):
The effect of visual biofeedback on the propulsion effectiveness of
experienced wheelchair users. Arch Phys Med Rehabil 87:510.
21. K DeGroot, H Hollingsworth, Morgan K, orris CL, and D ray (2009): The
influence of verbal training and visual feedback on manual wheelchair.
Disabil.Rehabil.Assist.Technol. 4:86.
87
22. ML Boninger, AM Koontz, SA Sisto, TA Dyson-Hudson, M Chang, R Price,
and RA Cooper (2005): Pushrim biomechanics and injury prevention in
spinal cord injury: Recommendations based on CULP-SCI investigations.
J Rehabil Res Dev. 42:9.
23. KR Woods, WM Richter, R Rodriguez, and PW Axelson (2004): Removal
of dynamic offset signal from load cell instrumented wheels. RESNA 27th
International Annual Conference
24. ML Boninger, RA Cooper, MA Baldwin, SD Shimada, and AM Koontz
(1999): Wheelchair pushrim kinetics: body weight and median nerve
function. Arch Phys Med Rehab 80:910.
25. WM Richter, TJ O'Connor, DA Chesney, PW Axelson, ML Boninger, and
RA Cooper (2000): Effect of pushrim compliance on propulsion efficiency.
Proceedings of the RESNA 2000 Annual Conference 381.
26. LH Van der Woude, HE Veeger, RH Rozendal, and AJ Sargeant (1989):
Optimum cycle frequencies in hand-rim wheelchair propulsion. Wheelchair
propulsion technique. Eur J Appl Physiol Occup Physiol 58:625.
27. Skinner BF: Science and Human Behavior. New York, Macmillan, 1953.
28. Mark Stephen Schwartz, Frank Andrasik: Biofeedback: a practitioner's
guide, 2003.
29. Ronald V. Croce, The effects of EMG biofeedback on strengthacquisition.
Applied Psychophysiology and Biofeedback, Volume 11, Number 4, 299-
310.

88
30. Ken Ohta, et al. Miyaji. Dynamics-based Force Sensor Using
Accelerometers-application of Hammer Throw Training Aid.The
Engineering of Sport, 2008, 207-213.
31. A. Barney Alexander, et al. A Comparison of Auditory and Visual Feedback
in Biofeedback Assisted Muscular Relaxation Training. Psychophysiology,
1975 Mar;12(2):119-23.
32. B. Peacocka, et al. Feedback and maximum voluntary contraction.
Ergonomics, 1981, 24(3): 223-228.
33. Levitt, R., Deisinger, J. A., Wall, J. R., Ford, L., &Cassisi, J. E. EMG
feedback-assisted postoperative rehabilitation of minor arthroscopic knee
surgeries. The Journal of Sports Medicine and Physical Fitness,(1995). 35,
218–223.
34. Steven L. Cohen. Et al. EMG Biofeedback: The Effects of CRF, FR, VR,
FI,and VI Schedules of Reinforcement on the Acquisitionand Extinction of
Increases in Forearm Muscle Tension. Applied Psychophysiology and
Biofeedback, Vol. 26, No. 3, 2001
35. Consortium for Spinal Cord Medicine. Preservation of upper limb function
following spinal cord injury: A clinical practice guideline for health-care
professionals. Consortium for Spinal Cord Medicine: Clinical Practice
Guidelines . 2005.
36. AM Kwarciak, SA Sisto, M Yarossi, R Price, E Komaroff, and ML Boninger
(2009): Redefining the manual wheelchair stroke cycle: identification and
impact of nonpropulsive pushrim contact. Arch Phys Med Rehab 90:20.

89
37. I Rice, D Gagnon, J Gallagher, and M Boninger (2010): Hand rim
wheelchair propulsion training using biomechanical real-time visual
feedback based on motor learning theory principles. J.Spinal Cord.Med.
33:33.
38. AM Kwarciak, JT Turner, L Guo, and WM Richter (2010): Comparing
handrim biomechanics for treadmill and overground wheelchair propulsion.
Spinal Cord.
39. Jeffery Wade Rankin (2010): The Influence of Altering Wheelchair
Propulsion Technique on Upper Extremity Demand. Unpublished
dissertation. University of Texas at Austin.
40. AM Kwarciak, JT Turner, L Guo, and WM Richter (2012): The effects of
four different stroke patterns on manual wheelchair propulsion and upper
limb muscle strain. Disability and Rehabilitation: Assistive Technology.
22295946