Wheat-Bread Market Value Chain in Ethiopiaageconsearch.umn.edu/bitstream/246312/2/72....
23
Analysis of Price Shock Transmission: Case of the Wheat-Bread Market Value Chain in Ethiopia Mekbib G. Haile, Bernardina Algieri, Matthias Kalkuhl, and Samuel Gebreselassie Invited paper presented at the 5th International Conference of the African Association of Agricultural Economists, September 23-26, 2016, Addis Ababa, Ethiopia Copyright 2016 by [authors]. All rights reserved. Readers may make verbatim copies of this document for non-commercial purposes by any means, provided that this copyright notice appears on all such copies.
Transcript of Wheat-Bread Market Value Chain in Ethiopiaageconsearch.umn.edu/bitstream/246312/2/72....
Analysis of Price Shock Transmission: Case of the
Wheat-Bread Market Value Chain in Ethiopia
Mekbib G. Haile, Bernardina Algieri, Matthias Kalkuhl, and Samuel Gebreselassie
Invited paper presented at the 5th International Conference of the African Association of
Agricultural Economists, September 23-26, 2016, Addis Ababa, Ethiopia
Copyright 2016 by [authors]. All rights reserved. Readers may make verbatim copies of this
document for non-commercial purposes by any means, provided that this copyright notice
appears on all such copies.

Analysis of Price Shock Transmission: Case of the Wheat-Bread Market Value Chain in
Ethiopia
Mekbib G. Haile
Center for development Research (ZEF), [email protected], Tel. +49-228-731884
Bernardina Algieri
University of Calabria and Center for Development Research (ZEF)
Matthias Kalkuhl
Mercator Research Institute on Global Commons and Climate Change (MCC)
Samuel Gebreselassie
Ethiopian Economics Assoication (EEA)
Abstract
This study assesses the degree of vertical price transmission along the wheat-bread value chain
in Ethiopia. This is pursued by applying a vector error correction model (VECM) and an impulse
response analysis using monthly price data for the period 2000 –2015. The empirical findings
indicate that significant cointegration exists across prices of the different stages along the value
chain. In particular, there is a strong price shock transmission for the price pair international–
local wholesale wheat prices. This suggests that international wheat price shocks could have
significant consequences for the Ethiopian economy, given that the country is not only a net
importer of wheat but it also imports a sizable amount vis-à-vis the domestic production.
Although price shocks are transmitted along the value chain to a different extent, the speed of
adjustment is quite slow. For instance, less than 6% of the disequilibrium in bread prices is
eliminated in one month, implying that it takes longer that one year for bread price to virtually
restore to its long-run equilibrium value after a shock. The results also reveal that causal
relationships exist between prices at different market stages. To this end, the impulse response
analysis shows diverse responses to shocks, with some shocks producing weak and temporary
adjustments while others producing stronger and persistent changes. We found that producer
and wholesale market levels play a dominant role in the wheat value chain, implying that
policies may give particular attention to these markets.
Keywords: Value chain, price transmission, impulse response, wheat, Ethiopia
JEL codes: Q02, Q11, Q13, L11, M31

2
1. Introduction
Wheat is an important staple food in the diets of many Ethiopians, providing about 15% of the
caloric intake for the country’s over 90 million population (FAO 2015). Not only is wheat one of
the most widely produced cereal in the country—accounting for 20% of the domestic cereal
production in 2013/14—it is also the most important staple food crop that the government
imports from abroad. Imported wheat has contributed a significant share of the marketable wheat
in the country. Wheat import has been as high as 40% of the locally produced wheat over the last
decade. This large import dependency exposes the domestic wheat market to international shocks
and price volatility. This is especially true in situations of food price spikes, such as during the
global food price crisis in 2007/08 and in 2011, when grain prices in Ethiopia showed dramatic
increases. Nominal wheat price, for instance, surged by 60% in four months between April and
August 2008 and the prices of domestic wheat flour and wheat bread increased too by about 30%
and 40% respectively during the same period (CSA, 2015). As a consequence, the Ethiopian
government took several administrative measures on the domestic market including the most
direct intervention of controlling prices for selected staples including bread (Admassie, 2013).
Several studies argue that the price changes in Ethiopia are not significantly affected by
international prices (Admassie, 2013; Minot, 2010). This may be true for the general inflation in
the country and for agricultural crops (such as sorghum and teff) for which Ethiopia has a
negligible net trade with the rest of the world. This could, however, be different in the case of
some crops such as wheat. As roughly 80% of the domestic wheat production is used for own
consumption (Gebreselassie et al., forthcoming), imported wheat contributes a much higher share
to marketed wheat than to produced wheat. Following the 2007/08 food crisis, for instance,
imported wheat contributed more than twice of the domestic market surplus (Rashid and Lemma,
2014). Because imported wheat is distributed at government administered prices, this may
moderate the domestic market exposure to shocks in the international market. Moreover, wheat
is just one of inputs for higher-value products such as bread and this may further dilute shock
transmission from international wheat markets. The higher is the value added to a raw material,
the lower is the share of the raw material costs in the total costs. Consequently, price shocks in
the raw commodity may have a lower impact on the price of processed consumer products like
flour or bread.

3
Against this background, the objective of the present study is to investigate price transmission
along the wheat-bread value supply chain in Ethiopia using monthly prices over the period 2000
to 2015. We explicitly examine the degree of transmission of price shocks from international
wheat markets to domestic producer, domestic wholesale and retail wheat markets, as well as to
wheat flour and bread markets in the country. To this end, we consider the various linkages and
causalities between different processing steps and actors in the wheat value chain by estimating a
system of response functions to exogenous shocks. Indeed, in well-functioning (integrated)
markets1, price shocks in any market level are virtually transmitted to other market levels. While
primary producers benefit from price increases at the wholesale and the retail market levels, final
consumers benefit from upstream cost reductions. The efficiency of wheat supply chain is,
therefore, crucial to maintain a sustainable distribution of value addition and benefits among
farmers, processors, wholesalers, retailers and consumers.
This study provides several contributions to the extant literature. It explicitly examines price
transmission along the wheat-bread value chain in Ethiopia and the degree of shocks
transmission from international wheat prices to domestic prices. To our knowledge, an analysis
on the system of inter-linked market channels that interact and influence each other along the
wheat value chain is still missing. In addition, we provide information about the size and speed
of price shock transmission. This study analyses the direction of causal relationships across
market price levels. The focus on price transmission and its interlinkages along the wheat-bread
value chain is important. It allows analysis of changes in the value between the intermediaries;
helps explain their negotiation power; identifies sales margins at different levels of the chain; and
discovers market inefficiencies. Furthermore, the direction of causality is useful to know whether
there is any single market level with a dominant price leadership role so that policy interventions
can be targeted.
2. Price shock transmission along the wheat-bread value chain
Transmission of price shocks can happen in horizontally or vertically related markets. Horizontal
price or shock transmission, as discussed in the above section, occurs between similar products
traded in different geographical locations. Vertical price transmission, on the other hand, relates
to shock innovations between different stages of the supply chain. Given that price is the primary
mechanism that interconnects various market stages, the extent of adjustment and the speed at
which price shocks are transmitted into producer, wholesale, and retail markets shows the actions
of participants at the various market levels (Goodwin & Harper, 2000). The degree of shock
transmission depends on the stage of the product in the value chain. Theoretically, the value
addition increases when we move from the raw commodity market (e.g., wheat grain) to
processed products (e.g., wheat bread) along the value chain. As a result, we expect the exposure
of agents to grain price volatility to decrease along the value chain. For instance, we expect that a
1 Market integration refers to a condition in which there exists flow of goods and information across place, time and
form. Market integration thus implies a reduced localised price volatility, high specialisation and efficiency.

4
shock at the international wheat market transmits to domestic producer and wholesale prices at a
reasonable size and speed, whereas the transmission will be limited at further stages of the value
chain, such as at the consumption end.
The Ethiopian wheat value chain consists of multiple actors and channels. A range of actors that
include smallholder farmers, wholesalers, retailers, part-time farmer-traders, brokers, processors,
cooperatives, the government and parastatal organizations, and private consumers take part in the
wheat value chain. Previous studies indicated that the wheat supply chain in Ethiopia consists of
as much as seven to ten marketing channels or outlets (Urgessa, 2011; Woldehanna et al., 2010).
In general, wheat trade involves a large number of transactions of small value and quantity.
Small traders and brokers play a significant role in the supply chain. The size of transactions is
largely governed by subsistence domestic production and traditional transport system. The
subsistence nature of domestic wheat growers and the big role the government plays through the
Ethiopian grain trade enterprise (EGTE), a parastatal organization, in the wheat market affect the
efficiency and effectiveness of the value chain. The length and complexity of the value chain,
number of actors involved, and the level of transparency among actors have nontrivial
implications for the distributional gains and losses among wheat producers and consumers.
Figure 1. Shock transmission along the wheat supply chain in Ethiopia
Figure 1 illustrates different stages of the wheat market that we consider in our analyses. The
boxes in solid lines denote markets or factors that are largely exogenous to the effects of changes
in the domestic market. Because Ethiopia is a net importer of wheat and it is a “small country”,
its demand (import) does not affect world wheat price. We therefore expect shock transmission
from international market prices to wheat and wheat product prices in the domestic markets, but
not vice versa. Besides shocks in the international wheat prices, changes in shipment costs,
which we proxy by the Baltic dry index (BDI), can also affect domestic prices. The solid line
arrows in figure 1 therefore show our expectation of a direct impact from one market level to the
Wheat Flour Price Retail Wheat Price
Baltic Dry Index Rainfall
Wheat Bread Price
International Wheat Price Producer Wheat Price
Wholesale Wheat Price
Exogenous factor
Endogenous market
Direct effect
Indirect effect

5
other, whereas the dotted arrows reflect indirect effects. This figure will guide our time series
analyses in subsequent sections. Figure 1 does not exclude shock transmission, for instance, from
international wheat market to domestic bread markets. Nevertheless, it hints that as the value
chain gets longer, the degree of shock transmission form the international market is expected to
get weaker.
3. Empirical Analysis
3.1. Data
Monthly data for the period January 2000 to February 2015 are used for our empirical analysis.
While data on domestic prices are taken from the Ethiopian central statistical agency (CSA)2,
data on international wheat price are obtained from the World Bank price database, the Baltic
Dry Index from Bloomberg, and monthly rainfall from the Ethiopian meteorological agency.3
Table 1 presents the descriptive statistics of these variables along with their descriptions.
Table 1. Descriptive statistics of time series variables, January 2000- February 2015
Variable name Description Mean SD Min. Max.
INT_P International wheat Price, Birr/kg 1.06 0.21 0.63 1.86
PROD_P Domestic producer price, Birr/kg 1.18 0.26 0.46 1.94
WHOL_P Domestic wholesale price, Birr/kg 1.57 0.25 1.10 2.61
RET_P Retail price in Addis Ababa, Birr/kg 1.84 0.26 1.28 2.70
FLOUR_P Flour price in Addis Ababa, Birr/kg 2.68 0.38 1.75 3.74
BREAD_P Bread price in Addis Ababa, Birr/kg 3.13 0.73 1.88 6.39
BDI Baltic Dry Index (Birr) 14.21 10.95 1.75 48.30
EX-RATE Exchange rate, Birr/USD 12.22 4.49 8.14 20.82
PRE Precipitation, mm 69.25 47.05 1.10 217.50
PRE_DEV
Precipitation deviation from long-run
mean, mm 0.00 20.36 -54.87 114.33
Notes: Prices are in real 2000 Ethiopian Birr deflated by CPI.
We converted the International wheat price and BDI values into Ethiopian Birr using the official
exchange rate. All price series are in real 2000 Ethiopian Birr values deflated by the general
consumer price index (CPI) of the country. As it is expected for an importing country, the
international price is below the domestic producer wheat prices. Prices increase as we go
downstream along the wheat value chain, reflecting other costs gaining more importance in the
2 We consider retail, flour, and bread prices in Addis Ababa since grain markets in Ethiopia have a radial structure
with the capital city of Addis Ababa being the central location. 3 We construct a rainfall shock variable as a deviation of current month precipitation value from the long-run
average value for that particular month.

6
final product compared to wheat grain itself. Indeed, the average international wheat price (in
local currency) is 1.06 Birr/kg and the average wheat bread price is 3.13 Birr/kg. This is
equivalent to about a 200 percent relative price increase from the top to the bottom of the value
chain. Figure 2 shows a general declining trend of real wheat flour and bread prices but an
increasing trend of all the other price series, with frequent volatility overtime. The period
2007/08 exhibits a more pronounced increase of all real prices. The Baltic dry index has been
rising until it reached at its peak value in 2007/08 when it has started to decline.
Figure 2. Monthly real international and domestic wheat and wheat product prices
3.2. Econometric framework
As a preliminary step of our time series analysis, we test all variables for the presence of unit
root with the Augmented Dickey-Fuller (ADF) and the Phillips-Perron (PP) tests. The results of
these tests show that most of the variable series exhibit non-stationarity, with the exception of the
precipitation variables. A contrasting result between the ADF and PP tests is recorded for retail
price, which is stationary according to the PP test and non-stationary following the ADF test. We
follow the ADF test which, according to the literature, is more accurate. Thus, we conclude that
all price variables and the Baltic Dry Index are integrated of order one 𝐼(1) in levels and become
stationary by first differencing. The outcomes of the tests are summarized in table 2.
Given non-stationary variable series—except the rainfall variables that enter as exogenous
variables in our time series analysis—we test if the price series are cointegrated. We follow the
Johansen-Juselius procedure to determine whether the series are cointegrated and to identify the
01
23
4
BD
I
-10
12
Pri
ce in
Bir
r/kg
,log
2000
m1
2000
m10
2001
m7
2002
m4
2003
m1
2003
m10
2004
m7
2005
m4
2006
m1
2006
m10
2007
m7
2008
m4
2009
m1
2009
m10
2010
m7
2011
m4
2012
m1
2012
m10
2013
m7
2014
m4
2015
m1
INT_P PROD_P
WHOL_P RET_P
FLOUR_P BREAD_P
BDI

7
number of cointegrating equations (Johansen & Juselius, 1990). We allow the series to have a
constant in the VAR model and a linear trend in the cointegrating equations.4 The lag length is
determined based on the Akaike Information Criterion (AIC) and the Schwartz-Bayesian
Information Criterion (SBIC).
Table 2. Unit root test results
Test on level variables Test on first differenced variables
Variables ADF test statistics PP test statistics ADF test statistics PP test statistics
Constant Trend constant trend constant trend Constant Trend
INT_P -2.99** -3.04 -2.85 -2.89
-7.35** -11.65** -11.70**
PROD_P -2.14 -2.52 -2.73 -3.12 -7.85** -7.84** -19.05** -19.01**
WHOL_P -2.71 -2.73 -2.98** -2.99 -8.74** -8.72**
-13.78**
RET_P -2.83 -3.19 -3.36** -3.63** -6.50** -6.51**
FLOUR_P -1.81 -2.76 -2.59 -4.40 -8.84** -8.81** -18.10** -18.04**
BREAD_P -0.70 -2.63 -1.26 -3.30 -7.88** -7.93** -18.46** -18.46**
BDI -1.13 -2.12 -1.17 -2.14 -6.77** -6.85** -10.22** -10.26**
PRE -10.41** -10.66** -6.90** -6.92**
PRE_DEV -12.98** -13.31** -12.48** -13.06**
Notes: AIC and BIC are used to determine appropriate lag lengths. The critical values are -2.885 and -3.439 for the
5% significance level, corresponding to the specifications using a constant (but not trend) and a trend, respectively.
** indicates rejection of the null hypothesis at the 5% level.
Under the Johansen-Juselius procedure, the trace and the maximum eigenvalue tests have been
implemented to determine the number of cointegrating vectors. The critical values are those
computed by Osterwald-Lenum (Osterwald-Lenum, 1992). The two tests deliver different results
(table 3). There are two cointegrating equations according to the trace test, as the null hypotheses
of r = 0 and r ≤ 1 (against the alternatives r > 0 and r > 1 respectively) are rejected at
conventional significance levels, whereas the null of r=2 cannot be rejected. There is, however,
just one cointegrating equation following the maximum eigenvalue test. We rely on results from
the trace test because it tends to have superior power performance in empirical works (Lütkepohl
et al., 2001) and since the computed λmax value—when the null hypothesis is r=1—is very close
to the 95% critical value. We therefore estimate a vector error correction model (VECM) with
two cointegrating relationships, whereby two lags of the precipitation deviation and two lags of
first-differenced Baltic dry index are included as exogenous variables.
Table 3. Johansen cointegration tests: Adjusted Sample: Apr 2000 to Feb 2015
H0 H1 95% Critical value
λtrace test λtrace value
r = 0 r > 0 141.90** 114.90
r ≤ 1 r > 1 93.93** 87.31
r ≤ 2 r > 2 56.77 62.99
r ≤ 3 r > 3 37.24 42.44
4 This is determined based on the Pantula test (Pantula, 1989).

8
r ≤ 4 r > 4 19.75 25.32
λmax test λmax value
r = 0 r = 1 47.65** 43.97
r = 1 r = 2 37.16 37.52
r = 2 r = 3 19.52 31.46
r = 3 r = 4 17.49 25.54
r = 4 r = 5 12.10 18.96
Note: ** denotes rejection of the null for the 5% significance levels critical values from Osterwald-Lenum (1992)
3.3. Vector autoregressive and error correction model analysis
A VECM is a restricted vector autoregressive (VAR) model that can be applied to analyse
nonstationary data series that are found to be cointegrated. The VECM modelling procedure can
be written by defining an unrestricted VAR of order k as follows:
𝑷𝒕 = 𝒄 + 𝑨𝟏𝑷𝒕−𝟏 + ⋯ + 𝑨𝒌𝑷𝒕−𝒌 + 𝑩𝟎𝑿𝒕 + 𝑩𝟏𝑿𝒕−𝟏 + ⋯ + 𝑩𝒔𝑿𝒕−𝒔 + 𝝊𝒕 (1)
where c is constant and 𝑃𝑡 is a (6𝑥1) vector of all endogenous variables defined in the model,
namely international wheat price, domestic producer, wholesale, and retail wheat prices, as well
as wheat flour and bread prices.
𝑋𝑡 is a (2𝑥1) vector comprising all exogenous variables; the precipitation deviation variable, to
account for weather conditions, and the BDI variable to allow for changes in shipping costs that
could affect the margin between domestic prices and international wheat prices.
𝑨𝟏, … , 𝑨𝒌 and 𝑩𝟎, … , 𝑩𝒔 are matrices containing the coefficients to be estimated; 𝝊𝒕 is a (6𝑥1)
vector of i.i.d normal disturbances with mean 0 and covariance matrix 𝚺.
Equation 1 can be adjusted in form of vector autoregressive in differences and error correction
components:
𝚫𝑷𝒕 = ∑ 𝚪𝒊𝚫𝑷𝒕−𝒊𝒌−𝟏𝒊=𝟏 + 𝚷𝐏𝒕−𝟏 + ∑ 𝑩𝒋𝑿𝒕−𝒋
𝒔𝒋=𝟎 + 𝝊𝒕 (2)
Equation 2 is the classical VECM (Engle & Granger, 1987) obtained from the level VAR from
(1) by subtracting 𝑷𝒕−𝟏 from both sides and rearranging terms. Here 𝜞i= – (A𝒊+𝟏+ A𝒊+𝟐+...+A𝒌)
and 𝚷 = −(𝑰– 𝑨𝟏 − 𝑨𝟐 − ⋯ − 𝑨𝒌) for 𝑖 = 1,2, … 𝑘 − 1, where 𝐼 is the identity matrix. More
specifically, 𝚪𝒊 is the (6x6) matrix of parameters for an i order lag process that capture short-run
dynamics. 𝚷 is the (6x6) matrix that contains information regarding the long-run relationship.
We can decompose 𝜫 = 𝜶𝜷′ where 𝜶 includes the speed of adjustment coefficients to
equilibrium (or error correction term ECT) and 𝜷′ is the long-run matrix of coefficients, i.e., the
cointegrating vector in the long-run. In formal terms:
𝚫𝑷𝒕 = ∑ 𝚪𝒊𝚫𝑷𝒕−𝒊𝒌−𝟏𝒊=𝟏 + 𝛂𝛃′ 𝐏𝒕−𝟏 + ∑ 𝑩𝒋𝑿𝒕−𝒋
𝒔𝒋=𝟎 + 𝝊𝒕 (3)
9
The adjustment coefficients 𝜶, the long-run coefficients entering 𝜷′ (the cointegrating equation),
the short-run coefficients contained in 𝚪𝒊 (in the VAR model), and the coefficients on the
exogenous variables are estimated based on the Johansen maximum likelihood framework
(Johansen, 1988; Johansen & Juselius, 1990). All the variable series (except the rainfall
deviation) are transformed to their natural logarithms in our empirical analysis, coefficients can
therefore be interpreted as elasticity transmissions.
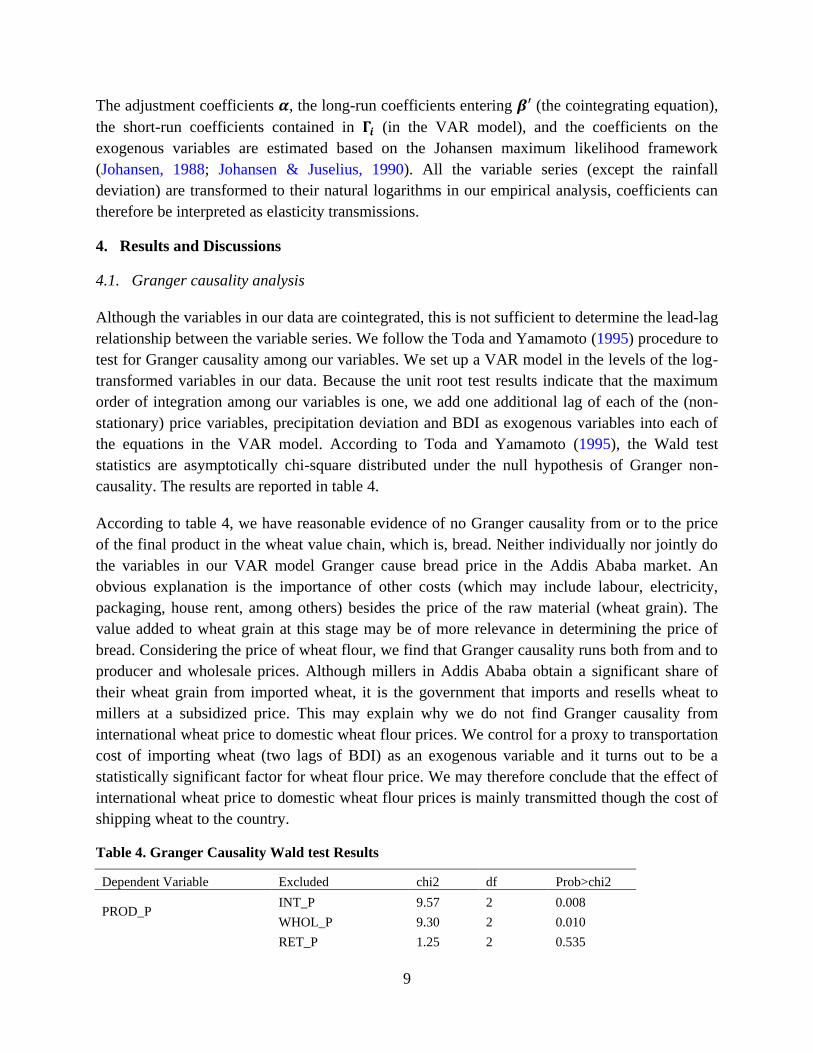
4. Results and Discussions
4.1. Granger causality analysis
Although the variables in our data are cointegrated, this is not sufficient to determine the lead-lag
relationship between the variable series. We follow the Toda and Yamamoto (1995) procedure to
test for Granger causality among our variables. We set up a VAR model in the levels of the log-
transformed variables in our data. Because the unit root test results indicate that the maximum
order of integration among our variables is one, we add one additional lag of each of the (non-
stationary) price variables, precipitation deviation and BDI as exogenous variables into each of
the equations in the VAR model. According to Toda and Yamamoto (1995), the Wald test
statistics are asymptotically chi-square distributed under the null hypothesis of Granger non-
causality. The results are reported in table 4.
According to table 4, we have reasonable evidence of no Granger causality from or to the price
of the final product in the wheat value chain, which is, bread. Neither individually nor jointly do
the variables in our VAR model Granger cause bread price in the Addis Ababa market. An
obvious explanation is the importance of other costs (which may include labour, electricity,
packaging, house rent, among others) besides the price of the raw material (wheat grain). The
value added to wheat grain at this stage may be of more relevance in determining the price of
bread. Considering the price of wheat flour, we find that Granger causality runs both from and to
producer and wholesale prices. Although millers in Addis Ababa obtain a significant share of
their wheat grain from imported wheat, it is the government that imports and resells wheat to
millers at a subsidized price. This may explain why we do not find Granger causality from
international wheat price to domestic wheat flour prices. We control for a proxy to transportation
cost of importing wheat (two lags of BDI) as an exogenous variable and it turns out to be a
statistically significant factor for wheat flour price. We may therefore conclude that the effect of
international wheat price to domestic wheat flour prices is mainly transmitted though the cost of
shipping wheat to the country.
Table 4. Granger Causality Wald test Results
Dependent Variable Excluded chi2 df Prob>chi2
PROD_P
INT_P 9.57 2 0.008
WHOL_P 9.30 2 0.010
RET_P 1.25 2 0.535
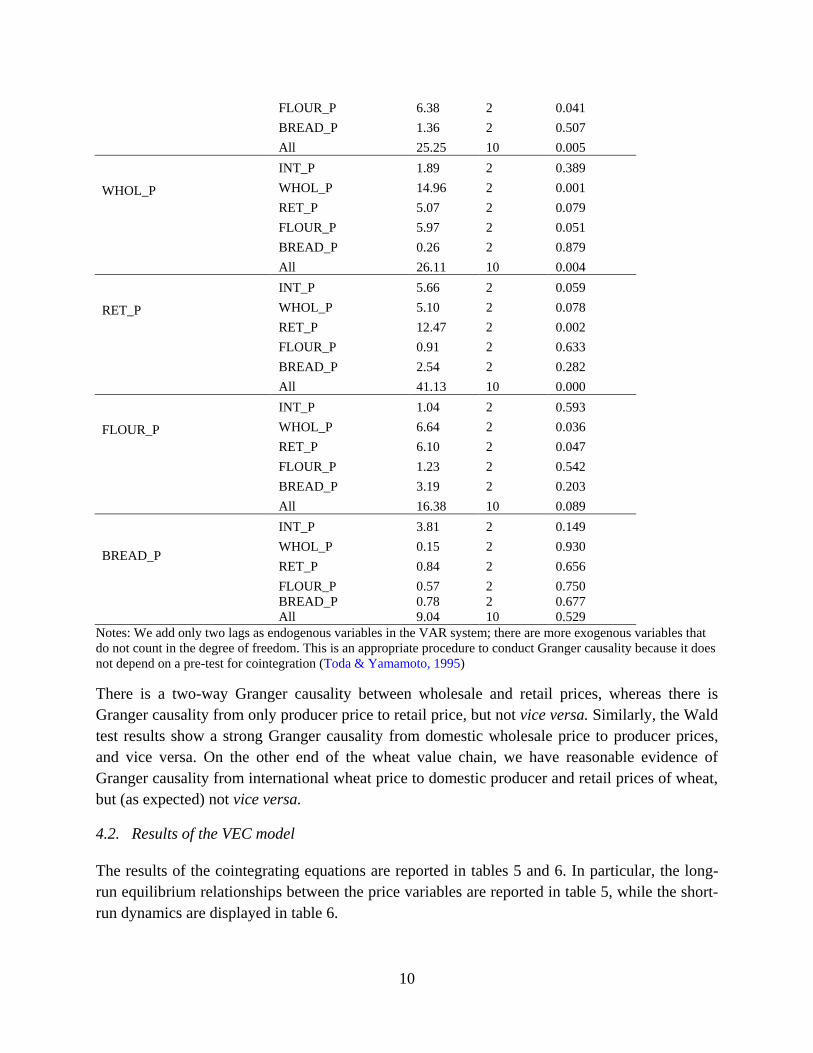
10
FLOUR_P 6.38 2 0.041
BREAD_P 1.36 2 0.507
All 25.25 10 0.005
WHOL_P
INT_P 1.89 2 0.389
WHOL_P 14.96 2 0.001
RET_P 5.07 2 0.079
FLOUR_P 5.97 2 0.051
BREAD_P 0.26 2 0.879
All 26.11 10 0.004
RET_P
INT_P 5.66 2 0.059
WHOL_P 5.10 2 0.078
RET_P 12.47 2 0.002
FLOUR_P 0.91 2 0.633
BREAD_P 2.54 2 0.282
All 41.13 10 0.000
FLOUR_P
INT_P 1.04 2 0.593
WHOL_P 6.64 2 0.036
RET_P 6.10 2 0.047
FLOUR_P 1.23 2 0.542
BREAD_P 3.19 2 0.203
All 16.38 10 0.089
BREAD_P
INT_P 3.81 2 0.149
WHOL_P 0.15 2 0.930
RET_P 0.84 2 0.656
FLOUR_P 0.57 2 0.750
BREAD_P 0.78 2 0.677
All 9.04 10 0.529
Notes: We add only two lags as endogenous variables in the VAR system; there are more exogenous variables that
do not count in the degree of freedom. This is an appropriate procedure to conduct Granger causality because it does
not depend on a pre-test for cointegration (Toda & Yamamoto, 1995)
There is a two-way Granger causality between wholesale and retail prices, whereas there is
Granger causality from only producer price to retail price, but not vice versa. Similarly, the Wald
test results show a strong Granger causality from domestic wholesale price to producer prices,
and vice versa. On the other end of the wheat value chain, we have reasonable evidence of
Granger causality from international wheat price to domestic producer and retail prices of wheat,
but (as expected) not vice versa.
4.2. Results of the VEC model
The results of the cointegrating equations are reported in tables 5 and 6. In particular, the long-
run equilibrium relationships between the price variables are reported in table 5, while the short-
run dynamics are displayed in table 6.

11
The two cointegrating equations— in which we have normalized by coefficients of bread and
flour price (the bottom of the chain) to one—can be interpreted as two stationary bread and flour
price setting long-run relations. All wheat prices, with the exception of domestic wholesale and
international prices, are above their equilibrium values as the respective price coefficients in the
cointegrating equation are positive (table 5). Domestic wholesale and international wheat prices
instead are currently below the long-run equilibrium. This implies that the latter wheat prices
should adjust upwards to remain in the long-run equilibrium, while all the other prices need to
adjust downwards. To this end, the short-run adjustments coefficients—that is, the coefficients of
the ECTs in table 6— help to restore these deviations toward the equilibrium.
All the statistically significant estimated coefficients of the ECT have expected signs, that is,
negative when the deviation in the long-run relation is positive, and vice versa. For instance,
when the average international wheat price is too low, it slowly adjusts upward while at the same
time the other prices fall back towards their equilibrium values. Adjustments towards the
equilibrium are generally slow, however. For instance, about 6% of the disequilibrium in bread
prices is eliminated in 1 month, which means it takes above 16 months to restore the equilibrium
after a shock. The speed that markets adjust to shocks is determined by the actions of market
agents who are involved in the transactions that link different market levels. Our results indicate
that price signals pass across agents with some delays, that is, increases or decreases in one end
of the chain are not transmitted instantaneously but instead are distributed over time. This may
indicate that adjustment is costly or it is subject to constraints, such as very high transaction
costs.
Table 5. Long-run relationship between prices
Variable CointEq1 CointEq2
BREAD_P (t-1) 1 0
FLOUR_P (t-1) 0 1
RET_P (t-1) 2.936***
(0.664)
0.108
(0.189)
WHOL_P (t-1) -3.404***
(0.632)
-1.282***
(0.180)
PROD_P (t-1) 0.305
(0.355)
0.577***
(0.101)
INT_P (t-1) -0.674***
(0.243)
-0.156**
(0.069)
Intercept -1.390 -0.549
Notes: *, **, and *** denote statistical significance at the 10%, 5% and 1%
levels, respectively. Standard errors in parentheses.
Table 6. VECM short-run estimates and adjustment parameters
Variables BREAD_P FLOUR_P RET_P WHOL_P PROD_P INT_P
ECTt-1 -0.058** 0.052*** -0.091*** -0.005 0.039 0.075***
(0.029) (0.025) (0.026) (0.029) (0.048) (0.032)
ECTt-2 0.065 -0.326*** 0.011 0.050 -0.443*** -0.152
(0.095) (0.080) (0.085) (0.094) (0.156) (0.106)
BREAD_Pt-1 -0.269*** -0.072 -0.049 -0.070 0.050 -0.118

12
(0.081) (0.068) (0.073) (0.080) (0.133) (0.090)
BREAD_Pt-2 -0.063 0.049 0.024 -0.039 -0.112 -0.077
(0.082) (0.069) (0.074) (0.081) (0.135) (0.092)
FLOUR_Pt-1 -0.011 -0.114 0.024 0.068 0.339** -0.190*
(0.095) (0.080) (0.086) (0.094) (0.156) (0.106)
FLOUR_Pt-2 -0.032 -0.182** -0.030 -0.189** -0.006 -0.130
(0.098) (0.082) (0.088) (0.096) (0.160) (0.109)
RET_Pt-1 0.100 -0.164** -0.202** -0.017 0.015 -0.150
(0.088) (0.074) (0.079) (0.087) (0.144) (0.098)
RET_Pt-2 0.026 -0.064 -0.119 -0.149* -0.207 -0.141
(0.085) (0.072) (0.077) (0.084) (0.140) (0.095)
WHOL_Pt-1 -0.180** -0.007 0.034 -0.085 -0.086 0.125
(0.090) (0.076) (0.081) (0.089) (0.147) (0.100)
WHOL_Pt-2 -0.191** -0.125* -0.088 0.028 -0.100 0.006
(0.090) (0.076) (0.081) (0.089) (0.148) (0.101)
PROD_Pt-1 -0.003 0.125*** 0.090** 0.132*** -0.214*** -0.011
(0.050) (0.042) (0.044) (0.049) (0.081) (0.055)
PROD_Pt-2 -0.010 -0.008 0.011 0.031 -0.094 0.020
(0.051) (0.043) (0.045) (0.050) (0.083) (0.056)
INT_Pt-1 0.077 0.031 0.074 -0.073 -0.310** 0.316***
(0.074) (0.062) (0.066) (0.073) (0.121) (0.082)
INT_Pt-2 -0.159** -0.082 -0.165** 0.072 0.246** -0.128
(0.075) (0.063) (0.067) (0.074) (0.123) (0.083)
PRE_DEVt-1 8.28E-5 1.11E-4 -4.43E-5 -1.04E-5 -0.001* 0
(0.0003) (0.0002) (0.0002) (0.0003) (0.0003) (0.0003)
PRE_DEVt-2 -3.38E-4 -4.97E-5 -2.13E-4 -1.35E-4 1.60E-4 0
(0.0003) (0.0002) (0.0002) (0.0003) (0.0004) (0.0003)
LRBDIt-1 0.002 0.039** -0.005 0.035 -0.034 -0.022
(0.028) (0.020) (0.025) (0.028) (0.046) (0.032)
LRBDIt-2 0.017 0.008 -0.015 -0.006 0.041 0.041
(0.028) (0.023) (0.025) (0.027) (0.045) (0.031)
Intercept 0.060 0.255*** 0.168*** -0.069 0.399*** 0.070
(0.062) (0.052) (0.056) (0.061) (0.102) (0.069)
N 179
R-Squared 0.174 0.282 0.312 0.132 0.258 0.193
F-statistics, p-value 0.017 0.000 0.005 0.199 0.011 0.154
Notes: *, **, and *** denote statistical significance at the 10%, 5% and 1% levels, respectively. Standard errors in
parentheses.
Nearly all short-run own-price elasticities are statistically significant and negative, indicating that
a higher rate of price in the previous month is followed by a lower rate in the current month. The
only exception is that of the international wheat price, which has a positive sign. This implies
that while, domestic prices are mean reverting, that is, a shock in one period is not persistent as
the price converges back to its equilibrium level, the opposite applies to international wheat
price. Another interesting result is that a change in domestic producer price triggers a short-run
response in wholesale, retail, and flour prices, whereas domestic producer price is influenced by
international wheat and domestic wheat flour prices. More specifically, a 10% increase in the
rate of domestic producer price in the previous month triggers a short-run decline of about 2.1%
in its own price but an increase of about 1.2% in flour price, 1.3% in wholesale, and slightly less

13
than 1% in wheat retail prices. As expected, rainfall deviation in the previous month results to a
lower rate of producer prices in the current month. The positive and statistically significant effect
of changes in BDI on the rate of flour prices is because domestic millers typically obtain a
significant share of their wheat grain from imports (Gebreselassie et al, forthcoming). One
expects the government to adjust the price at which it sells imported wheat to millers depending
on changes in shipment costs.
The VEC model is fairly well specified: there is no serial correlation in the disturbances (table 7)
and the stability conditions needed to compute impulse response functions are satisfied (figure
3). However, we fail to reject non-normality of the disturbance term, which indicates that our
parameter estimates are not efficient, but consistent.
Figure 3. Stability of the VAR model
specification
Table 7. Lagrange-multiplier test for
autocorrelation
Lags LM-Stat Prob
1 34.635 0.534
2 43.228 0.190
3 34.783 0.526
4 60.633 0.006
5 21.574 0.973
6 33.793 0.574
H0: No autocorrelation at given lag order
4.3. Alternative specifications of the VEC model
We also estimate a similar VECM for a subset of the price variables in our data. In particular, we
want to analyse the relations among prices at the downstream and upstream of the wheat value
chain. The first specification investigates the relationship between international wheat price,
wholesale price, wheat flour and bread prices, while constraining the long-run coefficients on
producer and retail prices to zero. The long-run equilibrium relationship estimates of these price
variables are reported in table 8, while the coefficients on short-run dynamics are displayed in
table 9.5
The two cointegrating equations—which we have normalized by coefficients of bread and flour
price (variables at the downstream of the value chain) to one—can be interpreted as two
stationary bread and flour price setting long-run relations. In relation to the normalized prices,
5 For the sake of brevity, the parameters estimates on ECT terms and on own price variables are reported. The
remaining results—which can be available on request—are qualitatively similar to our previous estimates.
-1.5
-1.0
-0.5
0.0
0.5
1.0
1.5
-1.5 -1.0 -0.5 0.0 0.5 1.0 1.5
Inverse Roots of AR Characteristic Polynomial

14
domestic flour price (CointEq1) and wholesale price (CointEq2) and international wheat prices
are currently below the long-run equilibrium. Thus, these prices need to adjust upwards to restore
to their long-run equilibrium values, whereas the normalized prices should adjust downwards. As
expected the estimated coefficients of the ECT on the normalized prices—wheat bread in the first
and flour in the second cointegration equations—are negative and statistically significant at the 1
percent level. According to the estimated coefficients, when the average wheat bread price is too
high, it adjusts downwards by about 9% in one month alone, whereas wheat flour price adjusts
upward by a slightly faster speed (21%). The other short-run adjustments coefficients on the
unconstrained price variables have expected signs; however, all except the one on international
prices are not statistically significant. These findings are qualitatively consistent to our earlier
estimates that do not impose the additional constraints.
Table 8. Long-run relationship between prices, with specific constraints
Variable CointEq1 CointEq2
WHBREAD_P(t-1) 1 0
WHFLOUR_P(t-1) -1.990*** 1
(0.323)
WHRET_P(t-1) 0 0
WHWHOL_P(t-1) 0 -0.493***
(0.109)
WHPROD_P(t-1) 0 0
INT_P(t-1) -0.432** -0.215**
(0.178) (0.100)
Intercept 0.762 -0.748
Notes: *, **, and *** denote statistical significance at the 10%, 5% and 1% levels, respectively. Standard errors in
parentheses.
In line with our previous findings, all but international wheat own-price elasticities are
statistically significant and negative, indicating that a higher rate of price in the previous month
is followed by a lower rate in the current month. This confirms our conclusion that domestic
prices are mean reverting, whereas a higher international price in the previous month is
reinforced in the current month.
Table 9. VECM short-run estimates and adjustment parameters, with specific constraints
Variables BREAD_P FLOUR_P RET_P WHOL_P PROD_P INT_P
ECTt-1 -0.092** 0.050 -0.017 0.052 -0.036 0.131***
(0.040) (0.034) (0.038) (0.038) (0.067) (0.044)
ECTt-2 -0.151** -0.208*** -0.135** -0.053 -0.165 0.096
(0.064) (0.054) (0.060) (0.061) (0.108) (0.070)
(Own price)t-1 -0.253*** -0.078 -0.339*** -0.168** -0.383*** 0.306***
(0.083) (0.090) (0.082) (0.090) (0.084) (0.079)
(Own price)t-2 -0.068 -0.151* -0.185** 0.006 -0.207** -0.076
(0.081) (0.086) (0.081) (0.088) (0.085) (0.081)

15
Intercept 0.032* 0.034** 0.025 0.003 0.026 -0.001
(0.017) (0.014) (0.016) (0.016) (0.028) (0.018)
N 178
R-squared 0.184 0.281 0.235 0.174 0.208 0.206
F-statistic 2.122 3.671 2.884 1.978 2.476 2.445
Notes: *, **, and *** denote statistical significance at the 10%, 5% and 1% levels, respectively. Standard errors in
parentheses.
The second alternative specification considers the relationship of prices at the upstream of the
domestic wheat market chain. In particular, we analyse the relationship between domestic
producer, wholesale, and retail prices with a single cointegration equation.6 The long-run
equilibrium relationship estimates and selected coefficients on short-run dynamics of this model
are reported in tables 10 and 11.
Table 10. Long-run relationship between prices, upstream
Variables CointEq1
RET_P(t-1) 1
WHOL_P(t-1) -0.638***
(0.120)
PROD_P(t-1) -0.176**
(0.072)
Intercept -0.296
Notes: *, **, and *** denote statistical significance at the 10%, 5% and 1% levels, respectively. Standard errors in
parentheses.
The coefficients on both domestic wholesale and producer wheat prices in the cointegrating
equation are statistically significant, as is the adjustment parameter for retail price. When the
predictions from the cointegrating equation are positive, retail price is above its equilibrium
value, whereas wholesale and producer prices are below their equilibrium values—since the
respective coefficient in the cointegrating equation is positive for retail price but negative for the
latter two. The estimate of the adjustment parameter for retail price is -0.42 and it is statistically
significant at the 1% level. Thus, when the average retail price is above its equilibrium value, it
quickly falls back towards the wholesale and producer price levels. Indeed, it takes less than a
quarter of a year for the retail price to attain its equilibrium value.
Table 11. VECM short-run estimates and adjustment parameters, upstream
Variables RET_P WHOL_P PROD_P
ECTt-1 -0.421*** -0.021 0.090
(0.080) (0.088) (0.153)
(Own price)t-1 -0.105 -0.130 -0.399***
(0.090) (0.100) (0.084)
(Own price)t-2 -0.075 -0.013 -0.163**
6 The number of cointegration equations is again determined based on the Johansen-Juselius procedure.

16
(0.077) (0.093) (0.084)
Intercept 0.034** 0.001 -0.024
(0.017) (0.018) (0.032)
N 179
R-squared 0.281 0.084 0.147
F-statistic 6.580 1.549 2.900
Notes: *, **, and *** denote statistical significance at the 10%, 5% and 1% levels, respectively. Standard errors in
parentheses.
4.4. Impulse response functions and variance decomposition
The discussion in this section refers to variance decomposition and impulse response functions
(IRF) based on our estimates from the baseline specification (tables 5 and 6).7 We provide the
impulse response functions based on the Cholesky decomposition method (figure 4) and the
variance decomposition based on Monte Carlo repetitions (table 12) to evaluate how shocks
impact the wheat-to-bread value chain. In particular, the IRFs give information on how
innovations to one variable trigger changes in other variables after a certain number of periods,
whereas the variance decomposition provides information about the relative importance of
factors in explaining the variation of each price series.
The four graphs in the first column of figure 4 display the impacts of international wheat price
shock on domestic price dynamics. It emerges that the effect of a shock in the international
wheat price dies out within three to four months. A shock of one standard deviation in the
international price triggers a positive response from all domestic price series in the current
month. This shock leads to a decline in all domestic prices in subsequent months before they
bounce back to positive after one month in the case of producer prices but after three months for
the other domestic prices. The other four graphs in the second and third columns of this figure
show the impacts of impulses in producer and wholesale prices on the remaining domestic
prices. A one standard deviation shock in both producer and wholesale prices leads to a
persistent increase in retail prices. Increases in wholesale prices also generate long-lasting
upsurges in both producer and wheat flour prices. Note also that the response of producer price
to the initial impulse in producer price itself, as well as, the response of wholesale price to the
initial wholesale price impulse are persistent, suggesting a high degree of inertia in both prices.
This implies that increases in producer and wholesale prices are difficult to eradicate. Retail
price shocks—fourth column in figure 4—have a negligible effect on all prices except a quite
delayed one on bread price and one that exponentially vanishes on subsequent own prices. The
graphs in the last two columns of figure 4 show that flour and bread price shocks have a
contained influence on other price dynamics, but have a persistent effect on their own respective
prices. The bottom panel of figure 4 depicts that current shocks in the Baltic dry index triggers a
transitory but positive change in domestic wheat flour and producer prices, which occurs after
one month for the former price but after two months for the latter.
7 The variance decomposition and IRFs from the alternative specification are available upon request.

17
The cumulative responses also show that impacts of international wheat prices remain positive in
the case of producer but become negligible for wheat flour and bread prices (figure A.1). This
implies that positive shocks in international wheat prices may have long-run benefits to domestic
producers but they negatively affect consumers in the short-run. Shocks in producer prices do
also trigger contemporaneous positive responses in wholesale, retail and wheat bread prices, as
do wholesale price shocks trigger positive changes in producer, retail and flour prices. In general,
upstream price shocks are stronger and more persistent. This conclusion is also supported by the
IRFs from the alternative specifications.8
Figure 4. Selected Impulse response functions
The variance decomposition indicates the percentage of domestic price changes explained by
their own shocks and by shocks on other variables in the system. The results show that a
8 These results are available upon request.
-.02
.00
.02
.04
.06
.08
1 2 3 4 5 6 7 8 9 10
Response of LRAA_WHBREAD_P to LRWH_INTP
-.02
.00
.02
.04
.06
.08
1 2 3 4 5 6 7 8 9 10
Response of LRAA_WHBREAD_P to LRBA_WHPROD_P
-.02
.00
.02
.04
.06
.08
1 2 3 4 5 6 7 8 9 10
Response of LRAA_WHBREAD_P to LRAA_WHWHOL_P
-.02
.00
.02
.04
.06
.08
1 2 3 4 5 6 7 8 9 10
Response of LRAA_WHBREAD_P to LRAA_WHRET_P
-.02
.00
.02
.04
.06
.08
1 2 3 4 5 6 7 8 9 10
Response of LRAA_WHBREAD_P to LRAA_WHFLOUR_P
-.02
.00
.02
.04
.06
.08
1 2 3 4 5 6 7 8 9 10
Response of LRAA_WHBREAD_P to LRAA_WHBREAD_P
-.02
.00
.02
.04
.06
1 2 3 4 5 6 7 8 9 10
Response of LRAA_WHFLOUR_P to LRWH_INTP
-.02
.00
.02
.04
.06
1 2 3 4 5 6 7 8 9 10
Response of LRAA_WHFLOUR_P to LRBA_WHPROD_P
-.02
.00
.02
.04
.06
1 2 3 4 5 6 7 8 9 10
Response of LRAA_WHFLOUR_P to LRAA_WHWHOL_P
-.02
.00
.02
.04
.06
1 2 3 4 5 6 7 8 9 10
Response of LRAA_WHFLOUR_P to LRAA_WHRET_P
-.02
.00
.02
.04
.06
1 2 3 4 5 6 7 8 9 10
Response of LRAA_WHFLOUR_P to LRAA_WHFLOUR_P
-.02
.00
.02
.04
.06
1 2 3 4 5 6 7 8 9 10
Response of LRAA_WHFLOUR_P to LRAA_WHBREAD_P
-.02
.00
.02
.04
.06
1 2 3 4 5 6 7 8 9 10
Response of LRAA_WHRET_P to LRWH_INTP
-.02
.00
.02
.04
.06
1 2 3 4 5 6 7 8 9 10
Response of LRAA_WHRET_P to LRBA_WHPROD_P
-.02
.00
.02
.04
.06
1 2 3 4 5 6 7 8 9 10
Response of LRAA_WHRET_P to LRAA_WHWHOL_P
-.02
.00
.02
.04
.06
1 2 3 4 5 6 7 8 9 10
Response of LRAA_WHRET_P to LRAA_WHRET_P
-.02
.00
.02
.04
.06
1 2 3 4 5 6 7 8 9 10
Response of LRAA_WHRET_P to LRAA_WHFLOUR_P
-.02
.00
.02
.04
.06
1 2 3 4 5 6 7 8 9 10
Response of LRAA_WHRET_P to LRAA_WHBREAD_P
-.02
.00
.02
.04
.06
.08
1 2 3 4 5 6 7 8 9 10
Response of LRAA_WHWHOL_P to LRWH_INTP
-.02
.00
.02
.04
.06
.08
1 2 3 4 5 6 7 8 9 10
Response of LRAA_WHWHOL_P to LRBA_WHPROD_P
-.02
.00
.02
.04
.06
.08
1 2 3 4 5 6 7 8 9 10
Response of LRAA_WHWHOL_P to LRAA_WHWHOL_P
-.02
.00
.02
.04
.06
.08
1 2 3 4 5 6 7 8 9 10
Response of LRAA_WHWHOL_P to LRAA_WHRET_P
-.02
.00
.02
.04
.06
.08
1 2 3 4 5 6 7 8 9 10
Response of LRAA_WHWHOL_P to LRAA_WHFLOUR_P
-.02
.00
.02
.04
.06
.08
1 2 3 4 5 6 7 8 9 10
Response of LRAA_WHWHOL_P to LRAA_WHBREAD_P
-.04
.00
.04
.08
.12
1 2 3 4 5 6 7 8 9 10
Response of LRBA_WHPROD_P to LRWH_INTP
-.04
.00
.04
.08
.12
1 2 3 4 5 6 7 8 9 10
Response of LRBA_WHPROD_P to LRBA_WHPROD_P
-.04
.00
.04
.08
.12
1 2 3 4 5 6 7 8 9 10
Response of LRBA_WHPROD_P to LRAA_WHWHOL_P
-.04
.00
.04
.08
.12
1 2 3 4 5 6 7 8 9 10
Response of LRBA_WHPROD_P to LRAA_WHRET_P
-.04
.00
.04
.08
.12
1 2 3 4 5 6 7 8 9 10
Response of LRBA_WHPROD_P to LRAA_WHFLOUR_P
-.04
.00
.04
.08
.12
1 2 3 4 5 6 7 8 9 10
Response of LRBA_WHPROD_P to LRAA_WHBREAD_P
Response to Cholesky One S.D. Innovations
-.1
0
.1
.2
-.1
0
.1
.2
0 2 4 6 8
0 2 4 6 8
Response of D(LRAA_WHFLOUR_P) to D(BDI) Response fo D(LRAA_WHOL_P) to D(BDI)
Response of D(LRAA_PROD_P) to D(BDI)

18
substantial part of all price variations are explained by own-price shocks, though this diminishes
in latter periods. Considering variances of wheat flour prices, for instance, above half of the
variation is explained by current shocks in flour prices itself for about the subsequent 6 months.
However, shocks in other prices—in particular, wholesale prices—become more important in
explaining variations in flour price in latter months. Shocks in wholesale prices also explain a
sizable share of the variability in retail prices. In fact, four to five months delayed changes in
retail prices are better explained by contemporaneous shocks in wholesale prices than shocks in
retail prices themselves. Shocks in domestic producer price are also important in explaining
changes in retail and wholesale prices, explaining above a fifth of the variability in the latter
price starting from the second month horizon. The variances of the downstream prices along the
wheat value chain—bread, flour, and retail wheat prices—are largely explained by own shocks.
These conclusions remain unchanged when we consider corresponding variance decomposition
results from the alternative specifications.9
Table 12. Variance decomposition of domestic price series
Variance Decomposition of BREAD_P:
Period S.E. BREAD_P FLOUR_P RET_P WHOL_P PROD_P INT_P
1 0.070 87.195 5.596 0.140 0.672 1.361 5.036
2 0.086 83.904 6.387 0.129 0.450 1.171 7.959
3 0.098 85.179 6.228 0.528 0.699 0.920 6.447
4 0.110 85.060 6.855 1.060 0.562 0.748 5.715
5 0.120 83.626 7.895 1.516 0.525 0.724 5.714
6 0.130 82.432 8.185 2.358 0.538 0.722 5.765
7 0.139 81.523 8.273 3.167 0.554 0.700 5.782
8 0.147 80.461 8.381 3.843 0.614 0.714 5.987
9 0.155 79.463 8.462 4.432 0.681 0.744 6.219
10 0.162 78.645 8.482 4.968 0.732 0.767 6.406
Variance Decomposition of FLOUR_P:
Period S.E. BREAD_P FLOUR_P RET_P WHOL_P PROD_P INT_P
1 0.059 0.000 85.217 0.141 7.989 0.275 6.378
2 0.072 0.032 76.062 0.136 15.805 0.250 7.714
3 0.077 0.499 70.698 0.306 18.986 2.688 6.824
4 0.083 0.548 64.383 0.726 24.037 3.508 6.798
5 0.091 0.535 58.623 1.191 29.531 3.360 6.759
6 0.097 0.515 54.025 1.241 34.370 3.345 6.505
7 0.103 0.520 50.282 1.300 38.204 3.465 6.229
8 0.109 0.502 46.950 1.353 41.574 3.440 6.181
9 0.115 0.482 44.140 1.378 44.460 3.378 6.162
10 0.120 0.465 41.784 1.379 46.909 3.342 6.122
Variance Decomposition of RET_P:
Period S.E. BREAD_P FLOUR_P RET_P WHOL_P PROD_P INT_P
1 0.063 0.000 0.000 82.829 8.752 6.242 2.178
2 0.082 1.251 0.003 61.716 18.768 11.965 6.298
3 0.093 1.725 0.197 53.892 25.441 13.739 5.006
4 0.104 2.410 0.443 45.460 32.202 14.991 4.494
9 These results are not reported for the sake of brevity.

19
5 0.118 2.898 0.439 37.792 37.845 16.029 4.996
6 0.131 3.481 0.604 31.510 41.972 16.864 5.569
7 0.143 3.915 0.835 27.124 44.888 17.370 5.868
8 0.154 4.262 0.988 23.717 46.989 17.760 6.284
9 0.165 4.526 1.088 21.092 48.516 18.092 6.686
10 0.175 4.744 1.191 19.057 49.656 18.356 6.996
Variance Decomposition of WHOL_P:
Period S.E. BREAD_P FLOUR_P RET_P WHOL_P PROD_P INT_P
1 0.069 0.000 0.000 0.000 82.346 15.028 2.627
2 0.098 0.248 0.280 0.021 73.425 24.259 1.767
3 0.118 0.299 0.423 0.659 71.361 25.973 1.285
4 0.133 0.279 0.369 0.653 71.065 26.414 1.220
5 0.148 0.301 0.317 0.599 70.168 27.051 1.563
6 0.161 0.295 0.295 0.547 69.632 27.621 1.610
7 0.172 0.290 0.291 0.509 69.256 28.060 1.594
8 0.183 0.277 0.272 0.461 68.986 28.423 1.581
9 0.192 0.266 0.254 0.421 68.744 28.739 1.577
10 0.201 0.255 0.240 0.387 68.566 28.999 1.553
Variance Decomposition of PROD_P:
Period S.E. BREAD_P FLOUR_P RET_P WHOL_P PROD_P INT_P
1 0.115 0.000 0.000 0.000 0.000 98.069 1.931
2 0.139 0.175 0.093 0.114 2.588 95.394 1.636
3 0.157 0.241 1.495 0.493 3.642 92.451 1.678
4 0.178 0.194 3.396 0.391 5.854 88.431 1.733
5 0.200 0.184 4.713 0.342 8.106 84.609 2.047
6 0.220 0.177 5.808 0.331 9.739 81.852 2.093
7 0.239 0.173 6.752 0.333 10.990 79.605 2.146
8 0.256 0.170 7.430 0.322 11.970 77.867 2.240
9 0.273 0.170 7.979 0.315 12.739 76.466 2.331
10 0.289 0.170 8.444 0.308 13.328 75.363 2.387
Cholesky Ordering: INT_P, PROD_P, WHOL_P, RET_P, FLOUR_P, BREAD_P
In summary, the variance decomposition findings are in agreement with the implications of the
IRFs, suggesting that stronger shock transmission happens from upstream to downstream of the
wheat value chain than vice versa. Not only does this support the major findings of the granger
causality analysis, this is also in line with our prior expectations (figure 1). These results appear
robust, qualitatively, across alternative specifications as well the use of alternative analysis.
5. Conclusions
The empirical analysis of this paper emphasizes inter-linkages in the wheat value chain in
Ethiopia and its exposure to international price shocks. The wholesale market has been identified
as an important market as it Granger-causes every other domestic market (except bread prices).
Similar to wholesale prices, producer prices Granger-cause all other domestic markets except
bread. Both findings indicate that prices and expectations are formed at the upstream of the

20
wheat-bread value chain—particularly at the wholesale market— and that prices are determined
largely by supply side shocks. In general, our alternative time series analyses suggest that
stronger shock transmission happens from upstream to downstream of the wheat value chain than
vice versa. This is in line with our prior expectations as the items at the upstream of the local
value chain serve as inputs in production of items downstream—and thus contribute to the cost
of production.
The VECM analysis has shown that international prices explain an important share of the
variance of domestic prices at the downstream of the wheat value chain—retail, flour, and bread
prices. This implies that when price shocks occur in the worldwide wheat market, Ethiopia is not
insulated from such price shocks. This could be due the fact that Ethiopia relies strongly on
wheat imports. It should be noted that the speed of adjustment through the supply chain to
market shocks is slow and this points to the fact that the adjustment may be subject to high
transaction costs, the presence of market power, and information asymmetries.
Value chain development has been advocated as a key strategy to promote growth, to improve
market structure, and to reduce exposure to volatility from raw materials (ILO, 2012). While our
empirical analysis reveals that higher stages of the wheat value chain indeed depend less on the
domestic production stage, exposure to international price volatility is not entirely mitigated.
Yet, we found that producer and wholesale market levels play a dominant role in the wheat value
chain, implying that policies may give particular attention to these markets.

21
Appendix
-.02
.00
.02
.04
.06
.08
1 2 3 4 5 6 7 8 9 10
LRWH_INTP LRBA_WHPROD_P
LRAA_WHWHOL_P LRAA_WHRET_P
LRAA_WHFLOUR_P LRAA_WHBREAD_P
Response of LRAA_WHBREAD_P to Cholesky
One S.D. Innovations
-.02
.00
.02
.04
.06
1 2 3 4 5 6 7 8 9 10
LRWH_INTP LRBA_WHPROD_P
LRAA_WHWHOL_P LRAA_WHRET_P
LRAA_WHFLOUR_P LRAA_WHBREAD_P
Response of LRAA_WHFLOUR_P to Cholesky
One S.D. Innovations
-.02
.00
.02
.04
.06
1 2 3 4 5 6 7 8 9 10
LRWH_INTP LRBA_WHPROD_P
LRAA_WHWHOL_P LRAA_WHRET_P
LRAA_WHFLOUR_P LRAA_WHBREAD_P
Response of LRAA_WHRET_P to Cholesky
One S.D. Innovations
-.02
.00
.02
.04
.06
.08
1 2 3 4 5 6 7 8 9 10
LRWH_INTP LRBA_WHPROD_P
LRAA_WHWHOL_P LRAA_WHRET_P
LRAA_WHFLOUR_P LRAA_WHBREAD_P
Response of LRAA_WHWHOL_P to Cholesky
One S.D. Innovations
-.04
.00
.04
.08
.12
1 2 3 4 5 6 7 8 9 10
LRWH_INTP LRBA_WHPROD_P
LRAA_WHWHOL_P LRAA_WHRET_P
LRAA_WHFLOUR_P LRAA_WHBREAD_P
Response of LRBA_WHPROD_P to Cholesky
One S.D. Innovations
Figure A. 1. Impulse response functions for the baseline specification
22
References
Admassie, A. (2013) The political economy of food price: The case of Ethiopia. UNU WIDER
Working Paper 001. Helsinki, Finland.
Engle, R. F., & Granger, C. W. (1987). Co-integration and error correction: representation,
estimation, and testing. Econometrica: Journal of the Econometric Society, 251-276.
Goodwin, B. K., & Harper, D. C. (2000). Price transmission, threshold behavior, and asymmetric
adjustment in the US pork sector. Journal of Agricultural and Applied Economics,
32(03), 543-553.
Johansen, S. (1988). Statistical analysis of cointegration vectors. Journal of Economic Dynamics
and Control, 12(2), 231-254.
Johansen, S., & Juselius, K. (1990). Maximum likelihood estimation and inference on
cointegration with applications to the demand for money. Oxford Bulletin of Economics
and Statistics, 52(2), 169-210.
Lütkepohl, H., Saikkonen, P., & Trenkler, C. (2001). Maximum eigenvalue versus trace tests for
the cointegrating rank of a VAR process. The Econometrics Journal, 287-310.
Minot, N. (2010). Transmission of world food price changes to markets in Sub-Saharan Africa.
IFPRI Discussion Paper: 01059. International Food Policy Research Institute,
Washington, DC.
Osterwald-Lenum, M. (1992). A note with quantiles of the asymptotic distribution of the
maximum likelihood cointegration rank test statistics1. Oxford Bulletin of Economics and
Statistics, 54(3), 461-472.
Pantula, S. G. (1989). Testing for unit roots in time series data. Econometric Theory, 5(02), 256-
271.
Toda, H. Y., & Yamamoto, T. (1995). Statistical inference in vector autoregressions with
possibly integrated processes. Journal of econometrics, 66(1), 225-250.
Urgessa, M. (2011). Market chain analysis of teff and wheat production in Halaba Liyu Woreda,
Southern Ethiopia. MSc. Thesis: Haramaya University. Haramaya, Ethiopia.
Woldehanna, T., Bayrau, A., Getnet, K., & Woldegiorigis, T. (2010). A Study on the formulation
of policy options and strategies to enhance the participation of producers, traders and
processors in the grain market of the Ethiopia commodity exchange. Report Submitted to
Ethiopia Commodity Exchange Authority. Ethiopian Development Research Institute
(EDRI). Addis Ababa, Ethiopia.