
© Ipswitch, Inc. WhatsUp Gold VoIP Monitor Product Overview.

WhatsUpGoldv14.4
User Guide
i
Contents
CHAPTER 1 WhatsUp Gold Overview
Welcome to Ipswitch WhatsUp Gold ..................................................................................................................... 8
WhatsUp Gold editions ............................................................................................................................................. 10
New in Ipswitch WhatsUp Gold ............................................................................................................................. 15
Sending feedback ....................................................................................................................................................... 15
Finding more information and updates ............................................................................................................. 15
CHAPTER 2 Installing and Configuring WhatsUp Gold
System requirements ................................................................................................................................................ 17
Installing WhatsUp Gold .......................................................................................................................................... 17
Using IIS for the WhatsUp Gold web server ...................................................................................................... 18
Getting Acquainted with WhatsUp Gold
CHAPTER 3 Using the WhatsUp Gold Console ................................................................................................ 19
About the console .......................................................................................................................................... 19
About the Task Tray and Desktop Actions icon .................................................................................. 20
Using the WhatsUp Gold console menus .............................................................................................. 21
About the Device View ................................................................................................................................. 29
About the Map View ..................................................................................................................................... 31
CHAPTER 4 Using the WhatsUp Gold Web Interface .................................................................................... 32
Accessing the web interface ...................................................................................................................... 32
About the WhatsUp Gold web interface ................................................................................................ 33
CHAPTER 5 Using WhatsUp Gold Mobile Access ........................................................................................... 39
About WhatsUp Gold Mobile Access ...................................................................................................... 39
Managing WhatsUp Gold Mobile Access .............................................................................................. 40
Accessing WhatsUp Gold from a mobile device ................................................................................. 40
Navigating and using the WhatsUp Gold Mobile Access home screen ..................................... 43
Discovering Network Data
CHAPTER 6 Discovering network devices ......................................................................................................... 49
Preparing devices for discovery ................................................................................................................ 49
Preparing WhatsUp Gold for discovery .................................................................................................. 51
Configuring and running discovery ........................................................................................................ 52
Configuring Scheduled Discovery ........................................................................................................... 60
Adding a single device manually .............................................................................................................. 61
ii
CHAPTER 7 Using Device Roles ............................................................................................................................. 63
Configuring device role settings .............................................................................................................. 64
Configuring device role identification settings ................................................................................... 66
Using the percent variables in the Discovery Console ..................................................................... 69
Managing device roles ................................................................................................................................. 72
Using Administrative Features
CHAPTER 8 Managing Users .................................................................................................................................. 74
About user accounts ..................................................................................................................................... 74
About user rights ............................................................................................................................................ 77
About device group access rights ............................................................................................................ 80
CHAPTER 9 Using the Program Options ............................................................................................................ 86
Enabling the polling engine ....................................................................................................................... 86
Enabling actions ............................................................................................................................................. 87
Enabling performance monitors ............................................................................................................... 87
Enabling FIPS 140-2 mode .......................................................................................................................... 87
Enabling WhatsVirtual event collection ................................................................................................. 90
Enabling the WhatsUp Gold web server ................................................................................................ 91
Changing the date and time format........................................................................................................ 92
Changing how long report data is stored ............................................................................................. 93
Changing the device state colors or icons ............................................................................................ 94
Changing clock/regional preferences .................................................................................................... 95
CHAPTER 10 Using the WhatsUp Services Controller ................................................................................... 96
Managing Services using the WhatsUp Services Controller ........................................................... 96
Managing Devices
CHAPTER 11 About Device Basics ........................................................................................................................ 98
Viewing network devices and data .......................................................................................................... 98
Device overview ............................................................................................................................................. 99
About the Device View ................................................................................................................................. 99
Using Credentials ........................................................................................................................................ 100
Learning about the Device Properties ................................................................................................. 101
Adding a new device ................................................................................................................................. 114
Cloning a device .......................................................................................................................................... 119
CHAPTER 12 Using Device Groups ....................................................................................................... 122
CHAPTER 13 About Polling ..................................................................................................................... 136
Using Acknowledgements ....................................................................................................................... 145
iii
CHAPTER 14 Using Maps ......................................................................................................................... 146
Creating custom context Menus ........................................................................................................... 159
Configuring multiple devices with the Bulk Field Change feature ........................................... 161
Performing a device search using Find Device................................................................................. 162
Monitoring Devices
CHAPTER 15 Using Active Monitors ................................................................................................................. 165
Active monitors overview ........................................................................................................................ 165
About the Active Monitor Library .......................................................................................................... 165
Configuring active monitors ................................................................................................................... 166
Using the Active Script Active Monitor ............................................................................................... 243
Assigning active monitors ........................................................................................................................ 243
Removing and deleting active monitors ............................................................................................ 245
About critical active monitors ................................................................................................................ 246
Group and Device active monitor reports .......................................................................................... 249
CHAPTER 16 Using Passive Monitors ............................................................................................................... 250
Passive monitors overview ...................................................................................................................... 250
About the Passive Monitor Library........................................................................................................ 251
About Passive Monitor Listeners ........................................................................................................... 253
Configuring passive monitors ................................................................................................................ 257
Assigning passive monitors ..................................................................................................................... 262
Group and device passive monitor reports ....................................................................................... 263
CHAPTER 17 Using Actions .................................................................................................................................. 264
Actions overview ......................................................................................................................................... 264
About the Action Library .......................................................................................................................... 266
Configuring an action ................................................................................................................................ 267
About Percent Variables ........................................................................................................................... 297
Testing an action ......................................................................................................................................... 300
Assigning an action .................................................................................................................................... 300
Removing an action ................................................................................................................................... 302
Creating a Blackout Period ...................................................................................................................... 303
About Action Policies ................................................................................................................................. 303
Example: getting an Email alert when the Web server fails ......................................................... 306
Using Scripting Actions ............................................................................................................................. 309
iv
CHAPTER 18 Using Performance Monitors .................................................................................................... 310
Performance monitors overview ........................................................................................................... 310
About the Performance Monitor Library ............................................................................................ 311
Configuring performance monitors ..................................................................................................... 312
Enabling global performance monitors .............................................................................................. 317
Enabling SNMP on Windows devices ................................................................................................... 318
Scenario: ......................................................................................................................................................... 329
Using the Active Script Performance Monitor .................................................................................. 329
About performance reporting ................................................................................................................ 330
CHAPTER 19 Using the Alert Center ................................................................................................................. 331
About Alert Center ...................................................................................................................................... 331
Navigating Alert Center ............................................................................................................................ 333
About the Threshold Library ................................................................................................................... 339
About the Alert Center Notification Library ...................................................................................... 380
About notification policies ...................................................................................................................... 386
Using Alert Center reports ....................................................................................................................... 388
CHAPTER 20 Monitoring Performance Data in Real Time ........................................................................ 394
About Real-Time Data features .............................................................................................................. 394
Using InstantInfo popups ......................................................................................................................... 395
Using Network Tools to view real-time data ..................................................................................... 396
Using Split Second Graph Workspace Reports ................................................................................. 398
Viewing Real-time Data in Full Reports ............................................................................................... 399
Using Reporting Features
CHAPTER 21 Understanding and Using Workspaces ................................................................................. 400
Learning about workspaces .................................................................................................................... 400
About types of workspaces ..................................................................................................................... 401
Managing Workspace Views ................................................................................................................... 407
Navigating Workspace Views .................................................................................................................. 410
About workspace content........................................................................................................................ 410
Adding workspace reports to a workspace view ............................................................................. 410
v
CHAPTER 22 Using Workspace Reports .......................................................................................................... 413
Learning about workspace reports ....................................................................................................... 413
List of workspace reports ......................................................................................................................... 415
Flow Monitor workspace reports ........................................................................................................... 432
About the workspace report menu ...................................................................................................... 434
Configuring a workspace report ............................................................................................................ 435
Moving workspace reports within a workspace view .................................................................... 436
Device Group Mini Status workspace report ..................................................................................... 437
CHAPTER 23 Using Full Reports ......................................................................................................................... 439
Learning about full reports ...................................................................................................................... 439
Advantages of full Reports ....................................................................................................................... 440
List of full reports ......................................................................................................................................... 443
About report refresh intervals ................................................................................................................ 447
Report column sizing and sorting ......................................................................................................... 448
Changing the report date range ............................................................................................................ 448
Filtering report data by page .................................................................................................................. 450
Adding a report to your list of favorites .............................................................................................. 450
CHAPTER 24 Using Scheduled Reports (web interface) / Recurring Reports (console)................. 451
Using Scheduled Reports: printing, exporting, and emailing reports ..................................... 452
Using Recurring Reports (WhatsUp Gold console) ......................................................................... 454
Appendix A: Using SNMP Features
SNMP overview ......................................................................................................................................................... 456
Monitoring an SNMP Service ............................................................................................................................... 457
About the SNMP Agent or Manager ................................................................................................................. 457
About the SNMP Management Information Base ....................................................................................... 457
About SNMP Object Names and Identifiers ................................................................................................... 458
Using the SNMP MIB Manager ............................................................................................................................ 459
Using the SNMP MIB Manager to troubleshoot MIB files .......................................................................... 459
About the SNMP operations ................................................................................................................................ 462
Using a custom name for SNMP device interfaces ...................................................................................... 462
Configuring a custom name (ifAlias) for an SNMP device interface ......................................... 462
About SNMP Security ............................................................................................................................................. 466
Using the Trap Definition Import Tool ............................................................................................................. 466
vi
Appendix B: Using Network Tools
About Network Tools ............................................................................................................................................. 468
Using the Ping tool .................................................................................................................................................. 470
Using the Traceroute tool ..................................................................................................................................... 470
Using the Lookup tool ........................................................................................................................................... 471
Using the Telnet tool .............................................................................................................................................. 472
Using the SNMP MIB Walker ................................................................................................................................ 473
Using the SNMP MIB Explorer ............................................................................................................................. 476
Using the MAC Address Tool ............................................................................................................................... 477
Using the Diagnostic Tool .................................................................................................................................... 479
Using the Web Performance Monitor .............................................................................................................. 480
Using the Web Task Manager .............................................................................................................................. 483
Using the Web Task Manager - Process tab ....................................................................................... 485
Using the Web Task Manager - Performance tab ............................................................................ 487
Using the Web Task Manager - Interfaces tab .................................................................................. 490
Using the database backup and restore backup utility ............................................................................. 492
Appendix C: Extending WhatsUp Gold with custom scripting
Extending WhatsUp Gold with scripting ......................................................................................................... 493
Scripting Active Monitors ..................................................................................................................................... 494
Using the Context object with Active Monitors ............................................................................... 495
Example Active Script Active Monitors ............................................................................................... 498
Scripting Performance Monitors ........................................................................................................................ 511
Using the Context object with Performance Monitors .................................................................. 512
Example Active Script Performance Monitors .................................................................................. 515
Scripting Actions ...................................................................................................................................................... 520
Using the Context object with Actions ............................................................................................... 521
Example Active Script Actions ................................................................................................................ 523
Appendix D: Using the SNMP API
CoreAsp.SnmpRqst ..................................................................................................................................... 525
CoreAsp.ComResult .................................................................................................................................... 529
CoreAsp.ComSnmpResponse ................................................................................................................. 529
Example scripts using the SNMP API .................................................................................................... 530
Troubleshooting the SNMP API .............................................................................................................. 533
vii
Appendix E: Troubleshooting and Maintenance
Troubleshooting your network........................................................................................................................... 534
Maintaining the Database .................................................................................................................................... 535
About the database tools ......................................................................................................................... 535
Recovering from a "Version Mismatch" error ................................................................................................ 538
Task Tray Application fails on Windows Vista ................................................................................................ 538
Connecting to a Remote Desktop ..................................................................................................................... 539
WhatsUp Gold engine message ......................................................................................................................... 539
Troubleshooting SNMP and WMI connections ............................................................................................. 540
Re-enabling the Telnet protocol handler ........................................................................................................ 541
Passive Monitor payload limitation ................................................................................................................... 542
Receiving entries in the SNMP Trap Log ......................................................................................................... 542
Restarting the WhatsUp Gold services from the command line ............................................................ 542
Recommended SMS modems and troubleshooting tips .......................................................................... 543
Uninstalling Ipswitch WhatsUp Gold ................................................................................................................ 545
Troubleshooting the WhatsUp Health Threshold ........................................................................................ 545
Appendix F: About the Dashboard Screen Manager
Ipswitch Dashboard Screen Manager overview ........................................................................................... 547
How does the Dashboard Screen Manager work? ...................................................................................... 548
What is a Dashboard playlist? ................................................................................................................. 549
Installing the Dashboard Screen Manager ..................................................................................................... 549
Opening the Dashboard Screen Manager ......................................................................................... 550
Configuring a Dashboard Screen Manager playlist..................................................................................... 551
8
CHAPTER 1
WhatsUp Gold Overview
In This Chapter
Welcome to Ipswitch WhatsUp Gold .............................................................. 8
WhatsUp Gold editions .................................................................................... 10
New in Ipswitch WhatsUp Gold ..................................................................... 14
Sending feedback ............................................................................................... 15
Finding more information and updates ..................................................... 15
Welcome to Ipswitch WhatsUp Gold
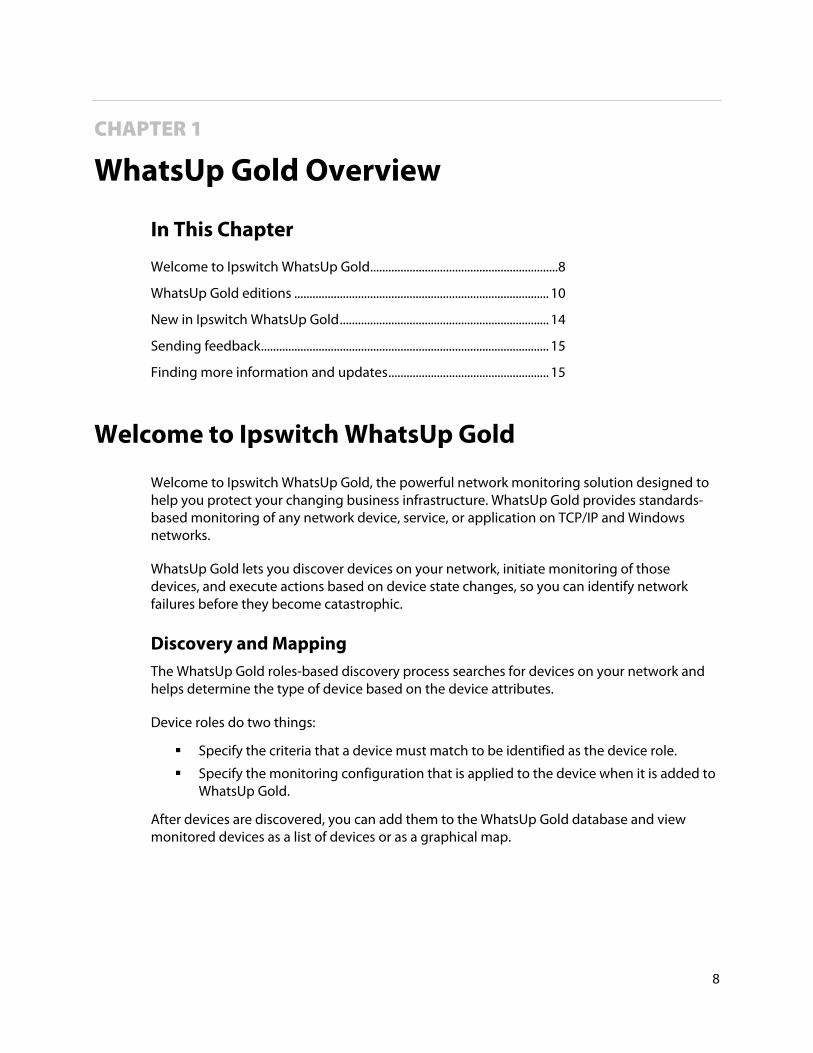
Welcome to Ipswitch WhatsUp Gold, the powerful network monitoring solution designed to help you protect your changing business infrastructure. WhatsUp Gold provides standards-based monitoring of any network device, service, or application on TCP/IP and Windows networks.
WhatsUp Gold lets you discover devices on your network, initiate monitoring of those devices, and execute actions based on device state changes, so you can identify network failures before they become catastrophic.
Discovery and Mapping The WhatsUp Gold roles-based discovery process searches for devices on your network and helps determine the type of device based on the device attributes.
Device roles do two things:
Specify the criteria that a device must match to be identified as the device role.
Specify the monitoring configuration that is applied to the device when it is added to WhatsUp Gold.
After devices are discovered, you can add them to the WhatsUp Gold database and view monitored devices as a list of devices or as a graphical map.
Using WhatsUp Gold 14.4
9
Polling/Listening WhatsUp Gold actively polls devices to determine their status. You can use active monitors to poll services on a device and to passively listen for messages sent across the network. Performance monitors track device performance by checking and reporting on device resources, such as disk, CPU, and interfaces.
Actions/Alerts Depending on the responses received from polling, WhatsUp Gold fires actions to notify you of changes on your network. Actions aid in problem resolution through assorted options such as email and cell phone alerts, or service restarts. In addition to actions, WhatsUp Gold Alert Center notifies you of issues on passive and performance monitors, the WhatsUp Gold system, and WhatsUp Gold Flow Monitor through user-configured thresholds and notification policies.
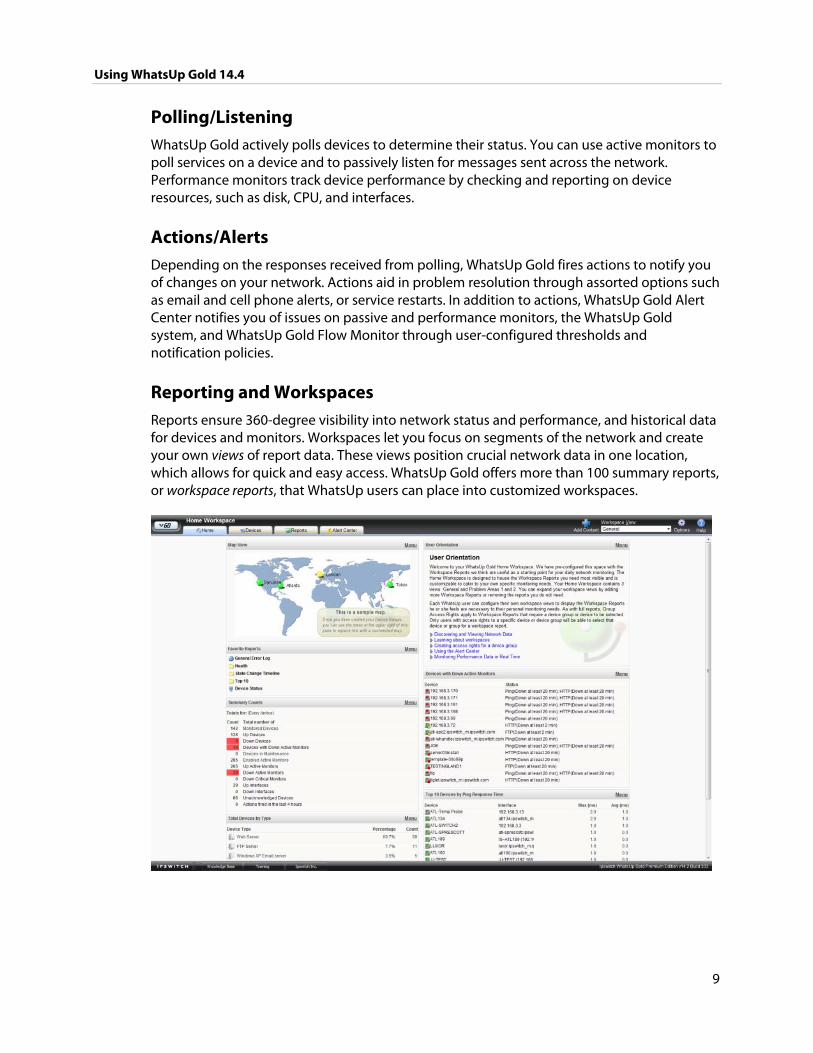
Reporting and Workspaces Reports ensure 360-degree visibility into network status and performance, and historical data for devices and monitors. Workspaces let you focus on segments of the network and create your own views of report data. These views position crucial network data in one location, which allows for quick and easy access. WhatsUp Gold offers more than 100 summary reports, or workspace reports, that WhatsUp users can place into customized workspaces.
Using WhatsUp Gold 14.4
10
WhatsUp Gold Interfaces WhatsUp Gold offers two user interfaces, the Windows console interface and the web interface, which offer similar functionality. We recommend that you do the initial set up—discovery and mapping—on the console, then use the web interface for additional setup of monitors and workspaces, users and permissions, and for day-to-day monitoring.
Windows console interface. The console is a Windows application, through which you can configure and manage WhatsUp Gold and its database.
Web interface. The web interface provides access to WhatsUp Gold functionality (via HTTP or HTTPS) from a web browser.
Mobile interface. You can now conveniently view your network's status from a mobile device at any time through WhatsUp Gold Mobile Access.
WhatsUp Gold editions
WhatsUp Gold is available in four editions. Each edition tailors WhatsUp Gold's features to meet the diverse needs of WhatsUp users, from small networks to those spanning multiple geographic locations.
WhatsUp Gold Standard Edition provides core network management features.
WhatsUp Gold Premium Edition provides all of the network management capabilities of WhatsUp Gold Standard Edition, plus advanced management for Microsoft® Exchange™, Microsoft® SQL Server™, and SMTP email servers. Premium Edition also includes several features that let you monitor performance data in real time, as well as support for application monitoring using Microsoft's WMI™.
WhatsUp Gold MSP Edition gives managed solution providers the ability to use all of the features of WhatsUp Gold Premium Edition to monitor their customers' remote networks from a central location in the managed solution provider's network operations center. Managing multiple companies' networks at once has never been easier.
WhatsUp Gold Distributed Edition extends the features of WhatsUp Gold Premium Edition to companies whose networks are segmented across multiple geographic locations. WhatsUp Gold Distributed Edition can detect issues at any of the company's sites and can then report the issue to the effected site and to a central location.
Using WhatsUp Gold 14.4
11
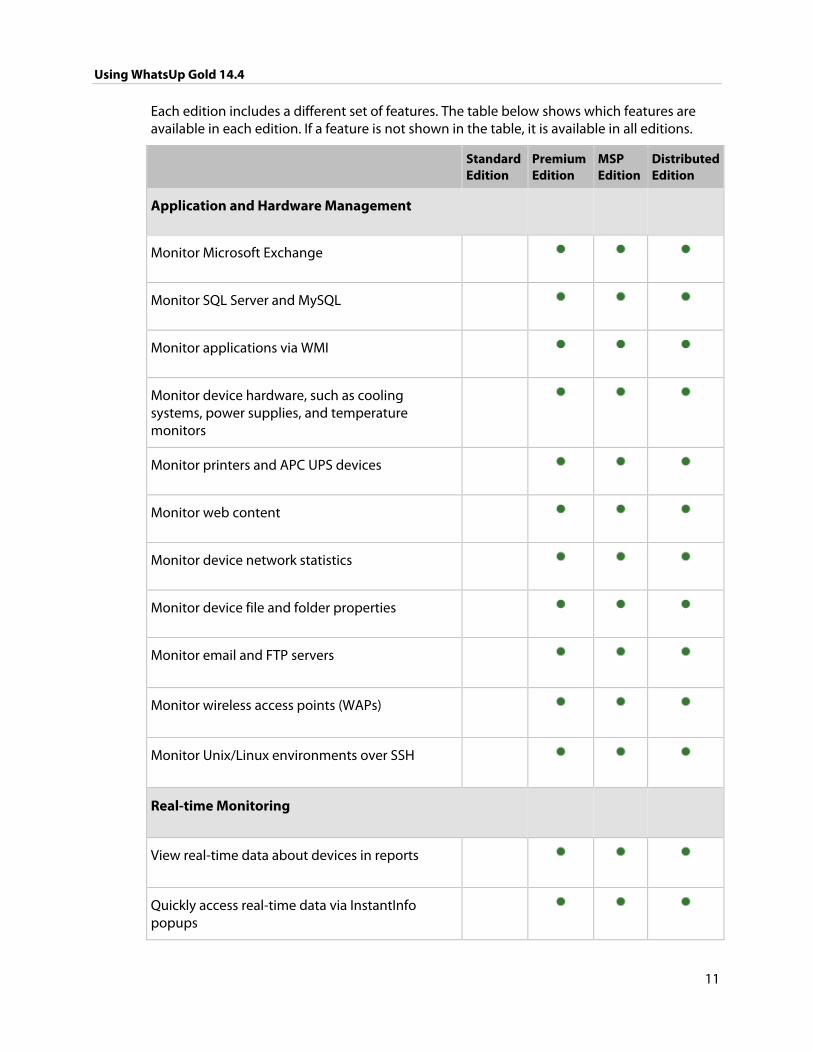
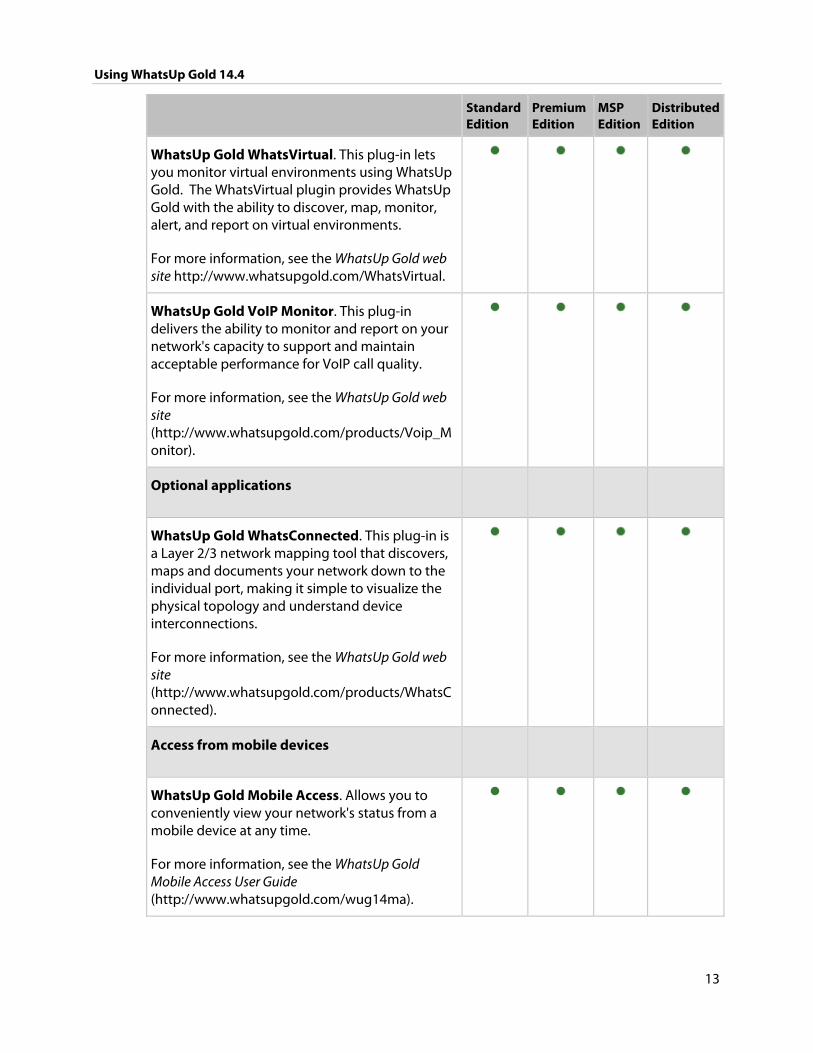
Each edition includes a different set of features. The table below shows which features are available in each edition. If a feature is not shown in the table, it is available in all editions.
Standard Edition
Premium Edition
MSP Edition
Distributed Edition
Application and Hardware Management
Monitor Microsoft Exchange
Monitor SQL Server and MySQL
Monitor applications via WMI
Monitor device hardware, such as cooling systems, power supplies, and temperature monitors
Monitor printers and APC UPS devices
Monitor web content
Monitor device network statistics
Monitor device file and folder properties
Monitor email and FTP servers
Monitor wireless access points (WAPs)
Monitor Unix/Linux environments over SSH
Real-time Monitoring
View real-time data about devices in reports
Quickly access real-time data via InstantInfo popups
Using WhatsUp Gold 14.4
12
Standard Edition
Premium Edition
MSP Edition
Distributed Edition
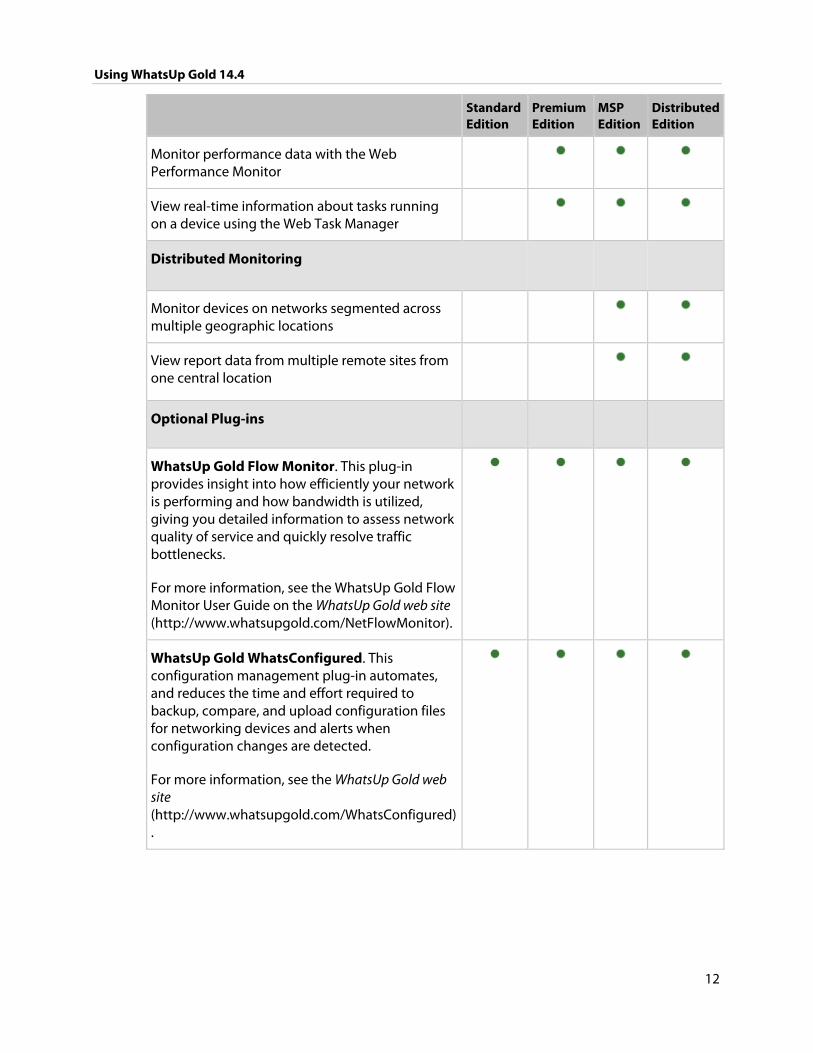
Monitor performance data with the Web Performance Monitor
View real-time information about tasks running on a device using the Web Task Manager
Distributed Monitoring
Monitor devices on networks segmented across multiple geographic locations
View report data from multiple remote sites from one central location
Optional Plug-ins
WhatsUp Gold Flow Monitor. This plug-in provides insight into how efficiently your network is performing and how bandwidth is utilized, giving you detailed information to assess network quality of service and quickly resolve traffic bottlenecks.
For more information, see the WhatsUp Gold Flow Monitor User Guide on the WhatsUp Gold web site (http://www.whatsupgold.com/NetFlowMonitor).
WhatsUp Gold WhatsConfigured. This configuration management plug-in automates, and reduces the time and effort required to backup, compare, and upload configuration files for networking devices and alerts when configuration changes are detected.
For more information, see the WhatsUp Gold web site (http://www.whatsupgold.com/WhatsConfigured).
Using WhatsUp Gold 14.4
13
Standard Edition
Premium Edition
MSP Edition
Distributed Edition
WhatsUp Gold WhatsVirtual. This plug-in lets you monitor virtual environments using WhatsUp Gold. The WhatsVirtual plugin provides WhatsUp Gold with the ability to discover, map, monitor, alert, and report on virtual environments.
For more information, see the WhatsUp Gold web site http://www.whatsupgold.com/WhatsVirtual.
WhatsUp Gold VoIP Monitor. This plug-in delivers the ability to monitor and report on your network's capacity to support and maintain acceptable performance for VoIP call quality.
For more information, see the WhatsUp Gold web site (http://www.whatsupgold.com/products/Voip_Monitor).
Optional applications
WhatsUp Gold WhatsConnected. This plug-in is a Layer 2/3 network mapping tool that discovers, maps and documents your network down to the individual port, making it simple to visualize the physical topology and understand device interconnections.
For more information, see the WhatsUp Gold web site (http://www.whatsupgold.com/products/WhatsConnected).
Access from mobile devices
WhatsUp Gold Mobile Access. Allows you to conveniently view your network's status from a mobile device at any time.
For more information, see the WhatsUp Gold Mobile Access User Guide (http://www.whatsupgold.com/wug14ma).
Using WhatsUp Gold 14.4
14
WhatsUp Gold optional plug-ins are available for use with any of the WhatsUp Gold editions. These plug-ins broaden your monitoring and reporting capabilities to give you a more complete picture of your network and its many components. For more information, see the WhatsUp Gold web site (http://www.whatsupgold.com/).
WhatsUp Gold Flow Monitor plug-in for WhatsUp Gold leverages Cisco NetFlow, sFlow, and J-Flow data from switches and routers to gather, analyze, report, and alert on LAN/WAN network traffic patterns and bandwidth utilization in real-time. It highlights not only overall utilization for the LAN/WAN, specific devices, or interfaces; it also indicates users, applications, and protocols that are consuming abnormal amounts of bandwidth, giving you detailed information to assess network quality of service and quickly resolve traffic bottlenecks. WhatsUp Flow Monitor protects network security by detecting virus and worm activity on the network. Comprehensive reporting takes the raw real-time network traffic data from routers and switches and presents you with useful information to understand trends, utilization, and where network bandwidth is consumed. For more information, see the WhatsUp Gold Flow Monitor User Guide on the WhatsUp Gold web site (http://www.whatsupgold.com/NetFlowMonitor).
WhatsUp Gold WhatsConnected plug-in for WhatsUp Gold provides layer 2/3 network discovery and topology mapping to visually depict device connectivity down to the individual port. It also employs deep device scanning that provides detailed Information about discovered devices in a simple device list view, a device category view, and a detailed topology view. You can publish any of the network maps as a network diagram in Microsoft® Visio™ or export detailed device information to WhatsUp Gold to automate the creation of detailed network topology map views. WhatsConnected also includes Layer 2 Trace and IP/MAC Finder tools to validate connection paths and report real-time availability data on devices. For more information, see the WhatsUp Gold web site (http://www.whatsupgold.com/products/WhatsConnected).
WhatsUp Gold VoIP Monitor plug-in for WhatsUp Gold measures your network's ability to provide the quality of service (QoS) necessary for your VoIP calls on your LAN and WAN links. After a simple setup, the VoIP Monitor accesses Cisco IP SLA (service level agreement) enabled devices to monitor VoIP performance and quality parameters including jitter, packet loss, latency, and other performance values. The plug-in’s full integration with WhatsUp Gold allows you to easily view graphs and metrics for bandwidth and interface utilization and troubleshoot network issues that affect VoIP performance. For more information, see the WhatsUp Gold web site (http://www.whatsupgold.com/products/Voip_Monitor).
Using WhatsUp Gold 14.4
15
New in Ipswitch WhatsUp Gold
Refer to the Release Notes (http://www.whatsupgold.com/WUG144relnotes) for Ipswitch WhatsUp Gold product features, system requirements, fixed in this release, known issues, and other information.
Sending feedback
We value your opinions on our products and welcome your feedback.
To provide feedback on existing features, suggest new features or enhancements, or suggest ways to make our products easier to use, please fill out our product feedback form (http://www.whatsupgold.com/wugfeedback).
Finding more information and updates
Following are information resources for WhatsUp Gold. This information may be periodically updated and available on the WhatsUp Gold web site (http://www.whatsupgold.com/wugtechsupport).
Release Notes. The release notes provide an overview of changes, known issues, and bug fixes for the current release. The notes also contain instructions for installing, upgrading, and configuring WhatsUp Gold. The release notes are available at Start > Programs > Ipswitch WhatsUp Gold > Release Notes or on the WhatsUp Gold web site (http://www.whatsupgold.com/WUG144relnotes).
Application Help for the console and web interface. The console and web help contain dialog assistance, general configuration information, and how-to's that explain how to use the features. The Table of Contents is organized by functional area, and can be accessed from the main menu or by clicking Help in the console, or the ? icon in the web interface.
Getting Started Guide. This guide provides an overview of WhatsUp Gold, information to help you get started using the application, the system requirements, and information about installing and upgrading. The Getting Started Guide is available on the WhatsUp Gold web site (http://www.whatsupgold.com/wug144gsg).
Additional WhatsUp Gold resources. For a listing of current and previous guides and help available for WhatsUp Gold products, see the WhatsUp Gold web site (http://www.whatsupgold.com/support/guides.aspx).
WhatsUp Gold optional plug-ins. You can extend the core features of WhatsUp Gold by installing plug-ins. For information on available plug-ins and to see release notes for each plug-in, see WhatsUp Gold plug-ins documentation (http://www.whatsupgold.com/support/guides.aspx).

Using WhatsUp Gold 14.4
16
Licensing Information. Licensing and support information is available on the MyIpswitch licensing portal (http://www.myipswitch.com/). The web portal provides enhanced web-based capabilities to view and manage Ipswitch product licenses.
Technical Support. Use the WhatsUp Gold Support Site for a variety of WhatsUp Gold product help resources. From here you can view product documentation, search Knowledge Base articles, access the community site for help from other users, and get other Technical Support information. The Support Site is available on the WhatsUp Gold web site (http://www.whatsupgold.com/wugtechsupport).
17
CHAPTER 2
Installing and Configuring WhatsUp Gold
In This Chapter
System requirements ........................................................................................ 17
Installing WhatsUp Gold .................................................................................. 17
Using IIS for the WhatsUp Gold web server .............................................. 18
System requirements
Refer to the Release Notes (http://www.whatsupgold.com/WC30relnotes) for WhatsConnected product features, system requirements, fixed in this release, known issues, and other information.
Installing WhatsUp Gold
Note: The Release Notes (http://www.whatsupgold.com/WUG144relnotes) contain the most up-to-date information about installing WhatsUp Gold. Read the release notes prior to installing to be aware of any potential installation issues.
Before installing WhatsUp Gold, you must decide where you want to store the network management data WhatsUp Gold gathers.
By default, WhatsUp Gold installs Microsoft SQL Server 2005 Express Edition on the same computer on which WhatsUp Gold is installed. This configuration works well for most networks. However, Microsoft SQL Server 2005 Express Edition has a database size limit of 4 GB, which may be too small to contain the data collected on larger networks.
Using WhatsUp Gold 14.4
18
Alternatively, you can configure WhatsUp Gold to use an existing Microsoft SQL Server database. Microsoft SQL Server does not have the same size limitations as Microsoft SQL Server 2005 Express Edition, but it does require a knowledgable database administrator for its configuration and maintenace.
Note: The installation instructions in this document apply only to WhatsUp Gold Standard Edition and WhatsUp Gold Premium Edition. For installation instructions for WhatsUp Gold Distributed Edition or WhatsUp Gold MSP Edition, see WhatsUp Gold Distributed Edition Deployment Guide (http://www.whatsupgold.com/WUG144dsdg) or WhatsUp Gold MSP Edition Deployment Guide (http://www.whatsupgold.com/WUG144mspdg).
Using IIS for the WhatsUp Gold web server
Because of the need for a more robust and feature rich web platform, Microsoft IIS version 6, or version 7 has become the recommended web server for supporting the WhatsUp Gold Web Interface and its associated web services. The installation program has been updated to automatically configure an existing IIS web server by default. The legacy WhatsUp Gold Web Server is provided as a fall-back option.
For more information, see the Configuring the web server section of the Installing and Configuring WhatsUp Gold (http://www.whatsupgold.com/wugiis_144) guide.
19
Getting Acquainted with WhatsUp Gold
CHAPTER 3
Using the WhatsUp Gold Console
In This Chapter
About the console .............................................................................................. 19
About the Task Tray and Desktop Actions icon ....................................... 20
Using the WhatsUp Gold console menus .................................................. 21
About the Device View ..................................................................................... 29
About the Map View .......................................................................................... 31
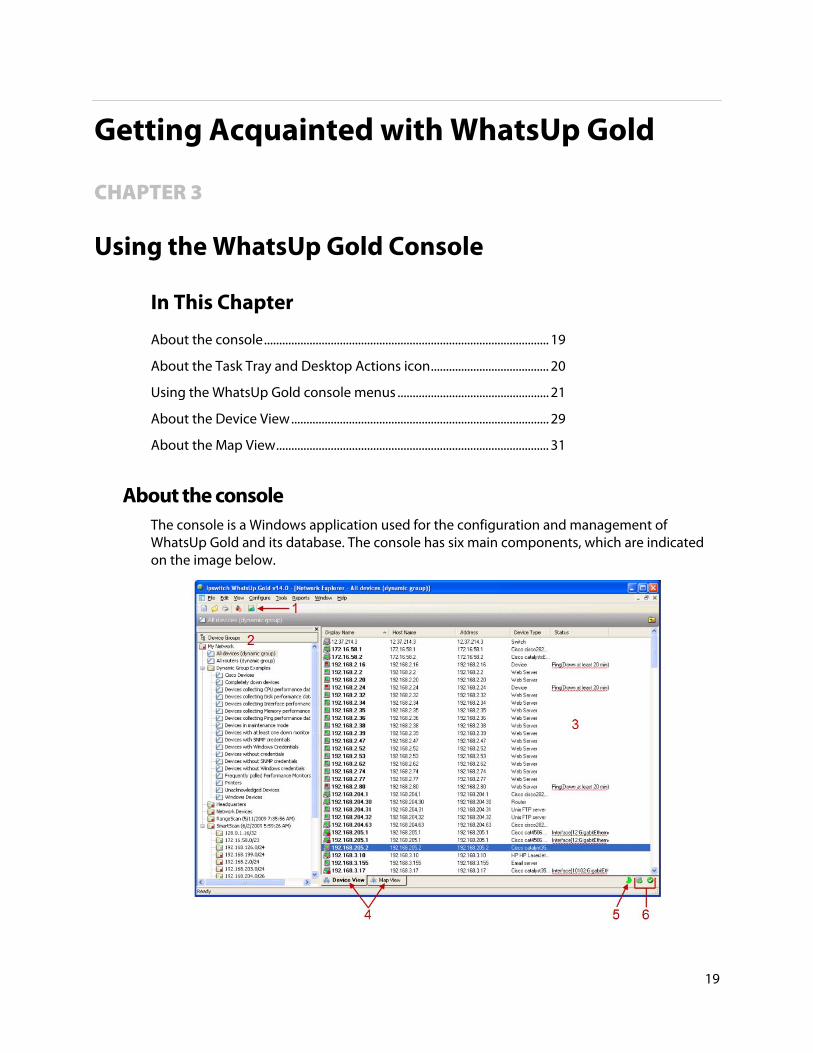
About the console The console is a Windows application used for the configuration and management of WhatsUp Gold and its database. The console has six main components, which are indicated on the image below.
Using WhatsUp Gold 14.4
20
1 WhatsUp Gold Toolbar. The icons on this toolbar change according to the view you are currently using. Button functions are identified with mouse-over tooltips. Additional toolbar icons can be enabled for the Map view by selecting View > Toolbars.
2 Device Group Tree. This is a list of all device groups created through WhatsUp Gold. When you perform a discovery scan, WhatsUp Gold creates a top level folder for that scan. All discovered subnetworks are created in subgroups, but can be organized, deleted, or renamed to fit your needs.
3 View pane. This pane displays the selected device group based on the view from the tabs below (Device View or Map View).
4 View selectors. Choose the way you want to view your device groups. Each of these views are explained in detail later in this chapter.
Device View. This view provides an overview of each device and subgroup in a selected device group.
Map View. This view shows a graphical representation of the devices and subgroups in a selected device group.
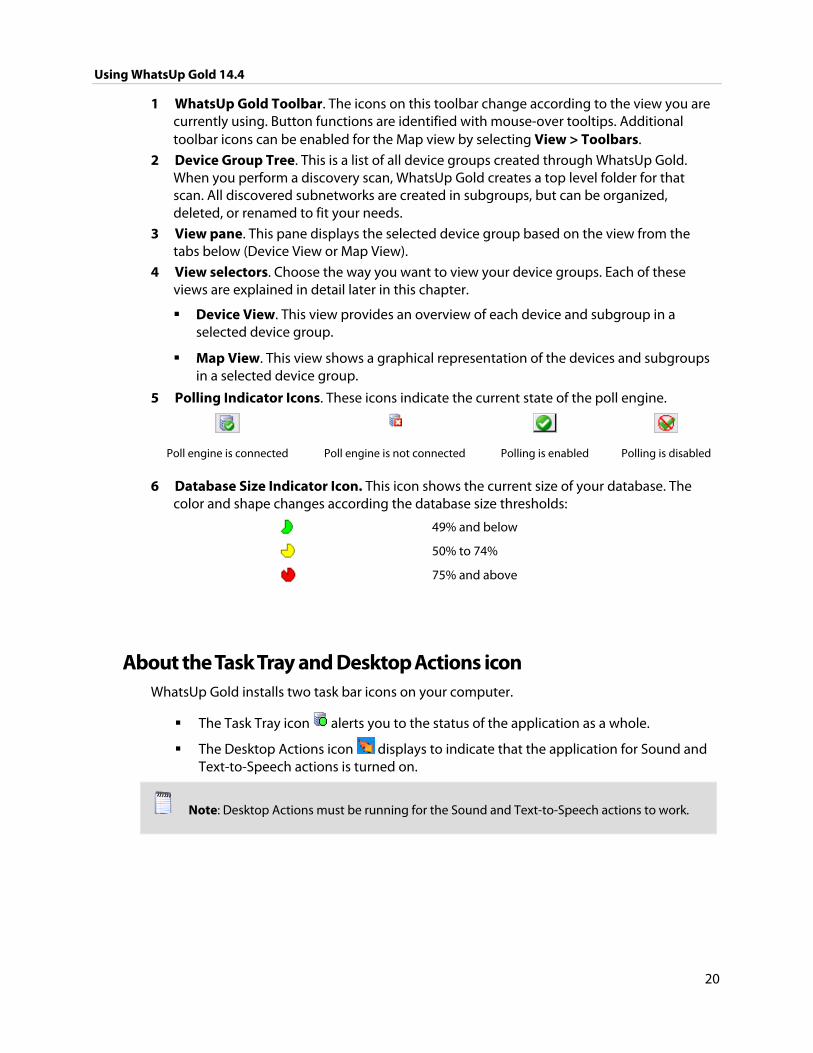
5 Polling Indicator Icons. These icons indicate the current state of the poll engine.
Poll engine is connected Poll engine is not connected Polling is enabled Polling is disabled
6 Database Size Indicator Icon. This icon shows the current size of your database. The color and shape changes according the database size thresholds:
49% and below
50% to 74%
75% and above
About the Task Tray and Desktop Actions icon WhatsUp Gold installs two task bar icons on your computer.
The Task Tray icon alerts you to the status of the application as a whole.
The Desktop Actions icon displays to indicate that the application for Sound and Text-to-Speech actions is turned on.
Note: Desktop Actions must be running for the Sound and Text-to-Speech actions to work.
Using WhatsUp Gold 14.4
21
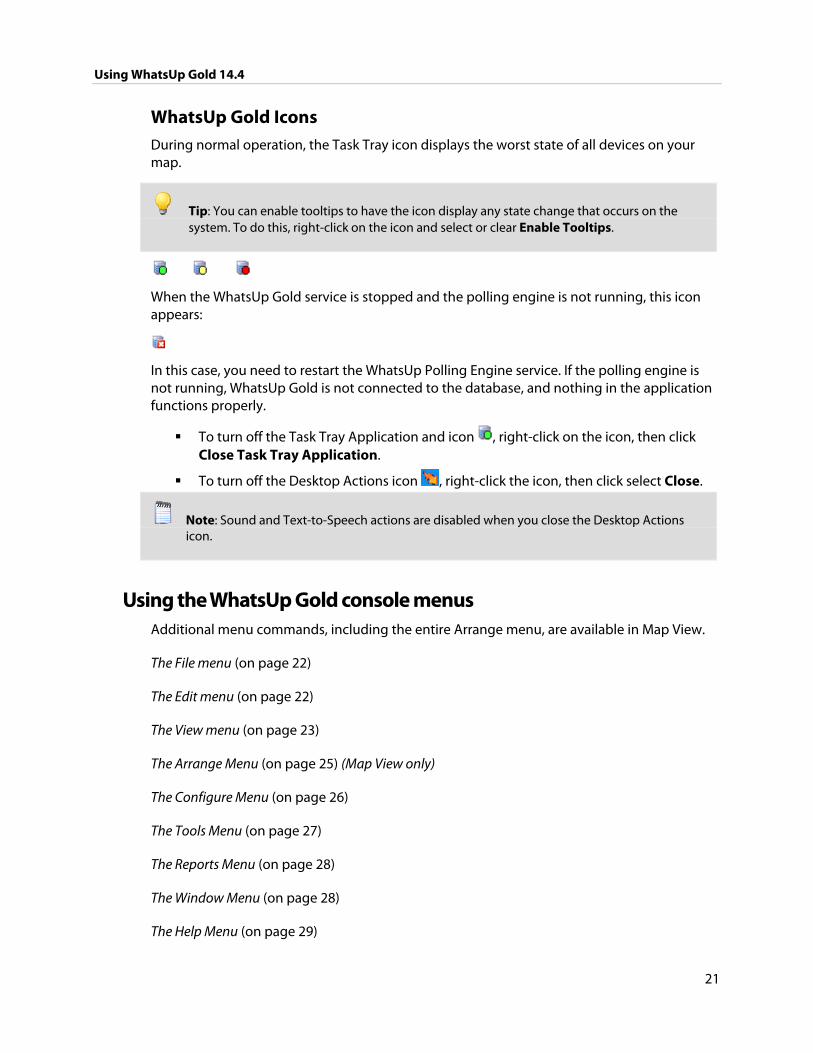
WhatsUp Gold Icons During normal operation, the Task Tray icon displays the worst state of all devices on your map.
Tip: You can enable tooltips to have the icon display any state change that occurs on the system. To do this, right-click on the icon and select or clear Enable Tooltips.
When the WhatsUp Gold service is stopped and the polling engine is not running, this icon appears:
In this case, you need to restart the WhatsUp Polling Engine service. If the polling engine is not running, WhatsUp Gold is not connected to the database, and nothing in the application functions properly.
To turn off the Task Tray Application and icon , right-click on the icon, then click Close Task Tray Application.
To turn off the Desktop Actions icon , right-click the icon, then click select Close.
Note: Sound and Text-to-Speech actions are disabled when you close the Desktop Actions icon.
Using the WhatsUp Gold console menus Additional menu commands, including the entire Arrange menu, are available in Map View.
The File menu (on page 22)
The Edit menu (on page 22)
The View menu (on page 23)
The Arrange Menu (on page 25) (Map View only)
The Configure Menu (on page 26)
The Tools Menu (on page 27)
The Reports Menu (on page 28)
The Window Menu (on page 28)
The Help Menu (on page 29)
Using WhatsUp Gold 14.4
22
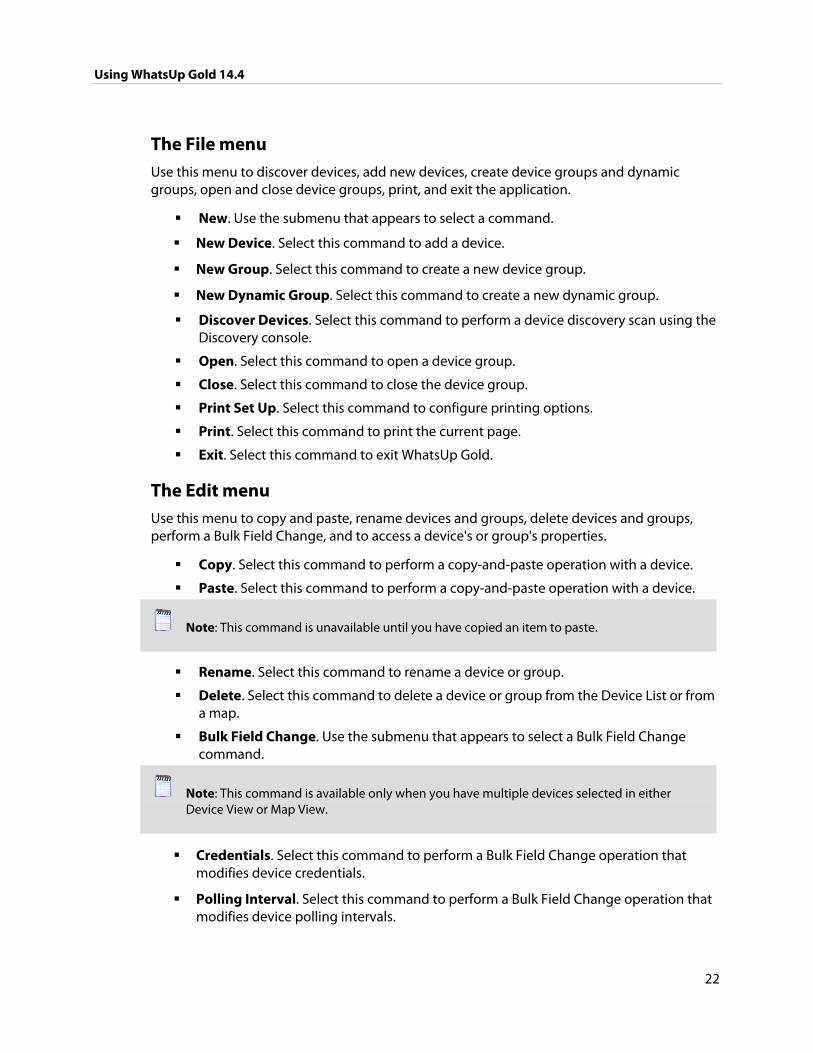
The File menu Use this menu to discover devices, add new devices, create device groups and dynamic groups, open and close device groups, print, and exit the application.
New. Use the submenu that appears to select a command.
New Device. Select this command to add a device.
New Group. Select this command to create a new device group.
New Dynamic Group. Select this command to create a new dynamic group.
Discover Devices. Select this command to perform a device discovery scan using the Discovery console.
Open. Select this command to open a device group.
Close. Select this command to close the device group.
Print Set Up. Select this command to configure printing options.
Print. Select this command to print the current page.
Exit. Select this command to exit WhatsUp Gold.
The Edit menu Use this menu to copy and paste, rename devices and groups, delete devices and groups, perform a Bulk Field Change, and to access a device's or group's properties.
Copy. Select this command to perform a copy-and-paste operation with a device.
Paste. Select this command to perform a copy-and-paste operation with a device.
Note: This command is unavailable until you have copied an item to paste.
Rename. Select this command to rename a device or group.
Delete. Select this command to delete a device or group from the Device List or from a map.
Bulk Field Change. Use the submenu that appears to select a Bulk Field Change command.
Note: This command is available only when you have multiple devices selected in either Device View or Map View.
Credentials. Select this command to perform a Bulk Field Change operation that modifies device credentials.
Polling Interval. Select this command to perform a Bulk Field Change operation that modifies device polling intervals.
Using WhatsUp Gold 14.4
23
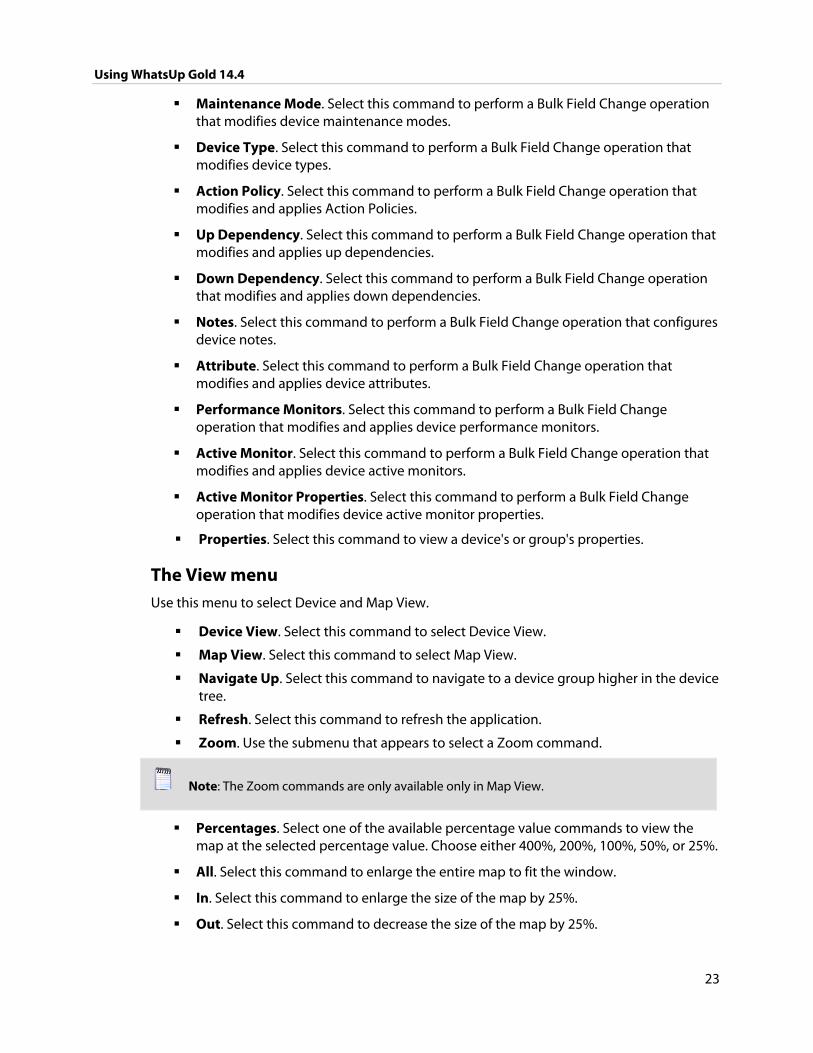
Maintenance Mode. Select this command to perform a Bulk Field Change operation that modifies device maintenance modes.
Device Type. Select this command to perform a Bulk Field Change operation that modifies device types.
Action Policy. Select this command to perform a Bulk Field Change operation that modifies and applies Action Policies.
Up Dependency. Select this command to perform a Bulk Field Change operation that modifies and applies up dependencies.
Down Dependency. Select this command to perform a Bulk Field Change operation that modifies and applies down dependencies.
Notes. Select this command to perform a Bulk Field Change operation that configures device notes.
Attribute. Select this command to perform a Bulk Field Change operation that modifies and applies device attributes.
Performance Monitors. Select this command to perform a Bulk Field Change operation that modifies and applies device performance monitors.
Active Monitor. Select this command to perform a Bulk Field Change operation that modifies and applies device active monitors.
Active Monitor Properties. Select this command to perform a Bulk Field Change operation that modifies device active monitor properties.
Properties. Select this command to view a device's or group's properties.
The View menu Use this menu to select Device and Map View.
Device View. Select this command to select Device View.
Map View. Select this command to select Map View.
Navigate Up. Select this command to navigate to a device group higher in the device tree.
Refresh. Select this command to refresh the application.
Zoom. Use the submenu that appears to select a Zoom command.
Note: The Zoom commands are only available only in Map View.
Percentages. Select one of the available percentage value commands to view the map at the selected percentage value. Choose either 400%, 200%, 100%, 50%, or 25%.
All. Select this command to enlarge the entire map to fit the window.
In. Select this command to enlarge the size of the map by 25%.
Out. Select this command to decrease the size of the map by 25%.
Using WhatsUp Gold 14.4
24
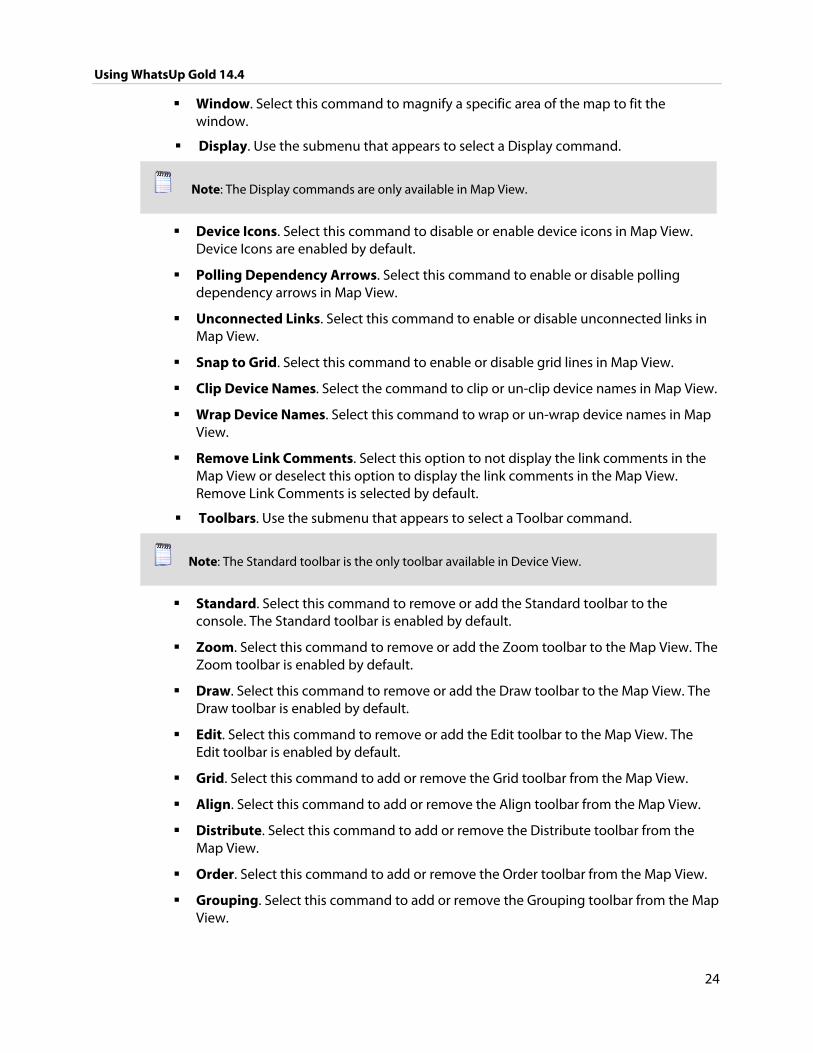
Window. Select this command to magnify a specific area of the map to fit the window.
Display. Use the submenu that appears to select a Display command.
Note: The Display commands are only available in Map View.
Device Icons. Select this command to disable or enable device icons in Map View. Device Icons are enabled by default.
Polling Dependency Arrows. Select this command to enable or disable polling dependency arrows in Map View.
Unconnected Links. Select this command to enable or disable unconnected links in Map View.
Snap to Grid. Select this command to enable or disable grid lines in Map View.
Clip Device Names. Select the command to clip or un-clip device names in Map View.
Wrap Device Names. Select this command to wrap or un-wrap device names in Map View.
Remove Link Comments. Select this option to not display the link comments in the Map View or deselect this option to display the link comments in the Map View. Remove Link Comments is selected by default.
Toolbars. Use the submenu that appears to select a Toolbar command.
Note: The Standard toolbar is the only toolbar available in Device View.
Standard. Select this command to remove or add the Standard toolbar to the console. The Standard toolbar is enabled by default.
Zoom. Select this command to remove or add the Zoom toolbar to the Map View. The Zoom toolbar is enabled by default.
Draw. Select this command to remove or add the Draw toolbar to the Map View. The Draw toolbar is enabled by default.
Edit. Select this command to remove or add the Edit toolbar to the Map View. The Edit toolbar is enabled by default.
Grid. Select this command to add or remove the Grid toolbar from the Map View.
Align. Select this command to add or remove the Align toolbar from the Map View.
Distribute. Select this command to add or remove the Distribute toolbar from the Map View.
Order. Select this command to add or remove the Order toolbar from the Map View.
Grouping. Select this command to add or remove the Grouping toolbar from the Map View.
Using WhatsUp Gold 14.4
25
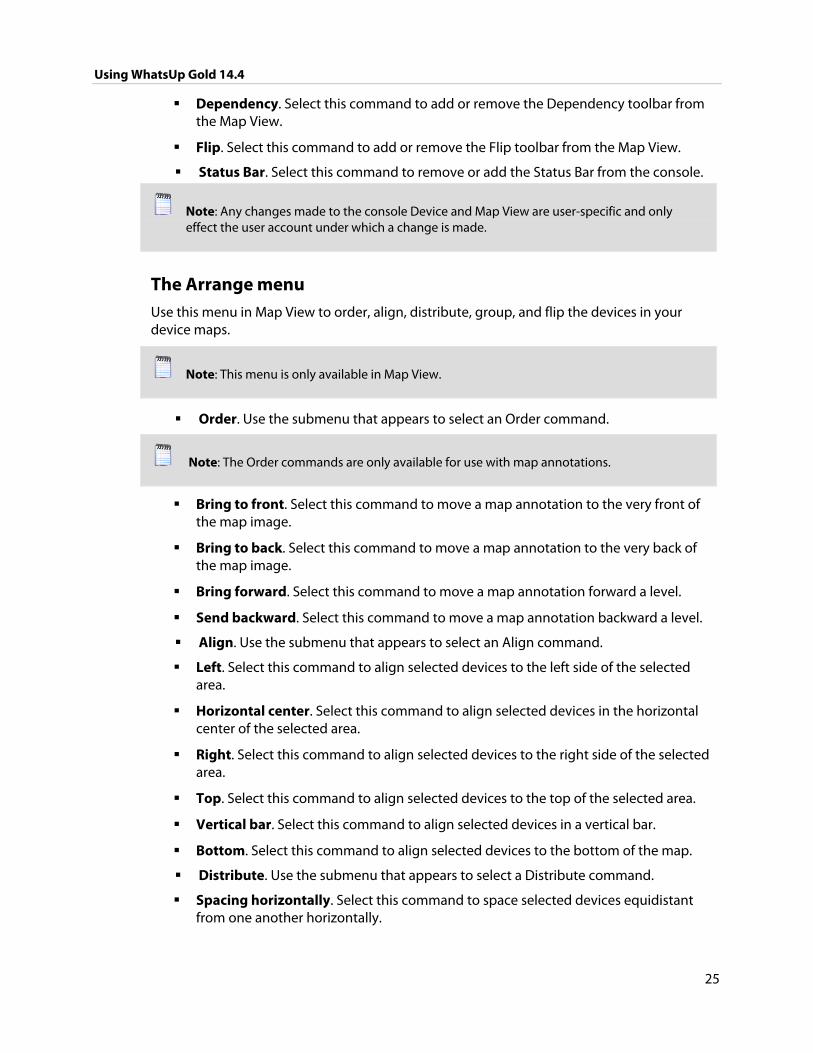
Dependency. Select this command to add or remove the Dependency toolbar from the Map View.
Flip. Select this command to add or remove the Flip toolbar from the Map View.
Status Bar. Select this command to remove or add the Status Bar from the console.
Note: Any changes made to the console Device and Map View are user-specific and only effect the user account under which a change is made.
The Arrange menu Use this menu in Map View to order, align, distribute, group, and flip the devices in your device maps.
Note: This menu is only available in Map View.
Order. Use the submenu that appears to select an Order command.
Note: The Order commands are only available for use with map annotations.
Bring to front. Select this command to move a map annotation to the very front of the map image.
Bring to back. Select this command to move a map annotation to the very back of the map image.
Bring forward. Select this command to move a map annotation forward a level.
Send backward. Select this command to move a map annotation backward a level.
Align. Use the submenu that appears to select an Align command.
Left. Select this command to align selected devices to the left side of the selected area.
Horizontal center. Select this command to align selected devices in the horizontal center of the selected area.
Right. Select this command to align selected devices to the right side of the selected area.
Top. Select this command to align selected devices to the top of the selected area.
Vertical bar. Select this command to align selected devices in a vertical bar.
Bottom. Select this command to align selected devices to the bottom of the map.
Distribute. Use the submenu that appears to select a Distribute command.
Spacing horizontally. Select this command to space selected devices equidistant from one another horizontally.
Using WhatsUp Gold 14.4
26
Spacing vertically. Select this command to space selected devices equidistant from one another vertically.
Center horizontally. Select this command to arrange selected devices around a horizontal axis.
Center vertically. Select this command to arrange selected devices around a vertical axis.
Device icons radially. Select this command to arrange selected devices into a circle.
Device icons in rows. Select this command to arrange selected devices in rows.
Device icons by links. Select this command to arrange selected devices by their links.
Grouping. Use the submenu that appears to select a Grouping command.
Note: The Group commands are only available for use with map annotations.
Group. Select this command to group two or more selected map annotations together.
Ungroup. Select this command to ungroup map annotations.
Flip. Use the submenu that appears to select a Flip command.
Note: The Flip commands are only available for use with map annotations.
Horizontally. Select this command to flip a selected map annotation horizontally.
Vertically. Select this command to flip a selected map annotation vertically.
The Configure menu Use this menu to access the program options, all of the WhatsUp Gold libraries, recurring actions and reports, device types, and global email settings.
Note: The monitors and actions you configure via the Configure menu can be applied to a device from its Properties dialog (Edit > Properties).
Program Options. Select this command to configure the WhatsUp Gold program options.
Performance Monitor Library. Select this menu item to configure performance monitors.
Active Monitor Library. Select this menu item to configure active monitors.
Passive Monitor Library. Select this menu item to configure passive monitors.
Action Library. Select this menu item to configure actions.
Action Policies. Select this menu item to configure action policies.
Using WhatsUp Gold 14.4
27
Device Types. Select this menu item to configure device types.
Note: The functionality of device types has been replaced by device roles (on page 63). The Device Type library is accessible for legacy support only.
Recurring Actions. Select this menu item to configure recurring actions.
Recurring Reports. Select this menu item to configure recurring reports.
Note: The functionality of Recurring Reports...
Credentials. Select this menu item to configure device credentials.
Email Settings. Select the menu item to configure the global email settings.
The Tools menu Use this menu to discover devices, access a desktop remotely, view running actions, perform database utilities, import trap definitions, and to acknowledge devices.
Discover Devices. Select this command to perform a device discovery scan using the New Device Discovery Wizard.
VoIP Configuration Utility. Select this command to run the WhatsUp Gold VoIP Configuration Utility. This command is only available if you have an active VoIP Monitor license.
WhatsConfigured. Select this command to open WhatsConfigured. This command is only available if you have an active WhatsConfigured license.
Failover Console. Select this command to launch the WhatsUp Gold Failover Console. This command is only available if you have an active WhatsUp Gold Failover license.
Welcome Center. Select this command to access the WhatsUp Gold Welcome Center.
Remote Desktop. Select this command to connect to a remote desktop.
Running Actions. Select this command to view any actions that are currently running.
Tip: You can use the Running Actions dialog to cancel running actions.
Database Utilities. Use the submenu that appears to select a Database Utilities command.
Back Up WhatsUp SQL Database. Select this command to make a copy of your WhatsUp Gold SQL database.
Restore WhatsUp SQL Database. Select this command to restore your WhatsUp Gold SQL database with a previous version.
Back Up Flow Monitor SQL Database. Select this command to make a copy of your Flow Monitor SQL database.
Using WhatsUp Gold 14.4
28
Restore Flow Monitor SQL Database. Select this command to restore your Flow Monitor SQL database with a previous version.
Services Manager. Select this command to start the WhatsUp Services Controller. The WhatsUp Services Controller application (NMServiceManager.exe) provides a single user interface to manage all Ipswitch WhatsUp Gold services.
Import Trap Definitions. Select this command to import trap definitions to the Passive Monitor Library using the Trap Definition Import tool.
Acknowledge. Select this command to acknowledge device state changes.
The Reports menu Use this menu to view WhatsUp Gold reports.
All. Select this command to view a list of all WhatsUp Gold reports.
System. Select this command to a view a list of WhatsUp Gold System reports, such as Problem Areas reports with error logs and General reports with activity and action logs.
Group. Select this command to view a list of WhatsUp Gold Group reports, such as group performance reports.
Device. Select this command to view a list of WhatsUp Gold Device reports, such as device performance reports and the Device Status report.
The Window menu Use this menu manage the open windows on your computer desktop, and to enable the WhatsUp Gold Network Explorer.
Close. Select this command to close the current window.
Note: If you only one WhatsUp Gold window is open, you are unable to close the window with this command. To exit the application, select File > Exit.
New Window. Select this command to open a new window containing WhatsUp Gold.
Cascade. Select this command to cascade the open WhatsUp Gold windows on your desktop.
Tile Horizontally. Select this command to tile the open WhatsUp Gold windows on your desktop horizontally.
Tile Vertically. Select this command to tile the open WhatsUp Gold windows on your desktop vertically.
Network Explorer. Select this command to enable or disable the WhatsUp Gold Network Explorer.
Using WhatsUp Gold 14.4
29
The Help menu Use this menu to view the WhatsUp Gold help system, Online Help, and information about your licensed version of the product.
Help Topics. Select to view the WhatsUp Gold help system.
Online Help. Select to view the most recent WhatsUp Gold online help content.
About WhatsUp. Select to view the About WhatsUp Gold dialog that displays your license type, serial number, product edition, the registered user, the number of currently monitored devices, the maximum number of monitored devices your license type allows, and any installed plug-ins.
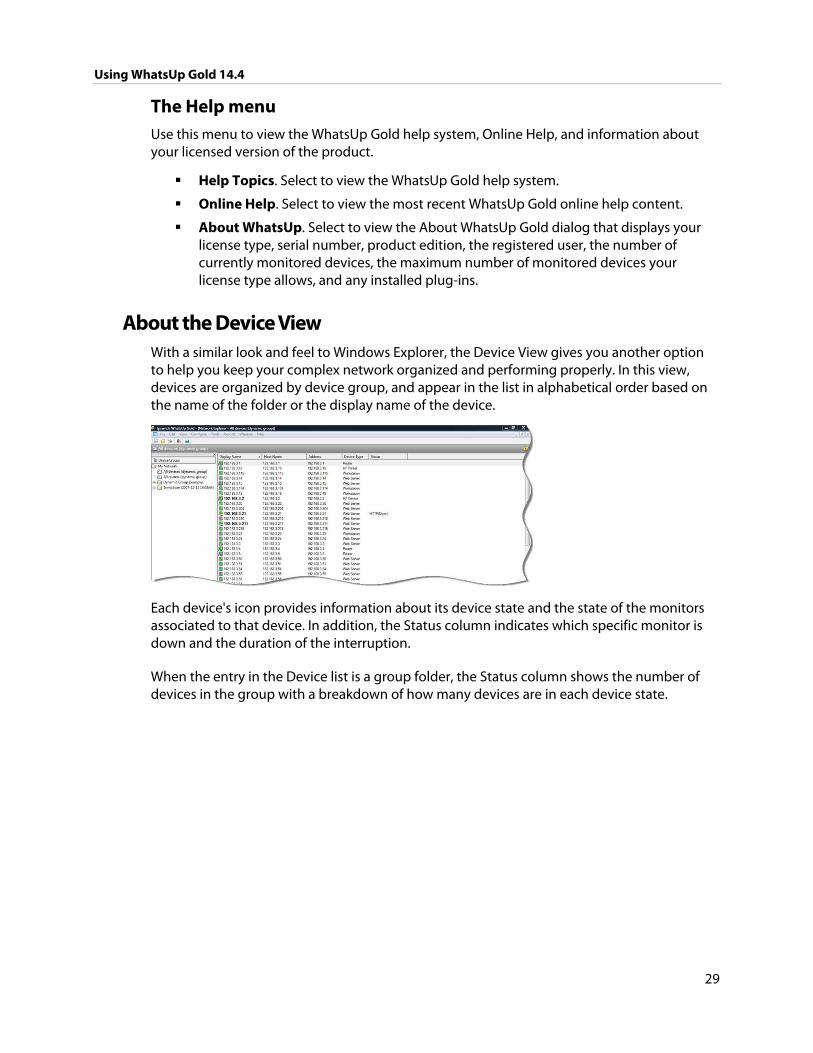
About the Device View With a similar look and feel to Windows Explorer, the Device View gives you another option to help you keep your complex network organized and performing properly. In this view, devices are organized by device group, and appear in the list in alphabetical order based on the name of the folder or the display name of the device.
Each device's icon provides information about its device state and the state of the monitors associated to that device. In addition, the Status column indicates which specific monitor is down and the duration of the interruption.
When the entry in the Device list is a group folder, the Status column shows the number of devices in the group with a breakdown of how many devices are in each device state.
Using WhatsUp Gold 14.4
30
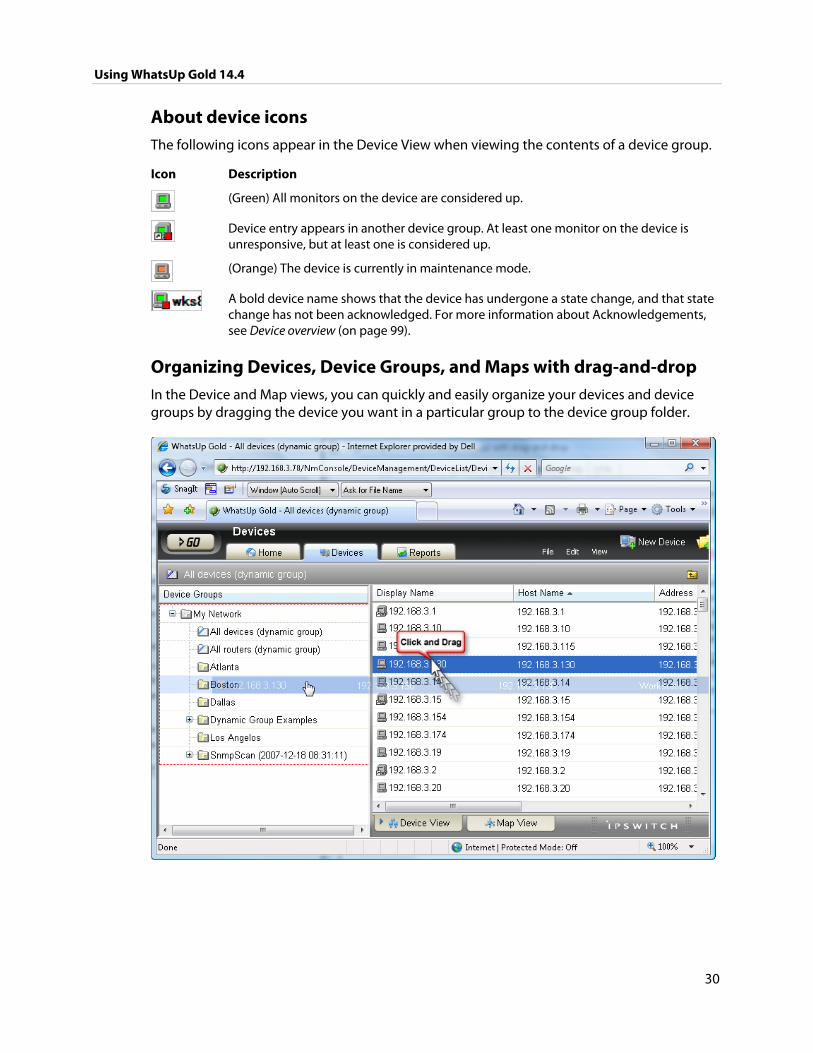
About device icons The following icons appear in the Device View when viewing the contents of a device group.
Icon Description
(Green) All monitors on the device are considered up.
Device entry appears in another device group. At least one monitor on the device is unresponsive, but at least one is considered up.
(Orange) The device is currently in maintenance mode.
A bold device name shows that the device has undergone a state change, and that state change has not been acknowledged. For more information about Acknowledgements, see Device overview (on page 99).
Organizing Devices, Device Groups, and Maps with drag-and-drop In the Device and Map views, you can quickly and easily organize your devices and device groups by dragging the device you want in a particular group to the device group folder.
Using WhatsUp Gold 14.4
31
After you drop the icon or icons, a menu appears, asking if you want to move or copy the devices. If you move the devices, they are deleted from the previous device group. If you copy the devices, the devices appear in both device groups.
Note: When you copy a device using drag-and-drop, a shortcut is created in the new location. Even though a device exists in multiple locations, it only exists once in the database. Therefore, to modify a device, you can change the settings by opening the device properties from any group in which the device appears, and the change is reflected in all other instances of the device. This also means that each device is only polled once, no matter how many times it appears in your device group tree.
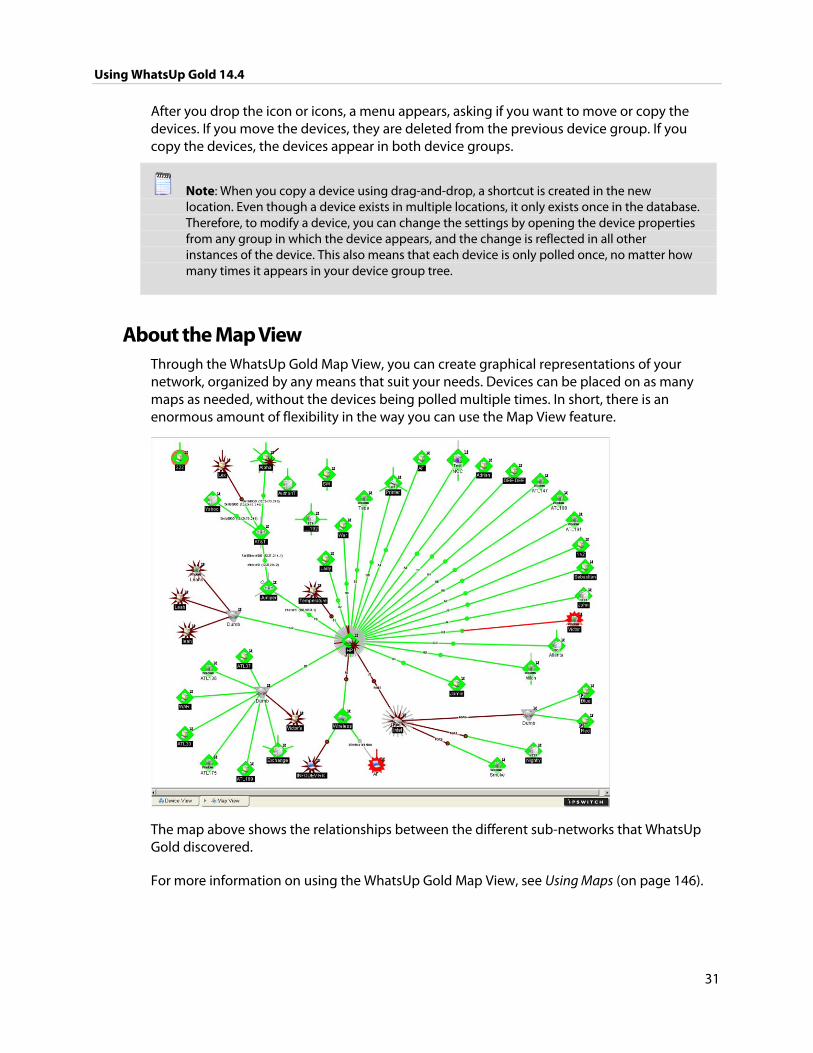
About the Map View Through the WhatsUp Gold Map View, you can create graphical representations of your network, organized by any means that suit your needs. Devices can be placed on as many maps as needed, without the devices being polled multiple times. In short, there is an enormous amount of flexibility in the way you can use the Map View feature.
The map above shows the relationships between the different sub-networks that WhatsUp Gold discovered.
For more information on using the WhatsUp Gold Map View, see Using Maps (on page 146).
32
CHAPTER 4
Using the WhatsUp Gold Web Interface
In This Chapter
Accessing the web interface ........................................................................... 32
About the WhatsUp Gold web interface .................................................... 33
Accessing the web interface You can connect to the WhatsUp Gold web interface from any supported browser by entering its web address. This web address consists of the hostname of the WhatsUp Gold host and the web server port number. The default port number is 80.
For example, if your WhatsUp Gold host is named monitor1.ipswitch.com, then the web address will be: http://monitor1.ipswitch.com:80.
Note: When you use the default port number (80), you do not have to include the port number in the address.
There are two default users on the Web server:
Account type Username Password
Administrator admin admin
Guest guest <password left blank>
Note: The WhatsUp Gold web interface Administrator account password can be changed in the installation wizard during the WhatsUp Gold installation process.
You have the option to enable the web server during installation. You also can enable/disable the web server in the WhatsUp Gold console (Configure > Program Options > Web Server), then Select Enable web server on port.
Note: Microsoft Internet Information Services (IIS) is also as the web server for WhatsUp Gold. For more information, see the Configuring the web server section of the Installing and Configuring WhatsUp Gold (http://www.whatsupgold.com/wugiis_144) guide.
Using WhatsUp Gold 14.4
33
About the WhatsUp Gold web interface The web interface allows you to view and modify almost all aspects of WhatsUp Gold using a web browser. From the web interface, you can add devices, view or modify device groups, view device maps, and access reports about your devices.
The web interface includes two features that are not available through the console:
In WhatsUp Gold Premium, Distributed, and MSP Editions, Split Second Graphs display up-to-the-second information on SNMP and WMI performance counters for the devices on your network. Split Second Graphs can be viewed on the WhatsUp Gold Web Performance Monitor, the Web Task Manager, device and group performance reports, and several workspace reports.
Full and workspace reports are only available through the web interface. From the console, you can launch a web browser to view reports in the web interface, but you cannot view the reports directly in the console.
There are also some features that are available in the console but are not available through the web interface:
Advanced mapping features, such as annotations, link lines, and automatic arrangement of device icons are not available in the web interface.
Device discovery is not available in the web interface, but you can add specific devices by IP address.
The web interface is organized into four main sections: the GO menu, the Home tab, the Devices tab, and the Reports tab.
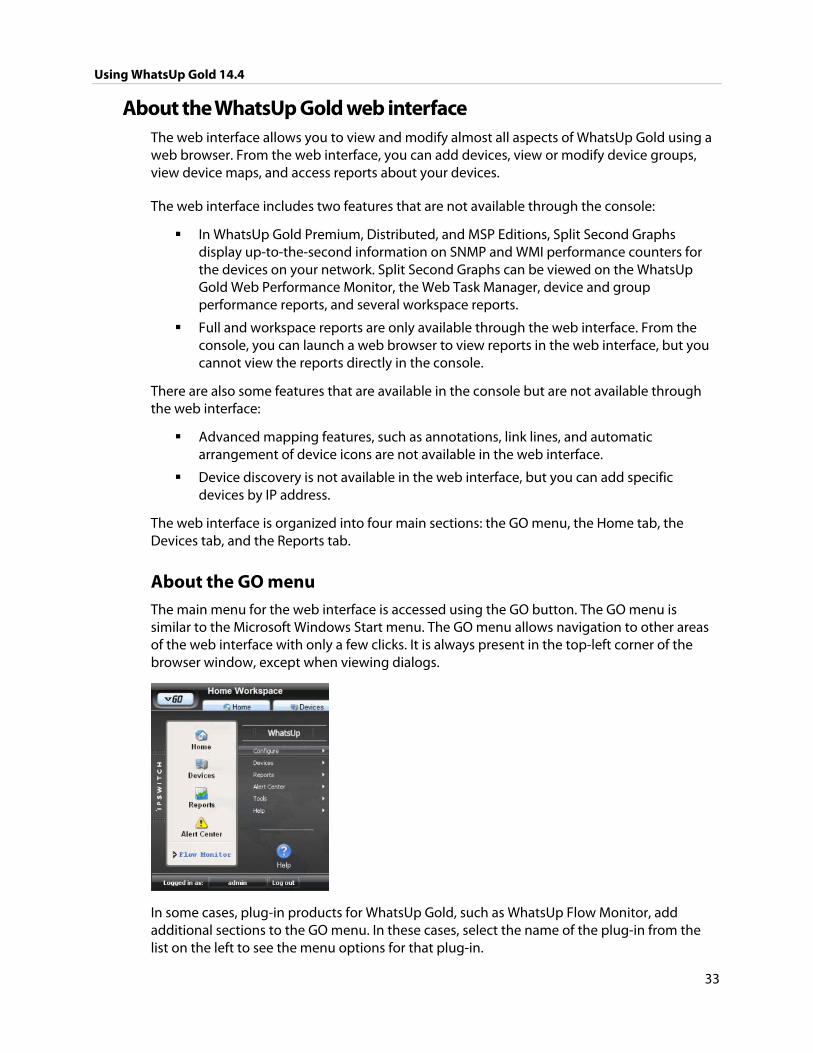
About the GO menu The main menu for the web interface is accessed using the GO button. The GO menu is similar to the Microsoft Windows Start menu. The GO menu allows navigation to other areas of the web interface with only a few clicks. It is always present in the top-left corner of the browser window, except when viewing dialogs.
In some cases, plug-in products for WhatsUp Gold, such as WhatsUp Flow Monitor, add additional sections to the GO menu. In these cases, select the name of the plug-in from the list on the left to see the menu options for that plug-in.
Using WhatsUp Gold 14.4
34
About the Home tab The Home Workspace is the first screen you see after logging in to the web interface. The Home Workspace is your customizable home page. It displays important information about the health of monitored servers and network devices in a way that can be tailored to your specific needs. The Home page comes pre-packaged with five preconfigured workspace views:
Getting Started
Active Management
Passive Management
Performance Managemant
Distributed Overview*
*The Distributed Overview workspace view only exists if you have a license for WhatsUp Gold Distributed Edition.
Each of these views contains four to six workspace reports related to the title's view.
In addition to these pre-configured views, you have the opportunity to create your own workspace views.
For more information on your Home Workspace, see Customizing workspace views (on page 407).
The Workspace Toolbar Add Content. Use this button to add workspace reports to your workspace views.
Workspace View. Use this drop-down menu to edit your workspace views and to switch between workspace views.
Help. Use this button to view the WhatsUp Gold Help for the window you are currently viewing.
About the Devices tab The Devices tab is used to view and manage the lists of devices you have added to WhatsUp Gold. The Devices tab has two modes:
Device View shows a list of devices and groups formatted like a table.
Map View shows the map that you configured for the current device group in the console.
You can add devices in either mode by using the Devices Menu or the Devices Toolbar located along the top edge of your browser.
Using WhatsUp Gold 14.4
35
The Devices Menu bar File. Use this section of the menu to add new devices, device groups, and dynamic
groups.
Edit. Use this section of the menu to copy, move, edit, and delete devices and device groups. You can also access Device Status and Device Properties from this section.
View. Use this section to switch between Device and Map views, to navigate to device groups, and to refresh the screen.
The Devices Toolbar New Device. Use this button to add a new device to your list of monitored devices.
New Group. Use this button to add a new device group to your list of monitored devices.
New Dynamic Group. Use this button to add a new dynamic group to your list of monitored devices.
The Right-Click Menu You can also manage groups using the right-click menu, which includes quick links to many common tasks, tools, and reports.
Drag and Drop Just like in the console and most Windows applications, you can use your mouse to organize devices and groups using drag and drop in the web interface. You can drag devices from the device view or map view into device groups in the device groups list, in the list of devices and groups contained in the current group, or on a map.
Using WhatsUp Gold 14.4
36
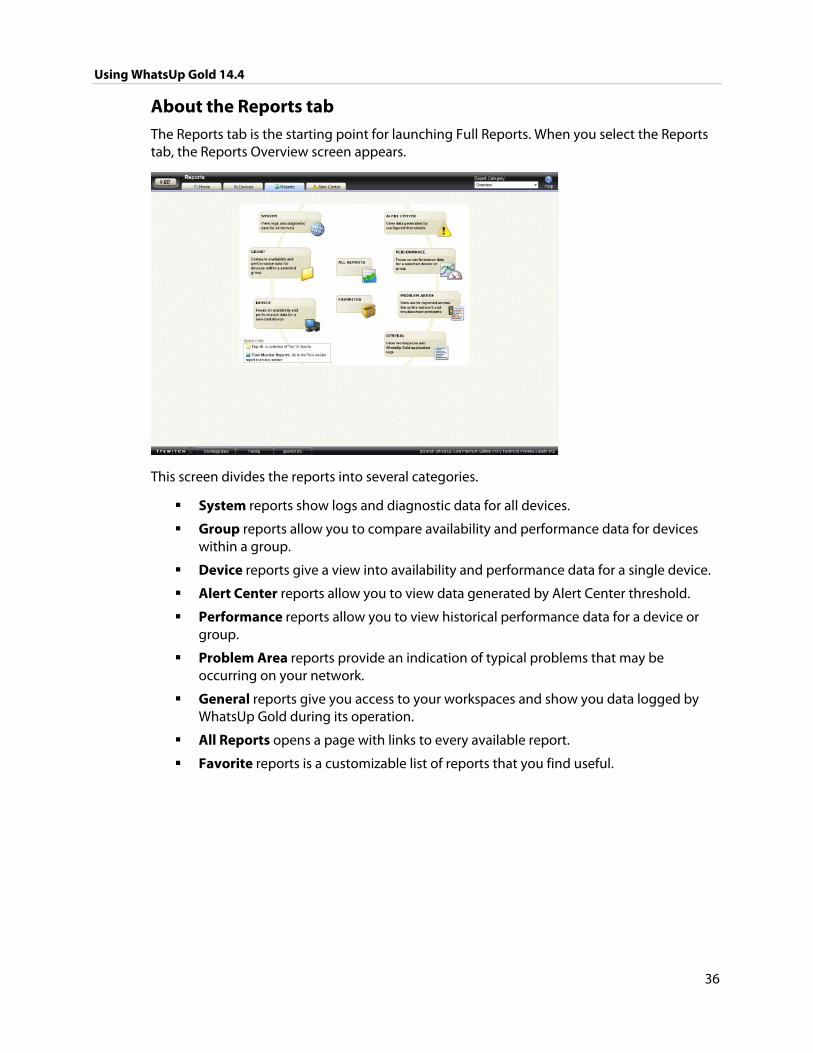
About the Reports tab The Reports tab is the starting point for launching Full Reports. When you select the Reports tab, the Reports Overview screen appears.
This screen divides the reports into several categories.
System reports show logs and diagnostic data for all devices.
Group reports allow you to compare availability and performance data for devices within a group.
Device reports give a view into availability and performance data for a single device.
Alert Center reports allow you to view data generated by Alert Center threshold.
Performance reports allow you to view historical performance data for a device or group.
Problem Area reports provide an indication of typical problems that may be occurring on your network.
General reports give you access to your workspaces and show you data logged by WhatsUp Gold during its operation.
All Reports opens a page with links to every available report.
Favorite reports is a customizable list of reports that you find useful.
Using WhatsUp Gold 14.4
37
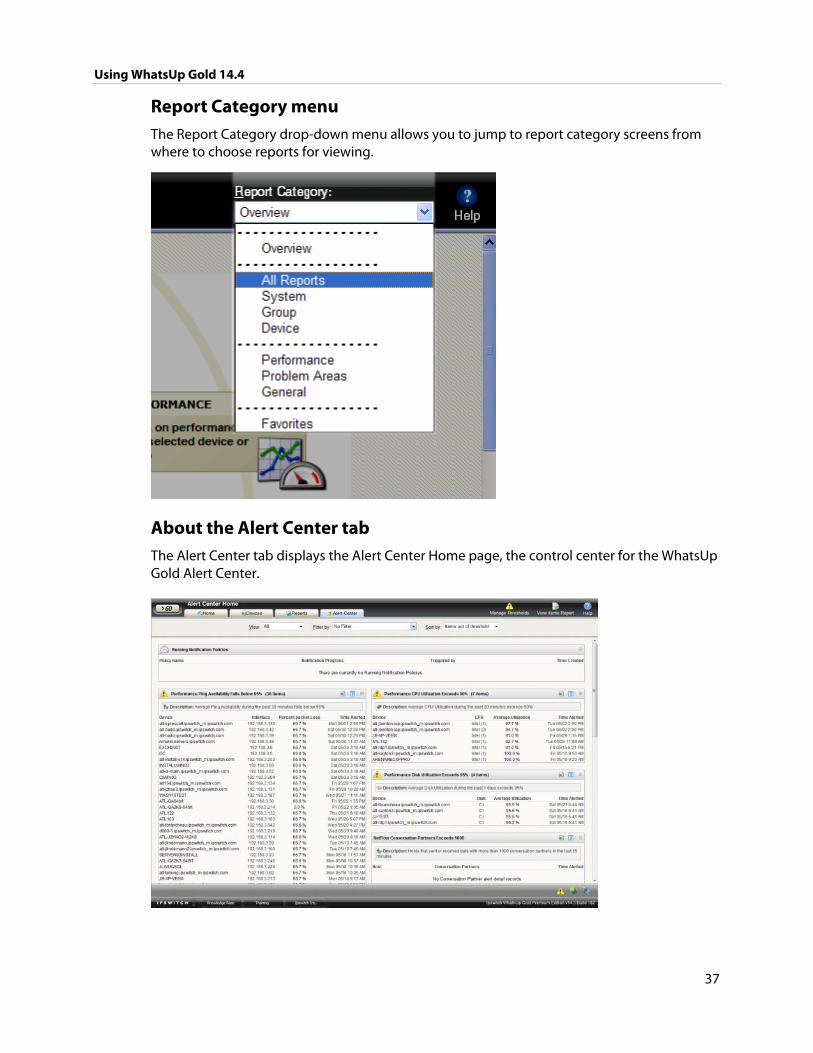
Report Category menu The Report Category drop-down menu allows you to jump to report category screens from where to choose reports for viewing.
About the Alert Center tab The Alert Center tab displays the Alert Center Home page, the control center for the WhatsUp Gold Alert Center.
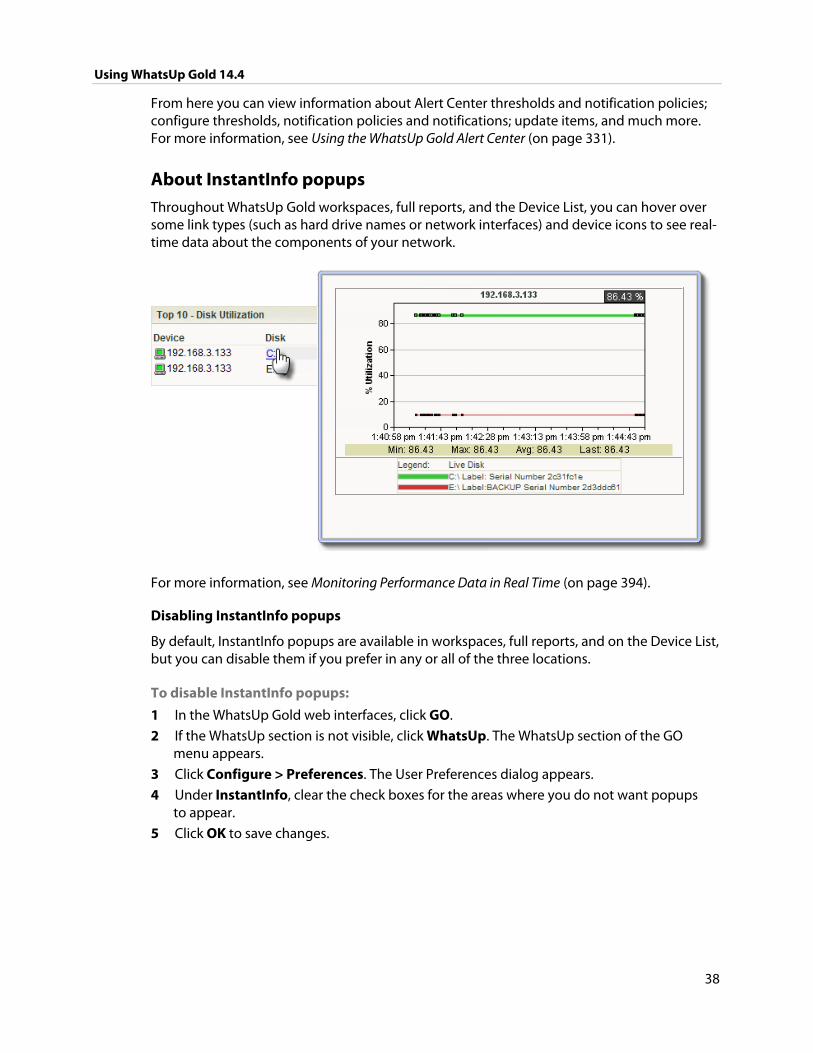
Using WhatsUp Gold 14.4
38
From here you can view information about Alert Center thresholds and notification policies; configure thresholds, notification policies and notifications; update items, and much more. For more information, see Using the WhatsUp Gold Alert Center (on page 331).
About InstantInfo popups Throughout WhatsUp Gold workspaces, full reports, and the Device List, you can hover over some link types (such as hard drive names or network interfaces) and device icons to see real-time data about the components of your network.
For more information, see Monitoring Performance Data in Real Time (on page 394).
Disabling InstantInfo popups
By default, InstantInfo popups are available in workspaces, full reports, and on the Device List, but you can disable them if you prefer in any or all of the three locations.
To disable InstantInfo popups:
1 In the WhatsUp Gold web interfaces, click GO.
2 If the WhatsUp section is not visible, click WhatsUp. The WhatsUp section of the GO menu appears.
3 Click Configure > Preferences. The User Preferences dialog appears.
4 Under InstantInfo, clear the check boxes for the areas where you do not want popups to appear.
5 Click OK to save changes.
39
CHAPTER 5
Using WhatsUp Gold Mobile Access
In This Chapter
About WhatsUp Gold Mobile Access ........................................................... 39
Managing WhatsUp Gold Mobile Access ................................................... 39
Accessing WhatsUp Gold from a mobile device ..................................... 40
Navigating and using the WhatsUp Gold Mobile Access home screen 43
About WhatsUp Gold Mobile Access WhatsUp Gold provides mobile access to the WhatsUp Gold network management application. Now you can conveniently view your network's status from a mobile device at anytime. This new WhatsUp Gold feature ensures that you are informed about network issues so that you can maintain critical network performance.
Mobile Access supported browsers Because WhatsUp Gold Mobile Access does not depend on JavaScript to function, most mobile web browsers support it. However, a JavaScript enabled browser enhances the WhatsUp Gold look and navigation.
Note: Cookies are required for the standard web session to function.
Browsers supported to access the WhatsUp Gold mobile interface
Mobile Safari 2.2
Microsoft Internet Explorer Mobile 6.1
Opera Mini 4.2
Tip: You may need to adjust your browser's viewing options to optimize for your device's browser.
Using WhatsUp Gold 14.4
40
Managing WhatsUp Gold Mobile Access The WhatsUp Gold Mobile Access feature is enabled by default and the WhatsUp Gold Admin user rights are selected by default. You can provide access to other WhatsUp Gold users in the user rights options of the Edit User dialog. Use the following configuration options to manage Mobile Access.
To enable or disable WhatsUp Gold Mobile Access (globally) in the Manage Web Server configuration options:
1 Go to the Manage Web Server dialog.
From the web interface, click GO. The GO menu appears.
If the WhatsUp section is not visible, click WhatsUp. The WhatsUp section of the GO menu appears.
2 Select Configure > Manage Web Server. The Manage Web Server dialog appears.
3 Select the Enable Mobile Access option.
To enable or disable WhatsUp Gold Mobile Access users in the Manage Users configuration options:
1 Go to the Manage Users dialog.
From the web interface, click GO. The GO menu appears.
If the WhatsUp section is not visible, click WhatsUp. The WhatsUp section of the GO menu appears.
2 Select Configure > Manage Users. The Manage Users dialog appears.
3 Select a user that you want to give rights to access to WhatsUp Gold mobile features, then click Edit. The Edit User dialog appears.
4 Under User Rights in the General options, click Mobile Access to enable the option.
Accessing WhatsUp Gold from a mobile device You can access the WhatsUp Gold mobile interface from any supported mobile device browser. Enter the WhatsUp Gold web address which includes the hostname of the WhatsUp Gold host, the web server port number, followed by /NmConsole/Mobile/Start. The default port number is 80.
For example, if your WhatsUp Gold host is named monitor1.ipswitch.com, then the web address will be: http://monitor1.ipswitch.com:80/NmConsole/Mobile/Start/.
Note: When you use the default port number (80), you do not have to include the port number in the address.
Note: If you want WhatsUp Gold Mobile Access to be accessible via the Internet (for example, via mobile phones using EDGE or 3G), then make sure it is available on a server with a public IP.
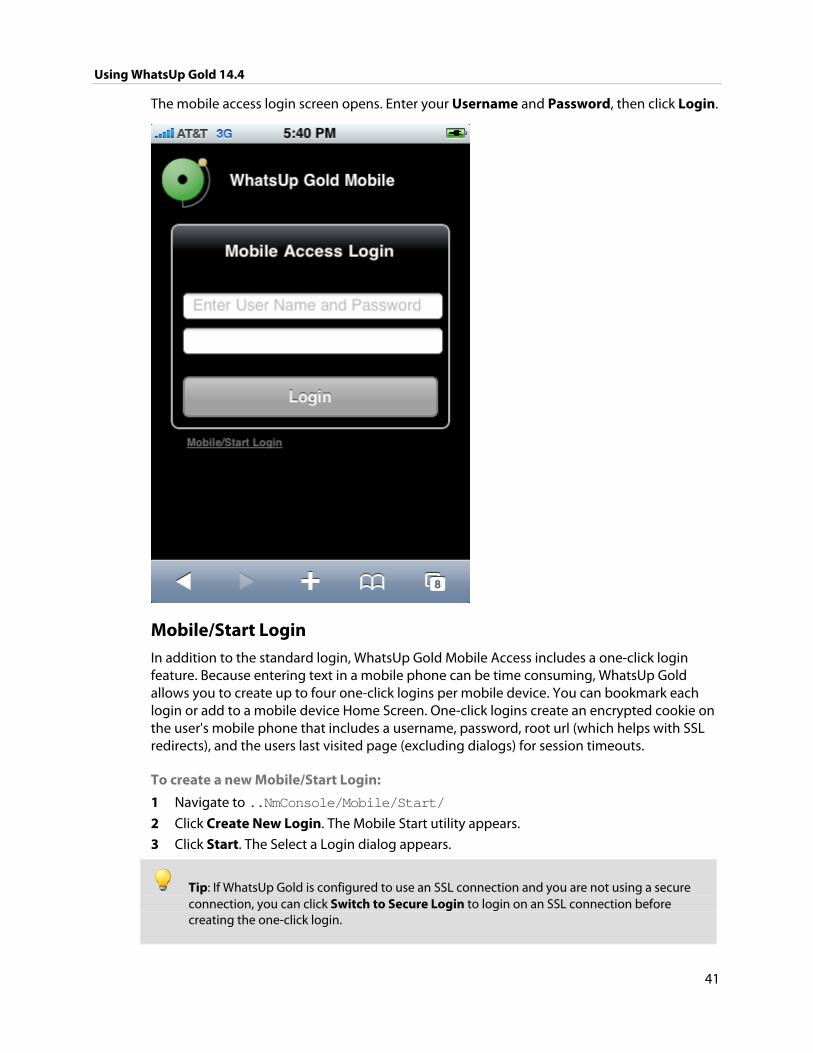
Using WhatsUp Gold 14.4
41
The mobile access login screen opens. Enter your Username and Password, then click Login.
Mobile/Start Login In addition to the standard login, WhatsUp Gold Mobile Access includes a one-click login feature. Because entering text in a mobile phone can be time consuming, WhatsUp Gold allows you to create up to four one-click logins per mobile device. You can bookmark each login or add to a mobile device Home Screen. One-click logins create an encrypted cookie on the user's mobile phone that includes a username, password, root url (which helps with SSL redirects), and the users last visited page (excluding dialogs) for session timeouts.
To create a new Mobile/Start Login:
1 Navigate to ..NmConsole/Mobile/Start/
2 Click Create New Login. The Mobile Start utility appears.
3 Click Start. The Select a Login dialog appears.
Tip: If WhatsUp Gold is configured to use an SSL connection and you are not using a secure connection, you can click Switch to Secure Login to login on an SSL connection before creating the one-click login.
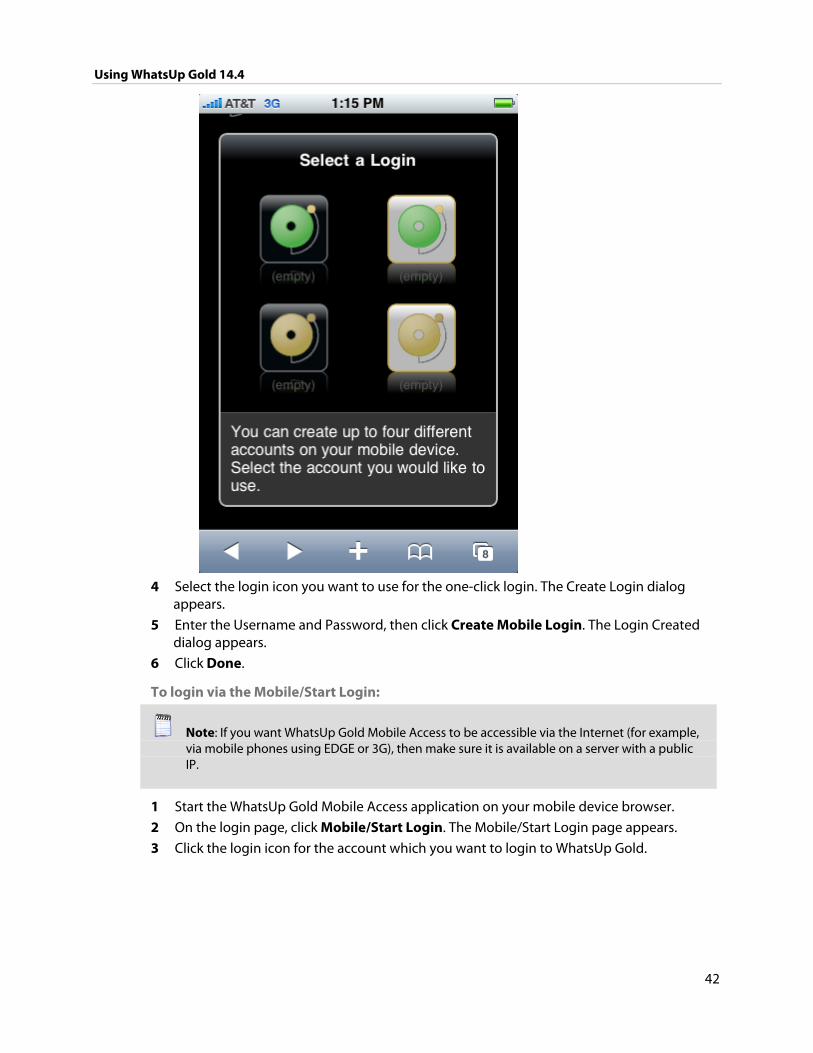
Using WhatsUp Gold 14.4
42
4 Select the login icon you want to use for the one-click login. The Create Login dialog
appears.
5 Enter the Username and Password, then click Create Mobile Login. The Login Created dialog appears.
6 Click Done.
To login via the Mobile/Start Login:
Note: If you want WhatsUp Gold Mobile Access to be accessible via the Internet (for example, via mobile phones using EDGE or 3G), then make sure it is available on a server with a public IP.
1 Start the WhatsUp Gold Mobile Access application on your mobile device browser.
2 On the login page, click Mobile/Start Login. The Mobile/Start Login page appears.
3 Click the login icon for the account which you want to login to WhatsUp Gold.
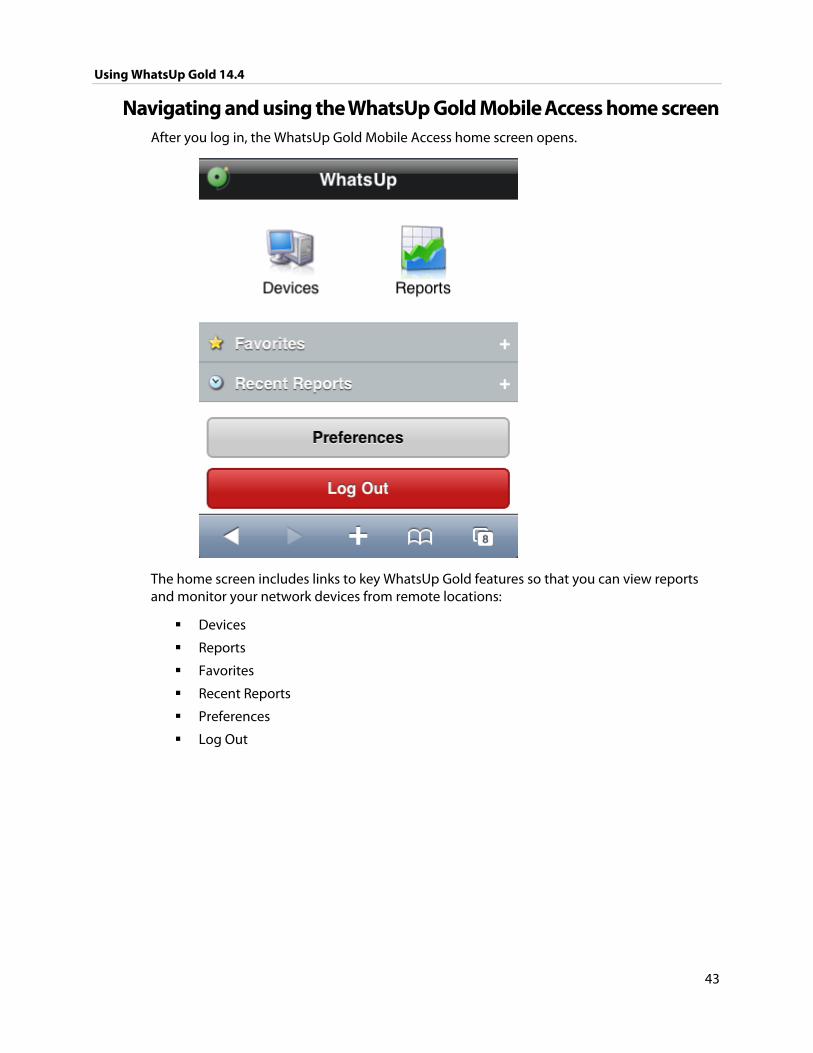
Using WhatsUp Gold 14.4
43
Navigating and using the WhatsUp Gold Mobile Access home screen After you log in, the WhatsUp Gold Mobile Access home screen opens.
The home screen includes links to key WhatsUp Gold features so that you can view reports and monitor your network devices from remote locations:
Devices
Reports
Favorites
Recent Reports
Preferences
Log Out
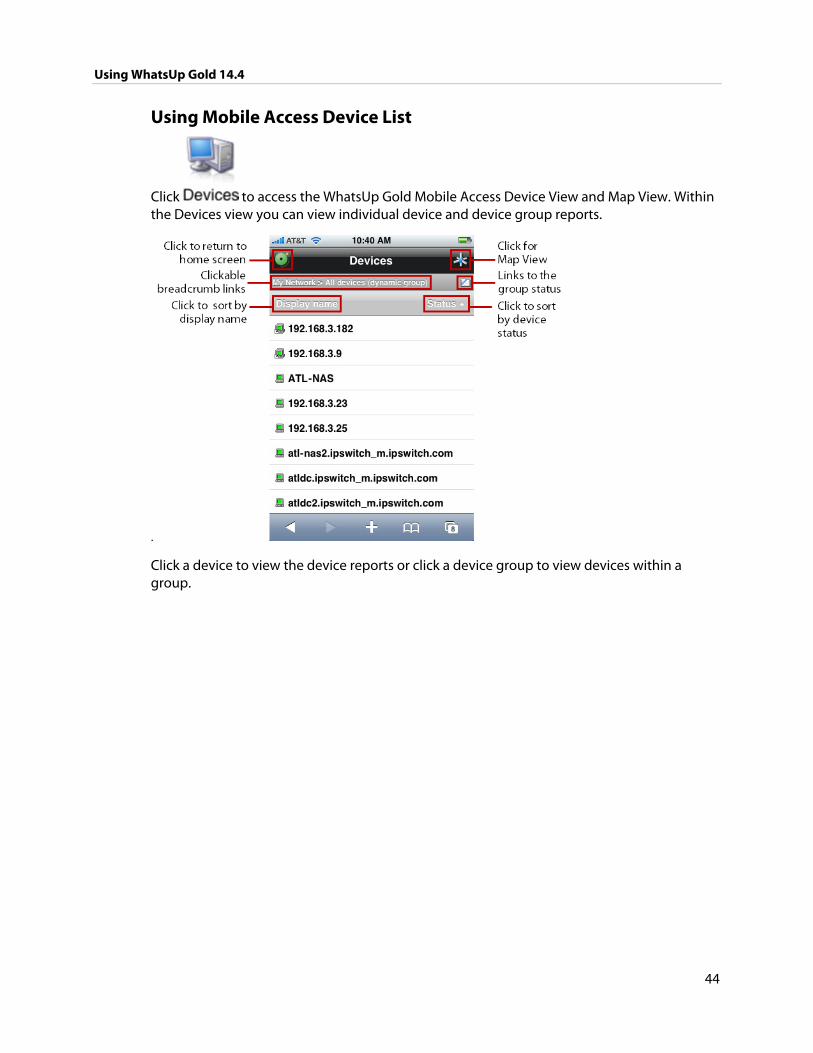
Using WhatsUp Gold 14.4
44
Using Mobile Access Device List
Click to access the WhatsUp Gold Mobile Access Device View and Map View. Within the Devices view you can view individual device and device group reports.
.
Click a device to view the device reports or click a device group to view devices within a group.
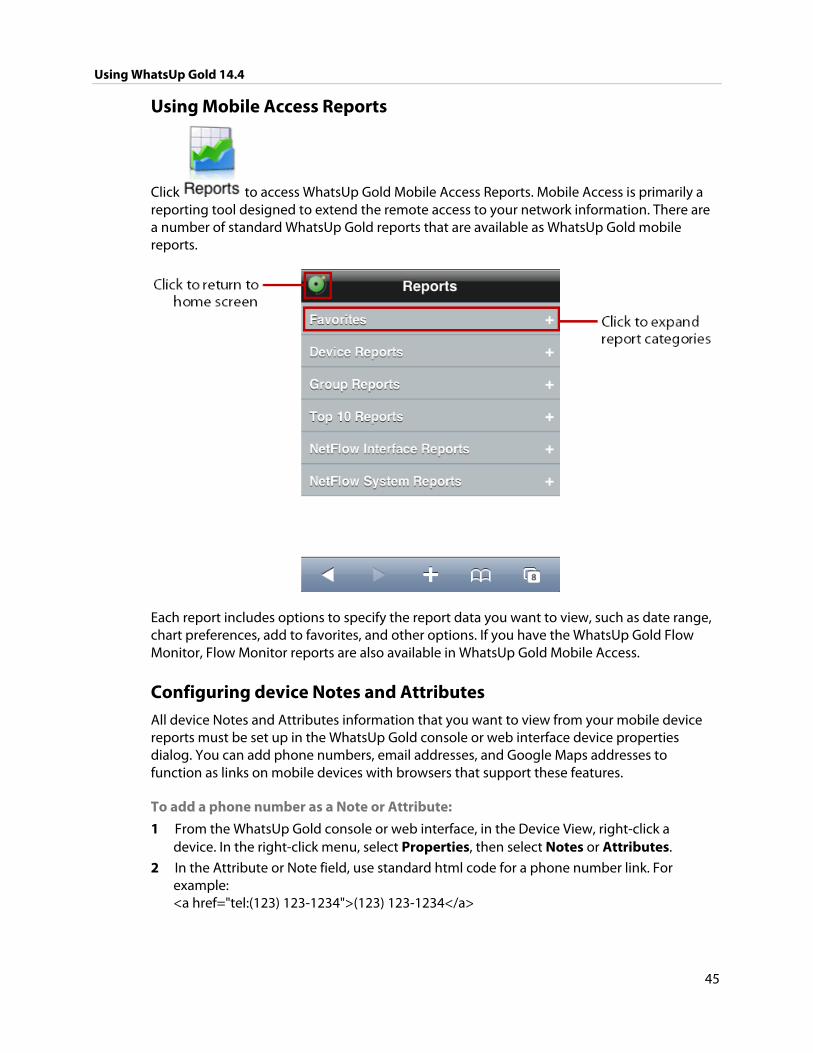
Using WhatsUp Gold 14.4
45
Using Mobile Access Reports
Click to access WhatsUp Gold Mobile Access Reports. Mobile Access is primarily a reporting tool designed to extend the remote access to your network information. There are a number of standard WhatsUp Gold reports that are available as WhatsUp Gold mobile reports.
Each report includes options to specify the report data you want to view, such as date range, chart preferences, add to favorites, and other options. If you have the WhatsUp Gold Flow Monitor, Flow Monitor reports are also available in WhatsUp Gold Mobile Access.
Configuring device Notes and Attributes All device Notes and Attributes information that you want to view from your mobile device reports must be set up in the WhatsUp Gold console or web interface device properties dialog. You can add phone numbers, email addresses, and Google Maps addresses to function as links on mobile devices with browsers that support these features.
To add a phone number as a Note or Attribute:
1 From the WhatsUp Gold console or web interface, in the Device View, right-click a device. In the right-click menu, select Properties, then select Notes or Attributes.
2 In the Attribute or Note field, use standard html code for a phone number link. For example: <a href="tel:(123) 123-1234">(123) 123-1234</a>

Using WhatsUp Gold 14.4
46
To add an email address as a Note or Attribute:
1 From the WhatsUp Gold console or web interface, in the Device View, right-click a device. In the right-click menu, select Properties, then select Notes or Attributes.
2 In the Attribute or Note field, use standard html code for an email link. For example: <a href="mailto:<John Doe> [email protected]">John Doe</a>
To add a Google Map address as a Note or Attribute:
1 From the WhatsUp Gold console or web interface, in the Device View, right-click a device. In the right-click menu, select Properties, then select Notes or Attributes.
2 In the Attribute or Note field, use standard html code for a Google map link. Google map links can be copied from the link field on the address's map view.
Using Mobile Access Favorites WhatsUp Gold Mobile Access Favorites lets you view favorite reports that you mark with the Add to Favorites button at the bottom of each report.
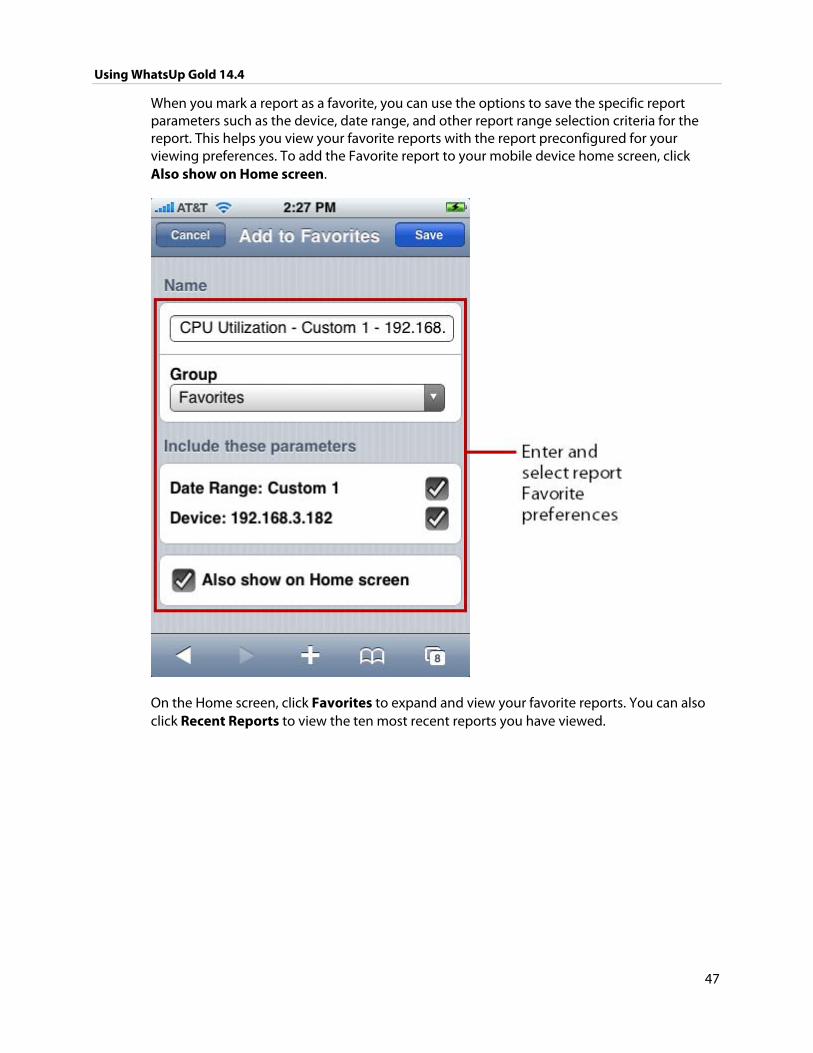
Using WhatsUp Gold 14.4
47
When you mark a report as a favorite, you can use the options to save the specific report parameters such as the device, date range, and other report range selection criteria for the report. This helps you view your favorite reports with the report preconfigured for your viewing preferences. To add the Favorite report to your mobile device home screen, click Also show on Home screen.
On the Home screen, click Favorites to expand and view your favorite reports. You can also click Recent Reports to view the ten most recent reports you have viewed.
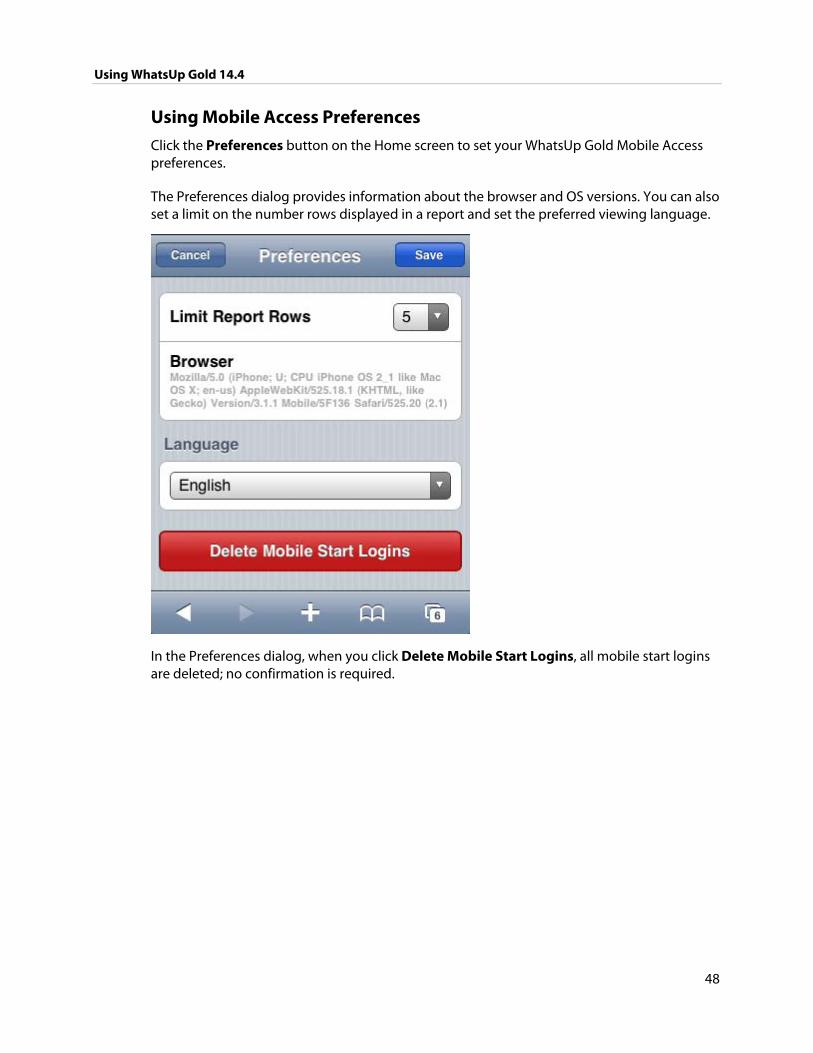
Using WhatsUp Gold 14.4
48
Using Mobile Access Preferences
Click the Preferences button on the Home screen to set your WhatsUp Gold Mobile Access preferences.
The Preferences dialog provides information about the browser and OS versions. You can also set a limit on the number rows displayed in a report and set the preferred viewing language.
In the Preferences dialog, when you click Delete Mobile Start Logins, all mobile start logins are deleted; no confirmation is required.
49
Discovering Network Data
CHAPTER 6
Discovering network devices
In This Chapter
Preparing devices for discovery .................................................................... 49
Preparing WhatsUp Gold for discovery ...................................................... 51
Configuring and running discovery ............................................................. 52
Configuring Scheduled Discovery ................................................................ 60
Adding a single device manually .................................................................. 61
Network discovery is the process WhatsUp Gold uses to identify devices on your network that you may want to monitor. Network discovery scans each device to determine its manufacturer, model, and running software and services. WhatsUp Gold uses this information to automatically assign commonly used monitors to each device.
Before you discover the devices on your network, you need to prepare both your devices and WhatsUp Gold so that devices are discovered properly.
Preparing devices for discovery For In order for WhatsUp Gold to properly discover and identify a device, the device must respond to the protocols that WhatsUp Gold uses during discovery.
Preparing devices to be discovered To discover that a device exists on an IP address, WhatsUp Gold uses the following methods:
Ping (ICMP)
Scanning for open TCP port
If a device does not respond to ping or TCP requests, it cannot be discovered by WhatsUp Gold. We recommend ensuring that all devices respond to at least one of these types of requests.
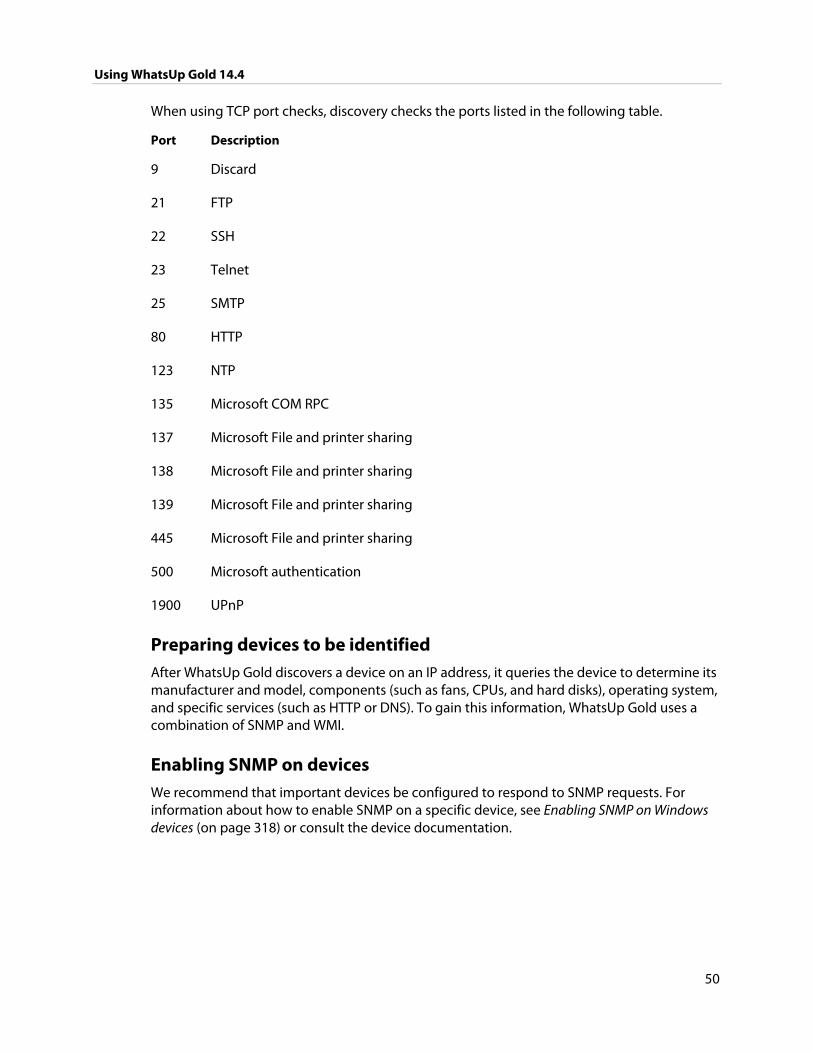
Using WhatsUp Gold 14.4
50
When using TCP port checks, discovery checks the ports listed in the following table.
Port Description
9 Discard
21 FTP
22 SSH
23 Telnet
25 SMTP
80 HTTP
123 NTP
135 Microsoft COM RPC
137 Microsoft File and printer sharing
138 Microsoft File and printer sharing
139 Microsoft File and printer sharing
445 Microsoft File and printer sharing
500 Microsoft authentication
1900 UPnP
Preparing devices to be identified After WhatsUp Gold discovers a device on an IP address, it queries the device to determine its manufacturer and model, components (such as fans, CPUs, and hard disks), operating system, and specific services (such as HTTP or DNS). To gain this information, WhatsUp Gold uses a combination of SNMP and WMI.
Enabling SNMP on devices We recommend that important devices be configured to respond to SNMP requests. For information about how to enable SNMP on a specific device, see Enabling SNMP on Windows devices (on page 318) or consult the device documentation.
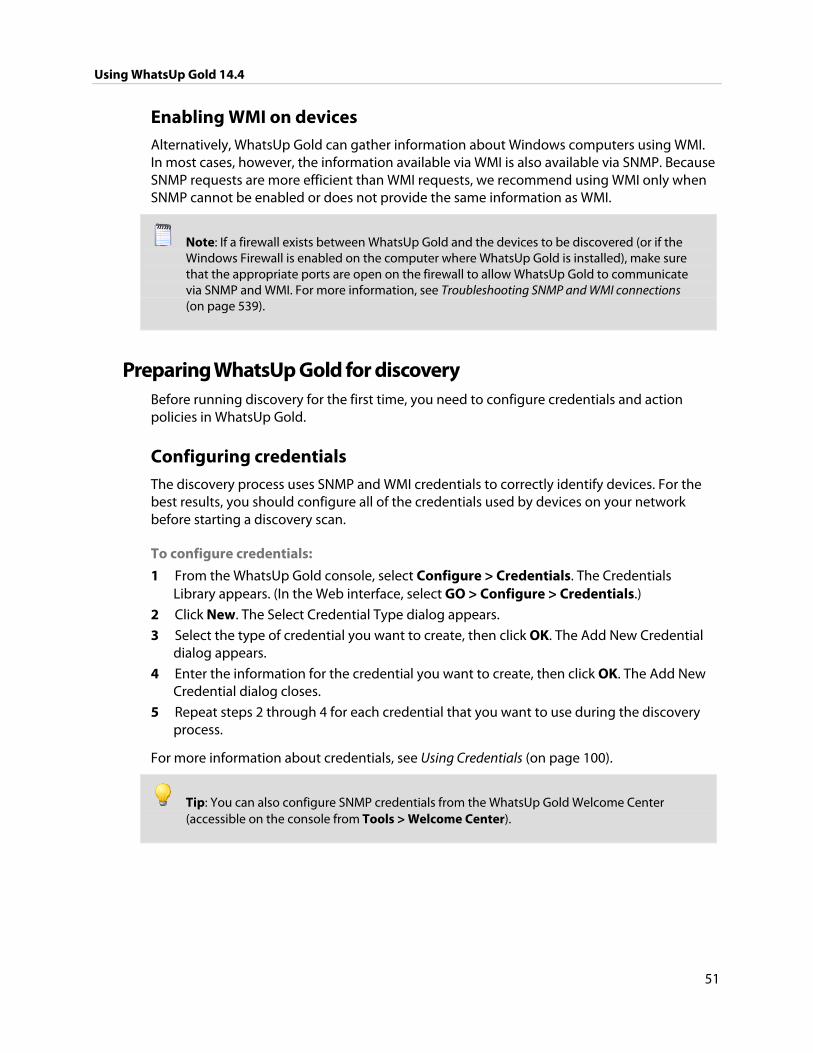
Using WhatsUp Gold 14.4
51
Enabling WMI on devices Alternatively, WhatsUp Gold can gather information about Windows computers using WMI. In most cases, however, the information available via WMI is also available via SNMP. Because SNMP requests are more efficient than WMI requests, we recommend using WMI only when SNMP cannot be enabled or does not provide the same information as WMI.
Note: If a firewall exists between WhatsUp Gold and the devices to be discovered (or if the Windows Firewall is enabled on the computer where WhatsUp Gold is installed), make sure that the appropriate ports are open on the firewall to allow WhatsUp Gold to communicate via SNMP and WMI. For more information, see Troubleshooting SNMP and WMI connections (on page 539).
Preparing WhatsUp Gold for discovery Before running discovery for the first time, you need to configure credentials and action policies in WhatsUp Gold.
Configuring credentials The discovery process uses SNMP and WMI credentials to correctly identify devices. For the best results, you should configure all of the credentials used by devices on your network before starting a discovery scan.
To configure credentials:
1 From the WhatsUp Gold console, select Configure > Credentials. The Credentials Library appears. (In the Web interface, select GO > Configure > Credentials.)
2 Click New. The Select Credential Type dialog appears.
3 Select the type of credential you want to create, then click OK. The Add New Credential dialog appears.
4 Enter the information for the credential you want to create, then click OK. The Add New Credential dialog closes.
5 Repeat steps 2 through 4 for each credential that you want to use during the discovery process.
For more information about credentials, see Using Credentials (on page 100).
Tip: You can also configure SNMP credentials from the WhatsUp Gold Welcome Center (accessible on the console from Tools > Welcome Center).
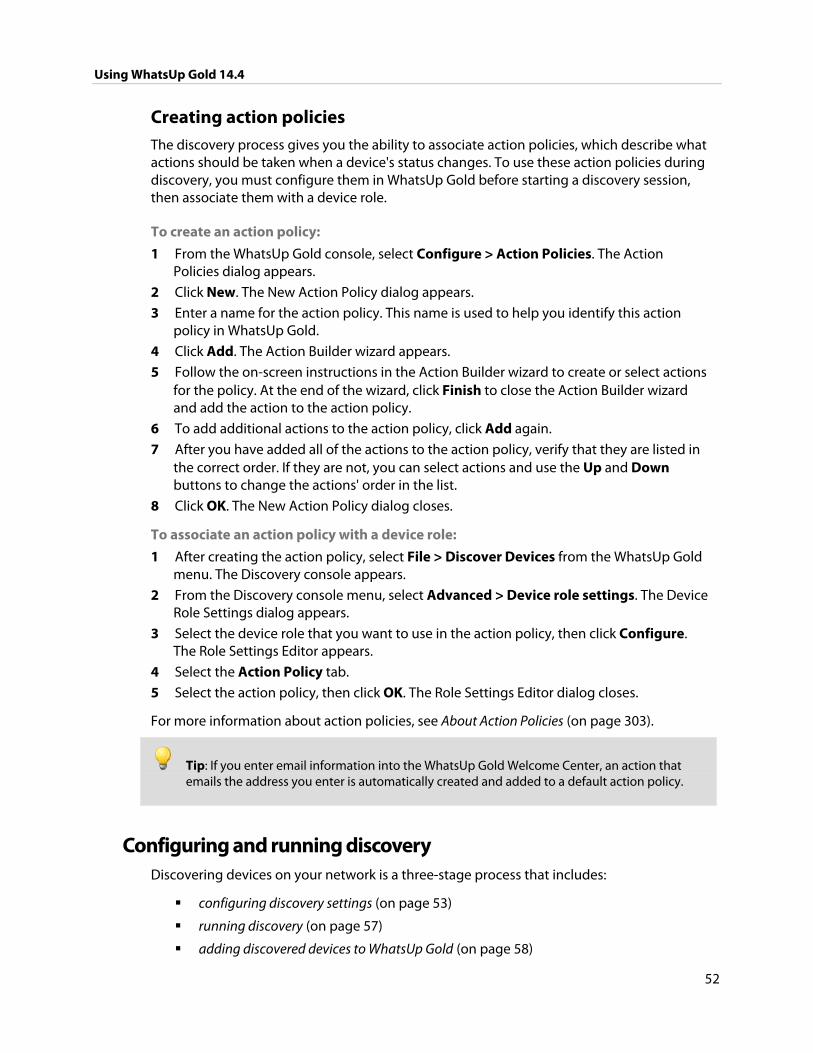
Using WhatsUp Gold 14.4
52
Creating action policies The discovery process gives you the ability to associate action policies, which describe what actions should be taken when a device's status changes. To use these action policies during discovery, you must configure them in WhatsUp Gold before starting a discovery session, then associate them with a device role.
To create an action policy:
1 From the WhatsUp Gold console, select Configure > Action Policies. The Action Policies dialog appears.
2 Click New. The New Action Policy dialog appears.
3 Enter a name for the action policy. This name is used to help you identify this action policy in WhatsUp Gold.
4 Click Add. The Action Builder wizard appears.
5 Follow the on-screen instructions in the Action Builder wizard to create or select actions for the policy. At the end of the wizard, click Finish to close the Action Builder wizard and add the action to the action policy.
6 To add additional actions to the action policy, click Add again.
7 After you have added all of the actions to the action policy, verify that they are listed in the correct order. If they are not, you can select actions and use the Up and Down buttons to change the actions' order in the list.
8 Click OK. The New Action Policy dialog closes.
To associate an action policy with a device role:
1 After creating the action policy, select File > Discover Devices from the WhatsUp Gold menu. The Discovery console appears.
2 From the Discovery console menu, select Advanced > Device role settings. The Device Role Settings dialog appears.
3 Select the device role that you want to use in the action policy, then click Configure. The Role Settings Editor appears.
4 Select the Action Policy tab.
5 Select the action policy, then click OK. The Role Settings Editor dialog closes.
For more information about action policies, see About Action Policies (on page 303).
Tip: If you enter email information into the WhatsUp Gold Welcome Center, an action that emails the address you enter is automatically created and added to a default action policy.
Configuring and running discovery Discovering devices on your network is a three-stage process that includes:
configuring discovery settings (on page 53)
running discovery (on page 57)
adding discovered devices to WhatsUp Gold (on page 58)
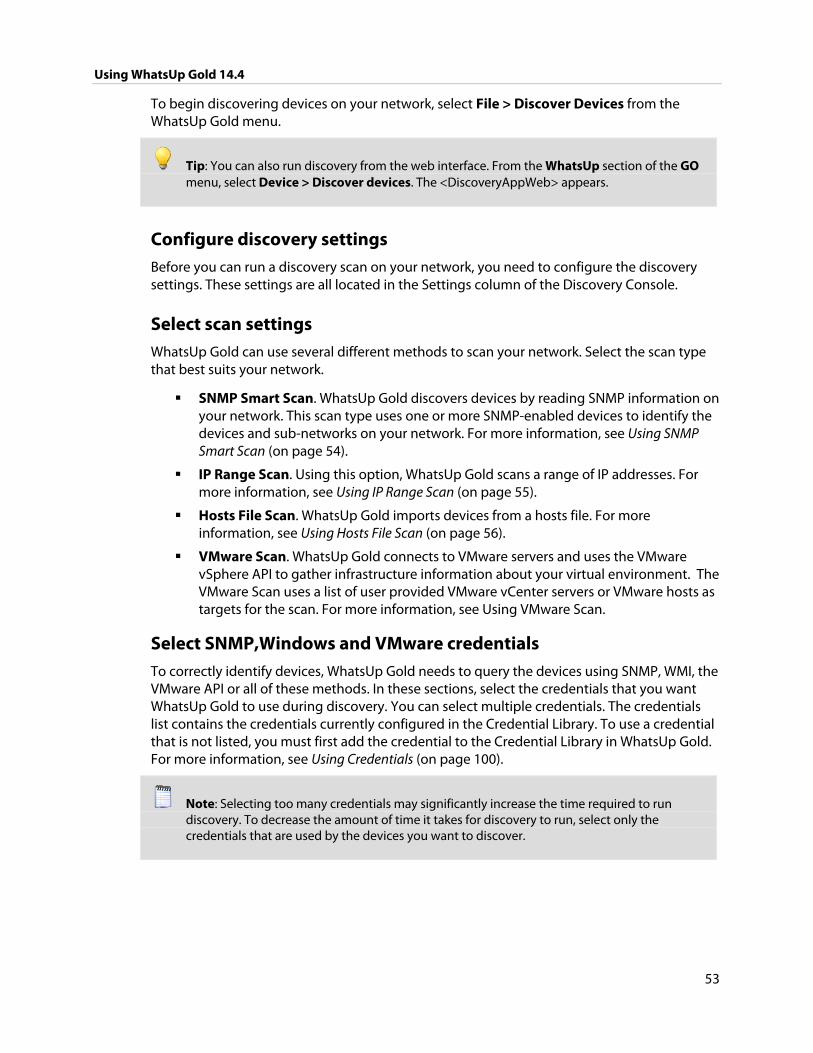
Using WhatsUp Gold 14.4
53
To begin discovering devices on your network, select File > Discover Devices from the WhatsUp Gold menu.
Tip: You can also run discovery from the web interface. From the WhatsUp section of the GO menu, select Device > Discover devices. The <DiscoveryAppWeb> appears.
Configure discovery settings Before you can run a discovery scan on your network, you need to configure the discovery settings. These settings are all located in the Settings column of the Discovery Console.
Select scan settings WhatsUp Gold can use several different methods to scan your network. Select the scan type that best suits your network.
SNMP Smart Scan. WhatsUp Gold discovers devices by reading SNMP information on your network. This scan type uses one or more SNMP-enabled devices to identify the devices and sub-networks on your network. For more information, see Using SNMP Smart Scan (on page 54).
IP Range Scan. Using this option, WhatsUp Gold scans a range of IP addresses. For more information, see Using IP Range Scan (on page 55).
Hosts File Scan. WhatsUp Gold imports devices from a hosts file. For more information, see Using Hosts File Scan (on page 56).
VMware Scan. WhatsUp Gold connects to VMware servers and uses the VMware vSphere API to gather infrastructure information about your virtual environment. The VMware Scan uses a list of user provided VMware vCenter servers or VMware hosts as targets for the scan. For more information, see Using VMware Scan.
Select SNMP,Windows and VMware credentials To correctly identify devices, WhatsUp Gold needs to query the devices using SNMP, WMI, the VMware API or all of these methods. In these sections, select the credentials that you want WhatsUp Gold to use during discovery. You can select multiple credentials. The credentials list contains the credentials currently configured in the Credential Library. To use a credential that is not listed, you must first add the credential to the Credential Library in WhatsUp Gold. For more information, see Using Credentials (on page 100).
Note: Selecting too many credentials may significantly increase the time required to run discovery. To decrease the amount of time it takes for discovery to run, select only the credentials that are used by the devices you want to discover.
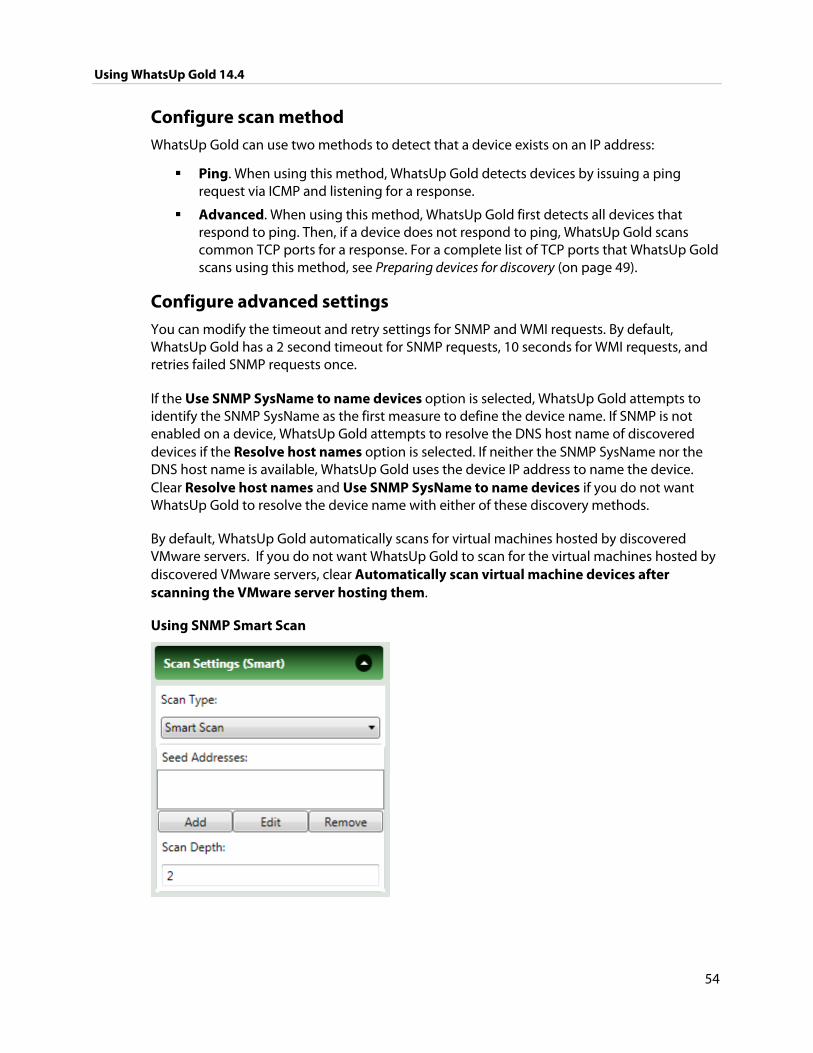
Using WhatsUp Gold 14.4
54
Configure scan method WhatsUp Gold can use two methods to detect that a device exists on an IP address:
Ping. When using this method, WhatsUp Gold detects devices by issuing a ping request via ICMP and listening for a response.
Advanced. When using this method, WhatsUp Gold first detects all devices that respond to ping. Then, if a device does not respond to ping, WhatsUp Gold scans common TCP ports for a response. For a complete list of TCP ports that WhatsUp Gold scans using this method, see Preparing devices for discovery (on page 49).
Configure advanced settings You can modify the timeout and retry settings for SNMP and WMI requests. By default, WhatsUp Gold has a 2 second timeout for SNMP requests, 10 seconds for WMI requests, and retries failed SNMP requests once.
If the Use SNMP SysName to name devices option is selected, WhatsUp Gold attempts to identify the SNMP SysName as the first measure to define the device name. If SNMP is not enabled on a device, WhatsUp Gold attempts to resolve the DNS host name of discovered devices if the Resolve host names option is selected. If neither the SNMP SysName nor the DNS host name is available, WhatsUp Gold uses the device IP address to name the device. Clear Resolve host names and Use SNMP SysName to name devices if you do not want WhatsUp Gold to resolve the device name with either of these discovery methods.
By default, WhatsUp Gold automatically scans for virtual machines hosted by discovered VMware servers. If you do not want WhatsUp Gold to scan for the virtual machines hosted by discovered VMware servers, clear Automatically scan virtual machine devices after scanning the VMware server hosting them.
Using SNMP Smart Scan
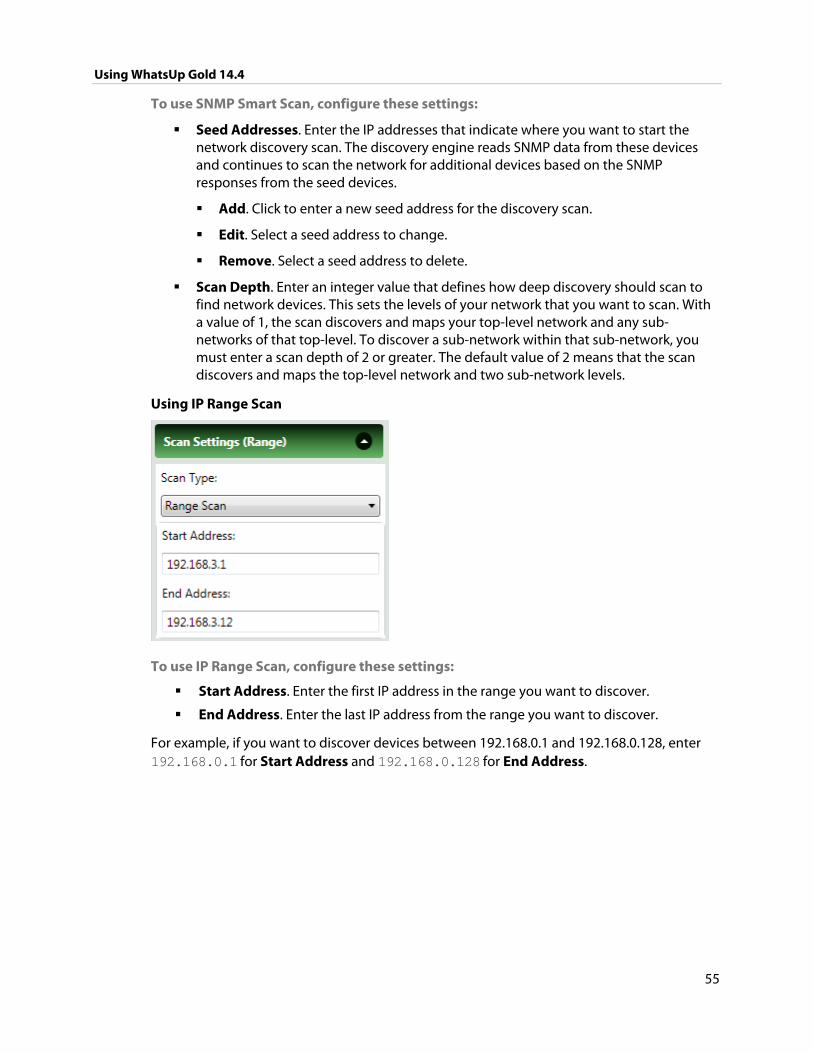
Using WhatsUp Gold 14.4
55
To use SNMP Smart Scan, configure these settings:
Seed Addresses. Enter the IP addresses that indicate where you want to start the network discovery scan. The discovery engine reads SNMP data from these devices and continues to scan the network for additional devices based on the SNMP responses from the seed devices.
Add. Click to enter a new seed address for the discovery scan.
Edit. Select a seed address to change.
Remove. Select a seed address to delete.
Scan Depth. Enter an integer value that defines how deep discovery should scan to find network devices. This sets the levels of your network that you want to scan. With a value of 1, the scan discovers and maps your top-level network and any sub-networks of that top-level. To discover a sub-network within that sub-network, you must enter a scan depth of 2 or greater. The default value of 2 means that the scan discovers and maps the top-level network and two sub-network levels.
Using IP Range Scan
To use IP Range Scan, configure these settings:
Start Address. Enter the first IP address in the range you want to discover.
End Address. Enter the last IP address from the range you want to discover.
For example, if you want to discover devices between 192.168.0.1 and 192.168.0.128, enter 192.168.0.1 for Start Address and 192.168.0.128 for End Address.
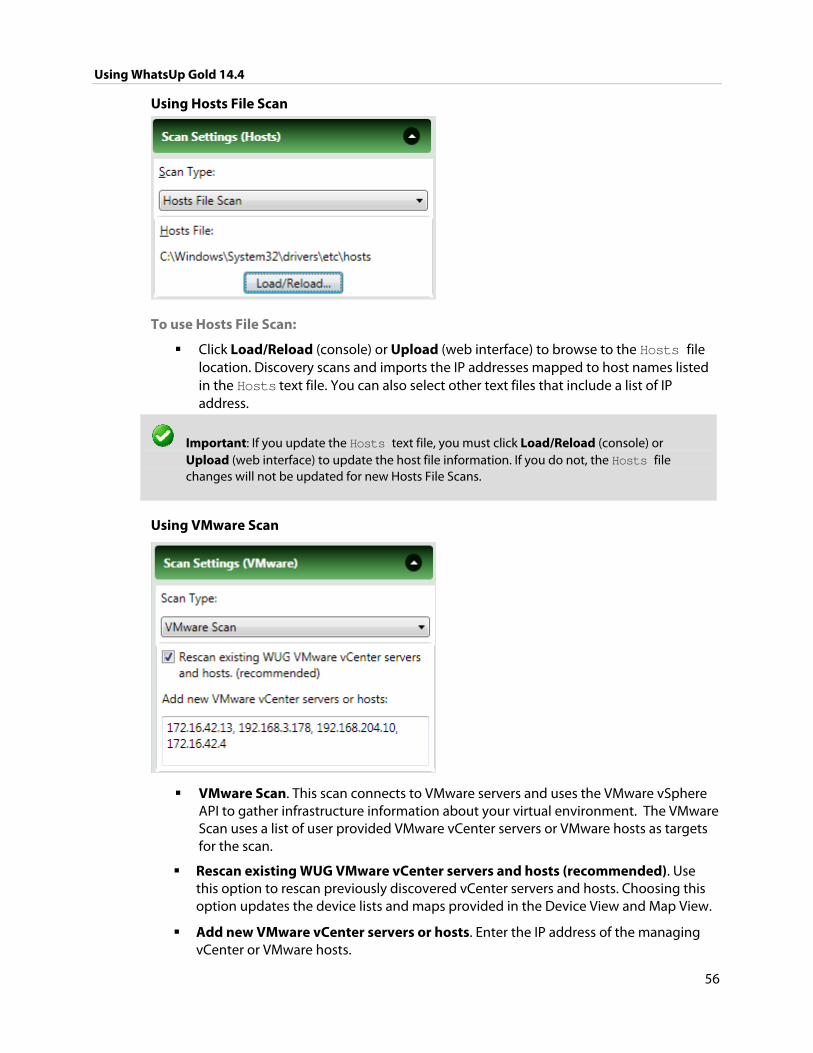
Using WhatsUp Gold 14.4
56
Using Hosts File Scan
To use Hosts File Scan:
Click Load/Reload (console) or Upload (web interface) to browse to the Hosts file location. Discovery scans and imports the IP addresses mapped to host names listed in the Hosts text file. You can also select other text files that include a list of IP address.
Important: If you update the Hosts text file, you must click Load/Reload (console) or Upload (web interface) to update the host file information. If you do not, the Hosts file changes will not be updated for new Hosts File Scans.
Using VMware Scan
VMware Scan. This scan connects to VMware servers and uses the VMware vSphere API to gather infrastructure information about your virtual environment. The VMware Scan uses a list of user provided VMware vCenter servers or VMware hosts as targets for the scan.
Rescan existing WUG VMware vCenter servers and hosts (recommended). Use this option to rescan previously discovered vCenter servers and hosts. Choosing this option updates the device lists and maps provided in the Device View and Map View.
Add new VMware vCenter servers or hosts. Enter the IP address of the managing vCenter or VMware hosts.
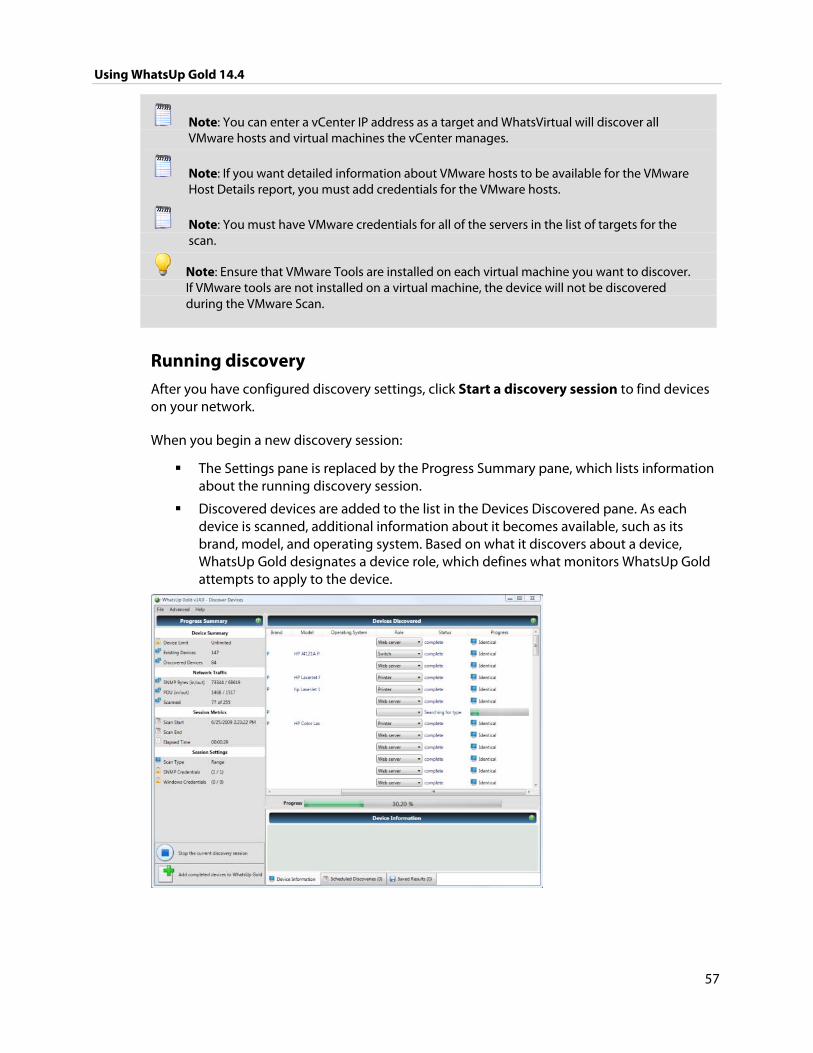
Using WhatsUp Gold 14.4
57
Note: You can enter a vCenter IP address as a target and WhatsVirtual will discover all VMware hosts and virtual machines the vCenter manages.
Note: If you want detailed information about VMware hosts to be available for the VMware Host Details report, you must add credentials for the VMware hosts.
Note: You must have VMware credentials for all of the servers in the list of targets for the scan.
Note: Ensure that VMware Tools are installed on each virtual machine you want to discover. If VMware tools are not installed on a virtual machine, the device will not be discovered during the VMware Scan.
Running discovery
After you have configured discovery settings, click Start a discovery session to find devices on your network.
When you begin a new discovery session:
The Settings pane is replaced by the Progress Summary pane, which lists information about the running discovery session.
Discovered devices are added to the list in the Devices Discovered pane. As each device is scanned, additional information about it becomes available, such as its brand, model, and operating system. Based on what it discovers about a device, WhatsUp Gold designates a device role, which defines what monitors WhatsUp Gold attempts to apply to the device.
Using WhatsUp Gold 14.4
58
To see detailed information about a discovered device:
1 Select a fully discovered device from the list in the Devices Discovered pane. You can tell a device has been fully discovered when the Status column lists completed. The row highlights when the device is selected.
2 If it is not already selected, select the Device Information tab from the bottom of window. This section shows detailed information about the selected device.
To stop a running discovery session:
If a discovery session has not completed fully (reached 100% on the progress bar), you can stop it by clicking Stop the current discovery session.
Tip: When you stop a running discovery session, the devices that have been completely discovered remain in the Devices Discovered list and can still be added to WhatsUp Gold. Devices that show a Status of Canceled, however, cannot be added to WhatsUp Gold unless you run another discovery session and allow them to be discovered completely.
Add discovered devices to WhatsUp Gold After WhatsUp Gold discovers and identifies the role of devices, you can add those devices to a device group. You do not have to wait for the discovery session to reach 100% before you can add devices; after a device is listed as Complete in the Status column, it can be added to a device group.
Tip: If a device identifies with an incorrect role or a role other than the one you want to use, you can change it in the drop down in the Role column. This field lists all of the roles for which the device met the criteria. If the role you want to use is not in this list, you must modify the device identification on the role. For more information, see Using Device Roles (on page 63).
To add all completed devices to a device group:
1 Click Add completed devices to WhatsUp Gold. The Add Devices to WhatsUp Gold dialog appears.
Note: Only devices that are listed as Complete in the Status column can be added. If any selected devices are in any other status, they are not added to WhatsUp Gold.
2 In Group name, enter the name of the device group to which you want to add devices. To use a device group that already exists in WhatsUp Gold, enter its name exactly as it appears in WhatsUp Gold. If the entered name does not already exist in WhatsUp Gold, a device group with that name is created. To use a default name, which includes the type of scan and the time the scan started, click Default name.
3 Click Add devices to WhatsUp Gold. A progress dialog appears as the devices are added to the device group.
4 When you are finished adding devices, click Close. The Save Device Settings dialog closes.
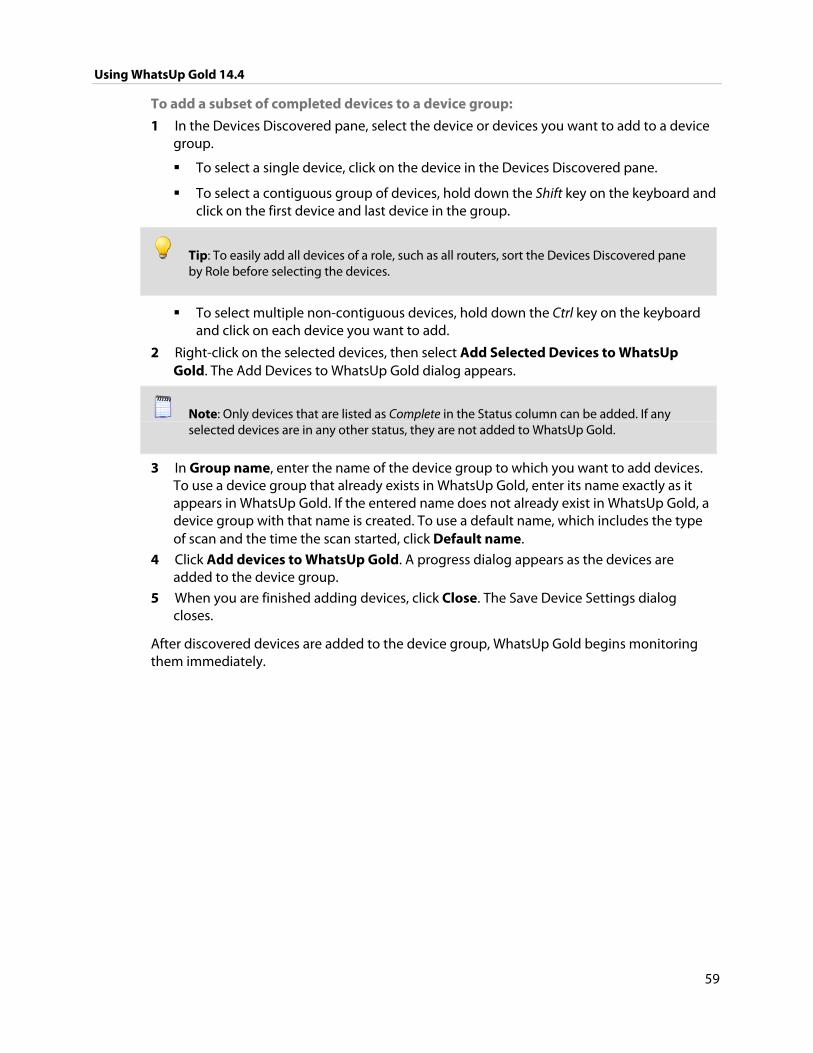
Using WhatsUp Gold 14.4
59
To add a subset of completed devices to a device group:
1 In the Devices Discovered pane, select the device or devices you want to add to a device group.
To select a single device, click on the device in the Devices Discovered pane.
To select a contiguous group of devices, hold down the Shift key on the keyboard and click on the first device and last device in the group.
Tip: To easily add all devices of a role, such as all routers, sort the Devices Discovered pane by Role before selecting the devices.
To select multiple non-contiguous devices, hold down the Ctrl key on the keyboard and click on each device you want to add.
2 Right-click on the selected devices, then select Add Selected Devices to WhatsUp Gold. The Add Devices to WhatsUp Gold dialog appears.
Note: Only devices that are listed as Complete in the Status column can be added. If any selected devices are in any other status, they are not added to WhatsUp Gold.
3 In Group name, enter the name of the device group to which you want to add devices. To use a device group that already exists in WhatsUp Gold, enter its name exactly as it appears in WhatsUp Gold. If the entered name does not already exist in WhatsUp Gold, a device group with that name is created. To use a default name, which includes the type of scan and the time the scan started, click Default name.
4 Click Add devices to WhatsUp Gold. A progress dialog appears as the devices are added to the device group.
5 When you are finished adding devices, click Close. The Save Device Settings dialog closes.
After discovered devices are added to the device group, WhatsUp Gold begins monitoring them immediately.
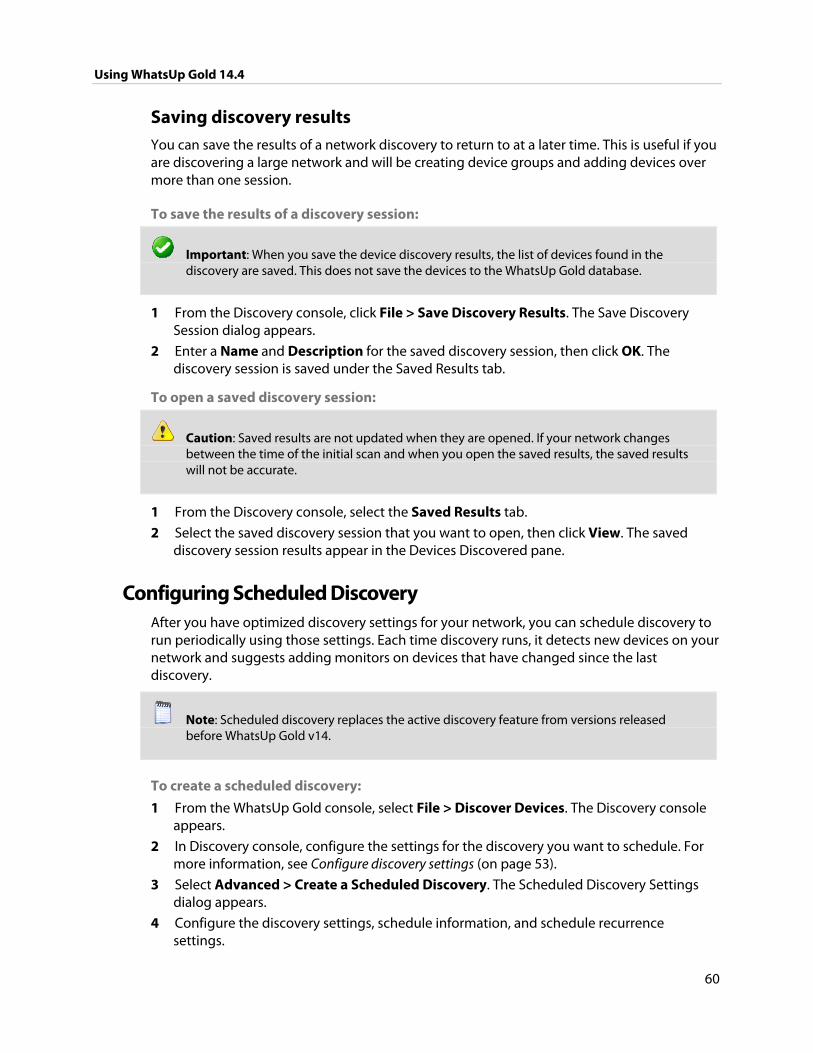
Using WhatsUp Gold 14.4
60
Saving discovery results You can save the results of a network discovery to return to at a later time. This is useful if you are discovering a large network and will be creating device groups and adding devices over more than one session.
To save the results of a discovery session:
Important: When you save the device discovery results, the list of devices found in the discovery are saved. This does not save the devices to the WhatsUp Gold database.
1 From the Discovery console, click File > Save Discovery Results. The Save Discovery Session dialog appears.
2 Enter a Name and Description for the saved discovery session, then click OK. The discovery session is saved under the Saved Results tab.
To open a saved discovery session:
Caution: Saved results are not updated when they are opened. If your network changes between the time of the initial scan and when you open the saved results, the saved results will not be accurate.
1 From the Discovery console, select the Saved Results tab.
2 Select the saved discovery session that you want to open, then click View. The saved discovery session results appear in the Devices Discovered pane.
Configuring Scheduled Discovery After you have optimized discovery settings for your network, you can schedule discovery to run periodically using those settings. Each time discovery runs, it detects new devices on your network and suggests adding monitors on devices that have changed since the last discovery.
Note: Scheduled discovery replaces the active discovery feature from versions released before WhatsUp Gold v14.
To create a scheduled discovery:
1 From the WhatsUp Gold console, select File > Discover Devices. The Discovery console appears.
2 In Discovery console, configure the settings for the discovery you want to schedule. For more information, see Configure discovery settings (on page 53).
3 Select Advanced > Create a Scheduled Discovery. The Scheduled Discovery Settings dialog appears.
4 Configure the discovery settings, schedule information, and schedule recurrence settings.
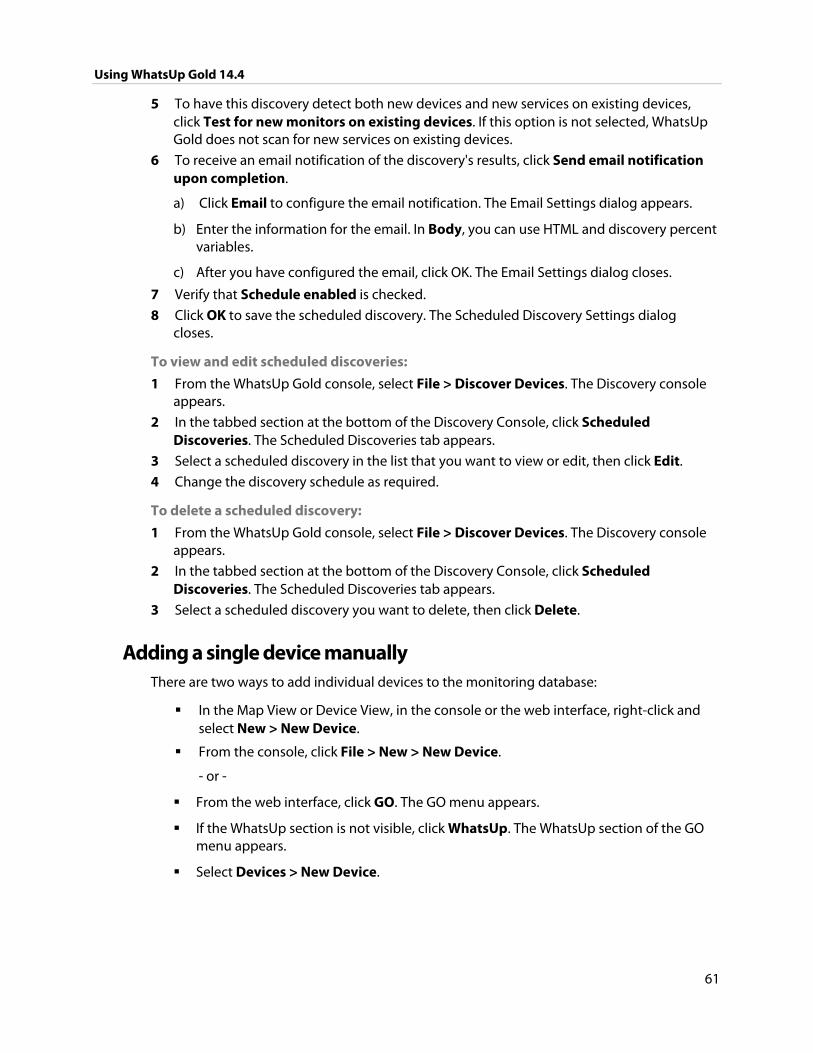
Using WhatsUp Gold 14.4
61
5 To have this discovery detect both new devices and new services on existing devices, click Test for new monitors on existing devices. If this option is not selected, WhatsUp Gold does not scan for new services on existing devices.
6 To receive an email notification of the discovery's results, click Send email notification upon completion.
a) Click Email to configure the email notification. The Email Settings dialog appears.
b) Enter the information for the email. In Body, you can use HTML and discovery percent variables.
c) After you have configured the email, click OK. The Email Settings dialog closes.
7 Verify that Schedule enabled is checked.
8 Click OK to save the scheduled discovery. The Scheduled Discovery Settings dialog closes.
To view and edit scheduled discoveries:
1 From the WhatsUp Gold console, select File > Discover Devices. The Discovery console appears.
2 In the tabbed section at the bottom of the Discovery Console, click Scheduled Discoveries. The Scheduled Discoveries tab appears.
3 Select a scheduled discovery in the list that you want to view or edit, then click Edit.
4 Change the discovery schedule as required.
To delete a scheduled discovery:
1 From the WhatsUp Gold console, select File > Discover Devices. The Discovery console appears.
2 In the tabbed section at the bottom of the Discovery Console, click Scheduled Discoveries. The Scheduled Discoveries tab appears.
3 Select a scheduled discovery you want to delete, then click Delete.
Adding a single device manually There are two ways to add individual devices to the monitoring database:
In the Map View or Device View, in the console or the web interface, right-click and select New > New Device.
From the console, click File > New > New Device.
- or -
From the web interface, click GO. The GO menu appears.
If the WhatsUp section is not visible, click WhatsUp. The WhatsUp section of the GO menu appears.
Select Devices > New Device.
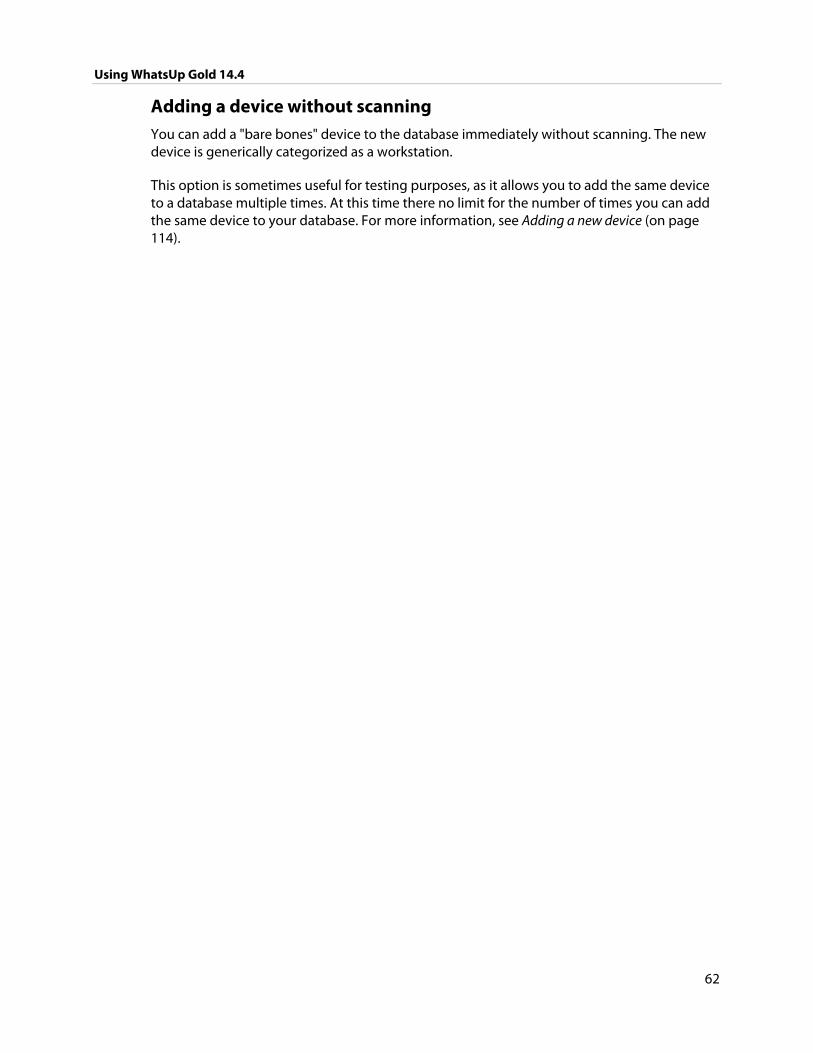
Using WhatsUp Gold 14.4
62
Adding a device without scanning You can add a "bare bones" device to the database immediately without scanning. The new device is generically categorized as a workstation.
This option is sometimes useful for testing purposes, as it allows you to add the same device to a database multiple times. At this time there no limit for the number of times you can add the same device to your database. For more information, see Adding a new device (on page 114).
63
CHAPTER 7
Using Device Roles
In This Chapter
Configuring device role settings ................................................................... 64
Configuring device role identification settings ....................................... 66
Using the percent variables in the Discovery Console.......................... 69
Managing device roles ..................................................................................... 71
When WhatsUp Gold discovers devices, it tries to determine the type of each device so that it can monitor them appropriately. To determine a device type, WhatsUp Gold compares the discovered attributes of each device to a set of criteria called device roles.
Device roles do two things:
Specify the criteria that a device must match to be identified as the device role.
Specify the monitoring configuration that is applied to the device when it is added to WhatsUp Gold.
WhatsUp Gold provides more than 15 default device roles that are used to identify most common network devices. If your network includes devices that are not identified by this default set, you can create custom device roles.
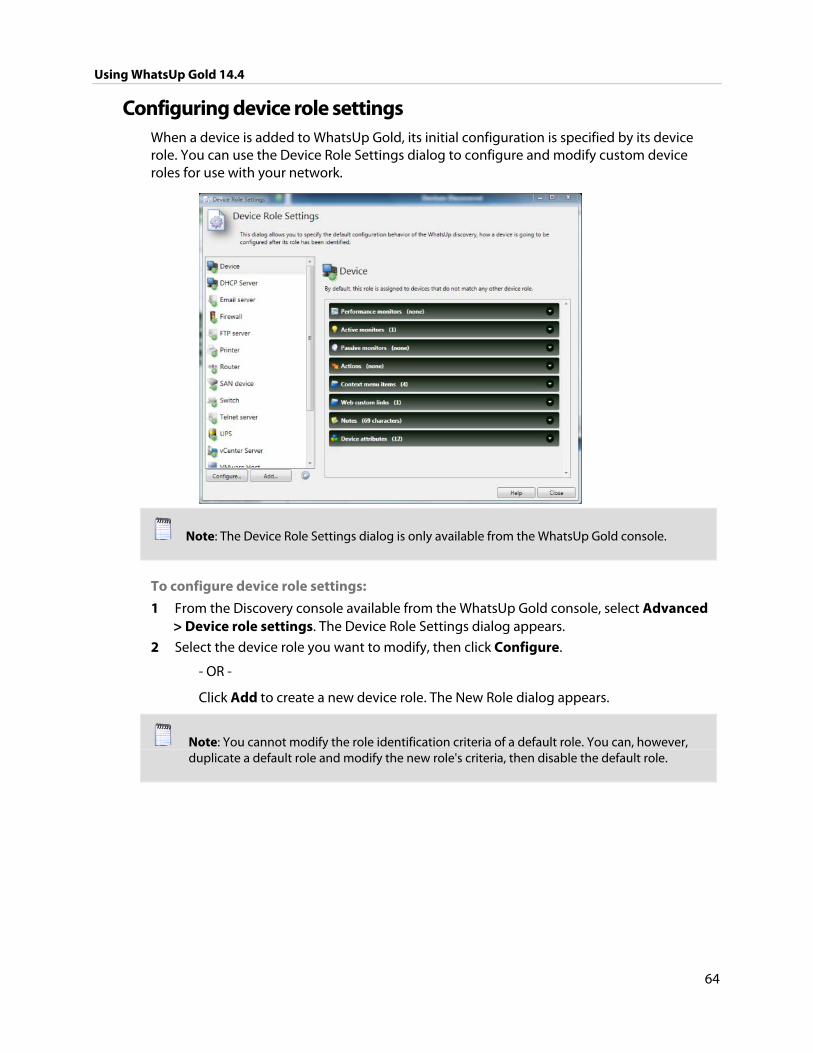
Using WhatsUp Gold 14.4
64
Configuring device role settings When a device is added to WhatsUp Gold, its initial configuration is specified by its device role. You can use the Device Role Settings dialog to configure and modify custom device roles for use with your network.
Note: The Device Role Settings dialog is only available from the WhatsUp Gold console.
To configure device role settings:
1 From the Discovery console available from the WhatsUp Gold console, select Advanced > Device role settings. The Device Role Settings dialog appears.
2 Select the device role you want to modify, then click Configure.
- OR -
Click Add to create a new device role. The New Role dialog appears.
Note: You cannot modify the role identification criteria of a default role. You can, however, duplicate a default role and modify the new role's criteria, then disable the default role.
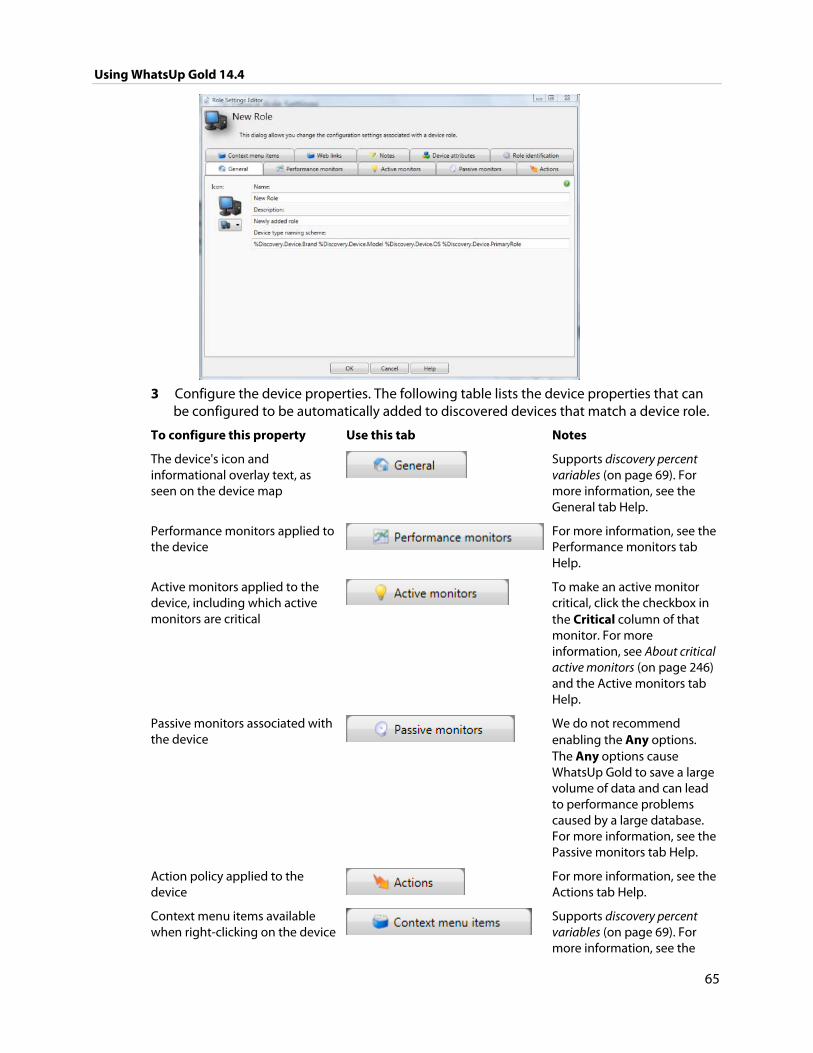
Using WhatsUp Gold 14.4
65
3 Configure the device properties. The following table lists the device properties that can
be configured to be automatically added to discovered devices that match a device role.
To configure this property Use this tab Notes
The device's icon and informational overlay text, as seen on the device map
Supports discovery percent variables (on page 69). For more information, see the General tab Help.
Performance monitors applied to the device
For more information, see the Performance monitors tab Help.
Active monitors applied to the device, including which active monitors are critical
To make an active monitor critical, click the checkbox in the Critical column of that monitor. For more information, see About critical active monitors (on page 246) and the Active monitors tab Help.
Passive monitors associated with the device
We do not recommend enabling the Any options. The Any options cause WhatsUp Gold to save a large volume of data and can lead to performance problems caused by a large database. For more information, see the Passive monitors tab Help.
Action policy applied to the device
For more information, see the Actions tab Help.
Context menu items available when right-clicking on the device
Supports discovery percent variables (on page 69). For more information, see the
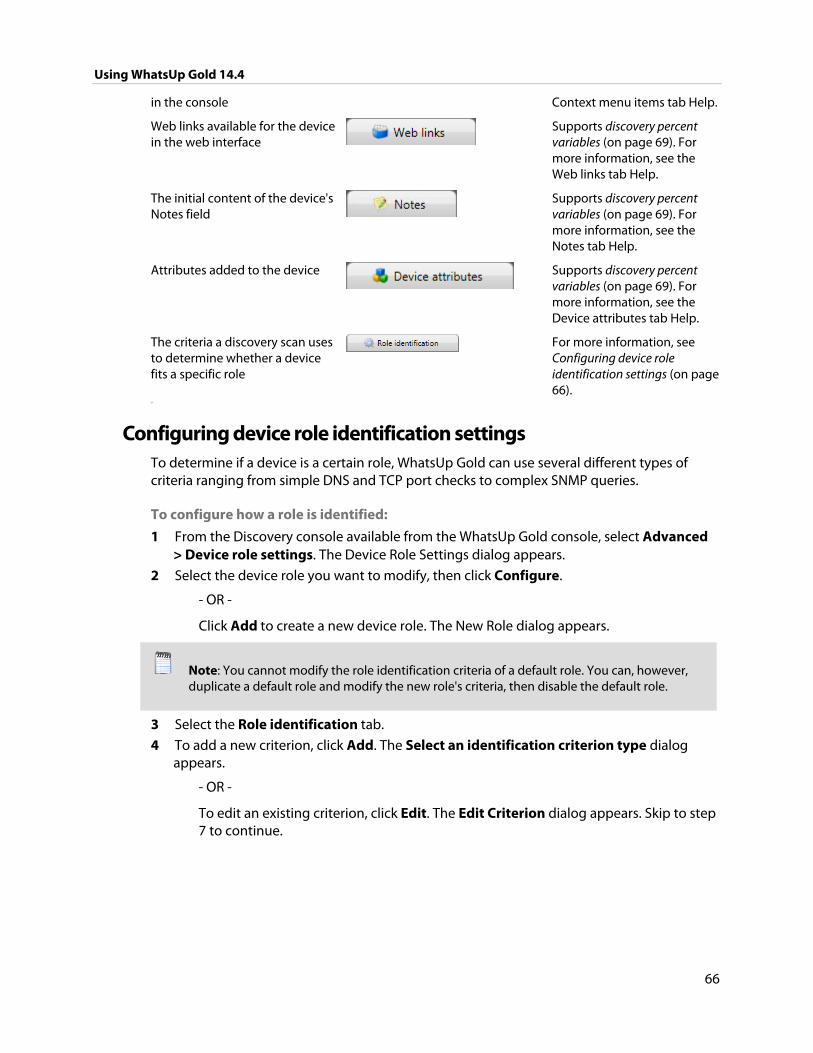
Using WhatsUp Gold 14.4
66
in the console Context menu items tab Help.
Web links available for the device in the web interface
Supports discovery percent variables (on page 69). For more information, see the Web links tab Help.
The initial content of the device's Notes field
Supports discovery percent variables (on page 69). For more information, see the Notes tab Help.
Attributes added to the device
Supports discovery percent variables (on page 69). For more information, see the Device attributes tab Help.
The criteria a discovery scan uses to determine whether a device fits a specific role
For more information, see Configuring device role identification settings (on page 66).
gmx
Configuring device role identification settings To determine if a device is a certain role, WhatsUp Gold can use several different types of criteria ranging from simple DNS and TCP port checks to complex SNMP queries.
To configure how a role is identified:
1 From the Discovery console available from the WhatsUp Gold console, select Advanced > Device role settings. The Device Role Settings dialog appears.
2 Select the device role you want to modify, then click Configure.
- OR -
Click Add to create a new device role. The New Role dialog appears.
Note: You cannot modify the role identification criteria of a default role. You can, however, duplicate a default role and modify the new role's criteria, then disable the default role.
3 Select the Role identification tab.
4 To add a new criterion, click Add. The Select an identification criterion type dialog appears.
- OR -
To edit an existing criterion, click Edit. The Edit Criterion dialog appears. Skip to step 7 to continue.
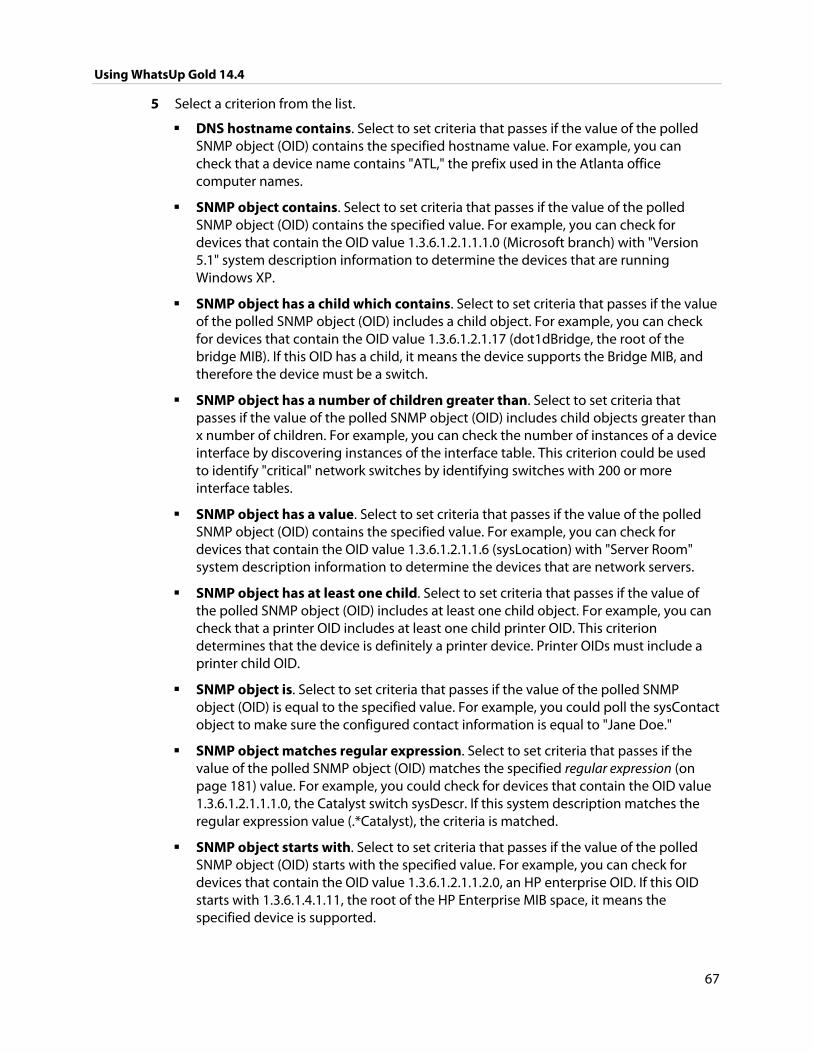
Using WhatsUp Gold 14.4
67
5 Select a criterion from the list.
DNS hostname contains. Select to set criteria that passes if the value of the polled SNMP object (OID) contains the specified hostname value. For example, you can check that a device name contains "ATL," the prefix used in the Atlanta office computer names.
SNMP object contains. Select to set criteria that passes if the value of the polled SNMP object (OID) contains the specified value. For example, you can check for devices that contain the OID value 1.3.6.1.2.1.1.1.0 (Microsoft branch) with "Version 5.1" system description information to determine the devices that are running Windows XP.
SNMP object has a child which contains. Select to set criteria that passes if the value of the polled SNMP object (OID) includes a child object. For example, you can check for devices that contain the OID value 1.3.6.1.2.1.17 (dot1dBridge, the root of the bridge MIB). If this OID has a child, it means the device supports the Bridge MIB, and therefore the device must be a switch.
SNMP object has a number of children greater than. Select to set criteria that passes if the value of the polled SNMP object (OID) includes child objects greater than x number of children. For example, you can check the number of instances of a device interface by discovering instances of the interface table. This criterion could be used to identify "critical" network switches by identifying switches with 200 or more interface tables.
SNMP object has a value. Select to set criteria that passes if the value of the polled SNMP object (OID) contains the specified value. For example, you can check for devices that contain the OID value 1.3.6.1.2.1.1.6 (sysLocation) with "Server Room" system description information to determine the devices that are network servers.
SNMP object has at least one child. Select to set criteria that passes if the value of the polled SNMP object (OID) includes at least one child object. For example, you can check that a printer OID includes at least one child printer OID. This criterion determines that the device is definitely a printer device. Printer OIDs must include a printer child OID.
SNMP object is. Select to set criteria that passes if the value of the polled SNMP object (OID) is equal to the specified value. For example, you could poll the sysContact object to make sure the configured contact information is equal to "Jane Doe."
SNMP object matches regular expression. Select to set criteria that passes if the value of the polled SNMP object (OID) matches the specified regular expression (on page 181) value. For example, you could check for devices that contain the OID value 1.3.6.1.2.1.1.1.0, the Catalyst switch sysDescr. If this system description matches the regular expression value (.*Catalyst), the criteria is matched.
SNMP object starts with. Select to set criteria that passes if the value of the polled SNMP object (OID) starts with the specified value. For example, you can check for devices that contain the OID value 1.3.6.1.2.1.1.2.0, an HP enterprise OID. If this OID starts with 1.3.6.1.4.1.11, the root of the HP Enterprise MIB space, it means the specified device is supported.
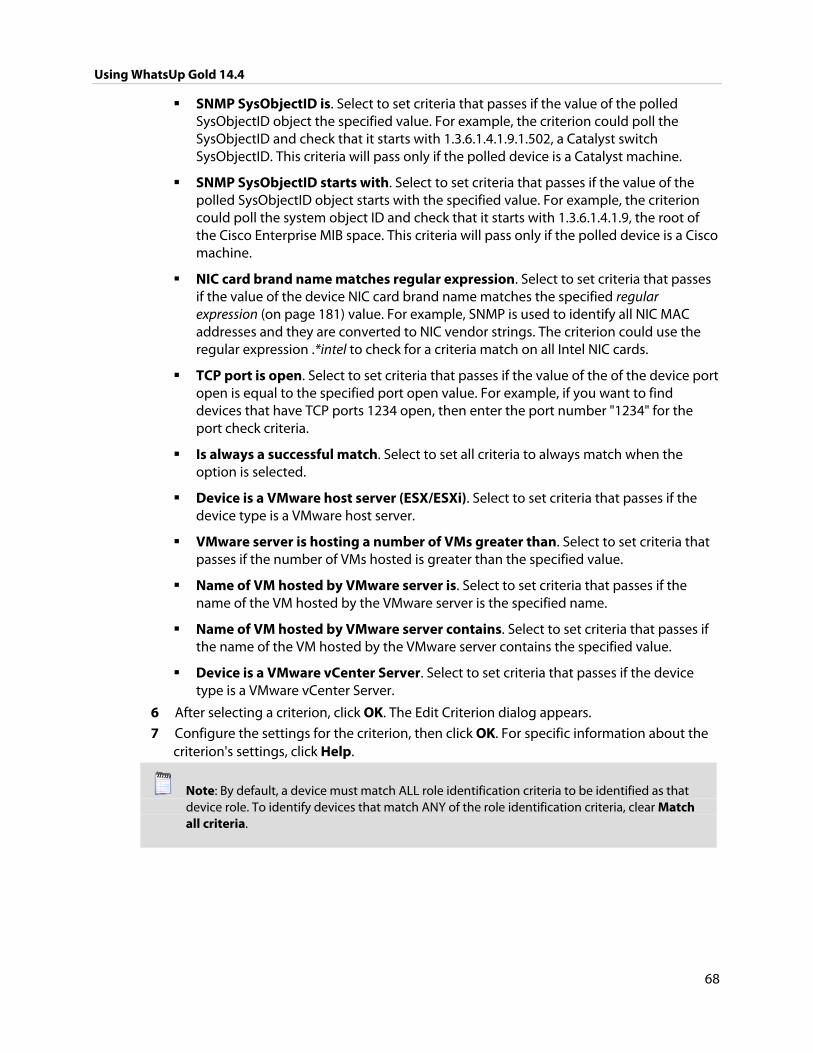
Using WhatsUp Gold 14.4
68
SNMP SysObjectID is. Select to set criteria that passes if the value of the polled SysObjectID object the specified value. For example, the criterion could poll the SysObjectID and check that it starts with 1.3.6.1.4.1.9.1.502, a Catalyst switch SysObjectID. This criteria will pass only if the polled device is a Catalyst machine.
SNMP SysObjectID starts with. Select to set criteria that passes if the value of the polled SysObjectID object starts with the specified value. For example, the criterion could poll the system object ID and check that it starts with 1.3.6.1.4.1.9, the root of the Cisco Enterprise MIB space. This criteria will pass only if the polled device is a Cisco machine.
NIC card brand name matches regular expression. Select to set criteria that passes if the value of the device NIC card brand name matches the specified regular expression (on page 181) value. For example, SNMP is used to identify all NIC MAC addresses and they are converted to NIC vendor strings. The criterion could use the regular expression .*intel to check for a criteria match on all Intel NIC cards.
TCP port is open. Select to set criteria that passes if the value of the of the device port open is equal to the specified port open value. For example, if you want to find devices that have TCP ports 1234 open, then enter the port number "1234" for the port check criteria.
Is always a successful match. Select to set all criteria to always match when the option is selected.
Device is a VMware host server (ESX/ESXi). Select to set criteria that passes if the device type is a VMware host server.
VMware server is hosting a number of VMs greater than. Select to set criteria that passes if the number of VMs hosted is greater than the specified value.
Name of VM hosted by VMware server is. Select to set criteria that passes if the name of the VM hosted by the VMware server is the specified name.
Name of VM hosted by VMware server contains. Select to set criteria that passes if the name of the VM hosted by the VMware server contains the specified value.
Device is a VMware vCenter Server. Select to set criteria that passes if the device type is a VMware vCenter Server.
6 After selecting a criterion, click OK. The Edit Criterion dialog appears.
7 Configure the settings for the criterion, then click OK. For specific information about the criterion's settings, click Help.
Note: By default, a device must match ALL role identification criteria to be identified as that device role. To identify devices that match ANY of the role identification criteria, clear Match all criteria.
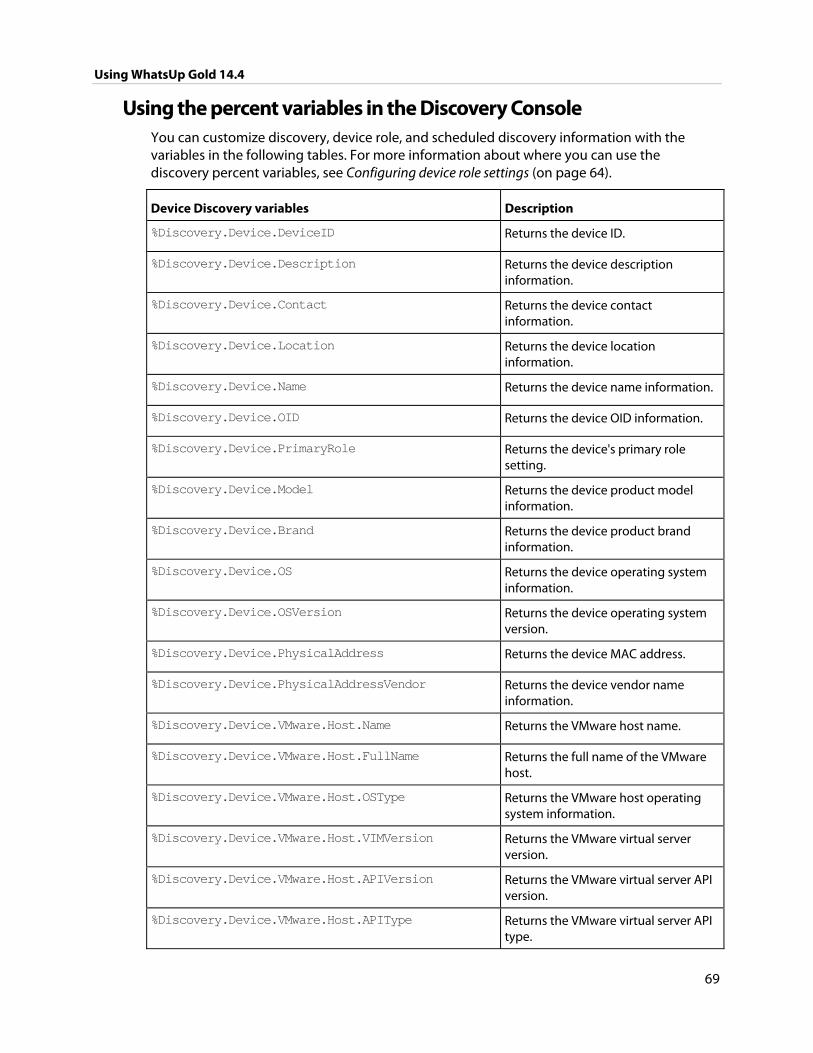
Using WhatsUp Gold 14.4
69
Using the percent variables in the Discovery Console You can customize discovery, device role, and scheduled discovery information with the variables in the following tables. For more information about where you can use the discovery percent variables, see Configuring device role settings (on page 64).
Device Discovery variables Description
%Discovery.Device.DeviceID Returns the device ID.
%Discovery.Device.Description Returns the device description information.
%Discovery.Device.Contact Returns the device contact information.
%Discovery.Device.Location Returns the device location information.
%Discovery.Device.Name Returns the device name information.
%Discovery.Device.OID Returns the device OID information.
%Discovery.Device.PrimaryRole Returns the device's primary role setting.
%Discovery.Device.Model Returns the device product model information.
%Discovery.Device.Brand Returns the device product brand information.
%Discovery.Device.OS Returns the device operating system information.
%Discovery.Device.OSVersion Returns the device operating system version.
%Discovery.Device.PhysicalAddress Returns the device MAC address.
%Discovery.Device.PhysicalAddressVendor Returns the device vendor name information.
%Discovery.Device.VMware.Host.Name Returns the VMware host name.
%Discovery.Device.VMware.Host.FullName Returns the full name of the VMware host.
%Discovery.Device.VMware.Host.OSType Returns the VMware host operating system information.
%Discovery.Device.VMware.Host.VIMVersion Returns the VMware virtual server version.
%Discovery.Device.VMware.Host.APIVersion Returns the VMware virtual server API version.
%Discovery.Device.VMware.Host.APIType Returns the VMware virtual server API type.
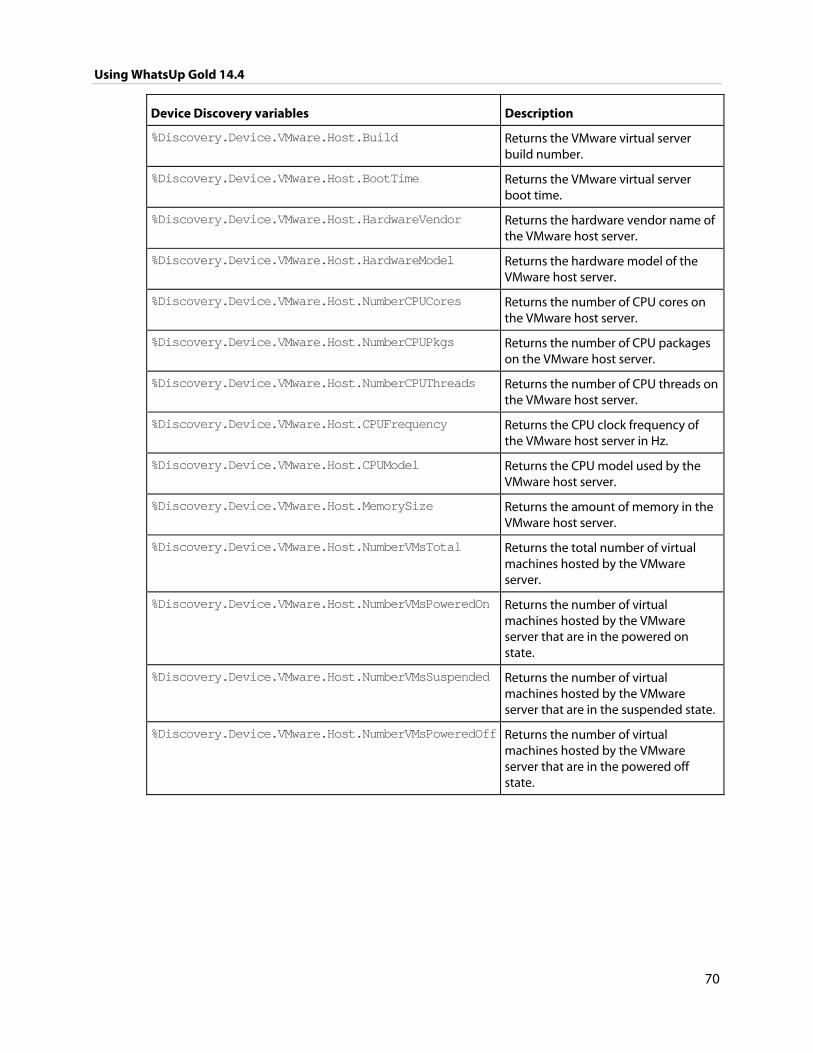
Using WhatsUp Gold 14.4
70
Device Discovery variables Description
%Discovery.Device.VMware.Host.Build Returns the VMware virtual server build number.
%Discovery.Device.VMware.Host.BootTime Returns the VMware virtual server boot time.
%Discovery.Device.VMware.Host.HardwareVendor Returns the hardware vendor name of the VMware host server.
%Discovery.Device.VMware.Host.HardwareModel Returns the hardware model of the VMware host server.
%Discovery.Device.VMware.Host.NumberCPUCores Returns the number of CPU cores on the VMware host server.
%Discovery.Device.VMware.Host.NumberCPUPkgs Returns the number of CPU packages on the VMware host server.
%Discovery.Device.VMware.Host.NumberCPUThreads Returns the number of CPU threads on the VMware host server.
%Discovery.Device.VMware.Host.CPUFrequency Returns the CPU clock frequency of the VMware host server in Hz.
%Discovery.Device.VMware.Host.CPUModel Returns the CPU model used by the VMware host server.
%Discovery.Device.VMware.Host.MemorySize Returns the amount of memory in the VMware host server.
%Discovery.Device.VMware.Host.NumberVMsTotal Returns the total number of virtual machines hosted by the VMware server.
%Discovery.Device.VMware.Host.NumberVMsPoweredOn Returns the number of virtual machines hosted by the VMware server that are in the powered on state.
%Discovery.Device.VMware.Host.NumberVMsSuspended Returns the number of virtual machines hosted by the VMware server that are in the suspended state.
%Discovery.Device.VMware.Host.NumberVMsPoweredOff Returns the number of virtual machines hosted by the VMware server that are in the powered off state.
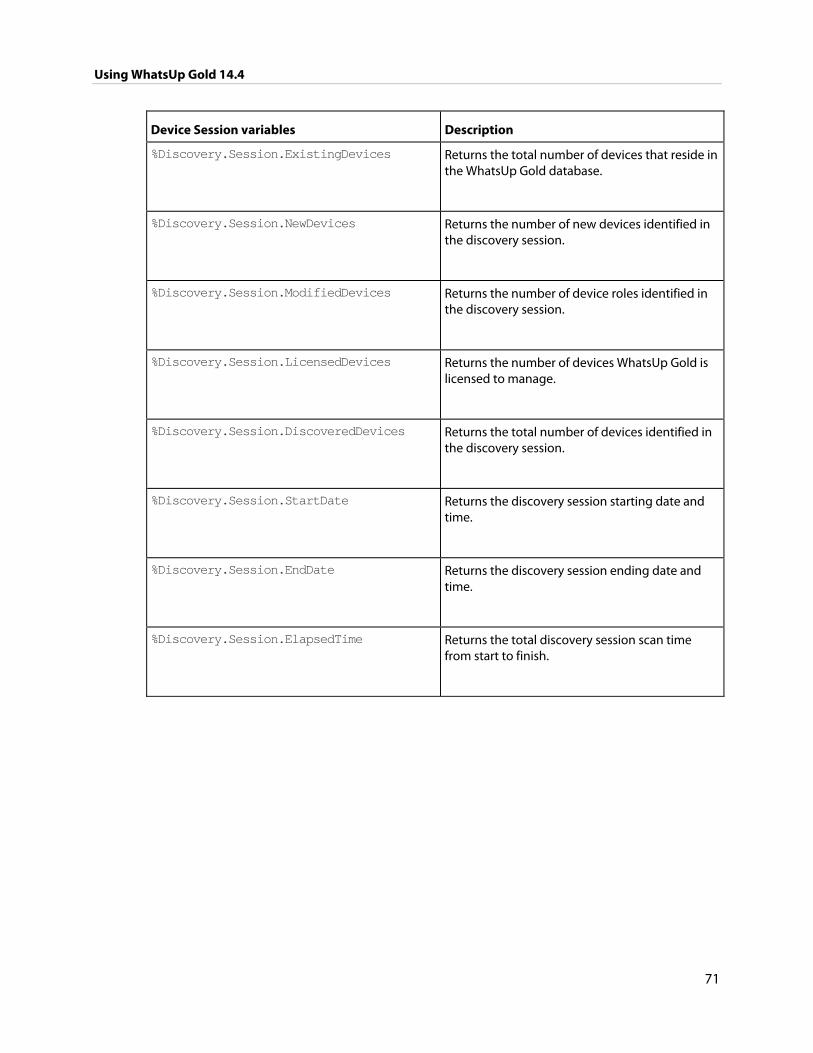
Using WhatsUp Gold 14.4
71
Device Session variables Description
%Discovery.Session.ExistingDevices Returns the total number of devices that reside in the WhatsUp Gold database.
%Discovery.Session.NewDevices Returns the number of new devices identified in the discovery session.
%Discovery.Session.ModifiedDevices Returns the number of device roles identified in the discovery session.
%Discovery.Session.LicensedDevices Returns the number of devices WhatsUp Gold is licensed to manage.
%Discovery.Session.DiscoveredDevices Returns the total number of devices identified in the discovery session.
%Discovery.Session.StartDate Returns the discovery session starting date and time.
%Discovery.Session.EndDate Returns the discovery session ending date and time.
%Discovery.Session.ElapsedTime Returns the total discovery session scan time from start to finish.
Using WhatsUp Gold 14.4
72
Managing device roles Use the Device Role Settings dialog to manage device roles for discovery. From this dialog you can:
Create new device roles (on page 72)
Duplicate existing device roles (on page 72)
Modify device roles (on page 72)
Enable or disable device roles (on page 73)
Restore device roles to their original settings (on page 73)
Delete device roles
The Device Role Settings dialog is accessible from the Discovery console (Advanced > Device role settings).
Creating new roles
To create a new device role:
1 From the Discovery console, select Advanced > Device role settings. The Device Role Settings dialog appears.
2 Click Add. The Role Settings Editor dialog appears.
3 Configure the new device role. When you are done, click OK. The Role Settings Editor dialog closes.
4
Duplicating device roles
To duplicate an existing device role:
1 From the Discovery console, select Advanced > Device role settings. The Device Role Settings dialog appears.
2 Select a device role, then click the gear icon ( ). A menu appears.
3 Select Duplicate selected role from the menu. A copy of the selected role is added to the list and selected.
4 To modify it, click Configure. The Role Settings Editor dialog appears.
5 Modify the device role. When you are done, click OK. The Role Settings Editor dialog closes.
Using WhatsUp Gold 14.4
73
Modifying device roles
To modify an existing device role:
1 From the Discovery console, select Advanced > Device role settings. The Device Role Settings dialog appears.
2 Select a device role, then click Configure. The Role Settings Editor dialog appears.
3 Modify the device role. When you are done, click OK. The Role Settings Editor dialog closes.
Enabling or disabling device roles
To enable/disable a device role:
1 From the Discovery console, select Advanced > Device role settings. The Device Role Settings dialog appears.
2 Select a device role, then click the gear icon ( ). A menu appears.
3 If the device role is disabled, select Enable selected role. If the device role is enabled, select Disable selected role. The device role's status is immediately updated in the list.
Restoring a device role to its original settings
To restore a default device role to its original settings:
Note: Only default device roles can be restored.
1 From the Discovery console, select Advanced > Device role settings. The Device Role Settings dialog appears.
2 Select a device role, then click the gear icon ( ). A menu appears.
3 Select Restore selected role to factory defaults. A confirmation dialog appears.
4 To restore the device role to its default settings, select Yes. The device role is restored to its original settings.
74
Using Administrative Features
CHAPTER 8
Managing Users
In This Chapter
About user accounts ......................................................................................... 74
About user rights ................................................................................................ 77
About device group access rights ................................................................ 80
About user accounts User accounts in WhatsUp Gold define a person's role and determine what actions the person can perform.
Default user accounts There are two default user accounts:
1 Administrator account. The Administrator account is given all user rights, including Manage Users, which grants the the right to create and edit user accounts. The Administrator is also given all group access rights, so that when enabled, this account will be able to view and edit devices in all device groups.
2 Guest account. The Guest account allows people to see the application without giving them the ability to modify any settings. By default, all user rights and all group access rights are disabled for this account. This limits the account to only seeing a limited number of things in the application. The Administrator (or anyone else with Manage User rights) can modify the Guest account rights using the Manage Users dialog.
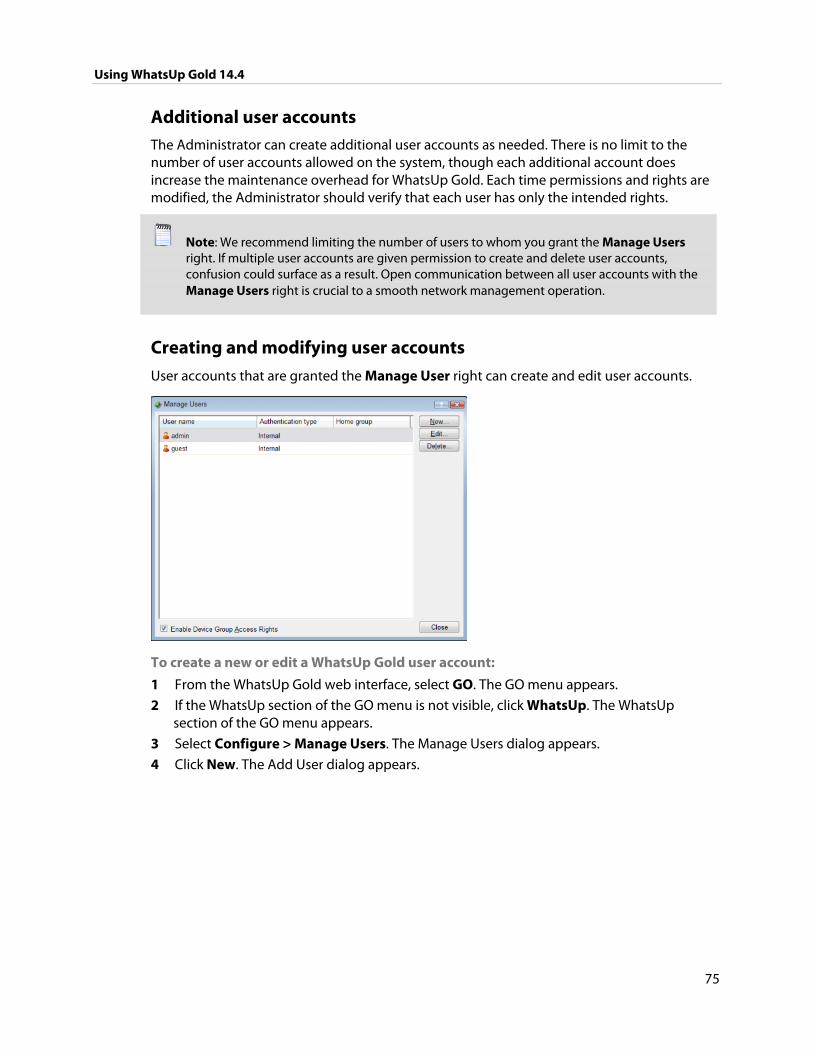
Using WhatsUp Gold 14.4
75
Additional user accounts The Administrator can create additional user accounts as needed. There is no limit to the number of user accounts allowed on the system, though each additional account does increase the maintenance overhead for WhatsUp Gold. Each time permissions and rights are modified, the Administrator should verify that each user has only the intended rights.
Note: We recommend limiting the number of users to whom you grant the Manage Users right. If multiple user accounts are given permission to create and delete user accounts, confusion could surface as a result. Open communication between all user accounts with the Manage Users right is crucial to a smooth network management operation.
Creating and modifying user accounts
User accounts that are granted the Manage User right can create and edit user accounts.
To create a new or edit a WhatsUp Gold user account:
1 From the WhatsUp Gold web interface, select GO. The GO menu appears.
2 If the WhatsUp section of the GO menu is not visible, click WhatsUp. The WhatsUp section of the GO menu appears.
3 Select Configure > Manage Users. The Manage Users dialog appears.
4 Click New. The Add User dialog appears.
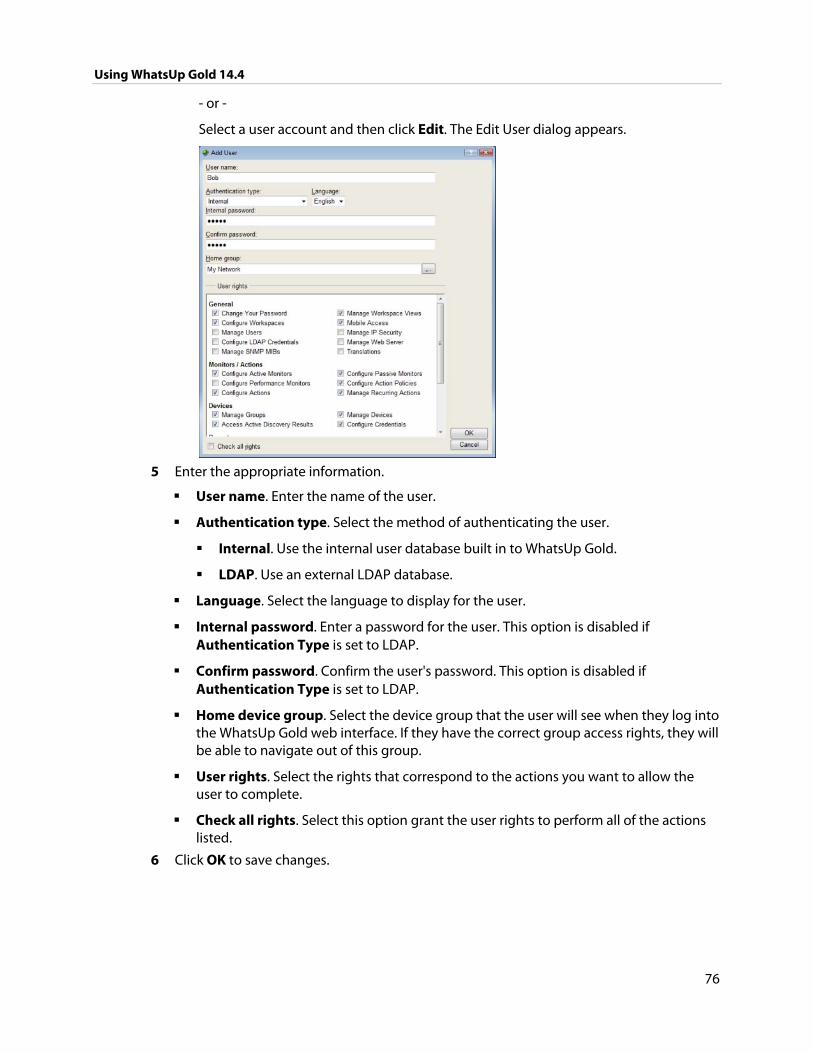
Using WhatsUp Gold 14.4
76
- or -
Select a user account and then click Edit. The Edit User dialog appears.
5 Enter the appropriate information.
User name. Enter the name of the user.
Authentication type. Select the method of authenticating the user.
Internal. Use the internal user database built in to WhatsUp Gold.
LDAP. Use an external LDAP database.
Language. Select the language to display for the user.
Internal password. Enter a password for the user. This option is disabled if Authentication Type is set to LDAP.
Confirm password. Confirm the user's password. This option is disabled if Authentication Type is set to LDAP.
Home device group. Select the device group that the user will see when they log into the WhatsUp Gold web interface. If they have the correct group access rights, they will be able to navigate out of this group.
User rights. Select the rights that correspond to the actions you want to allow the user to complete.
Check all rights. Select this option grant the user rights to perform all of the actions listed.
6 Click OK to save changes.
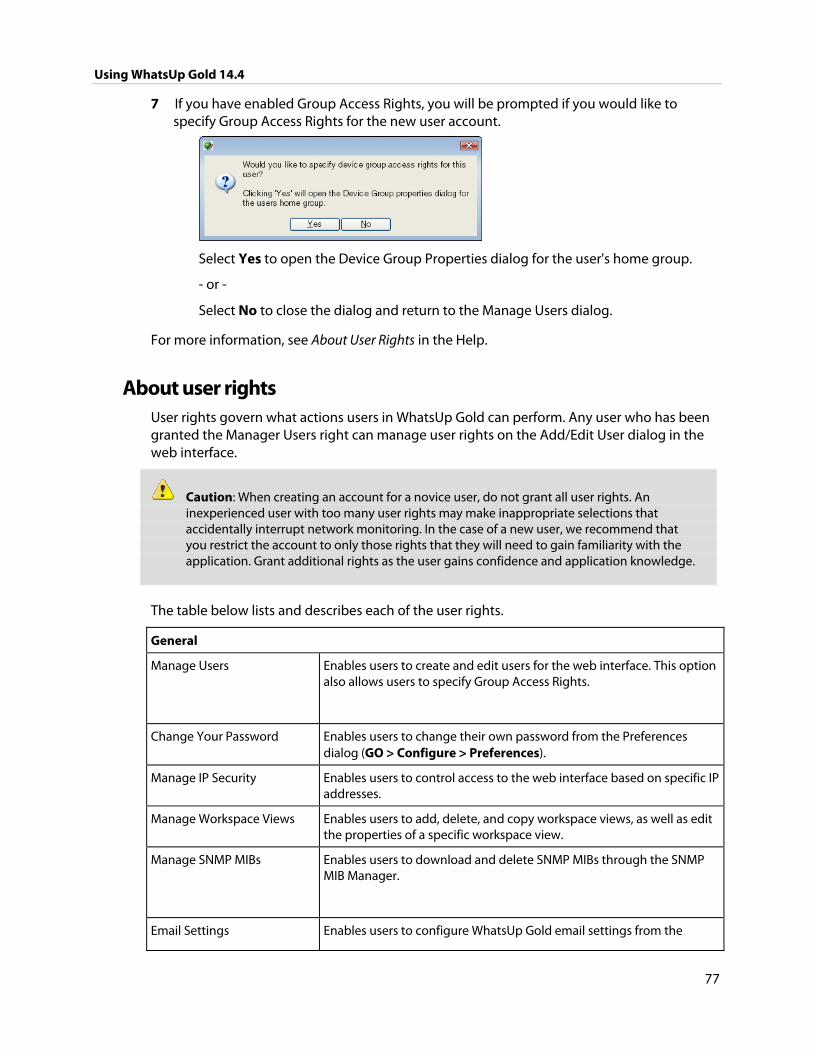
Using WhatsUp Gold 14.4
77
7 If you have enabled Group Access Rights, you will be prompted if you would like to specify Group Access Rights for the new user account.
Select Yes to open the Device Group Properties dialog for the user's home group.
- or -
Select No to close the dialog and return to the Manage Users dialog.
For more information, see About User Rights in the Help.
About user rights User rights govern what actions users in WhatsUp Gold can perform. Any user who has been granted the Manager Users right can manage user rights on the Add/Edit User dialog in the web interface.
Caution: When creating an account for a novice user, do not grant all user rights. An inexperienced user with too many user rights may make inappropriate selections that accidentally interrupt network monitoring. In the case of a new user, we recommend that you restrict the account to only those rights that they will need to gain familiarity with the application. Grant additional rights as the user gains confidence and application knowledge.
The table below lists and describes each of the user rights.
General
Manage Users
Enables users to create and edit users for the web interface. This option also allows users to specify Group Access Rights.
Change Your Password Enables users to change their own password from the Preferences dialog (GO > Configure > Preferences).
Manage IP Security Enables users to control access to the web interface based on specific IP addresses.
Manage Workspace Views Enables users to add, delete, and copy workspace views, as well as edit the properties of a specific workspace view.
Manage SNMP MIBs
Enables users to download and delete SNMP MIBs through the SNMP MIB Manager.
Email Settings Enables users to configure WhatsUp Gold email settings from the
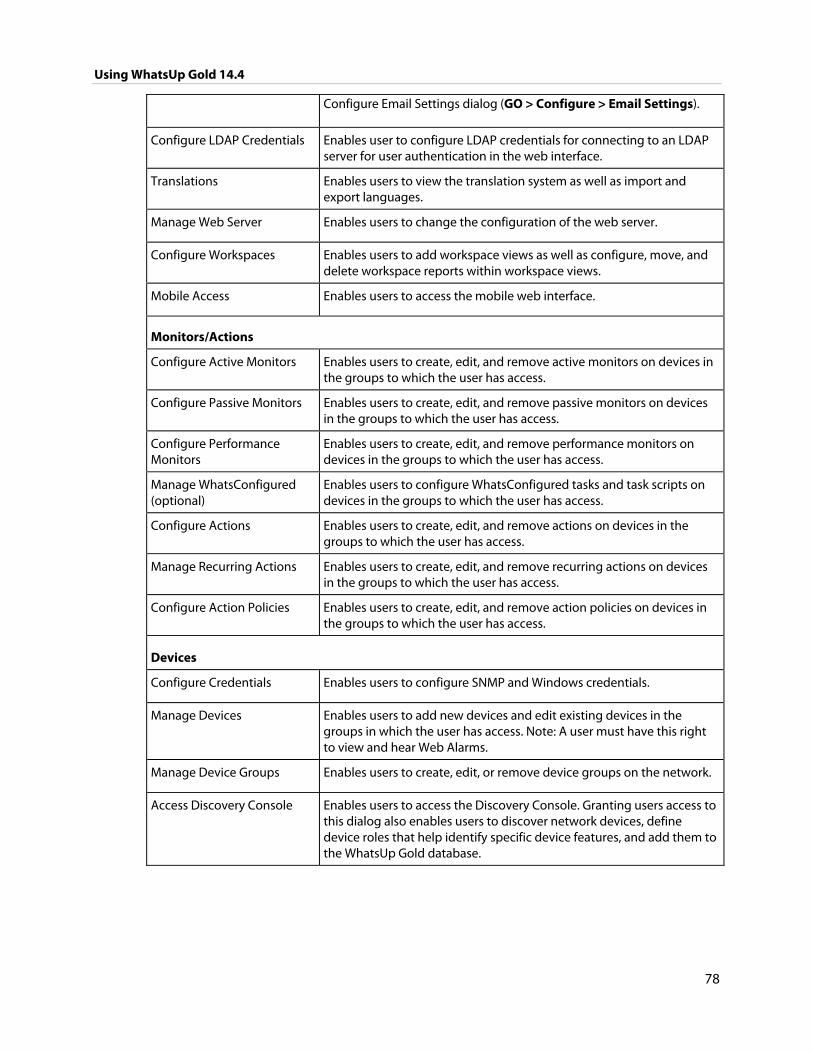
Using WhatsUp Gold 14.4
78
Configure Email Settings dialog (GO > Configure > Email Settings).
Configure LDAP Credentials Enables user to configure LDAP credentials for connecting to an LDAP server for user authentication in the web interface.
Translations Enables users to view the translation system as well as import and export languages.
Manage Web Server Enables users to change the configuration of the web server.
Configure Workspaces Enables users to add workspace views as well as configure, move, and delete workspace reports within workspace views.
Mobile Access Enables users to access the mobile web interface.
Monitors/Actions
Configure Active Monitors Enables users to create, edit, and remove active monitors on devices in the groups to which the user has access.
Configure Passive Monitors Enables users to create, edit, and remove passive monitors on devices in the groups to which the user has access.
Configure Performance Monitors
Enables users to create, edit, and remove performance monitors on devices in the groups to which the user has access.
Manage WhatsConfigured (optional)
Enables users to configure WhatsConfigured tasks and task scripts on devices in the groups to which the user has access.
Configure Actions Enables users to create, edit, and remove actions on devices in the groups to which the user has access.
Manage Recurring Actions Enables users to create, edit, and remove recurring actions on devices in the groups to which the user has access.
Configure Action Policies Enables users to create, edit, and remove action policies on devices in the groups to which the user has access.
Devices
Configure Credentials Enables users to configure SNMP and Windows credentials.
Manage Devices Enables users to add new devices and edit existing devices in the groups in which the user has access. Note: A user must have this right to view and hear Web Alarms.
Manage Device Groups Enables users to create, edit, or remove device groups on the network.
Access Discovery Console Enables users to access the Discovery Console. Granting users access to this dialog also enables users to discover network devices, define device roles that help identify specific device features, and add them to the WhatsUp Gold database.
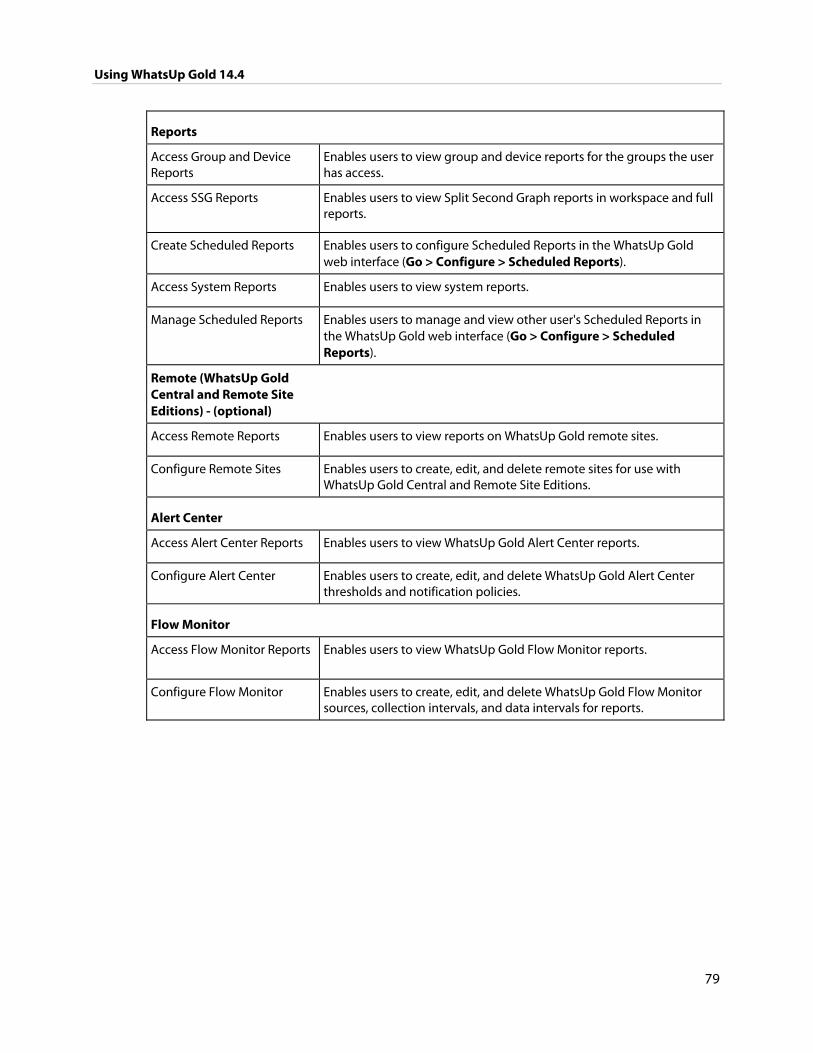
Using WhatsUp Gold 14.4
79
Reports
Access Group and Device Reports
Enables users to view group and device reports for the groups the user has access.
Access SSG Reports Enables users to view Split Second Graph reports in workspace and full reports.
Create Scheduled Reports Enables users to configure Scheduled Reports in the WhatsUp Gold web interface (Go > Configure > Scheduled Reports).
Access System Reports Enables users to view system reports.
Manage Scheduled Reports Enables users to manage and view other user's Scheduled Reports in the WhatsUp Gold web interface (Go > Configure > Scheduled Reports).
Remote (WhatsUp Gold Central and Remote Site Editions) - (optional)
Access Remote Reports Enables users to view reports on WhatsUp Gold remote sites.
Configure Remote Sites Enables users to create, edit, and delete remote sites for use with WhatsUp Gold Central and Remote Site Editions.
Alert Center
Access Alert Center Reports Enables users to view WhatsUp Gold Alert Center reports.
Configure Alert Center Enables users to create, edit, and delete WhatsUp Gold Alert Center thresholds and notification policies.
Flow Monitor
Access Flow Monitor Reports Enables users to view WhatsUp Gold Flow Monitor reports.
Configure Flow Monitor Enables users to create, edit, and delete WhatsUp Gold Flow Monitor sources, collection intervals, and data intervals for reports.
Using WhatsUp Gold 14.4
80
About Remote User Rights
When using WhatsUp Gold Distributed or MSP editions, make sure that Access Remote Reports is selected on the Central Site for each user that you want to provide access to the Remote Site reports. Also, make sure that you select Configure Remote Sites if you want a user to be able to access and change options in the Configure Remote Sites dialog. This dialog provides a list of all of the Remote Sites that have connected to the Central Site. You can view and edit two important settings in this dialog:
Accept remote site connection. Allows authorized users to enable or disable accepting connections from Remote Sites. This option is checked by default. The primary reason to clear the option is if you need to disable the Central Site from accepting any connections from this Remote Site. For example, this option could be helpful if one of the Remote Sites connected to the Central Site has an unusual amount of activity and is using too much bandwidth between sites. This option lets you temporarily disable a single Central Site from accepting remote site connections until you determine what the problem is.
Local device. Allows authorized users to select a local device to associate with the Remote Site. Click the browse (...) button to select a device. This device is often the computer that is running the WhatsUp software on a Remote Site. Associating a local device allows you to view the device status from the Remote Site, keeping you informed about the connection status with the Remote Site. It also provides easy access to the Network Tools for the local device you selected.
About device group access rights Device group access rights enable WhatsUp Gold users to see or make changes to specific groups and devices. These rights can be enabled or disabled by the administrator and are disabled by default.
Device group access rights are useful when users need to view and edit only those groups that matter to them, as would be the case with a large network with multiple network administrators. Device group access rights allow an administrator to grant each user rights to only the devices on the network for which that user is responsible.
Types of device group access rights There are four types of device group access rights:
1 Group Read. This right allows users to view groups and devices in the selected group. This right allows users to see the group's map and device list. Group-level reports are not affected by group access rights but are affected by user rights.
2 Group Write. This right allows users to edit group properties and add, edit, and delete devices and subgroups within the selected group.
3 Device Read. This right allows users to view the device properties of all devices within the selected group. Device-level reports are not affected by group access rights but can are affected by user rights.
Using WhatsUp Gold 14.4
81
4 Device Write. This right allows users to edit the device properties of any device within the selected group and to delete the device from the group.
Note: To add a device to a group, a user must have Group Write rights to the group. Device Write rights allow users to modify and delete existing rights, but do not allow them to add new devices to the group.
Tip: When enabled, group access rights are applied throughout WhatsUp Gold. Device pickers, group pickers, and group views all respect what a user account is granted permission to view and edit. Reports are not affected by group access rights but are affected by user rights.
The following is a list of operations and the group access rights that must be assigned for the user to perform that task:
List and Map in the Group Views menu require Group Read access.
Create Group and Group Properties in the Group Operations menu require Group Read and Group Write access.
Copy Group requires Group Read in the source group, and Group Read and Group Write in the destination group. (Permissions to groups and sub-groups are copied, not inherited from the new parent).
Move Group requires Group Read and Group Write in both the source and the destination groups. (Permissions of the group and sub-groups remain the same.)
Delete Group requires Group Read, Group Write, Device Read, and Device Write recursively. (Device Read Write may not be required if the group is empty).
Create Device requires Group Read, Group Write, Device Read, and Device Write. If the device already exists in other group(s), you must also have Group Read, Group Write, Device Read, and Device Write in one or more of those groups.
Copy Device requires Group Read in the source group and Group Read and Group Write in the destination group. The level of device permissions must be the same in both groups. Downgrade from Device Read and Device Write to Device Read is also permitted.
Move Device requires Group Read and Group Write in both the source and the destination groups. The level of device permissions must be the same in both groups. Downgrade from Device Read and Device Write to Device Read is also permitted.
Viewing Device Properties requires Device Read.
Modifying Device Properties, Bulk Field Change, and Acknowledgement require Device Read and Device Write.
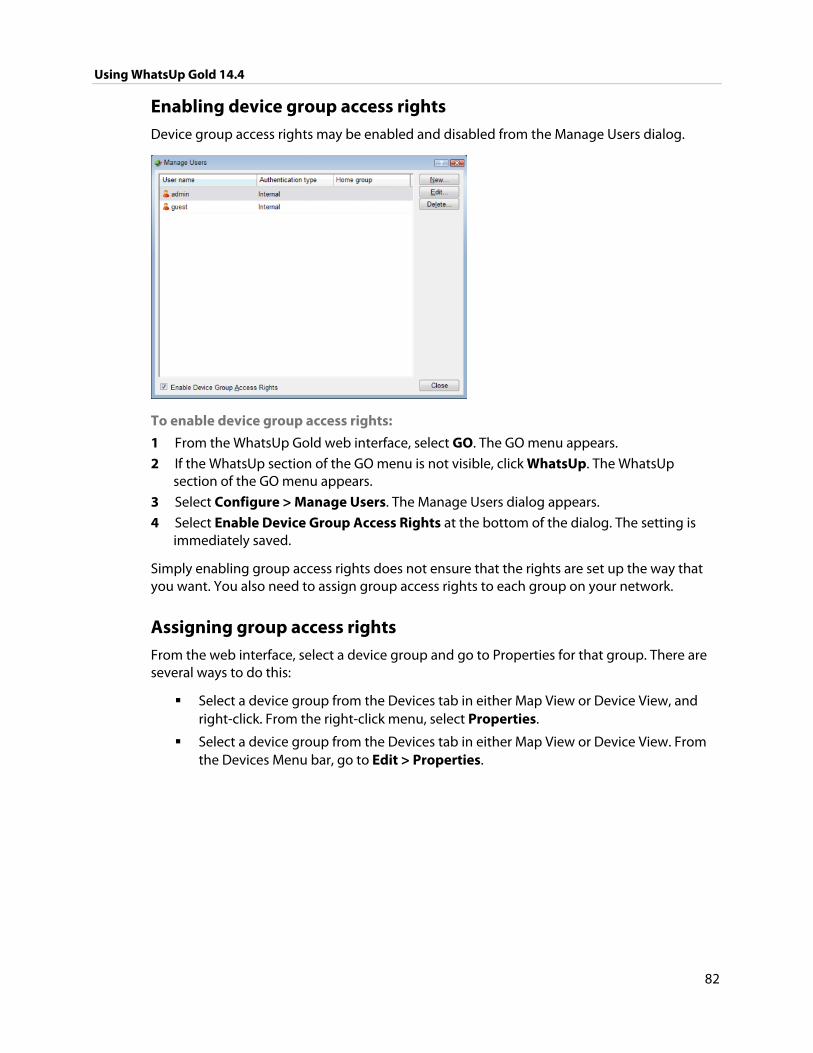
Using WhatsUp Gold 14.4
82
Enabling device group access rights Device group access rights may be enabled and disabled from the Manage Users dialog.
To enable device group access rights:
1 From the WhatsUp Gold web interface, select GO. The GO menu appears.
2 If the WhatsUp section of the GO menu is not visible, click WhatsUp. The WhatsUp section of the GO menu appears.
3 Select Configure > Manage Users. The Manage Users dialog appears.
4 Select Enable Device Group Access Rights at the bottom of the dialog. The setting is immediately saved.
Simply enabling group access rights does not ensure that the rights are set up the way that you want. You also need to assign group access rights to each group on your network.
Assigning group access rights From the web interface, select a device group and go to Properties for that group. There are several ways to do this:
Select a device group from the Devices tab in either Map View or Device View, and right-click. From the right-click menu, select Properties.
Select a device group from the Devices tab in either Map View or Device View. From the Devices Menu bar, go to Edit > Properties.
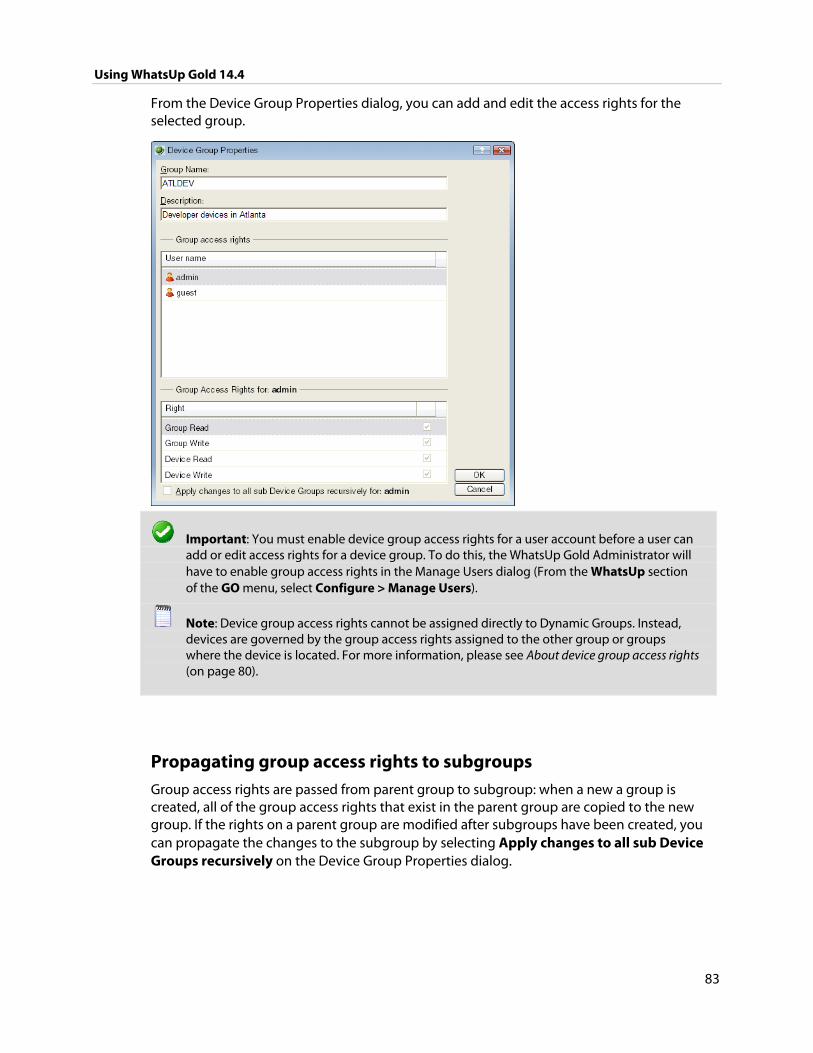
Using WhatsUp Gold 14.4
83
From the Device Group Properties dialog, you can add and edit the access rights for the selected group.
Important: You must enable device group access rights for a user account before a user can add or edit access rights for a device group. To do this, the WhatsUp Gold Administrator will have to enable group access rights in the Manage Users dialog (From the WhatsUp section of the GO menu, select Configure > Manage Users).
Note: Device group access rights cannot be assigned directly to Dynamic Groups. Instead, devices are governed by the group access rights assigned to the other group or groups where the device is located. For more information, please see About device group access rights (on page 80).
Propagating group access rights to subgroups Group access rights are passed from parent group to subgroup: when a new a group is created, all of the group access rights that exist in the parent group are copied to the new group. If the rights on a parent group are modified after subgroups have been created, you can propagate the changes to the subgroup by selecting Apply changes to all sub Device Groups recursively on the Device Group Properties dialog.
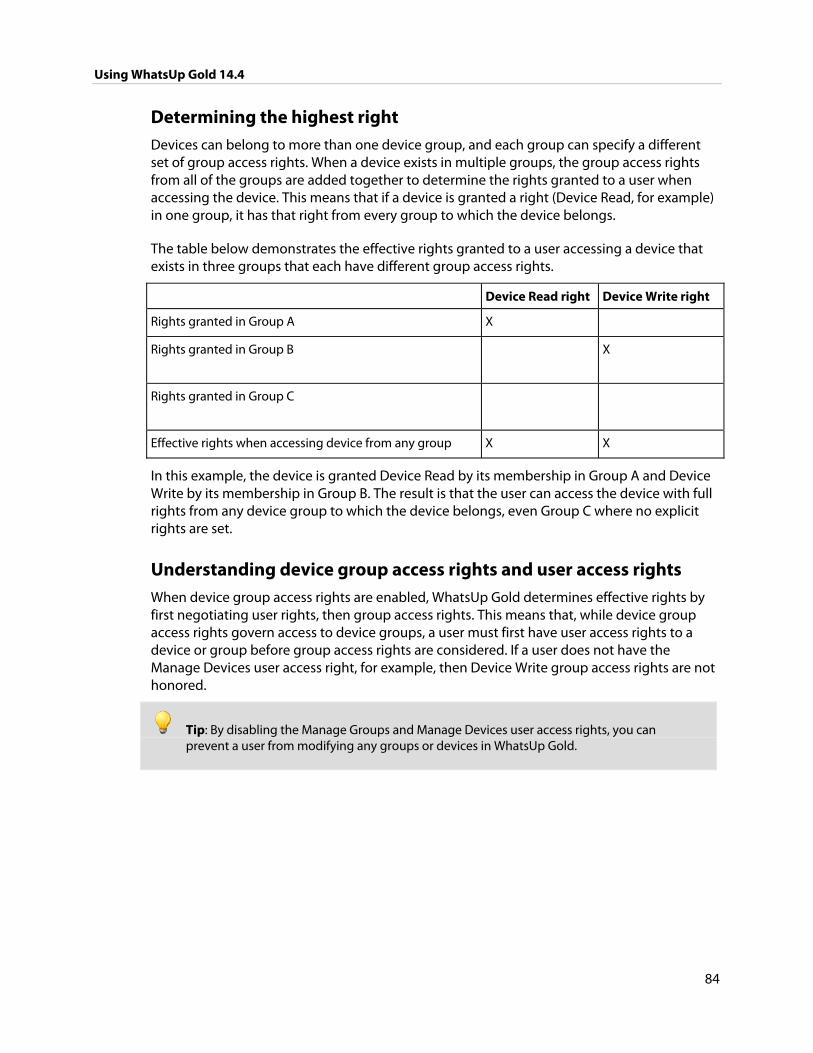
Using WhatsUp Gold 14.4
84
Determining the highest right Devices can belong to more than one device group, and each group can specify a different set of group access rights. When a device exists in multiple groups, the group access rights from all of the groups are added together to determine the rights granted to a user when accessing the device. This means that if a device is granted a right (Device Read, for example) in one group, it has that right from every group to which the device belongs.
The table below demonstrates the effective rights granted to a user accessing a device that exists in three groups that each have different group access rights.
Device Read right Device Write right
Rights granted in Group A X
Rights granted in Group B X
Rights granted in Group C
Effective rights when accessing device from any group X X
In this example, the device is granted Device Read by its membership in Group A and Device Write by its membership in Group B. The result is that the user can access the device with full rights from any device group to which the device belongs, even Group C where no explicit rights are set.
Understanding device group access rights and user access rights When device group access rights are enabled, WhatsUp Gold determines effective rights by first negotiating user rights, then group access rights. This means that, while device group access rights govern access to device groups, a user must first have user access rights to a device or group before group access rights are considered. If a user does not have the Manage Devices user access right, for example, then Device Write group access rights are not honored.
Tip: By disabling the Manage Groups and Manage Devices user access rights, you can prevent a user from modifying any groups or devices in WhatsUp Gold.
Using WhatsUp Gold 14.4
85
About group access rights and users' home groups Users are given Group Read rights for their Home group by default. If Group Read rights are removed from a user's home group, the user cannot access the Device List until the Group Read right is restored or the user's Home group is changed to a group for which the user has Group Read rights.
Note: Changing a user's Home group does not change the user's Group Access rights for original Home group. Be careful to prevent unintentionally granting access to a device group to which you do not want a user to have access.
For example, an administrator creates a new user account and leaves the Home group as the default My Network. The new user account automatically receives Group Read rights to My Network. At a later date, the administrator changes the user account to use a subgroup as the user's Home group. Unless the administrator deliberately removes the Group Read right from My Network, the user continues to have Group Read rights to My Network, potentially granting the user more visibility into WhatsUp Gold than the administrator intended. Changing the user's Home group is not enough to restrict what he or she can see in WhatsUp Gold.
About group access rights and dynamic device groups Group access rights cannot be assigned to dynamic device groups. However, every device within a dynamic device group belongs to at least one other group. Therefore, when a user accesses a device accessed through a dynamic device group, the rights he or she is granted to the device are equal to the sum of the rights granted in each of the groups to which the device belongs.
For more information, see Determining the highest right (on page 83).
86
CHAPTER 9
Using the Program Options
In This Chapter
Enabling the polling engine ........................................................................... 86
Enabling actions .................................................................................................. 86
Enabling performance monitors ................................................................... 87
Enabling FIPS 140-2 mode .............................................................................. 87
Enabling WhatsVirtual event collection ..................................................... 90
Enabling the WhatsUp Gold web server .................................................... 91
Changing the date and time format ............................................................ 91
Changing how long report data is stored.................................................. 92
Changing the device state colors or icons ................................................ 93
Changing clock/regional preferences ......................................................... 95
Enabling the polling engine To enable or disable the WhatsUp polling engine:
1 From the console main menu, click Configure > Program Options. 2 Click the General icon.
3 Select Enable polling engine to turn on polling. Clear the selection to turn polling off.
4 Click OK to save changes.
Tip: In the bottom right corner of the WhatsUp Gold console, the Polling icon shows if the engine is active.
Using WhatsUp Gold 14.4
87
Enabling actions To enable or disable the WhatsUp Gold actions:
1 From the console main menu, click Configure > Program Options. 2 Click the General icon.
3 Select Enable actions to enable actions. Clear the selection to disable all actions.
Important: If you disable WhatsUp Gold actions, any configured actions or action policies do not run.
4 Click OK to save changes.
Enabling performance monitors To enable or disable WhatsUp Gold performance monitors:
1 From the console main menu, click Configure > Program Options. 2 Click the General icon.
3 Select Enable performance monitors to enable WhatsUp Gold performance monitors. Clear the selection to disable all performance monitors.
Important: If you disable performance monitors, WhatsUp Gold ceases to gather device data using any of the default or custom performance monitors that exist in the Performance Monitor Library.
4 Click OK to save changes.
Enabling FIPS 140-2 mode There are several important things to take into consideration if you plan to operate WhatsUp Gold in FIPS 140-2 mode:
WhatsUp Gold does not recommend that you enable FIPS if you plan to use SNMPv1, SNMPv2, or SNMPv3 credentials that do not use encryption or authentication.
WhatsUp Gold will detect a FIPS compliant operating system and will place the system in FIPS 140-2 mode automatically upon initial start-up.
WhatsUp Gold recommends that SSHv1 not be used on a server or device with associated SSH monitors or SSH actions, because WhatsUp Gold does not support communications using SSHv1.
WhatsUp Gold recommends that SSHv2 only be used with FIPS 140-2 certified algorithms, because WhatsUp Gold in FIPS 140-2 mode does not support communications using non-certified algorithms.
SNMPv3 credentials using MD5 and DES56 are prohibited; you are unable to enable FIPS if SNMPv3 credentials using MD5 exist in the Credentials Library (on page 100). You must modify or remove such credentials in order to enable FIPS.

Using WhatsUp Gold 14.4
88
To enable or disable FIPS 140-2 mode:
1 From the console main menu, click Configure > Program Options. 2 Click the General icon.
3 Select Operate in FIPS 140-2 mode to enable FIPS 140-2 mode. Clear the selection to stop WhatsUp Gold from operating in FIPS 140-2 mode.
Note: WhatsUp Gold will automatically enable FIPS 140-2 mode when it detects that it is operating on a FIPS-compliant operating system.
Note: This option is disabled if any of the configured credentials in the Credentials Library are not FIPS-compliant. In order for this option to be available, you must go to the Credentials Library and either modify or remove the non-compliant credentials.
4 Click OK to save changes.
About operating WhatsUp Gold in FIPS 140-2 mode There are several important things to take into consideration if you plan to operate WhatsUp Gold in FIPS 140-2 mode:
WhatsUp Gold does not recommend that you enable FIPS if you plan to use SNMPv1, SNMPv2, or SNMPv3 credentials that do not use encryption or authentication.
WhatsUp Gold will detect a FIPS compliant operating system and will place the system in FIPS 140-2 mode automatically upon initial start-up.
WhatsUp Gold recommends that SSHv2 only be used with FIPS 140-2 certified algorithms, because WhatsUp Gold in FIPS 140-2 mode does not support communications using non-certified algorithms.
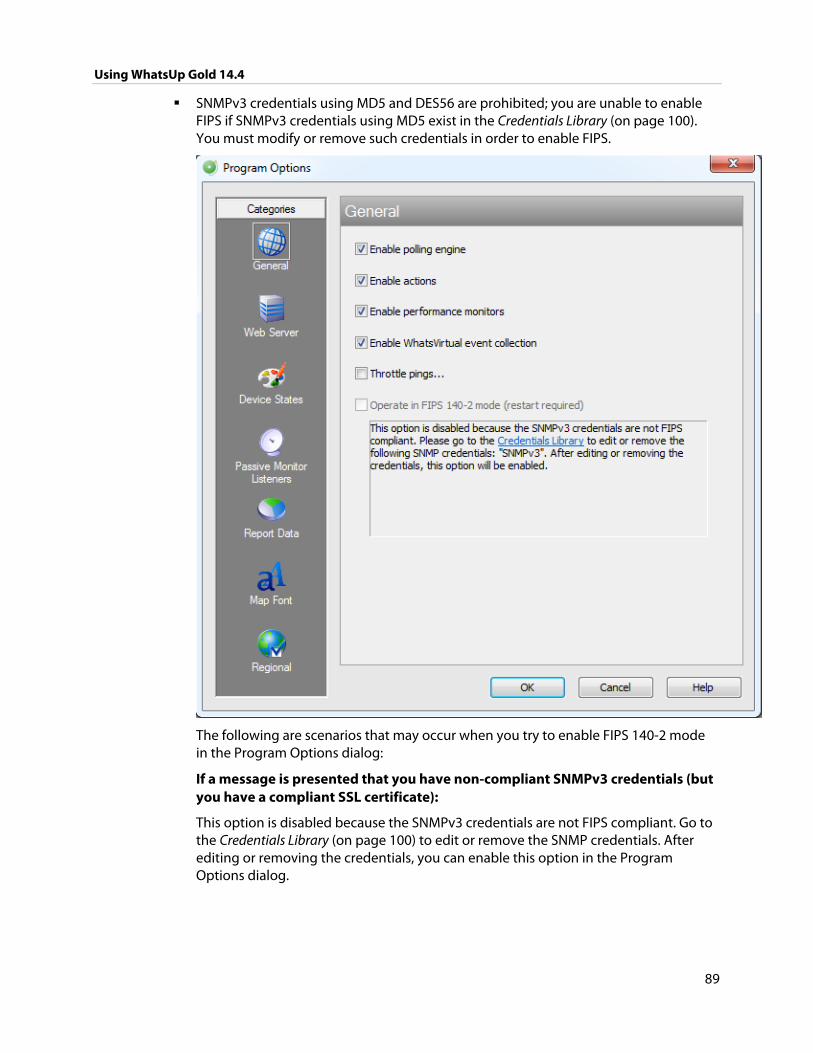
Using WhatsUp Gold 14.4
89
SNMPv3 credentials using MD5 and DES56 are prohibited; you are unable to enable FIPS if SNMPv3 credentials using MD5 exist in the Credentials Library (on page 100). You must modify or remove such credentials in order to enable FIPS.
The following are scenarios that may occur when you try to enable FIPS 140-2 mode in the Program Options dialog:
If a message is presented that you have non-compliant SNMPv3 credentials (but you have a compliant SSL certificate):
This option is disabled because the SNMPv3 credentials are not FIPS compliant. Go to the Credentials Library (on page 100) to edit or remove the SNMP credentials. After editing or removing the credentials, you can enable this option in the Program Options dialog.
Using WhatsUp Gold 14.4
90
If a message is presented that you have non-compliant SSL certificate (but you have a compliant SNMP credentials):
This option is disabled because the SSL certificate is not FIPS compliant. Replace your current SSL certificate with a FIPS-compliant SSL certificate. To automatically replace your current SSL certificate with the default FIPS-compliant SSL certificate, click the link in the on-screen messsage. After replacing the SSL certificate, you can enable this option in the Program Options dialog.
If a message is presented that you have non-compliant SNMPv3 credentials and a non-compliant SSL certificate:
This option is disabled because the SNMPv3 credentials and the SSL certificate are not FIPS compliant. Go to the Credentials Library (on page 100) to edit or remove the SNMP credentials. Also, replace your current SSL certificate with a FIPS-compliant SSL certificate. To automatically replace your current SSL certificate with the default WhatsUp Gold FIPS-compliant SSL certificate, click the link in the on-screen message. After editing or removing the credentials and replacing the SSL certificate, you can enable this option in the Program Options dialog.
If a message is presented that confirms you have used the WhatsUp Gold default SSL certificate:
You have selected to use the default FIPS-compliant SSL certificate in WhatsUp Gold. Your certificate password will not be backed up automatically. Make sure you back up the SSL certificate password before completing this action. The current SSL certificate will be backed up as server.crt.bak and server.key.bak.
For more information about SSL certificates in WhatsUp Gold, see About the WhatsUp Gold default SSL certificates.
For more information about the FIPS 140-2 specification, see the U.S. Department of Commerce documentation (http://www.whatsupgold.com/wug_USDOC_FIPS).
Enabling WhatsVirtual event collection To enable or disable WhatsVirtual event collection:
1 From the console main menu, click Configure > Program Options. 2 Click the General icon.
3 Select Enable WhatsVirtual event collection to enable the collection of events from all of the configured vCenter servers. Clear the selection to disable the collection of events.
Note: The Enable WhatsVirtual event collection option is selected by default, enabling event collection for all configured vCenter servers.
4 Click OK to save your changes, or click Cancel to discard your changes.
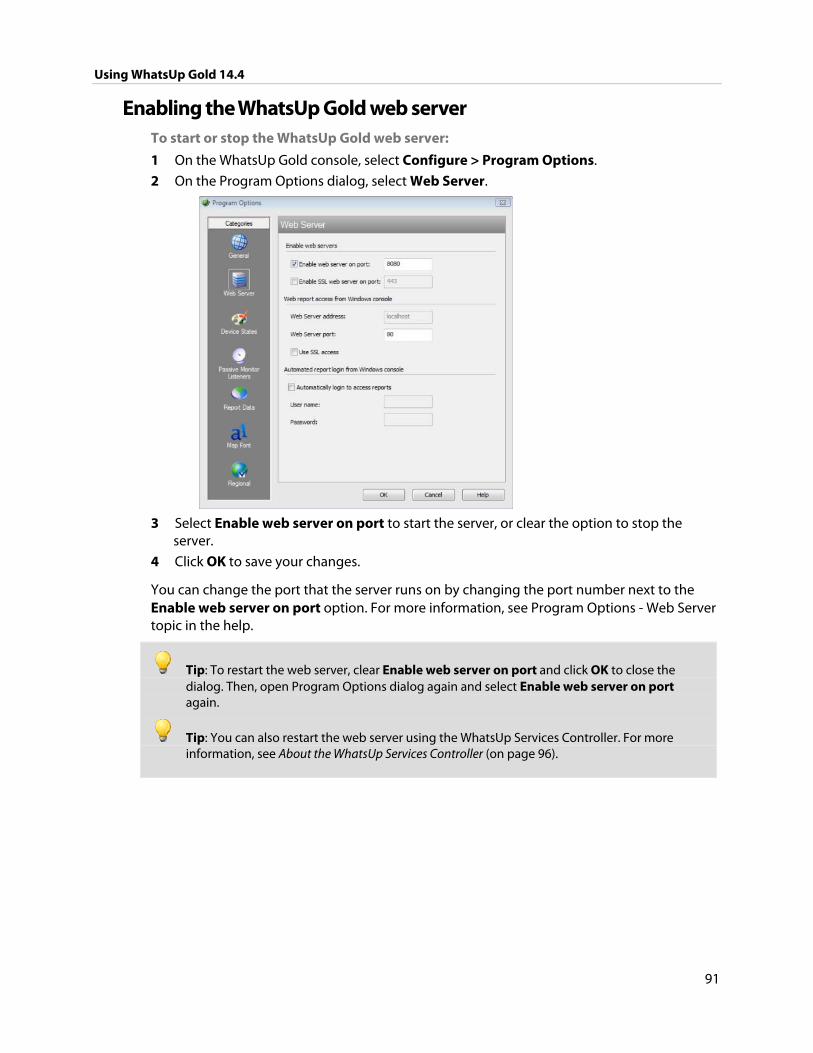
Using WhatsUp Gold 14.4
91
Enabling the WhatsUp Gold web server To start or stop the WhatsUp Gold web server:
1 On the WhatsUp Gold console, select Configure > Program Options.
2 On the Program Options dialog, select Web Server.
3 Select Enable web server on port to start the server, or clear the option to stop the
server.
4 Click OK to save your changes.
You can change the port that the server runs on by changing the port number next to the Enable web server on port option. For more information, see Program Options - Web Server topic in the help.
Tip: To restart the web server, clear Enable web server on port and click OK to close the dialog. Then, open Program Options dialog again and select Enable web server on port again.
Tip: You can also restart the web server using the WhatsUp Services Controller. For more information, see About the WhatsUp Services Controller (on page 96).
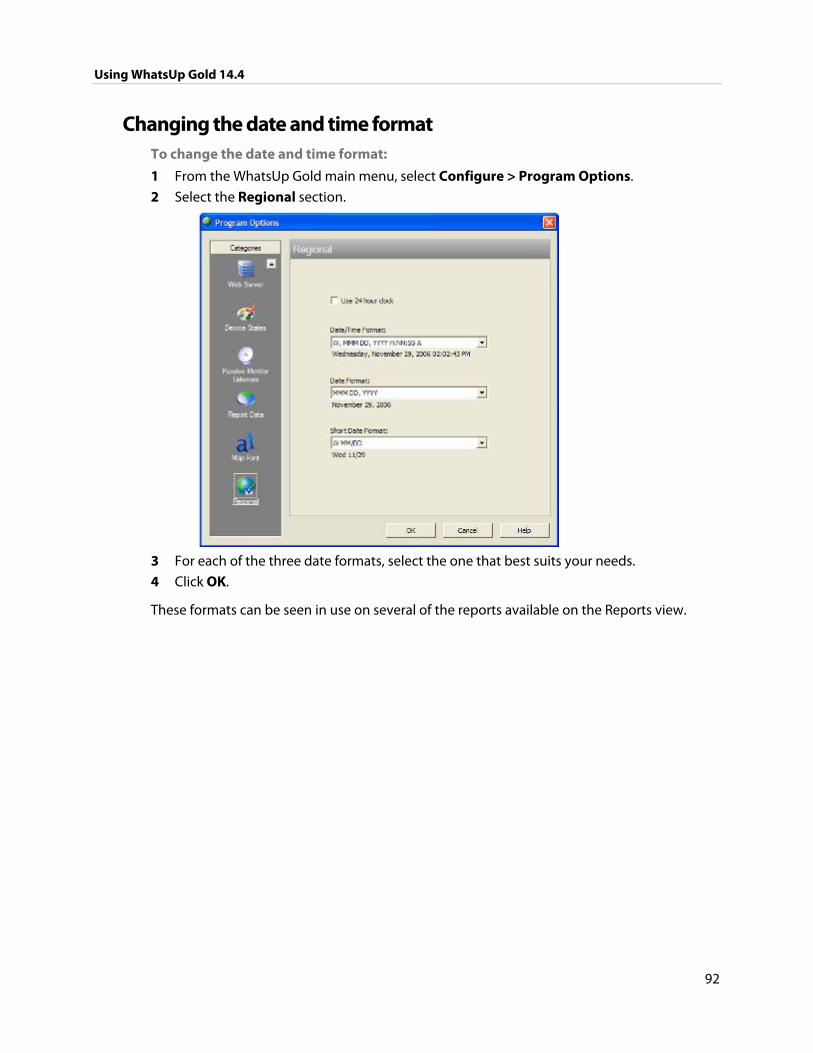
Using WhatsUp Gold 14.4
92
Changing the date and time format To change the date and time format:
1 From the WhatsUp Gold main menu, select Configure > Program Options.
2 Select the Regional section.
3 For each of the three date formats, select the one that best suits your needs.
4 Click OK.
These formats can be seen in use on several of the reports available on the Reports view.
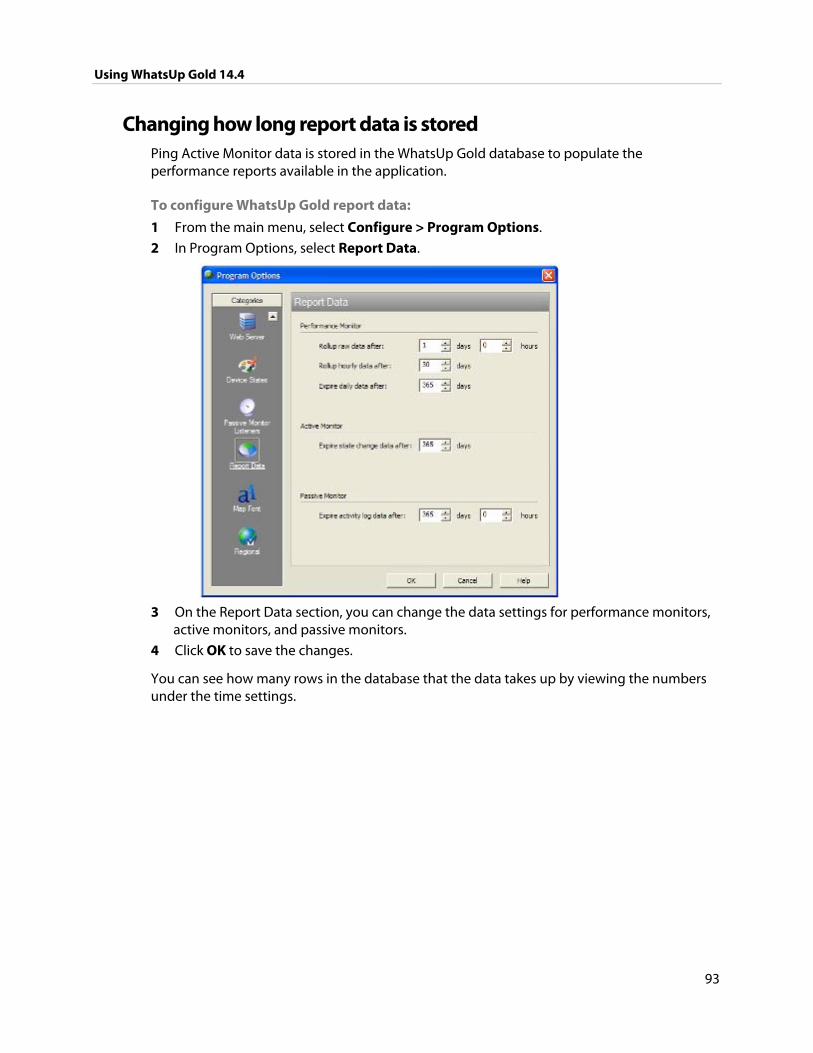
Using WhatsUp Gold 14.4
93
Changing how long report data is stored Ping Active Monitor data is stored in the WhatsUp Gold database to populate the performance reports available in the application.
To configure WhatsUp Gold report data:
1 From the main menu, select Configure > Program Options.
2 In Program Options, select Report Data.
3 On the Report Data section, you can change the data settings for performance monitors,
active monitors, and passive monitors.
4 Click OK to save the changes.
You can see how many rows in the database that the data takes up by viewing the numbers under the time settings.
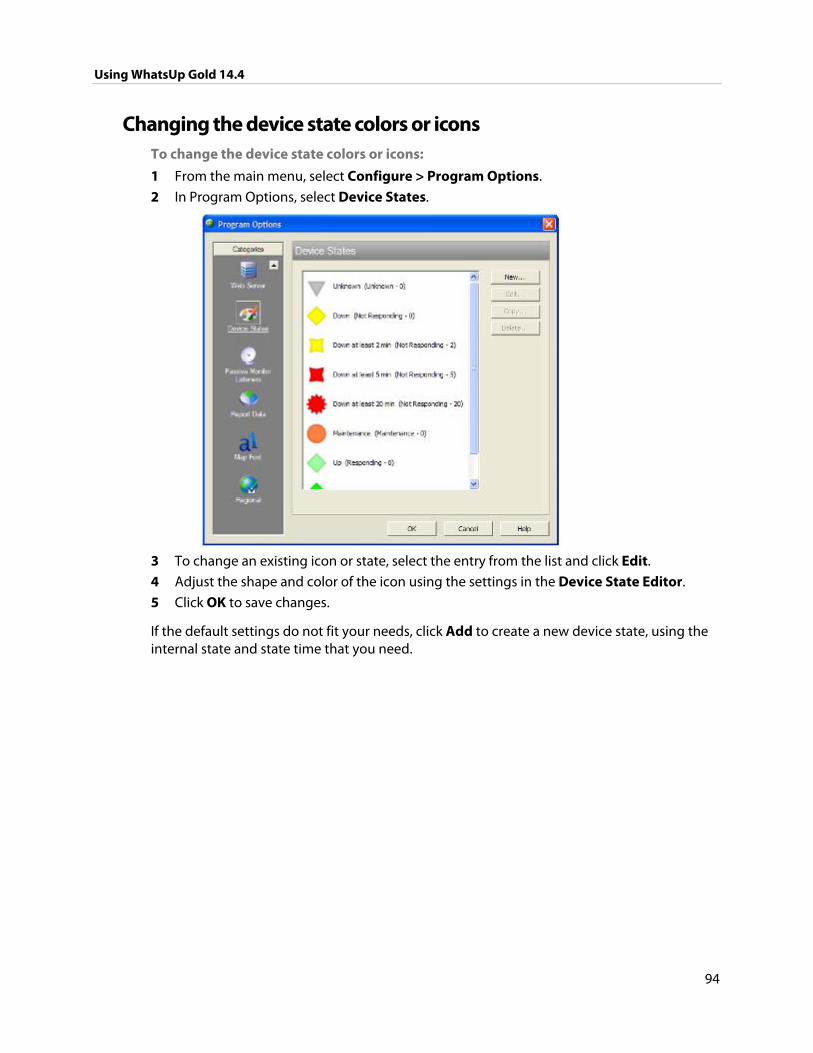
Using WhatsUp Gold 14.4
94
Changing the device state colors or icons To change the device state colors or icons:
1 From the main menu, select Configure > Program Options.
2 In Program Options, select Device States.
3 To change an existing icon or state, select the entry from the list and click Edit.
4 Adjust the shape and color of the icon using the settings in the Device State Editor.
5 Click OK to save changes.
If the default settings do not fit your needs, click Add to create a new device state, using the internal state and state time that you need.
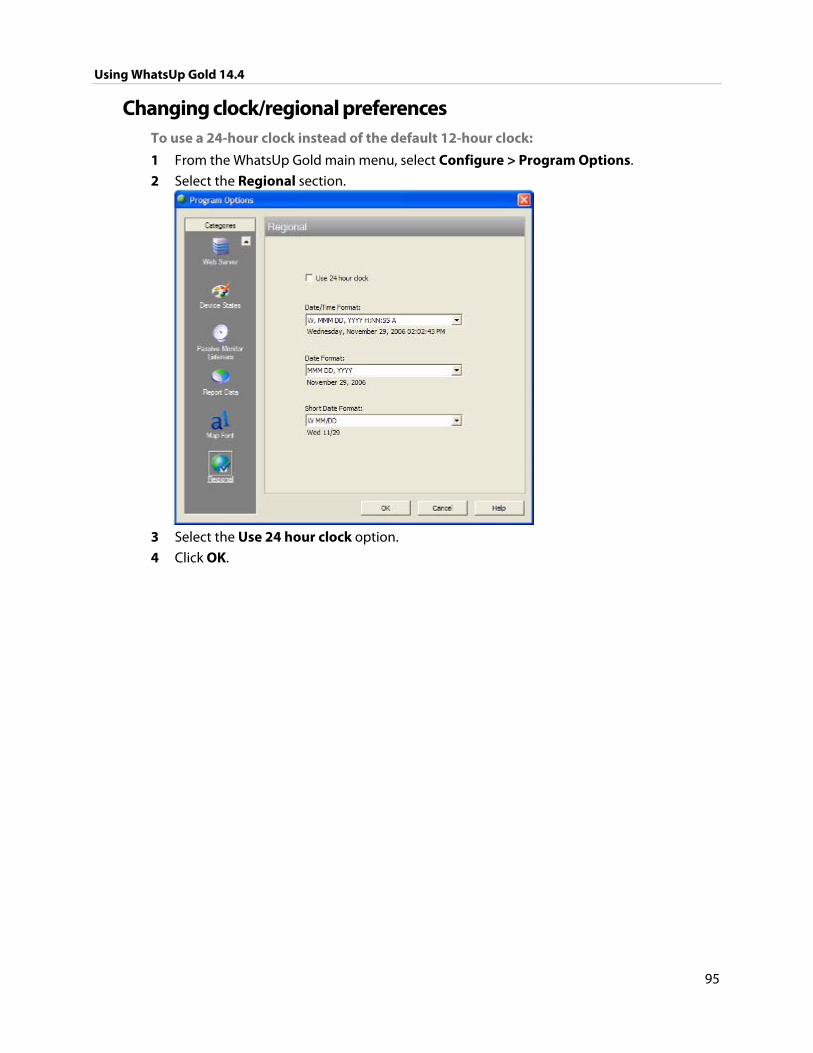
Using WhatsUp Gold 14.4
95
Changing clock/regional preferences To use a 24-hour clock instead of the default 12-hour clock:
1 From the WhatsUp Gold main menu, select Configure > Program Options.
2 Select the Regional section.
3 Select the Use 24 hour clock option.
4 Click OK.

96
CHAPTER 10
Using the WhatsUp Services Controller
In This Chapter
Managing Services using the WhatsUp Services Controller ............... 96
Managing Services using the WhatsUp Services Controller The WhatsUp Gold Services Controller application (NMServiceManager.exe) provides a single user interface to manage all Ipswitch WhatsUp Gold services. WhatsUp Gold services controller includes services that you can start, stop, or restart:
Note: Some services are optional. If the associated product is not licensed and enabled you may not be able to start and stop the service with the WhatsUp Services Controller dialog (Ipswitch Services Control Manager). Your license file determines whether or not you can access a plug-in. To update your license to purchase WhatsUp Gold Flow Monitor, VoIP plug-in, WhatsConnected, or WhatsConfigured, visit the MyIpswitch portal (http://www.myipswitch.com).
Polling Engine (nmservice.exe)
Flow Collector (bwcollector.net.exe)
Alert Center (alertcenterservice.exe)
Trivial File Transfer Protocol Server (TFTPservice.exe)
Whats Configured (networkconfigservice.exe)
Discovery (discoveryservice.exe)
Web Server (nmwebservice.exe)
Failover Manager (nmfailover.exe)
API (nmapi.exe)
Whats Connected Data Service (networkviewerdataservice.exe)
Whats Virtual Service (whatsvirtualservice.exe)
This application communicates with the Ipswitch Service Control Manager service (ServiceControlManager.exe) to issue start, stops, and restarts to the services used by WhatsUp Gold and its plug-in applications.
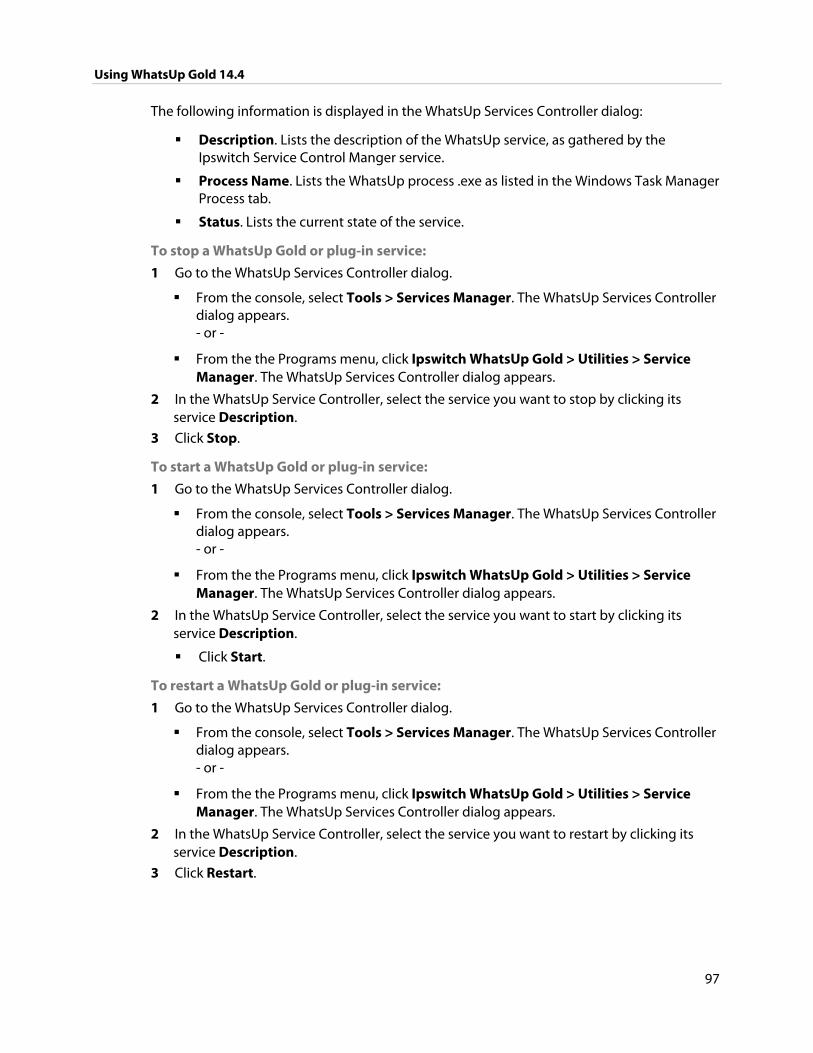
Using WhatsUp Gold 14.4
97
The following information is displayed in the WhatsUp Services Controller dialog:
Description. Lists the description of the WhatsUp service, as gathered by the Ipswitch Service Control Manger service.
Process Name. Lists the WhatsUp process .exe as listed in the Windows Task Manager Process tab.
Status. Lists the current state of the service.
To stop a WhatsUp Gold or plug-in service:
1 Go to the WhatsUp Services Controller dialog.
From the console, select Tools > Services Manager. The WhatsUp Services Controller dialog appears. - or -
From the the Programs menu, click Ipswitch WhatsUp Gold > Utilities > Service Manager. The WhatsUp Services Controller dialog appears.
2 In the WhatsUp Service Controller, select the service you want to stop by clicking its service Description.
3 Click Stop.
To start a WhatsUp Gold or plug-in service:
1 Go to the WhatsUp Services Controller dialog.
From the console, select Tools > Services Manager. The WhatsUp Services Controller dialog appears. - or -
From the the Programs menu, click Ipswitch WhatsUp Gold > Utilities > Service Manager. The WhatsUp Services Controller dialog appears.
2 In the WhatsUp Service Controller, select the service you want to start by clicking its service Description.
Click Start.
To restart a WhatsUp Gold or plug-in service:
1 Go to the WhatsUp Services Controller dialog.
From the console, select Tools > Services Manager. The WhatsUp Services Controller dialog appears. - or -
From the the Programs menu, click Ipswitch WhatsUp Gold > Utilities > Service Manager. The WhatsUp Services Controller dialog appears.
2 In the WhatsUp Service Controller, select the service you want to restart by clicking its service Description.
3 Click Restart.
98
Managing Devices
CHAPTER 11
About Device Basics
In This Chapter
Viewing network devices and data .............................................................. 98
Device overview .................................................................................................. 99
About the Device View ..................................................................................... 99
Using Credentials ............................................................................................. 100
Learning about the Device Properties ...................................................... 101
Adding a new device ....................................................................................... 114
Cloning a device ............................................................................................... 119
Using Device Groups ....................................................................................... 122
About Polling ..................................................................................................... 136
Using Acknowledgements ............................................................................ 145
Using Maps ......................................................................................................... 146
Creating custom context Menus ................................................................. 159
Configuring multiple devices with the Bulk Field Change feature 160
Performing a device search using Find Device ...................................... 162
Viewing network devices and data After you have discovered and configured your network with the appropriate monitors, you can begin viewing the information WhatsUp Gold is gathering for you. There are several ways to view network data with WhatsUp Gold.
Device and Map Views While Device and Map Views are good for viewing device information or the location of a device, they are also useful for viewing the current status of network devices. Devices on both are displayed with device state icons that show the status for devices at the time of the last poll. The Device and Map Views are viewable on both the WhatsUp Gold console and web interface.
Using WhatsUp Gold 14.4
99
Workspace views and reports WhatsUp Gold's workspace views let you organize various workspace reports by the type of information they display or by devices and device groups. Workspace views and reports are viewable from the WhatsUp Gold web interface.
Full reports In WhatsUp Gold, reports are used to troubleshoot and monitor performance and historical data that has been collected during the operation of the application. Reports are viewed from the WhatsUp Gold Reports tab and can be sent on a regular basis to an email address you identify through the Recurring Report feature on the WhatsUp Gold console or Scheduled Reports feature on the WhatsUp Gold web interface.
Device overview In WhatsUp Gold, devices are virtual representations of resources (computers/workstations, servers, routers, switches, etc.) that are connected to your computer through a LAN (Local Area Network), a wireless network, or even over the Internet. WhatsUp Gold watches these devices through a network connection. When those network resources are cannot be reached by WhatsUp Gold, the device is considered down and an action can be configured to fire.
Device Services WhatsUp Gold associates Active Monitors with devices on your network. Active monitors query the network services installed on a device and then wait for a response. These monitors query the services running on a network resource, checking to make sure that the FTP server, web server, email server, etc., is up and responding. Active Monitors include DNS, SNMP, Telnet, Ping, TCPIP, and NT Service. If a response is either not received or is not what is expected, the service is considered down. If the query is returned as expected, the service is considered up.
For a more information about service monitors, see Active monitors overview (on page 165).
About the Device View This view provides an overview of each device in a selected group. Each device's icon provides information about its status. In addition, the Status column indicates which specific active monitor is down and the duration of the interruption. When the entry in the Device list is a group folder, the Status column shows the number of devices in the group with a breakdown of how many devices are in each device state.
Note: Dynamic groups will not show information about the number of devices in a group or a breakdown of how many devices are in each device state in the Status column. For more information, see Using Dynamic Groups.
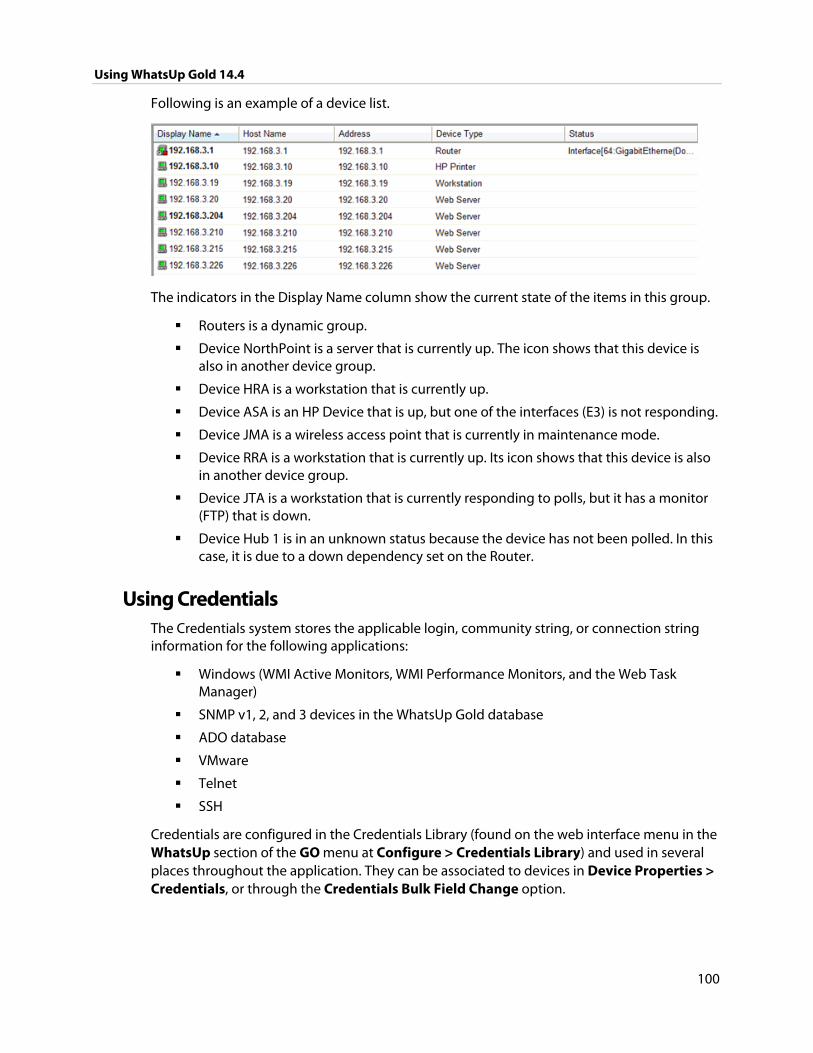
Using WhatsUp Gold 14.4
100
Following is an example of a device list.
The indicators in the Display Name column show the current state of the items in this group.
Routers is a dynamic group.
Device NorthPoint is a server that is currently up. The icon shows that this device is also in another device group.
Device HRA is a workstation that is currently up.
Device ASA is an HP Device that is up, but one of the interfaces (E3) is not responding.
Device JMA is a wireless access point that is currently in maintenance mode.
Device RRA is a workstation that is currently up. Its icon shows that this device is also in another device group.
Device JTA is a workstation that is currently responding to polls, but it has a monitor (FTP) that is down.
Device Hub 1 is in an unknown status because the device has not been polled. In this case, it is due to a down dependency set on the Router.
Using Credentials The Credentials system stores the applicable login, community string, or connection string information for the following applications:
Windows (WMI Active Monitors, WMI Performance Monitors, and the Web Task Manager)
SNMP v1, 2, and 3 devices in the WhatsUp Gold database
ADO database
VMware
Telnet
SSH
Credentials are configured in the Credentials Library (found on the web interface menu in the WhatsUp section of the GO menu at Configure > Credentials Library) and used in several places throughout the application. They can be associated to devices in Device Properties > Credentials, or through the Credentials Bulk Field Change option.
Using WhatsUp Gold 14.4
101
A device needs SNMP credentials applied to it in order for SNMP-based active monitors to work. Similarly, NT Service Checks must have Windows credentials applied, and WhatsUp Gold database monitors require ADO connection information.
VMware vCenter, and ESXi devices require VMware credentials to access system performance counters.
WhatsConfigured plug-in requires either an SSH or Telnet connection to gather configuration data and to perform various task scripts.
Related Topics
About General Device Properties ............................................................... 102
About Device Property Performance Monitors ..................................... 103
About Device Property Active Monitors .................................................. 104
About Device Property Passive Monitors ................................................ 105
About Device Property Actions ................................................................... 106
About Device Property Credentials ........................................................... 107
About Device Property Polling .................................................................... 108
About Device Property Notes ...................................................................... 109
About Device Property Menus..................................................................... 110
About Device Property Custom Links ....................................................... 111
About Device Property Attributes .............................................................. 112
About the DeviceIdentifier attribute ......................................................... 113
About Device Property Tasks ....................................................................... 113
Learning about the Device Properties You can modify individual device properties by right-clicking a device icon in either the Device View or Map View, then selecting Properties. Following is an overview of the device properties available to use in WhatsUp Gold.
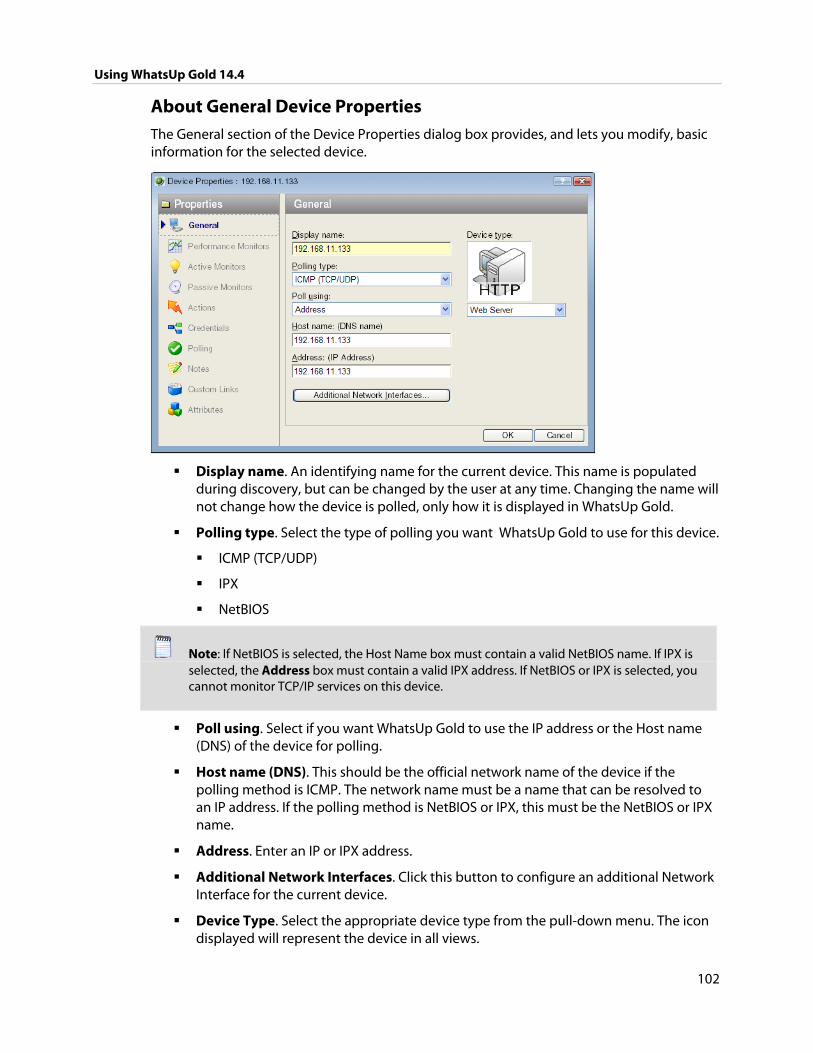
Using WhatsUp Gold 14.4
102
About General Device Properties The General section of the Device Properties dialog box provides, and lets you modify, basic information for the selected device.
Display name. An identifying name for the current device. This name is populated during discovery, but can be changed by the user at any time. Changing the name will not change how the device is polled, only how it is displayed in WhatsUp Gold.
Polling type. Select the type of polling you want WhatsUp Gold to use for this device.
ICMP (TCP/UDP)
IPX
NetBIOS
Note: If NetBIOS is selected, the Host Name box must contain a valid NetBIOS name. If IPX is selected, the Address box must contain a valid IPX address. If NetBIOS or IPX is selected, you cannot monitor TCP/IP services on this device.
Poll using. Select if you want WhatsUp Gold to use the IP address or the Host name (DNS) of the device for polling.
Host name (DNS). This should be the official network name of the device if the polling method is ICMP. The network name must be a name that can be resolved to an IP address. If the polling method is NetBIOS or IPX, this must be the NetBIOS or IPX name.
Address. Enter an IP or IPX address.
Additional Network Interfaces. Click this button to configure an additional Network Interface for the current device.
Device Type. Select the appropriate device type from the pull-down menu. The icon displayed will represent the device in all views.
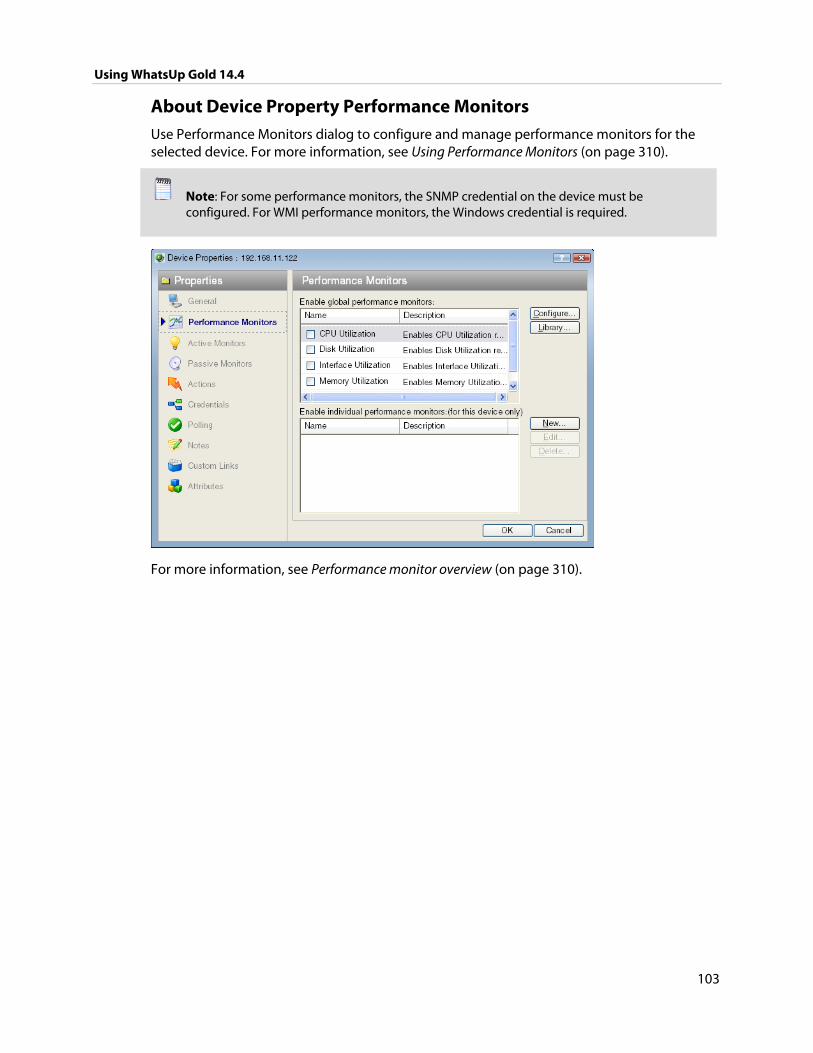
Using WhatsUp Gold 14.4
103
About Device Property Performance Monitors Use Performance Monitors dialog to configure and manage performance monitors for the selected device. For more information, see Using Performance Monitors (on page 310).
Note: For some performance monitors, the SNMP credential on the device must be configured. For WMI performance monitors, the Windows credential is required.
For more information, see Performance monitor overview (on page 310).
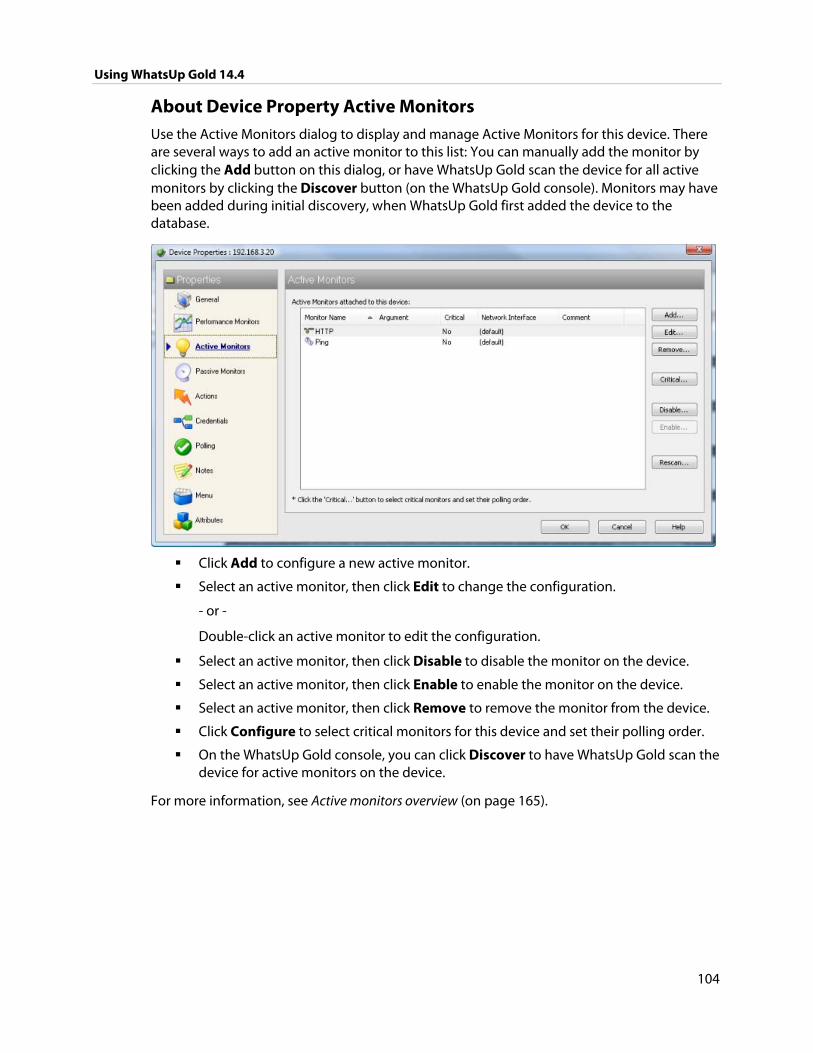
Using WhatsUp Gold 14.4
104
About Device Property Active Monitors Use the Active Monitors dialog to display and manage Active Monitors for this device. There are several ways to add an active monitor to this list: You can manually add the monitor by clicking the Add button on this dialog, or have WhatsUp Gold scan the device for all active monitors by clicking the Discover button (on the WhatsUp Gold console). Monitors may have been added during initial discovery, when WhatsUp Gold first added the device to the database.
Click Add to configure a new active monitor.
Select an active monitor, then click Edit to change the configuration.
- or -
Double-click an active monitor to edit the configuration.
Select an active monitor, then click Disable to disable the monitor on the device.
Select an active monitor, then click Enable to enable the monitor on the device.
Select an active monitor, then click Remove to remove the monitor from the device.
Click Configure to select critical monitors for this device and set their polling order.
On the WhatsUp Gold console, you can click Discover to have WhatsUp Gold scan the device for active monitors on the device.
For more information, see Active monitors overview (on page 165).
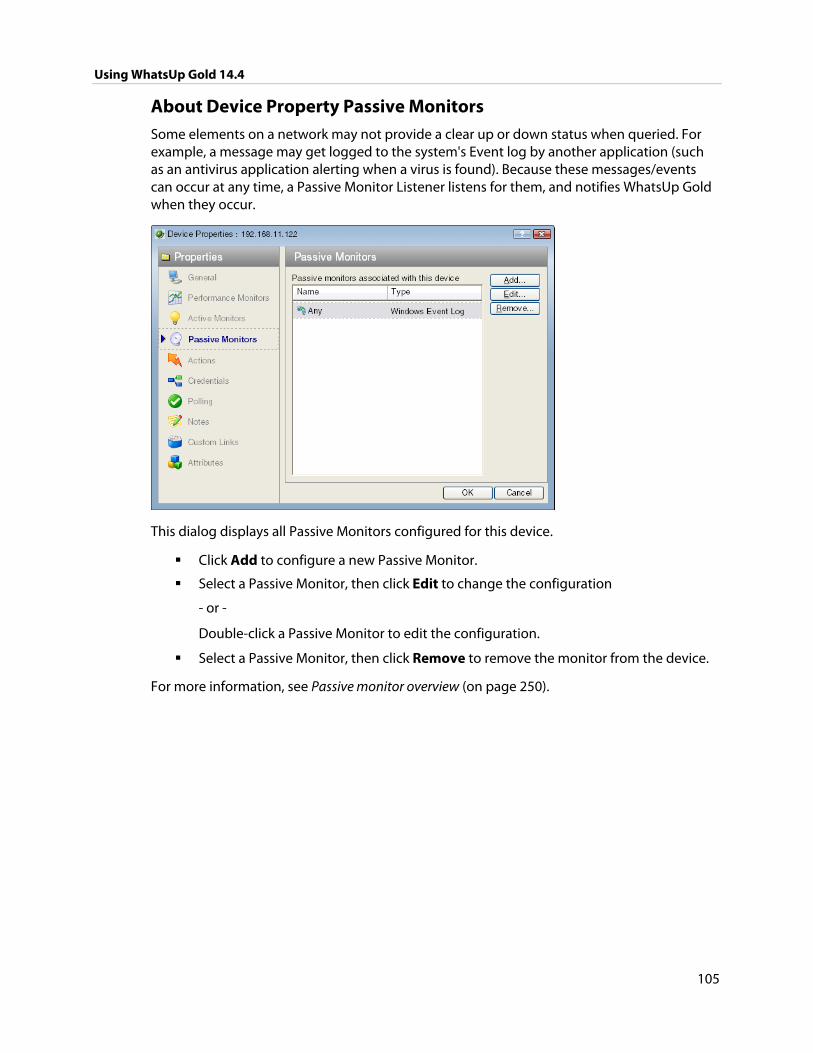
Using WhatsUp Gold 14.4
105
About Device Property Passive Monitors Some elements on a network may not provide a clear up or down status when queried. For example, a message may get logged to the system's Event log by another application (such as an antivirus application alerting when a virus is found). Because these messages/events can occur at any time, a Passive Monitor Listener listens for them, and notifies WhatsUp Gold when they occur.
This dialog displays all Passive Monitors configured for this device.
Click Add to configure a new Passive Monitor.
Select a Passive Monitor, then click Edit to change the configuration
- or -
Double-click a Passive Monitor to edit the configuration.
Select a Passive Monitor, then click Remove to remove the monitor from the device.
For more information, see Passive monitor overview (on page 250).
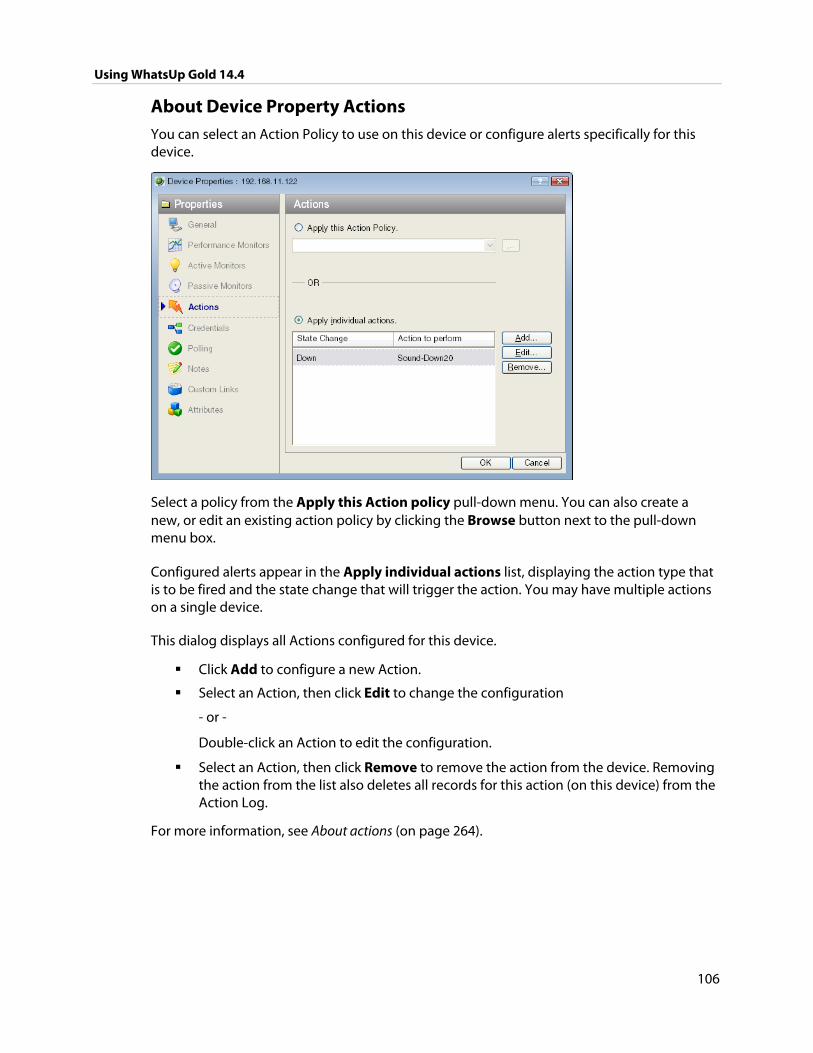
Using WhatsUp Gold 14.4
106
About Device Property Actions You can select an Action Policy to use on this device or configure alerts specifically for this device.
Select a policy from the Apply this Action policy pull-down menu. You can also create a new, or edit an existing action policy by clicking the Browse button next to the pull-down menu box.
Configured alerts appear in the Apply individual actions list, displaying the action type that is to be fired and the state change that will trigger the action. You may have multiple actions on a single device.
This dialog displays all Actions configured for this device.
Click Add to configure a new Action.
Select an Action, then click Edit to change the configuration
- or -
Double-click an Action to edit the configuration.
Select an Action, then click Remove to remove the action from the device. Removing the action from the list also deletes all records for this action (on this device) from the Action Log.
For more information, see About actions (on page 264).
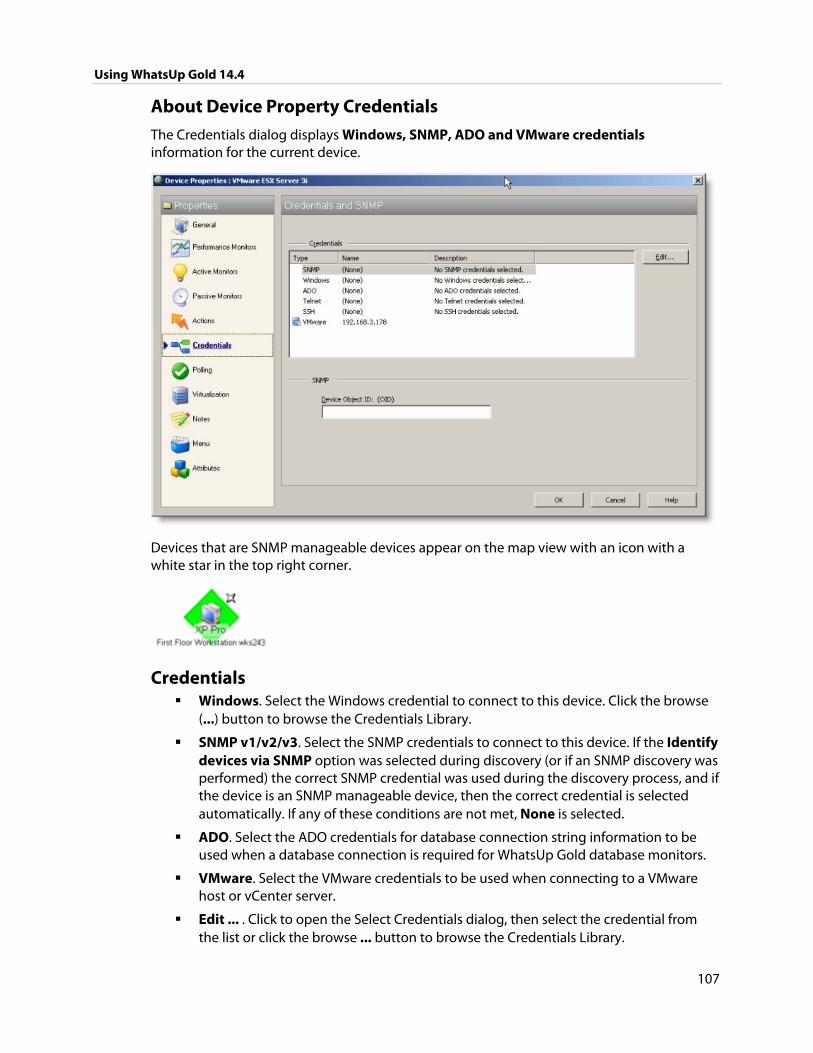
Using WhatsUp Gold 14.4
107
About Device Property Credentials
The Credentials dialog displays Windows, SNMP, ADO and VMware credentials information for the current device.
Devices that are SNMP manageable devices appear on the map view with an icon with a white star in the top right corner.
Credentials Windows. Select the Windows credential to connect to this device. Click the browse
(...) button to browse the Credentials Library.
SNMP v1/v2/v3. Select the SNMP credentials to connect to this device. If the Identify devices via SNMP option was selected during discovery (or if an SNMP discovery was performed) the correct SNMP credential was used during the discovery process, and if the device is an SNMP manageable device, then the correct credential is selected automatically. If any of these conditions are not met, None is selected.
ADO. Select the ADO credentials for database connection string information to be used when a database connection is required for WhatsUp Gold database monitors.
VMware. Select the VMware credentials to be used when connecting to a VMware host or vCenter server.
Edit ... . Click to open the Select Credentials dialog, then select the credential from the list or click the browse ... button to browse the Credentials Library.
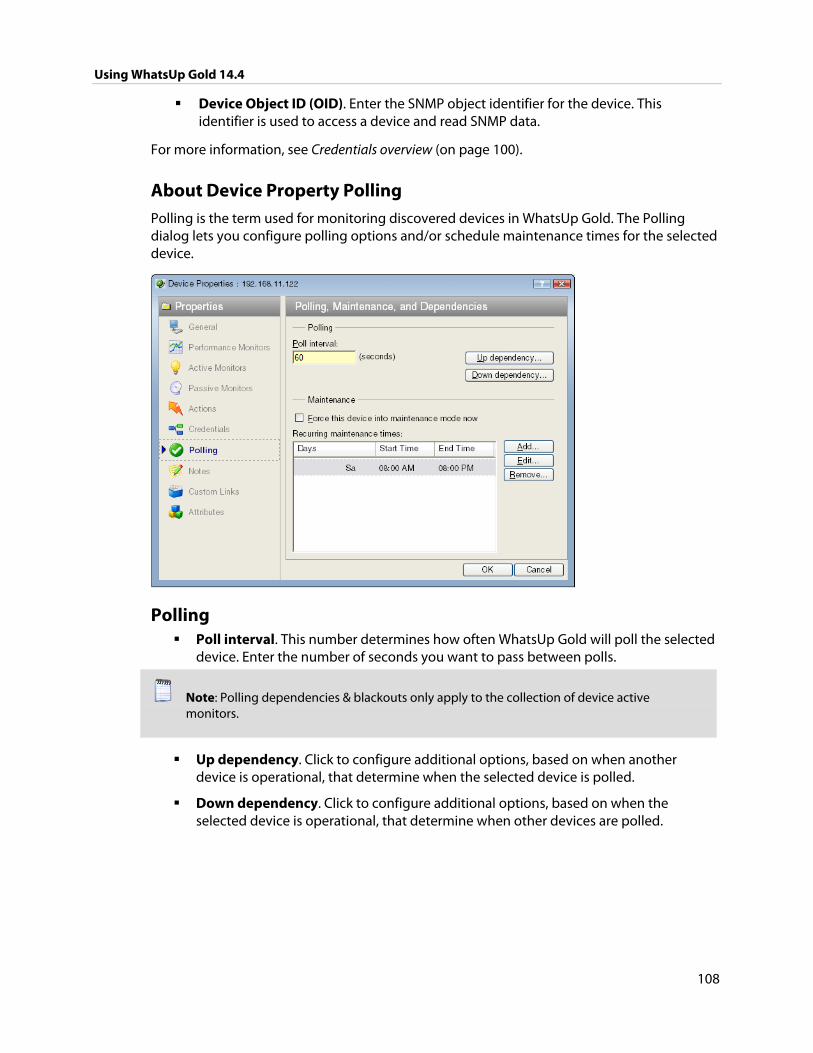
Using WhatsUp Gold 14.4
108
Device Object ID (OID). Enter the SNMP object identifier for the device. This identifier is used to access a device and read SNMP data.
For more information, see Credentials overview (on page 100).
About Device Property Polling Polling is the term used for monitoring discovered devices in WhatsUp Gold. The Polling dialog lets you configure polling options and/or schedule maintenance times for the selected device.
Polling Poll interval. This number determines how often WhatsUp Gold will poll the selected
device. Enter the number of seconds you want to pass between polls.
Note: Polling dependencies & blackouts only apply to the collection of device active monitors.
Up dependency. Click to configure additional options, based on when another device is operational, that determine when the selected device is polled.
Down dependency. Click to configure additional options, based on when the selected device is operational, that determine when other devices are polled.
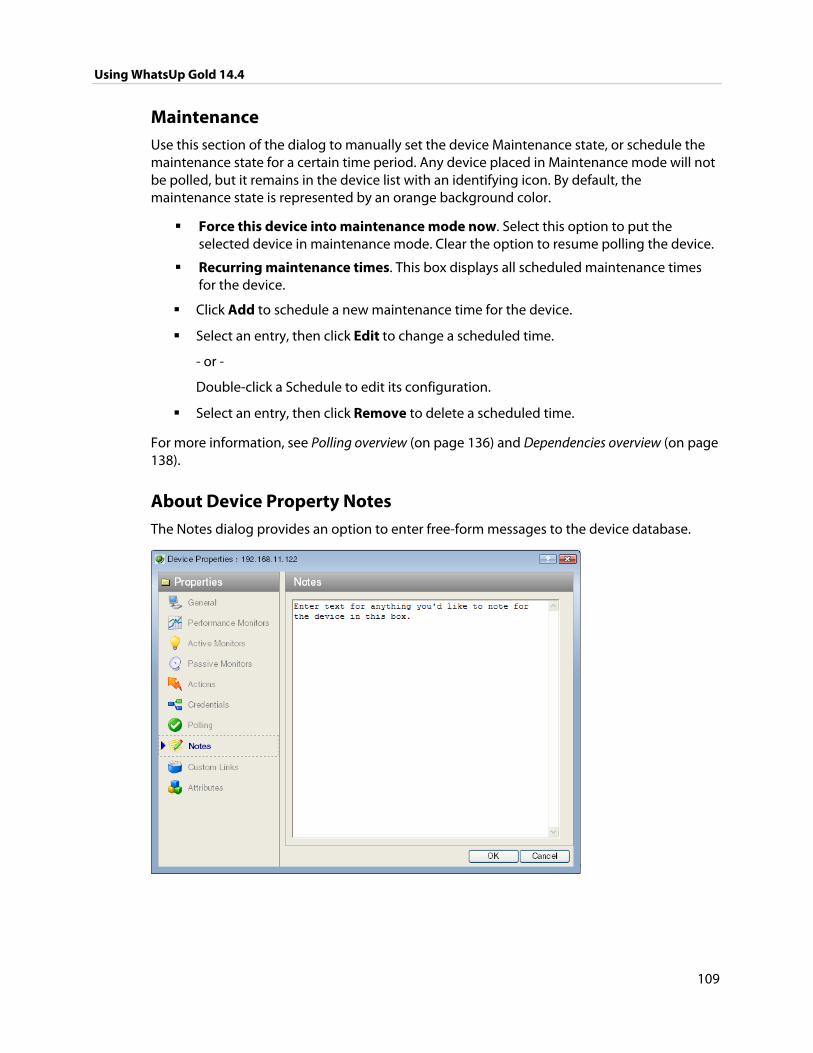
Using WhatsUp Gold 14.4
109
Maintenance Use this section of the dialog to manually set the device Maintenance state, or schedule the maintenance state for a certain time period. Any device placed in Maintenance mode will not be polled, but it remains in the device list with an identifying icon. By default, the maintenance state is represented by an orange background color.
Force this device into maintenance mode now. Select this option to put the selected device in maintenance mode. Clear the option to resume polling the device.
Recurring maintenance times. This box displays all scheduled maintenance times for the device.
Click Add to schedule a new maintenance time for the device.
Select an entry, then click Edit to change a scheduled time.
- or -
Double-click a Schedule to edit its configuration.
Select an entry, then click Remove to delete a scheduled time.
For more information, see Polling overview (on page 136) and Dependencies overview (on page 138).
About Device Property Notes The Notes dialog provides an option to enter free-form messages to the device database.
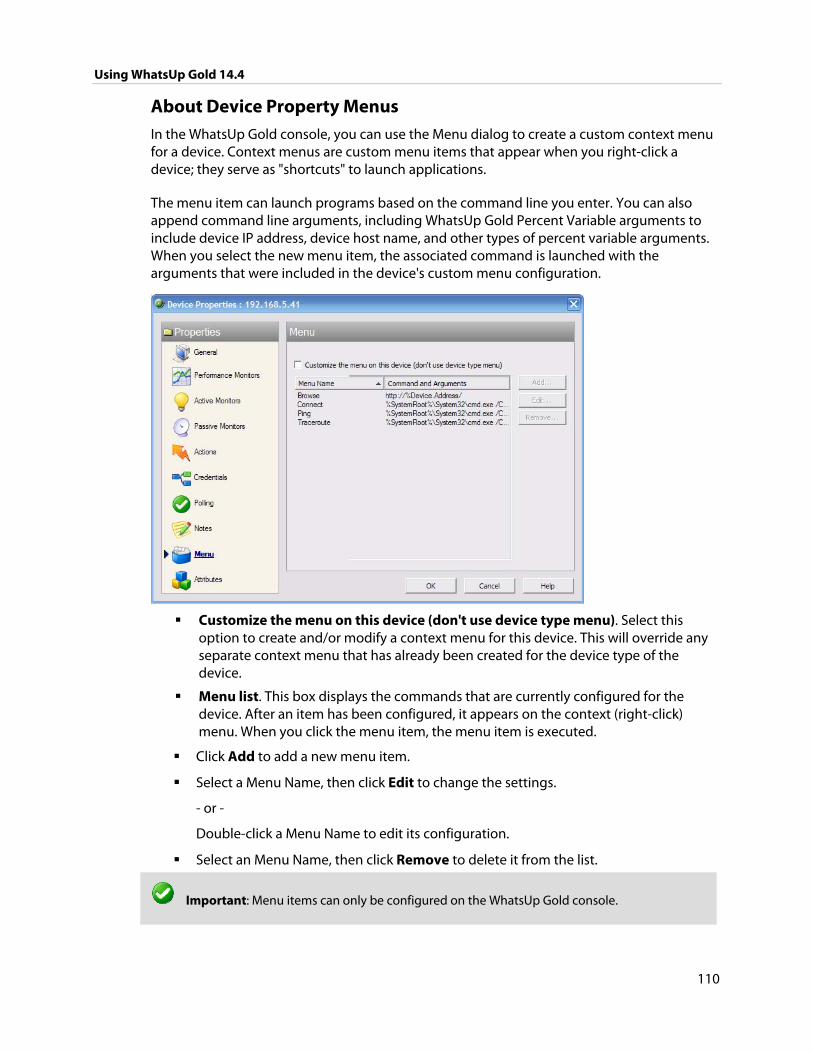
Using WhatsUp Gold 14.4
110
About Device Property Menus In the WhatsUp Gold console, you can use the Menu dialog to create a custom context menu for a device. Context menus are custom menu items that appear when you right-click a device; they serve as "shortcuts" to launch applications.
The menu item can launch programs based on the command line you enter. You can also append command line arguments, including WhatsUp Gold Percent Variable arguments to include device IP address, device host name, and other types of percent variable arguments. When you select the new menu item, the associated command is launched with the arguments that were included in the device's custom menu configuration.
Customize the menu on this device (don't use device type menu). Select this option to create and/or modify a context menu for this device. This will override any separate context menu that has already been created for the device type of the device.
Menu list. This box displays the commands that are currently configured for the device. After an item has been configured, it appears on the context (right-click) menu. When you click the menu item, the menu item is executed.
Click Add to add a new menu item.
Select a Menu Name, then click Edit to change the settings.
- or -
Double-click a Menu Name to edit its configuration.
Select an Menu Name, then click Remove to delete it from the list.
Important: Menu items can only be configured on the WhatsUp Gold console.
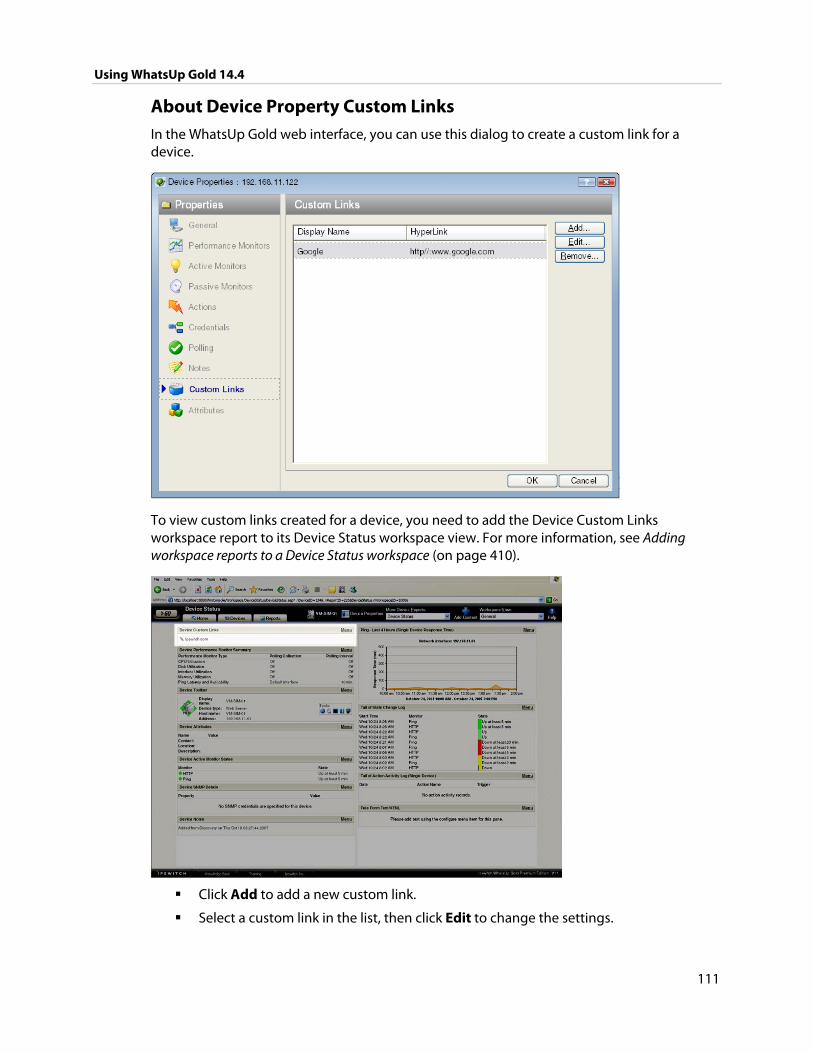
Using WhatsUp Gold 14.4
111
About Device Property Custom Links In the WhatsUp Gold web interface, you can use this dialog to create a custom link for a device.
To view custom links created for a device, you need to add the Device Custom Links workspace report to its Device Status workspace view. For more information, see Adding workspace reports to a Device Status workspace (on page 410).
Click Add to add a new custom link.
Select a custom link in the list, then click Edit to change the settings.
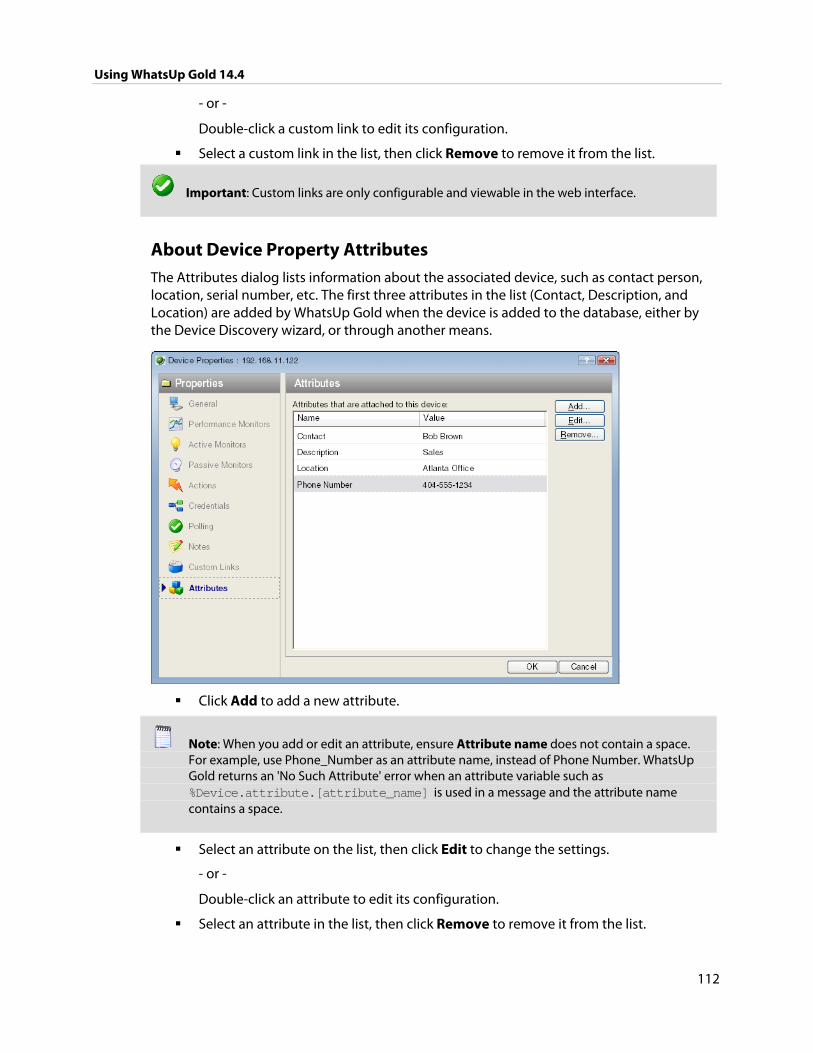
Using WhatsUp Gold 14.4
112
- or -
Double-click a custom link to edit its configuration.
Select a custom link in the list, then click Remove to remove it from the list.
Important: Custom links are only configurable and viewable in the web interface.
About Device Property Attributes The Attributes dialog lists information about the associated device, such as contact person, location, serial number, etc. The first three attributes in the list (Contact, Description, and Location) are added by WhatsUp Gold when the device is added to the database, either by the Device Discovery wizard, or through another means.
Click Add to add a new attribute.
Note: When you add or edit an attribute, ensure Attribute name does not contain a space. For example, use Phone_Number as an attribute name, instead of Phone Number. WhatsUp Gold returns an 'No Such Attribute' error when an attribute variable such as %Device.attribute.[attribute_name] is used in a message and the attribute name contains a space.
Select an attribute on the list, then click Edit to change the settings.
- or -
Double-click an attribute to edit its configuration.
Select an attribute in the list, then click Remove to remove it from the list.
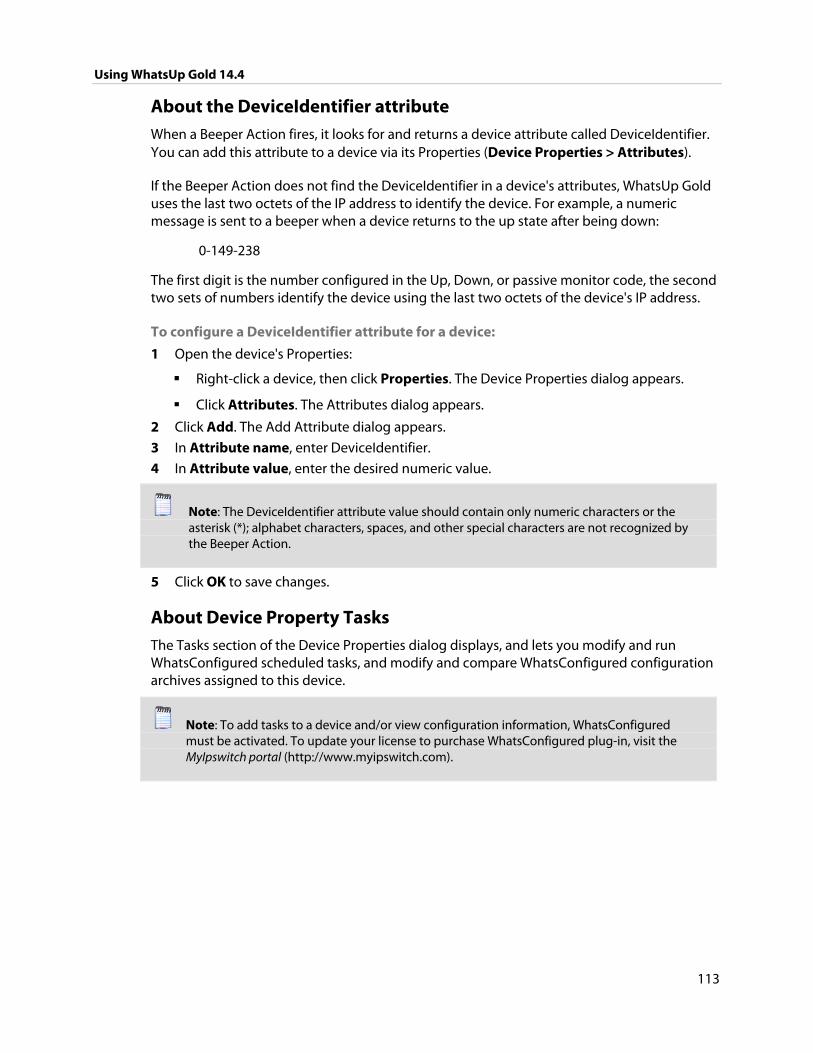
Using WhatsUp Gold 14.4
113
About the DeviceIdentifier attribute When a Beeper Action fires, it looks for and returns a device attribute called DeviceIdentifier. You can add this attribute to a device via its Properties (Device Properties > Attributes).
If the Beeper Action does not find the DeviceIdentifier in a device's attributes, WhatsUp Gold uses the last two octets of the IP address to identify the device. For example, a numeric message is sent to a beeper when a device returns to the up state after being down:
0-149-238
The first digit is the number configured in the Up, Down, or passive monitor code, the second two sets of numbers identify the device using the last two octets of the device's IP address.
To configure a DeviceIdentifier attribute for a device:
1 Open the device's Properties:
Right-click a device, then click Properties. The Device Properties dialog appears.
Click Attributes. The Attributes dialog appears.
2 Click Add. The Add Attribute dialog appears.
3 In Attribute name, enter DeviceIdentifier.
4 In Attribute value, enter the desired numeric value.
Note: The DeviceIdentifier attribute value should contain only numeric characters or the asterisk (*); alphabet characters, spaces, and other special characters are not recognized by the Beeper Action.
5 Click OK to save changes.
About Device Property Tasks The Tasks section of the Device Properties dialog displays, and lets you modify and run WhatsConfigured scheduled tasks, and modify and compare WhatsConfigured configuration archives assigned to this device.
Note: To add tasks to a device and/or view configuration information, WhatsConfigured must be activated. To update your license to purchase WhatsConfigured plug-in, visit the MyIpswitch portal (http://www.myipswitch.com).
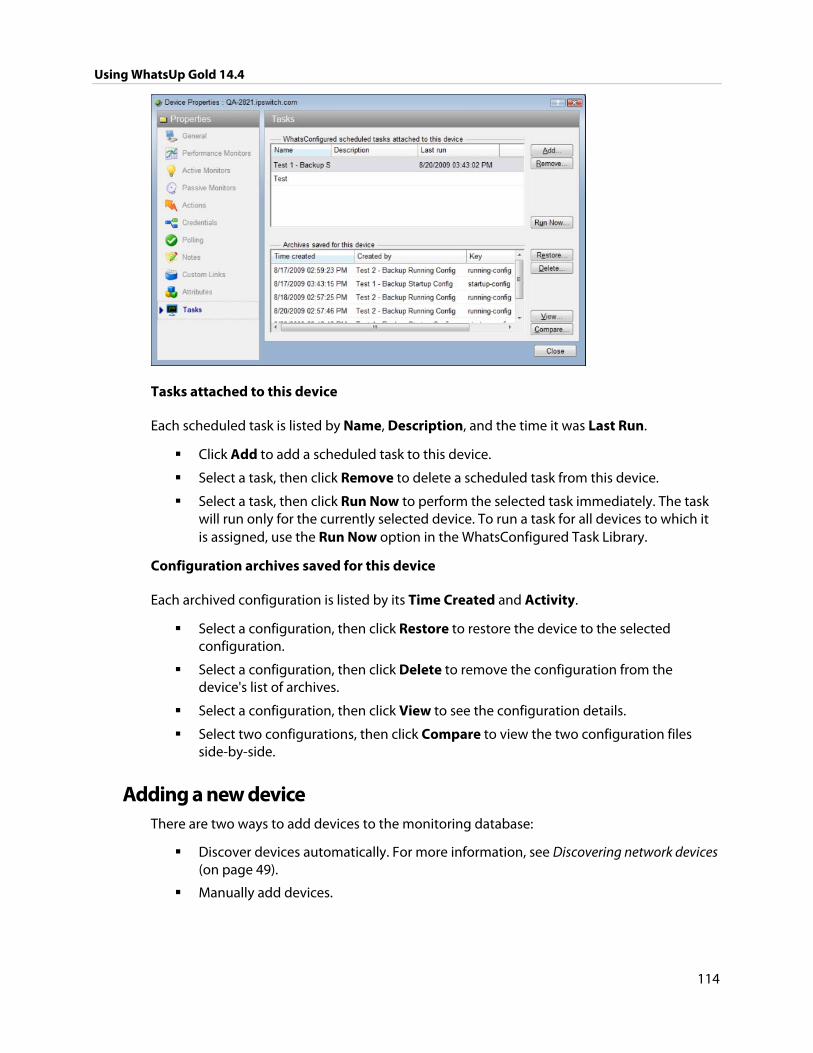
Using WhatsUp Gold 14.4
114
Tasks attached to this device
Each scheduled task is listed by Name, Description, and the time it was Last Run.
Click Add to add a scheduled task to this device.
Select a task, then click Remove to delete a scheduled task from this device.
Select a task, then click Run Now to perform the selected task immediately. The task will run only for the currently selected device. To run a task for all devices to which it is assigned, use the Run Now option in the WhatsConfigured Task Library.
Configuration archives saved for this device
Each archived configuration is listed by its Time Created and Activity.
Select a configuration, then click Restore to restore the device to the selected configuration.
Select a configuration, then click Delete to remove the configuration from the device's list of archives.
Select a configuration, then click View to see the configuration details.
Select two configurations, then click Compare to view the two configuration files side-by-side.
Adding a new device There are two ways to add devices to the monitoring database:
Discover devices automatically. For more information, see Discovering network devices (on page 49).
Manually add devices.
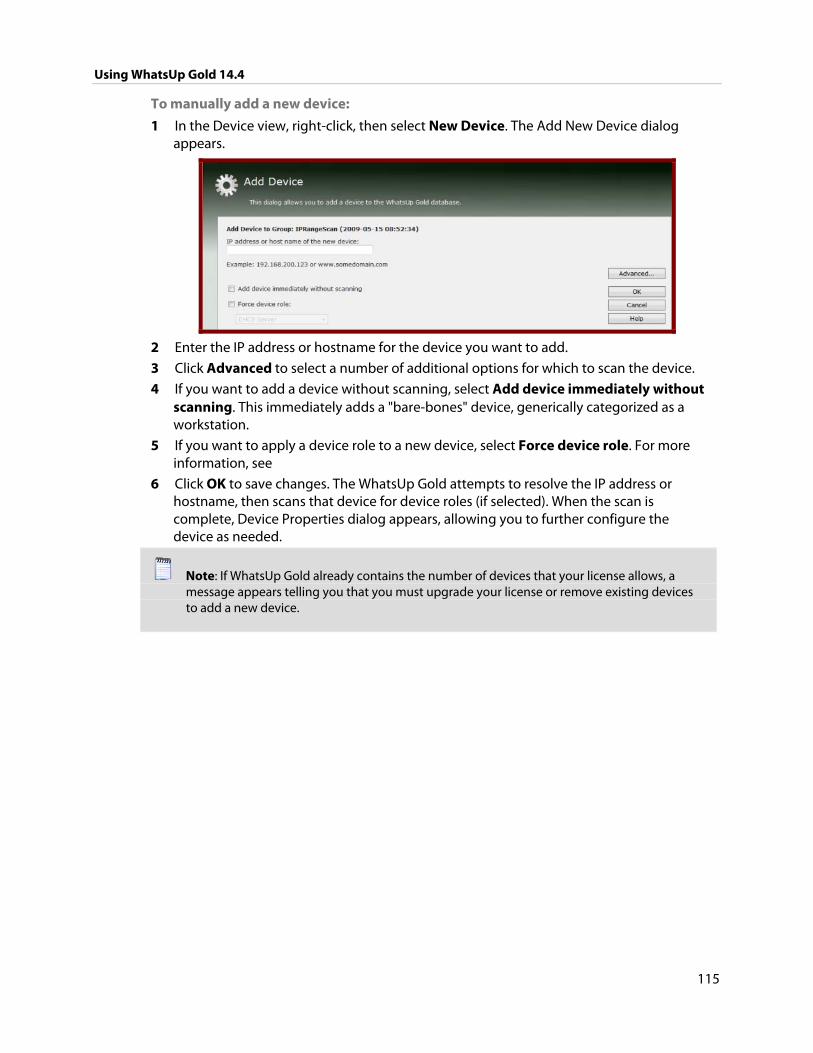
Using WhatsUp Gold 14.4
115
To manually add a new device:
1 In the Device view, right-click, then select New Device. The Add New Device dialog appears.
2 Enter the IP address or hostname for the device you want to add.
3 Click Advanced to select a number of additional options for which to scan the device.
4 If you want to add a device without scanning, select Add device immediately without scanning. This immediately adds a "bare-bones" device, generically categorized as a workstation.
5 If you want to apply a device role to a new device, select Force device role. For more information, see
6 Click OK to save changes. The WhatsUp Gold attempts to resolve the IP address or hostname, then scans that device for device roles (if selected). When the scan is complete, Device Properties dialog appears, allowing you to further configure the device as needed.
Note: If WhatsUp Gold already contains the number of devices that your license allows, a message appears telling you that you must upgrade your license or remove existing devices to add a new device.
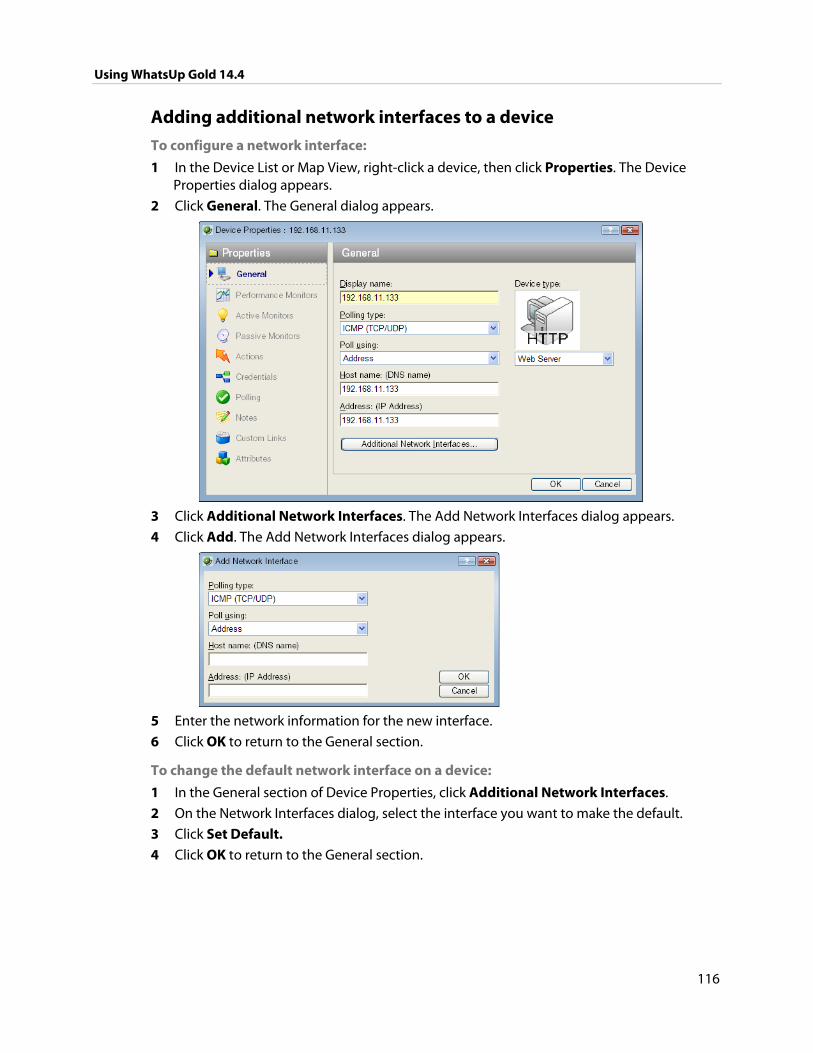
Using WhatsUp Gold 14.4
116
Adding additional network interfaces to a device
To configure a network interface:
1 In the Device List or Map View, right-click a device, then click Properties. The Device Properties dialog appears.
2 Click General. The General dialog appears.
3 Click Additional Network Interfaces. The Add Network Interfaces dialog appears.
4 Click Add. The Add Network Interfaces dialog appears.
5 Enter the network information for the new interface.
6 Click OK to return to the General section.
To change the default network interface on a device:
1 In the General section of Device Properties, click Additional Network Interfaces.
2 On the Network Interfaces dialog, select the interface you want to make the default.
3 Click Set Default. 4 Click OK to return to the General section.
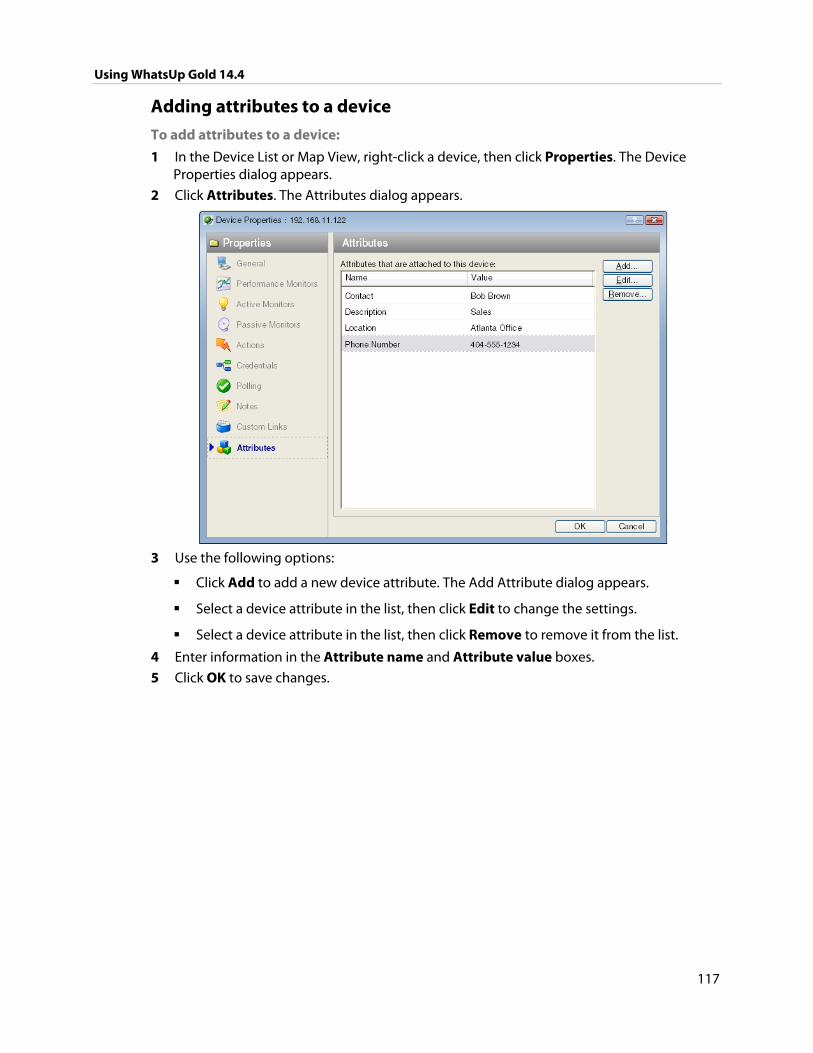
Using WhatsUp Gold 14.4
117
Adding attributes to a device
To add attributes to a device:
1 In the Device List or Map View, right-click a device, then click Properties. The Device Properties dialog appears.
2 Click Attributes. The Attributes dialog appears.
3 Use the following options:
Click Add to add a new device attribute. The Add Attribute dialog appears.
Select a device attribute in the list, then click Edit to change the settings.
Select a device attribute in the list, then click Remove to remove it from the list.
4 Enter information in the Attribute name and Attribute value boxes.
5 Click OK to save changes.
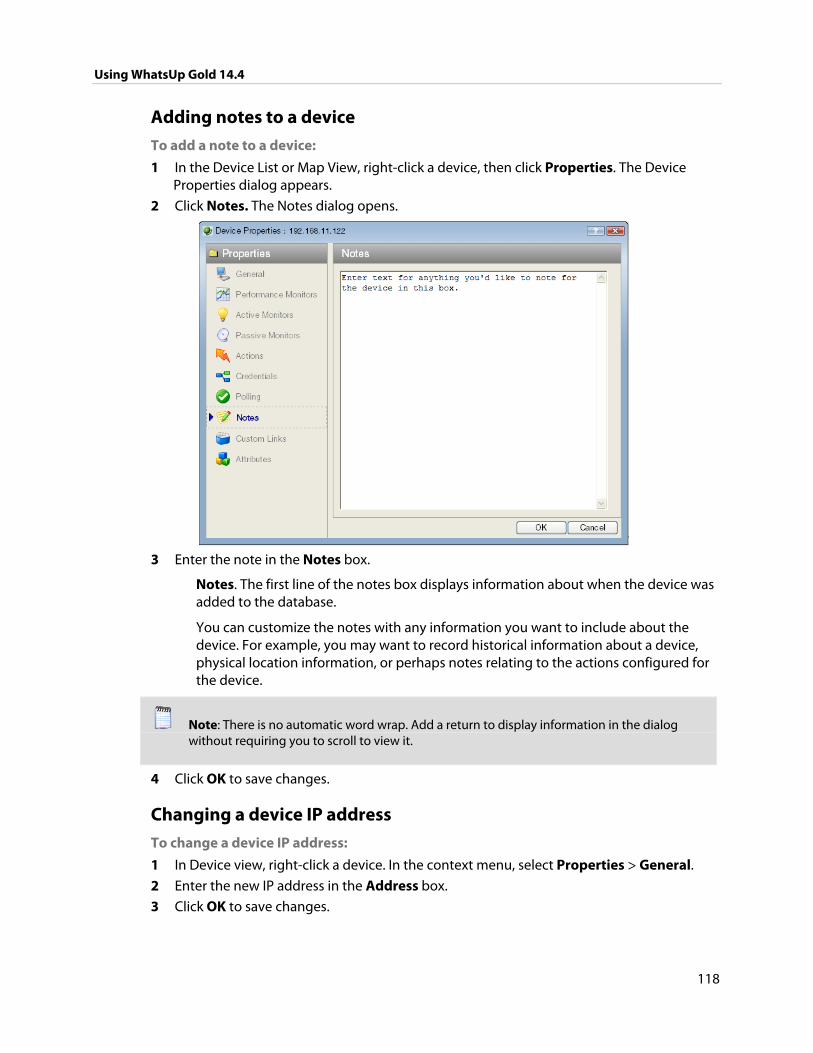
Using WhatsUp Gold 14.4
118
Adding notes to a device
To add a note to a device:
1 In the Device List or Map View, right-click a device, then click Properties. The Device Properties dialog appears.
2 Click Notes. The Notes dialog opens.
3 Enter the note in the Notes box.
Notes. The first line of the notes box displays information about when the device was added to the database.
You can customize the notes with any information you want to include about the device. For example, you may want to record historical information about a device, physical location information, or perhaps notes relating to the actions configured for the device.
Note: There is no automatic word wrap. Add a return to display information in the dialog without requiring you to scroll to view it.
4 Click OK to save changes.
Changing a device IP address
To change a device IP address:
1 In Device view, right-click a device. In the context menu, select Properties > General. 2 Enter the new IP address in the Address box.
3 Click OK to save changes.
Using WhatsUp Gold 14.4
119
Changing a device name Changing the name of a device changes how it appears in the list views.
To change a device name:
1 In Device view, right-click a device. In the context menu, click Properties > General. 2 In the General section of Device Properties, enter the new name in the Display Name
box.
3 Click OK to save changes.
Changing Device Types
Important: Prior to the WhatsUp Gold v14 release Device Types were used to identify the role a device performed on the network for the active and passive monitors, menu items, and icons associated with each device. WhatsUp Gold v14 and later has moved Device Type information to be managed in the Discovery Console Device Role Settings. The Device Types dialogs now have limited functionality. Active monitors, passive monitors, and action policies are no longer editable in the Device Type dialog. The device General and Menu Items information is editable. For more information, see Discovering and Viewing Network Data.
Cloning a device The WhatsUp Gold cloning feature, available in the web interface, allows you to do a deep copy of a device. The term deep copy means that the device is copied to a new device with all active monitors, passive monitors, actions, attributes, etc. applied to the new device. This functionality makes it easy to create a new device with monitors, actions, and attributes set up based on ones you have already taken the time to set up for a previously created device. This reduces the time required to setup new monitors, actions, and attributes for a new device.
Note: Any monitors and action policies associated with the device you are cloning from are not duplicated for the new cloned device, rather the new cloned device has the existing monitors and action policies applied to it. If you want to assign new monitors to the newly cloned device, see Monitoring Devices or if you want to create a new action policy and associate it with the device, see About Action Policies (on page 303).
Methods to clone a device There are three ways to clone a device, from the device right-click menu, dragging-and-dropping a device from a device list or a map view to a new device group, or from the Edit menu in the top toolbar (Edit > Clone).
Using WhatsUp Gold 14.4
120
After you have cloned a device, you need to change the device host name and address in the Device Properties - General dialog settings so that WhatsUp Gold can monitor the new device and all of the active monitors, passive monitors, actions, and attributes that are applied to the new device. For more information, see Changing the cloned Device Properties (on page 121).
Cloning a device from the right-click menu
To clone a device from the right-click menu:
1 From the WhatsUp Gold web interface, in the Device List or Map View, right-click the device for which you want to clone attributes. The right-click menu appears.
2 Click Clone. The Clone selected items from x to .... dialog appears.
3 Select the group that you want to clone the device into, then click OK. A status dialog appears indicating the cloning process status.
4 Click Close to complete the cloning process.
Note: The new cloned device display name is as shown in the following device name example: - Original name: Device-WHO - First clone (in new group): Device-WHO - Second clone: Device-WHO - Clone - Third clone: Device-WHO - Clone (2) - Subsequent clones: Device-WHO - Clone (nnn)
Tip: You can also use the Device Properties - Notes dialog to verify if a device is a cloned device. Right-click the device you want to check, then click Properties > Notes. If the device is a cloned device, a message appears; for example, This device was cloned on 6/24/2010 10:12:37 AM.
5 Change the cloned device properties as required. For more information, see Changing the cloned Device Properties (on page 121).
Using WhatsUp Gold 14.4
121
Cloning a device using drag-n-drop
To clone a device using drag-n-drop:
1 From the WhatsUp Gold web interface, in the Device List or Map View, select the device (or multiple devices) for which you want to clone attributes, then drag the device(s) to the device group where you want the device(s) to reside. The Copy, Move, Clone, Cancel menu appears.
2 Click Clone. A status dialog appears indicating the cloning process status.
3 Click Close to complete the cloning process.
Note: The new cloned device display name is as shown in the following device name example: - Original name: Device-WHO - First clone (in new group): Device-WHO - Second clone: Device-WHO - Clone - Third clone: Device-WHO - Clone (2) - Subsequent clones: Device-WHO - Clone (nnn)
Tip: You can also use the Device Properties - Notes dialog to verify if a device is a cloned device. Right-click the device you want to check, then click Properties > Notes. If the device is a cloned device, a message appears; for example, This device was cloned on 6/24/2010 10:12:37 AM.
4 Change the cloned device properties as required. For more information, see Changing the cloned Device Properties (on page 121).
Changing the cloned Device Properties After you have cloned a device, you need to change the device host name and address in the Device Properties - General dialog settings so that WhatsUp Gold can monitor the new device and all of the active monitors, passive monitors, actions, and attributes that are applied to the new device.
To change the cloned Device Properties:
1 From the group where the new cloned device resides, right-click the device, then click Properties. The Device Properties dialog appears.
2 Click General. The General dialog opens.
3 Enter the new device Host name, Address, and other information you want to change for this device, then click OK.
122
CHAPTER 12
Using Device Groups
In This Chapter
About device groups ....................................................................................... 122
About Dynamic Groups .................................................................................. 124
Building Dynamic Groups.............................................................................. 133
About device groups In WhatsUp Gold, devices are organized in groups to allow you to quickly find and diagnose problems. You can create as many device groups as you wish to organize your network in a way that is meaningful to you and your monitoring needs.
Device group types Two types of device groups exist in WhatsUp Gold:
Non-dynamic groups
Dynamic groups
Non-dynamic groups are simply referred to as "device groups." Each time you discover devices on your network, a new device group is created containing the devices found in the scan that you choose to monitor. The group is named using the type of scan you used during discovery, and the date and time the scan took place. For example, "SNMPScan (2007-08-03 10:24:37)." Devices that are already in the database are added to the new group as a shortcut to the original device reference. This is only to relay that there are more than one reference in the My Network tree, as you configure devices by clicking either the original reference icon or the shortcut. Functionally, they serve the same purpose and display the same device status.
Dynamic groups are created by using SQL queries that search for devices based on user-specified criteria. By default, all devices discovered on your network are placed into a dynamic group named All devices. Similarly, each time a router is discovered it is placed into a similar dynamic group named All routers.
Using WhatsUp Gold 14.4
123
Device group icons Just as devices in WhatsUp Gold, device groups use icons to display the current state of the group, or to indicate the type of device group.
All of the monitors on all devices in the group are up.
The device group contains at least one device that is considered down.
The device group is empty, or devices have not been polled due to a dependency on another device.
Indicates a dynamic group.
Device group maps The Map View is based on device group folders, meaning that each device group will have a separate map. If a device group folder contains a subfolder, or subgroup, you can double-click on the folder in Map View to display the subfolder's map.
Device group reports Device groups are particularly important when you are viewing full and workspace reports pertaining to a specific group, or group reports (on page 441). When viewing Group Reports, you choose one specific device group in which to view network data. It's a good idea to think of ways to easily distinguish device groups from one another for this reason. An easy way to distinguish groups is using group names that are meaningful, such as "Atlanta Developers" and "Atlanta Tech Support." As a result, you can easily tell what each device group is when choosing a group on which to view Group Report information.
Device Group Access Rights Similar to user rights are the WhatsUp Gold group access rights which link permissions to device groups. For more information, see About group access rights (on page 80).
Creating device groups
To create a new device group:
Important: You cannot create a new device group within a dynamic group.
Note: There is a separate procedure for creating new dynamic groups.
On the WhatsUp Gold console 1 Select File > New Group. A new device group appears in the My Network Tree named
"New Device Group." You will need to rename this group.
2 To rename the group, select the new group and right-click. The right-click menu appears. Select Rename and enter a new name for the group.
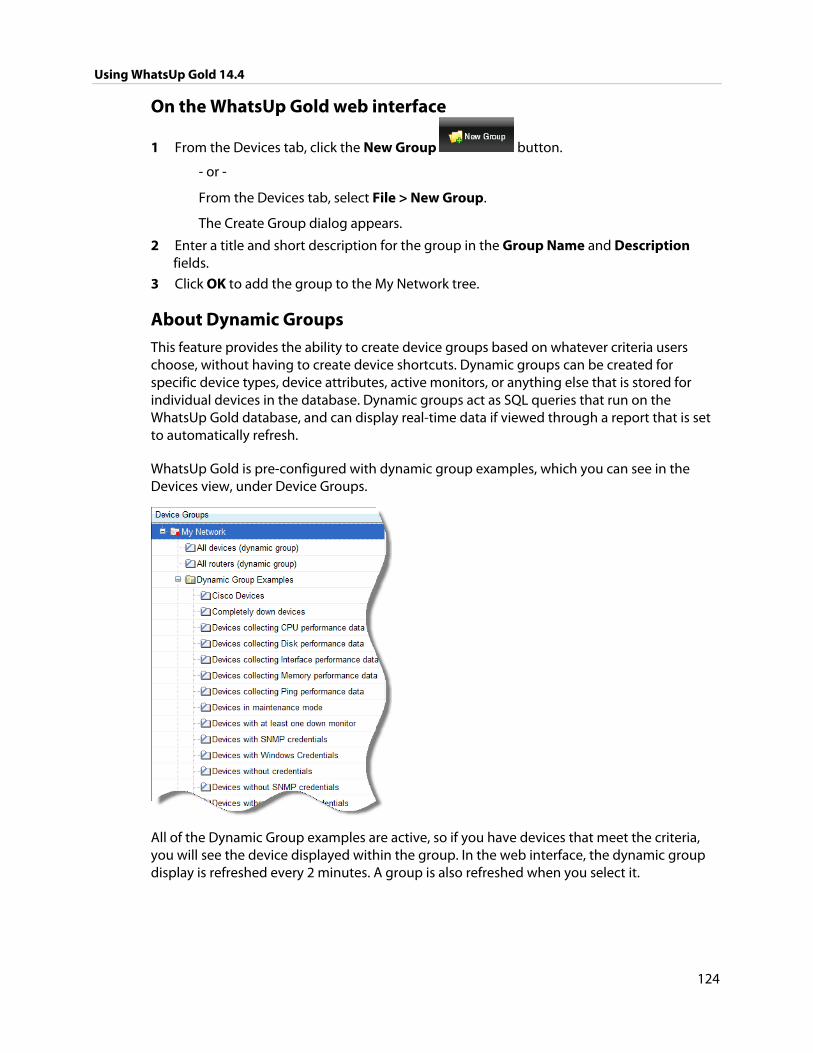
Using WhatsUp Gold 14.4
124
On the WhatsUp Gold web interface
1 From the Devices tab, click the New Group button.
- or -
From the Devices tab, select File > New Group.
The Create Group dialog appears.
2 Enter a title and short description for the group in the Group Name and Description fields.
3 Click OK to add the group to the My Network tree.
About Dynamic Groups This feature provides the ability to create device groups based on whatever criteria users choose, without having to create device shortcuts. Dynamic groups can be created for specific device types, device attributes, active monitors, or anything else that is stored for individual devices in the database. Dynamic groups act as SQL queries that run on the WhatsUp Gold database, and can display real-time data if viewed through a report that is set to automatically refresh.
WhatsUp Gold is pre-configured with dynamic group examples, which you can see in the Devices view, under Device Groups.
All of the Dynamic Group examples are active, so if you have devices that meet the criteria, you will see the device displayed within the group. In the web interface, the dynamic group display is refreshed every 2 minutes. A group is also refreshed when you select it.
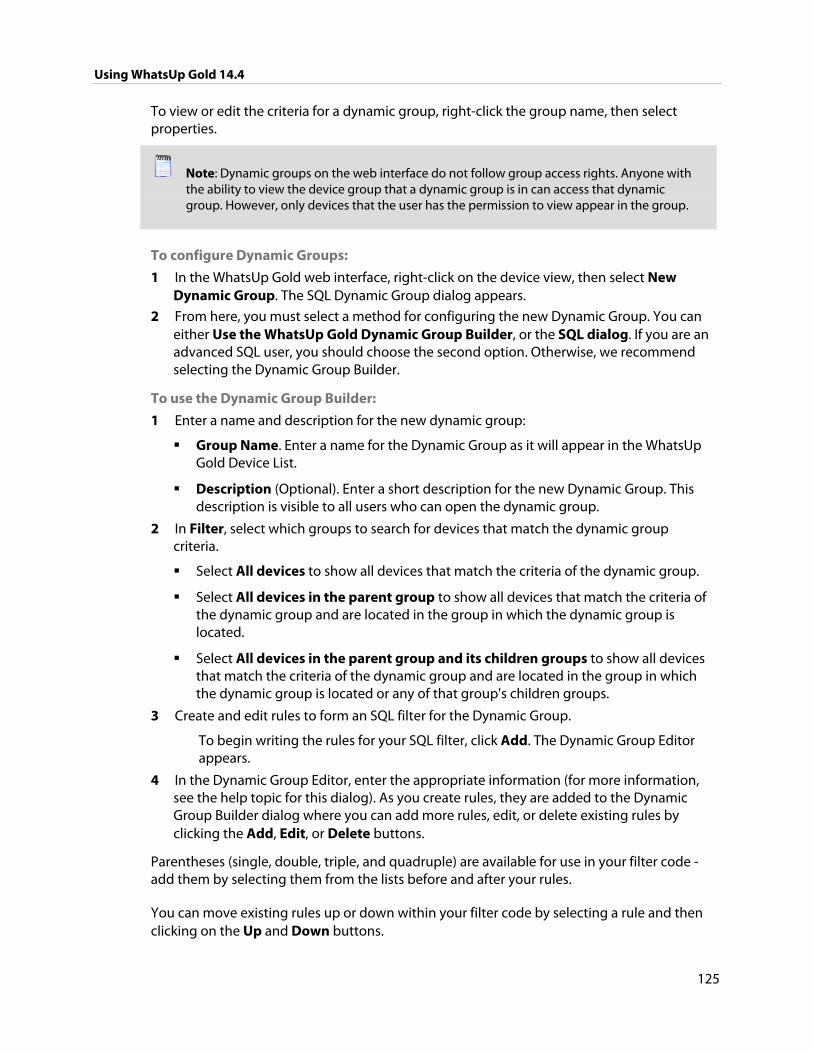
Using WhatsUp Gold 14.4
125
To view or edit the criteria for a dynamic group, right-click the group name, then select properties.
Note: Dynamic groups on the web interface do not follow group access rights. Anyone with the ability to view the device group that a dynamic group is in can access that dynamic group. However, only devices that the user has the permission to view appear in the group.
To configure Dynamic Groups:
1 In the WhatsUp Gold web interface, right-click on the device view, then select New Dynamic Group. The SQL Dynamic Group dialog appears.
2 From here, you must select a method for configuring the new Dynamic Group. You can either Use the WhatsUp Gold Dynamic Group Builder, or the SQL dialog. If you are an advanced SQL user, you should choose the second option. Otherwise, we recommend selecting the Dynamic Group Builder.
To use the Dynamic Group Builder:
1 Enter a name and description for the new dynamic group:
Group Name. Enter a name for the Dynamic Group as it will appear in the WhatsUp Gold Device List.
Description (Optional). Enter a short description for the new Dynamic Group. This description is visible to all users who can open the dynamic group.
2 In Filter, select which groups to search for devices that match the dynamic group criteria.
Select All devices to show all devices that match the criteria of the dynamic group.
Select All devices in the parent group to show all devices that match the criteria of the dynamic group and are located in the group in which the dynamic group is located.
Select All devices in the parent group and its children groups to show all devices that match the criteria of the dynamic group and are located in the group in which the dynamic group is located or any of that group's children groups.
3 Create and edit rules to form an SQL filter for the Dynamic Group.
To begin writing the rules for your SQL filter, click Add. The Dynamic Group Editor appears.
4 In the Dynamic Group Editor, enter the appropriate information (for more information, see the help topic for this dialog). As you create rules, they are added to the Dynamic Group Builder dialog where you can add more rules, edit, or delete existing rules by clicking the Add, Edit, or Delete buttons.
Parentheses (single, double, triple, and quadruple) are available for use in your filter code - add them by selecting them from the lists before and after your rules.
You can move existing rules up or down within your filter code by selecting a rule and then clicking on the Up and Down buttons.
Using WhatsUp Gold 14.4
126
Validating your filter code Keep in mind that as you configure your rules, the SQL filter is displayed at the bottom of the Builder dialog. When you are satisfied with the filter code that is displayed, click the Validate button to test the filter code sytnax. If the test returns no errors, click OK to save the configured SQL filter and to add the new Dynamic Group to your Device List.
If the code returns errors, either make the needed changes at this time, then click OK. Additionally, you have the option to save the filter code so that you may edit it at a later time. You can then select the Dynamic Group from the Device List and right-click, then select Properties to edit the group filter code.
Converting your filter code You can convert a Dynamic Group created with the Dynamic Group Builder to the SQL dialog by clicking the Convert button. It is important to note that once you convert the Dynamic Group to the SQL dialog, you will not be able to edit the group in the Dynamic Group Builder again - you will only be able to make changes to the group from the SQL dialog. If you aren't an advanced SQL user, we recommend that you make a copy of the Dynamic Group so that you can keep a copy available for edit in the Dynamic Group Builder.
To use the SQL Dynamic Group dialog:
1 Enter a Display name for the group, enter the group Description, and enter an SQL query in the Filter box that identifies the devices you want to appear in that group.
2 Click OK to add the group to the device list. SQL validation occurs as soon as you click OK. If the filter fails, an error message appears.
In addition to the pre-configured dynamic groups, we have provided several sample filters for you to create some very interesting dynamic groups.
Tip: You can learn more about the database structure by downloading the database schema file on the WhatsUp Gold support page (http://www.whatsupgold.com/wugtechsupport).
Dynamic Group Examples
WhatsUp Gold is pre-configured with dynamic group examples, which you can see in the Devices view, under Device Groups. For more information on these groups, see Using Dynamic Groups.
The following examples show several dynamic group filters that you can use to create some interesting dynamic groups for your devices. To use these examples, select the text of the filter, and then copy and paste the text into the Filter box of the Dynamic Group dialog.
Note: You may have to remove the copyright information from the cut and paste if it appears when you copy from this help file.
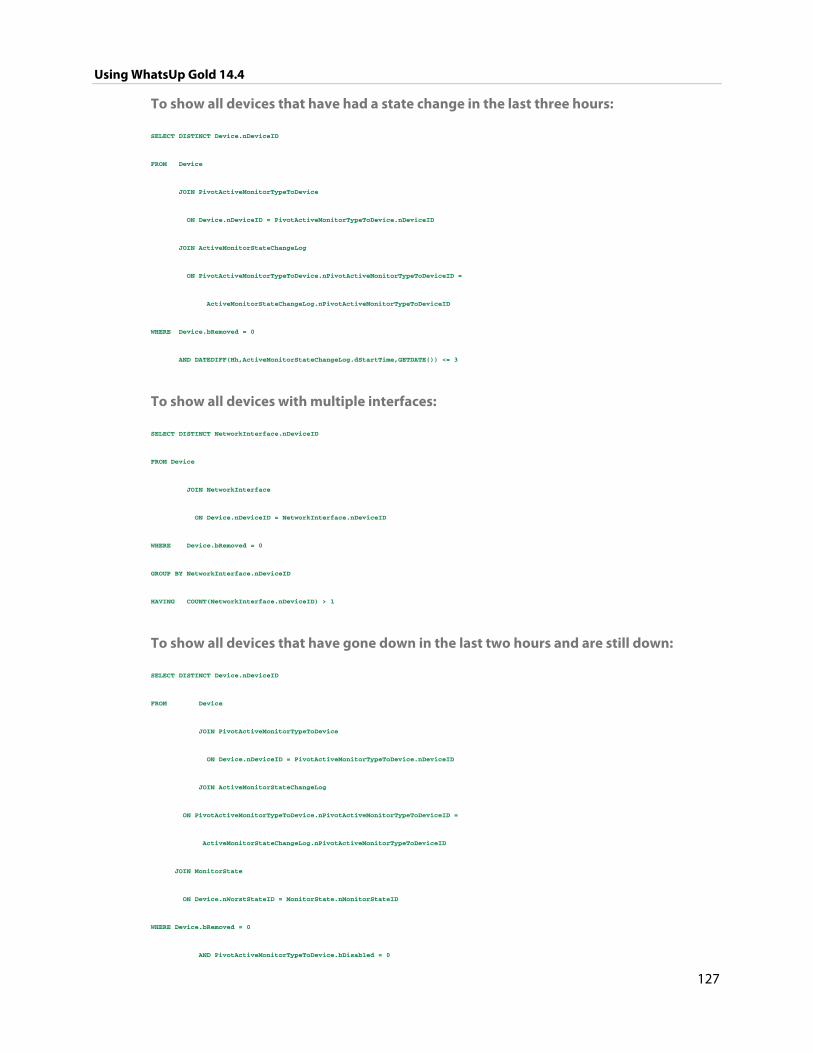
Using WhatsUp Gold 14.4
127
To show all devices that have had a state change in the last three hours:
SELECT DISTINCT Device.nDeviceID
FROM Device
JOIN PivotActiveMonitorTypeToDevice
ON Device.nDeviceID = PivotActiveMonitorTypeToDevice.nDeviceID
JOIN ActiveMonitorStateChangeLog
ON PivotActiveMonitorTypeToDevice.nPivotActiveMonitorTypeToDeviceID =
ActiveMonitorStateChangeLog.nPivotActiveMonitorTypeToDeviceID
WHERE Device.bRemoved = 0
AND DATEDIFF(Hh,ActiveMonitorStateChangeLog.dStartTime,GETDATE()) <= 3
To show all devices with multiple interfaces:
SELECT DISTINCT NetworkInterface.nDeviceID
FROM Device
JOIN NetworkInterface
ON Device.nDeviceID = NetworkInterface.nDeviceID
WHERE Device.bRemoved = 0
GROUP BY NetworkInterface.nDeviceID
HAVING COUNT(NetworkInterface.nDeviceID) > 1
To show all devices that have gone down in the last two hours and are still down:
SELECT DISTINCT Device.nDeviceID
FROM Device
JOIN PivotActiveMonitorTypeToDevice
ON Device.nDeviceID = PivotActiveMonitorTypeToDevice.nDeviceID
JOIN ActiveMonitorStateChangeLog
ON PivotActiveMonitorTypeToDevice.nPivotActiveMonitorTypeToDeviceID =
ActiveMonitorStateChangeLog.nPivotActiveMonitorTypeToDeviceID
JOIN MonitorState
ON Device.nWorstStateID = MonitorState.nMonitorStateID
WHERE Device.bRemoved = 0
AND PivotActiveMonitorTypeToDevice.bDisabled = 0
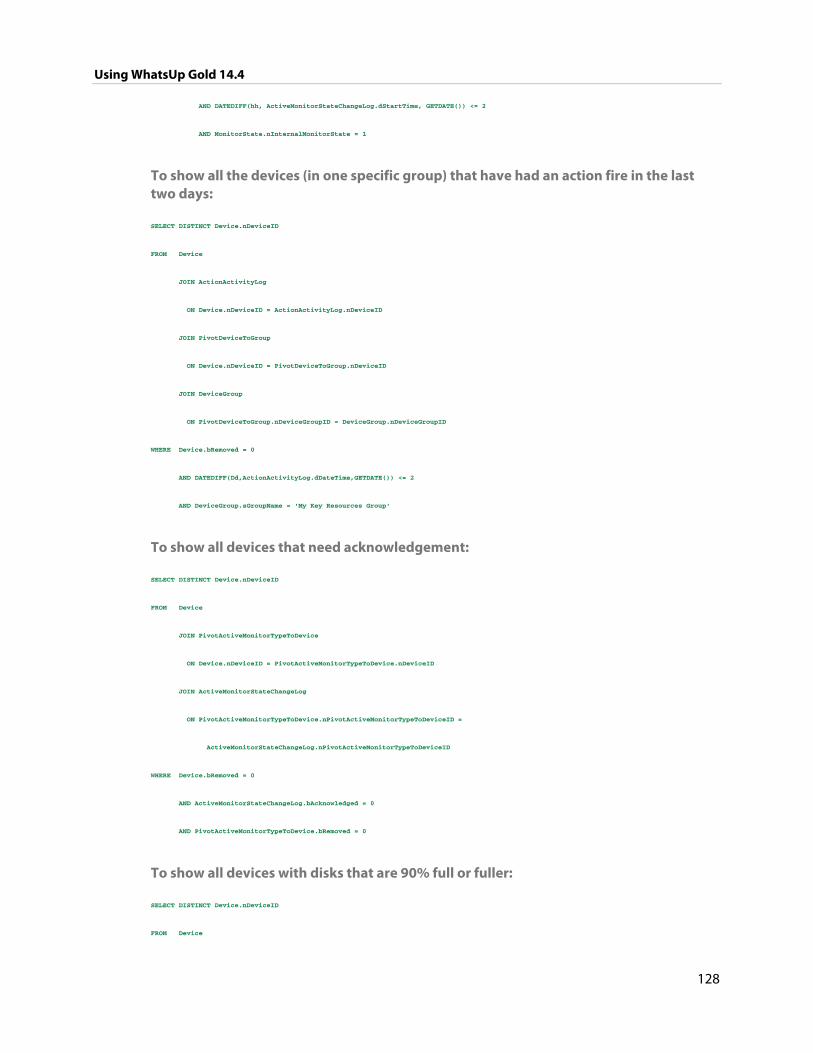
Using WhatsUp Gold 14.4
128
AND DATEDIFF(hh, ActiveMonitorStateChangeLog.dStartTime, GETDATE()) <= 2
AND MonitorState.nInternalMonitorState = 1
To show all the devices (in one specific group) that have had an action fire in the last two days:
SELECT DISTINCT Device.nDeviceID
FROM Device
JOIN ActionActivityLog
ON Device.nDeviceID = ActionActivityLog.nDeviceID
JOIN PivotDeviceToGroup
ON Device.nDeviceID = PivotDeviceToGroup.nDeviceID
JOIN DeviceGroup
ON PivotDeviceToGroup.nDeviceGroupID = DeviceGroup.nDeviceGroupID
WHERE Device.bRemoved = 0
AND DATEDIFF(Dd,ActionActivityLog.dDateTime,GETDATE()) <= 2
AND DeviceGroup.sGroupName = 'My Key Resources Group'
To show all devices that need acknowledgement:
SELECT DISTINCT Device.nDeviceID
FROM Device
JOIN PivotActiveMonitorTypeToDevice
ON Device.nDeviceID = PivotActiveMonitorTypeToDevice.nDeviceID
JOIN ActiveMonitorStateChangeLog
ON PivotActiveMonitorTypeToDevice.nPivotActiveMonitorTypeToDeviceID =
ActiveMonitorStateChangeLog.nPivotActiveMonitorTypeToDeviceID
WHERE Device.bRemoved = 0
AND ActiveMonitorStateChangeLog.bAcknowledged = 0
AND PivotActiveMonitorTypeToDevice.bRemoved = 0
To show all devices with disks that are 90% full or fuller:
SELECT DISTINCT Device.nDeviceID
FROM Device
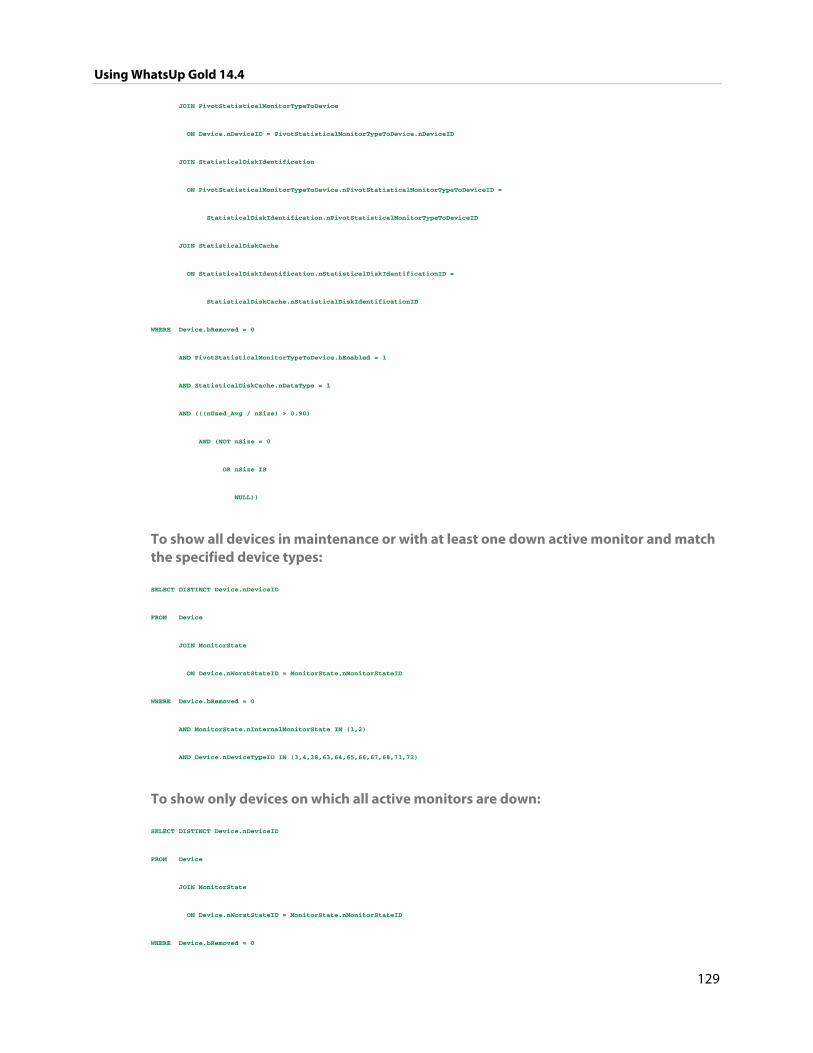
Using WhatsUp Gold 14.4
129
JOIN PivotStatisticalMonitorTypeToDevice
ON Device.nDeviceID = PivotStatisticalMonitorTypeToDevice.nDeviceID
JOIN StatisticalDiskIdentification
ON PivotStatisticalMonitorTypeToDevice.nPivotStatisticalMonitorTypeToDeviceID =
StatisticalDiskIdentification.nPivotStatisticalMonitorTypeToDeviceID
JOIN StatisticalDiskCache
ON StatisticalDiskIdentification.nStatisticalDiskIdentificationID =
StatisticalDiskCache.nStatisticalDiskIdentificationID
WHERE Device.bRemoved = 0
AND PivotStatisticalMonitorTypeToDevice.bEnabled = 1
AND StatisticalDiskCache.nDataType = 1
AND (((nUsed_Avg / nSize) > 0.90)
AND (NOT nSize = 0
OR nSize IS
NULL))
To show all devices in maintenance or with at least one down active monitor and match the specified device types:
SELECT DISTINCT Device.nDeviceID
FROM Device
JOIN MonitorState
ON Device.nWorstStateID = MonitorState.nMonitorStateID
WHERE Device.bRemoved = 0
AND MonitorState.nInternalMonitorState IN (1,2)
AND Device.nDeviceTypeID IN (3,4,38,63,64,65,66,67,68,71,72)
To show only devices on which all active monitors are down:
SELECT DISTINCT Device.nDeviceID
FROM Device
JOIN MonitorState
ON Device.nWorstStateID = MonitorState.nMonitorStateID
WHERE Device.bRemoved = 0
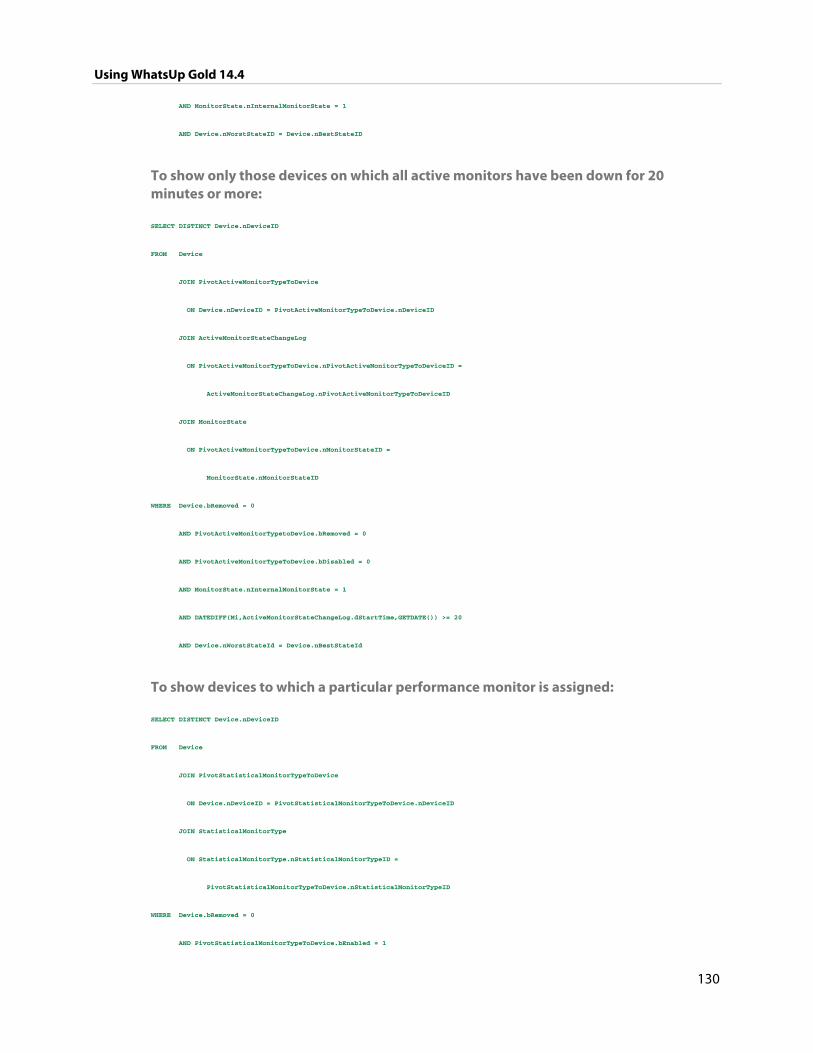
Using WhatsUp Gold 14.4
130
AND MonitorState.nInternalMonitorState = 1
AND Device.nWorstStateID = Device.nBestStateID
To show only those devices on which all active monitors have been down for 20 minutes or more:
SELECT DISTINCT Device.nDeviceID
FROM Device
JOIN PivotActiveMonitorTypeToDevice
ON Device.nDeviceID = PivotActiveMonitorTypeToDevice.nDeviceID
JOIN ActiveMonitorStateChangeLog
ON PivotActiveMonitorTypeToDevice.nPivotActiveMonitorTypeToDeviceID =
ActiveMonitorStateChangeLog.nPivotActiveMonitorTypeToDeviceID
JOIN MonitorState
ON PivotActiveMonitorTypeToDevice.nMonitorStateID =
MonitorState.nMonitorStateID
WHERE Device.bRemoved = 0
AND PivotActiveMonitorTypetoDevice.bRemoved = 0
AND PivotActiveMonitorTypeToDevice.bDisabled = 0
AND MonitorState.nInternalMonitorState = 1
AND DATEDIFF(Mi,ActiveMonitorStateChangeLog.dStartTime,GETDATE()) >= 20
AND Device.nWorstStateId = Device.nBestStateId
To show devices to which a particular performance monitor is assigned:
SELECT DISTINCT Device.nDeviceID
FROM Device
JOIN PivotStatisticalMonitorTypeToDevice
ON Device.nDeviceID = PivotStatisticalMonitorTypeToDevice.nDeviceID
JOIN StatisticalMonitorType
ON StatisticalMonitorType.nStatisticalMonitorTypeID =
PivotStatisticalMonitorTypeToDevice.nStatisticalMonitorTypeID
WHERE Device.bRemoved = 0
AND PivotStatisticalMonitorTypeToDevice.bEnabled = 1
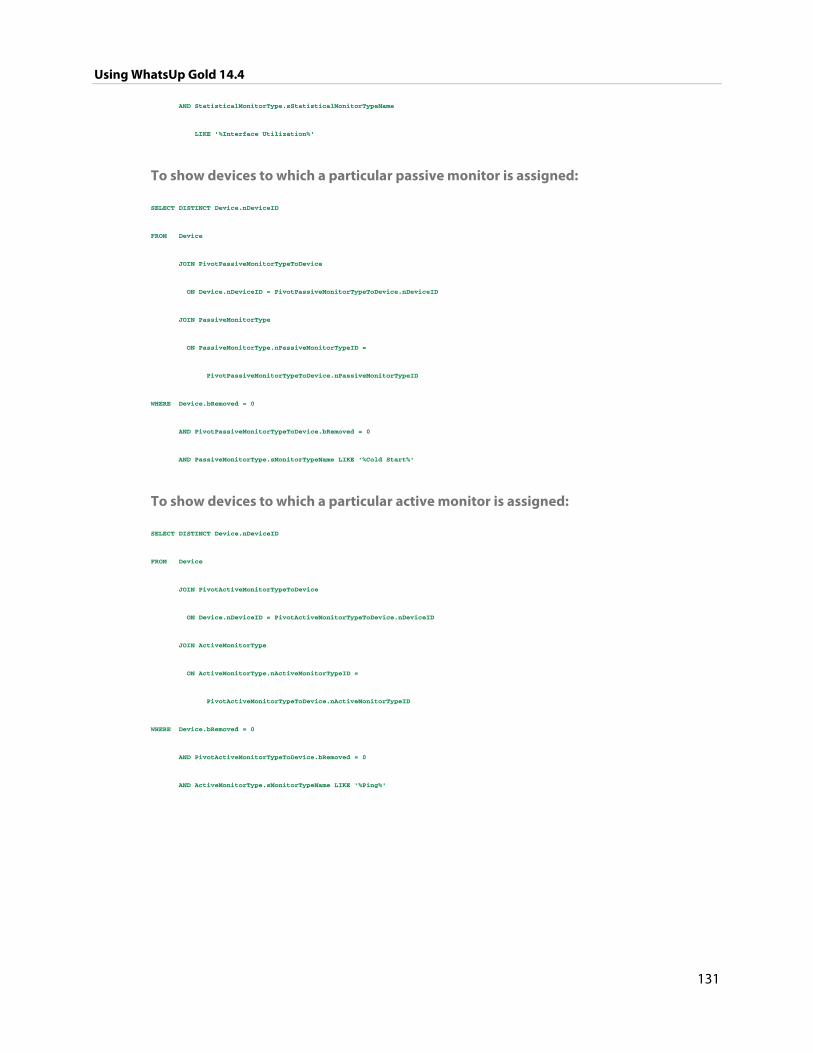
Using WhatsUp Gold 14.4
131
AND StatisticalMonitorType.sStatisticalMonitorTypeName
LIKE '%Interface Utilization%'
To show devices to which a particular passive monitor is assigned:
SELECT DISTINCT Device.nDeviceID
FROM Device
JOIN PivotPassiveMonitorTypeToDevice
ON Device.nDeviceID = PivotPassiveMonitorTypeToDevice.nDeviceID
JOIN PassiveMonitorType
ON PassiveMonitorType.nPassiveMonitorTypeID =
PivotPassiveMonitorTypeToDevice.nPassiveMonitorTypeID
WHERE Device.bRemoved = 0
AND PivotPassiveMonitorTypeToDevice.bRemoved = 0
AND PassiveMonitorType.sMonitorTypeName LIKE '%Cold Start%'
To show devices to which a particular active monitor is assigned:
SELECT DISTINCT Device.nDeviceID
FROM Device
JOIN PivotActiveMonitorTypeToDevice
ON Device.nDeviceID = PivotActiveMonitorTypeToDevice.nDeviceID
JOIN ActiveMonitorType
ON ActiveMonitorType.nActiveMonitorTypeID =
PivotActiveMonitorTypeToDevice.nActiveMonitorTypeID
WHERE Device.bRemoved = 0
AND PivotActiveMonitorTypeToDevice.bRemoved = 0
AND ActiveMonitorType.sMonitorTypeName LIKE '%Ping%'
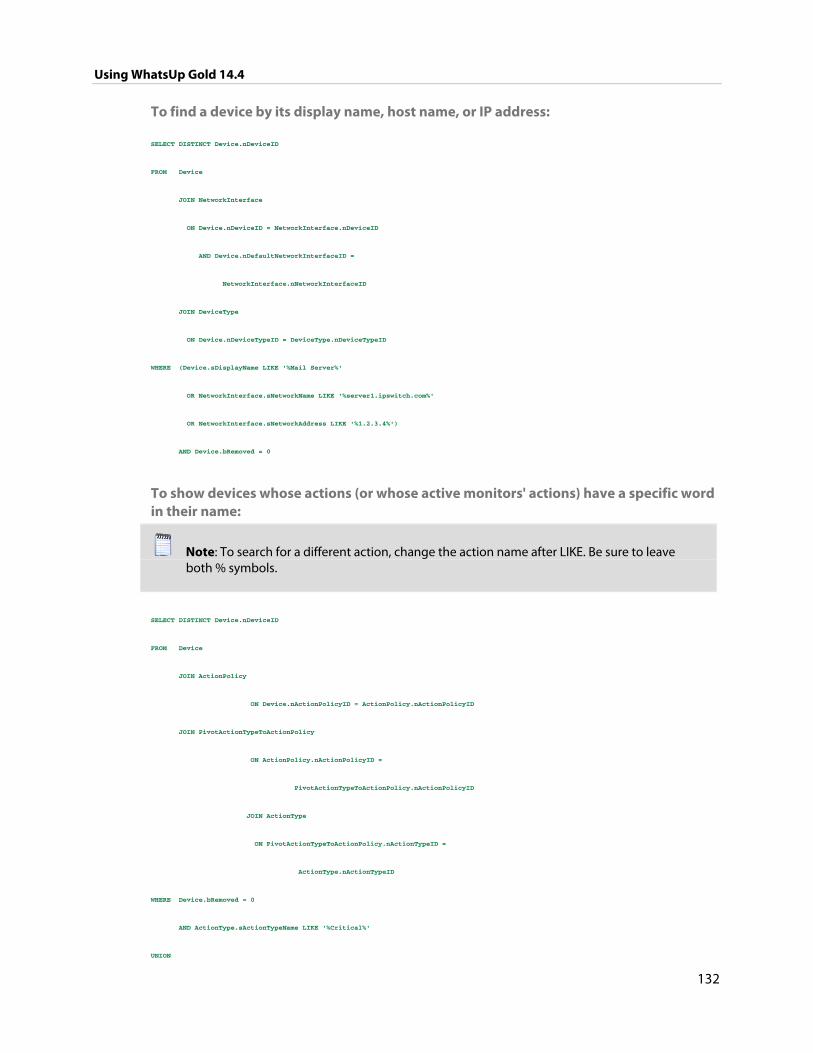
Using WhatsUp Gold 14.4
132
To find a device by its display name, host name, or IP address:
SELECT DISTINCT Device.nDeviceID
FROM Device
JOIN NetworkInterface
ON Device.nDeviceID = NetworkInterface.nDeviceID
AND Device.nDefaultNetworkInterfaceID =
NetworkInterface.nNetworkInterfaceID
JOIN DeviceType
ON Device.nDeviceTypeID = DeviceType.nDeviceTypeID
WHERE (Device.sDisplayName LIKE '%Mail Server%'
OR NetworkInterface.sNetworkName LIKE '%server1.ipswitch.com%'
OR NetworkInterface.sNetworkAddress LIKE '%1.2.3.4%')
AND Device.bRemoved = 0
To show devices whose actions (or whose active monitors' actions) have a specific word in their name:
Note: To search for a different action, change the action name after LIKE. Be sure to leave both % symbols.
SELECT DISTINCT Device.nDeviceID
FROM Device
JOIN ActionPolicy
ON Device.nActionPolicyID = ActionPolicy.nActionPolicyID
JOIN PivotActionTypeToActionPolicy
ON ActionPolicy.nActionPolicyID =
PivotActionTypeToActionPolicy.nActionPolicyID
JOIN ActionType
ON PivotActionTypeToActionPolicy.nActionTypeID =
ActionType.nActionTypeID
WHERE Device.bRemoved = 0
AND ActionType.sActionTypeName LIKE '%Critical%'
UNION
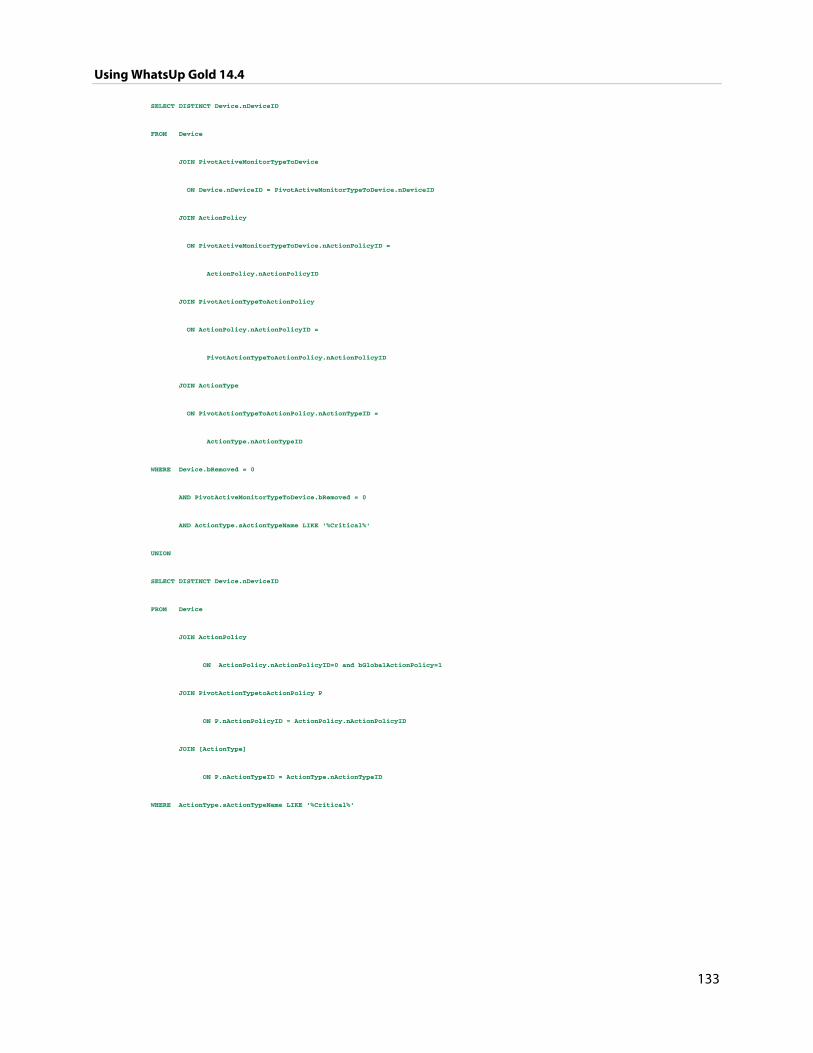
Using WhatsUp Gold 14.4
133
SELECT DISTINCT Device.nDeviceID
FROM Device
JOIN PivotActiveMonitorTypeToDevice
ON Device.nDeviceID = PivotActiveMonitorTypeToDevice.nDeviceID
JOIN ActionPolicy
ON PivotActiveMonitorTypeToDevice.nActionPolicyID =
ActionPolicy.nActionPolicyID
JOIN PivotActionTypeToActionPolicy
ON ActionPolicy.nActionPolicyID =
PivotActionTypeToActionPolicy.nActionPolicyID
JOIN ActionType
ON PivotActionTypeToActionPolicy.nActionTypeID =
ActionType.nActionTypeID
WHERE Device.bRemoved = 0
AND PivotActiveMonitorTypeToDevice.bRemoved = 0
AND ActionType.sActionTypeName LIKE '%Critical%'
UNION
SELECT DISTINCT Device.nDeviceID
FROM Device
JOIN ActionPolicy
ON ActionPolicy.nActionPolicyID=0 and bGlobalActionPolicy=1
JOIN PivotActionTypetoActionPolicy P
ON P.nActionPolicyID = ActionPolicy.nActionPolicyID
JOIN [ActionType]
ON P.nActionTypeID = ActionType.nActionTypeID
WHERE ActionType.sActionTypeName LIKE '%Critical%'
Using WhatsUp Gold 14.4
134
Building Dynamic Groups 1 Enter a name and description for the new dynamic group:
Group Name. Enter a name for the Dynamic Group as it will appear in the WhatsUp Gold Device List.
Description (Optional). Enter a short description for the new Dynamic Group. This description is visible to all users who can open the dynamic group.
2 In Filter, select which groups to search for devices that match the dynamic group criteria.
Select All devices to show all devices that match the criteria of the dynamic group.
Select All devices in the parent group to show all devices that match the criteria of the dynamic group and are located in the group in which the dynamic group is located.
Select All devices in the parent group and its children groups to show all devices that match the criteria of the dynamic group and are located in the group in which the dynamic group is located or any of that group's children groups.
3 Create and edit rules to form an SQL filter for the Dynamic Group.
To begin writing the rules for your SQL filter, click Add. The Dynamic Group Editor appears.
4 In the Dynamic Group Editor, enter the appropriate information (for more information, see the help topic for this dialog). As you create rules, they are added to the Dynamic Group Builder dialog where you can add more rules, edit, or delete existing rules by clicking the Add, Edit, or Delete buttons.
Parentheses (single, double, triple, and quadruple) are available for use in your filter code - add them by selecting them from the lists before and after your rules.
You can move existing rules up or down within your filter code by selecting a rule and then clicking on the Up and Down buttons.
Validating your filter code Keep in mind that as you configure your rules, the SQL filter is displayed at the bottom of the Builder dialog. When you are satisfied with the filter code that is displayed, click the Validate button to test the filter code sytnax. If the test returns no errors, click OK to save the configured SQL filter and to add the new Dynamic Group to your Device List.
If the code returns errors, either make the needed changes at this time, then click OK. Additionally, you have the option to save the filter code so that you may edit it at a later time. You can then select the Dynamic Group from the Device List and right-click, then select Properties to edit the group filter code.

Using WhatsUp Gold 14.4
135
Converting your filter code You can convert a Dynamic Group created with the Dynamic Group Builder to the SQL dialog by clicking the Convert button. It is important to note that once you convert the Dynamic Group to the SQL dialog, you will not be able to edit the group in the Dynamic Group Builder again - you will only be able to make changes to the group from the SQL dialog. If you aren't an advanced SQL user, we recommend that you make a copy of the Dynamic Group so that you can keep a copy available for edit in the Dynamic Group Builder.
136
CHAPTER 13
About Polling
In This Chapter
Polling overview ............................................................................................... 136
Dependencies overview ................................................................................ 138
IPX support ......................................................................................................... 144
Polling overview Polling is the active watching, or monitoring, of your network by WhatsUp Gold. This is done in a variety of ways, depending on the service monitors you have configured on your devices. The default polling method is done through Internet Control Message Protocol (ICMP). The default polling interval for WhatsUp Gold is 60 seconds.
A small amount of data is sent from the WhatsUp Gold computer across the network to the device it is watching. If the device is up, it echoes the data back to the WhatsUp Gold computer. A device is considered down by WhatsUp Gold when it does not send the data back.
Changing how you poll devices
After a device is added to the database, WhatsUp Gold begins watching that device using ICMP (Internet Control Message Protocol). WhatsUp Gold 'bounces' a message off of the device, then waits for the echo reply. If the reply is not returned, WhatsUp Gold considers it unresponsive device and changes the status color of the device.
By default, WhatsUp Gold uses the IP address of the device to send this message. You can change this to use the Host name or the Windows name of the computer, and you can change the means it uses to poll the devices.
To change how you poll a device:
1 Double-click on the device you want to edit to view Device Properties.
2 Click the General icon.
3 Select the type of poll you want to check the device with in the Polling type list box.
4 Select IP address or Host name from the Poll using list box.
5 If you select Host name in the Poll using box, you must complete the Host name box.
6 Click OK to save changes.
This is useful if you want to monitor a device that has a dynamic IP address instead of an address assigned to that device. You will need to choose Poll using Host name so the DNS will be able to find the device on the network.
Using WhatsUp Gold 14.4
137
Using Maintenance mode
This feature lets you place devices in Maintenance mode, where they will not be polled by the engine.
Any device placed in maintenance mode is not polled, and actions are not fired for it, but it remains in the device list and historical data is preserved. By default, the maintenance state is represented by an orange color in both the device list view and the map view.
Device view
Map view
The mode can be set in two ways:
Force this device into maintenance mode now. Set this device options manually by selecting Device Properties > Polling.
Scheduled maintenance times. Schedule maintenance times for the device.
Click Add to schedule a new maintenance time for the device.
Select an existing entry, then click Edit to change a scheduled time.
Select an existing entry, then click Remove to delete a scheduled time from the list.
Setting how often your devices are polled
The default polling interval is 60 second. You can change this on a per-device basis.
1 Double-click on the device you want to edit to view Device Properties.
2 Click the Polling icon to view the Polling section of Device Properties.
3 Change the interval in the Poll Frequency box.
4 Click OK to save changes.
Stopping and starting polling
To stop or start the polling on all devices by turning the polling engine off or on:
1 From the console main menu, click Configure > Program Options. 2 Click the General icon.
3 Select Enable polling engine to turn on polling. Clear the selection to turn polling off.
4 Click OK to save changes.
Tip: In the bottom right corner of the WhatsUp Gold console, the Polling icon shows if the engine is active.
Using WhatsUp Gold 14.4
138
Stopping and starting polling on a monitor
To stop and start polling on a per-monitor basis:
1 Double-click on the device you want to edit to view Device Properties.
2 Click the Active Monitor icon.
3 Select the Active Monitor you want to change the polling on.
4 Click Edit to view the Monitor Properties for that monitor.
5 Click the Polling icon.
6 Select Enable polling for this Active Monitor to turn polling on, clear the option to turn it off.
7 Click OK to save changes.
Dependencies overview By default, WhatsUp Gold polls all of the devices and active monitors on your Device List, often creating unnecessary overhead by polling devices whose state could be assumed based on the status of other devices. The dependency feature reduces polling overhead in these cases by allowing you to create conditions under which a device will not be polled. These conditions determine if a dependent device is to be polled based on the state of another device which is the target of the dependency. The state of the target device is determined by the state of one or more of its active monitors. You can establish dependencies on either the up or down states of these active monitors, resulting in Up dependencies, or Down dependencies.
Up Dependencies An up dependency establishes a condition so that a device is polled only if the selected active monitors on a second device are in the up state. The device can be thought of as being “behind” the device to which it has a dependency, so that it will only be polled if the device "in front" of it is up.
Example
In this example, an active monitor has been configured for each of the devices, and is denoted using Ping (device_name). Without dependencies, WhatsUp Gold attempts to poll the Ping monitors on the hosts even if the switch has been powered down, or is otherwise unreachable. This situation results in network and system overhead that could be avoided by creating up dependencies on the hosts.
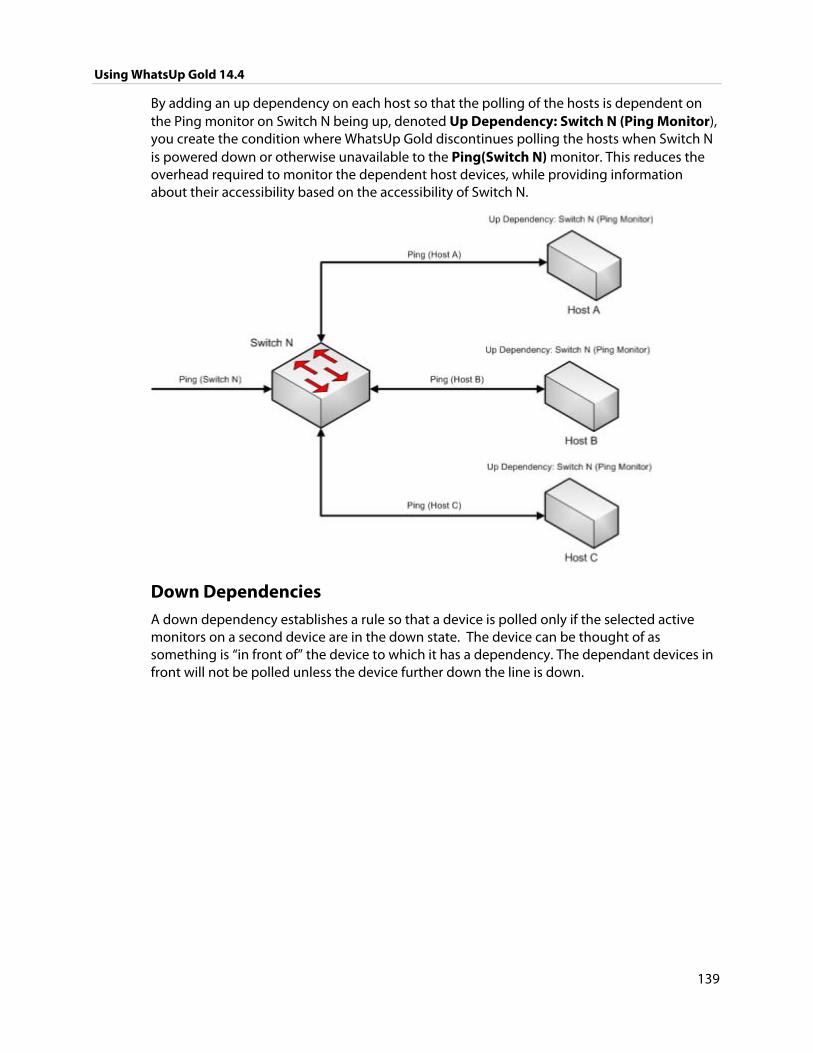
Using WhatsUp Gold 14.4
139
By adding an up dependency on each host so that the polling of the hosts is dependent on the Ping monitor on Switch N being up, denoted Up Dependency: Switch N (Ping Monitor), you create the condition where WhatsUp Gold discontinues polling the hosts when Switch N is powered down or otherwise unavailable to the Ping(Switch N) monitor. This reduces the overhead required to monitor the dependent host devices, while providing information about their accessibility based on the accessibility of Switch N.
Down Dependencies A down dependency establishes a rule so that a device is polled only if the selected active monitors on a second device are in the down state. The device can be thought of as something is “in front of” the device to which it has a dependency. The dependant devices in front will not be polled unless the device further down the line is down.
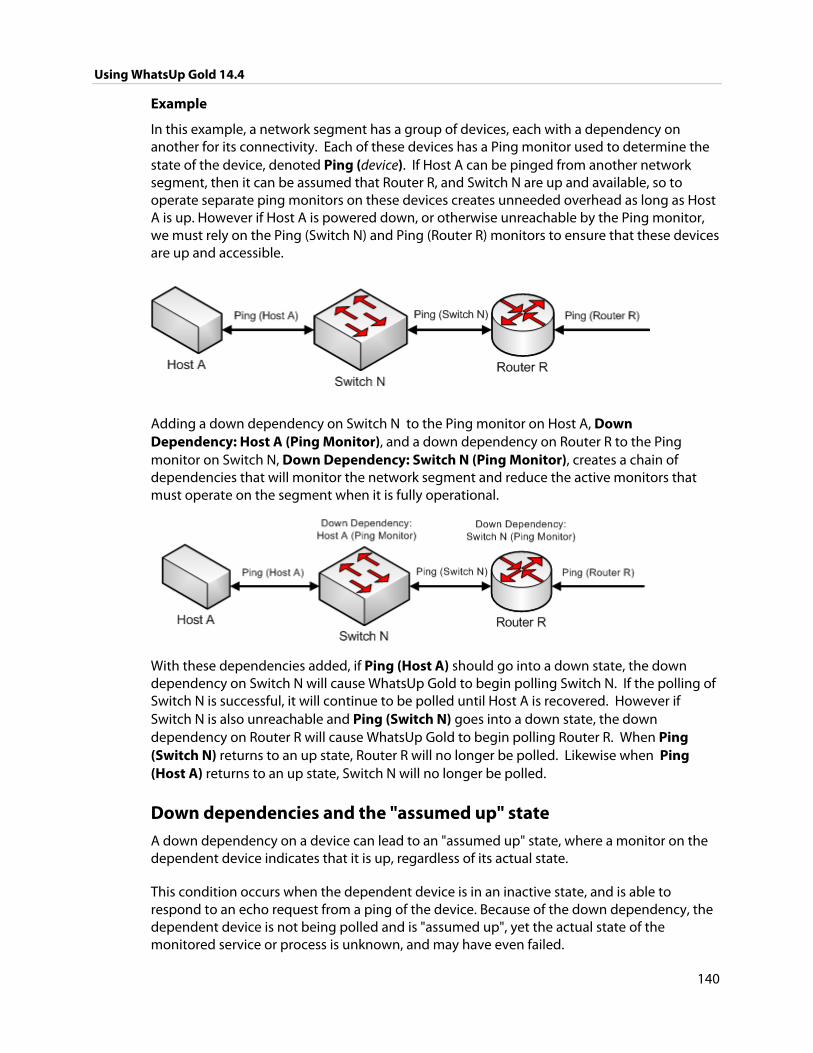
Using WhatsUp Gold 14.4
140
Example
In this example, a network segment has a group of devices, each with a dependency on another for its connectivity. Each of these devices has a Ping monitor used to determine the state of the device, denoted Ping (device). If Host A can be pinged from another network segment, then it can be assumed that Router R, and Switch N are up and available, so to operate separate ping monitors on these devices creates unneeded overhead as long as Host A is up. However if Host A is powered down, or otherwise unreachable by the Ping monitor, we must rely on the Ping (Switch N) and Ping (Router R) monitors to ensure that these devices are up and accessible.
Adding a down dependency on Switch N to the Ping monitor on Host A, Down Dependency: Host A (Ping Monitor), and a down dependency on Router R to the Ping monitor on Switch N, Down Dependency: Switch N (Ping Monitor), creates a chain of dependencies that will monitor the network segment and reduce the active monitors that must operate on the segment when it is fully operational.
With these dependencies added, if Ping (Host A) should go into a down state, the down dependency on Switch N will cause WhatsUp Gold to begin polling Switch N. If the polling of Switch N is successful, it will continue to be polled until Host A is recovered. However if Switch N is also unreachable and Ping (Switch N) goes into a down state, the down dependency on Router R will cause WhatsUp Gold to begin polling Router R. When Ping (Switch N) returns to an up state, Router R will no longer be polled. Likewise when Ping (Host A) returns to an up state, Switch N will no longer be polled.
Down dependencies and the "assumed up" state A down dependency on a device can lead to an "assumed up" state, where a monitor on the dependent device indicates that it is up, regardless of its actual state.
This condition occurs when the dependent device is in an inactive state, and is able to respond to an echo request from a ping of the device. Because of the down dependency, the dependent device is not being polled and is "assumed up", yet the actual state of the monitored service or process is unknown, and may have even failed.
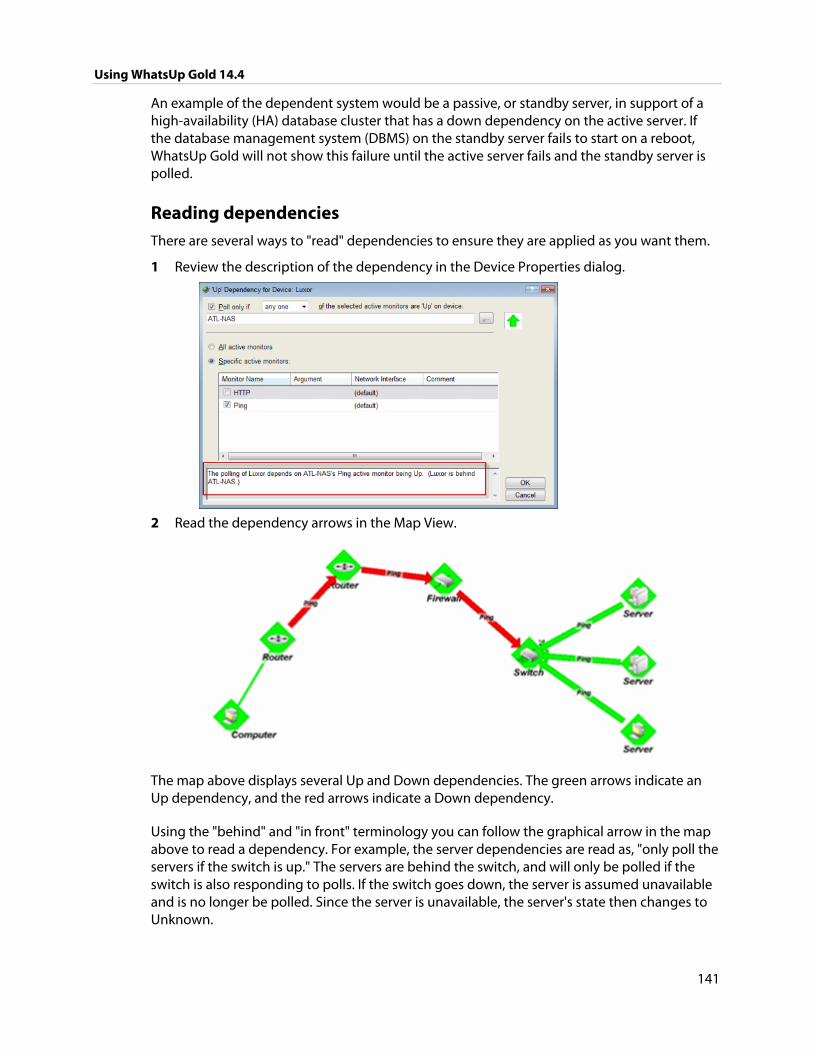
Using WhatsUp Gold 14.4
141
An example of the dependent system would be a passive, or standby server, in support of a high-availability (HA) database cluster that has a down dependency on the active server. If the database management system (DBMS) on the standby server fails to start on a reboot, WhatsUp Gold will not show this failure until the active server fails and the standby server is polled.
Reading dependencies There are several ways to "read" dependencies to ensure they are applied as you want them.
1 Review the description of the dependency in the Device Properties dialog.
2 Read the dependency arrows in the Map View.
The map above displays several Up and Down dependencies. The green arrows indicate an Up dependency, and the red arrows indicate a Down dependency.
Using the "behind" and "in front" terminology you can follow the graphical arrow in the map above to read a dependency. For example, the server dependencies are read as, "only poll the servers if the switch is up." The servers are behind the switch, and will only be polled if the switch is also responding to polls. If the switch goes down, the server is assumed unavailable and is no longer be polled. Since the server is unavailable, the server's state then changes to Unknown.
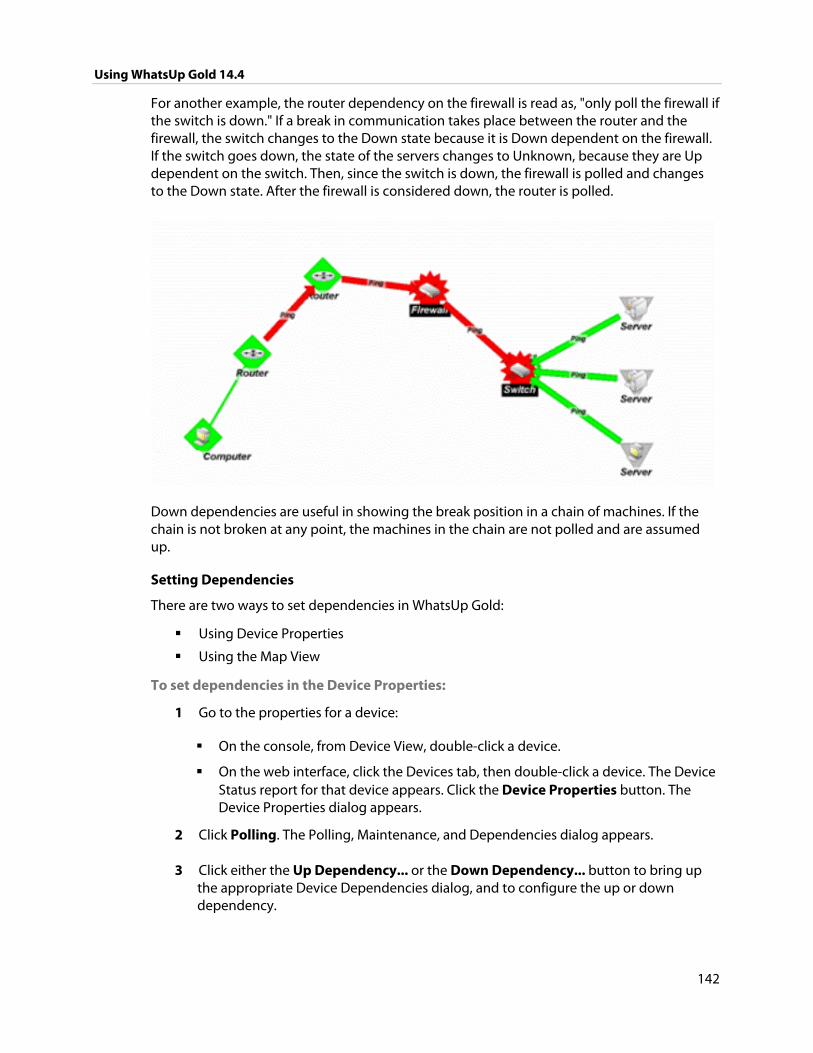
Using WhatsUp Gold 14.4
142
For another example, the router dependency on the firewall is read as, "only poll the firewall if the switch is down." If a break in communication takes place between the router and the firewall, the switch changes to the Down state because it is Down dependent on the firewall. If the switch goes down, the state of the servers changes to Unknown, because they are Up dependent on the switch. Then, since the switch is down, the firewall is polled and changes to the Down state. After the firewall is considered down, the router is polled.
Down dependencies are useful in showing the break position in a chain of machines. If the chain is not broken at any point, the machines in the chain are not polled and are assumed up.
Setting Dependencies
There are two ways to set dependencies in WhatsUp Gold:
Using Device Properties
Using the Map View
To set dependencies in the Device Properties:
1 Go to the properties for a device:
On the console, from Device View, double-click a device.
On the web interface, click the Devices tab, then double-click a device. The Device Status report for that device appears. Click the Device Properties button. The Device Properties dialog appears.
2 Click Polling. The Polling, Maintenance, and Dependencies dialog appears.
3 Click either the Up Dependency... or the Down Dependency... button to bring up the appropriate Device Dependencies dialog, and to configure the up or down dependency.
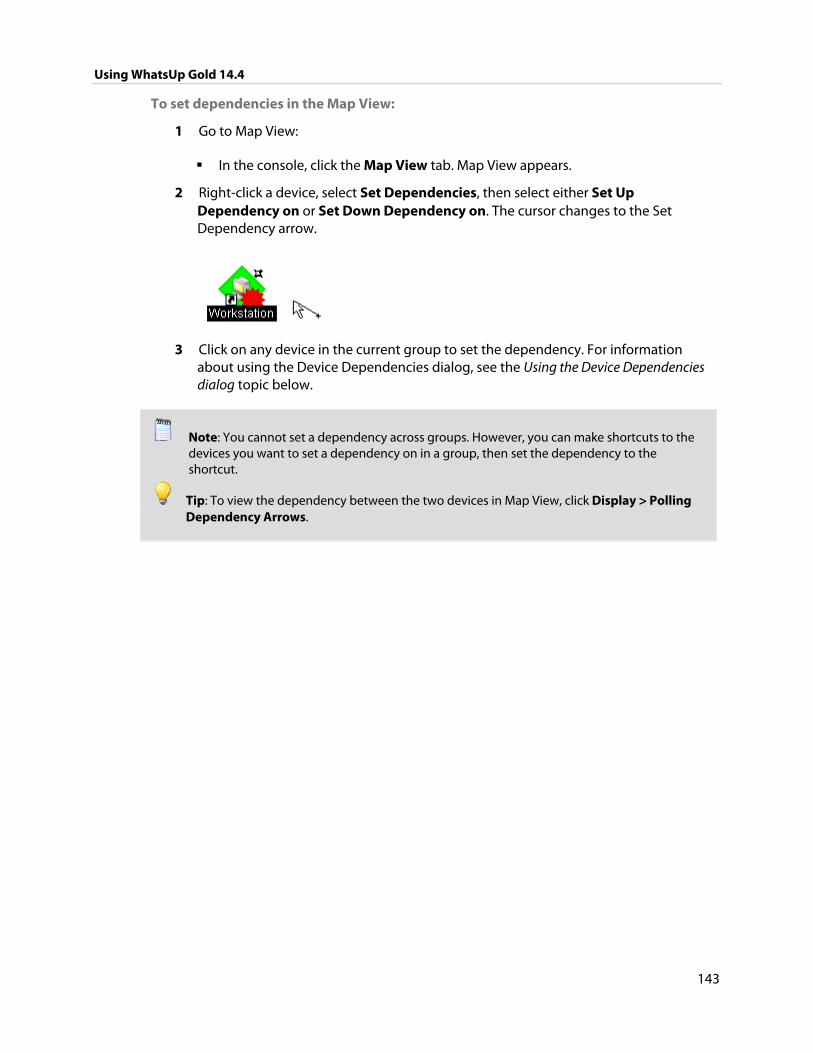
Using WhatsUp Gold 14.4
143
To set dependencies in the Map View:
1 Go to Map View:
In the console, click the Map View tab. Map View appears.
2 Right-click a device, select Set Dependencies, then select either Set Up Dependency on or Set Down Dependency on. The cursor changes to the Set Dependency arrow.
3 Click on any device in the current group to set the dependency. For information about using the Device Dependencies dialog, see the Using the Device Dependencies dialog topic below.
Note: You cannot set a dependency across groups. However, you can make shortcuts to the devices you want to set a dependency on in a group, then set the dependency to the shortcut.
Tip: To view the dependency between the two devices in Map View, click Display > Polling Dependency Arrows.
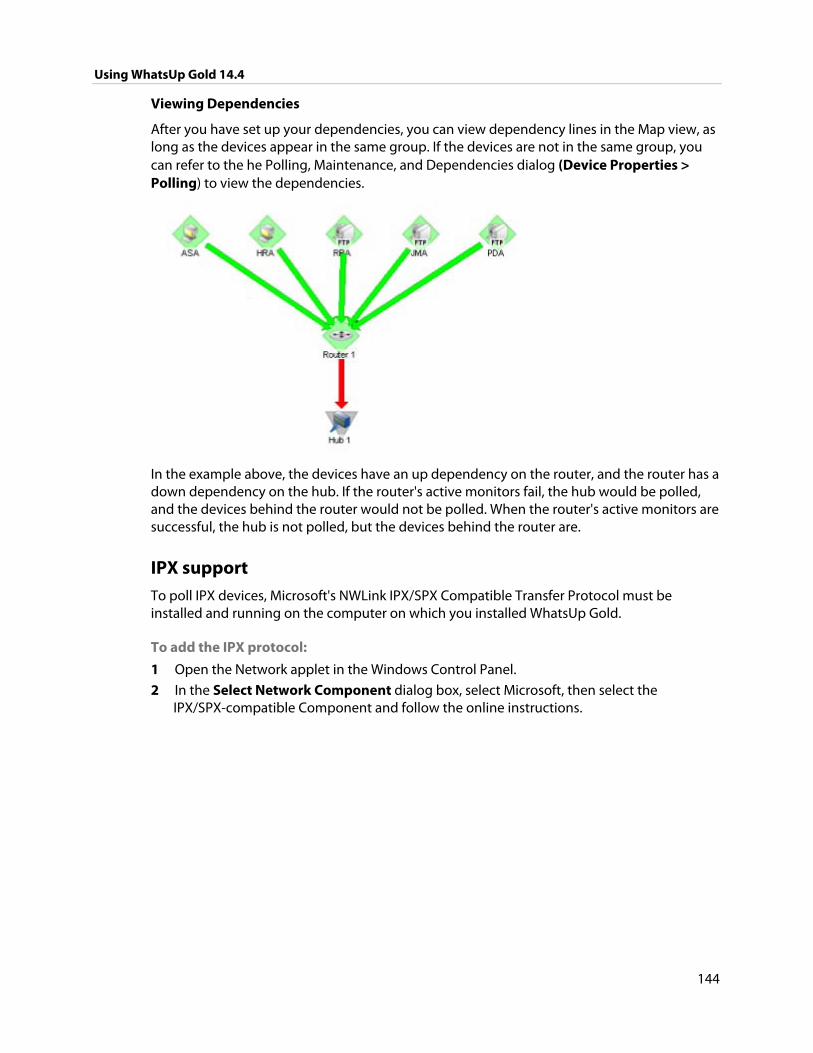
Using WhatsUp Gold 14.4
144
Viewing Dependencies
After you have set up your dependencies, you can view dependency lines in the Map view, as long as the devices appear in the same group. If the devices are not in the same group, you can refer to the he Polling, Maintenance, and Dependencies dialog (Device Properties > Polling) to view the dependencies.
In the example above, the devices have an up dependency on the router, and the router has a down dependency on the hub. If the router's active monitors fail, the hub would be polled, and the devices behind the router would not be polled. When the router's active monitors are successful, the hub is not polled, but the devices behind the router are.
IPX support To poll IPX devices, Microsoft's NWLink IPX/SPX Compatible Transfer Protocol must be installed and running on the computer on which you installed WhatsUp Gold.
To add the IPX protocol:
1 Open the Network applet in the Windows Control Panel.
2 In the Select Network Component dialog box, select Microsoft, then select the IPX/SPX-compatible Component and follow the online instructions.
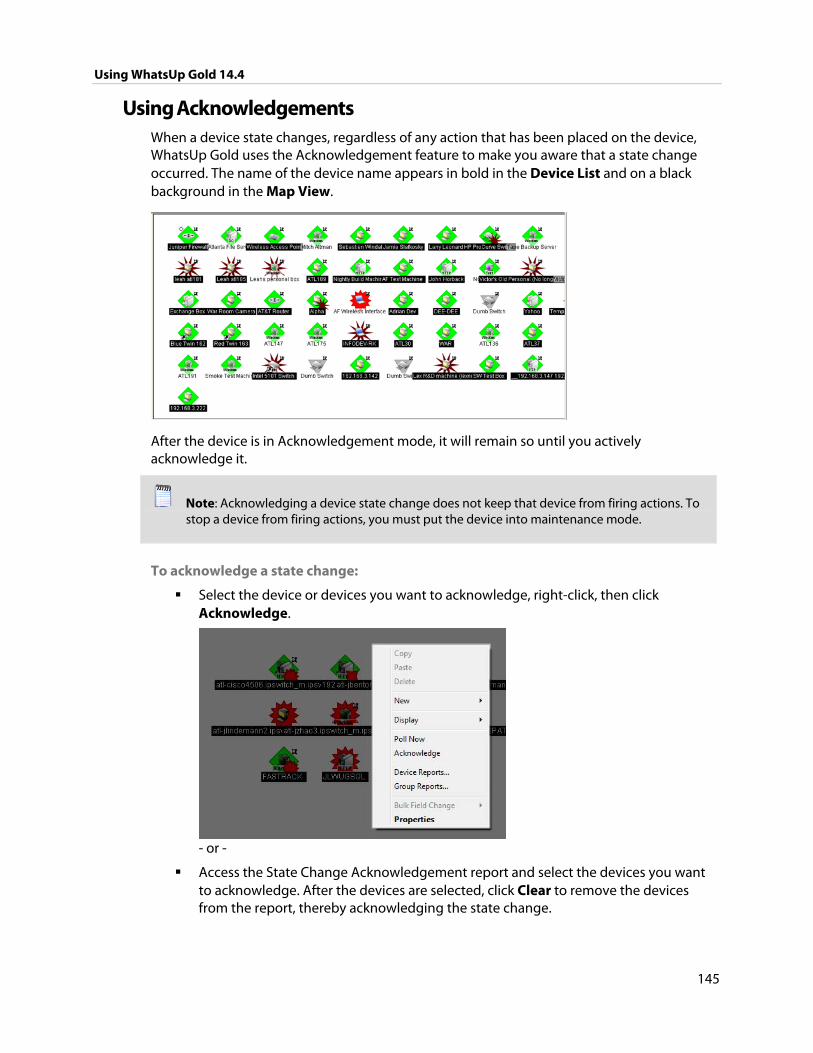
Using WhatsUp Gold 14.4
145
Using Acknowledgements When a device state changes, regardless of any action that has been placed on the device, WhatsUp Gold uses the Acknowledgement feature to make you aware that a state change occurred. The name of the device name appears in bold in the Device List and on a black background in the Map View.
After the device is in Acknowledgement mode, it will remain so until you actively acknowledge it.
Note: Acknowledging a device state change does not keep that device from firing actions. To stop a device from firing actions, you must put the device into maintenance mode.
To acknowledge a state change:
Select the device or devices you want to acknowledge, right-click, then click Acknowledge.
- or -
Access the State Change Acknowledgement report and select the devices you want to acknowledge. After the devices are selected, click Clear to remove the devices from the report, thereby acknowledging the state change.

146
CHAPTER 14
Using Maps
In This Chapter
Using the Map View ......................................................................................... 146
Organizing devices .......................................................................................... 149
Adding annotations to a map ...................................................................... 150
Using link lines ................................................................................................... 154
Using attached lines ........................................................................................ 156
Using device types ........................................................................................... 157
Using grid properties ...................................................................................... 157
Grouping objects .............................................................................................. 158
Locking the position of map objects ......................................................... 159
Using the Map View As you discover devices on your network, WhatsUp Gold creates a map of the initial discovery device group. You can configure this map, or create other device groups and configure maps for these groups as you see fit. Regardless of the groups for which you configure maps, you can configure all maps in a variety of ways:
Organize devices into user-specified groups, for example, all HTTP servers.
Customize individual device icons such as workstations, containers, routers, and bridges.
Indicate relationships among devices by using annotation objects such as rectangles, ellipses, text, network clouds, and "attached" or "free" lines.
Show status of network link lines.
Map View is accessed on the Devices tab under View > Map View.
Interpreting the Map View The Map View consists of device icons, annotations, and graphical indicators which are used to represent the state of your network. The device icon is a graphical representation of the device and provides the hostname or IP address of the device. The device icon can be modified adding annotations, which you can add manually, and by graphical indicators which are automatically applied to device icons.
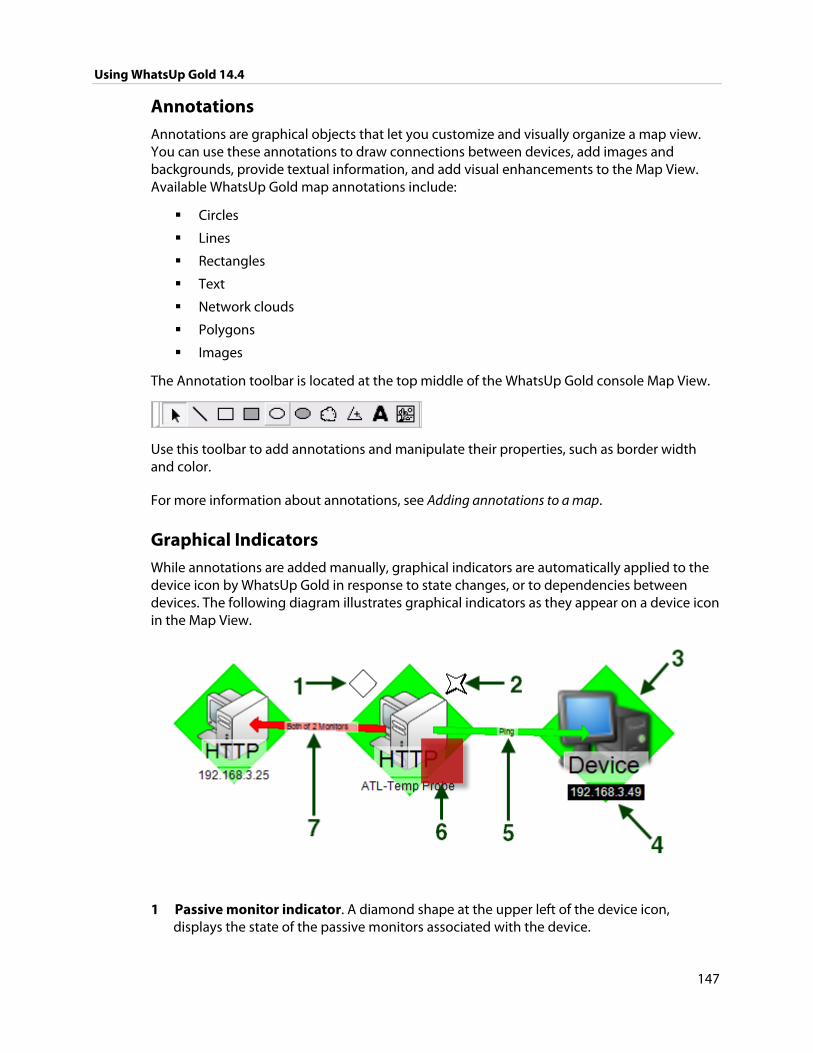
Using WhatsUp Gold 14.4
147
Annotations Annotations are graphical objects that let you customize and visually organize a map view. You can use these annotations to draw connections between devices, add images and backgrounds, provide textual information, and add visual enhancements to the Map View. Available WhatsUp Gold map annotations include:
Circles
Lines
Rectangles
Text
Network clouds
Polygons
Images
The Annotation toolbar is located at the top middle of the WhatsUp Gold console Map View.
Use this toolbar to add annotations and manipulate their properties, such as border width and color.
For more information about annotations, see Adding annotations to a map.
Graphical Indicators While annotations are added manually, graphical indicators are automatically applied to the device icon by WhatsUp Gold in response to state changes, or to dependencies between devices. The following diagram illustrates graphical indicators as they appear on a device icon in the Map View.
1 Passive monitor indicator. A diamond shape at the upper left of the device icon, displays the state of the passive monitors associated with the device.
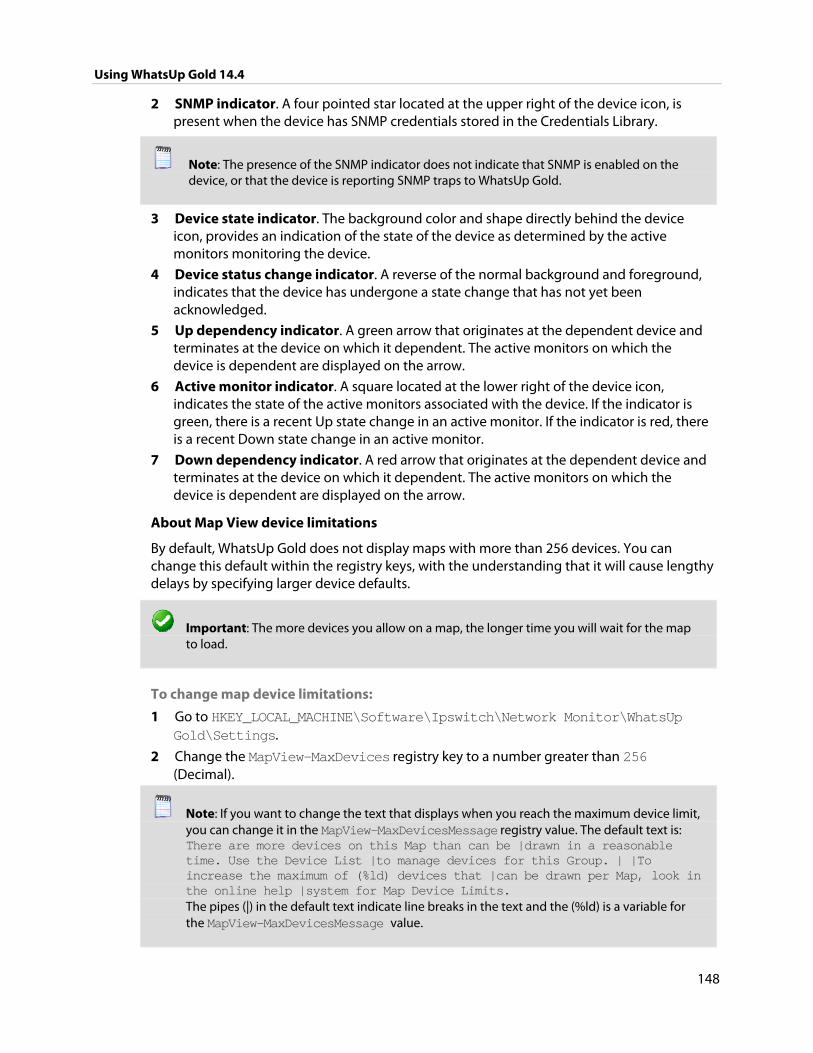
Using WhatsUp Gold 14.4
148
2 SNMP indicator. A four pointed star located at the upper right of the device icon, is present when the device has SNMP credentials stored in the Credentials Library.
Note: The presence of the SNMP indicator does not indicate that SNMP is enabled on the device, or that the device is reporting SNMP traps to WhatsUp Gold.
3 Device state indicator. The background color and shape directly behind the device icon, provides an indication of the state of the device as determined by the active monitors monitoring the device.
4 Device status change indicator. A reverse of the normal background and foreground, indicates that the device has undergone a state change that has not yet been acknowledged.
5 Up dependency indicator. A green arrow that originates at the dependent device and terminates at the device on which it dependent. The active monitors on which the device is dependent are displayed on the arrow.
6 Active monitor indicator. A square located at the lower right of the device icon, indicates the state of the active monitors associated with the device. If the indicator is green, there is a recent Up state change in an active monitor. If the indicator is red, there is a recent Down state change in an active monitor.
7 Down dependency indicator. A red arrow that originates at the dependent device and terminates at the device on which it dependent. The active monitors on which the device is dependent are displayed on the arrow.
About Map View device limitations
By default, WhatsUp Gold does not display maps with more than 256 devices. You can change this default within the registry keys, with the understanding that it will cause lengthy delays by specifying larger device defaults.
Important: The more devices you allow on a map, the longer time you will wait for the map to load.
To change map device limitations:
1 Go to HKEY_LOCAL_MACHINE\Software\Ipswitch\Network Monitor\WhatsUp Gold\Settings.
2 Change the MapView-MaxDevices registry key to a number greater than 256 (Decimal).
Note: If you want to change the text that displays when you reach the maximum device limit, you can change it in the MapView-MaxDevicesMessage registry value. The default text is: There are more devices on this Map than can be |drawn in a reasonable time. Use the Device List |to manage devices for this Group. | |To increase the maximum of (%ld) devices that |can be drawn per Map, look in the online help |system for Map Device Limits. The pipes (|) in the default text indicate line breaks in the text and the (%ld) is a variable for the MapView-MaxDevicesMessage value.
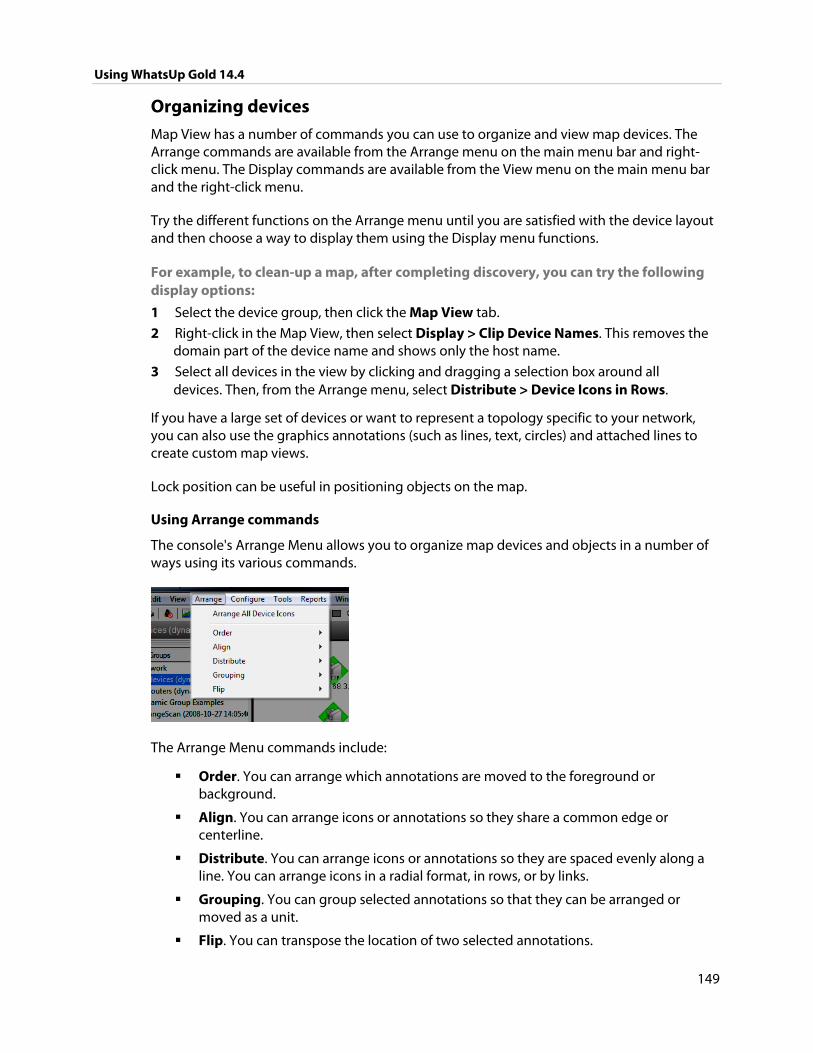
Using WhatsUp Gold 14.4
149
Organizing devices Map View has a number of commands you can use to organize and view map devices. The Arrange commands are available from the Arrange menu on the main menu bar and right-click menu. The Display commands are available from the View menu on the main menu bar and the right-click menu.
Try the different functions on the Arrange menu until you are satisfied with the device layout and then choose a way to display them using the Display menu functions.
For example, to clean-up a map, after completing discovery, you can try the following display options:
1 Select the device group, then click the Map View tab.
2 Right-click in the Map View, then select Display > Clip Device Names. This removes the domain part of the device name and shows only the host name.
3 Select all devices in the view by clicking and dragging a selection box around all devices. Then, from the Arrange menu, select Distribute > Device Icons in Rows.
If you have a large set of devices or want to represent a topology specific to your network, you can also use the graphics annotations (such as lines, text, circles) and attached lines to create custom map views.
Lock position can be useful in positioning objects on the map.
Using Arrange commands
The console's Arrange Menu allows you to organize map devices and objects in a number of ways using its various commands.
The Arrange Menu commands include:
Order. You can arrange which annotations are moved to the foreground or background.
Align. You can arrange icons or annotations so they share a common edge or centerline.
Distribute. You can arrange icons or annotations so they are spaced evenly along a line. You can arrange icons in a radial format, in rows, or by links.
Grouping. You can group selected annotations so that they can be arranged or moved as a unit.
Flip. You can transpose the location of two selected annotations.
Using WhatsUp Gold 14.4
150
For example, you can automatically arrange device icons:
1 In the toolbar, click the Select (arrow) tool, then click in the Map view and drag the cursor to draw a box around the icons you want to select.
2 Then select Arrange > Arrange All Device Icons. This feature arranges all device icons on the current map in equally spaced rows starting in the top left corner.
Using map display commands
Display commands let you change the visual representation of a map, and add annotations that help you monitor dependencies and active monitors. Right-click in Map View, then select from the following Display commands.
Device Icons. By default, the map displays icons for each device; you can alternatively choose to display dots or nodes.
Polling Dependency Arrows. If you have set up a device so that it gets polled only if a second device is down or up (a dependency), then by default you will see an arrow that shows this dependency. For example, if polling of device A is dependent on the state of device B, the arrow will point from device A to device B. You can alternatively opt to not display dependencies.
Unconnected Links. Select this command to display short lines for links that are not connected anywhere. For example, a network interface that is not connected to another device, or any active monitor (such as HTTP, or SMTP). Unconnected links are red for down active monitors, and green for up active monitors.
Snap to Grid. Select this command to display a grid and automatically align objects along your grid when they come within a certain distance of grid points.
Clip Device Names. Select this command if you want to shorten the device display names. When selected, the display names are terminated at the first space or period in the name. If the display name is a dotted decimal IP address, only the last digits of the IP address are displayed.
Wrap Device Names. Select this command to wrap long display names. When selected, the display names are wrapped at every space or period in the name.
Adding annotations to a map Annotations are graphical objects that let you customize and visually organize a map view.
Available WhatsUp Gold map annotations include:
Circles
Lines
Rectangles
Text
Network clouds
Polygons
Images
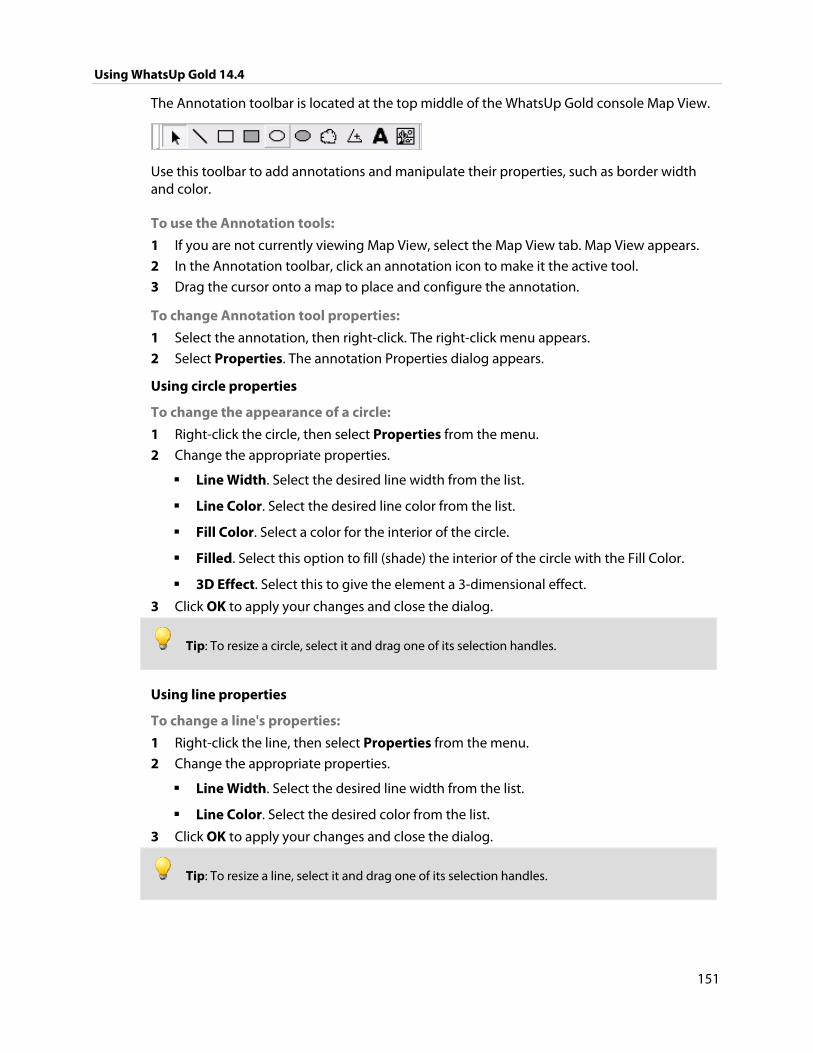
Using WhatsUp Gold 14.4
151
The Annotation toolbar is located at the top middle of the WhatsUp Gold console Map View.
Use this toolbar to add annotations and manipulate their properties, such as border width and color.
To use the Annotation tools:
1 If you are not currently viewing Map View, select the Map View tab. Map View appears.
2 In the Annotation toolbar, click an annotation icon to make it the active tool.
3 Drag the cursor onto a map to place and configure the annotation.
To change Annotation tool properties:
1 Select the annotation, then right-click. The right-click menu appears.
2 Select Properties. The annotation Properties dialog appears.
Using circle properties
To change the appearance of a circle:
1 Right-click the circle, then select Properties from the menu.
2 Change the appropriate properties.
Line Width. Select the desired line width from the list.
Line Color. Select the desired line color from the list.
Fill Color. Select a color for the interior of the circle.
Filled. Select this option to fill (shade) the interior of the circle with the Fill Color.
3D Effect. Select this to give the element a 3-dimensional effect.
3 Click OK to apply your changes and close the dialog.
Tip: To resize a circle, select it and drag one of its selection handles.
Using line properties
To change a line's properties:
1 Right-click the line, then select Properties from the menu.
2 Change the appropriate properties.
Line Width. Select the desired line width from the list.
Line Color. Select the desired color from the list.
3 Click OK to apply your changes and close the dialog.
Tip: To resize a line, select it and drag one of its selection handles.
Using WhatsUp Gold 14.4
152
Using rectangle properties
To change the appearance of a rectangle:
1 Right-click the rectangle, then select Properties from the menu.
2 Change the appropriate properties.
Line Width. Select the desired line width from the list.
Line Color. Select the desired line color from the list.
Fill Color. Select a color for the interior of the rectangle.
Filled. Select this option to fill (shade) the interior of the rectangle with the Fill Color.
Rounded. Select this to make the corners of a rectangle rounded.
3D Effect. Select this to give the element a 3-dimensional effect.
3 Click OK to apply your changes and close the dialog.
Tip: To resize a rectangle, select it and drag one of its selection handles.
Using text properties
To change text properties:
1 Right-click the text and then select Properties from the menu.
2 Change the appropriate properties.
Text. Enter the text you want to appear on your map.
Text Color. Select the desired text color from the list.
Background Color. Select the desired background color for the text.
Transparent. If this is selected, the text uses the background color of the map and appears only as text on the map. If this is not selected, the text can have its own background color on the map.
Rotation Degrees. Using your mouse, click the increments and notice the preview text changing its rotation. If you select the down arrow on the extreme right, you can rapidly change the rotation degrees of the text.
Font. Click this to change the font of the text.
3 Click OK to apply your changes and close the dialog.
Tip: To resize the text object, select it and drag one of its selection handles.
Using WhatsUp Gold 14.4
153
Using the network cloud
To change a network cloud’s properties:
1 Right-click the network cloud and then select Properties from the menu.
2 Change the appropriate properties.
Line Width. Select the desired line width from the list box.
Line Color. Select the desired line color from the list box.
Fill Color. Select a color for the interior of the network cloud.
Filled. Select this option to fill (shade) the interior of the network cloud with the Fill Color.
3D Effect. Select this to give the element a 3-dimensional effect.
3 Click OK to apply your changes and close the dialog box.
Tip: To resize a cloud, select it and drag one of its selection handles.
Using polygon properties
To change the appearance of a polygon:
1 Right-click the polygon, then select Properties from the menu.
2 Change the appropriate properties.
Line Width. Select the desired line width from the list.
Line Color. Select the desired line color from the list.
Fill Color. Select a color for the interior of the polygon.
Filled. Select this option to fill (shade) the interior of the polygon with the Fill Color.
3D Effect. Select this to give the element a 3-dimensional effect.
3 Click OK to apply your changes and close the dialog.
Tip: To resize a polygon, select it and drag one of its selection handles.
Using image properties
Tip: You can import images over which to arrange map device icons. For example, import an image of your office layout and place map devices in their respective locations.
To import an image for use in a map:
1 Click the image icon on the Annotation toolbar.
2 Select the area on the map where you would like the image. The Image Properties dialog appears.
3 Browse (...) to the image file that you would like to import.
4 Click OK to import the image.
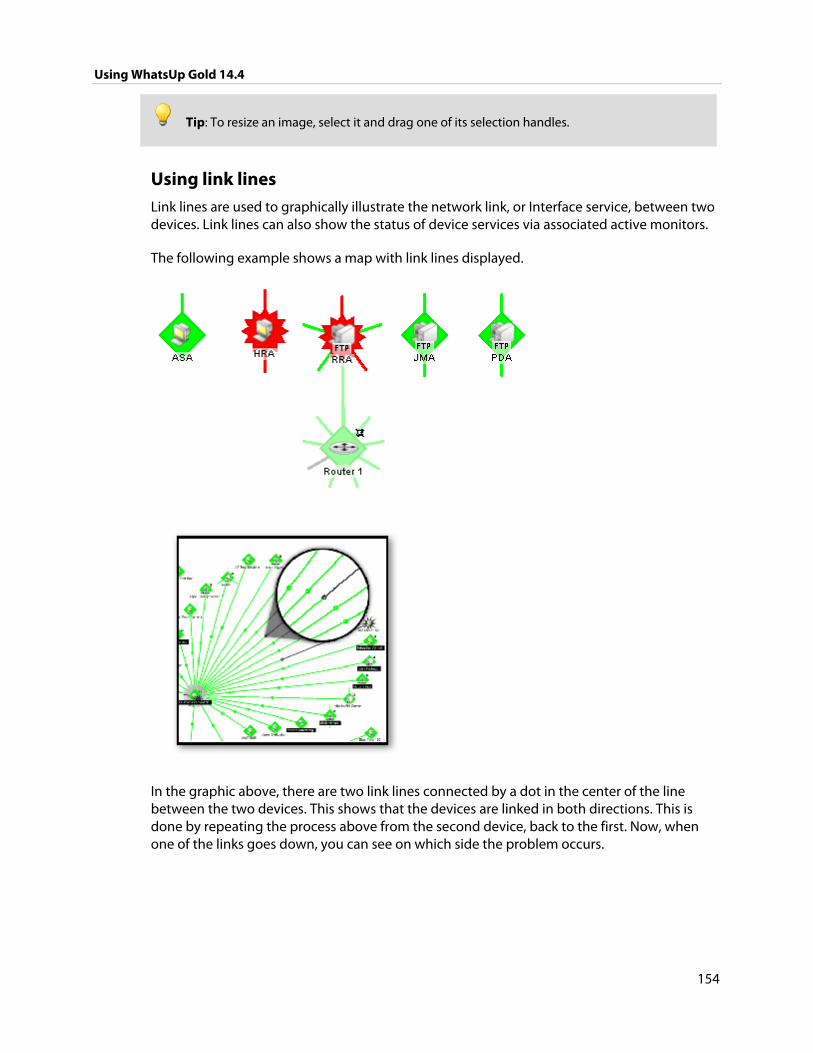
Using WhatsUp Gold 14.4
154
Tip: To resize an image, select it and drag one of its selection handles.
Using link lines Link lines are used to graphically illustrate the network link, or Interface service, between two devices. Link lines can also show the status of device services via associated active monitors.
The following example shows a map with link lines displayed.
In the graphic above, there are two link lines connected by a dot in the center of the line between the two devices. This shows that the devices are linked in both directions. This is done by repeating the process above from the second device, back to the first. Now, when one of the links goes down, you can see on which side the problem occurs.
Using WhatsUp Gold 14.4
155
About connecting links
Connecting links represent a service that connects two devices (e.g., an interface) and are drawn as lines from one device to another. If two devices have mutual links, the single line can consist of more than one color (if one object is up and the other is down). The center-point of the line back to the up object is green, while the other half of the line going to the down object is red. In essence, the color of the line represents the state of the service on the host that the color touches.
Example
If the red part of the line touches "System A" and the green part of the line touches "System B", then we know that some service on "System A" is the problem.
Creating connected link lines
There are two ways to set up the connecting link lines:
1 Manually, in Map View select a device, then right-click. On the right-click menu, select Link > Link to. (Select Link > Disconnect link to remove the link between devices.)
a) Select a monitor for which you want to display a link line, then click OK. The link line cursor appears.
b) Drag the cursor to another device and click to create a link.
2 Automatically, during device discovery when using SNMP SmartScan. (On the console, select File > Discover Devices > SNMP SmartScan.)
Note: The Interface service must be included in the scan.
Note: When you use one of the automatic discover options, particularly when discovering interfaces on a router or switch, you need to enter the SNMP community string in the appropriate scan dialog. This lets the scan identify all the interfaces on the device. If scanning a specific device (from the Device Properties > Active Monitors dialog), with the device selected, right-click and select Properties, then select Credentials. From SNMP v1/v2/v3 credentials, select Public. Next, in the Device Properties dialog, in the left Properties column click Active Monitors, select a monitor in the list, then click Rescan.
Tip: You may also consider the WhatsConnected application. WhatsConnected provides layer 2/3 network discovery and topology mapping to visually depict device connectivity down to the individual port. It also employs deep device scanning that provides detailed Information about discovered devices in a simple device list view, a device category view, and a detailed topology view. You can publish any of the network maps as a network diagram in Microsoft® Visio™ or export detailed device information to WhatsUp Gold to automate the creation of detailed network topology map views. WhatsConnected also includes Layer 2 Trace and IP/MAC Finder tools to validate connection paths and report real-time availability data on devices. For more information, see the WhatsUp Gold web site (http://www.whatsupgold.com/products/WhatsConnected).
Using WhatsUp Gold 14.4
156
About unconnected links
Unconnected links represent a service that is not connected to some other host (e.g., an unused interface on a router). They are drawn as short lines extending out from the host. The first unconnected interface is drawn straight up ("12 noon") and the rest are evenly distributed around the host in a clockwise fashion. You can choose to display or not display the unconnected links.
Because unconnected links illustrate any service for which a device has an active monitor, you can use this feature to show a visual status of the services for which monitors are configured. For example, though the device is up (green), you may see that one of the unconnected links is down (red) and will know to check the device's services.
Showing unconnected links
Unconnected links must be displayed for all or none of the devices in a map.
To display unconnected links for all devices:
1 Right-click in Map View. The right-click menu appears.
2 Select Display > Unconnected Links.
To hide unconnected links for all devices:
1. Right-click in Map view. The right-click menu appears.
2. Select Display > Unconnected Links.
Using attached lines Attached lines illustrate arbitrary connections between devices. When you move two devices that are connected by attached lines, the attached lines also move. Attached lines are visual representations assigned by the user, and not a reflection of a true connection between the two devices--the true connection between devices is illustrated with Link lines.
To draw an attached line:
1 In Map View, right-click a device. The right-click menu appears.
2 Select Attach > Attach to. A line displays next to the cursor.
3 Click the device icon to which you want to attach. WhatsUp Gold draws an attached line between the two devices.
Note: Each device can attach to a maximum of five different devices.
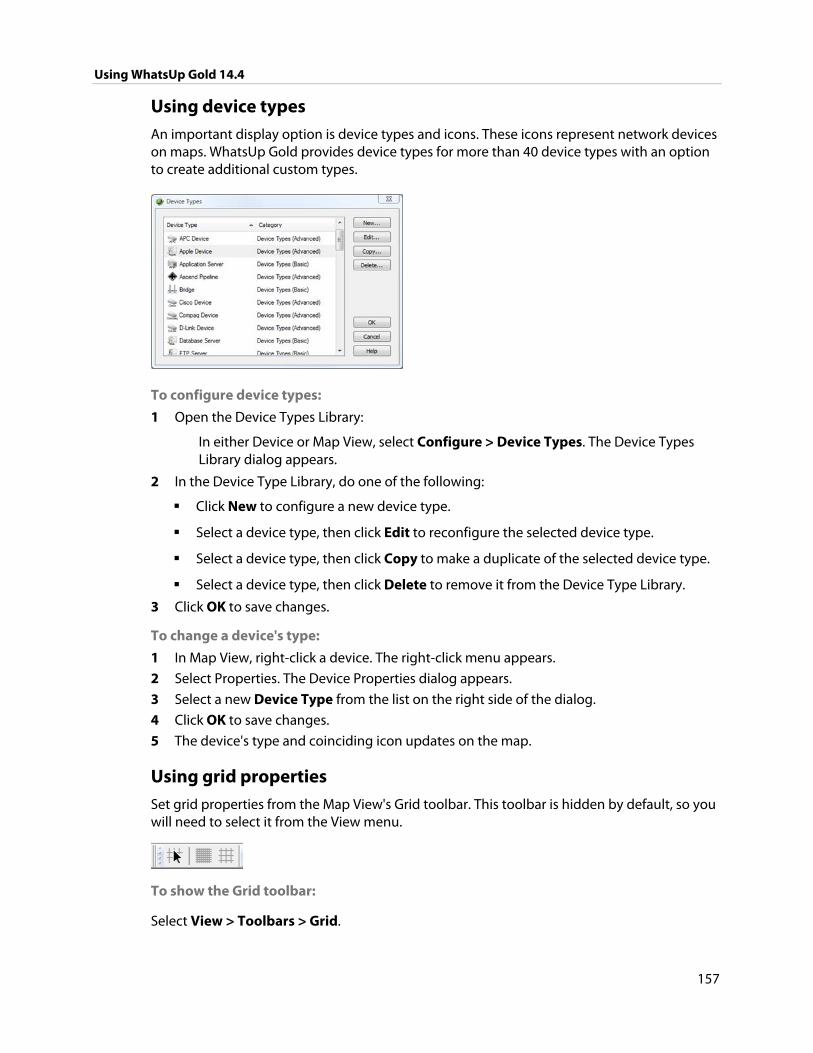
Using WhatsUp Gold 14.4
157
Using device types An important display option is device types and icons. These icons represent network devices on maps. WhatsUp Gold provides device types for more than 40 device types with an option to create additional custom types.
To configure device types:
1 Open the Device Types Library:
In either Device or Map View, select Configure > Device Types. The Device Types Library dialog appears.
2 In the Device Type Library, do one of the following:
Click New to configure a new device type.
Select a device type, then click Edit to reconfigure the selected device type.
Select a device type, then click Copy to make a duplicate of the selected device type.
Select a device type, then click Delete to remove it from the Device Type Library.
3 Click OK to save changes.
To change a device's type:
1 In Map View, right-click a device. The right-click menu appears.
2 Select Properties. The Device Properties dialog appears.
3 Select a new Device Type from the list on the right side of the dialog.
4 Click OK to save changes.
5 The device's type and coinciding icon updates on the map.
Using grid properties Set grid properties from the Map View's Grid toolbar. This toolbar is hidden by default, so you will need to select it from the View menu.
To show the Grid toolbar:
Select View > Toolbars > Grid.
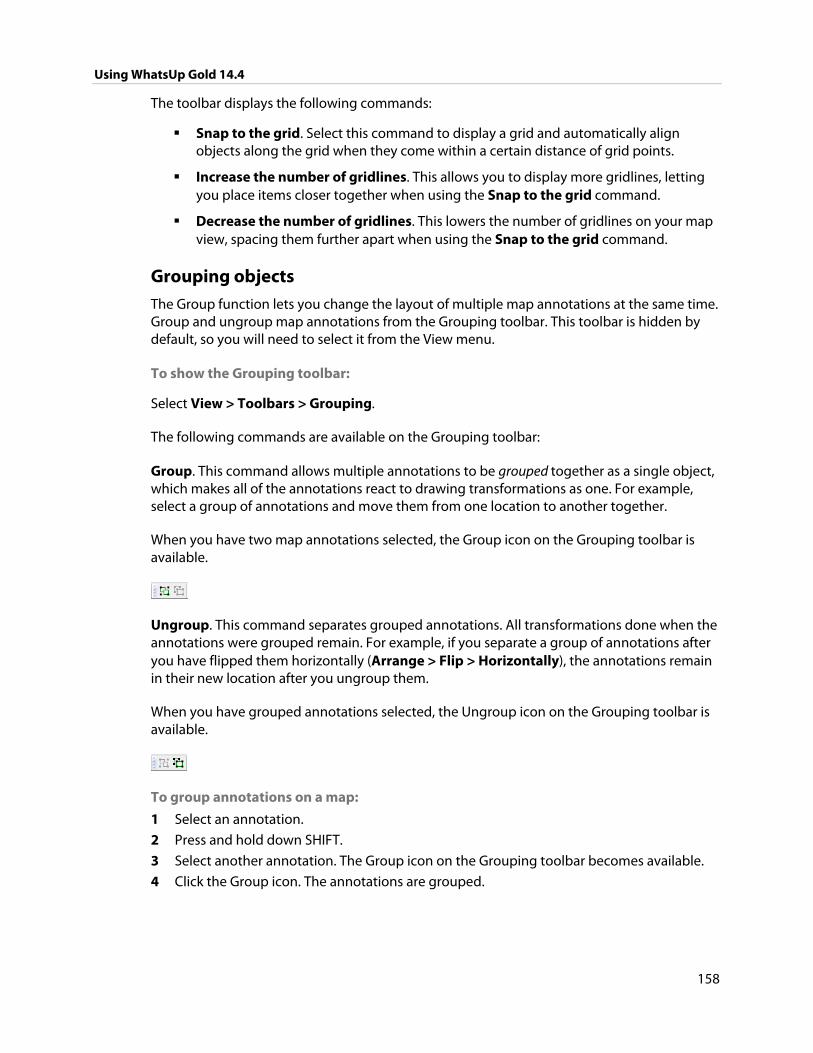
Using WhatsUp Gold 14.4
158
The toolbar displays the following commands:
Snap to the grid. Select this command to display a grid and automatically align objects along the grid when they come within a certain distance of grid points.
Increase the number of gridlines. This allows you to display more gridlines, letting you place items closer together when using the Snap to the grid command.
Decrease the number of gridlines. This lowers the number of gridlines on your map view, spacing them further apart when using the Snap to the grid command.
Grouping objects The Group function lets you change the layout of multiple map annotations at the same time. Group and ungroup map annotations from the Grouping toolbar. This toolbar is hidden by default, so you will need to select it from the View menu.
To show the Grouping toolbar:
Select View > Toolbars > Grouping.
The following commands are available on the Grouping toolbar:
Group. This command allows multiple annotations to be grouped together as a single object, which makes all of the annotations react to drawing transformations as one. For example, select a group of annotations and move them from one location to another together.
When you have two map annotations selected, the Group icon on the Grouping toolbar is available.
Ungroup. This command separates grouped annotations. All transformations done when the annotations were grouped remain. For example, if you separate a group of annotations after you have flipped them horizontally (Arrange > Flip > Horizontally), the annotations remain in their new location after you ungroup them.
When you have grouped annotations selected, the Ungroup icon on the Grouping toolbar is available.
To group annotations on a map:
1 Select an annotation.
2 Press and hold down SHIFT.
3 Select another annotation. The Group icon on the Grouping toolbar becomes available.
4 Click the Group icon. The annotations are grouped.
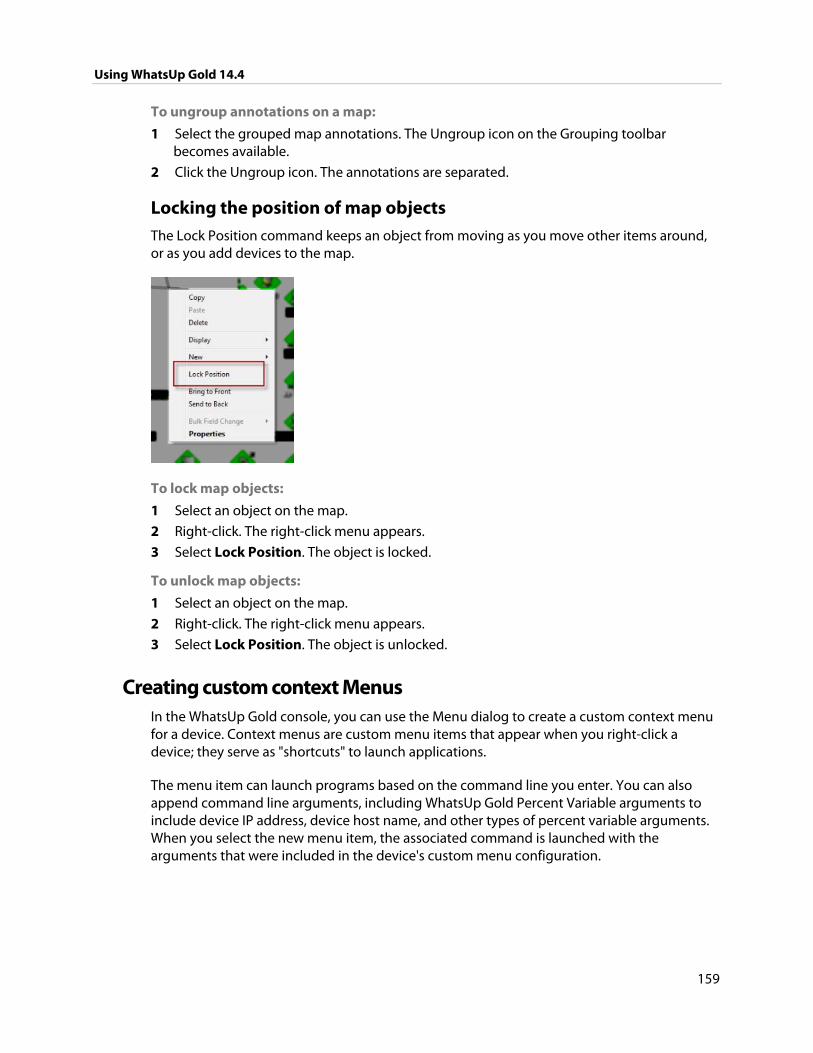
Using WhatsUp Gold 14.4
159
To ungroup annotations on a map:
1 Select the grouped map annotations. The Ungroup icon on the Grouping toolbar becomes available.
2 Click the Ungroup icon. The annotations are separated.
Locking the position of map objects The Lock Position command keeps an object from moving as you move other items around, or as you add devices to the map.
To lock map objects:
1 Select an object on the map.
2 Right-click. The right-click menu appears.
3 Select Lock Position. The object is locked.
To unlock map objects:
1 Select an object on the map.
2 Right-click. The right-click menu appears.
3 Select Lock Position. The object is unlocked.
Creating custom context Menus In the WhatsUp Gold console, you can use the Menu dialog to create a custom context menu for a device. Context menus are custom menu items that appear when you right-click a device; they serve as "shortcuts" to launch applications.
The menu item can launch programs based on the command line you enter. You can also append command line arguments, including WhatsUp Gold Percent Variable arguments to include device IP address, device host name, and other types of percent variable arguments. When you select the new menu item, the associated command is launched with the arguments that were included in the device's custom menu configuration.
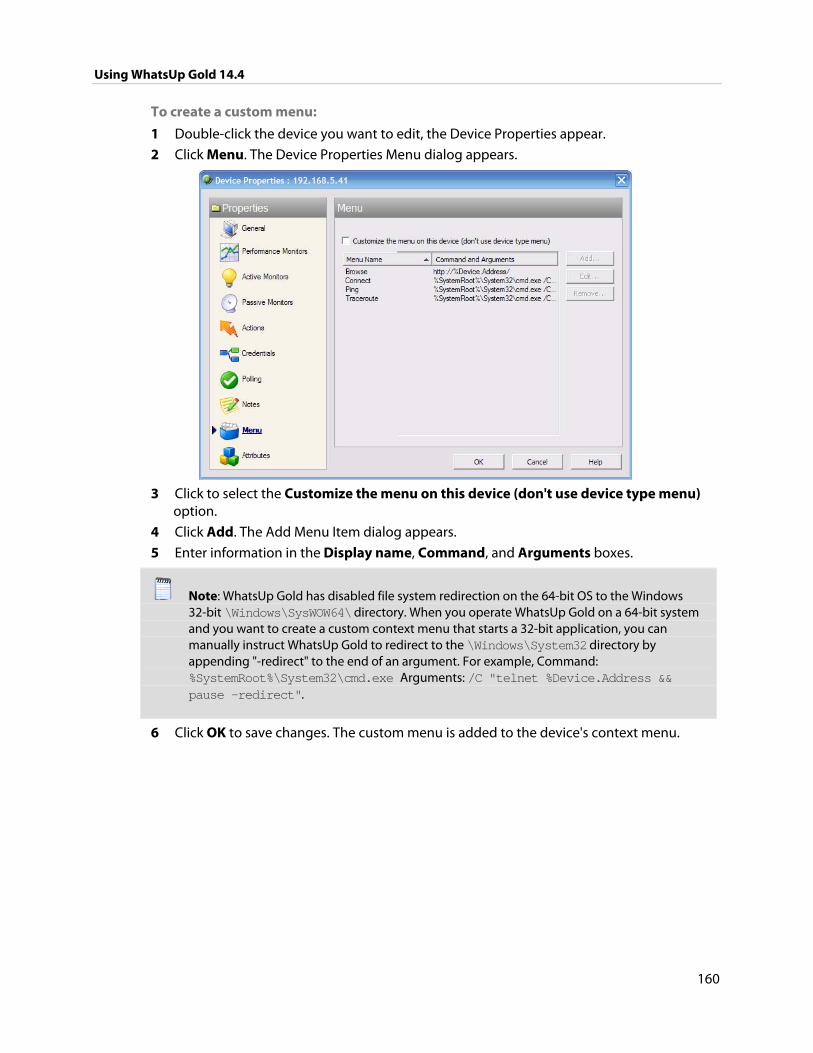
Using WhatsUp Gold 14.4
160
To create a custom menu:
1 Double-click the device you want to edit, the Device Properties appear.
2 Click Menu. The Device Properties Menu dialog appears.
3 Click to select the Customize the menu on this device (don't use device type menu)
option.
4 Click Add. The Add Menu Item dialog appears.
5 Enter information in the Display name, Command, and Arguments boxes.
Note: WhatsUp Gold has disabled file system redirection on the 64-bit OS to the Windows 32-bit \Windows\SysWOW64\ directory. When you operate WhatsUp Gold on a 64-bit system and you want to create a custom context menu that starts a 32-bit application, you can manually instruct WhatsUp Gold to redirect to the \Windows\System32 directory by appending "-redirect" to the end of an argument. For example, Command: %SystemRoot%\System32\cmd.exe Arguments: /C "telnet %Device.Address && pause -redirect".
6 Click OK to save changes. The custom menu is added to the device's context menu.
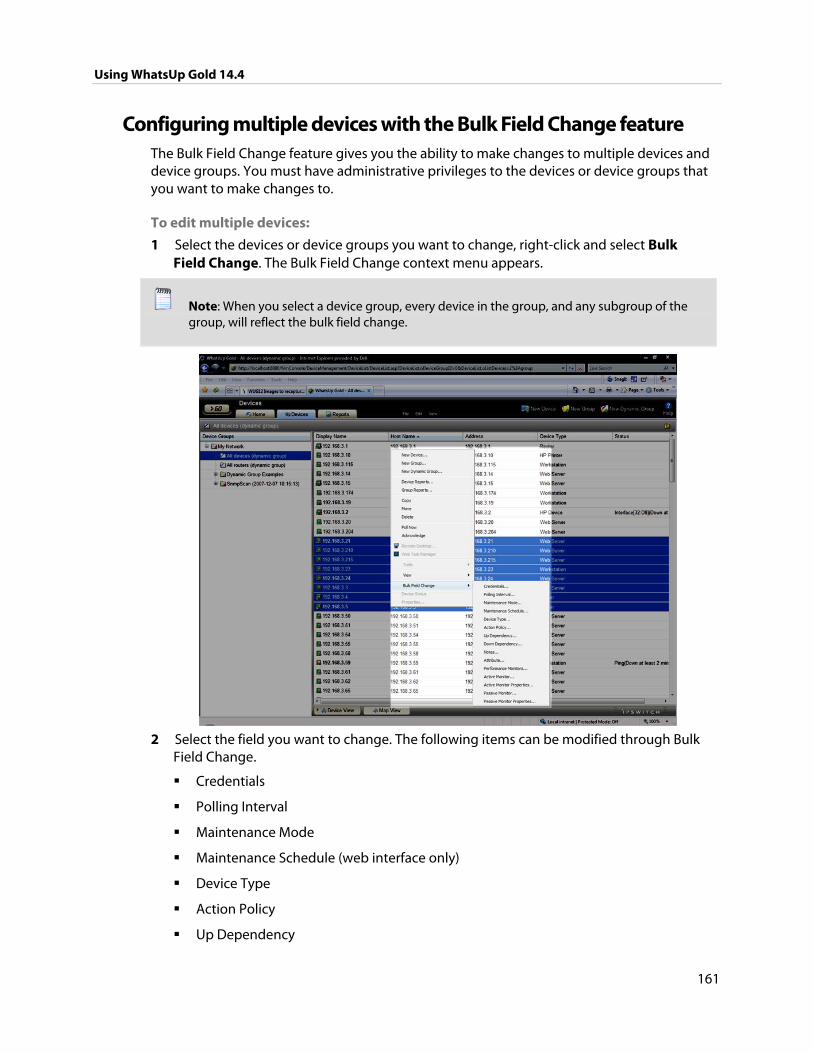
Using WhatsUp Gold 14.4
161
Configuring multiple devices with the Bulk Field Change feature The Bulk Field Change feature gives you the ability to make changes to multiple devices and device groups. You must have administrative privileges to the devices or device groups that you want to make changes to.
To edit multiple devices:
1 Select the devices or device groups you want to change, right-click and select Bulk Field Change. The Bulk Field Change context menu appears.
Note: When you select a device group, every device in the group, and any subgroup of the group, will reflect the bulk field change.
2 Select the field you want to change. The following items can be modified through Bulk
Field Change.
Credentials
Polling Interval
Maintenance Mode
Maintenance Schedule (web interface only)
Device Type
Action Policy
Up Dependency
Using WhatsUp Gold 14.4
162
Down Dependency
Notes
Attribute
Performance Monitors
Active Monitor
Active Monitor Properties
Passive Monitor (web interface only)
Passive Monitor Properties (web interface only)
3 Enter the configuration information that you want set.
4 Click OK to save changes.
Performing a device search using Find Device Use this dialog to find the device group(s) to which a network device belongs. After finding the device groups in which a devices resides, you can open the device group the contains the device, edit the device, remove the device from a selected group, or remove it from the WhatsUp Gold database.
Note: Find Device is a "contains" search. For example, if you enter the numbers 192 for an IP address search, any device whose IP address contains the sequential numbers 192 would be listed in the search results.
The dialog displays the following data about devices matching the search criteria.
The device's Display Name.
The device's Hostname.
The device's IP Address.
The Device Group to which the device belongs. If a device belongs to more than one device group, it is listed multiple times in the list of devices, one time for each group in which it belongs.
Note: Devices are displayed in this list according to a user's group access rights. You must have Group Read rights to at least one group to which a device belongs in order for it to appear in the results list. For more information, see Group Access and User Rights for the Find feature (on page 163).
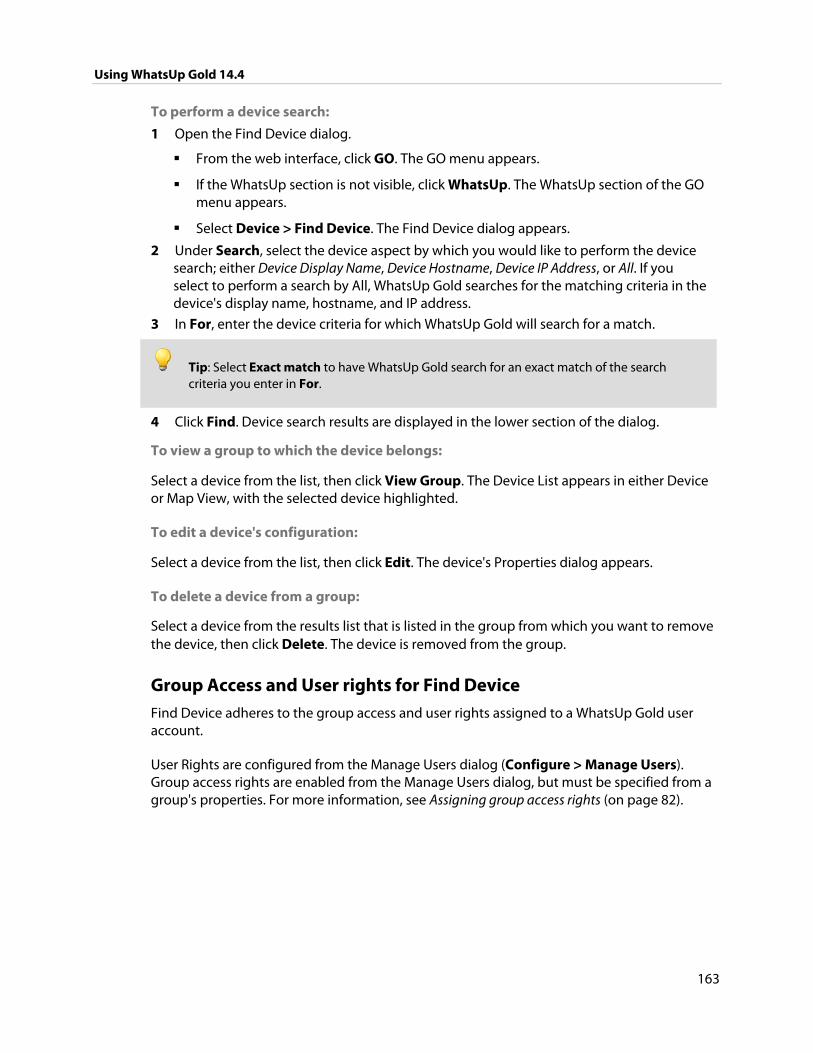
Using WhatsUp Gold 14.4
163
To perform a device search:
1 Open the Find Device dialog.
From the web interface, click GO. The GO menu appears.
If the WhatsUp section is not visible, click WhatsUp. The WhatsUp section of the GO menu appears.
Select Device > Find Device. The Find Device dialog appears.
2 Under Search, select the device aspect by which you would like to perform the device search; either Device Display Name, Device Hostname, Device IP Address, or All. If you select to perform a search by All, WhatsUp Gold searches for the matching criteria in the device's display name, hostname, and IP address.
3 In For, enter the device criteria for which WhatsUp Gold will search for a match.
Tip: Select Exact match to have WhatsUp Gold search for an exact match of the search criteria you enter in For.
4 Click Find. Device search results are displayed in the lower section of the dialog.
To view a group to which the device belongs:
Select a device from the list, then click View Group. The Device List appears in either Device or Map View, with the selected device highlighted.
To edit a device's configuration:
Select a device from the list, then click Edit. The device's Properties dialog appears.
To delete a device from a group:
Select a device from the results list that is listed in the group from which you want to remove the device, then click Delete. The device is removed from the group.
Group Access and User rights for Find Device Find Device adheres to the group access and user rights assigned to a WhatsUp Gold user account.
User Rights are configured from the Manage Users dialog (Configure > Manage Users). Group access rights are enabled from the Manage Users dialog, but must be specified from a group's properties. For more information, see Assigning group access rights (on page 82).
Using WhatsUp Gold 14.4
164
A user account must have Group Read rights to at least one group to which a device belongs in order for it to appear in the results list. Additionally, a user account must have the following rights to perform Find Device's functions:
An account must have Device Read to edit a device via Device Properties.
An account must have both the Group Write and Manage Groups rights to remove a device from a group.
An account must have both the Device Write and Manage Devices rights to remove a device from WhatsUp Gold.
Note: When you attempt to remove a device from a group and it is the last copy of that device in WhatsUp Gold, if you have the appropriate rights, it is removed from WhatsUp Gold.
165
Monitoring Devices
CHAPTER 15
Using Active Monitors
In This Chapter
Active monitors overview .............................................................................. 165
About the Active Monitor Library ............................................................... 165
Configuring active monitors ........................................................................ 166
Using the Active Script Active Monitor ..................................................... 243
Assigning active monitors ............................................................................. 243
Removing and deleting active monitors ................................................. 244
About critical active monitors ...................................................................... 246
Group and Device active monitor reports ............................................... 248
Active monitors overview Active monitors are the WhatsUp Gold feature responsible for watching over device services, for example Web or email servers. Active monitors regularly query or poll the device services for which they are configured and wait for responses. If a query is returned with an expected response, the queried service is considered "up." If a response is not received, or if the response is not expected, the queried service is considered "down" and a state change is issued on the device.
Active monitors are stored in and configured from the Active Monitor Library.
About the Active Monitor Library The Active Monitor Library dialog displays all active monitors currently configured for use in WhatsUp Gold.
In an effort to help you manage your network easily after your initial installation of the application, WhatsUp Gold includes a number of pre-configured active monitors. These pre-configured monitors are displayed in the Active Monitor Library. As you configure new active monitor types, they are added to the library.
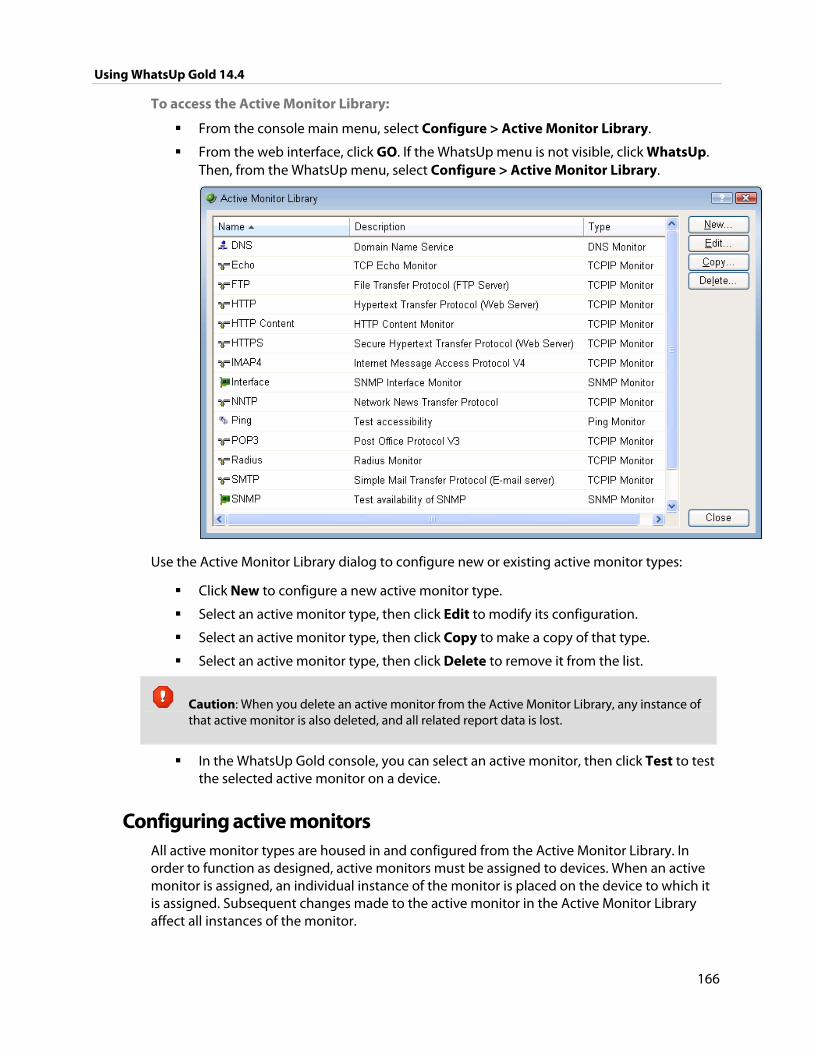
Using WhatsUp Gold 14.4
166
To access the Active Monitor Library:
From the console main menu, select Configure > Active Monitor Library.
From the web interface, click GO. If the WhatsUp menu is not visible, click WhatsUp. Then, from the WhatsUp menu, select Configure > Active Monitor Library.
Use the Active Monitor Library dialog to configure new or existing active monitor types:
Click New to configure a new active monitor type.
Select an active monitor type, then click Edit to modify its configuration.
Select an active monitor type, then click Copy to make a copy of that type.
Select an active monitor type, then click Delete to remove it from the list.
Caution: When you delete an active monitor from the Active Monitor Library, any instance of that active monitor is also deleted, and all related report data is lost.
In the WhatsUp Gold console, you can select an active monitor, then click Test to test the selected active monitor on a device.
Configuring active monitors All active monitor types are housed in and configured from the Active Monitor Library. In order to function as designed, active monitors must be assigned to devices. When an active monitor is assigned, an individual instance of the monitor is placed on the device to which it is assigned. Subsequent changes made to the active monitor in the Active Monitor Library affect all instances of the monitor.
Using WhatsUp Gold 14.4
167
Using the Domain Name Service (DNS) Monitor The DNS monitor is a simple service Monitor that checks for the DNS (Domain Name Server) on port 53. If no DNS service responds on this port, then the service is considered down.
To configure a DNS Monitor:
1 Go to the Active Monitor Library:
From the web interface, click GO. The GO menu appears.
If the WhatsUp section is not visible, click WhatsUp. The WhatsUp section of the GO menu appears.
Select Configure > Active Monitor Library. The Active Monitor Library appears.
- or -
From the main menu of the console, select Configure > Active Monitor Library. The Active Monitor Library appears.
2 In the Active Monitor Library, do one of the following:
Click New. The Select Active Monitor Type dialog appears.
Select DNS Monitor from the list, then click OK. The Add DNS Monitor dialog appears.
- or - Select an existing DNS Monitor, then click Edit. The monitor properties dialog appears.
3 Enter or select the appropriate information in the following fields.
Name. The name of the monitor as it appears in the Active Monitor Library.
Description. The description of the monitor as it appears in the Active Monitor Library.
Timeout. Enter a timeout value. This is the length of time in which the service is given a chance to respond. If there is no response in this amount of time, the service is considered down.
Use in Rescan. Select this option to have the monitor appear in the Active Monitor list on the Device Properties dialog. WhatsUp Gold will add the monitor type to the device during a rescan, which is launched using the Rescan button on the Device Properties dialog, if the protocol or service is active on the device.
4 Click OK to save changes.
Using WhatsUp Gold 14.4
168
Using the NT Service Monitor The NT Service Monitor checks the status of a service on a Windows machine and attempts a restarts (if the appropriate Administrator permissions exist).
Note: A running Windows Management Instrumentation (WMI) service on the targeted machine is required for the NT Service Monitor to work properly. Windows 2000 Service Pack 2 or higher, XP, and 2003 are installed with the WMI service. Though WMI is not installed with Windows NT, it can be downloaded from Microsoft and installed on Windows NT.
To configure an NT Service Monitor:
1 Go to the Active Monitor Library:
From the web interface, click GO. The GO menu appears.
If the WhatsUp section is not visible, click WhatsUp. The WhatsUp section of the GO menu appears.
Select Configure > Active Monitor Library. The Active Monitor Library appears.
- or -
From the main menu of the console, select Configure > Active Monitor Library. The Active Monitor Library appears.
2 In the Active Monitor Library, do one of the following:
Click New. The Select Active Monitor Type dialog appears.
Select NT Service Monitor from the list, then click OK. The Add NT Service Monitor dialog appears.
- or - Select an existing NT Service Monitor, then click Edit. The monitor properties dialog appears.
3 Enter or select the appropriate information in the following fields.
Name. The name of the monitor as it appears in the Active Monitor Library.
Description. The description of the monitor as it appears in the Active Monitor Library.
Service name. Click the Browse button next to the Service Name text box to bring up the Browse for Service dialog which allows you to locate any server/workstation running the service.
Restart on failure. Select this option to have the monitor attempt to restart the service when it enters a down state.
Use in discovery. Select this option to have the monitor appear in the Active Monitors list during discovery. From there, you can select the monitor to have WhatsUp Gold discover that monitor type on your devices.

Using WhatsUp Gold 14.4
169
Note: WhatsUp Gold uses Windows Management Instrumentation (WMI) to verify the status of the NT Service Active Monitors you have configured. WhatsUp Gold currently only supports monitoring on Windows 2000 Service Pack 2 or higher, Windows XP Professional, and Windows 2003 or higher.
4 Click OK to save changes.
Using the Ping Monitor The Ping monitor sends an ICMP (ping) command to a device. If the device does not respond, the monitor is considered down.
To configure a Ping Monitor:
1 Go to the Active Monitor Library:
From the web interface, click GO. The GO menu appears.
If the WhatsUp section is not visible, click WhatsUp. The WhatsUp section of the GO menu appears.
Select Configure > Active Monitor Library. The Active Monitor Library appears.
- or -
From the main menu of the console, select Configure > Active Monitor Library. The Active Monitor Library appears.
2 In the Active Monitor Library, do one of the following:
Click New. The Select Active Monitor Type dialog appears.
Select Ping Monitor from the list, then click OK. The Add Ping Monitor dialog appears.
- or - Select an existing Ping Monitor, then click Edit. The monitor properties dialog appears.
3 Enter or select the appropriate information in the following fields.
Name. The name of the monitor as it appears in the Active Monitor Library.
Description. The description of the monitor as it appears in the Active Monitor Library.
Timeout. The ping will fail if the device does not respond after this number of seconds.
Retries. The number of times WhatsUp Gold will attempt to send the command before the device is considered down.
Payload size. The length in bytes of each packet sent by the ping command.
Use in discovery. Select this option to have the monitor appear in the Active Monitors list during discovery. From there, you can select the monitor to have WhatsUp Gold discover that monitor type on your devices.
4 Click OK to save changes.
Using WhatsUp Gold 14.4
170
Using the SNMP Monitor The Simple Network Management Protocol (SNMP) is the protocol responsible for governing network management. In this monitor, WhatsUp Gold utilizes SNMP to gather specific information about the functions of SNMP-enabled network devices by querying a device to verify that it returns an expected value. Depending on the state you choose, the monitor is considered either Up or Down according to the returned value.
To configure an SNMP Monitor:
1 Go to the Active Monitor Library:
From the web interface, click GO. The GO menu appears.
If the WhatsUp section is not visible, click WhatsUp. The WhatsUp section of the GO menu appears.
Select Configure > Active Monitor Library. The Active Monitor Library appears.
- or -
From the main menu of the console, select Configure > Active Monitor Library. The Active Monitor Library appears.
2 In the Active Monitor Library, do one of the following:
Click New. The Select Active Monitor Type dialog appears.
Select SNMP Monitor from the list, then click OK. The Add SNMP Monitor dialog appears.
- or -
Select an existing SNMP Monitor, then click Edit. The monitor properties dialog appears.
3 Enter or select the appropriate information in the following fields.
Name. The name of the monitor as it appears in the Active Monitor Library.
Description. The description of the monitor as it appears in the Active Monitor Library.
Object ID. Click the Browse button; then, locate and select the appropriate SNMP object in the MIB object tree. For more information, see Selecting an Object in the MIB Tree below.
Check type. Select Constant Value, Range of Values, or Rate of Change in Value.
Constant Value
Value. Depending on the Object ID you selected, enter the appropriate value.
If the value matches, then the monitor is: select Up or Down.
Using WhatsUp Gold 14.4
171
Range of Values
Low Value. Depending on the Object ID you selected, enter the appropriate value.
High Value. Depending on the Object ID you selected, enter the appropriate value.
Rate of Change in Value
Rate of Change (in variable units per second). Enter the desired value.
If the value is above the rate, then the monitor is: select Up or Down.
4 Click OK to save changes.
Selecting an object in the MIB Tree
In order to select the appropriate object in the MIB tree, you need to be familiar with the MIB names for the SNMP objects for which you want to monitor. For more information, see RFC 1213.
Example A.
If you want to monitor the volume of data traveling from your router, you select ifOutOctets in the MIB object tree and insert 1.3.6.1.2.1.2.2.1.16 in the MIB box.
Example B.
If you are interested in the operating status value of a port on your router, you select ifOperStatus and insert 1.3.6.1.2.1.2.2.1.8 in the MIB box.
Example C.
If you are interested in errors from a specific port on your router, you select ifInErrors, and inserting 1.3.6.1.2.1.2.2.1.14 in the MIB box.
For more information, see Extending WhatsUp Gold with scripting (on page 493).
Example: monitoring network printer toner levels
To avoid running out of printer ink in the middle of print jobs, or wasting toner by switching toner cartridges before they are empty, through WhatsUp Gold you can create a custom SNMP active Monitor that notifies you when toner levels are low.
To configure a printer monitor:
1 From the WhatsUp Gold web interface, click GO. The GO menu appears.
2 If the WhatsUp section is not visible, click WhatsUp. The WhatsUp section of the GO menu appears.
3 Select Configure > Active Monitor Library. The Active Monitor Library dialog appears.
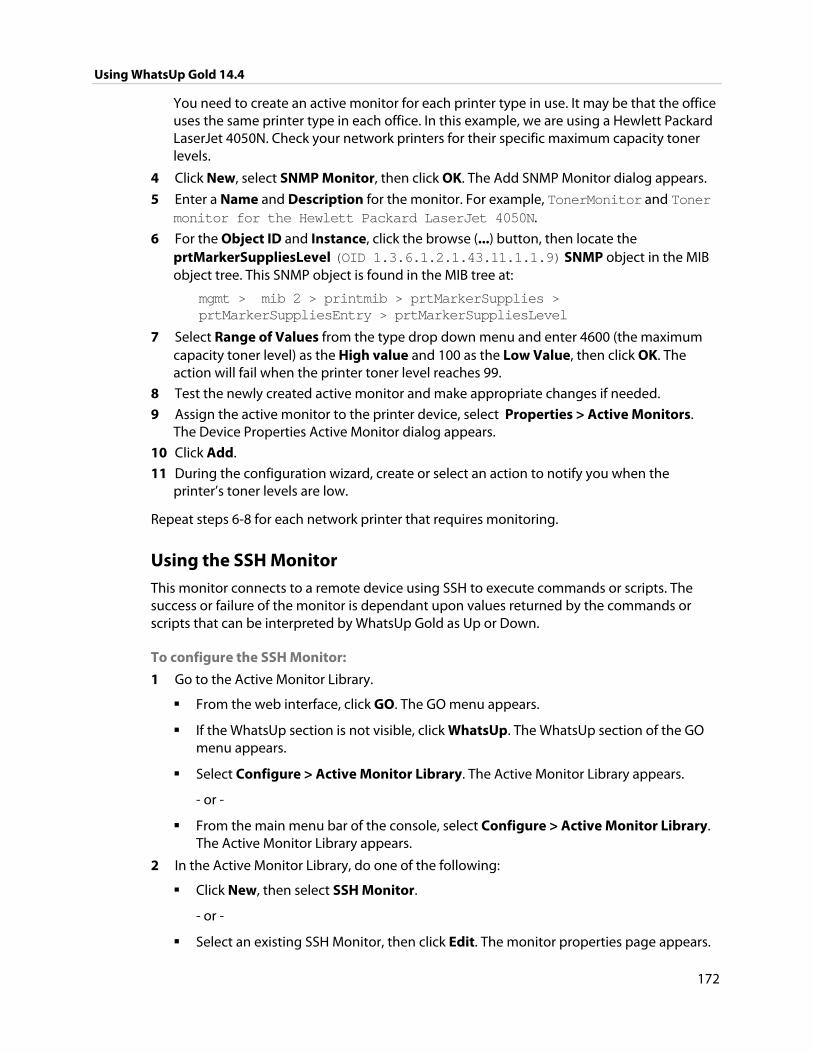
Using WhatsUp Gold 14.4
172
You need to create an active monitor for each printer type in use. It may be that the office uses the same printer type in each office. In this example, we are using a Hewlett Packard LaserJet 4050N. Check your network printers for their specific maximum capacity toner levels.
4 Click New, select SNMP Monitor, then click OK. The Add SNMP Monitor dialog appears.
5 Enter a Name and Description for the monitor. For example, TonerMonitor and Toner monitor for the Hewlett Packard LaserJet 4050N.
6 For the Object ID and Instance, click the browse (...) button, then locate the prtMarkerSuppliesLevel (OID 1.3.6.1.2.1.43.11.1.1.9) SNMP object in the MIB object tree. This SNMP object is found in the MIB tree at:
mgmt > mib 2 > printmib > prtMarkerSupplies > prtMarkerSuppliesEntry > prtMarkerSuppliesLevel
7 Select Range of Values from the type drop down menu and enter 4600 (the maximum capacity toner level) as the High value and 100 as the Low Value, then click OK. The action will fail when the printer toner level reaches 99.
8 Test the newly created active monitor and make appropriate changes if needed.
9 Assign the active monitor to the printer device, select Properties > Active Monitors. The Device Properties Active Monitor dialog appears.
10 Click Add.
11 During the configuration wizard, create or select an action to notify you when the printer’s toner levels are low.
Repeat steps 6-8 for each network printer that requires monitoring.
Using the SSH Monitor This monitor connects to a remote device using SSH to execute commands or scripts. The success or failure of the monitor is dependant upon values returned by the commands or scripts that can be interpreted by WhatsUp Gold as Up or Down.
To configure the SSH Monitor:
1 Go to the Active Monitor Library.
From the web interface, click GO. The GO menu appears.
If the WhatsUp section is not visible, click WhatsUp. The WhatsUp section of the GO menu appears.
Select Configure > Active Monitor Library. The Active Monitor Library appears.
- or -
From the main menu bar of the console, select Configure > Active Monitor Library. The Active Monitor Library appears.
2 In the Active Monitor Library, do one of the following:
Click New, then select SSH Monitor.
- or -
Select an existing SSH Monitor, then click Edit. The monitor properties page appears.
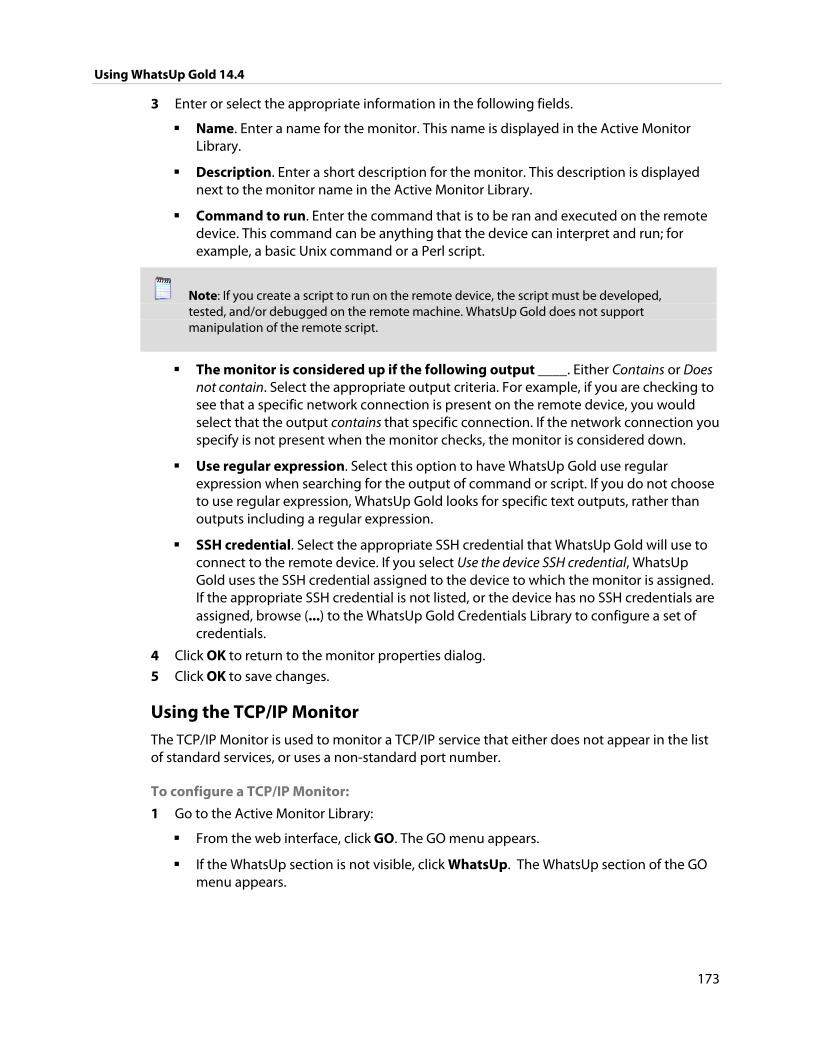
Using WhatsUp Gold 14.4
173
3 Enter or select the appropriate information in the following fields.
Name. Enter a name for the monitor. This name is displayed in the Active Monitor Library.
Description. Enter a short description for the monitor. This description is displayed next to the monitor name in the Active Monitor Library.
Command to run. Enter the command that is to be ran and executed on the remote device. This command can be anything that the device can interpret and run; for example, a basic Unix command or a Perl script.
Note: If you create a script to run on the remote device, the script must be developed, tested, and/or debugged on the remote machine. WhatsUp Gold does not support manipulation of the remote script.
The monitor is considered up if the following output ____. Either Contains or Does not contain. Select the appropriate output criteria. For example, if you are checking to see that a specific network connection is present on the remote device, you would select that the output contains that specific connection. If the network connection you specify is not present when the monitor checks, the monitor is considered down.
Use regular expression. Select this option to have WhatsUp Gold use regular expression when searching for the output of command or script. If you do not choose to use regular expression, WhatsUp Gold looks for specific text outputs, rather than outputs including a regular expression.
SSH credential. Select the appropriate SSH credential that WhatsUp Gold will use to connect to the remote device. If you select Use the device SSH credential, WhatsUp Gold uses the SSH credential assigned to the device to which the monitor is assigned. If the appropriate SSH credential is not listed, or the device has no SSH credentials are assigned, browse (...) to the WhatsUp Gold Credentials Library to configure a set of credentials.
4 Click OK to return to the monitor properties dialog.
5 Click OK to save changes.
Using the TCP/IP Monitor The TCP/IP Monitor is used to monitor a TCP/IP service that either does not appear in the list of standard services, or uses a non-standard port number.
To configure a TCP/IP Monitor:
1 Go to the Active Monitor Library:
From the web interface, click GO. The GO menu appears.
If the WhatsUp section is not visible, click WhatsUp. The WhatsUp section of the GO menu appears.
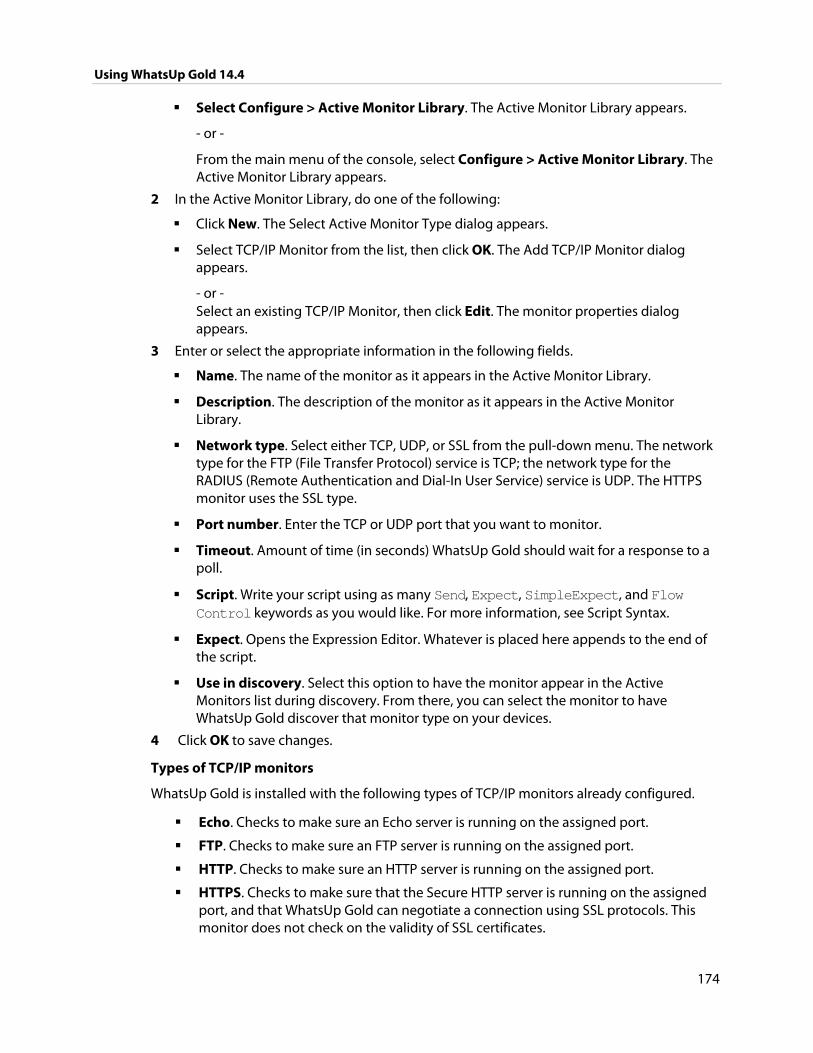
Using WhatsUp Gold 14.4
174
Select Configure > Active Monitor Library. The Active Monitor Library appears.
- or -
From the main menu of the console, select Configure > Active Monitor Library. The Active Monitor Library appears.
2 In the Active Monitor Library, do one of the following:
Click New. The Select Active Monitor Type dialog appears.
Select TCP/IP Monitor from the list, then click OK. The Add TCP/IP Monitor dialog appears.
- or - Select an existing TCP/IP Monitor, then click Edit. The monitor properties dialog appears.
3 Enter or select the appropriate information in the following fields.
Name. The name of the monitor as it appears in the Active Monitor Library.
Description. The description of the monitor as it appears in the Active Monitor Library.
Network type. Select either TCP, UDP, or SSL from the pull-down menu. The network type for the FTP (File Transfer Protocol) service is TCP; the network type for the RADIUS (Remote Authentication and Dial-In User Service) service is UDP. The HTTPS monitor uses the SSL type.
Port number. Enter the TCP or UDP port that you want to monitor.
Timeout. Amount of time (in seconds) WhatsUp Gold should wait for a response to a poll.
Script. Write your script using as many Send, Expect, SimpleExpect, and Flow Control keywords as you would like. For more information, see Script Syntax.
Expect. Opens the Expression Editor. Whatever is placed here appends to the end of the script.
Use in discovery. Select this option to have the monitor appear in the Active Monitors list during discovery. From there, you can select the monitor to have WhatsUp Gold discover that monitor type on your devices.
4 Click OK to save changes.
Types of TCP/IP monitors
WhatsUp Gold is installed with the following types of TCP/IP monitors already configured.
Echo. Checks to make sure an Echo server is running on the assigned port.
FTP. Checks to make sure an FTP server is running on the assigned port.
HTTP. Checks to make sure an HTTP server is running on the assigned port.
HTTPS. Checks to make sure that the Secure HTTP server is running on the assigned port, and that WhatsUp Gold can negotiate a connection using SSL protocols. This monitor does not check on the validity of SSL certificates.
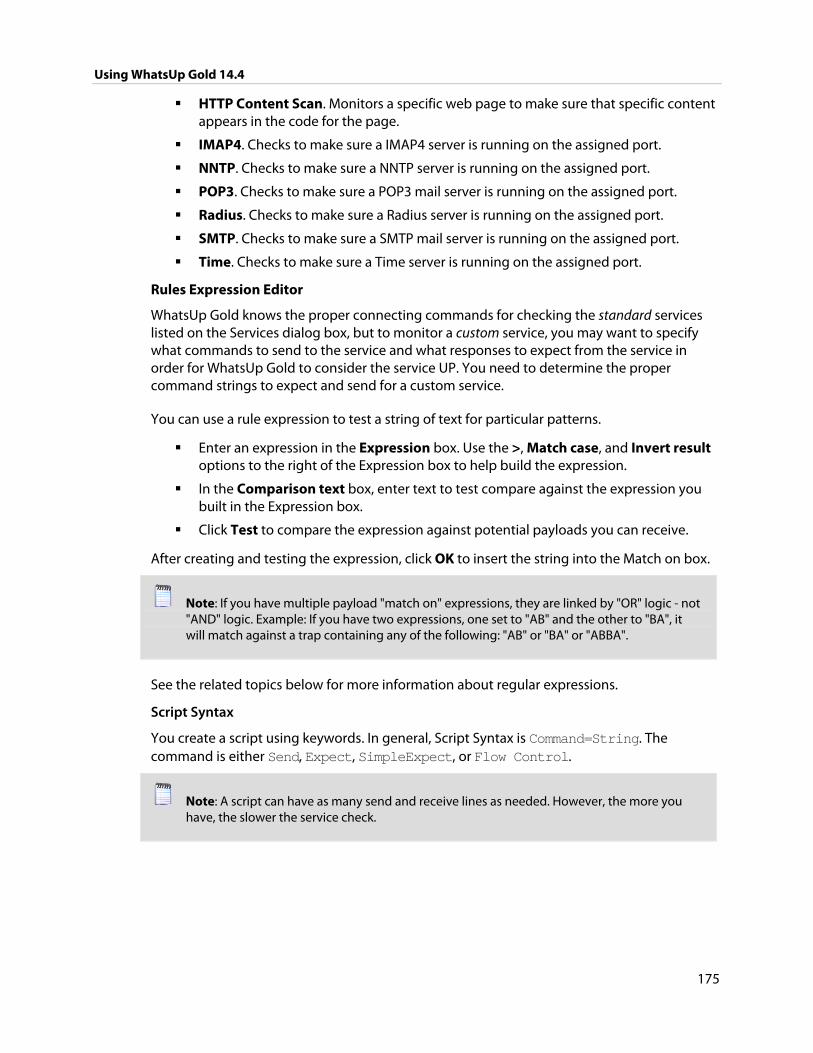
Using WhatsUp Gold 14.4
175
HTTP Content Scan. Monitors a specific web page to make sure that specific content appears in the code for the page.
IMAP4. Checks to make sure a IMAP4 server is running on the assigned port.
NNTP. Checks to make sure a NNTP server is running on the assigned port.
POP3. Checks to make sure a POP3 mail server is running on the assigned port.
Radius. Checks to make sure a Radius server is running on the assigned port.
SMTP. Checks to make sure a SMTP mail server is running on the assigned port.
Time. Checks to make sure a Time server is running on the assigned port.
Rules Expression Editor
WhatsUp Gold knows the proper connecting commands for checking the standard services listed on the Services dialog box, but to monitor a custom service, you may want to specify what commands to send to the service and what responses to expect from the service in order for WhatsUp Gold to consider the service UP. You need to determine the proper command strings to expect and send for a custom service.
You can use a rule expression to test a string of text for particular patterns.
Enter an expression in the Expression box. Use the >, Match case, and Invert result options to the right of the Expression box to help build the expression.
In the Comparison text box, enter text to test compare against the expression you built in the Expression box.
Click Test to compare the expression against potential payloads you can receive.
After creating and testing the expression, click OK to insert the string into the Match on box.
Note: If you have multiple payload "match on" expressions, they are linked by "OR" logic - not "AND" logic. Example: If you have two expressions, one set to "AB" and the other to "BA", it will match against a trap containing any of the following: "AB" or "BA" or "ABBA".
See the related topics below for more information about regular expressions.
Script Syntax
You create a script using keywords. In general, Script Syntax is Command=String. The command is either Send, Expect, SimpleExpect, or Flow Control.
Note: A script can have as many send and receive lines as needed. However, the more you have, the slower the service check.
Using WhatsUp Gold 14.4
176
Keywords
Note: To comment out a line, use the # symbol as the first character of the line.
To send a string to a port, use the Send= keyword.
To expect a string from a port, use the SimpleExpect= or the Expect= keyword.
To receive a conditional response for an error or success, use Flow Control Keywords (on page 180).
Examples
If you have a TCP service to check, you need to do the following:
expect something on connection
send a command
check for a response
send something to disconnect
Script Syntax: Expect=Keyword
Expect=Keyword gives you flexibility to accept variable responses and pick out crucial information using special control characters and regular expressions. If you do not need flexibility, or are new to writing your own custom TCP/UDP scripts, you may want to use the SimpleExpect keyword.
There are 4 variations of the Expect Keyword:
Expect. Returns true when the expected value is matched.
Expect(MatchCase). Only returns true when the case matches the expected value.
DontExpect. Returns true when the value is not found.
DontExpect(MatchCase). Returns true when the value is not found.
The Expect syntax is Expect=Response, where the Response is either specified as an exact text string, or a mixture of regular expression rules and text. The Add/Edit Expect Rule button helps you construct and test a regular expression response string. It automatically chooses the variation of Expect for you based on options you select.
Note: Add/Edit Expect Rule does not aid in the generation of SimpleExpect keywords.
WhatsUp Gold v7 or v8 users: The ~, , ! and = = codes have been replaced with variations on the Expect keyword itself. Migrated definitions are automatically converted.
Using WhatsUp Gold 14.4
177
Example 1: # # Note: script comments start with a # character # # Send a simple text command # Send = Hello There # # Expect a nice response that begins with, "Hi, How are you" # Expect=^Hi, How are you
Example 2: # # Send a command followed by CR/LF # Send=Select * from Accounts\r\n # # Expect a large response, but we only care to check that somewhere # in the response John Doe is mentioned # Expect=John Doe
Example 3: # # Send a binary escape (27) and an x y and z and then a nak (21) # Send=\x1Bxyz\x15 # # Expect something that does *not* contain 123 escape (27) # DontExpect=123\x1B Script Syntax: Send=Keyword
To Send command on a connection, use a Send=keyword. The script syntax is Send=Command. The Command is exactly the message you want to send. You may use a combination of literal characters and binary representations.
WhatsUp Gold understands the C0 set of ANSI 7-bit control characters. A Binary can be represented as \\x##, where the ## is a hexadecimal value. Those familiar with the table may also choose to use shorthand such as \A (\x01) or \W (\x17)
You can also use \r and \n as the conventions for sending the carriage return and line feed control characters to terminate a line.
Using WhatsUp Gold 14.4
178
The following table shows the keywords you can use.
Keyword Description
\\x## Binary value in Hexadecimal. For example, \\x1B is escape
\\ The "\" character
\t The tab character (\x09)
\r The return character (\x0D)
\n The new line character \x0A)
WhatsUp Gold versions 7 and 8 users: The %### decimal syntax for specifying binary octets has been replaced with the \x## hexidecimal syntax.
Example 1: # # Note: script comments start with a # character # # Send a simple text command # Send=Hello There
Example 2: # # Send a command followed by CR/LF # Send=Select * from Accounts\r\n
Example 3: # # Send a binary escape (27) an x y and z and then a nak (21) # Send=\x1Bxyz\x15 Script Syntax: SimpleExpect Keyword
The SimpleExpect Keyword lets you specify expected responses from a service. Responses can even be binary (i.e. non-printable ASCII character) responses. If you know exactly (or even approximately) what to expect you can construct a simple expect response string to match against.
This keyword allows you some flexibility in accepting variable responses and picking out only crucial information. If you need additional flexibility you may want to consider using the regular expression syntax available in the Expect Keyword.
The SimpleExpect script syntax is SimpleExpect=Response, where the response is a series of characters you expect back from the service. The following table displays keywords that match logic and wildcards to compare responses byte-by-byte expanding escape codes as you go.
Using WhatsUp Gold 14.4
179
Command Options: Keyword Description
\x## Binary value (in Hexidecimal) for example \x00 is null
. Matches any character
\% The "%" character
\. The "." character
\\ The "\" character
Note: Only the number of characters specified in the expect string are used to match the response. The response is expected to start with these characters. Any extra trailing characters received are just ignored.
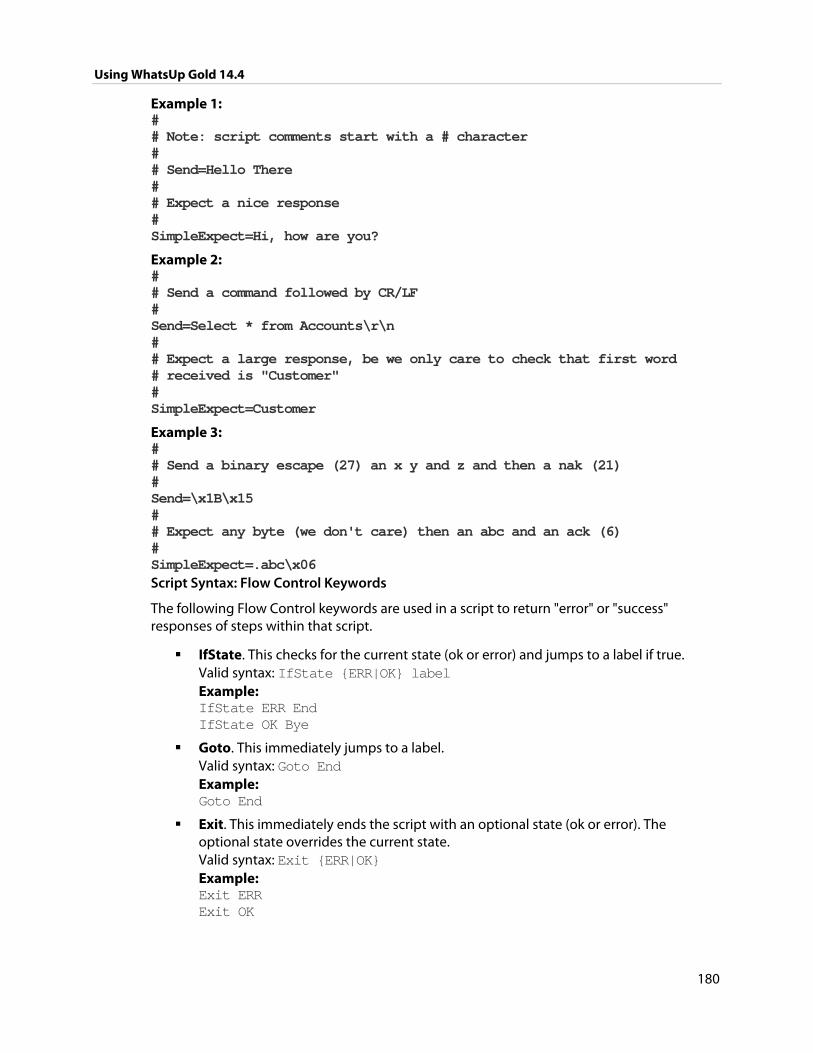
Using WhatsUp Gold 14.4
180
Example 1: # # Note: script comments start with a # character # # Send=Hello There # # Expect a nice response # SimpleExpect=Hi, how are you?
Example 2: # # Send a command followed by CR/LF # Send=Select * from Accounts\r\n # # Expect a large response, be we only care to check that first word # received is "Customer" # SimpleExpect=Customer
Example 3: # # Send a binary escape (27) an x y and z and then a nak (21) # Send=\x1B\x15 # # Expect any byte (we don't care) then an abc and an ack (6) # SimpleExpect=.abc\x06 Script Syntax: Flow Control Keywords
The following Flow Control keywords are used in a script to return "error" or "success" responses of steps within that script.
IfState. This checks for the current state (ok or error) and jumps to a label if true. Valid syntax: IfState {ERR|OK} label Example: IfState ERR End IfState OK Bye
Goto. This immediately jumps to a label. Valid syntax: Goto End Example: Goto End
Exit. This immediately ends the script with an optional state (ok or error). The optional state overrides the current state. Valid syntax: Exit {ERR|OK} Example: Exit ERR Exit OK
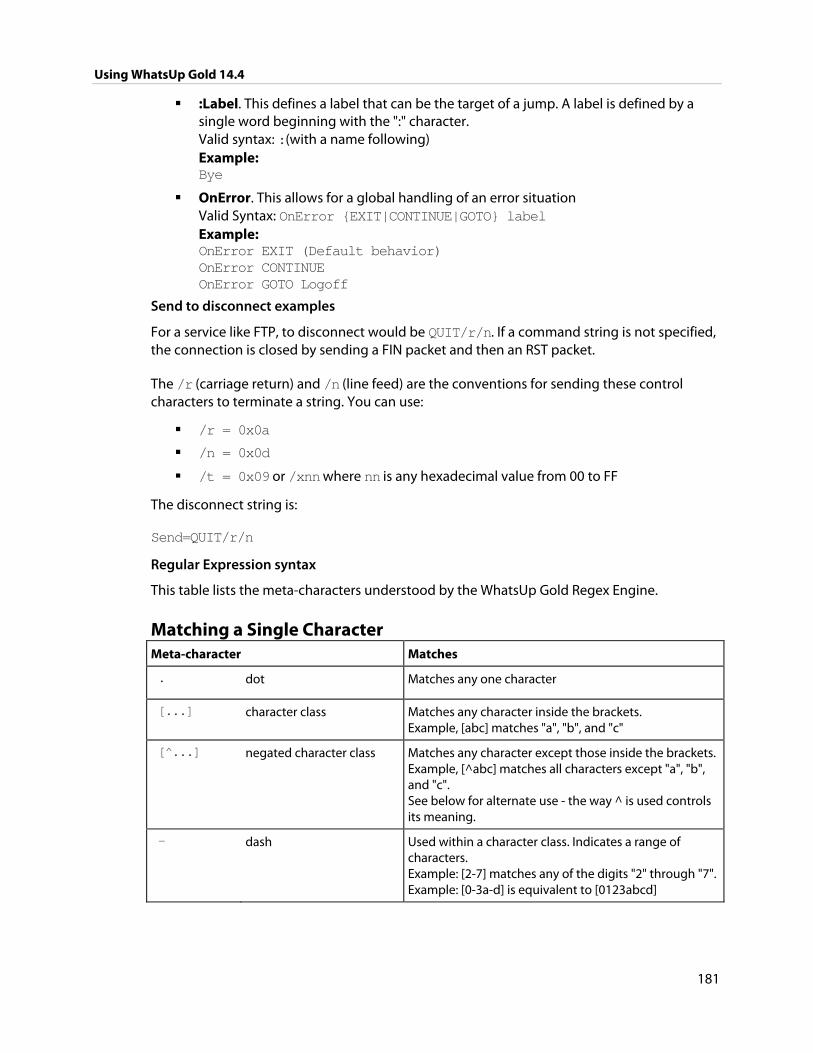
Using WhatsUp Gold 14.4
181
:Label. This defines a label that can be the target of a jump. A label is defined by a single word beginning with the ":" character. Valid syntax: :(with a name following) Example: Bye
OnError. This allows for a global handling of an error situation Valid Syntax: OnError {EXIT|CONTINUE|GOTO} label Example: OnError EXIT (Default behavior) OnError CONTINUE OnError GOTO Logoff
Send to disconnect examples
For a service like FTP, to disconnect would be QUIT/r/n. If a command string is not specified, the connection is closed by sending a FIN packet and then an RST packet.
The /r (carriage return) and /n (line feed) are the conventions for sending these control characters to terminate a string. You can use:
/r = 0x0a
/n = 0x0d
/t = 0x09 or /xnn where nn is any hexadecimal value from 00 to FF
The disconnect string is:
Send=QUIT/r/n
Regular Expression syntax
This table lists the meta-characters understood by the WhatsUp Gold Regex Engine.
Matching a Single Character Meta-character Matches
. dot Matches any one character
[...] character class Matches any character inside the brackets. Example, [abc] matches "a", "b", and "c"
[^...] negated character class Matches any character except those inside the brackets.Example, [^abc] matches all characters except "a", "b", and "c". See below for alternate use - the way ^ is used controls its meaning.
- dash Used within a character class. Indicates a range of characters. Example: [2-7] matches any of the digits "2" through "7".Example: [0-3a-d] is equivalent to [0123abcd]
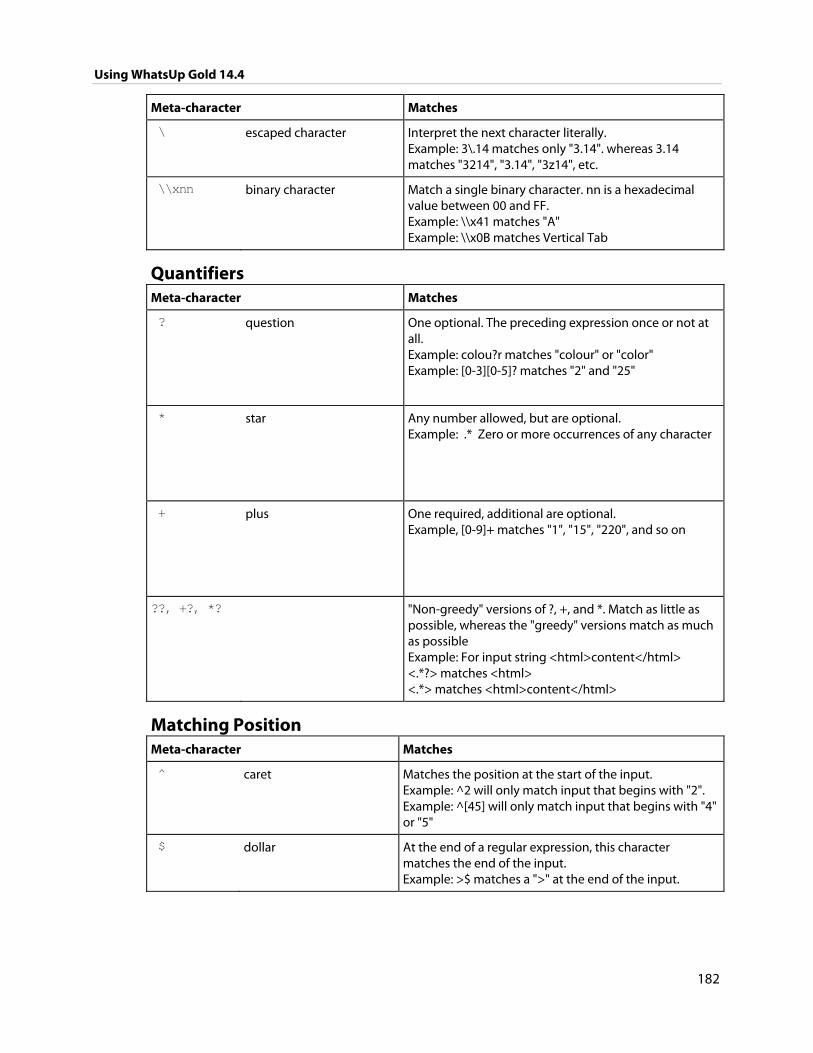
Using WhatsUp Gold 14.4
182
Meta-character Matches
\ escaped character Interpret the next character literally. Example: 3\.14 matches only "3.14". whereas 3.14 matches "3214", "3.14", "3z14", etc.
\\xnn binary character Match a single binary character. nn is a hexadecimal value between 00 and FF. Example: \\x41 matches "A" Example: \\x0B matches Vertical Tab
Quantifiers Meta-character Matches
? question One optional. The preceding expression once or not at all. Example: colou?r matches "colour" or "color" Example: [0-3][0-5]? matches "2" and "25"
* star Any number allowed, but are optional. Example: .* Zero or more occurrences of any character
+ plus One required, additional are optional. Example, [0-9]+ matches "1", "15", "220", and so on
??, +?, *? "Non-greedy" versions of ?, +, and *. Match as little as possible, whereas the "greedy" versions match as much as possible Example: For input string <html>content</html> <.*?> matches <html> <.*> matches <html>content</html>
Matching Position Meta-character Matches
caret Matches the position at the start of the input. Example: ^2 will only match input that begins with "2". Example: ^[45] will only match input that begins with "4" or "5"
$ dollar At the end of a regular expression, this character matches the end of the input. Example: >$ matches a ">" at the end of the input.
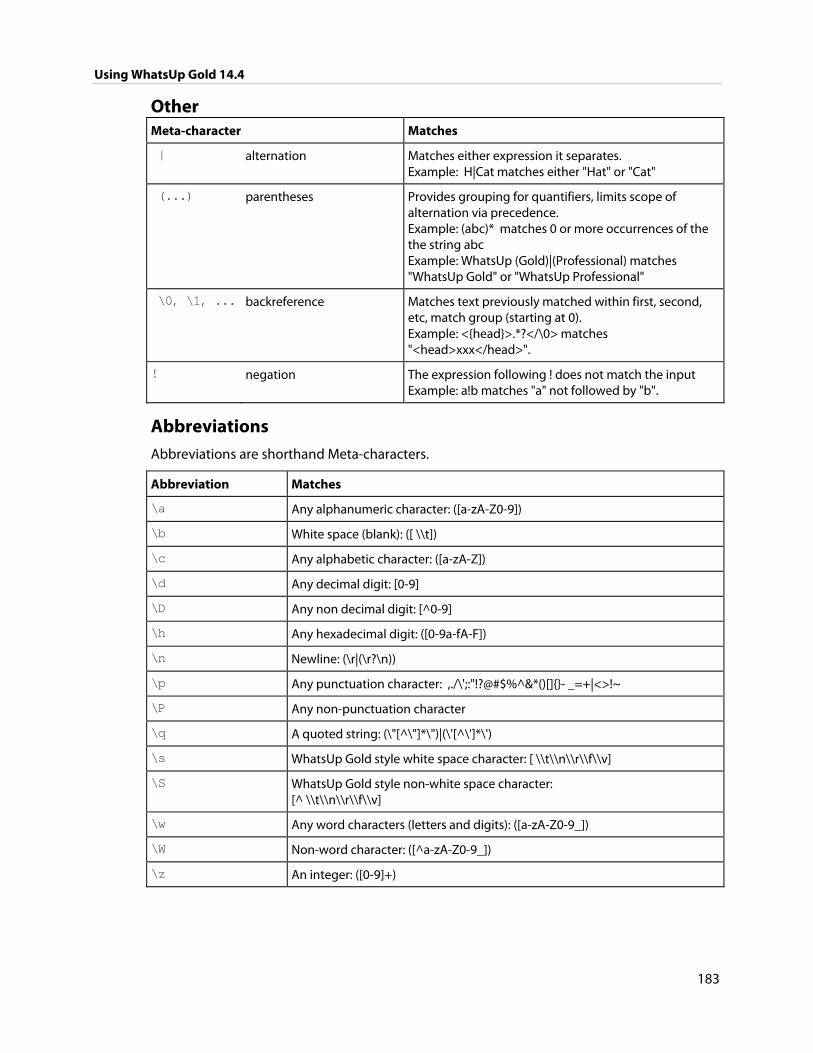
Using WhatsUp Gold 14.4
183
Other Meta-character Matches
| alternation Matches either expression it separates. Example: H|Cat matches either "Hat" or "Cat"
(...) parentheses Provides grouping for quantifiers, limits scope of alternation via precedence. Example: (abc)* matches 0 or more occurrences of the the string abc Example: WhatsUp (Gold)|(Professional) matches "WhatsUp Gold" or "WhatsUp Professional"
\0, \1, ... backreference Matches text previously matched within first, second, etc, match group (starting at 0). Example: <{head}>.*?</\0> matches "<head>xxx</head>".
! negation The expression following ! does not match the input Example: a!b matches "a" not followed by "b".
Abbreviations Abbreviations are shorthand Meta-characters.
Abbreviation Matches
\a Any alphanumeric character: ([a-zA-Z0-9])
\b White space (blank): ([ \\t])
\c Any alphabetic character: ([a-zA-Z])
\d Any decimal digit: [0-9]
\D Any non decimal digit: [^0-9]
\h Any hexadecimal digit: ([0-9a-fA-F])
\n Newline: (\r|(\r?\n))
\p Any punctuation character: ,./\';:"!?@#$%^&*()[]{}- _=+|<>!~
\P Any non-punctuation character
\q A quoted string: (\"[^\"]*\")|(\'[^\']*\')
\s WhatsUp Gold style white space character: [ \\t\\n\\r\\f\\v]
\S WhatsUp Gold style non-white space character: [^ \\t\\n\\r\\f\\v]
\w Any word characters (letters and digits): ([a-zA-Z0-9_])
\W Non-word character: ([^a-zA-Z0-9_])
\z An integer: ([0-9]+)
Using WhatsUp Gold 14.4
184
Text string example
Example 1
To check an IRC (Internet Relay Chat) service, you can send the command Version/r/n and the expected response from the IRC service is: irc.
Name: IRC; Port: 6667; TCP.
Send=Version/r/n
Expect=irc
Send=QUIT/r/n
Note: You can use Telnet to find the proper value for SimpleExpect, or an Expect string for a particular service. Packet Capture tools can also be very useful.
Using the Telnet Monitor Telnet is a simple service monitor that checks for a Telnet server on port 23. If no telnet service responds on this port, then the service is considered down.
To configure a Telnet Monitor:
1 Go to the Active Monitor Library:
From the web interface, click GO. The GO menu appears.
If the WhatsUp section is not visible, click WhatsUp. The WhatsUp section of the GO menu appears.
Select Configure > Active Monitor Library. The Active Monitor Library appears.
- or -
From the main menu of the console, select Configure > Active Monitor Library. The Active Monitor Library appears.
2 In the Active Monitor Library, do one of the following:
Click New. The Select Active Monitor Type dialog appears.
Select Telnet Monitor from the list, then click OK. The Add Telnet Monitor dialog appears.
- or - Select an existing Telnet Monitor, then click Edit. The monitor properties dialog appears.
Using WhatsUp Gold 14.4
185
3 Enter or select the appropriate information in the following fields.
Name. The name of the monitor as it appears in the Active Monitor Library.
Description. The description of the monitor as it appears in the Active Monitor Library.
Timeout. Enter a timeout value. This is the length of time in which the service is given a chance to respond. If there is no response in this amount of time, the service is considered down.
Use in discovery. Select this option to have the monitor appear in the Active Monitors list during discovery. From there, you can select the monitor to have WhatsUp Gold discover that monitor type on your devices.
4 Click OK to save changes.
Using Telnet to determine "Expect on Connect" string
Telnet to the desired port on the host when you are certain it is working properly, and see what comes back. You can enter just an identifying portion of a SimpleExpect or Expect keyword.
For example, if you expect to get "220 hostname.domain.com Imail v1.3" back from the host, you could use "220 host" as a response string (i.e. SimpleExpect=220 host, or Expect=^220 host).
Note: Some services are based on binary protocols (such as DNS) and will not provide you with a simple response string to use. You can use a packet capture tool to view these types of responses.
Using the Temperature Monitor The Temperature Monitor checks select Cisco switches/routers, Dell servers, HP ProCurve switches/routers, and Ravica temperature probes to see that they return a value that signals they are in an up state. The monitor first checks to see if a device is a Cisco, Dell, HP, or Ravica device, then checks any enabled temperature monitor devices. If a temperature probe is disabled, the monitor ignores it; if a temperature probe does not return a value of 1 - Normal (for Cisco switches/routers), 3 - OK (for Dell server devices), 4 - Good (for HP ProCurve switches and routers), 2 - OK (for HP ProLiant servers), or 2 - normal (for Ravica temperature probes) the monitor is considered down.
This monitor is pre-configured and exists in the Active Monitor Library upon installation of WhatsUp Gold. Unlike many pre-configured active monitors, the Temperature Monitor's default configuration cannot be modified. However, you can modify the monitor name and description, as well as the SNMP timeout and number of retries used while attempting to connect to devices.
Using WhatsUp Gold 14.4
186
To configure the Temperature Monitor:
1 Go to the Active Monitor Library.
From the web interface, click GO. The GO menu appears.
If the WhatsUp section is not visible, click WhatsUp. The WhatsUp section of the GO menu appears.
Select Configure > Active Monitor Library. The Active Monitor Library appears.
- or -
From the main menu bar of the console, select Configure > Active Monitor Library. The Active Monitor Library appears.
2 In the Active Monitor Library, do one of the following:
Click New, then select Temperature Monitor.
- or -
Select an existing Temperature Monitor, then click Edit. The monitor properties page appears.
3 In the Active Monitor Library, select the Temperature Monitor, then click Edit. The New/Edit Temperature Monitor dialog appears.
4 Enter the appropriate information in the following fields.
Name. The name of the monitor as it appears in the Active Monitor Library.
Description. The description of the monitor as it appears in the Active Monitor Library.
Tip: Click Advanced to modify the SNMP timeout and number of retries.
5 Click OK to save changes.
Using the WAP Radio Monitor The WAP Radio Active Monitor, included in the WhatsUp Gold Premium, Distributed, and MSP Editions, uses Simple Network Management Protocol (SNMP) to query WAP devices and report the status of the wireless access point. This monitor indicates that the wireless radio is in either an up or down state. Currently, the WAP Radio Active Monitor supports Cisco Aironet WAPs.
Important: The Cisco WAP you want to monitor must support Cisco Dot 11 and IEEE 802.11 MIBs for WhatsUp Gold WAP Monitor features to operate.
Using WhatsUp Gold 14.4
187
To determine the monitor status, the monitor first looks at the ifType (OID 1.3.6.1.2.1.2.2.1.3) value. The ifType value of 71 - IEEE 80211 must be present for the monitor to continue checking the WAP radio device status. If the ifType value is true, then the ifAdminStatus (OID: 1.3.6.1.2.1.2.2.1.7) value is checked. Finally, if the ifAdminStatus value for the interface is in the down or testing state, the active monitor is considered down and the ifOperStatus (OID: 1.3.6.1.2.1.2.2.1.8) value is checked. If the ifOperStatus value is 1 - up or 5 - dormant, the WAP radio is determined to be in the up state; otherwise the device is considered to be in the down state.
This monitor is pre-configured and exists in the Active Monitor Library upon installation of WhatsUp Gold. Unlike many pre-configured active monitors, the WAP Radio Monitor's default configuration cannot be modified. However, you can modify the monitor name and description, as well as the SNMP timeout and number of retries used while attempting to connect to devices.
To configure the WAP Radio Monitor:
1 Go to the Active Monitor Library.
From the web interface, click GO. The GO menu appears.
If the WhatsUp section is not visible, click WhatsUp. The WhatsUp section of the GO menu appears.
Select Configure > Active Monitor Library. The Active Monitor Library appears.
- or -
From the main menu bar of the console, select Configure > Active Monitor Library. The Active Monitor Library appears.
2 In the Active Monitor Library, do one of the following:
Click New, then select WAP Radio Monitor.
- or -
Select an existing WAP Radio Monitor, then click Edit. The monitor properties page appears.
3 In the Active Monitor Library, select the WAP Radio Monitor, then click Edit. The New/Edit WAP Radio Monitor dialog appears.
4 Enter the appropriate information in the following fields.
Name. The name of the monitor as it appears in the Active Monitor Library.
Description. The description of the monitor as it appears in the Active Monitor Library.
Tip: Click Advanced to modify the SNMP timeout and number of retries.
5 Click OK to save changes.
Using WhatsUp Gold 14.4
188
Using premium active monitors WhatsUp Gold Premium Edition provides all of the network monitoring capabilities of WhatsUp Gold and extends the product to allow additional monitoring capabilities, including:
APC UPS monitor watches your American Power Conversion Uninterruptible Power Supply (APC UPS) device and alerts you when selected thresholds are met or exceeded, output states are reached, and/or abnormal conditions are met.
Email monitor lets you periodically verify that mail servers are not only up, but are receiving and delivering messages properly.
Microsoft® Exchange™ and Microsoft SQL Server monitors let you manage the availability of key application services, rather than just the network visibility of the host server.
Fan monitor checks select Cisco, Dell, and HP device fans and cooling devices, such as active and passive cooling components, to see that they are enabled and return a values that signal they are working properly.
File Properties monitor
Folder monitor
FTP monitor
HTTP Content monitor
Network Statistics monitor
Power Supply monitor
Printer monitor
Process monitor
SQL Query monitor
General application monitoring using Microsoft's WMI lets you monitor any performance counter value and trigger an alarm if the value changes, goes out of range, or experiences an unexpected rate of change.
Using the APC UPS Monitor
This monitor watches your American Power Conversion Uninterruptible Power Supply (APC UPS) device and alerts you when selected thresholds are met or exceeded, output states are reached, and/or abnormal conditions are met. For example, an alert can be sent when the UPS battery capacity is below 20%, when the battery temperature is high, when the battery is in bypass mode due to a battery overload state, and many other UPS alert conditions.
Note: This feature is only available in WhatsUp Gold Premium Edition. To update your license, visit the MyIpswitch portal (http://www.myipswitch.com).
Using WhatsUp Gold 14.4
189
To configure an APC UPS active monitor:
1 Go to the Active Monitor Library.
From the web interface, click GO. The GO menu appears.
If the WhatsUp section is not visible, click WhatsUp. The WhatsUp section of the GO menu appears.
Select Configure > Active Monitor Library. The Active Monitor Library appears.
- or -
From the main menu bar of the console, select Configure > Active Monitor Library. The Active Monitor Library appears.
2 In the Active Monitor Library, do one of the following:
Click New. The Select Active Monitor Type dialog appears.
Select APC UPS Monitor from the list, then click OK. The Add APC UPS Monitor dialog appears.
- or - Select an existing APC UPS Monitor, then click Edit. The monitor properties dialog appears.
3 Enter or select the appropriate information in the following fields.
Name. Enter a name for the active monitor. This name is displayed in the Active Monitor Library.
Description. Enter a short description for the monitor. This name is displayed next to the monitor name in the Active Monitor Library.
Thresholds. Select the threshold(s) on which you want to be alerted. Refer to the APC UPS documentation for more information about the thresholds. By default, all of the thresholds are selected for use in the monitor. By default, the following output states are selected for use in the monitor:
Battery Status
Battery Capacity
Battery Runtime
Output Load
Tip: Select a threshold, then click Configure to set its individual threshold settings.
Using WhatsUp Gold 14.4
190
Monitor the following output states. Select the output state(s) on which you want to be alerted. Refer to the APC UPS documentation for more information about the output states. By default, the following output states are selected for use in the monitor:
Abnormal Condition Present
AVR Boost Active
AVR Trim Active
Bad Output Voltage
Batteries Discharged
Battery Charger Failure
Battery Communication Lost
Graceful Shutdown Initiated
Graceful Shutdown Issued by Downstream Device
Graceful Shutdown Issued by Upstream Device
High Battery Temperature
In Bypass due to Fan Failure
In Bypass due to Internal Fault
In Bypass due to Supply Failure
Low Battery
Low Battery/On Battery
Manual Bypass
No Batteries Attached
On
On Battery
On Line
Overload
Rebooting
Replace Battery
Runtime Calibration
Self Test In Progress
Serial Communication Established
Sleeping on a Timer
Sleeping until Utility Power Returns
Smart Boost or Smart Trim Fault
Using WhatsUp Gold 14.4
191
Software Bypass
Synchronized command is in progress
Tip: Use the list's vertical scroll bar to browse the output states.
Monitor the following abnormal conditions. Select the abnormal condition(s) on which you want to be alerted. Refer to the APC UPS documentation for more information about the abnormal conditions. By default, all of the abnormal conditions are selected for use in the monitor.
Backfeed Protection Relay
Battery Failure
Battery Voltage High
Bypass Contactor Stuck in Bypass Condition
Bypass Contactor Stuck in On-Line Condition
Bypass not in Range, Either Frequency or Voltage
Extended Run Frame Fault
IIC Inter-Module Communication Failure
In Bypass due to an Internal Fault
In Bypass due to an Overload
In Maintenance Bypass
Input Circuit Braker Tripped Open
Load (kVA) Alarm Threshold Violation
Main Intelligence Module Failure
No Batteries Installed
No Working Power Modules
Output Voltage out of Range
Power Module Failure
Redundancy Below Alarm Threshold
Redundancy Lost
Redundant Intelligence Module Failure
Redundant Intelligent Module in Control
Runtime Below Alarm Threshold
Site Wiring Fault
System Level Fan Failure
UPS Not Synchronized
Using WhatsUp Gold 14.4
192
UPS Specific Fault Detected
Tip: Use the list's vertical scroll bar to browse the abnormal conditions.
Tip: Click Advanced to set the SNMP timeout and number of retries.
4 Click OK to save changes.
Using the Email Monitor
The Email Monitor checks a mail server by first sending the server an email via SMTP. The monitor then attempts to delete previously sent emails using either POP3 or IMAP. If no emails from the monitor are present in the inbox to delete, the mail server is considered down.
The Email Monitor supports encryption with SSL/TLS and SMTP Authentication which ensures that the monitor sends emails to a secure email account.
Note: This feature is only available in WhatsUp Gold Premium Edition. To update your license, visit the MyIpswitch portal (http://www.myipswitch.com).
To configure an Email Monitor:
1 Go to the Active Monitor Library:
From the web interface, click GO. The GO menu appears.
If the WhatsUp section is not visible, click WhatsUp. The WhatsUp section of the GO menu appears.
Select Configure > Active Monitor Library. The Active Monitor Library appears.
- or -
From the main menu of the console, select Configure > Active Monitor Library. The Active Monitor Library appears.
2 In the Active Monitor Library, do one of the following:
Click New. The Select Active Monitor Type dialog appears.
Select Email Monitor from the list, then click OK. The Add Email Monitor dialog appears.
- or - Select an existing Email Monitor, then click Edit. The monitor properties dialog appears.
Using WhatsUp Gold 14.4
193
3 Enter or select the appropriate information in the following fields.
Name. Enter a title for the Email Monitor.
Description. Enter a short description for the monitor (optional).
Outgoing mail
SMTP server. Enter the address of the server on which SMTP is running. Use the default, %Device.Address, to use the device IP address on which the monitor is attached.
Port. Enter the port on which the SMTP service is listening. The standard SMTP port is 25.
Mail to. Enter the address to which the Email Monitor will send email.
Mail from. Enter the address to be listed as "From" in the email sent by the Email Monitor.
Incoming mail
Server. Enter the address of the server on which the POP3 or IMAP service is running.
Account type. Select the protocol (POP3 or IMAP) you want the monitor to use to check for correct email delivery.
Username. Enter the username of the account in which the monitor will use to log in.
Password. Enter the password for the account in which the monitor will use to log in.
4 Click OK to save changes.
Note: If you want to configure advanced settings for this instance of the Email Monitor, click Advanced. From here, you can choose to use SMTP Authentication; set the port on which POP3 or IMAP is running; use encrypted connections for SMTP, IMAP, and POP3; and set timeouts for SMTP, IMAP, and POP3.
To add an Email Monitor to a mail server:
1 On the device list, find the device that represents the SQL server. Right-click the device, then select Properties. Select Active Monitors.
2 Click Add. The Active Monitor Wizard appears.
3 Select the monitor, and continue with the wizard to configure any actions for the monitor.
For more information about assigning active monitors to devices, see Assigning active monitors (on page 243).
For more information on setting up an action to fire based on the active monitor status, see Using Actions (on page 264).
Using WhatsUp Gold 14.4
194
Monitoring a Microsoft Exchange 2007 Server
The Exchange Monitor lets you monitor the Microsoft® Exchange™ Server application. The Exchange Monitor provides real-time information about the state and health of Microsoft Exchange servers on your network.
The Exchange Monitor supports monitoring of Microsoft Exchange Server version 2007 and later, which can be on any machine in your network.
Important: Do not use the Exchange Monitor to monitor Exchange 2003 servers.
To create custom parameters to monitor, the Exchange Server host must be WMI-enabled.
Why use it? WhatsUp Gold can monitor and report the status of the standard services associated with any mail server, such as SMTP, POP3, and IMAP. If any of these services fail, your users are unable to get mail. It is a good idea to set up monitoring on these services so that you are the first to know if they fail. The Exchange Monitor extends monitoring to parameters reported by Microsoft Exchange, allowing you to get an early warning of a degradation in performance. For example, you can monitor the SMTP queues to see if performance is within an expected range, and if not, you can intervene before the SMTP service fails.
Note: This feature is only available in WhatsUp Gold Premium Edition. To update your license, visit the MyIpswitch portal (http://www.myipswitch.com).
How to get started using the Exchange
This topic describes the overall process of configuring an Exchange Monitor, assigning it to a device, and getting feedback from the monitor.
A basic approach to using the Exchange Monitor:
1 Determine which Exchange roles and performance thresholds to monitor.
2 Determine which Exchange services to monitor.
3 Decide whether to create a single monitor with multiple parameters and services, several monitors with one parameter or service, or some combination.
To start, it may be simpler to create one monitor for each parameter or service that you want to monitor. Whether you set up one monitor or many has a bearing on how the information is reported in WhatsUp Gold logs and by actions.
4 Configure an Exchange Monitor with your selected parameters and/or services.
5 Add the Exchange Monitor to the device that represents your Microsoft Exchange server.
6 Set up an Action to tell you when the monitor goes down or comes back up.
Using WhatsUp Gold 14.4
195
Note: The monitor will be reported down if any of the parameters or services in that monitor are down.
Configuring an Exchange Monitor
To configure an instance of the Exchange Monitor:
1 Go to the Active Monitor Library:
From the web interface, click GO. The GO menu appears.
If the WhatsUp section is not visible, click WhatsUp. The WhatsUp section of the GO menu appears.
Select Configure > Active Monitor Library.
- or -
From the main menu bar of the console, select Configure > Active Monitor Library. The Active Monitor Library appears.
Tip: The Active Monitor Library is the starting point for creating any Active Monitor in WhatsUp Gold. This dialog shows all of the Active Monitors in your database.
2 Add an Exchange monitor:
a) Click New. The Select Active Monitor Type dialog appears.
b) Select Exchange Monitor from the list and Click OK. The New Exchange Monitor Server dialog appears.
c) In the Name box, enter the name you want to use to identify this instance of the Exchange monitor.
d) In the Description box, enter any text information to further describe the monitor.
e) Select the Server Roles to monitor.
f) To configure the thresholds within the server role, highlight the server role and click Configure. For more information about specific thresholds, see Exchange roles and performance thresholds.
g) Select the services to monitor. For more information about specific services, see Exchange services.
h) Click OK to save the monitor in the Active Monitor Library.
3 Add the monitor to your Exchange Server device.
a) In your device list, find the device that represents the Exchange server. Right-click the device, then select Properties. Select Active Monitors.
b) Click Add. The Active Monitor wizard appears.
Select the monitor, and continue with the wizard to configure any actions for the monitor.
For more information on setting up an action, see Configuring an action (on page 267).
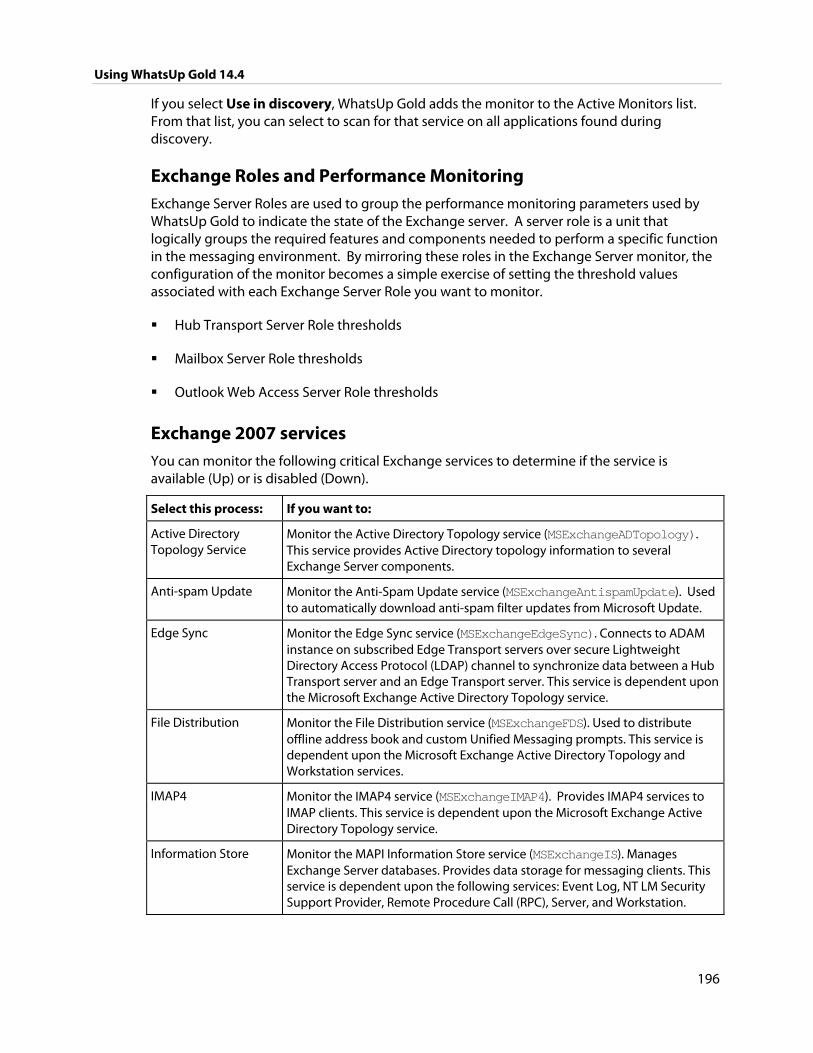
Using WhatsUp Gold 14.4
196
If you select Use in discovery, WhatsUp Gold adds the monitor to the Active Monitors list. From that list, you can select to scan for that service on all applications found during discovery.
Exchange Roles and Performance Monitoring Exchange Server Roles are used to group the performance monitoring parameters used by WhatsUp Gold to indicate the state of the Exchange server. A server role is a unit that logically groups the required features and components needed to perform a specific function in the messaging environment. By mirroring these roles in the Exchange Server monitor, the configuration of the monitor becomes a simple exercise of setting the threshold values associated with each Exchange Server Role you want to monitor.
Hub Transport Server Role thresholds
Mailbox Server Role thresholds
Outlook Web Access Server Role thresholds
Exchange 2007 services You can monitor the following critical Exchange services to determine if the service is available (Up) or is disabled (Down).
Select this process: If you want to:
Active Directory Topology Service
Monitor the Active Directory Topology service (MSExchangeADTopology). This service provides Active Directory topology information to several Exchange Server components.
Anti-spam Update Monitor the Anti-Spam Update service (MSExchangeAntispamUpdate). Used to automatically download anti-spam filter updates from Microsoft Update.
Edge Sync Monitor the Edge Sync service (MSExchangeEdgeSync). Connects to ADAM instance on subscribed Edge Transport servers over secure Lightweight Directory Access Protocol (LDAP) channel to synchronize data between a Hub Transport server and an Edge Transport server. This service is dependent upon the Microsoft Exchange Active Directory Topology service.
File Distribution Monitor the File Distribution service (MSExchangeFDS). Used to distribute offline address book and custom Unified Messaging prompts. This service is dependent upon the Microsoft Exchange Active Directory Topology and Workstation services.
IMAP4 Monitor the IMAP4 service (MSExchangeIMAP4). Provides IMAP4 services to IMAP clients. This service is dependent upon the Microsoft Exchange Active Directory Topology service.
Information Store Monitor the MAPI Information Store service (MSExchangeIS). Manages Exchange Server databases. Provides data storage for messaging clients. This service is dependent upon the following services: Event Log, NT LM Security Support Provider, Remote Procedure Call (RPC), Server, and Workstation.
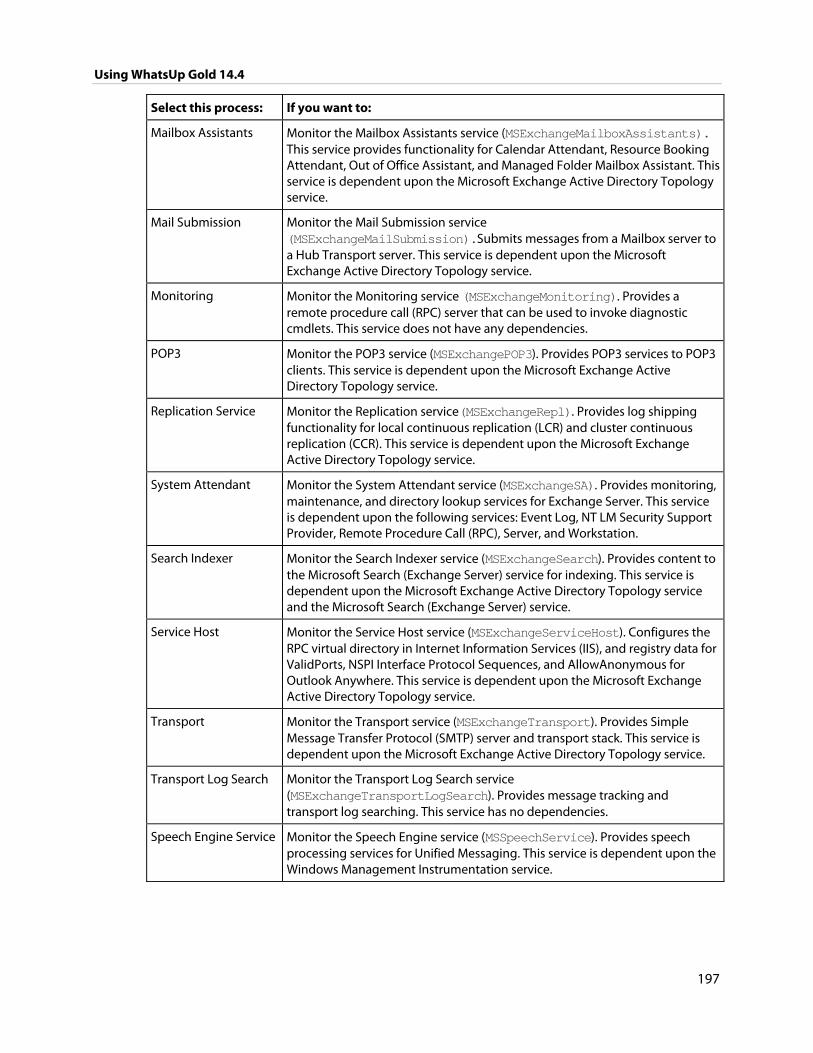
Using WhatsUp Gold 14.4
197
Select this process: If you want to:
Mailbox Assistants Monitor the Mailbox Assistants service (MSExchangeMailboxAssistants). This service provides functionality for Calendar Attendant, Resource Booking Attendant, Out of Office Assistant, and Managed Folder Mailbox Assistant. This service is dependent upon the Microsoft Exchange Active Directory Topology service.
Mail Submission Monitor the Mail Submission service (MSExchangeMailSubmission).Submits messages from a Mailbox server to a Hub Transport server. This service is dependent upon the Microsoft Exchange Active Directory Topology service.
Monitoring Monitor the Monitoring service (MSExchangeMonitoring). Provides a remote procedure call (RPC) server that can be used to invoke diagnostic cmdlets. This service does not have any dependencies.
POP3 Monitor the POP3 service (MSExchangePOP3). Provides POP3 services to POP3 clients. This service is dependent upon the Microsoft Exchange Active Directory Topology service.
Replication Service Monitor the Replication service(MSExchangeRepl). Provides log shipping functionality for local continuous replication (LCR) and cluster continuous replication (CCR). This service is dependent upon the Microsoft Exchange Active Directory Topology service.
System Attendant Monitor the System Attendant service (MSExchangeSA). Provides monitoring, maintenance, and directory lookup services for Exchange Server. This service is dependent upon the following services: Event Log, NT LM Security Support Provider, Remote Procedure Call (RPC), Server, and Workstation.
Search Indexer Monitor the Search Indexer service (MSExchangeSearch). Provides content to the Microsoft Search (Exchange Server) service for indexing. This service is dependent upon the Microsoft Exchange Active Directory Topology service and the Microsoft Search (Exchange Server) service.
Service Host Monitor the Service Host service (MSExchangeServiceHost). Configures the RPC virtual directory in Internet Information Services (IIS), and registry data for ValidPorts, NSPI Interface Protocol Sequences, and AllowAnonymous for Outlook Anywhere. This service is dependent upon the Microsoft Exchange Active Directory Topology service.
Transport Monitor the Transport service (MSExchangeTransport). Provides Simple Message Transfer Protocol (SMTP) server and transport stack. This service is dependent upon the Microsoft Exchange Active Directory Topology service.
Transport Log Search Monitor the Transport Log Search service (MSExchangeTransportLogSearch). Provides message tracking and transport log searching. This service has no dependencies.
Speech Engine Service Monitor the Speech Engine service (MSSpeechService). Provides speech processing services for Unified Messaging. This service is dependent upon the Windows Management Instrumentation service.

Using WhatsUp Gold 14.4
198
Select this process: If you want to:
Unified Messaging Monitor the Unified Messaging service (MSExchangeUM). Provides Unified Messaging features, such as the storing of inbound faxes and voice mail messages in a user's mailbox, and access to that mailbox via Outlook Voice Access. This service is dependent upon the Microsoft Exchange Active Directory Topology service and the Microsoft Exchange Speech Engine service.
Example: Exchange Server monitor
To monitor what is happening with the operating system on the Exchange server, you can create a monitor called ExchangeMailServer to monitor an Exchange server operating in the Mailbox Server role. The purpose of this monitor is to give an indication of the performance of the Exchange server in regards to the threshold values and services associated with the Mailbox Server role. To this end, you can configure the monitor to monitor the thresholds associated with the Mailbox Server role, as well as to monitor the Information Store, Mailbox Assistants and Mail Submission services.
1 Open the Active Monitor Library.
From the web interface, click GO. The GO menu appears.
If the WhatsUp section is not visible, click WhatsUp. The WhatsUp section of the GO menu appears.
Select Configure > Active Monitor Library. The Active Monitor Library appears.
2 Click New. The Select Active Monitor Type dialog appears.
3 Select Exchange Monitor and click OK. The New Exchange Server Monitor dialog appears.
a) In the Name box, enter ExchangeMailServer to identify that this monitor will do a check on system parameters.
b) In the Category field, select Mailbox Server.
c) Highlight the Mailbox Server role, then click Configure. The Configure Mailbox Server Thresholds menu appears.
d) In the RPC Averaged Latency must not exceed: field, enter an appropriate threshold for the average latency for Remote Procedure Calls, and click Ok. The New Exchange Monitor screen appears.
e) Under Services to monitor, select the System Attendant service. Make sure these items have a check in the box to the left. You need to clear the selections for the other parameters and also for the other processes.
f) Click OK to add the ExchangeMailServer monitor to the Active Monitor library.
4 Add the ExchangeMailServer monitor to your Exchange server device.
a) In your device list, find the device that represents the Exchange server. Right-click the device, then select Properties. Select Active Monitors.
b) Click Add. The Active Monitor wizard appears.
c) Select the ExchangeMailServer monitor, and continue with the wizard to configure any actions for the monitor.
Using WhatsUp Gold 14.4
199
For more information on setting up an action, see Configuring an action (on page 267).
After you complete the wizard, the monitor immediately begins to monitor the Exchange server.
Monitoring Microsoft Exchange 2003 Servers The Exchange 2003 Monitor lets you monitor the Microsoft® Exchange™ 2003 Server applications. The Exchange 2003 Monitor provides real-time information about the state and health of Microsoft Exchange servers on your network.
The Exchange 2003 Monitor supports monitoring of Microsoft Exchange Server versions 2000 and 2003, which can be on any machine in your network.
To create custom parameters to monitor, the Exchange Server host must be WMI-enabled.
Why use it? WhatsUp Gold can monitor and report the status of the standard services associated with any mail server, such as SMTP, POP3, and IMAP. If any of these services fail, your users are unable to get mail. It is a good idea to set up monitoring on these services so that you are the first to know if they fail. The Exchange Monitor extends monitoring to parameters reported by Microsoft Exchange, allowing you to get an early warning of a degradation in performance. For example, you can monitor the SMTP queues to see if performance is within an expected range, and if not, you can intervene before the SMTP service fails.
Note: This feature is only available in WhatsUp Gold Premium Edition. To update your license, visit the MyIpswitch portal (http://www.myipswitch.com).
How to get started using the Exchange 2003 Monitor
This topic describes the overall process of configuring an Exchange 2003 Monitor, assigning it to a device, and getting feedback from the monitor.
A basic approach to using the Exchange 2003 Monitor:
1 Determine which Exchange 2003 parameters to monitor.
2 Determine which Exchange 2003 services to monitor.
3 Decide whether to create a single monitor with multiple parameters and services, several monitors with one parameter or service, or some combination.
To start, it may be simpler to create one monitor for each parameter or service that you want to monitor. Whether you set up one monitor or many has a bearing on how the information is reported in WhatsUp Gold logs and by actions. For example, a single monitor to check disk space, named Exchange2003Disk, is reported in logs with this name. If Exchange2003Disk is reported down, you know it's a disk space problem.
4 Configure an Exchange 2003 Monitor with your selected parameters and/or services.
5 Add the Exchange 2003 Monitor to the device that represents your Microsoft Exchange 2003 server.
Using WhatsUp Gold 14.4
200
6 Set up an Action to tell you when the monitor goes down or comes back up.
Note: The monitor is reported down if any of the parameters or services in that monitor are down.
Configuring an Exchange 2003 Monitor
To configure an instance of the Exchange 2003 Monitor:
1 Go to the Active Monitor Library:
From the web interface, click GO. The GO menu appears.
If the WhatsUp section is not visible, click WhatsUp. The WhatsUp section of the GO menu appears.
Select Configure > Active Monitor Library.
- or -
From the main menu bar of the console, select Configure > Active Monitor Library. The Active Monitor Library appears.
Tip: The Active Monitor Library is the starting point for creating any Active Monitor in WhatsUp Gold. This dialog shows all of the Active Monitors in your database.
2 Add an Exchange 2003 monitor:
a) Click New. The Select Active Monitor Type dialog appears.
b) Select Exchange 2003 Monitor from the list. The New Exchange Monitor Server dialog appears.
c) In the Name box, enter the name you want to use to identify this instance of the Exchange monitor. For example, if you are configuring a monitor to check disk space, you might enter ExchangeDisk.
d) In the Description box, enter any text information to further describe the monitor.
e) Select the thresholds to add to the monitor. For more information about specific thresholds, see Exchange 2003 parameters (on page 201).
f) Select the services to monitor. For more information about specific services, see Exchange 2003 services (on page 201).
g) Click OK to save the monitor in the Active Monitor Library.
3 Add the monitor to your Exchange 2003 Server device.
a) In your device list, find the device that represents the Exchange server. Right-click the device, then select Properties. Select Active Monitors.
b) Click Add. The Active Monitor wizard appears.
Select the monitor, and continue with the wizard to configure any actions for the monitor.
For more information on setting up an action, see Configuring an action (on page 267).
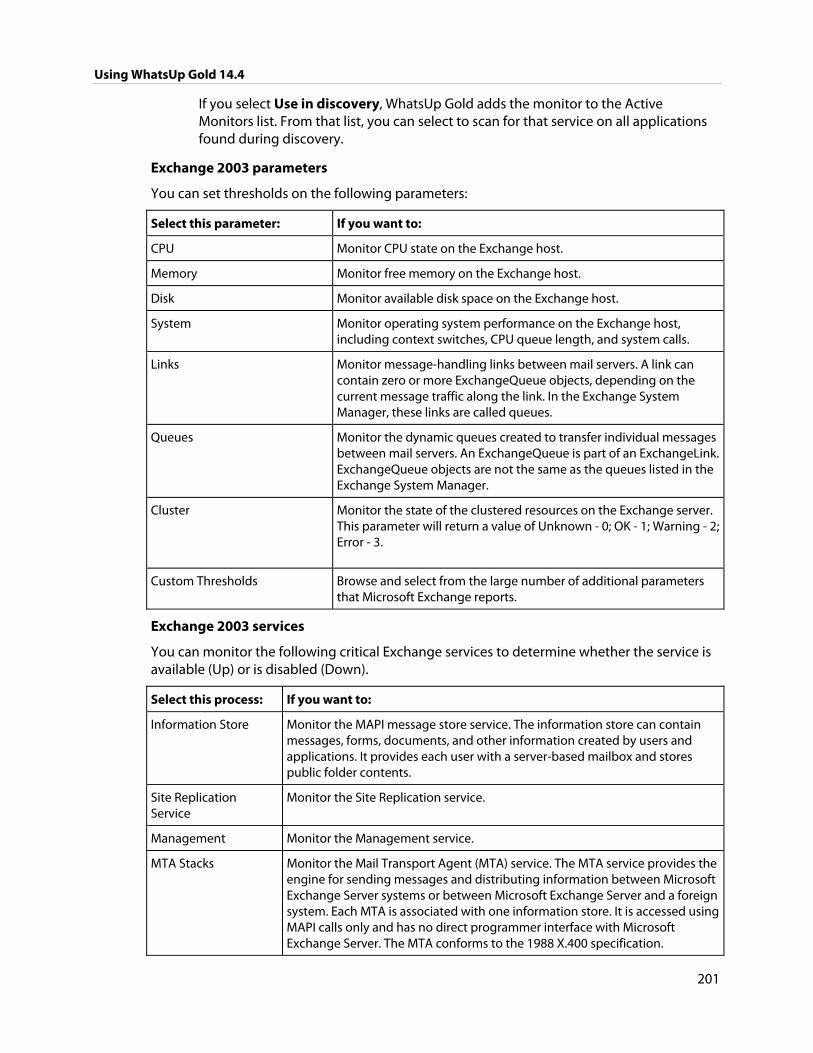
Using WhatsUp Gold 14.4
201
If you select Use in discovery, WhatsUp Gold adds the monitor to the Active Monitors list. From that list, you can select to scan for that service on all applications found during discovery.
Exchange 2003 parameters
You can set thresholds on the following parameters:
Select this parameter: If you want to:
CPU Monitor CPU state on the Exchange host.
Memory Monitor free memory on the Exchange host.
Disk Monitor available disk space on the Exchange host.
System Monitor operating system performance on the Exchange host, including context switches, CPU queue length, and system calls.
Links Monitor message-handling links between mail servers. A link can contain zero or more ExchangeQueue objects, depending on the current message traffic along the link. In the Exchange System Manager, these links are called queues.
Queues Monitor the dynamic queues created to transfer individual messages between mail servers. An ExchangeQueue is part of an ExchangeLink. ExchangeQueue objects are not the same as the queues listed in the Exchange System Manager.
Cluster
Monitor the state of the clustered resources on the Exchange server. This parameter will return a value of Unknown - 0; OK - 1; Warning - 2; Error - 3.
Custom Thresholds Browse and select from the large number of additional parameters that Microsoft Exchange reports.
Exchange 2003 services
You can monitor the following critical Exchange services to determine whether the service is available (Up) or is disabled (Down).
Select this process: If you want to:
Information Store Monitor the MAPI message store service. The information store can contain messages, forms, documents, and other information created by users and applications. It provides each user with a server-based mailbox and stores public folder contents.
Site Replication Service
Monitor the Site Replication service.
Management Monitor the Management service.
MTA Stacks Monitor the Mail Transport Agent (MTA) service. The MTA service provides the engine for sending messages and distributing information between Microsoft Exchange Server systems or between Microsoft Exchange Server and a foreign system. Each MTA is associated with one information store. It is accessed using MAPI calls only and has no direct programmer interface with Microsoft Exchange Server. The MTA conforms to the 1988 X.400 specification.
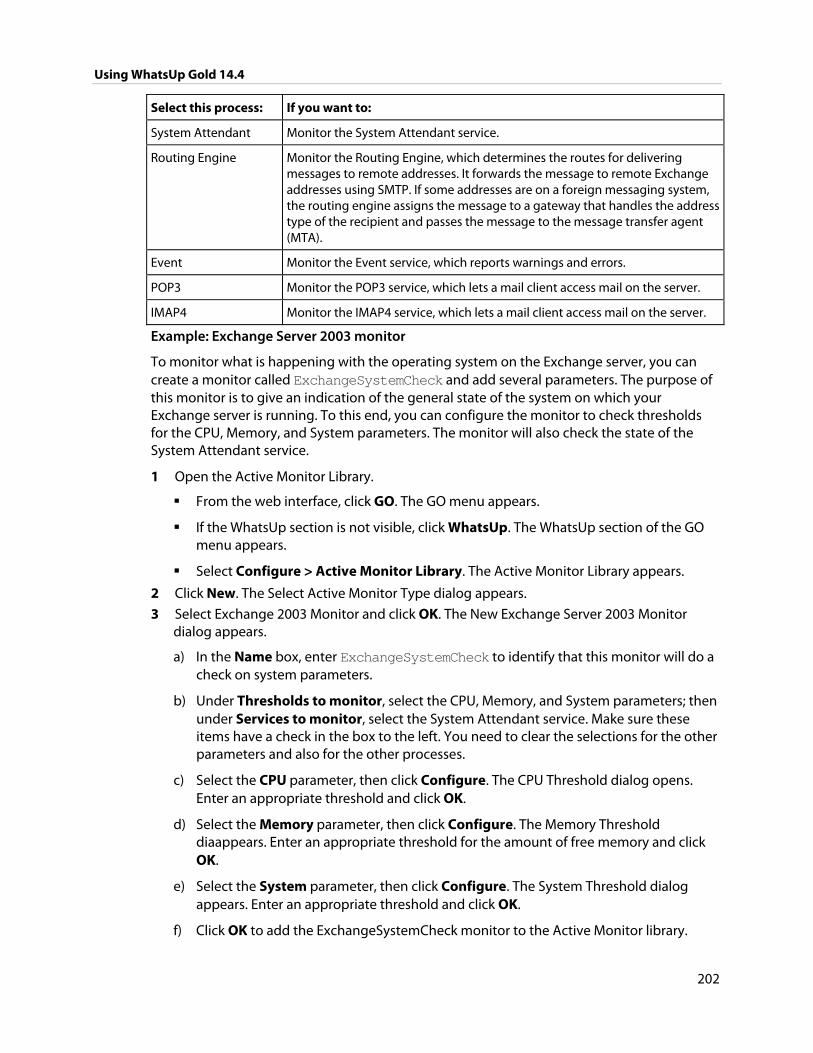
Using WhatsUp Gold 14.4
202
Select this process: If you want to:
System Attendant Monitor the System Attendant service.
Routing Engine Monitor the Routing Engine, which determines the routes for delivering messages to remote addresses. It forwards the message to remote Exchange addresses using SMTP. If some addresses are on a foreign messaging system, the routing engine assigns the message to a gateway that handles the address type of the recipient and passes the message to the message transfer agent (MTA).
Event Monitor the Event service, which reports warnings and errors.
POP3 Monitor the POP3 service, which lets a mail client access mail on the server.
IMAP4 Monitor the IMAP4 service, which lets a mail client access mail on the server.
Example: Exchange Server 2003 monitor
To monitor what is happening with the operating system on the Exchange server, you can create a monitor called ExchangeSystemCheck and add several parameters. The purpose of this monitor is to give an indication of the general state of the system on which your Exchange server is running. To this end, you can configure the monitor to check thresholds for the CPU, Memory, and System parameters. The monitor will also check the state of the System Attendant service.
1 Open the Active Monitor Library.
From the web interface, click GO. The GO menu appears.
If the WhatsUp section is not visible, click WhatsUp. The WhatsUp section of the GO menu appears.
Select Configure > Active Monitor Library. The Active Monitor Library appears.
2 Click New. The Select Active Monitor Type dialog appears.
3 Select Exchange 2003 Monitor and click OK. The New Exchange Server 2003 Monitor dialog appears.
a) In the Name box, enter ExchangeSystemCheck to identify that this monitor will do a check on system parameters.
b) Under Thresholds to monitor, select the CPU, Memory, and System parameters; then under Services to monitor, select the System Attendant service. Make sure these items have a check in the box to the left. You need to clear the selections for the other parameters and also for the other processes.
c) Select the CPU parameter, then click Configure. The CPU Threshold dialog opens. Enter an appropriate threshold and click OK.
d) Select the Memory parameter, then click Configure. The Memory Threshold diaappears. Enter an appropriate threshold for the amount of free memory and click OK.
e) Select the System parameter, then click Configure. The System Threshold dialog appears. Enter an appropriate threshold and click OK.
f) Click OK to add the ExchangeSystemCheck monitor to the Active Monitor library.
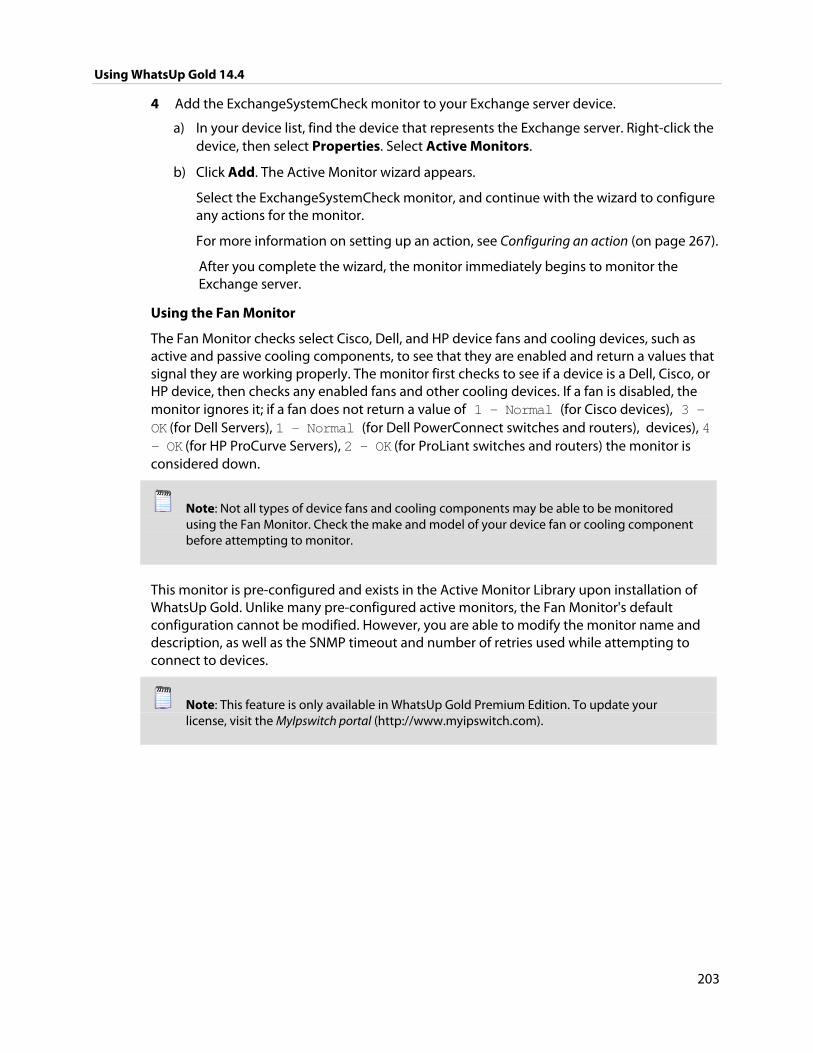
Using WhatsUp Gold 14.4
203
4 Add the ExchangeSystemCheck monitor to your Exchange server device.
a) In your device list, find the device that represents the Exchange server. Right-click the device, then select Properties. Select Active Monitors.
b) Click Add. The Active Monitor wizard appears.
Select the ExchangeSystemCheck monitor, and continue with the wizard to configure any actions for the monitor.
For more information on setting up an action, see Configuring an action (on page 267).
After you complete the wizard, the monitor immediately begins to monitor the Exchange server.
Using the Fan Monitor
The Fan Monitor checks select Cisco, Dell, and HP device fans and cooling devices, such as active and passive cooling components, to see that they are enabled and return a values that signal they are working properly. The monitor first checks to see if a device is a Dell, Cisco, or HP device, then checks any enabled fans and other cooling devices. If a fan is disabled, the monitor ignores it; if a fan does not return a value of 1 - Normal (for Cisco devices), 3 - OK (for Dell Servers), 1 - Normal (for Dell PowerConnect switches and routers), devices), 4 - OK (for HP ProCurve Servers), 2 - OK (for ProLiant switches and routers) the monitor is considered down.
Note: Not all types of device fans and cooling components may be able to be monitored using the Fan Monitor. Check the make and model of your device fan or cooling component before attempting to monitor.
This monitor is pre-configured and exists in the Active Monitor Library upon installation of WhatsUp Gold. Unlike many pre-configured active monitors, the Fan Monitor's default configuration cannot be modified. However, you are able to modify the monitor name and description, as well as the SNMP timeout and number of retries used while attempting to connect to devices.
Note: This feature is only available in WhatsUp Gold Premium Edition. To update your license, visit the MyIpswitch portal (http://www.myipswitch.com).
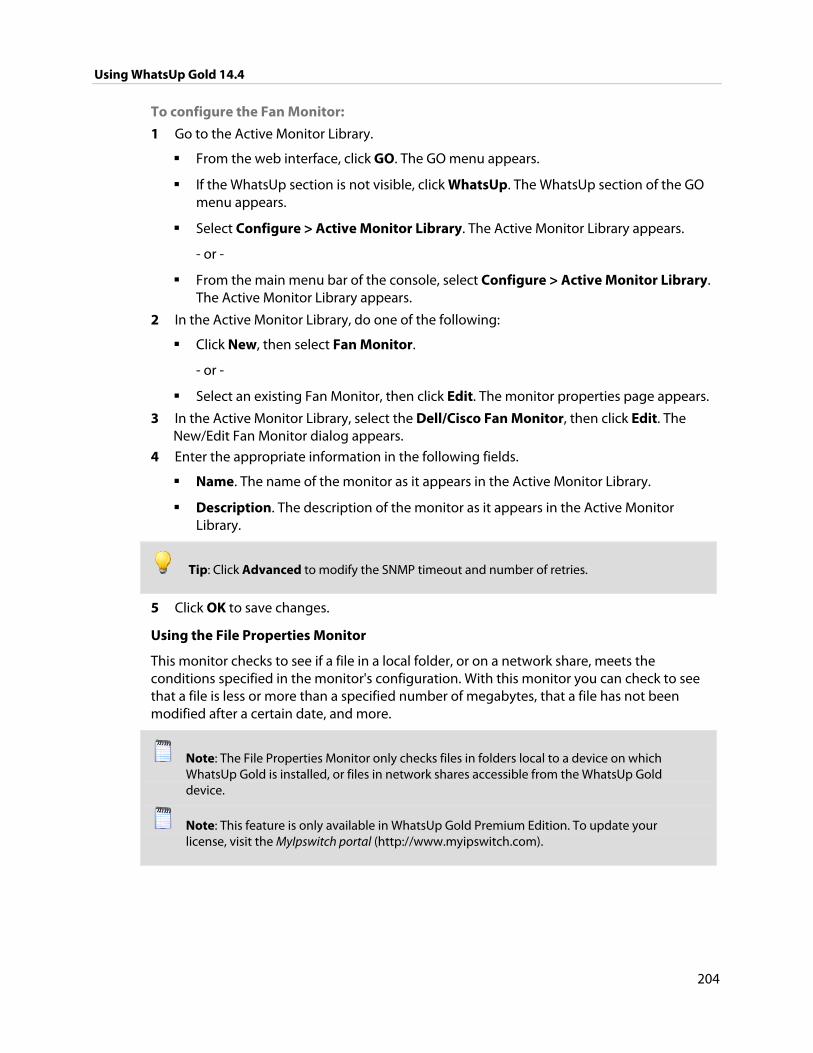
Using WhatsUp Gold 14.4
204
To configure the Fan Monitor:
1 Go to the Active Monitor Library.
From the web interface, click GO. The GO menu appears.
If the WhatsUp section is not visible, click WhatsUp. The WhatsUp section of the GO menu appears.
Select Configure > Active Monitor Library. The Active Monitor Library appears.
- or -
From the main menu bar of the console, select Configure > Active Monitor Library. The Active Monitor Library appears.
2 In the Active Monitor Library, do one of the following:
Click New, then select Fan Monitor.
- or -
Select an existing Fan Monitor, then click Edit. The monitor properties page appears.
3 In the Active Monitor Library, select the Dell/Cisco Fan Monitor, then click Edit. The New/Edit Fan Monitor dialog appears.
4 Enter the appropriate information in the following fields.
Name. The name of the monitor as it appears in the Active Monitor Library.
Description. The description of the monitor as it appears in the Active Monitor Library.
Tip: Click Advanced to modify the SNMP timeout and number of retries.
5 Click OK to save changes.
Using the File Properties Monitor
This monitor checks to see if a file in a local folder, or on a network share, meets the conditions specified in the monitor's configuration. With this monitor you can check to see that a file is less or more than a specified number of megabytes, that a file has not been modified after a certain date, and more.
Note: The File Properties Monitor only checks files in folders local to a device on which WhatsUp Gold is installed, or files in network shares accessible from the WhatsUp Gold device.
Note: This feature is only available in WhatsUp Gold Premium Edition. To update your license, visit the MyIpswitch portal (http://www.myipswitch.com).
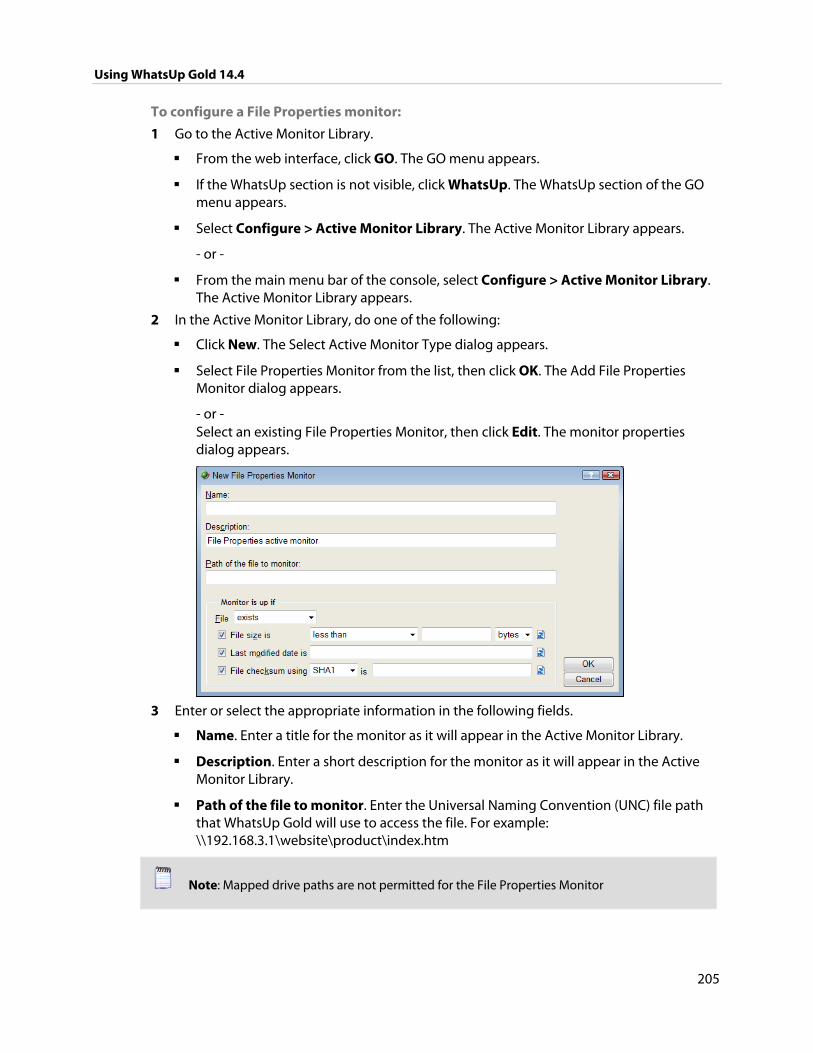
Using WhatsUp Gold 14.4
205
To configure a File Properties monitor:
1 Go to the Active Monitor Library.
From the web interface, click GO. The GO menu appears.
If the WhatsUp section is not visible, click WhatsUp. The WhatsUp section of the GO menu appears.
Select Configure > Active Monitor Library. The Active Monitor Library appears.
- or -
From the main menu bar of the console, select Configure > Active Monitor Library. The Active Monitor Library appears.
2 In the Active Monitor Library, do one of the following:
Click New. The Select Active Monitor Type dialog appears.
Select File Properties Monitor from the list, then click OK. The Add File Properties Monitor dialog appears.
- or - Select an existing File Properties Monitor, then click Edit. The monitor properties dialog appears.
3 Enter or select the appropriate information in the following fields.
Name. Enter a title for the monitor as it will appear in the Active Monitor Library.
Description. Enter a short description for the monitor as it will appear in the Active Monitor Library.
Path of the file to monitor. Enter the Universal Naming Convention (UNC) file path that WhatsUp Gold will use to access the file. For example: \\192.168.3.1\website\product\index.htm
Note: Mapped drive paths are not permitted for the File Properties Monitor
Using WhatsUp Gold 14.4
206
Monitor is up if
File. Select the appropriate option: exists or does not exist. If you select exists, the monitor is up if the selected file is found in the folder on the local directory. If you select does not exist, the monitor is up if the file is not found in the folder on the local directory.
Note: The following options are not required for the monitor scan.
File size is. Select this option, then select the appropriate variable to determine the success or failure of the monitor scan:
- less than
- less than or equal to
- greater than
- greater than or equal to
- equal to
- not equal to
Then enter a numerical value for the file size. The default unit used for the file size is bytes. Optionally, you can change the unit to either KB, MB, or GB.
Click the file properties button to obtain the file's current size. This current value will populate the file size value field and can be used to set the file size threshold. The File size option must be selected for the file properties button to appear.
Last modified date is. Select this option make the monitor dependent on the date on which the file is last modified. This field is populated using the file properties button ; click this button to populate the field with the most recent date and time on which the file was modified. This option must be selected for the file properties button to appear.
File checksum using ____ is _____. Select this option to make the monitor dependent on the file's checksum. Select the option, then select the algorithm (SHA1, SHA224, SHA256, SHA384, SHA512) WhatsUp Gold will use to calculate the checksum. This field is populated using the file properties button ; click this button to populate the field with the file's current checksum. This option must be selected for the file properties button to appear.
Warning: Selecting this option can greatly increase the amount of time it takes to complete the monitor scan and can possibly have an adverse affect on WhatsUp Gold performance. The probability of lengthy monitor scans and slower performance increases when you use algorithms other than SHA1 when you are scanning large files, or when you scan files located on network shares.
4 Click OK to save changes.
Using WhatsUp Gold 14.4
207
About file checksum
File checksums are fingerprint-like fixed data strings assigned to files when they are saved. Checksum algorithms, such as SHA1 and SHA512, are used to monitor checksum files to detect accidental modification of a file, such as corruption during the storage or transmission process. These algorithms match checksums against each other to look for discrepancies; if any exist, the file is known to have been modified.
The File Properties Monitor can monitor a file's current checksum to ensure that it is not been modified by matching the checksum specified in the monitor-configuration to the file's current checksum. If the monitor finds mismatched checksums, you can be alerted that the file has been corrupted.
Using the Folder Monitor
This monitor checks that a local or network share folder meets the conditions specified in the monitor configuration. For example, you can monitor folders for the existence of specific files, whether a folder exists, when a folder size is greater than or less than a specified size, when the number of files in a folder is greater than or less than a specified number of files, and more.
Note: The Folder Monitor only checks folders local to a machine on which WhatsUp Gold is installed, or folders on a network share accessible from the WhatsUp Gold device.
Note: This monitor uses the Windows credentials assigned to the device.
Note: This feature is only available in WhatsUp Gold Premium Edition. To update your license, visit the MyIpswitch portal (http://www.myipswitch.com).
To configure a Folder Monitor:
1 Go to the Active Monitor Library.
From the web interface, click GO. The GO menu appears.
If the WhatsUp section is not visible, click WhatsUp. The WhatsUp section of the GO menu appears.
Select Configure > Active Monitor Library. The Active Monitor Library appears.
- or -

Using WhatsUp Gold 14.4
208
From the main menu bar of the console, select Configure > Active Monitor Library. The Active Monitor Library appears.
2 In the Active Monitor Library, do one of the following:
Click New. The Select Active Monitor Type dialog appears.
Select Folder Monitor from the list, then click OK. The Add Folder Monitor dialog appears.
- or - Select an existing Folder Monitor, then click Edit. The monitor properties dialog appears.
3 Enter or select the appropriate information in the following fields.
Name. Enter a title for the Folder monitor as it will appear in the Active Monitor Library.
Description. Enter a short description for the monitor as it will appear in the Active Monitor Library.
Path of the folder to monitor. Enter the Universal Naming Convention (UNC) file path that WhatsUp Gold will use to access the file. For example: \\192.168.3.1\website\product\
Note: Local folders and folders on mapped drive paths are not permitted for the File Properties Monitor. Only UNC paths are allowed.
Using WhatsUp Gold 14.4
209
Include sub-folders. Select this option to include all folders within the parent folder in the monitor scan.
Important: Selecting this option can greatly increase the amount of time it takes to complete the monitor scan and possibly have an adverse affect on WhatsUp Gold performance.
Files to include
Include all files. Select this option to include all files within the parent folder in the monitor scan.
Include files with names matching following wildcard expression. Select this option, then enter a wildcard expression. Files that match the wildcard expression will be included in the monitor scan. For example, enter *.exe to check for executable (.exe) files in the selected folder.
Note: This option only works for a single wildcard expression at a time. If you enter more than one expression, the monitor reads the entry as one wildcard expression.
Important: When enabled, this option has the probability to greatly slow WhatsUp Gold performance, dependent on the wildcard expression specified. The probability of slower performance increases when this option is used in conjunction with the Include sub-folders option.
Monitor is up if
Folder. Select the appropriate option: exists or does not exist. If you select exists, the monitor is up if the selected folder is found. If you select does not exist, the monitor is up if the folder is not found.
Note: The following options are not required for the monitor scan.
For the following options, select the appropriate variables to determine the success or failure of the monitor scan:
- less than
- less than or equal to
- greater than
- greater than or equal to
- equal to
- not equal to
Using WhatsUp Gold 14.4
210
Actual folder size is. Select this option to make the monitor dependent on the actual folder size. The default unit used for the folder size is bytes. Optionally, you can change the unit to either KB, MB, or GB.
Folder size on disk is. Select this option to make the monitor dependent on the folder size on the disk. The default unit used for the folder size on disk is bytes. Optionally, you can change the unit to either KB, MB, or GB.
Number of files is. Select this option to make the monitor dependent on the number of files in the folder.
Tip: To obtain the current actual folder size, folder size on disk, and number of files, first select the appropriate option, then click the folder properties button. These current values will populate the option value field and can be used to set the monitor threshold.
4 Click OK to save changes.
Using the FTP Monitor
This active monitor performs upload, download, and delete tasks on designated FTP servers to ensure that the FTP servers are functioning properly. You can configure a single monitor to perform all three tasks, but note that if any one of the tasks fails, the entire monitor is considered down.
Note: We recommend that you create a separate FTP monitor for each FTP server you are monitoring--unless the same username and password are used for each of the servers.
Note: This feature is only available in WhatsUp Gold Premium Edition. To update your license, visit the MyIpswitch portal (http://www.myipswitch.com).
To configure an FTP Monitor:
1 Go to the Active Monitor Library.
From the web interface, click GO. The GO menu appears.
If the WhatsUp section is not visible, click WhatsUp. The WhatsUp section of the GO menu appears.
Select Configure > Active Monitor Library. The Active Monitor Library appears.
- or -
From the main menu bar of the console, select Configure > Active Monitor Library. The Active Monitor Library appears.
2 In the Active Monitor Library, do one of the following:
Click New. The Select Active Monitor Type dialog appears.
Select FTP Monitor from the list, then click OK. The Add FTP Monitor dialog appears.
- or - Select an existing FTP Monitor, then click Edit. The monitor properties dialog appears.
Using WhatsUp Gold 14.4
211
3 Enter or select the appropriate information in the following fields.
Name. Enter a name for the monitor. This name is displayed in the Active Monitor Library.
Description. Enter a short description for the monitor. This description is displayed next to the monitor name in the Active Monitor Library.
Server Settings
FTP Server. Enter the device address of the FTP server for which the FTP monitor is configured. The monitor will perform tasks on this FTP server.
Port. Enter the port over which the monitor should use to connect to the FTP server. The default port is 21.
Username. Enter the username used to log in to the FTP server for which the monitor is configured.
Password. Enter the password used to log in to the FTP server for which the monitor is configured.
Important: You must specify an account with the appropriate user permissions for the file actions you select. For more information, see FTP user permissions.
Use Passive Mode. Select this option to instruct WhatsUp Gold to use passive (PASV) mode as it attempts to connect to the FTP server and then to perform the selected tasks. If you do not select this option, the monitor uses Active mode. This option is selected by default. For more information, see Active and Passive modes.
File Actions
Upload. Select this option to have the active monitor upload a file to the designated FTP server. This option is selected by default.
Download. Select this option to have the active monitor download a file from the designated FTP server. This option is selected by default.
Delete. Select this option to have the active monitor delete a file from the designated FTP server. This option is selected by default.
Note: You cannot select the Download or Delete options if you have not selected the Upload option.
Timeout (sec). Enter a timeout (in seconds) for the amount of time WhatsUp Gold should wait for each attempted task to complete. The default timeout is 3 seconds.
Use in Rescan. Select this option to have the monitor appear in the Active Monitor list on the Device Properties dialog. WhatsUp Gold will add the monitor type to the device during a rescan, which is launched using the Rescan button on the Device Properties dialog, if the protocol or service is active on the device.
4 Click OK to save changes.
Using WhatsUp Gold 14.4
212
Using the HTTP Content Monitor
This monitor requests a URL and checks the HTTP response against the expected content. If the response does not return the expected content, the monitor fails. You can use this monitor to ensure that your web pages are available for viewing or that they are rendering on certain browsers. For example, you can check to see that a web page contains specific content that is to be listed after a certain date, such as "Ipswitch introduces its newest release, WhatsUp Gold v14." If the monitor does not find the content that you request it to find, the monitor fails and you know to update your web page.
Note: You can access some HTTPS sites, such as Gmail's login screen, using the HTTP Content Monitor.
Note: This feature is only available in WhatsUp Gold Premium Edition. To update your license, visit the MyIpswitch portal (http://www.myipswitch.com).
Enter or select the appropriate information in the following fields.
Name. Enter a name for the monitor as it will appear in the Active Monitor Library.
Description. Enter a short description for the monitor as it will appear in the Active Monitor Library.
HTTP server settings
URL. Enter the URL address that you want to check using the monitor. The URL must begin with a proper URI, such as http:// or https://.
Note: The URL can include the full path to the document, including the document's file name and any query string parameters. For example, http://www.domain.com/nmconsole/reports.htm?ReportID=100 .
Authentication username. If required, enter the username the web site uses for authentication.
Authentication password. Enter the password that coincides with the username that the web site uses for authentication.
Note: The HTTP Content Monitor only supports basic authentication.
Timeout (seconds). Enter the number of seconds WhatsUp Gold should attempt the connection.
Proxy server. If the content that you want WhatsUp Gold to check is behind a proxy server, enter the proxy server's IP address.
Proxy port. Enter the port on which the proxy server listens.
Using WhatsUp Gold 14.4
213
Web page content
Web page content to find. Enter the content that you would like WhatsUp Gold to look for on the web page it checks. Enter either plain text or a regular expression.
Use regular expression. Select this option to use regular expression in Web page content to find.
Note: The HTTP Content Monitor uses standard regular expression processing as supported by the .NET framework.
Click Request URL contents to populate the dialog with the web page contents of the URL you entered above.
Click Advanced to configure the user agent and custom headers.
Click Use in rescan to have the monitor appear in the Active Monitors list during rescan. WhatsUp Gold will add the monitor type to your devices during a rescan if the protocol or service is active on the device.
Click OK to save changes.
Example: monitoring and alerting on web page content
The HTTP Content monitor checks a specified web page to make sure that content appears on the page. If the results of the web page content are not what is expected, you can be notified through an associated action.
For example, to check whether a page is up and available, you can look for a text string contained in the web page. The following script checks for the words "WhatsUp Gold Tech Support" on the WhatsUp Gold main Support page. If this HTTP Content monitor shows as UP, the web page is displaying as expected. If this HTTP Content monitor shows as DOWN, he web page is down, missing, or has been changed:
Send=GET /support/index.aspx HTTP/1.0\r\nAccept: */*\r\nHost:www.whatsupgold.com\r\nUser-Agent: WhatsUp/1.0\r\n\r\n
Expect=WhatsUp Gold Tech Support
To configure a web page monitor:
1 Go to the Active Monitor Library.
From the web interface, click GO. The GO menu appears.
If the WhatsUp section is not visible, click WhatsUp. The WhatsUp section of the GO menu appears.
Select Configure > Active Monitor Library. The Active Monitor Library appears.
- or -
From the main menu bar of the console, select Configure > Active Monitor Library. The Active Monitor Library appears.
Using WhatsUp Gold 14.4
214
2 Click New. The Select Active Monitor Type dialog appears.
3 Select HTTP Content Monitor, then click OK. The New HTTP Content Monitor dialog appears.
4 Enter or select the following information for the monitor:
Name. Enter a name for the monitor as it will appear in the Active Monitor Library.
Description. Enter a short description for the monitor as it will appear in the Active Monitor Library.
HTTP server settings
URL. Enter the URL address that you want to check using the monitor. The URL must begin with a proper URI, such as http:// or https://.
Note: The URL can include the full path to the document, including the document's file name and any query string parameters. For example, http://www.domain.com/nmconsole/reports.htm?ReportID=100 .
Authentication username. If required, enter the username the web site uses for authentication.
Authentication password. Enter the password that coincides with the username that the web site uses for authentication.
Note: The HTTP Content Monitor only supports basic authentication.
Timeout (seconds). Enter the number of seconds WhatsUp Gold should attempt the connection.
Proxy server. If the content that you want WhatsUp Gold to check is behind a proxy server, enter the proxy server's IP address.
Proxy port. Enter the port on which the proxy server listens.
Web page content
Web page content to find. Enter the content that you would like WhatsUp Gold to look for on the web page it checks. Enter either plain text or a regular expression.
Use regular expression. Select this option to use regular expression in Web page content to find.
Note: The HTTP Content Monitor uses standard regular expression processing as supported by the .NET framework.
Note: Refer to the script above as an example for setting up a check for expected content on a specific web page URL.
Using WhatsUp Gold 14.4
215
To configure a web page monitor and email alert for a device:
1 Right-click the device (web server) that hosts the web page content for which you want to monitor. The Device Properties dialog appears.
2 Click Active Monitors. The Active Monitors dialog appears.
3 Click Add. The Select Active Monitor Type dialog appears.
4 Use the following process to add the HTTP Content Monitor. This monitor checks that the Web server returns valid content in response to an HTTP request.
On the Select Active Monitor Type screen, select the HTTP Content Monitor that you created above, then click Next. The Set Polling Properties dialog appears.
a) Leave the default settings selected (Enable polling for this Active Monitor and Use default network interface), then click Next. The Setup Actions for Monitor State Changes dialog appears.
b) Select Apply individual actions, then click Add. The Select or Create Action dialog appears.
c) Select Select an action from the Action Library, then click Next. The Select Action and State dialog appears.
d) In the Select an action from the Action Library list, select and existing email action or click browse (...) to create a new email action. Refer to the Help for creating a new email action.
e) In the Execute the actions on the following state change list, select Down, then click Finish to save the changes and return to the Setup Actions for State screen.
f) Click Finish to save the changes and return to the Setup Actions for Monitor State Changes dialog.
g) Click Finish. The Device Properties dialog appears.
h) Click OK.
The active monitor and resulting E-mail Action are now enabled. When the web page cannot return the web content, the page is triggered as down and the HTTP Content Monitor fails, triggering the E-mail Action that tells you that the page is down the Web server cannot return web content.
Using the Network Statistics Monitor
This monitor uses Simple Network Management Protocol (SNMP) to query a device to collect data on three device protocols, Internet Protocol (IP), Transmission Control Protocol (TCP), and User Datagram Protocol (UDP), and alerts you when the thresholds you specify are met or exceeded. For example, you can use the IP received discarded threshold monitor to watch for situations where a router with Quality of Service (QOS) has priorities set for Voice over IP (VoIP).
For more information, see Example - Using a Network Statistic Monitor to check for IP data received and discarded (on page 216).
Using WhatsUp Gold 14.4
216
Note: This feature is only available in WhatsUp Gold Premium Edition. To update your license, visit the MyIpswitch portal (http://www.myipswitch.com).
To configure a Network Statistics Monitor:
1 Go to the Active Monitor Library.
From the web interface, click GO. The GO menu appears.
If the WhatsUp section is not visible, click WhatsUp. The WhatsUp section of the GO menu appears.
Select Configure > Active Monitor Library. The Active Monitor Library appears.
- or -
From the main menu bar of the console, select Configure > Active Monitor Library. The Active Monitor Library appears.
2 In the Active Monitor Library, do one of the following:
Click New. The Select Active Monitor Type dialog appears.
Select Network Statistics Monitor from the list, then click OK. The Add Network Statistics Monitor dialog appears.
- or - Select an existing Network Statistics Monitor, then click Edit. The monitor properties dialog appears.
3 Enter or select the appropriate information in the following fields.
Name. Enter a name for the monitor. This name is displayed in the Active Monitor Library.
Description. Enter a short description for the monitor. This description is displayed next to the monitor name in the Active Monitor Library.
Thresholds to monitor. Select the IP, TCP, and/or UDP thresholds you want to monitor.
Tip: To configure individual settings, select a threshold, then click Configure.
Note: You can only configure one threshold at a time.
Object ID. The OID of the most recently selected parameter.
Description. The description of the most recently selected parameter.
4 Click OK to save changes.
Using WhatsUp Gold 14.4
217
Example - Using a Network Statistic Monitor to check for IP data received and discarded
You can use the Network Statistic Monitor to verify that various types of packet and connection statistic information for network protocols, such as IP, TCP, and UDP, are within the thresholds that you define as acceptable. By doing so, you can ensure that devices handle specific types of network data as expected.
For example, you can use the IP received discarded threshold monitor to watch for situations where a router with Quality of Service (QOS) has priorities set for Voice over IP (VoIP). In these situations, other IP datagrams that a router receives are buffered for delayed processing to give processing priority to the VoIP data. If the buffer space is overrun, lower priority IP datagrams are discarded even though the router initially received them. In this example, we will configure and assign a Network Statistic Monitor that monitors thresholds set for IP data that is received by a router but discarded from the buffer. We will also configure and assign an Email Action to notify you if the monitor fails.
To configure a Network Statistics Monitor:
1 Go to the Active Monitor Library.
From the web interface, click GO. The GO menu appears.
If the WhatsUp section is not visible, click WhatsUp. The WhatsUp section of the GO menu appears.
Select Configure > Active Monitor Library. The Active Monitor Library appears.
- or -
From the main menu bar of the console, select Configure > Active Monitor Library. The Active Monitor Library appears.
2 In the Active Monitor Library, click New. The Select Active Monitor Type dialog appears.
3 Enter a Name for the monitor, such as Cisco Router Buffer Overflow Monitor.
4 Enter a Description for the monitor. This description is displayed next to the monitor name in the Active Monitor Library.
5 Under the Thresholds to monitor section of the dialog, select IP received discarded.
6 Click OK to save changes.
After configuring the IP received discarded monitor, you need to assign it to the device(s) that you want to check using the monitor. In the next steps of this example, you will assign the monitor to a single device, then using the Action Builder, configure and assign an Email Action that will notify you when the monitor goes down.
Tip: You can also assign the monitor to multiple devices at one time via Bulk Field Change. For more information, see Assigning a monitor to multiple devices (on page 244).
Using WhatsUp Gold 14.4
218
To assign the IP Received Discarded monitor, and configure and assign an Email Action:
1 Go to the properties for the device to which you want to assign the monitor.
From either the Device View or Map View, right-click the device. The right-click menu appears.
Select Properties. The Device Properties dialog appears.
2 Click Active Monitors. The Device Properties - Active Monitors dialog appears.
3 Click Add. The Active Monitor Properties dialog appears.
4 Select the Cisco Router Buffer Overflow Monitor, then click Next.
5 Set the monitor's polling properties, then click Next.
6 Select Apply individual actions, then click Add. The Action Builder appears.
7 Select Create a new action, then click Next.
8 Select the Email Action, then click Next.
9 Under Execute the action on the following state change, select Down; this option specifies that WhatsUp Gold will issue a state change after the monitor has detected that the router has received IP data, but the buffer has been overrun with too much data. Click Finish. The New Email Action dialog appears.
Note: On the console, ensure that the Mail Destination tab is selected.
10 Enter a Name for the monitor, such as Cisco Router Buffer Overflow Monitor.
11 In SMTP Mail Server, enter the IP address or Host (DNS) name of your email server (SMTP mail host).
12 Enter the Port on which the SMTP Server is installed. The default SMTP port is 25.
13 Optionally, change the Timeout from the default of 5 seconds.
In Mail To, enter the email addresses to which you want send the notification. You can enter two addresses, separated by commas (with no spaces). The address should not contain brackets, spaces, quotation marks, or parentheses.
14 Select SMTP server requires authentication if your SMTP server uses authentication. This enables the Username and Password options.
15 Enter a Username and Password to be used with authentication.
16 Select Use an encrypted connection (SSL/TLS) if your SMTP server requires data encryption over a TLS connection.
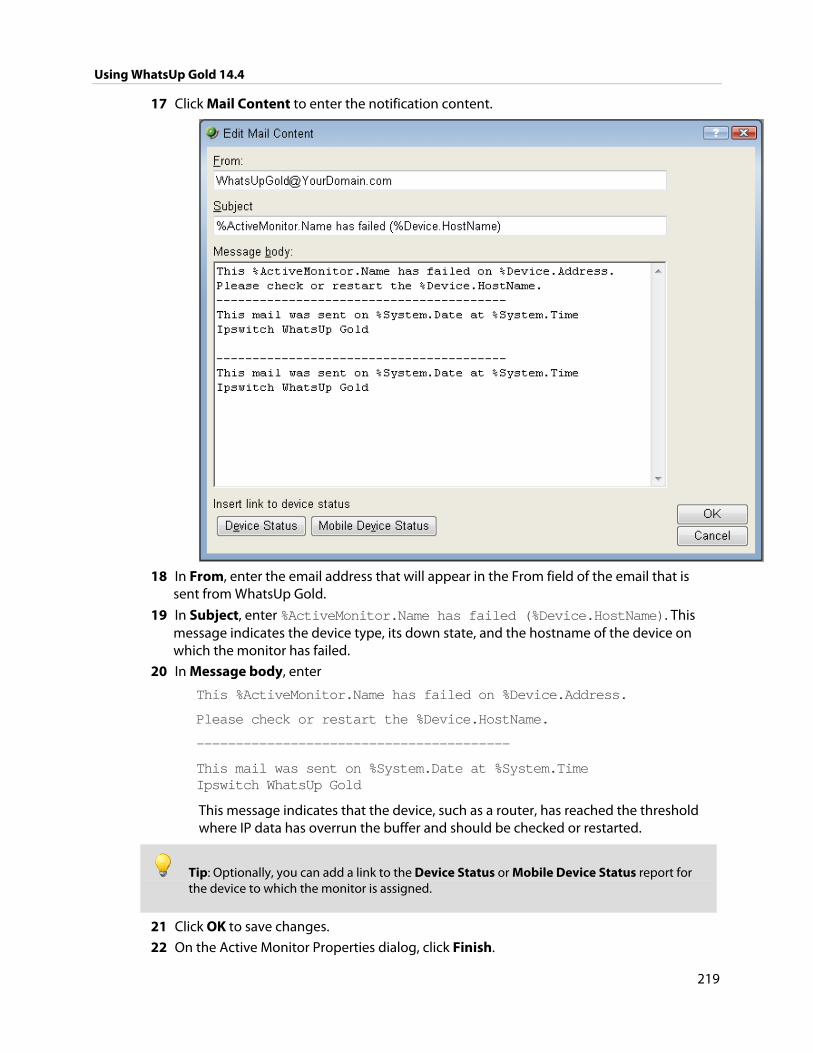
Using WhatsUp Gold 14.4
219
17 Click Mail Content to enter the notification content.
18 In From, enter the email address that will appear in the From field of the email that is
sent from WhatsUp Gold.
19 In Subject, enter %ActiveMonitor.Name has failed (%Device.HostName). This message indicates the device type, its down state, and the hostname of the device on which the monitor has failed.
20 In Message body, enter
This %ActiveMonitor.Name has failed on %Device.Address.
Please check or restart the %Device.HostName.
----------------------------------------
This mail was sent on %System.Date at %System.Time Ipswitch WhatsUp Gold
This message indicates that the device, such as a router, has reached the threshold where IP data has overrun the buffer and should be checked or restarted.
Tip: Optionally, you can add a link to the Device Status or Mobile Device Status report for the device to which the monitor is assigned.
21 Click OK to save changes.
22 On the Active Monitor Properties dialog, click Finish.
Using WhatsUp Gold 14.4
220
Using the Power Supply Monitor
The Power Supply Monitor checks Cisco switches/routers, Dell servers, Dell Power Connect switches/routers, and HP ProCurve and switches/routers, HP ProLiant servers, and other device power supplies to see that they are enabled and return a value that signals they are in an up state. The monitor first checks to see if a device is a Cisco, Dell, or HP device, then checks any enabled power supply devices. If a power supply is disabled, the monitor ignores it; if a power supply does not return a value of 1 - Normal (for Cisco switches/routers), 3 - OK (for Dell server devices), 1 - OK (for Dell switches/routers), 4 - Good (for HP ProCurve switches/routers), or 2 - OK (for HP ProLiant servers), the monitor is considered down.
Note: Not all types of device power supplies may be able to be monitored using the Power Supply Monitor. Check the make and model of your device power supply before attempting to monitor.
This monitor is pre-configured and exists in the Active Monitor Library upon installation of WhatsUp Gold. Unlike many pre-configured active monitors, the Power Supply Monitor's default configuration cannot be modified. However, you can modify the monitor name and description, as well as the SNMP timeout and number of retries used while attempting to connect to devices.
Note: This feature is only available in WhatsUp Gold Premium Edition. To update your license, visit the MyIpswitch portal (http://www.myipswitch.com).
To configure the Power Supply Monitor:
1 Go to the Active Monitor Library.
From the web interface, click GO. The GO menu appears.
If the WhatsUp section is not visible, click WhatsUp. The WhatsUp section of the GO menu appears.
Select Configure > Active Monitor Library. The Active Monitor Library appears.
- or -
From the main menu bar of the console, select Configure > Active Monitor Library. The Active Monitor Library appears.
2 In the Active Monitor Library, do one of the following:
Click New, then select Power Supply Monitor.
- or -
Select an existing Power Supply Monitor, then click Edit. The monitor properties page appears.
3 In the Active Monitor Library, select the Power Supply Monitor, then click Edit. The New/Edit Power Supply Monitor dialog appears.
Using WhatsUp Gold 14.4
221
4 Enter the appropriate information in the following fields.
Name. The name of the monitor as it appears in the Active Monitor Library.
Description. The description of the monitor as it appears in the Active Monitor Library.
Tip: Click Advanced to modify the SNMP timeout and number of retries.
5 Click OK to save changes.
Using the Printer Monitor
This monitor uses SNMP to collect data on SNMP-enabled network printers. If a failure criteria is met, any associated actions will fire. For example, you can monitor printer ink levels, for a paper jam, for low input media (paper), for a fuser that is over temperature, and more.
Important: In order for the Printer Active Monitor to work, in addition to being SNMP-enabled, the printer you are attempting to monitor must also support the Standard Printer MIB.
Note: This feature is only available in WhatsUp Gold Premium Edition. To update your license, visit the MyIpswitch portal (http://www.myipswitch.com).
To configure a Printer monitor:
1 Go to the Active Monitor Library.
From the web interface, click GO. The GO menu appears.
If the WhatsUp section is not visible, click WhatsUp. The WhatsUp section of the GO menu appears.
Select Configure > Active Monitor Library. The Active Monitor Library appears.
- or -
From the main menu bar of the console, select Configure > Active Monitor Library. The Active Monitor Library appears.
2 In the Active Monitor Library, do one of the following:
Click New. The Select Active Monitor Type dialog appears.
Select Printer Monitor from the list, then click OK. The Add Printer Monitor dialog appears.
- or - Select an existing Printer Monitor, then click Edit. The monitor properties dialog appears.
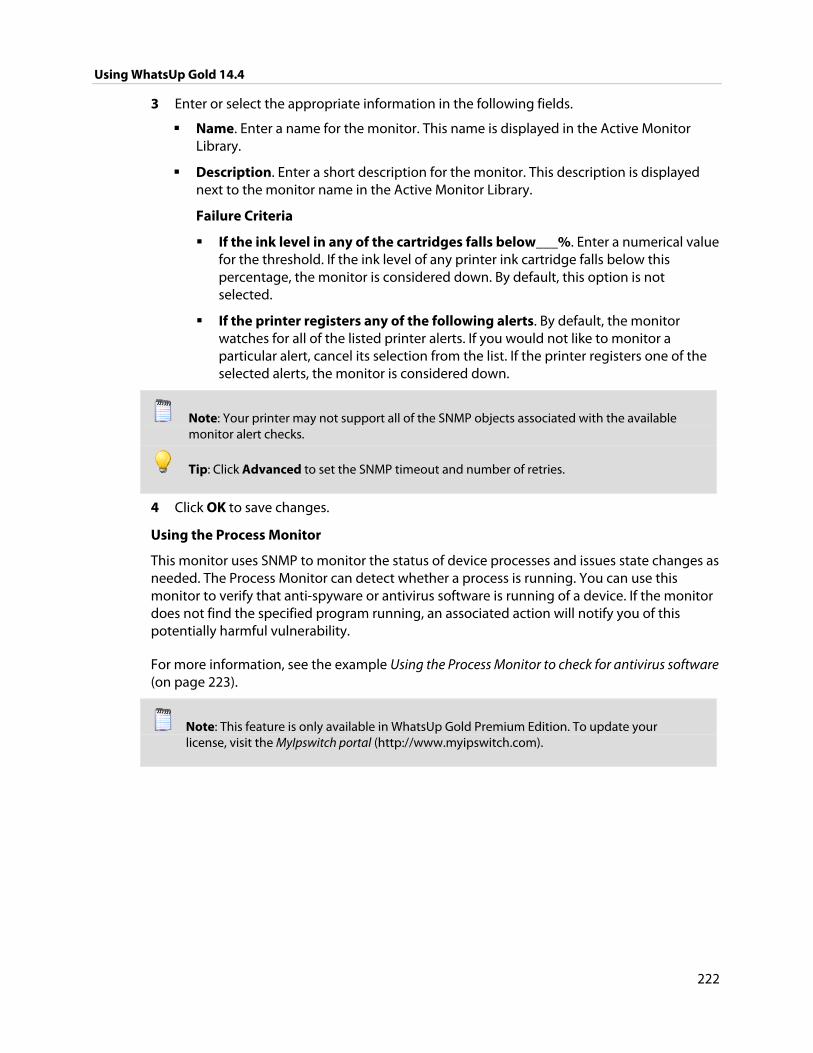
Using WhatsUp Gold 14.4
222
3 Enter or select the appropriate information in the following fields.
Name. Enter a name for the monitor. This name is displayed in the Active Monitor Library.
Description. Enter a short description for the monitor. This description is displayed next to the monitor name in the Active Monitor Library.
Failure Criteria
If the ink level in any of the cartridges falls below___%. Enter a numerical value for the threshold. If the ink level of any printer ink cartridge falls below this percentage, the monitor is considered down. By default, this option is not selected.
If the printer registers any of the following alerts. By default, the monitor watches for all of the listed printer alerts. If you would not like to monitor a particular alert, cancel its selection from the list. If the printer registers one of the selected alerts, the monitor is considered down.
Note: Your printer may not support all of the SNMP objects associated with the available monitor alert checks.
Tip: Click Advanced to set the SNMP timeout and number of retries.
4 Click OK to save changes.
Using the Process Monitor
This monitor uses SNMP to monitor the status of device processes and issues state changes as needed. The Process Monitor can detect whether a process is running. You can use this monitor to verify that anti-spyware or antivirus software is running of a device. If the monitor does not find the specified program running, an associated action will notify you of this potentially harmful vulnerability.
For more information, see the example Using the Process Monitor to check for antivirus software (on page 223).
Note: This feature is only available in WhatsUp Gold Premium Edition. To update your license, visit the MyIpswitch portal (http://www.myipswitch.com).
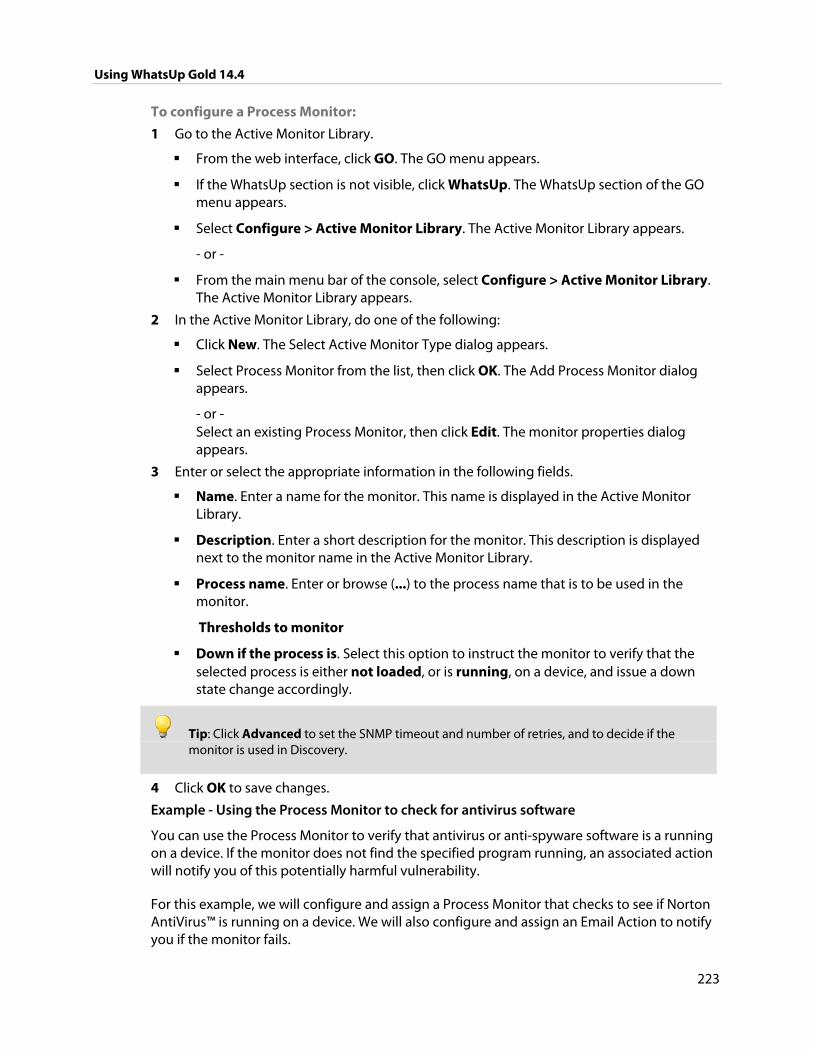
Using WhatsUp Gold 14.4
223
To configure a Process Monitor:
1 Go to the Active Monitor Library.
From the web interface, click GO. The GO menu appears.
If the WhatsUp section is not visible, click WhatsUp. The WhatsUp section of the GO menu appears.
Select Configure > Active Monitor Library. The Active Monitor Library appears.
- or -
From the main menu bar of the console, select Configure > Active Monitor Library. The Active Monitor Library appears.
2 In the Active Monitor Library, do one of the following:
Click New. The Select Active Monitor Type dialog appears.
Select Process Monitor from the list, then click OK. The Add Process Monitor dialog appears.
- or - Select an existing Process Monitor, then click Edit. The monitor properties dialog appears.
3 Enter or select the appropriate information in the following fields.
Name. Enter a name for the monitor. This name is displayed in the Active Monitor Library.
Description. Enter a short description for the monitor. This description is displayed next to the monitor name in the Active Monitor Library.
Process name. Enter or browse (...) to the process name that is to be used in the monitor.
Thresholds to monitor
Down if the process is. Select this option to instruct the monitor to verify that the selected process is either not loaded, or is running, on a device, and issue a down state change accordingly.
Tip: Click Advanced to set the SNMP timeout and number of retries, and to decide if the monitor is used in Discovery.
4 Click OK to save changes.
Example - Using the Process Monitor to check for antivirus software
You can use the Process Monitor to verify that antivirus or anti-spyware software is a running on a device. If the monitor does not find the specified program running, an associated action will notify you of this potentially harmful vulnerability.
For this example, we will configure and assign a Process Monitor that checks to see if Norton AntiVirus™ is running on a device. We will also configure and assign an Email Action to notify you if the monitor fails.
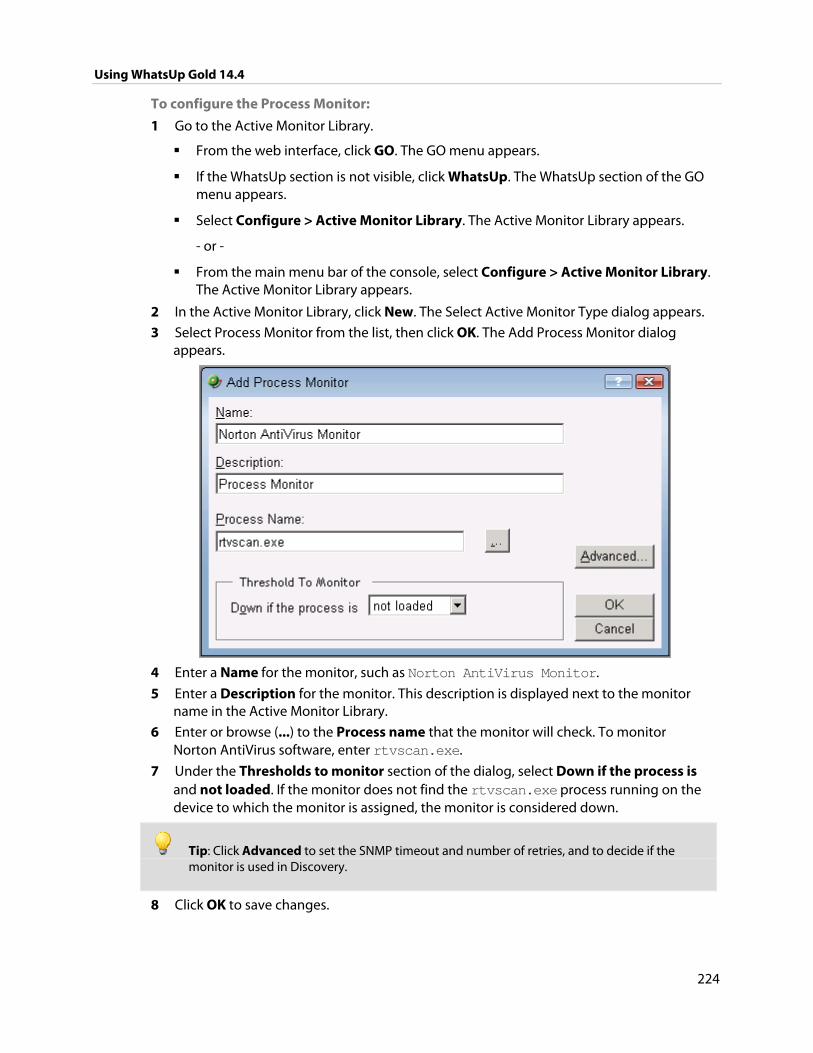
Using WhatsUp Gold 14.4
224
To configure the Process Monitor:
1 Go to the Active Monitor Library.
From the web interface, click GO. The GO menu appears.
If the WhatsUp section is not visible, click WhatsUp. The WhatsUp section of the GO menu appears.
Select Configure > Active Monitor Library. The Active Monitor Library appears.
- or -
From the main menu bar of the console, select Configure > Active Monitor Library. The Active Monitor Library appears.
2 In the Active Monitor Library, click New. The Select Active Monitor Type dialog appears.
3 Select Process Monitor from the list, then click OK. The Add Process Monitor dialog appears.
4 Enter a Name for the monitor, such as Norton AntiVirus Monitor.
5 Enter a Description for the monitor. This description is displayed next to the monitor name in the Active Monitor Library.
6 Enter or browse (...) to the Process name that the monitor will check. To monitor Norton AntiVirus software, enter rtvscan.exe.
7 Under the Thresholds to monitor section of the dialog, select Down if the process is and not loaded. If the monitor does not find the rtvscan.exe process running on the device to which the monitor is assigned, the monitor is considered down.
Tip: Click Advanced to set the SNMP timeout and number of retries, and to decide if the monitor is used in Discovery.
8 Click OK to save changes.
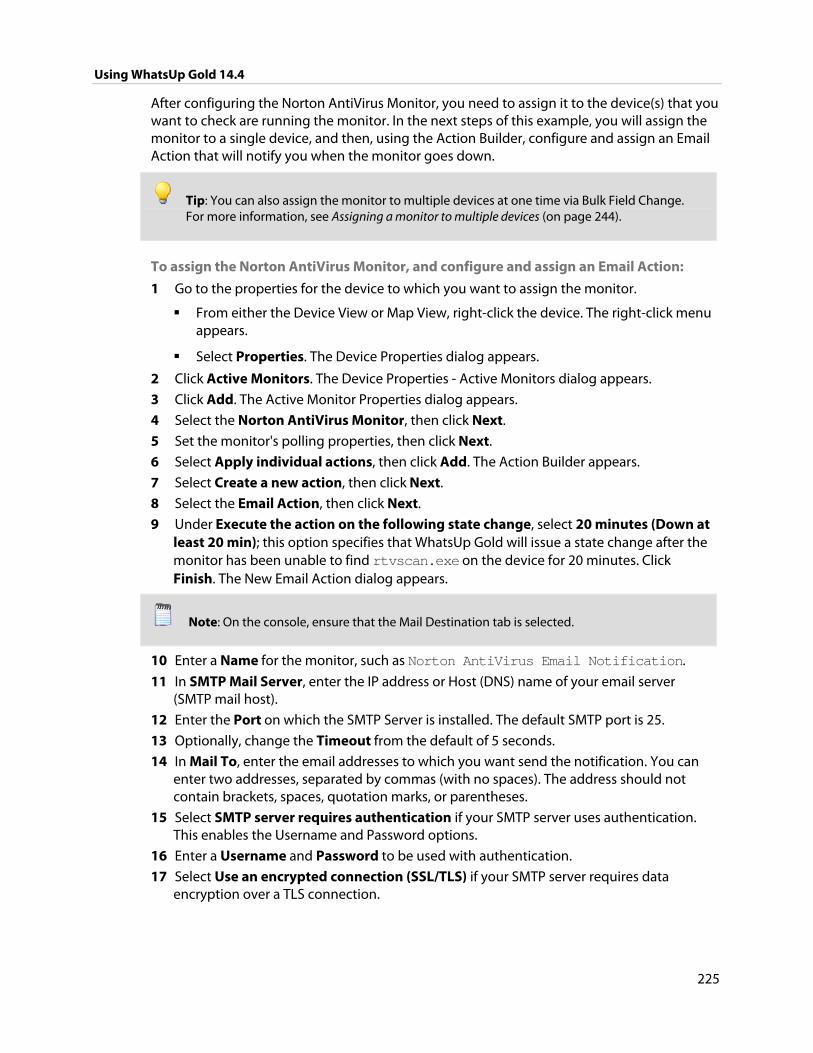
Using WhatsUp Gold 14.4
225
After configuring the Norton AntiVirus Monitor, you need to assign it to the device(s) that you want to check are running the monitor. In the next steps of this example, you will assign the monitor to a single device, and then, using the Action Builder, configure and assign an Email Action that will notify you when the monitor goes down.
Tip: You can also assign the monitor to multiple devices at one time via Bulk Field Change. For more information, see Assigning a monitor to multiple devices (on page 244).
To assign the Norton AntiVirus Monitor, and configure and assign an Email Action:
1 Go to the properties for the device to which you want to assign the monitor.
From either the Device View or Map View, right-click the device. The right-click menu appears.
Select Properties. The Device Properties dialog appears.
2 Click Active Monitors. The Device Properties - Active Monitors dialog appears.
3 Click Add. The Active Monitor Properties dialog appears.
4 Select the Norton AntiVirus Monitor, then click Next.
5 Set the monitor's polling properties, then click Next.
6 Select Apply individual actions, then click Add. The Action Builder appears.
7 Select Create a new action, then click Next.
8 Select the Email Action, then click Next.
9 Under Execute the action on the following state change, select 20 minutes (Down at least 20 min); this option specifies that WhatsUp Gold will issue a state change after the monitor has been unable to find rtvscan.exe on the device for 20 minutes. Click Finish. The New Email Action dialog appears.
Note: On the console, ensure that the Mail Destination tab is selected.
10 Enter a Name for the monitor, such as Norton AntiVirus Email Notification.
11 In SMTP Mail Server, enter the IP address or Host (DNS) name of your email server (SMTP mail host).
12 Enter the Port on which the SMTP Server is installed. The default SMTP port is 25.
13 Optionally, change the Timeout from the default of 5 seconds.
14 In Mail To, enter the email addresses to which you want send the notification. You can enter two addresses, separated by commas (with no spaces). The address should not contain brackets, spaces, quotation marks, or parentheses.
15 Select SMTP server requires authentication if your SMTP server uses authentication. This enables the Username and Password options.
16 Enter a Username and Password to be used with authentication.
17 Select Use an encrypted connection (SSL/TLS) if your SMTP server requires data encryption over a TLS connection.
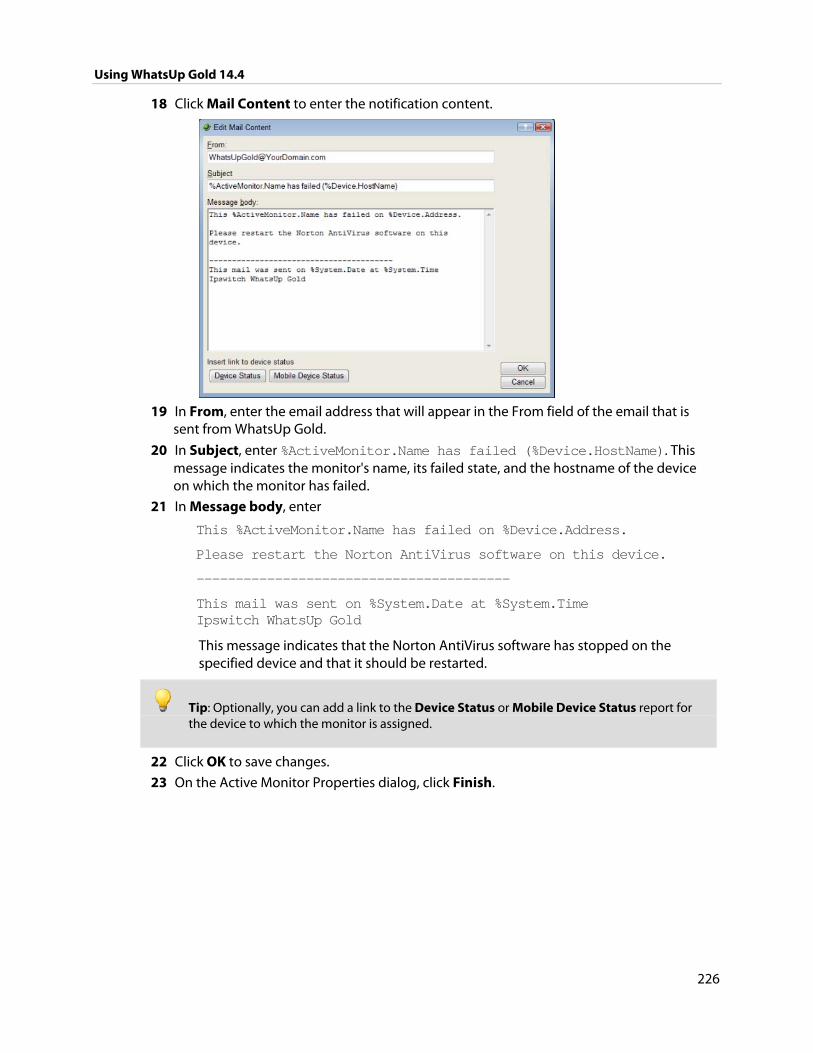
Using WhatsUp Gold 14.4
226
18 Click Mail Content to enter the notification content.
19 In From, enter the email address that will appear in the From field of the email that is
sent from WhatsUp Gold.
20 In Subject, enter %ActiveMonitor.Name has failed (%Device.HostName). This message indicates the monitor's name, its failed state, and the hostname of the device on which the monitor has failed.
21 In Message body, enter
This %ActiveMonitor.Name has failed on %Device.Address.
Please restart the Norton AntiVirus software on this device.
----------------------------------------
This mail was sent on %System.Date at %System.Time Ipswitch WhatsUp Gold
This message indicates that the Norton AntiVirus software has stopped on the specified device and that it should be restarted.
Tip: Optionally, you can add a link to the Device Status or Mobile Device Status report for the device to which the monitor is assigned.
22 Click OK to save changes.
23 On the Active Monitor Properties dialog, click Finish.
Using WhatsUp Gold 14.4
227
Monitoring Microsoft SQL Server
The SQL Server Monitor lets you monitor Microsoft® SQL Server. The SQL Server Monitor provides real-time information about the state and health of Microsoft SQL Server applications on your network.
The SQL Server Monitor supports monitoring of Microsoft SQL Server 2000 or later versions, and MSDE 2000 or later versions, which can be on any machine in your network.
To create custom parameters to monitor, the SQL Server host must be WMI-enabled.
Why use it? WhatsUp Gold can monitor and report the status of the standard services associated with TCP/IP servers, such as SMTP, POP3, and IMAP, FTP, HTTP. If any of these services fail, your users will be unable to get mail, transfer files, or use the web. It is a good idea to set up monitoring on these services so that you are the first to know if they fail. The SQL Server Monitor extends monitoring to parameters reported by Microsoft SQL Server (and Microsoft MSDE), allowing you to get an early warning of a degradation in performance. For example, you can monitor system parameters on your SQL Server database server to see if performance is within an expected range, and if not, you can intervene before the SQL Server fails. In other words, you can detect a looming problem before it causes an application or service failure.
Note: This feature is only available in WhatsUp Gold Premium Edition. To update your license, visit the MyIpswitch portal (http://www.myipswitch.com).
How to get started using SQL Server Monitor 1 Determine which SQL parameters to monitor.
Note: To use some parameters, configure your System Data Source (ODBC) name for the SQL Server. This is done in the Windows Data Sources (ODBC) administrator.
2 Determine which SQL services to monitor.
3 Decide whether to create a single monitor with multiple parameters and services, several monitors with one parameter or service, or some combination. Whether you set up one monitor or many has a bearing on how the information is reported in WhatsUp Gold logs and by actions. For example, if you create a single monitor to check disk usage, you can name it SQLDisk and it will be reported in logs with this name.
4 Configure an SQL Server Monitor with your selected parameters and/or services.
5 Add the SQL Monitor to the device that represents your SQL server.
6 Set up an action to tell you when the monitor goes down or comes back up.
Note: The monitor will be reported down if any of the parameters or services in that monitor are down.
Using WhatsUp Gold 14.4
228
Configuring a SQL Server Monitor
The SQL Server Monitor lets you monitor Microsoft® SQL Server. The SQL Server Monitor provides real-time information about the state and health of Microsoft SQL Server applications on your network.
The SQL Server Monitor supports monitoring of Microsoft SQL Server 2000 or later versions, and MSDE 2000 or later versions, which can be on any machine in your network.
To create custom parameters to monitor, the SQL Server host must be WMI-enabled.
To configure an instance of the SQL Server Monitor:
Important: You must activate WhatsUp Gold Premium Edition before configuring a SQL Server Monitor.
1 Open to the Active Monitor Library:
From the web interface, click GO. The GO menu appears.
If the WhatsUp section is not visible, click WhatsUp. The WhatsUp section of the GO menu appears.
Select Configure > Active Monitor Library.
- or -
From the main menu bar of the console, select Configure > Active Monitor Library. The Active Monitor Library appears.
Tip: The Active Monitor Library is the starting point for creating any Active Monitor in WhatsUp Gold. This dialog shows all of the Active Monitors in your database.
2 Add a SQL monitor:
a) Click New. The Select Active Monitor Type dialog appears.
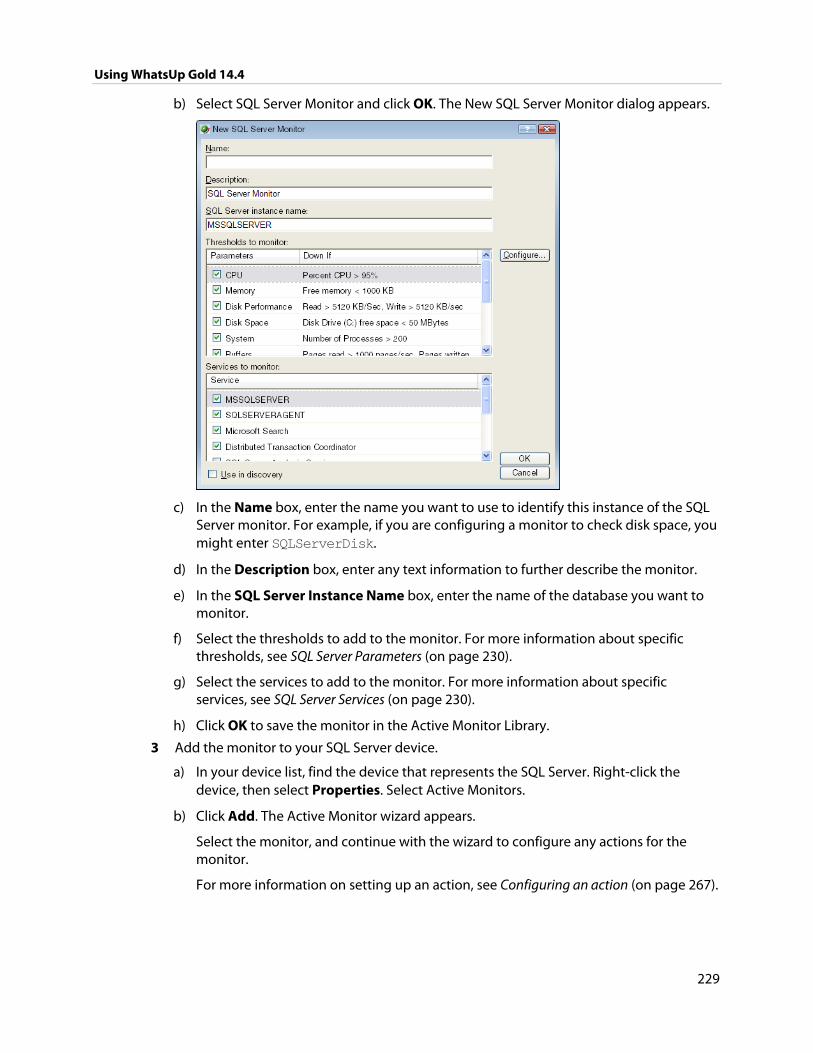
Using WhatsUp Gold 14.4
229
b) Select SQL Server Monitor and click OK. The New SQL Server Monitor dialog appears.
c) In the Name box, enter the name you want to use to identify this instance of the SQL Server monitor. For example, if you are configuring a monitor to check disk space, you might enter SQLServerDisk.
d) In the Description box, enter any text information to further describe the monitor.
e) In the SQL Server Instance Name box, enter the name of the database you want to monitor.
f) Select the thresholds to add to the monitor. For more information about specific thresholds, see SQL Server Parameters (on page 230).
g) Select the services to add to the monitor. For more information about specific services, see SQL Server Services (on page 230).
h) Click OK to save the monitor in the Active Monitor Library.
3 Add the monitor to your SQL Server device.
a) In your device list, find the device that represents the SQL Server. Right-click the device, then select Properties. Select Active Monitors.
b) Click Add. The Active Monitor wizard appears.
Select the monitor, and continue with the wizard to configure any actions for the monitor.
For more information on setting up an action, see Configuring an action (on page 267).
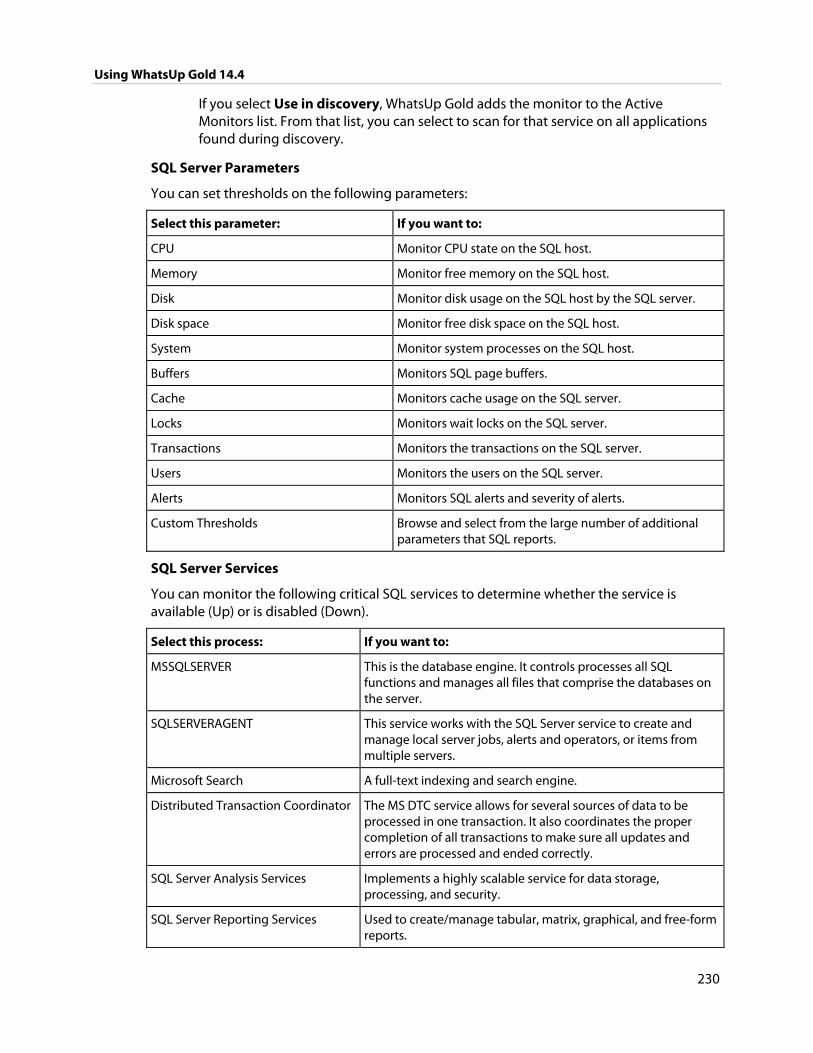
Using WhatsUp Gold 14.4
230
If you select Use in discovery, WhatsUp Gold adds the monitor to the Active Monitors list. From that list, you can select to scan for that service on all applications found during discovery.
SQL Server Parameters
You can set thresholds on the following parameters:
Select this parameter: If you want to:
CPU Monitor CPU state on the SQL host.
Memory Monitor free memory on the SQL host.
Disk Monitor disk usage on the SQL host by the SQL server.
Disk space Monitor free disk space on the SQL host.
System Monitor system processes on the SQL host.
Buffers Monitors SQL page buffers.
Cache Monitors cache usage on the SQL server.
Locks Monitors wait locks on the SQL server.
Transactions Monitors the transactions on the SQL server.
Users Monitors the users on the SQL server.
Alerts Monitors SQL alerts and severity of alerts.
Custom Thresholds Browse and select from the large number of additional parameters that SQL reports.
SQL Server Services
You can monitor the following critical SQL services to determine whether the service is available (Up) or is disabled (Down).
Select this process: If you want to:
MSSQLSERVER This is the database engine. It controls processes all SQL functions and manages all files that comprise the databases on the server.
SQLSERVERAGENT This service works with the SQL Server service to create and manage local server jobs, alerts and operators, or items from multiple servers.
Microsoft Search A full-text indexing and search engine.
Distributed Transaction Coordinator The MS DTC service allows for several sources of data to be processed in one transaction. It also coordinates the proper completion of all transactions to make sure all updates and errors are processed and ended correctly.
SQL Server Analysis Services Implements a highly scalable service for data storage, processing, and security.
SQL Server Reporting Services Used to create/manage tabular, matrix, graphical, and free-form reports.
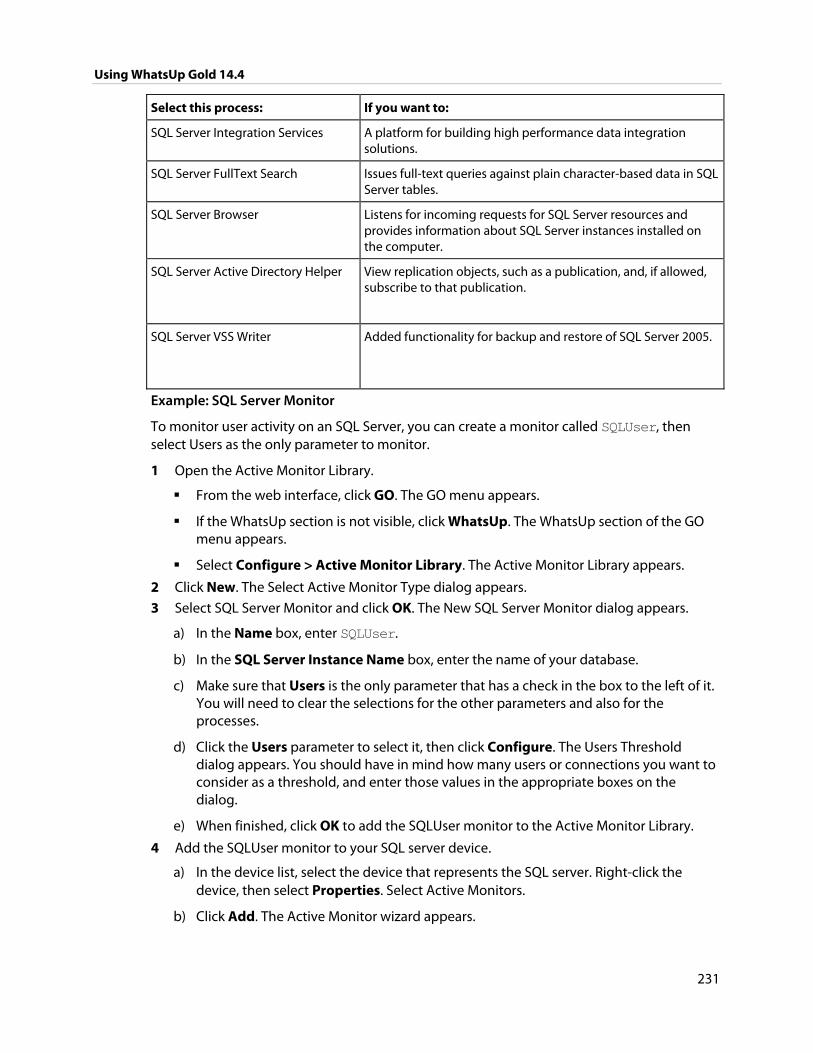
Using WhatsUp Gold 14.4
231
Select this process: If you want to:
SQL Server Integration Services A platform for building high performance data integration solutions.
SQL Server FullText Search Issues full-text queries against plain character-based data in SQL Server tables.
SQL Server Browser Listens for incoming requests for SQL Server resources and provides information about SQL Server instances installed on the computer.
SQL Server Active Directory Helper View replication objects, such as a publication, and, if allowed, subscribe to that publication.
SQL Server VSS Writer Added functionality for backup and restore of SQL Server 2005.
Example: SQL Server Monitor
To monitor user activity on an SQL Server, you can create a monitor called SQLUser, then select Users as the only parameter to monitor.
1 Open the Active Monitor Library.
From the web interface, click GO. The GO menu appears.
If the WhatsUp section is not visible, click WhatsUp. The WhatsUp section of the GO menu appears.
Select Configure > Active Monitor Library. The Active Monitor Library appears.
2 Click New. The Select Active Monitor Type dialog appears.
3 Select SQL Server Monitor and click OK. The New SQL Server Monitor dialog appears.
a) In the Name box, enter SQLUser.
b) In the SQL Server Instance Name box, enter the name of your database.
c) Make sure that Users is the only parameter that has a check in the box to the left of it. You will need to clear the selections for the other parameters and also for the processes.
d) Click the Users parameter to select it, then click Configure. The Users Threshold dialog appears. You should have in mind how many users or connections you want to consider as a threshold, and enter those values in the appropriate boxes on the dialog.
e) When finished, click OK to add the SQLUser monitor to the Active Monitor Library.
4 Add the SQLUser monitor to your SQL server device.
a) In the device list, select the device that represents the SQL server. Right-click the device, then select Properties. Select Active Monitors.
b) Click Add. The Active Monitor wizard appears.
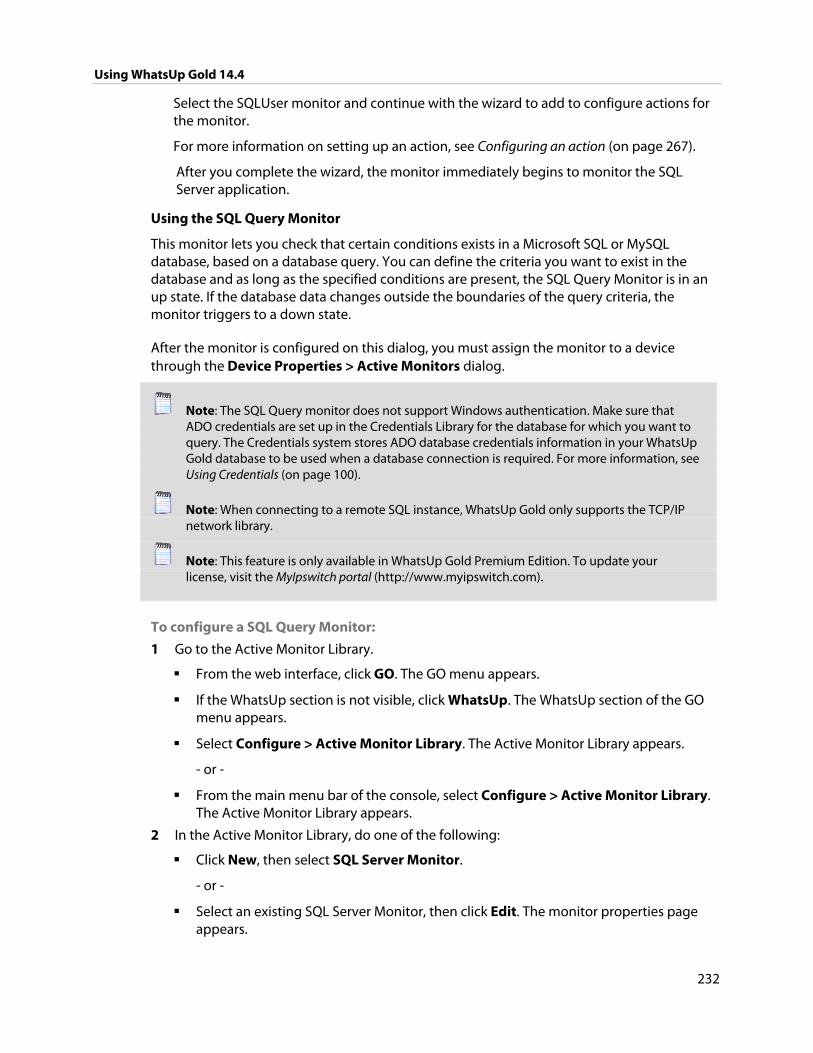
Using WhatsUp Gold 14.4
232
Select the SQLUser monitor and continue with the wizard to add to configure actions for the monitor.
For more information on setting up an action, see Configuring an action (on page 267).
After you complete the wizard, the monitor immediately begins to monitor the SQL Server application.
Using the SQL Query Monitor
This monitor lets you check that certain conditions exists in a Microsoft SQL or MySQL database, based on a database query. You can define the criteria you want to exist in the database and as long as the specified conditions are present, the SQL Query Monitor is in an up state. If the database data changes outside the boundaries of the query criteria, the monitor triggers to a down state.
After the monitor is configured on this dialog, you must assign the monitor to a device through the Device Properties > Active Monitors dialog.
Note: The SQL Query monitor does not support Windows authentication. Make sure that ADO credentials are set up in the Credentials Library for the database for which you want to query. The Credentials system stores ADO database credentials information in your WhatsUp Gold database to be used when a database connection is required. For more information, see Using Credentials (on page 100).
Note: When connecting to a remote SQL instance, WhatsUp Gold only supports the TCP/IP network library.
Note: This feature is only available in WhatsUp Gold Premium Edition. To update your license, visit the MyIpswitch portal (http://www.myipswitch.com).
To configure a SQL Query Monitor:
1 Go to the Active Monitor Library.
From the web interface, click GO. The GO menu appears.
If the WhatsUp section is not visible, click WhatsUp. The WhatsUp section of the GO menu appears.
Select Configure > Active Monitor Library. The Active Monitor Library appears.
- or -
From the main menu bar of the console, select Configure > Active Monitor Library. The Active Monitor Library appears.
2 In the Active Monitor Library, do one of the following:
Click New, then select SQL Server Monitor.
- or -
Select an existing SQL Server Monitor, then click Edit. The monitor properties page appears.

Using WhatsUp Gold 14.4
233
3 Enter or select the appropriate information in the following fields.
Name. Enter a title for the SQL Monitor as it will appear in the Active Monitor Library.
Description. Enter a short description for the monitor as it will appear in the Active Monitor Library.
Server Properties
Server Type. Select the database server type.
Note: MySQL database is supported and will be listed as a Server Type option if the MySQL 5.2 or later .NET connector is installed. You can download the connector on the MySQL Connectors Download site (http://www.whatsupgold.com/mysqlconnector).
Server Address. Enter the server address, in the ServerName\Instance format.
Note: The ServerName\Instance format is only required for SQL Server. MySQL only requires the ServerName.
Port (optional). Enter the database server port number if other than the standard database port number.
SQL Query to Run. Enter a query you want to run against a database to monitor and check for certain database conditions. Only SELECT queries are allowed.
Important: Make sure that you include the full database name in your query. For query help, click Build. The SQL Query Builder will assist you in developing proper query syntax.
Build. Click to open the SQL Query Builder dialog for assistance building queries.
Verify. Click to check that the query is valid. If there is a syntax error with the SQL query, a message will appear with tips about the syntax issue.
Monitor is up if
Important: All database rows must match the criteria settings in the Monitor is up if section for the monitor to be considered up. If multiple threshold criteria is used in the Content of each retrieved row matches the following criteria, all thresholds must match the criteria in each row.
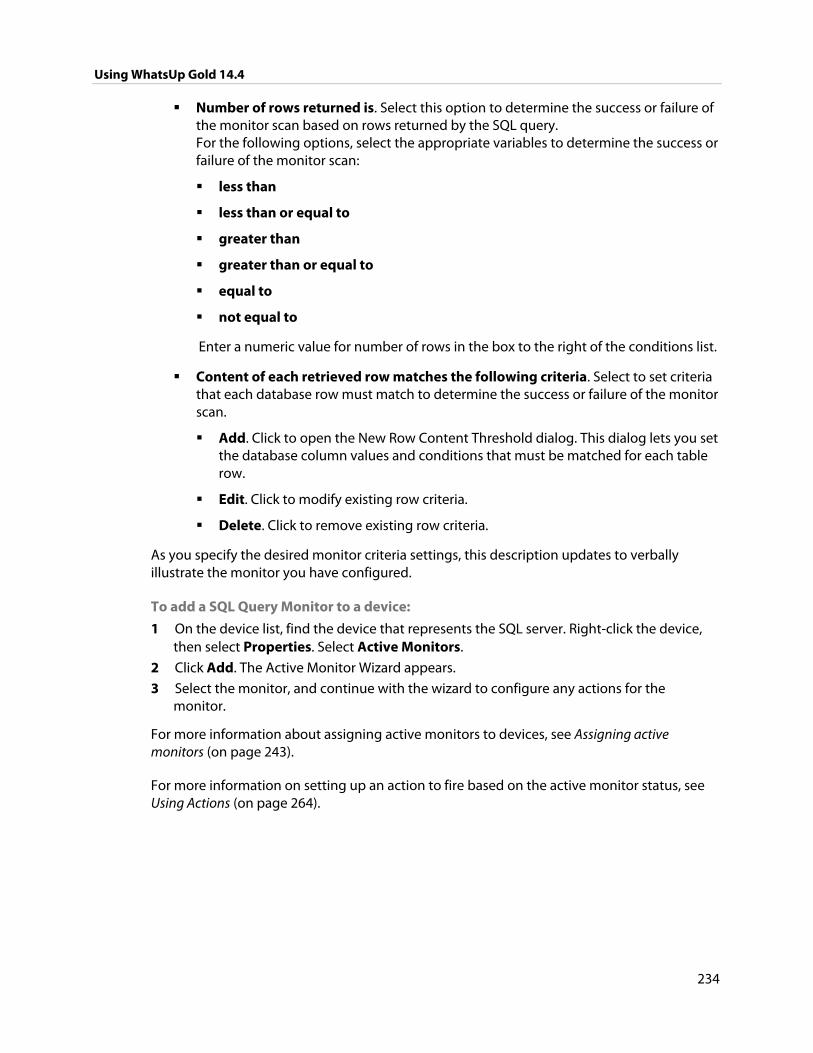
Using WhatsUp Gold 14.4
234
Number of rows returned is. Select this option to determine the success or failure of the monitor scan based on rows returned by the SQL query. For the following options, select the appropriate variables to determine the success or failure of the monitor scan:
less than
less than or equal to
greater than
greater than or equal to
equal to
not equal to
Enter a numeric value for number of rows in the box to the right of the conditions list.
Content of each retrieved row matches the following criteria. Select to set criteria that each database row must match to determine the success or failure of the monitor scan.
Add. Click to open the New Row Content Threshold dialog. This dialog lets you set the database column values and conditions that must be matched for each table row.
Edit. Click to modify existing row criteria.
Delete. Click to remove existing row criteria.
As you specify the desired monitor criteria settings, this description updates to verbally illustrate the monitor you have configured.
To add a SQL Query Monitor to a device:
1 On the device list, find the device that represents the SQL server. Right-click the device, then select Properties. Select Active Monitors.
2 Click Add. The Active Monitor Wizard appears.
3 Select the monitor, and continue with the wizard to configure any actions for the monitor.
For more information about assigning active monitors to devices, see Assigning active monitors (on page 243).
For more information on setting up an action to fire based on the active monitor status, see Using Actions (on page 264).
Using WhatsUp Gold 14.4
235
Monitoring WMI-enabled applications The WMI Monitor lets you monitor any WMI-enabled application. The WMI Monitor lets you create custom monitors to get real-time information about the state and health of applications and servers on your network. Most Windows applications and servers support WMI and provide their own set of real-time WMI data.
To create custom monitors, the host on which the application or server is installed must be WMI-enabled. You can connect to a host and view the WMI parameters reported by the Windows applications and servers on that host.
Why use it?
WhatsUp Gold can monitor and report the status of the standard services associated with TCP/IP servers, such as SMTP, POP3, IMAP, FTP, HTTP. If any of these services fail, network users cannot send mail, transfer files, or use the web. It is a good idea to set up monitoring on these services so that you are the first to know if they fail. The WMI Monitor extends monitoring to parameters reported by Windows-based applications and servers, allowing you to get an early warning of a degradation in performance. For example, you can monitor system parameters on your Oracle® database server to see if performance is within an expected range, and if not, you can intervene before the Oracle server fails. In other words, you can detect a looming problem before it causes an application or service failure.
Note: This feature is only available in WhatsUp Gold Premium Edition. To update your license, visit the MyIpswitch portal (http://www.myipswitch.com).
How to use WMI Monitors
This topic describes the overall process of configuring a WMI monitor, assigning it to a device, and getting feedback from the monitor.
1 Determine which WMI object you want to monitor.
2 Decide whether to create a single monitor with multiple WMI objects, sevmonitors with one object, or some combination.
To start, it may be simpler to create one monitor for each WMI object that you want to monitor. Whether you set up one monitor or many has a bearing on how the information is reported in WhatsUp Gold logs and by actions. For example, a single monitor to check errors on logon, named LogonErrors, is reported in logs with this name. If LogonErrors is reported down, you know it's a specific problem.
3 Configure a WMI Monitor with your objects.
4 Add the WMI Monitor to the device that represents your application host or server.
5 Set up an action to tell you when the monitor goes down or comes back up.
Note: The monitor will be reported down if any of the objects that you selected to monitor are down.
Using WhatsUp Gold 14.4
236
Configuring a WMI Monitor
To configure an instance of the WMI Monitor:
1 Open the Active Monitor Library.
From the web interface, click GO. The GO menu appears.
If the WhatsUp section is not visible, click WhatsUp. The WhatsUp section of the GO menu appears.
Select Active Monitor Library.
The Active Monitor Library is the starting point for creating any Active Monitor in WhatsUp Gold. This dialog shows all of the Active Monitors in your database.
2 Add a WMI Monitor:
a) Click New. The Select Active Monitor Type dialog appears.
b) Select WMI Monitor and click OK. The New WMI Monitor dialog appears.
3 Enter or select the appropriate information in the following fields.
Name. The name of the monitor as it appears in the Active Monitor Library.
Description. The description of the monitor as it appears in the Active Monitor Library.
Performance counter/Instance. Click the browse button next to this box to select a performance counter and instance for the monitor.
Check type. Select the type of check you want the WhatsUp Gold WMI monitor to make on the performance counter selected above.
Constant Value. Monitors the performance counter/instance for a specific value. If that value changes, the monitor triggers a device state change.
Range of Values. Monitors the performance counter/instance to make sure the returned value falls within a range of values. If the value falls outside of the range, the monitor triggers a device state change.
Rate of Change. Monitors the performance counter/instance to make sure the change in value matches the rate you enter in the check values section. If that rate changes, the monitor triggers a device state change.
Check values. Enter the values for the check type selected above. For Constant Value and Rate of Change, select the state of the device when the check value is met.
Note: You can also click Advanced to access Advanced Monitor Properties.
Using WhatsUp Gold 14.4
237
Example: WMI Monitor
Imagine that a device on your network has been illegally logged into through a brute force attack (an attack where an intruder runs a script to try random usernames and passwords on a range of IP addresses on your network). These types of attacks are extremely dangerous if the device in peril is on your domain or is storing sensitive information.
You can use a custom WMI Active Monitor to check the appropriate performance counters on a Windows device and notify you when this type of attack occurs, so you can do something about it before a potential intruder gains access to your network.
To configure this type of active monitor:
1 Using the WhatsUp Gold web interface, create the WMI monitor.
a) Open the Active Monitor Library.
From the web interface, click GO. The GO menu appears.
If the WhatsUp section is not visible, click WhatsUp. The WhatsUp section of the GO menu appears.
a) Select Configure > Active Monitor Library. The Active Monitor Library appears.
b) Click New. The Select Active Monitor Type dialog appears.
c) Select WMI Monitor and click OK. The Add WMI Monitor dialog appears.
d) In the Name box, enter "ErrorsLogon" to identify that this monitor checks for logon errors.
e) Click the Browse (…) button next to Instance to access the Performance Counters dialog.
f) Enter the computer name or IP address of the computer in which you want to connect.
g) Select a credential from a list of Windows credentials (pulled from the Credentials Library), then click OK to connect to the computer.
h) In the Performance object box, select Server.
i) In the Server folder, select the ErrorsLogon performance counter.
Take note of the Current value entry at the bottom of the dialog. This is the number of logon errors currently reported through WMI.
Click OK to add the Performance counter to the New WMI Monitor dialog.
j) In the Check type box, select Rate of Change.
k) In the Rate of Change box, enter the number of logon errors you feel is acceptable. This is the number of failed logon attempts between polls.
l) In the If the value is above the rate, then the monitor is box, select Down.
m) Click OK to add the active monitor to the library.
Using WhatsUp Gold 14.4
238
2 Enter the credentials for logging on to the device to which you will add this monitor.
a) In the Device Properties for the device, select the Credentials section.
b) In the Credentials Section, click the browse (…) button next to Windows credentials to access the Credentials Library.
c) Create a Windows credential using the administration login and password for the device you want to create the passive monitor for. When you have configured the credential, click Close.
d) On the Credentials page, select the new Windows credential, then click OK.
3 Add the ErrorsLogon monitor to the problem device.
a) In your device list, find the device. Double-click the device to display its properties, then select Active Monitors.
b) Click Add. The Active Monitor wizard appears.
Select the ErrorsLogon monitor, and continue with the wizard to configure any actions for the monitor.
c) For more information on setting up an action, see Configuring an Action (on page 267).
You may want to consider creating several levels of the active monitor, each with a higher threshold than the other, and with more severe actions associated with it.
For example, create a monitor with 30 as the threshold that simply sends you an email, letting you know that at least 31 attempts have been made. Next, create another monitor that uses 60 as the threshold. This monitor may have an SMS action associated with it that sends a text message to you when at least 61 attempts are made. For the most severe level you could create a 100 threshold and have the action send messages to several people who may be able to block the IP or take the device off the network while the attack is addressed.
Monitoring Mail Servers
The Email Monitor lets you monitor that a mail server is available and functioning correctly. This monitor checks a mail server by first sending the server an email via SMTP. The monitor then attempts to delete previously sent emails using either POP3 or IMAP. If no emails from the monitor are present in the inbox to delete, the mail server is considered down.
The email active monitor supports encryption with SSL/TLS and SMTP Authentication which ensures that the monitor sends emails to a secure email account.
The Email Monitor's email delivery check is done across two polls. Therefore, it is important that you pick a meaningful polling interval. For example, if you want to be notified when your mail server is taking more than two minutes to send and receive email, use a two-minute polling interval.
Note: WhatsUp Gold can monitor any POP3 server that supports these commands: USER, PASS, LIST, TOP, QUIT, RETR, and DELE. WhatsUp Gold can monitor any IMAP server that supports these commands: LOGIN, SELECT, SEARCH, STORE, CLOSE, and LOGOUT.
Using WhatsUp Gold 14.4
239
Configuring an Email Active Monitor
To configure an Email monitor:
1 Go to the Active Monitor Library:
From the web interface, click GO. The GO menu appears.
If the WhatsUp section is not visible, click WhatsUp. The WhatsUp section of the GO menu appears.
Select Configure > Active Monitor Library. The Active Monitor Library appears.
- or -
From the main menu of the console, select Configure > Active Monitor Library. The Active Monitor Library appears.
2 Add an Email Monitor:
a) Click New. The Select Active Monitor Type dialog appears.
b) Select Email Monitor from the list, then click OK. The Add Email Monitor dialog appears.
c) In Name, enter a title to identify this instance of the monitor.
d) In Description, enter any additional information to further describe the monitor.
e) In the Outgoing mail section of the dialog, in SMTP server, enter the address of the server on which SMTP is running. Use the default, %Device.Address, to use the device IP address on which the monitor is attached.
f) In Port, enter the port on which the SMTP service is listening. The standard SMTP port is 25.
g) In Mail to, enter the address to which the Email Monitor will send email.
h) In Mail from, enter the address from which the Email Monitor was sent from.
i) In the Incoming mail section of the dialog, in Server, enter the address of the server on which the POP3 or IMAP service is running.
j) In Account type, select the protocol (POP3 or IMAP) you want the monitor to use to check for correct email delivery.
k) In Username, enter the username of the email account in which the monitor will use to log in.
l) In Password, enter the password for the email account in which the monitor will use to log in.
m) Click OK to add the monitor to the Active Monitor Library.
If you want to configure advanced settings for this instance of the Email Monitor, click Advanced. From here, you can choose to use SMTP Authentication; set the port on which POP3 or IMAP is running; use encrypted connections for SMTP, IMAP, and POP3; and set timeouts for SMTP, IMAP, and POP3.
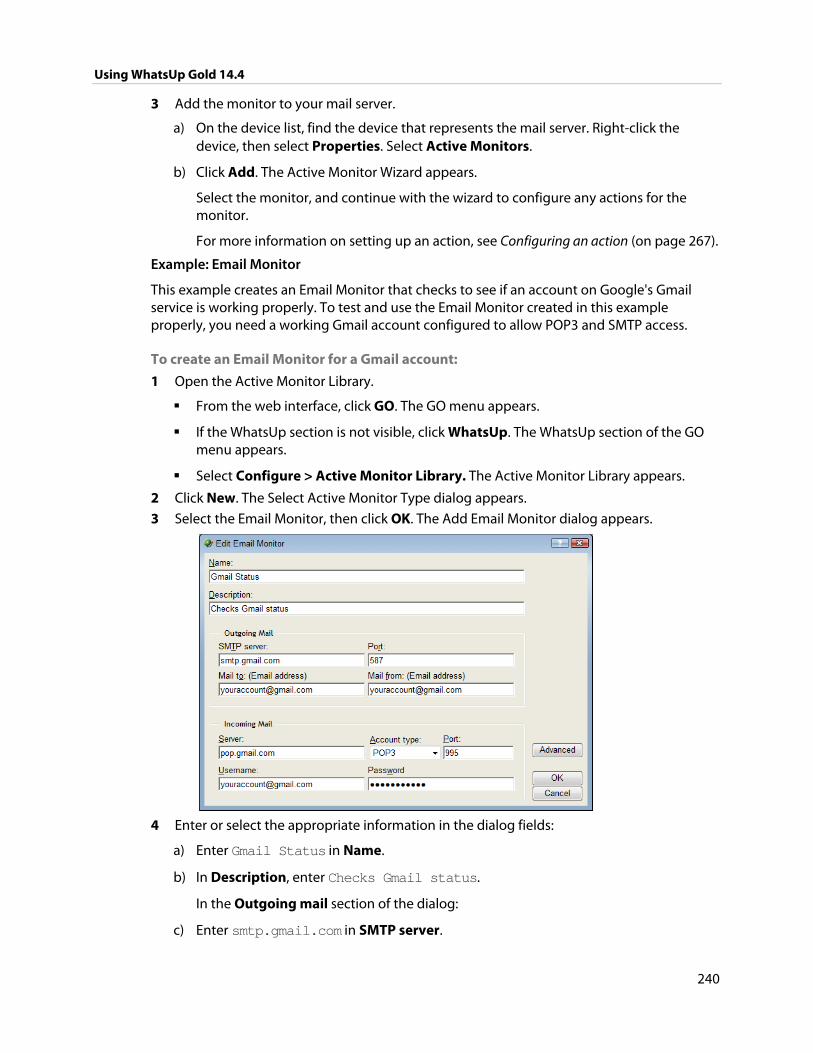
Using WhatsUp Gold 14.4
240
3 Add the monitor to your mail server.
a) On the device list, find the device that represents the mail server. Right-click the device, then select Properties. Select Active Monitors.
b) Click Add. The Active Monitor Wizard appears.
Select the monitor, and continue with the wizard to configure any actions for the monitor.
For more information on setting up an action, see Configuring an action (on page 267).
Example: Email Monitor
This example creates an Email Monitor that checks to see if an account on Google's Gmail service is working properly. To test and use the Email Monitor created in this example properly, you need a working Gmail account configured to allow POP3 and SMTP access.
To create an Email Monitor for a Gmail account:
1 Open the Active Monitor Library.
From the web interface, click GO. The GO menu appears.
If the WhatsUp section is not visible, click WhatsUp. The WhatsUp section of the GO menu appears.
Select Configure > Active Monitor Library. The Active Monitor Library appears.
2 Click New. The Select Active Monitor Type dialog appears.
3 Select the Email Monitor, then click OK. The Add Email Monitor dialog appears.
4 Enter or select the appropriate information in the dialog fields:
a) Enter Gmail Status in Name.
b) In Description, enter Checks Gmail status.
In the Outgoing mail section of the dialog:
c) Enter smtp.gmail.com in SMTP server.
Using WhatsUp Gold 14.4
241
d) Enter 587 for the Port.
e) If you have a Gmail account, enter it in Mail to, in the following format: [email protected]. If you do not have a Gmail account, create one on the Gmail site.
f) Enter the same Gmail account in Mail from.
In the Incoming mail section of the dialog:
g) Enter pop.gmail.com in Mail server.
h) Choose POP3 from the Account type list.
i) Enter 995 for the Port.
j) Again, enter your Gmail account in Username.
k) Enter the password for your Gmail account in Password.
5 Click Advanced. The Advance Monitor Properties dialog appears.
6 Enter or select the appropriate information in the dialog fields:
In the Outgoing server advanced properties section of the dialog:
a) Select SMTP server requires authentication.
b) Enter your Gmail account in Username.
c) Enter the password for your Gmail account in Password.
d) Select Use an encrypted connection (SSL/TLS).
e) Use the default Timeout of 5 seconds.
In the Incoming server advanced properties section of the dialog:
f) Select Use an encrypted connection (SSL/TLS).
g) Ensure that Use STARTTLS command is not selected.
h) Use the default Timeout of 5 seconds.
i) Click OK to save changes and return to the Add Email Monitor dialog.
j) Click OK on the Add Email Monitor dialog to add the Gmail Monitor to the Active Monitor Library.
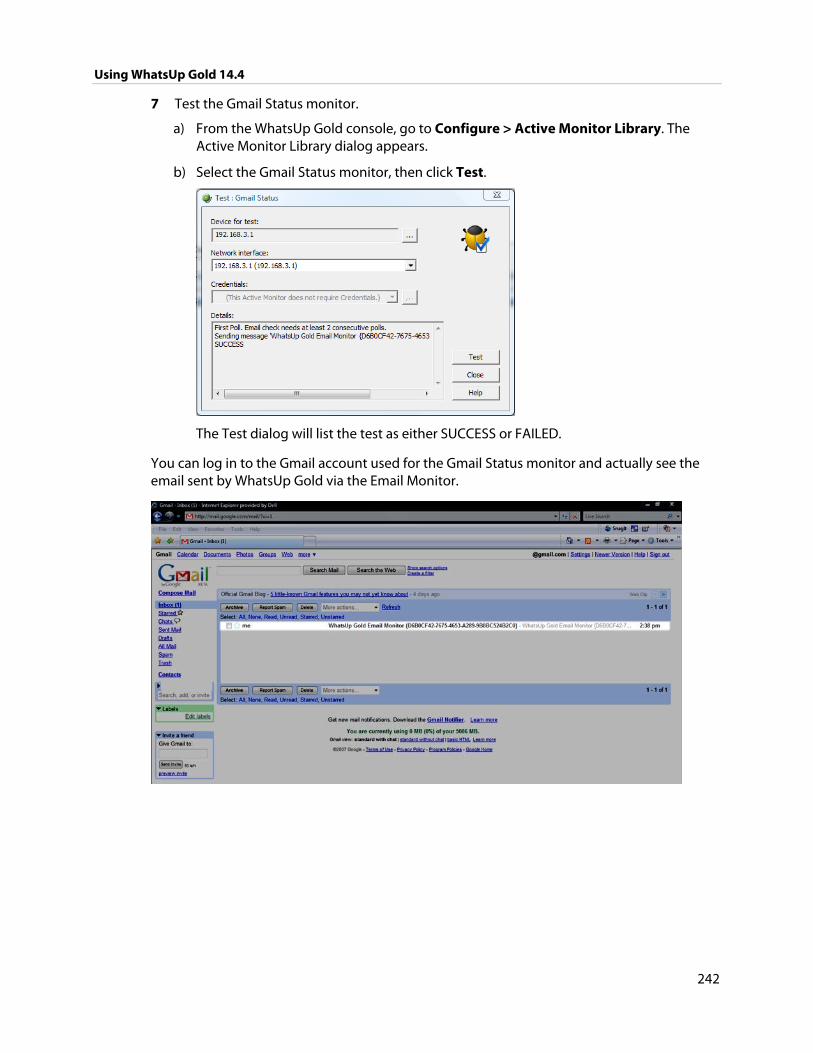
Using WhatsUp Gold 14.4
242
7 Test the Gmail Status monitor.
a) From the WhatsUp Gold console, go to Configure > Active Monitor Library. The Active Monitor Library dialog appears.
b) Select the Gmail Status monitor, then click Test.
The Test dialog will list the test as either SUCCESS or FAILED.
You can log in to the Gmail account used for the Gmail Status monitor and actually see the email sent by WhatsUp Gold via the Email Monitor.
Using WhatsUp Gold 14.4
243
About the VoIP Active Monitor
The VoIP Active Monitor lets you set the acceptable Mean Option Score (MOS) threshold for an IP SLA device. If the threshold is exceeded, an alert can be sent specifically to notify the appropriate network manager about the issue. For more information, see Using the WhatsUp Gold VoIP Monitor on the WhatsUp Gold web site (http://www.whatsupgold.com/support/guides.aspx?k_id=whatsupgold_com_wug_documents_worldwide_whatsupgoldsupportcenter).
Note: The WhatsUp Gold VoIP Monitor must be activated to use the VoIP Active Monitor.
Using the Active Script Active Monitor The Active Script Monitors let you write either VBScript or JScript code to perform specific customized checks on a device. If the script returns an error code, the monitor is considered down. A variety of Active Script resources are available on the Active Scripts resources page. (http://www.whatsupgold.com/cd/resources/active_script)
Note: Please be aware that Ipswitch does not support the custom scripts that you create; only the ability to use them in the Active Script Monitor.
For more information, see Extending WhatsUp Gold with scripting (on page 493).
Assigning active monitors After you configure an active monitor in the Active Monitor Library, you must add it to the individual devices for which you want to monitor services.
You can assign active monitors automatically during Discovery, or manually after Discovery, through a device's Properties. Additionally, the Bulk Field Change feature allows you to manually assign an active monitor to multiple devices at one time.
Note: When you assign an active monitor to a device, an instance of the monitor is added to the device. Changes that you make to the monitor's configuration via the Active Monitor Library affect all instances of the monitor. For example, if you assign a monitor to four separate devices and then make changes to the monitor from the Active Monitor Library, all four instances of the monitor adopt the changes.
Using WhatsUp Gold 14.4
244
Assigning a monitor when adding a device
To assign an active monitor when adding a device:
1 From the WhatsUp Gold web interface, select GO. The GO menu appears.
2 If the WhatsUp section of the GO menu is not visible, click WhatsUp. The WhatsUp section of the GO menu appears.
3 Select Devices > New Device. The Add New Device dialog appears.
4 Click Advanced. The Device Discovery Properties dialog appears.
5 Under Select Active Monitors to be used in the scan process, select the active monitor type(s) that you want to assign to the new device.
6 Click OK.
Assigning a monitor from Device Properties
To assign an active monitor to a device from its properties:
1 Go to the properties for the device to which you want to assign the monitor.
From either the Device View or Map View, right-click the device. The right-click menu appears.
Select Properties. The Device Properties dialog appears.
2 Click Active Monitors. The Device Properties - Active Monitors dialog appears.
3 Click Add. The Active Monitor Properties dialog appears.
4 Select the active monitor type you want to assign to the device, then click Next.
5 Set the monitor's polling properties, then click Next.
6 Setup actions for the monitor's state changes, then click Finish. The active monitor is assigned to the device.
Assigning a monitor to multiple devices
To assign an active monitor to multiple devices through Bulk Field Change:
1 From Device View, select the devices to which you want to assign an active monitor, then right-click one of the select devices. The right-click menu appears.
2 Select Bulk Field Change > Active Monitor. The Bulk Field Change: Active Monitor dialog appears.
3 Select the active monitor type that you want to assign, then click OK. The active monitor is assigned to the selected devices.
Using WhatsUp Gold 14.4
245
Removing and deleting active monitors Because active monitors are assigned to devices on an individual basis, active monitors can only be removed from devices, and must be deleted from the Active Monitor Library. You also have the option to disable a monitor on the device-level, rather than completely removing it from a device. If you want to stop monitoring a particular device, but would like to keep the device-specific historical data associated with the active monitor, you should disable the monitor rather than removing it from the device.
Disabling an active monitor
To disable an active monitor from monitoring a device:
1 Right-click the device from which you want to disable polling for the active monitor. The right-click menu appears.
2 Select Properties. The Device Properties dialog appears.
3 Click Active Monitors. The Device Properties - Active Monitors dialog appears.
4 Select the monitor you want to disable, then click Edit. The Active Monitor Properties dialog appears.
5 Clear Enable polling for this active monitor, then click Next.
6 On the following dialog, click Finish.
When you return to the Device Properties - Active Monitors dialog, you will see that the monitor is disabled for the device.
Removing an active monitor
To remove an active monitor from a device:
1 From Device or Map View, right-click the device from which you want to remove the active monitor, then click Properties. The Device Properties dialog appears.
2 Click Active Monitors. The Device Properties - Active Monitors dialog appears.
3 Select the monitor you want to remove.
4 Click Remove. A warning dialog appears that states all data for that instance of the monitor is deleted when the monitor is removed.
5 Click Yes to remove the monitor.
To remove an active monitor from multiple devices:
1 Select the appropriate devices in Device View or Map View, then right-click on one of the selected items. The right-click menu appears.
2 Select Bulk Field Change > Active Monitor. The Bulk Field Change: Active Monitor dialog appears.
3 Under Operation, select Remove.
4 Under Active Monitor type, select the active monitor that you want to remove.
5 Click OK to remove the monitor from the selected devices.
Using WhatsUp Gold 14.4
246
About critical active monitors Critical active monitors allow you to define a specific polling order for a device's active monitors; you can make one monitor dependent on another monitor on the same device, such as making an HTTP monitor dependent on the Ping monitor, so that you are not flooded with multiple alerts on the same device if network connectivity is lost.
In a critical monitor polling path, critical monitors are polled first. If you specify more than one critical monitor, you also specify the order in which they are polled. Critical monitors are "up" dependent on one another; if critical monitors return successful results, non-critical monitors are polled. If any of the critical monitors go down, all monitors behind it in the critical polling order are no longer polled and are placed in an unknown state for the duration of the polling cycle. If at the start of the next polling cycle, the critical monitor returns successful results, polling of successive critical monitors and non-critical monitors resumes.
Note: Up and Down device dependencies take precedence over critical monitor polling; if WhatsUp Gold detects device dependencies, the configured dependencies are respected.
When critical monitoring is enabled, and you specify a critical polling order, you now receive only one alert when a device loses its network connectivity.
Note: When a monitor is placed in the unknown state, assigned actions are not fired. Likewise, when a monitor comes out of the unknown state into an up state, assigned actions are not fired.
Only monitors that you specify as critical follow a specific polling order; non-critical monitors are not polled in any specific order. Additionally, if multiple non-critical monitors fail, all associated actions fire.
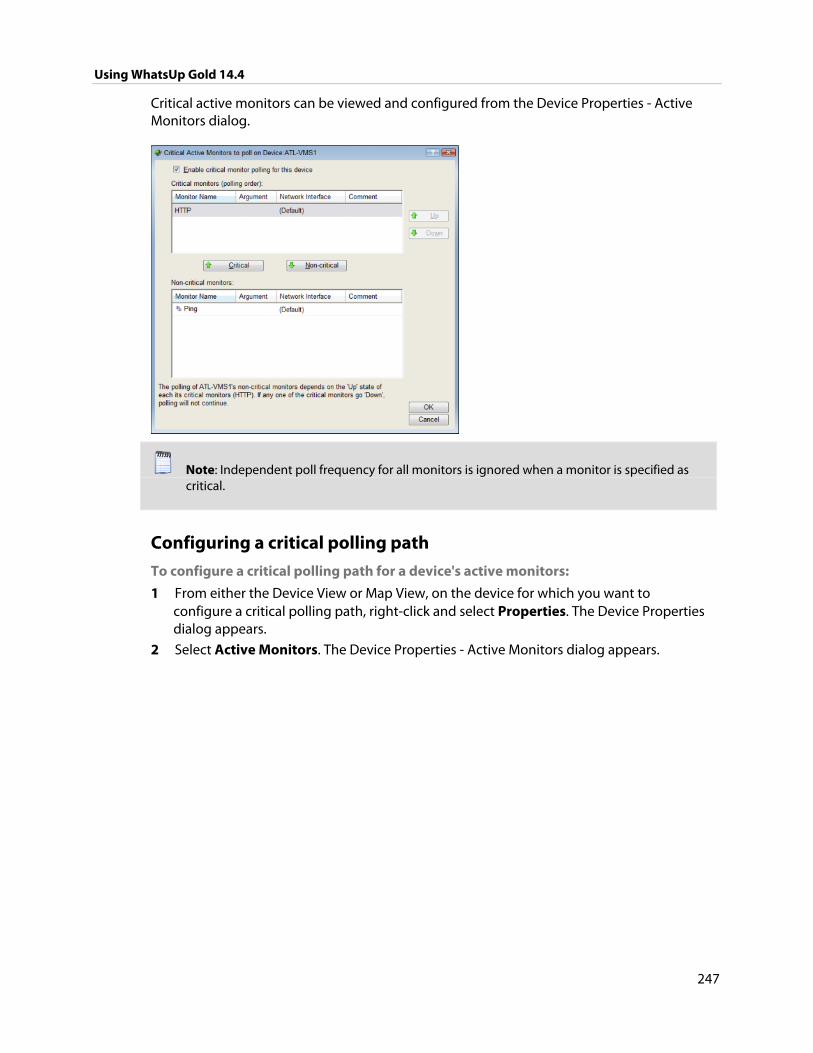
Using WhatsUp Gold 14.4
247
Critical active monitors can be viewed and configured from the Device Properties - Active Monitors dialog.
Note: Independent poll frequency for all monitors is ignored when a monitor is specified as critical.
Configuring a critical polling path
To configure a critical polling path for a device's active monitors:
1 From either the Device View or Map View, on the device for which you want to configure a critical polling path, right-click and select Properties. The Device Properties dialog appears.
2 Select Active Monitors. The Device Properties - Active Monitors dialog appears.
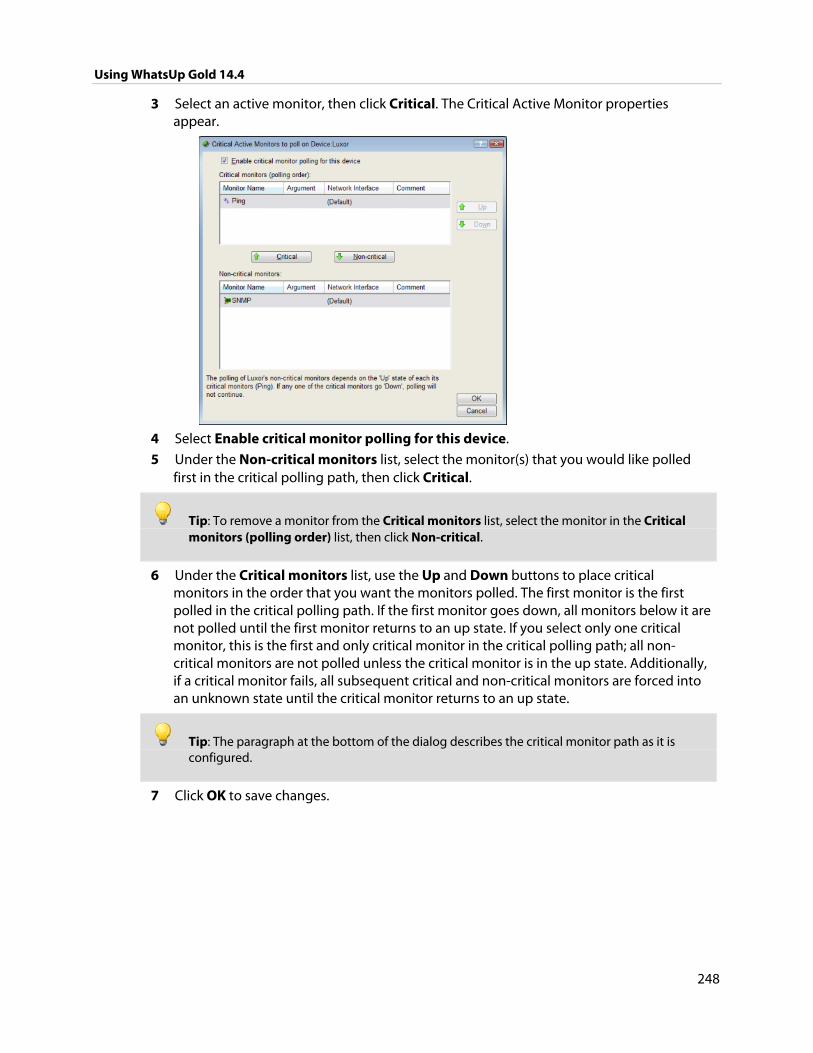
Using WhatsUp Gold 14.4
248
3 Select an active monitor, then click Critical. The Critical Active Monitor properties appear.
4 Select Enable critical monitor polling for this device.
5 Under the Non-critical monitors list, select the monitor(s) that you would like polled first in the critical polling path, then click Critical.
Tip: To remove a monitor from the Critical monitors list, select the monitor in the Critical monitors (polling order) list, then click Non-critical.
6 Under the Critical monitors list, use the Up and Down buttons to place critical monitors in the order that you want the monitors polled. The first monitor is the first polled in the critical polling path. If the first monitor goes down, all monitors below it are not polled until the first monitor returns to an up state. If you select only one critical monitor, this is the first and only critical monitor in the critical polling path; all non-critical monitors are not polled unless the critical monitor is in the up state. Additionally, if a critical monitor fails, all subsequent critical and non-critical monitors are forced into an unknown state until the critical monitor returns to an up state.
Tip: The paragraph at the bottom of the dialog describes the critical monitor path as it is configured.
7 Click OK to save changes.
Using WhatsUp Gold 14.4
249
Group and Device active monitor reports The following reports display information for devices and device groups that have active monitors configured and enabled. Access these reports from the WhatsUp Gold web interface's Reports tab.
State Change Acknowledgement
Active Monitor Availability
Active Monitor Outage
Health
State Change Timeline
State Summary
Device Status
For more information, see Using Full Reports (on page 439).
250
CHAPTER 16
Using Passive Monitors
In This Chapter
Passive monitors overview ............................................................................ 250
About the Passive Monitor Library ............................................................. 251
About Passive Monitor Listeners ................................................................ 253
Configuring passive monitors ...................................................................... 256
Assigning passive monitors .......................................................................... 262
Group and device passive monitor reports ............................................ 263
Passive monitors overview Passive monitors are the WhatsUp Gold feature responsible for listening for device events. As active monitors actively query or poll devices for data, passive monitors passively listen for device events. Because passive monitors do not poll devices on a regular basis, they use less network bandwidth than active monitors.
Passive monitors are useful because they gather information that goes beyond simple Up or Down service and device states by listening for a variety of events. For example, if you want to know when someone with improper credentials tries to access one of your SNMP-enabled devices, you can assign the default Authentication Failure passive monitor. The monitor listens for an authentication failure trap on the SNMP device, and logs these events to the SNMP Trap Log. If you assign an action to the monitor, every time the authentication failure trap is received, you are notified as soon as it happens.
Although passive monitors are useful, you should not rely on them solely to monitor a device or service--passive monitors are meant to be used in conjunction with active monitors. When used together, active and passive monitors make-up a powerful and crucial component of 360-degree network management.
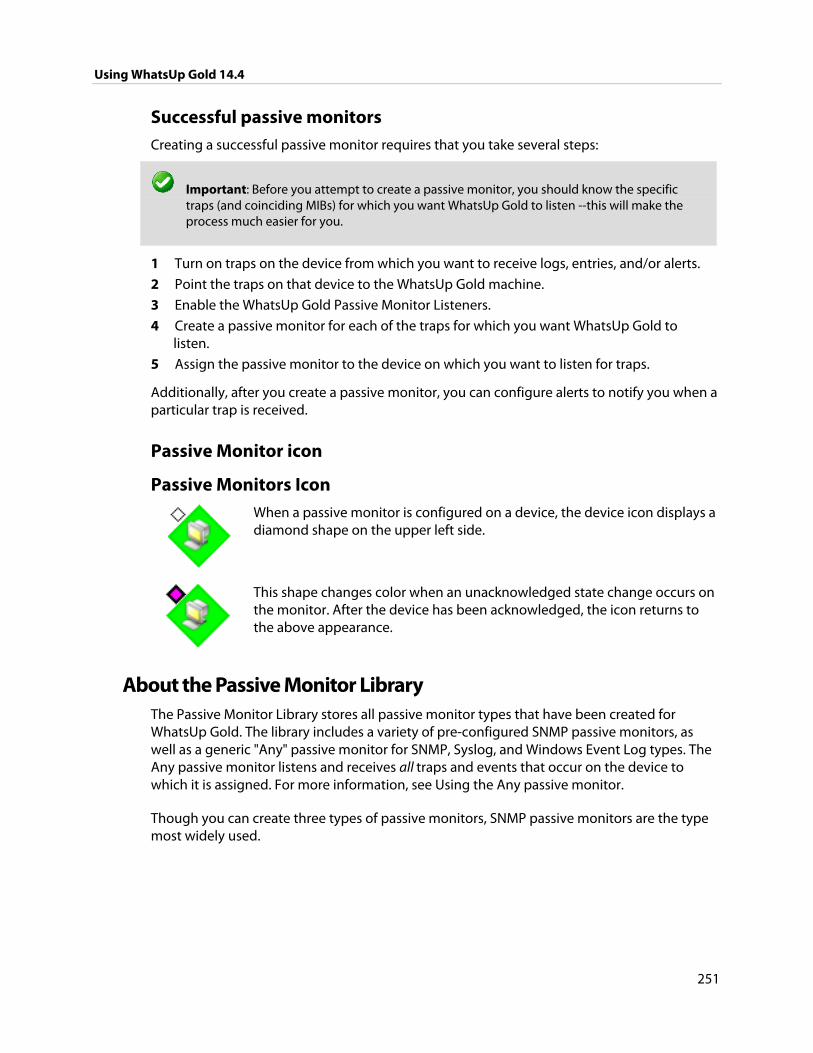
Using WhatsUp Gold 14.4
251
Successful passive monitors Creating a successful passive monitor requires that you take several steps:
Important: Before you attempt to create a passive monitor, you should know the specific traps (and coinciding MIBs) for which you want WhatsUp Gold to listen --this will make the process much easier for you.
1 Turn on traps on the device from which you want to receive logs, entries, and/or alerts.
2 Point the traps on that device to the WhatsUp Gold machine.
3 Enable the WhatsUp Gold Passive Monitor Listeners.
4 Create a passive monitor for each of the traps for which you want WhatsUp Gold to listen.
5 Assign the passive monitor to the device on which you want to listen for traps.
Additionally, after you create a passive monitor, you can configure alerts to notify you when a particular trap is received.
Passive Monitor icon
Passive Monitors Icon
When a passive monitor is configured on a device, the device icon displays a diamond shape on the upper left side.
This shape changes color when an unacknowledged state change occurs on the monitor. After the device has been acknowledged, the icon returns to the above appearance.
About the Passive Monitor Library The Passive Monitor Library stores all passive monitor types that have been created for WhatsUp Gold. The library includes a variety of pre-configured SNMP passive monitors, as well as a generic "Any" passive monitor for SNMP, Syslog, and Windows Event Log types. The Any passive monitor listens and receives all traps and events that occur on the device to which it is assigned. For more information, see Using the Any passive monitor.
Though you can create three types of passive monitors, SNMP passive monitors are the type most widely used.
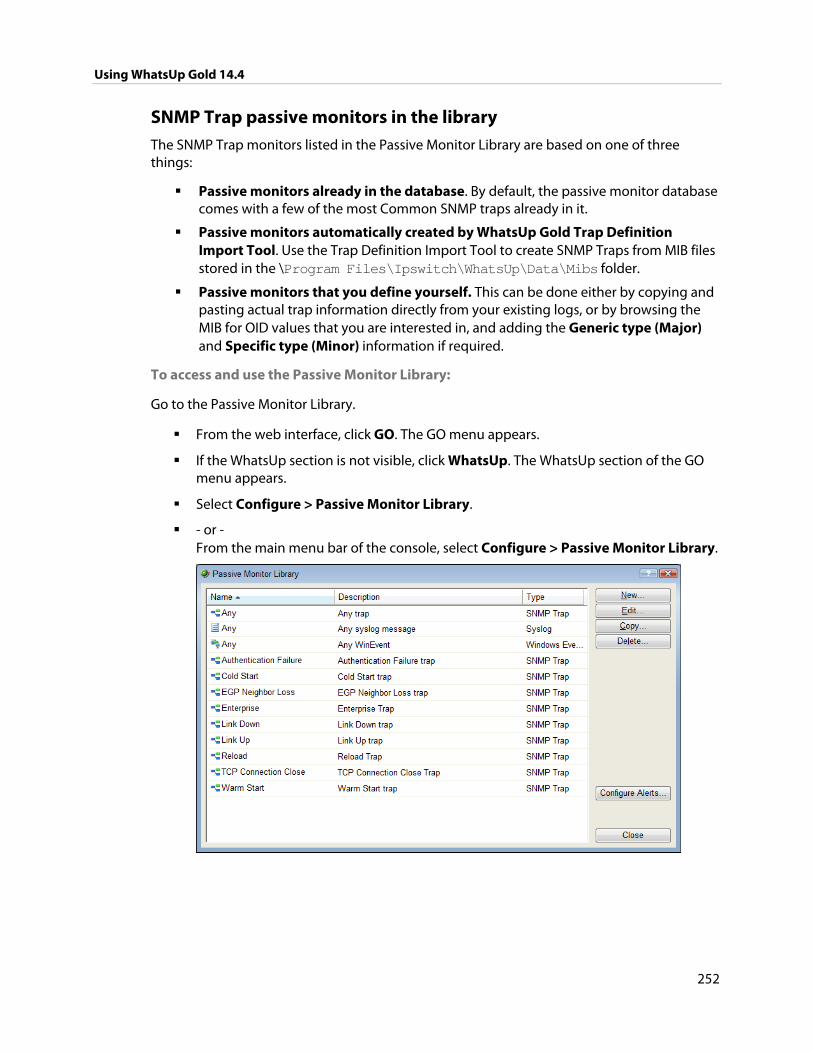
Using WhatsUp Gold 14.4
252
SNMP Trap passive monitors in the library The SNMP Trap monitors listed in the Passive Monitor Library are based on one of three things:
Passive monitors already in the database. By default, the passive monitor database comes with a few of the most Common SNMP traps already in it.
Passive monitors automatically created by WhatsUp Gold Trap Definition Import Tool. Use the Trap Definition Import Tool to create SNMP Traps from MIB files stored in the \Program Files\Ipswitch\WhatsUp\Data\Mibs folder.
Passive monitors that you define yourself. This can be done either by copying and pasting actual trap information directly from your existing logs, or by browsing the MIB for OID values that you are interested in, and adding the Generic type (Major) and Specific type (Minor) information if required.
To access and use the Passive Monitor Library:
Go to the Passive Monitor Library.
From the web interface, click GO. The GO menu appears.
If the WhatsUp section is not visible, click WhatsUp. The WhatsUp section of the GO menu appears.
Select Configure > Passive Monitor Library.
- or - From the main menu bar of the console, select Configure > Passive Monitor Library.
Using WhatsUp Gold 14.4
253
Use the Passive Monitor Library dialog to configure new or existing passive monitor types:
Click New to create a new passive monitor type.
Select a monitor type in the list, then click Edit to change the settings.
Select a monitor type in the list, then click Copy to create a new monitor type based on the selected type.
Select a monitor type, then click Delete to remove it from the list.
Note: From the WhatsUp Gold web interface, you can click Configure Alerts to view the Alert Center Threshold Library.
About Passive Monitor Listeners A Passive Monitor Listener is the component in passive monitors that listens for events to occur. When an event occurs, the listener notifies WhatsUp Gold and associated actions are fired.
WhatsUp Gold in installed with three Passive Monitor Listeners:
SNMP Trap Listener. This listens for SNMP traps, or unsolicited SNMP messages, that are sent from a device to indicate a change in status.
Syslog Trap Listener. This listens for Syslog messages forwarded from devices regarding a specific record and/or text within a record.
Windows Event Log Listener. This listens for any WinEvent; for example a service start or stop, or logon failures.
Important: Before you can configure passive monitors, you must configure the coinciding Passive Monitor Listener(s) on the WhatsUp Gold console via Program Options. For more information, see Setting Program Options for Passive Monitor Listeners.
Configuring the SNMP Trap Listener
To configure the SNMP Trap Listener:
1 From the WhatsUp Gold console main menu, select Configure > Program Options. The Program Options dialog appears.
Note: If the Windows SNMP Trap Service (Control Panel > Services) is running on the WhatsUp Gold console PC, you should stop the service. This is a precaution to prevent any conflict with the WhatsUp Passive Monitor Listener.
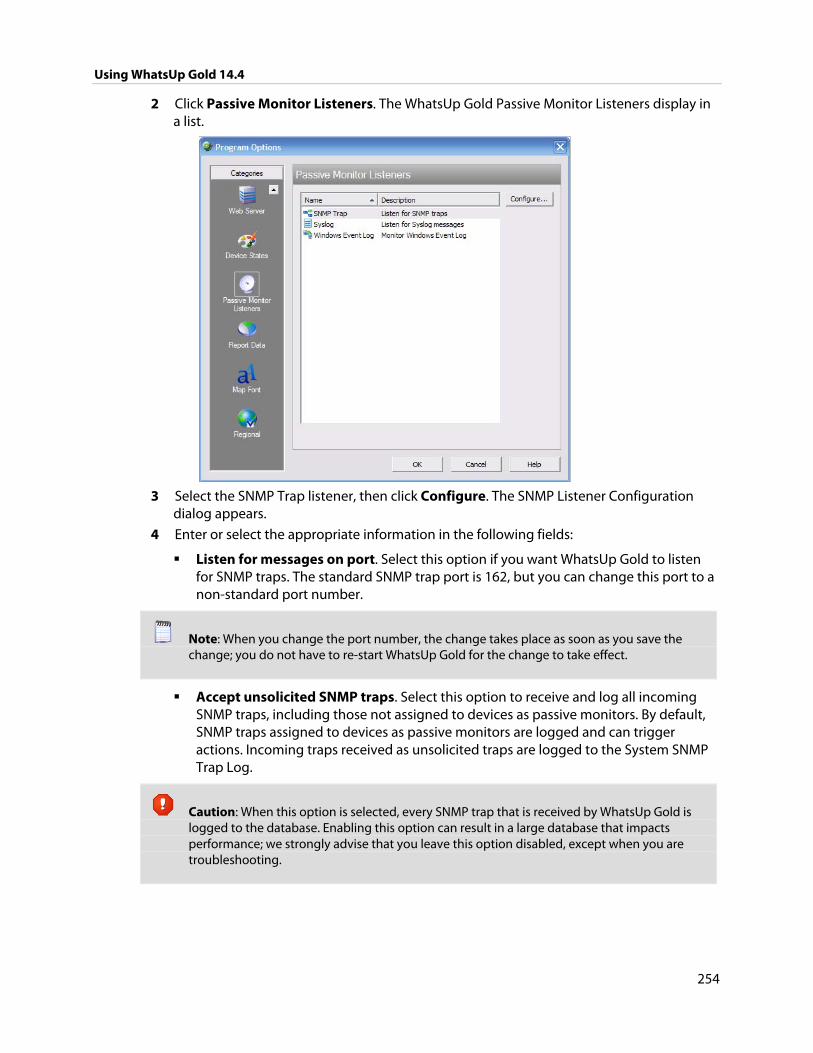
Using WhatsUp Gold 14.4
254
2 Click Passive Monitor Listeners. The WhatsUp Gold Passive Monitor Listeners display in a list.
3 Select the SNMP Trap listener, then click Configure. The SNMP Listener Configuration
dialog appears.
4 Enter or select the appropriate information in the following fields:
Listen for messages on port. Select this option if you want WhatsUp Gold to listen for SNMP traps. The standard SNMP trap port is 162, but you can change this port to a non-standard port number.
Note: When you change the port number, the change takes place as soon as you save the change; you do not have to re-start WhatsUp Gold for the change to take effect.
Accept unsolicited SNMP traps. Select this option to receive and log all incoming SNMP traps, including those not assigned to devices as passive monitors. By default, SNMP traps assigned to devices as passive monitors are logged and can trigger actions. Incoming traps received as unsolicited traps are logged to the System SNMP Trap Log.
Caution: When this option is selected, every SNMP trap that is received by WhatsUp Gold is logged to the database. Enabling this option can result in a large database that impacts performance; we strongly advise that you leave this option disabled, except when you are troubleshooting.

Using WhatsUp Gold 14.4
255
Note: To configure SNMP traps initially, we recommend enabling the Any SNMP trap on the source device; you can then see all incoming traps sent from that device in the Device SNMP Trap Log. After you configure the trap successfully, you should disable the Any trap, as it may also log large amounts of data.
Forward traps. Select this option to forward traps to the IP address(es) you specify in Forward traps to.
Forward unsolicited traps. Select this option to forward all traps, including unsolicited traps.
Forward traps to. Click Add to add in IP address and port to which to forward traps.
Note: You can forward traps to multiple IP addresses.
Tip: You can Edit and/or Remove IP addresses from this list.
5 Click OK to save changes.
Configuring the Syslog Listener WhatsUp Gold has an internal SNMP trap handler, which when enabled, listens for and accepts SNMP traps. WhatsUp Gold records the trap in the device's SNMP Trap Log.
To configure WhatsUp Gold to receive traps:
1 On the devices that are to be monitored, set the SNMP agent to send traps to WhatsUp Gold. Trap manager addresses must be set on each physical device. This cannot be done from WhatsUp Gold.
2 Set up the MIB entries for traps by placing the MIB text file in the C:\Program Files\Ipswitch\WhatsUp\Data\Mibs directory.
3 Enable the SNMP Trap Handler.
To configure the Syslog Passive Monitor Listener:
1 From the WhatsUp Gold console main menu, select Configure > Program Options. The Program Options dialog appears.
Note: If the Windows SNMP Trap Service (Control Panel > Services) is running on the WhatsUp Gold console PC, you should stop the service. This is a precaution to prevent any conflict with the WhatsUp Passive Monitor Listener.
2 Click Passive Monitor Listeners. The WhatsUp Gold Passive Monitor Listeners display in a list.
3 Select the Syslog Trap listener, then click Configure. The Syslog Listener Configuration dialog appears.
Using WhatsUp Gold 14.4
256
4 Enter or select the appropriate information in the following fields:
Listen for messages on port. Select this option if you want WhatsUp Gold to listen for Syslog messages.The Syslog Listener runs on port 514 by default, but can be changed if necessary.
Accept unsolicited passive monitors. If option this is cleared, ONLY Syslog entries which are specifically added to devices as passive monitors are logged to the System Syslog report. If you select this option, ALL incoming Syslog messages are detected and logged to the System Syslog report.
Note: Regardless of this filter setting, only Syslog messages that are solicited are logged to the devices' Syslog reports and are able to trigger actions.
5 Click OK to save changes.
Configuring the Windows Event Log Listener
To configure the Windows Event Log Listener:
1 From the WhatsUp Gold console main menu, select Configure > Program Options. The Program Options dialog appears.
Note: If the Windows SNMP Trap Service (Control Panel > Services) is running on the WhatsUp Gold console PC, you should stop the service. This is a precaution to prevent any conflict with the WhatsUp Passive Monitor Listener.
2 Click Passive Monitor Listeners. The WhatsUp Gold Passive Monitor Listeners display in a list.
3 Select the Windows Event Log Listener, then click Configure. The Windows Event Log Listener Configuration dialog appears.
4 Enter or select the appropriate information in the following fields:
Start Server. Select this option if you would like WhatsUp Gold to listen for Windows Event logs.
Do not generate payload. Select this option to only add the event time and message to the Windows Event Log; the payload is withheld from the entry.
Check connections interval. Select this option to have WhatsUp Gold check for and close inactive connections at the interval you specify. The default interval is 60 seconds.
5 Click OK to save changes.
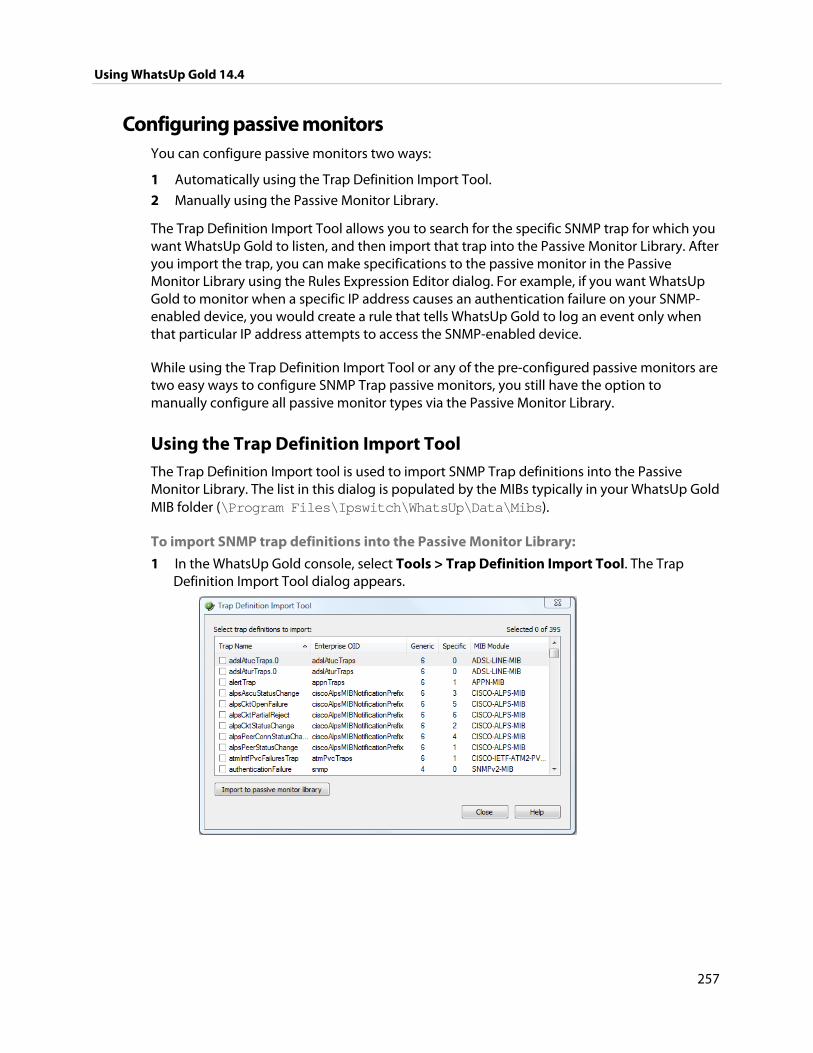
Using WhatsUp Gold 14.4
257
Configuring passive monitors You can configure passive monitors two ways:
1 Automatically using the Trap Definition Import Tool.
2 Manually using the Passive Monitor Library.
The Trap Definition Import Tool allows you to search for the specific SNMP trap for which you want WhatsUp Gold to listen, and then import that trap into the Passive Monitor Library. After you import the trap, you can make specifications to the passive monitor in the Passive Monitor Library using the Rules Expression Editor dialog. For example, if you want WhatsUp Gold to monitor when a specific IP address causes an authentication failure on your SNMP-enabled device, you would create a rule that tells WhatsUp Gold to log an event only when that particular IP address attempts to access the SNMP-enabled device.
While using the Trap Definition Import Tool or any of the pre-configured passive monitors are two easy ways to configure SNMP Trap passive monitors, you still have the option to manually configure all passive monitor types via the Passive Monitor Library.
Using the Trap Definition Import Tool The Trap Definition Import tool is used to import SNMP Trap definitions into the Passive Monitor Library. The list in this dialog is populated by the MIBs typically in your WhatsUp Gold MIB folder (\Program Files\Ipswitch\WhatsUp\Data\Mibs).
To import SNMP trap definitions into the Passive Monitor Library:
1 In the WhatsUp Gold console, select Tools > Trap Definition Import Tool. The Trap Definition Import Tool dialog appears.
Using WhatsUp Gold 14.4
258
2 Select the traps you want to import, then click Import to passive monitor library. The Trap Import Results dialog appears and provides a message about the import results.
Note: Traps that already exist in the database are not imported.
Tip: Use the dialog's scroll bar to scan available traps.
Using the Passive Monitor Library You can use the Passive Monitor Library to manually create new instances of a passive monitor type, or to edit the configuration of monitors you import using the Trap Definition Import Tool.
Using the SNMP Trap Monitor
To configure an instance of the SNMP Trap Passive Monitor:
1 Go to the Passive Monitor Library:
From the web interface, click GO. The GO menu appears.
If the WhatsUp section is not visible, click WhatsUp. The WhatsUp section of the GO menu appears.
Select Configure > Passive Monitor Library.
- or -
From the main menu of the console, select Configure > Passive Monitor Library.
2 In the Passive Monitor Library, do one of the following:
Click New. The Select Passive Monitor Type dialog appears.
Select SNMP Trap from the list, then click OK. The SNMP Passive Monitor Instance dialog appears.
- or -
Select an existing SNMP Trap from the list, then click Edit. The monitor properties dialog appears.
3 Enter or select the appropriate information in the following fields.
Name. The name of the monitor as it appears in the Passive Monitor Library.
Description. The description of the monitor as it appears in the Passive Monitor Library.
Enterprise/OID. Use the browse (...) button to select the desired object identifier (OID) from the Enterprise section of the MIB. This OID is used to identify traps for a particular application. If you specify the OID rather than select it from the MIB, then an incoming trap only matches this rule if the trap enterprise field begins with the OID that you have specified. If you are unsure of the OID to use, or don’t care to be specific, you can leave this field blank and it is ignored.
Using WhatsUp Gold 14.4
259
Note: This option is only available if Generic Type is set to 6-EnterpriseSpecific.
Generic Type (Major). Select the generic type number to be used in this monitor. Each trap has a generic type number. This number is part of the rule that determines the matching criteria for an incoming trap. For more information, see Common SNMP Traps in the Help.
Note: The definitions of 0 through 6 are not WhatsUp Gold definitions, but come from the SNMP specifications.
Specific Type (Minor). Enter a value. This value can be an integer from 0 to 4294967296. If you want to ignore this field, select "Any".
Note: This option is only available if Generic Type is set to 6-EnterpriseSpecific.
Payload. Click Add to view the Expression Editor where you can create an expression, test it, and compare it to potential payloads. After creating an expression, click OK to insert that string into the list under Match On.
Note: If you have multiple payload Match On expressions, they are linked by OR logic, not AND logic. If you have two expressions, one set to "AB" and the other to "BA", it will match against a trap containing any of the following: "AB" or "BA" or "ABBA". For more information, see the Regular Expression syntax (on page 181) topic.
Tip: Select an expression from the list to Edit it or Remove it from the list.
4 Click OK to save changes.
Using the Syslog Monitor 1 Go to the Passive Monitor Library:
From the web interface, click GO. The GO menu appears.
If the WhatsUp section is not visible, click WhatsUp. The WhatsUp section of the GO menu appears.
Select Configure > Passive Monitor Library.
- or -
From the main menu of the console, select Configure > Passive Monitor Library.
Using WhatsUp Gold 14.4
260
2 In the Passive Monitor Library, do one of the following:
Click New. The Select Passive Monitor Type dialog appears.
Select Syslog from the list, then click OK. The Syslog Passive Monitor Instance dialog appears.
- or -
Select an existing Syslog from the list, then click Edit. The monitor properties dialog appears.
3 Enter or select the appropriate information in the following fields.
Name. The name of the monitor as it appears in the Passive Monitor Library.
Description. The description of the monitor as it appears in the Passive Monitor Library.
Match on. Click Add to view the Expression Editor where you can create an expression, test it, and compare it to potential payloads. After creating an expression, click OK to insert that string into this list.
Note: If you have multiple payload Match On expressions, they are linked by OR logic, not AND logic. If you have two expressions, one set to "AB" and the other to "BA", it will match against a trap containing any of the following: "AB" or "BA" or "ABBA". For more information, see the Regular Expression syntax (on page 181) topic.
Tip: Select an expression from the list to Edit it or Remove it from the list.
4 Click OK to save changes.
Using the Windows Event Log Monitor
To configure an instance of the SNMP Trap Passive Monitor:
1 Go to the Passive Monitor Library:
From the web interface, click GO. The GO menu appears.
If the WhatsUp section is not visible, click WhatsUp. The WhatsUp section of the GO menu appears.
Select Configure > Passive Monitor Library.
- or -
From the main menu of the console, select Configure > Passive Monitor Library.
2 In the Passive Monitor Library, do one of the following:
Click New. The Select Passive Monitor Type dialog appears.
Select Windows Event Log from the list, then click OK. The WinEventLog Instance dialog appears.
- or -
Select an existing Windows Event Log monitor from the list, then click Edit. The monitor properties dialog appears.
Using WhatsUp Gold 14.4
261
3 Enter or select the appropriate information in the following fields.
Name. The number of the monitor as it appears in the Passive Monitor Library.
Description. The description as it appears in the Passive Monitor Library.
Condition. Enter one or more conditions for use in this Windows Event Log instance. Only log entries that match the expressions listed here are converted to events. Conditions are processed serially from top to bottom. As conditions are evaluated, results are applied to the next condition until all conditions have been evaluated. For complex sets of conditions that include both ANDs and ORs, this serial logic may produce results different from what is expected. As a best practice, we recommend keeping conditions simple by opting for multiple passive monitors over complex sets of conditions. When complex conditions are unavoidable, we recommend grouping all OR conditions together at the beginning of the condition set, followed by the AND conditions.
Tip: Select a condition and click Edit condition to change its configuration, or click Clear condition to remove it from the list.
Match description on. Click Add to view the Expression Editor where you can create an expression, test it, and compare it to potential payloads. After creating an expression, click OK to insert that string into the list under Match on.
Important: In a Windows Event Log Monitor, a payload Match Description On expression must match a value contained within the Windows Event Log message (this message is found in the WhatsUp Gold WinEvent Payload Viewer by scrolling through the Detail contents until you see "Message="). You must create a condition for any piece of information outside of this message that you would like WhatsUp Gold to search for using the Windows Event Log Monitor; for example, the Computer, Event ID, or Event Type.
Note: If you have multiple payload Match Description On expressions, they are linked by OR logic, not AND logic. For example, if you have two expressions, one set to "AB" and the other to "BA", it will match against any log entry that includes either of the two strings: "AB" or "BA" or "ABBA". For more information, see the Regular Expression syntax (on page 181) topic.
Using the Any passive monitor
The Any passive monitor receives all type-specific (SNMP, Syslog, Windows Event Log) traps and events sent from the device to which it is assigned. This monitor can be useful when you are trying to pinpoint the specific trap and coinciding MIB for which you want to WhatsUp Gold to listen and monitor. As the monitor gathers traps and events, this data is added to respective log (SNMP Trap Log, Syslog Entries, Windows Event Log). You can scan over the report entries to find the specific trap that you would like to monitor, and create a passive monitor for that specific trap.
Using WhatsUp Gold 14.4
262
If after running the monitor for some time you do not notice the trap for which you are looking, the MIB may not be loaded in the WhatsUp Gold MIB directory. If this is the case, you will need to import the MIB. For more information, see Using the SNMP MIB Manager (on page 459).
Important: Because of the volume of data that is gathered when this monitor is enabled, we strongly advise that this monitor only be used for troubleshooting purposes. If this monitor is enabled for more than short periods of time, you run the risk of flooding your database and compromising the performance of WhatsUp Gold.
As the monitor has been pre-configured for you, to use it, you are required only to assign it to the device for which you researching traps and events. For more information, see Assigning passive monitors (on page 262).
It is important that you remember to remove the monitor when you have completed troubleshooting because of the monitor's potential to fill up the WhatsUp Gold database.
Assigning passive monitors After you configure a passive monitor in the Passive Monitor Library, you must add it to the individual devices for which you want to monitor services.
Note: If you are assigning a Windows Event Log passive monitor type to a device, make sure that the device has credentials assigned before creating a passive monitor for it. For more information, see Using Credentials (on page 100). If want to use multiple Windows Event Log passive monitors, you must assign a unique Windows Event Log passive monitor for each device.
Note: The upgrade process to WhatsUp Gold from previous versions, automatically migrates Windows Event Log passive monitor credentials into the Credentials Library. If you experience upgrade problems with Windows Event Log passive monitors, look in the credentials library for the Windows (WMI) credentials that will work for the device. If the device credentials do not exist, create new credentials for the device. For more information, see Using Credentials (on page 100).
Note: When you assign a passive monitor to a device, an instance of the monitor is added to the device. Changes that you make to the monitor's configuration via the Passive Monitor Library affect all instances of the monitor. For example, if you assign a monitor to four separate devices and then make changes to the monitor from the Passive Monitor Library, all four instances of the monitor adopt the changes.
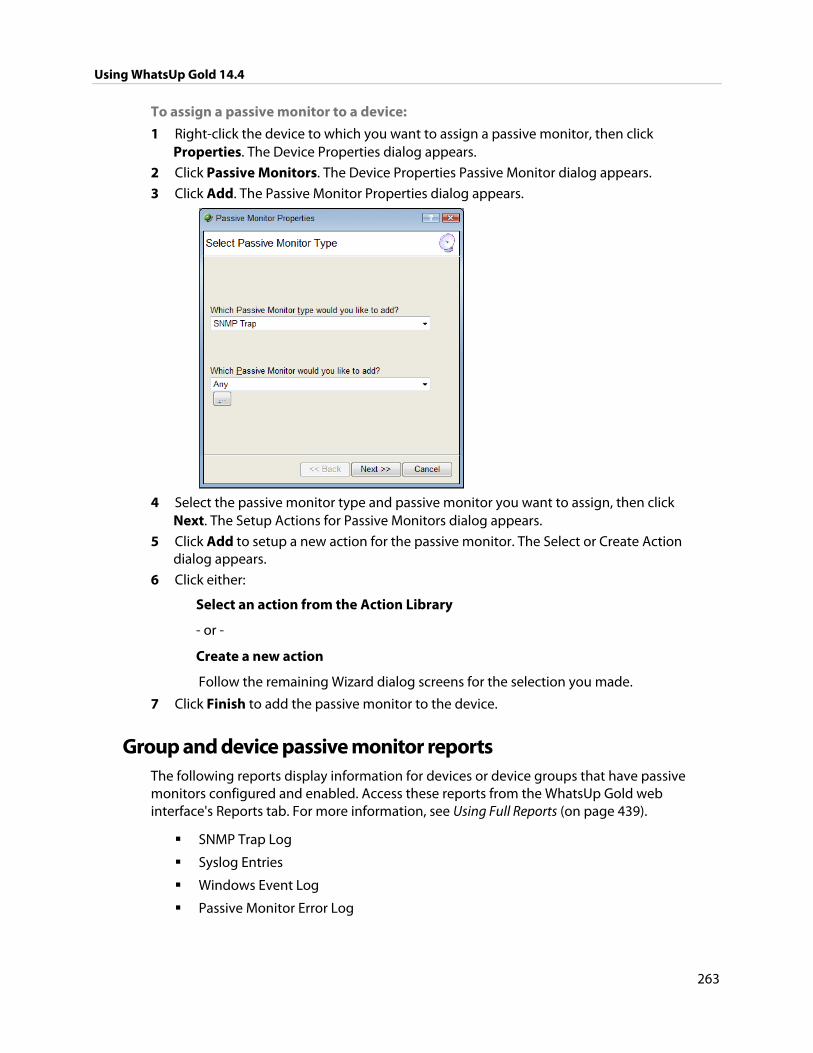
Using WhatsUp Gold 14.4
263
To assign a passive monitor to a device:
1 Right-click the device to which you want to assign a passive monitor, then click Properties. The Device Properties dialog appears.
2 Click Passive Monitors. The Device Properties Passive Monitor dialog appears.
3 Click Add. The Passive Monitor Properties dialog appears.
4 Select the passive monitor type and passive monitor you want to assign, then click
Next. The Setup Actions for Passive Monitors dialog appears.
5 Click Add to setup a new action for the passive monitor. The Select or Create Action dialog appears.
6 Click either:
Select an action from the Action Library
- or -
Create a new action
Follow the remaining Wizard dialog screens for the selection you made.
7 Click Finish to add the passive monitor to the device.
Group and device passive monitor reports The following reports display information for devices or device groups that have passive monitors configured and enabled. Access these reports from the WhatsUp Gold web interface's Reports tab. For more information, see Using Full Reports (on page 439).
SNMP Trap Log
Syslog Entries
Windows Event Log
Passive Monitor Error Log
264
CHAPTER 17
Using Actions
In This Chapter
Actions overview .............................................................................................. 264
About the Action Library ............................................................................... 265
Configuring an action ..................................................................................... 267
About Percent Variables ................................................................................ 297
Testing an action .............................................................................................. 300
Assigning an action ......................................................................................... 300
Removing an action ......................................................................................... 301
Creating a Blackout Period ............................................................................ 303
About Action Policies ...................................................................................... 303
Example: getting an Email alert when the Web server fails .............. 306
Using Scripting Actions .................................................................................. 309
Actions overview WhatsUp Gold actions are designed to perform a task as a device or monitor state change occurs.
As you configure an action, you choose the task it is to perform. Actions can try to correct the problem, notify someone of the state change, or launch an external application. Also, when you configure an action, you choose whether to assign it to a device, or to an active or passive monitor.
When assigned to an active monitor, actions fire according to the state changes it issues. For example, you can configure an Email Action to send an email alert when the active monitor for a Web server issues a down state change.
You can configure actions on a single device or monitor, or define an Action Policy to use across multiple devices or monitors.
Using WhatsUp Gold 14.4
265
About action strategies As you configure and assign actions, you should take several things into consideration.
Assigning an external notification action (email, SMS, beeper) to a large list of devices greatly increases the chance of numerous notifications being sent at one time.
For example, an email action assigned to a router and each of the devices that depend on that router for their Internet connectivity, would send email notifications not only from the router, but also from every single connected device, should the router go down.
In a situation like this, it consider using dependencies that allow you to restrict email notifications to only the router and the critical devices to which it is connected. For more information, see Dependencies overview (on page 138).
An action can be assigned to a device or to an active or passive monitor.
If you want to be notified if and when any or all of the monitors on a device go down, assign the action to the device. If you are concerned with specific monitors on a device, assign the action to the monitor itself. If you an assign to both the device and a specific monitor, both actions fire when the monitor goes down.
Action policies are easier to manage than lists of actions built on a device.
Whenever possible, use action policies in lieu of configuring multiple actions for one device.
If the existing WhatsUp Gold device states do not fit your monitoring needs, you can modify them, or configure new ones.
You may want to add device states for longer periods of downtime. Perhaps creating a Down at least 60 mins state, and sending an escalated message to show that the device is still down after an hour.
Web Alarms are only useful if someone is able to hear the notifications.
While Web Alarms are useful in many situations, they are not the most efficient way to monitor devices and services overnight.
Visual notifications are usually ample enough for most of the devices on your network.
Unless the device is vital to the daily-operation of your network or business, the color and shape of each device state easily informs you of current network device status.
You can check on the status of firing alerts via Running Actions. From here, you can cancel single alerts, or all currently firing alerts.
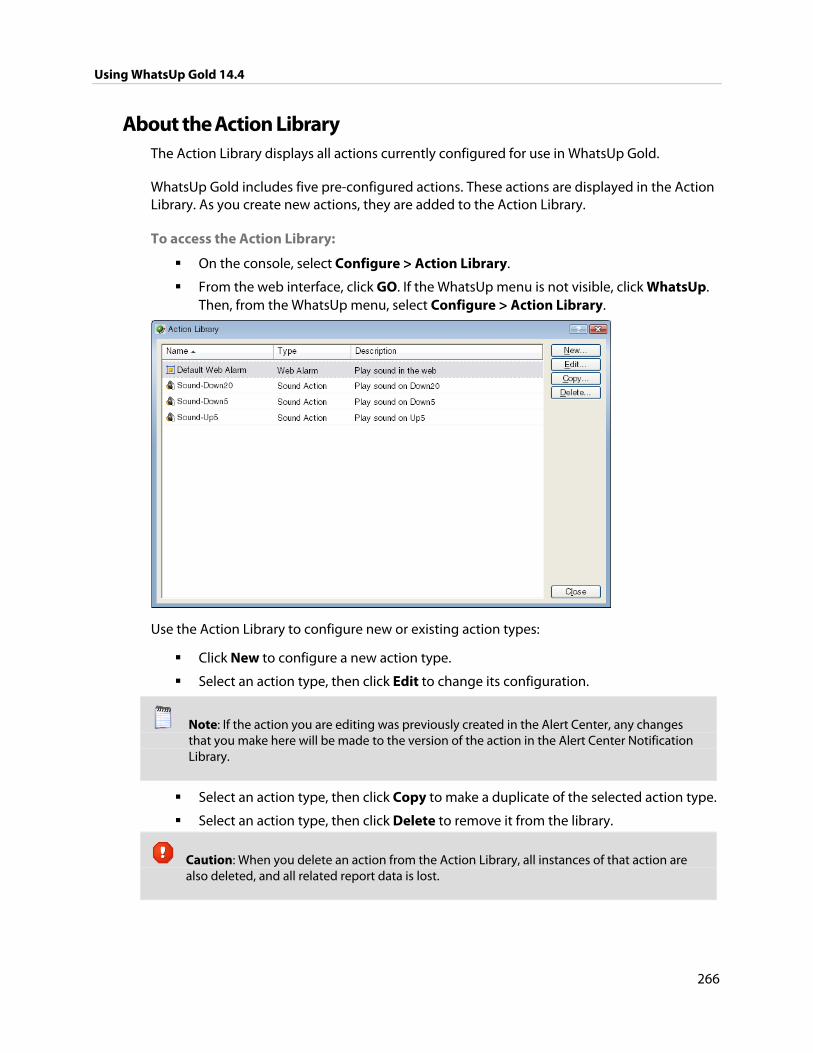
Using WhatsUp Gold 14.4
266
About the Action Library The Action Library displays all actions currently configured for use in WhatsUp Gold.
WhatsUp Gold includes five pre-configured actions. These actions are displayed in the Action Library. As you create new actions, they are added to the Action Library.
To access the Action Library:
On the console, select Configure > Action Library.
From the web interface, click GO. If the WhatsUp menu is not visible, click WhatsUp. Then, from the WhatsUp menu, select Configure > Action Library.
Use the Action Library to configure new or existing action types:
Click New to configure a new action type.
Select an action type, then click Edit to change its configuration.
Note: If the action you are editing was previously created in the Alert Center, any changes that you make here will be made to the version of the action in the Alert Center Notification Library.
Select an action type, then click Copy to make a duplicate of the selected action type.
Select an action type, then click Delete to remove it from the library.
Caution: When you delete an action from the Action Library, all instances of that action are also deleted, and all related report data is lost.
Using WhatsUp Gold 14.4
267
Configuring an action There are two aspects of fully configuring an action. The first is to create the action itself in the Action Library dialog or through the Action Builder wizard. The setup consists of:
Defining the target of the action (for example, a pager or email address)
Entering the notification variables or program arguments (that specify what information to report in the action message, or to pass to another program).
After the action is created, the second step is to assign the action or action policy to a device or active monitor and to link it to a state change (action policies are already linked to a state change during the policy definition). For more information see:
Assigning an action to a device (on page 300)
Assigning an action to an active monitor (on page 301)
Creating a custom action policy (on page 304)
After the actions have been completely configured, WhatsUp Gold launches the action as soon as the proper state change is reached.
Using the Beeper Action The Beeper Action sends a code to a beeper that indicates that a device or service has either gone down, or has come back up.
To configure a Beeper Action:
1 Go to the Action Library:
From the web interface, click GO. The GO menu appears.
If the WhatsUp section is not visible, click WhatsUp. The WhatsUp section of the GO menu appears.
Select Configure > Action Library. The Action Library appears.
- or -
From the main menu bar of the console, select Configure > Action Library. The Action Library appears.
2 In the Action Library, do one of the following:
Click New, then select Beeper Action.
- or -
Select an existing Beeper Action, then click Edit.

Using WhatsUp Gold 14.4
268
The action properties page appears.
3 Enter or select the appropriate information in the following fields.
Name. The name of the action as it appears in the Action Library.
Description. Enter a short description of the action. This is displayed in the Action Library dialog along with the entry in Name.
Beeper number. Enter the phone number to dial. You can use parentheses to delimit the area code and a dash to separate the exchange from the extension numbers, for example: (617) 555-5555.
Pause after answer. Enter a number of seconds the modem should pause before sending the signal codes once a connection has been made.
End transmission. By default, # is the correct symbol for the end transmission command. Some international systems require other or additional symbols.
Modem setup. Select either Primary, or one of the Alternate setups. Click Port Settings to further define your selection. Modem Setup is used specifically to support different service providers in case you use more than one provider for sending your beeper notifications. There could also be times you want to change your settings to meet a specific service provider’s requirements for a specific notification (for example: a lower baud rate). To do this, you can set up an alternate Modem Setup and associate this to the notification instead of using your Primary setting.
Note: Changing the Port Settings for the desired Modem Setup will affect ALL uses of that setting.
Up code. Specifies the characters sent to the beeper to indicate that the device has come back up after being down (the default value is 0*).
Using WhatsUp Gold 14.4
269
Down Code. Specifies the code sent to indicate the device is down (the default value is 1*).
On passive monitor code. Specifies the code sent to indicate that an active monitor has been received for the device. (Default value is 2*) You can use the asterisk (*) character to separate codes from a subsequent message.
Recurring action code. The percent variables for the action. The default action code is:
%System.NumberofUpDevices*%System.NumberofDownDevices
4 Click OK to save changes.
Using the Log to Text Action The Log to Text File Action uses Percent Variables to gather information about your network devices and logs a custom message to a specified text file with the Percent Variable results. You can specify the name and location of an existing text file or create a new file and location to which the message will be written.
This action is useful if you would rather receive network messages in a text file that can be saved, as an alternative to receiving an email or SMS alert.
To configure a Log to Text Action:
1 Go to the Action Library:
From the web interface, click GO. The GO menu appears.
If the WhatsUp section is not visible, click WhatsUp. The WhatsUp section of the GO menu appears.
Select Configure > Action Library. The Action Library appears.
- or -
From the main menu bar of the console, select Configure > Action Library. The Action Library appears.
2 In the Action Library, do one of the following:
Click New, then select Log to Text.
- or -
Select an existing Log to Test Action, then click Edit. The action properties page appears.
3 Specify or select the appropriate information in the dialog fields.
Specify a Name for the action as it will appear in the Action Library.
Specify a short Description for the action as it will appear in the Action Library.
Specify the full path to the Log file to which the text will be written.
Tip: On the console, click the Browse button to browse to the log file.
Using WhatsUp Gold 14.4
270
Select the Log file write mode. Select Append to have log messages appended to the Log file. Select Overwrite to have log messages overwrite existing log messages.
Enter the Log Message..that will be written to the log file. This message supports percent variables. The default log message is:
%Device.ActiveMonitorDownNames is %Device.State on %Device.Type: %Device.HostName (%Device.Address).
Details:
Monitors that are down include: %Device.ActiveMonitorDownNames
Monitors that are up include: %Device.ActiveMonitorUpNames
Notes on this device (from device property page):
%Device.Notes
----------------------------------------
This message was logged on %System.Date at %System.Time
Ipswitch WhatsUp Gold
Tip: Right-click in the Log Message field to select the percent variables you would like to use in the action.
4 Click OK to save changes.
Using the Pager Action The Pager Action sends a user-specified message to a pager.
To configure a Pager Action:
1 Go to the Action Library:
From the web interface, click GO. The GO menu appears.
If the WhatsUp section is not visible, click WhatsUp. The WhatsUp section of the GO menu appears.
Select Configure > Action Library. The Action Library appears.
- or -
From the main menu bar of the console, select Configure > Action Library. The Action Library appears.
2 In the Action Library, do one of the following:
Click New, then select Pager Action.
- or -
Select an existing Pager Action, then click Edit.
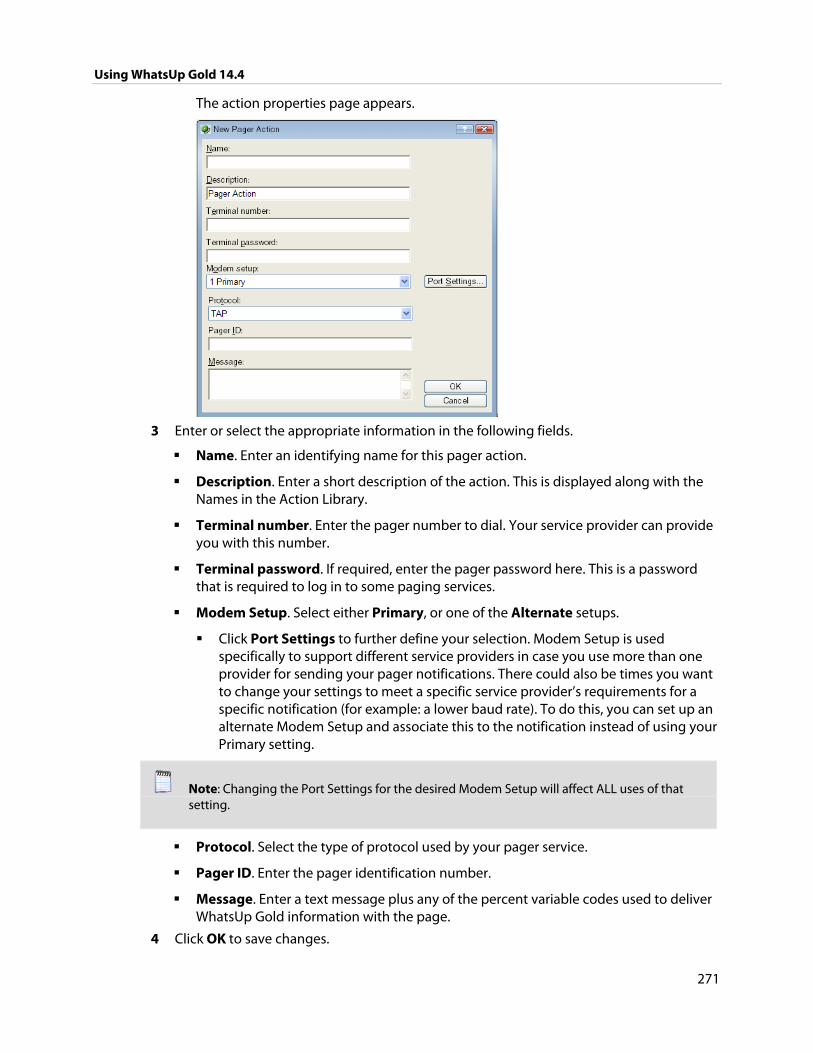
Using WhatsUp Gold 14.4
271
The action properties page appears.
3 Enter or select the appropriate information in the following fields.
Name. Enter an identifying name for this pager action.
Description. Enter a short description of the action. This is displayed along with the Names in the Action Library.
Terminal number. Enter the pager number to dial. Your service provider can provide you with this number.
Terminal password. If required, enter the pager password here. This is a password that is required to log in to some paging services.
Modem Setup. Select either Primary, or one of the Alternate setups.
Click Port Settings to further define your selection. Modem Setup is used specifically to support different service providers in case you use more than one provider for sending your pager notifications. There could also be times you want to change your settings to meet a specific service provider’s requirements for a specific notification (for example: a lower baud rate). To do this, you can set up an alternate Modem Setup and associate this to the notification instead of using your Primary setting.
Note: Changing the Port Settings for the desired Modem Setup will affect ALL uses of that setting.
Protocol. Select the type of protocol used by your pager service.
Pager ID. Enter the pager identification number.
Message. Enter a text message plus any of the percent variable codes used to deliver WhatsUp Gold information with the page.
4 Click OK to save changes.
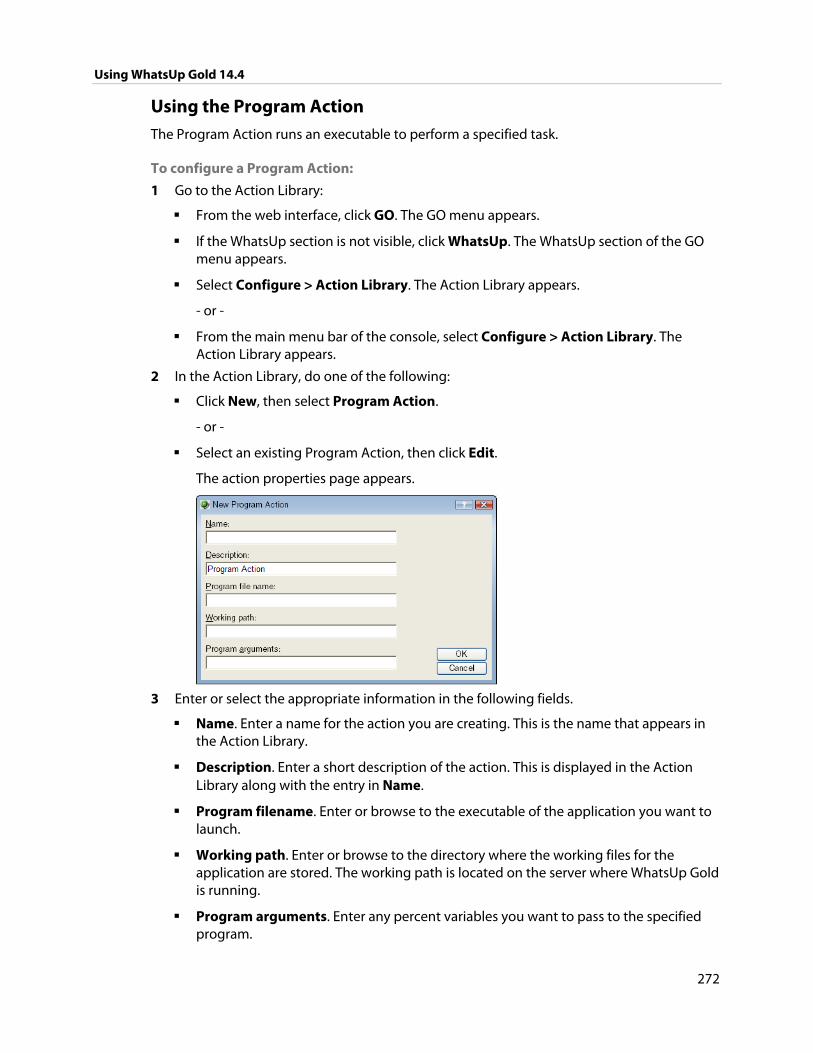
Using WhatsUp Gold 14.4
272
Using the Program Action The Program Action runs an executable to perform a specified task.
To configure a Program Action:
1 Go to the Action Library:
From the web interface, click GO. The GO menu appears.
If the WhatsUp section is not visible, click WhatsUp. The WhatsUp section of the GO menu appears.
Select Configure > Action Library. The Action Library appears.
- or -
From the main menu bar of the console, select Configure > Action Library. The Action Library appears.
2 In the Action Library, do one of the following:
Click New, then select Program Action.
- or -
Select an existing Program Action, then click Edit.
The action properties page appears.
3 Enter or select the appropriate information in the following fields.
Name. Enter a name for the action you are creating. This is the name that appears in the Action Library.
Description. Enter a short description of the action. This is displayed in the Action Library along with the entry in Name.
Program filename. Enter or browse to the executable of the application you want to launch.
Working path. Enter or browse to the directory where the working files for the application are stored. The working path is located on the server where WhatsUp Gold is running.
Program arguments. Enter any percent variables you want to pass to the specified program.
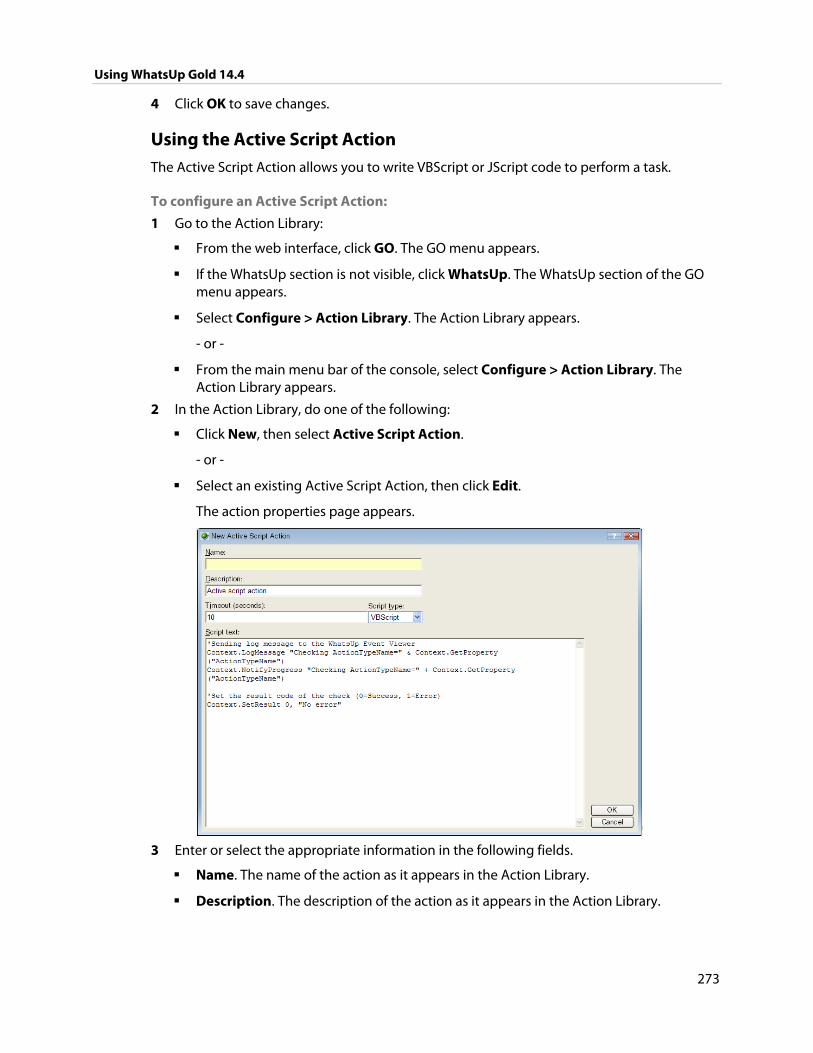
Using WhatsUp Gold 14.4
273
4 Click OK to save changes.
Using the Active Script Action The Active Script Action allows you to write VBScript or JScript code to perform a task.
To configure an Active Script Action:
1 Go to the Action Library:
From the web interface, click GO. The GO menu appears.
If the WhatsUp section is not visible, click WhatsUp. The WhatsUp section of the GO menu appears.
Select Configure > Action Library. The Action Library appears.
- or -
From the main menu bar of the console, select Configure > Action Library. The Action Library appears.
2 In the Action Library, do one of the following:
Click New, then select Active Script Action.
- or -
Select an existing Active Script Action, then click Edit.
The action properties page appears.
3 Enter or select the appropriate information in the following fields.
Name. The name of the action as it appears in the Action Library.
Description. The description of the action as it appears in the Action Library.
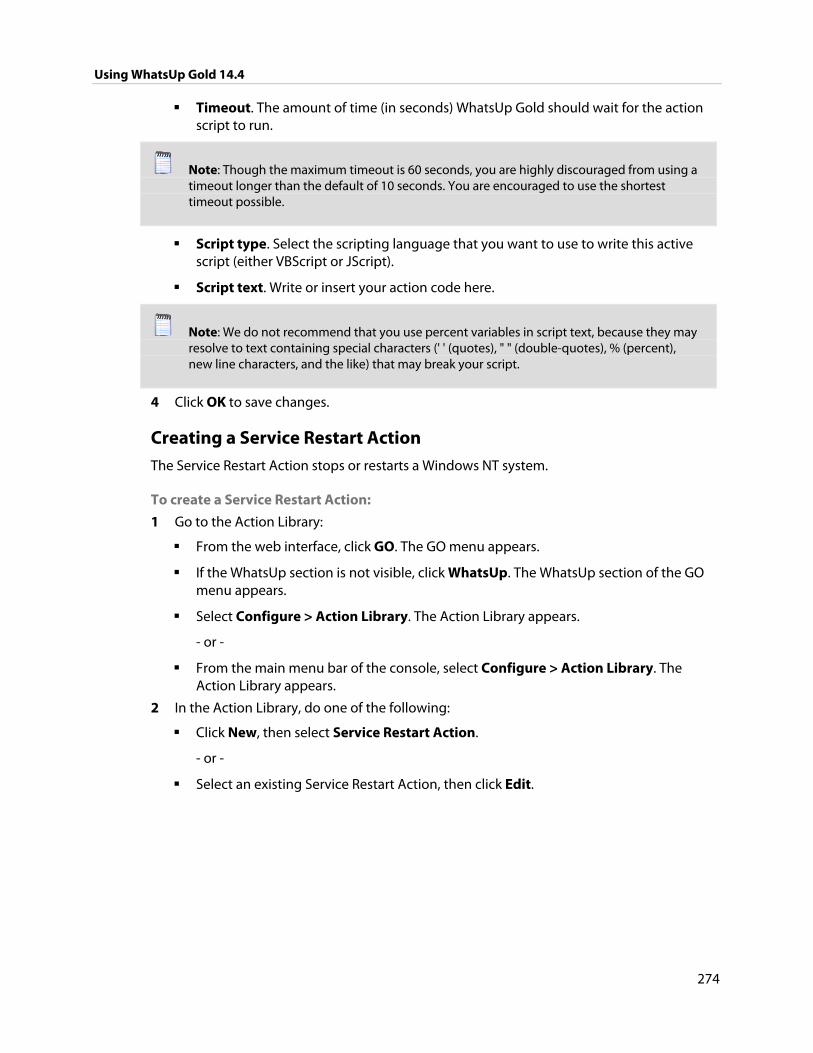
Using WhatsUp Gold 14.4
274
Timeout. The amount of time (in seconds) WhatsUp Gold should wait for the action script to run.
Note: Though the maximum timeout is 60 seconds, you are highly discouraged from using a timeout longer than the default of 10 seconds. You are encouraged to use the shortest timeout possible.
Script type. Select the scripting language that you want to use to write this active script (either VBScript or JScript).
Script text. Write or insert your action code here.
Note: We do not recommend that you use percent variables in script text, because they may resolve to text containing special characters (' ' (quotes), " " (double-quotes), % (percent), new line characters, and the like) that may break your script.
4 Click OK to save changes.
Creating a Service Restart Action The Service Restart Action stops or restarts a Windows NT system.
To create a Service Restart Action:
1 Go to the Action Library:
From the web interface, click GO. The GO menu appears.
If the WhatsUp section is not visible, click WhatsUp. The WhatsUp section of the GO menu appears.
Select Configure > Action Library. The Action Library appears.
- or -
From the main menu bar of the console, select Configure > Action Library. The Action Library appears.
2 In the Action Library, do one of the following:
Click New, then select Service Restart Action.
- or -
Select an existing Service Restart Action, then click Edit.
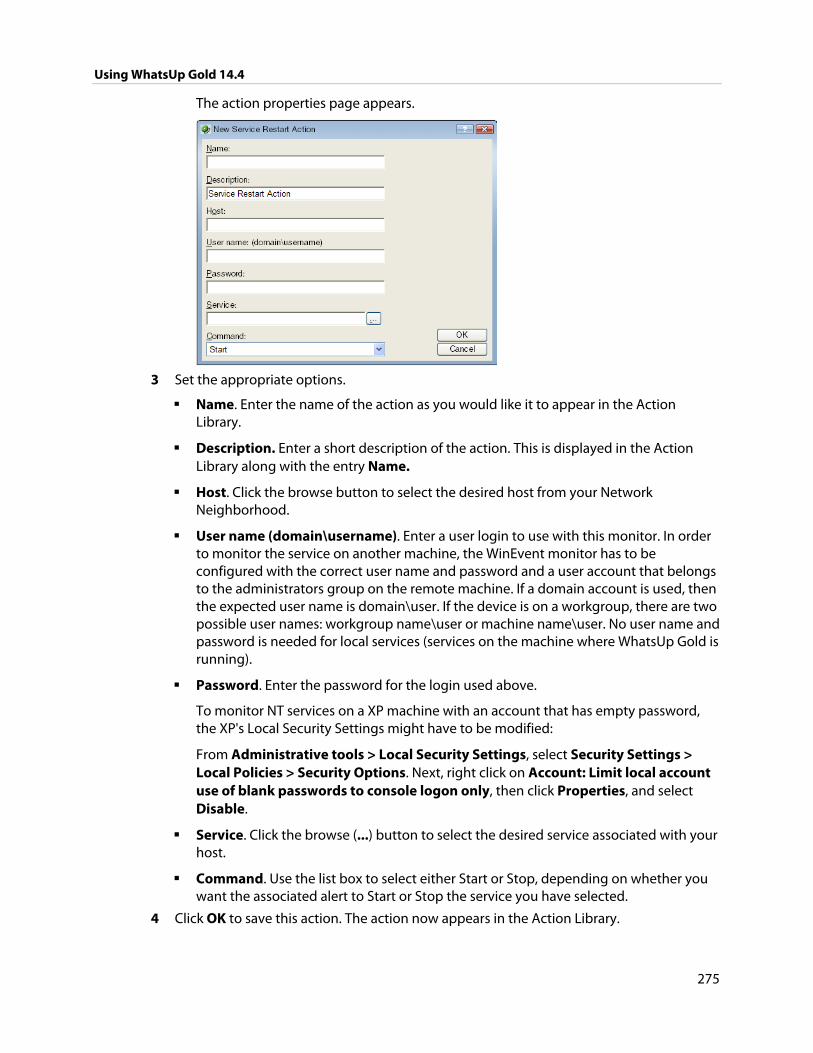
Using WhatsUp Gold 14.4
275
The action properties page appears.
3 Set the appropriate options.
Name. Enter the name of the action as you would like it to appear in the Action Library.
Description. Enter a short description of the action. This is displayed in the Action Library along with the entry Name.
Host. Click the browse button to select the desired host from your Network Neighborhood.
User name (domain\username). Enter a user login to use with this monitor. In order to monitor the service on another machine, the WinEvent monitor has to be configured with the correct user name and password and a user account that belongs to the administrators group on the remote machine. If a domain account is used, then the expected user name is domain\user. If the device is on a workgroup, there are two possible user names: workgroup name\user or machine name\user. No user name and password is needed for local services (services on the machine where WhatsUp Gold is running).
Password. Enter the password for the login used above.
To monitor NT services on a XP machine with an account that has empty password, the XP's Local Security Settings might have to be modified:
From Administrative tools > Local Security Settings, select Security Settings > Local Policies > Security Options. Next, right click on Account: Limit local account use of blank passwords to console logon only, then click Properties, and select Disable.
Service. Click the browse (...) button to select the desired service associated with your host.
Command. Use the list box to select either Start or Stop, depending on whether you want the associated alert to Start or Stop the service you have selected.
4 Click OK to save this action. The action now appears in the Action Library.
Using WhatsUp Gold 14.4
276
5 Assign the action to a device or a monitor. For more information, see Assigning an action to a device (on page 300) or Assigning an action to a monitor (on page 301).
Using the SMS Action The SMS Action sends a Short Message Service (SMS) notification to a pager or cell phone using an email gateway or dial-up modem. An SMS Action can also be used as an SMS notification in the WhatsUp Gold Alert Center. While you can configure this action on both the console and web interface, you can only configure the Alert Center notification message on the web.
Configuring an SMS Action on the console
To configure an SMS Action on the console:
1 From the main menu bar of the console, select Configure > Action Library. The Action Library appears.
2 In the Action Library, do one of the following:
Click New, then select SMS Action.
- or -
Select an existing SMS Action, then click Edit.
The action properties page appears.
3 Enter or select the appropriate information in the following fields.
Name. Enter a unique display name to identify the SMS notification.
Description. Enter a short description of the action. This is displayed in the Action Library along with the entry in Name.
Country. Using the list box, select the country for the SMS provider.
Provider. Using the list box, select the desired provider.
Note: If the provider list is incomplete and/or incorrect, you can click the Providers button to add, edit, or delete providers in this list.
Mode. Either Email or Dialup, depending on how the Provider was created in the system.
Email to. If the connection setting is Email, enter the email address of the SMS device.
Phone Number. If the connection setting is Dialup, enter the phone number to call with the message. You can enter multiple phone numbers, separated by a comma. There is a 2,000 character limit in this field, so you can enter many numbers.
Note: Non-numeric characters such as "-" and "." will be ignored.
Message. Enter a text message plus any desired percent variable codes. Keep in mind that if you use percent variables, this will greatly increase the character count.
Using WhatsUp Gold 14.4
277
Note: If the message exceeds 140 characters, the message will be broken into up to 3 parts and will be sent as separate messages ("1 of 3", "1 of 2", etc.).
4 Click OK to save changes.
Configuring an SMS Action on the web
To configure an SMS Action on the web interface:
1 From the web interface, click GO. The GO menu appears.
If the WhatsUp section is not visible, click WhatsUp. The WhatsUp section of the GO menu appears.
2 Select Configure > Action Library. The Action Library appears.
3 In the Action Library, do one of the following:
Click New, then select SMS Action.
- or -
Select an existing SMS Action, then click Edit.
The action properties page appears.
4 Enter or select the appropriate information in the following fields.
Name. Enter a unique display name to identify the SMS notification.
Description. Enter a short description of the action. This is displayed in the Action Library along with the entry in Name.
Country. Using the list box, select the country for the SMS provider.
Provider. Using the list box, select the desired provider.
Note: If the provider list is incomplete and/or incorrect, you can click the Providers button to add, edit, or delete providers in this list.
Mode. Either Email or Dialup, depending on how the Provider was created in the system.
Email to. If the connection setting is Email, enter the email address of the SMS device.
Phone Number. If the connection setting is Dialup, enter the phone number to call with the message. You can enter multiple phone numbers, separated by a comma. There is a 2,000 character limit in this field, so you can enter many numbers.
Note: Non-numeric characters such as "-" and "." will be ignored.
5 The New/Edit SMS Action dialog contains two tabs. Select a tab to configure message settings.
Using WhatsUp Gold 14.4
278
The Message tab contains options pertaining to the message sent as the result of an active or passive monitor.
Enter a text message plus any desired percent variable codes. Keep in mind that if you use percent variables, this will greatly increase the character count.
Note: If the message exceeds 140 characters, the message will be broken into up to 3 parts and will be sent as separate messages ("1 of 3", "1 of 2", etc.).
Tip: Click Mobile Device Status to insert a link to the device status in the message
The Alert Center Message tab contains options pertaining to the message that is to be sent from an WhatsUp Gold Alert Center notification.
Enter a text message plus any desired percent variable codes. Keep in mind that if you use percent variables, this will greatly increase the character count.
Tip: To enter Alert Center percent variables, right click inside the message box.
Note: If the message exceeds 140 characters, the message will be broken into up to 3 parts and will be sent as separate messages ("1 of 3", "1 of 2", etc.).
6 Click OK to save changes.
Using the SMS Direct Action The SMS Direct Action send SMS messages directly through an SMS modem, unlike SMS actions, which use email gateways or dial-up modems. If you want to send an SMS message and do not have an SMS modem, see Creating an SMS Action (on page 276).
To configure an SMS Direct Action:
1 Go to the Action Library:
From the web interface, click GO. The GO menu appears.
If the WhatsUp section is not visible, click WhatsUp. The WhatsUp section of the GO menu appears.
Select Configure > Action Library. The Action Library appears.
- or -
From the main menu bar of the console, select Configure > Action Library. The Action Library appears.
2 In the Action Library, do one of the following:
Click New, then select SMS Direct.
- or -
Select an existing SMS Direct Action, then click Edit.
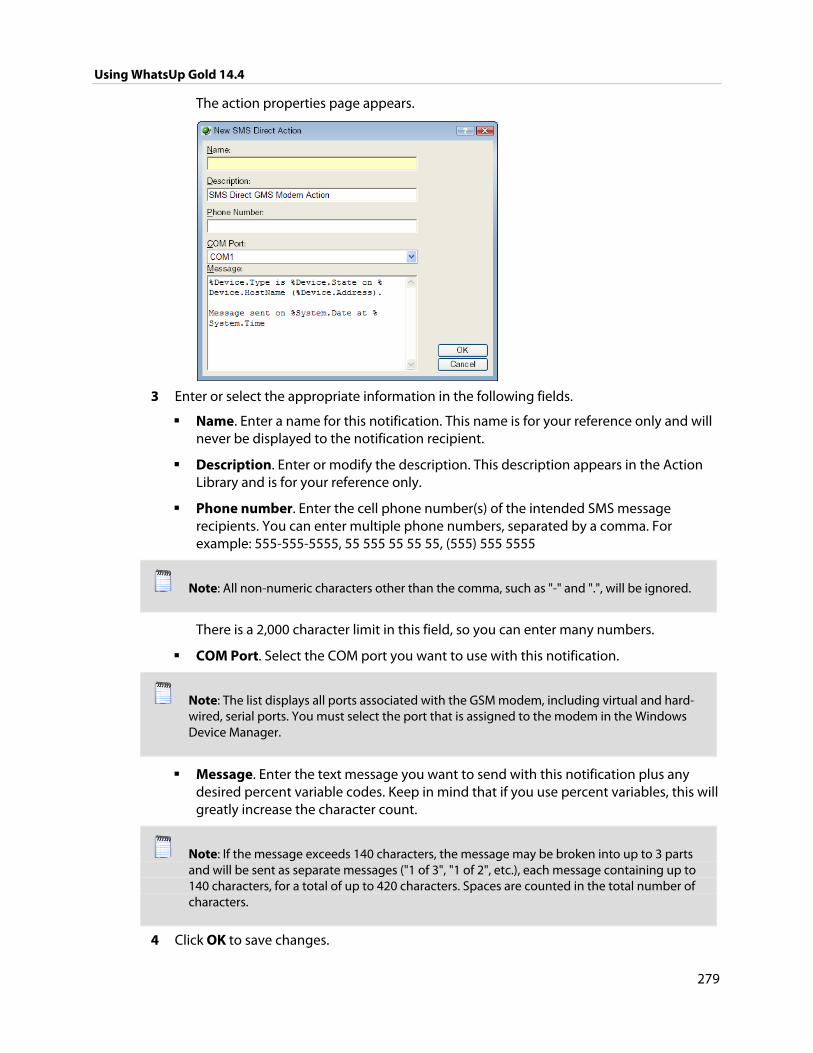
Using WhatsUp Gold 14.4
279
The action properties page appears.
3 Enter or select the appropriate information in the following fields.
Name. Enter a name for this notification. This name is for your reference only and will never be displayed to the notification recipient.
Description. Enter or modify the description. This description appears in the Action Library and is for your reference only.
Phone number. Enter the cell phone number(s) of the intended SMS message recipients. You can enter multiple phone numbers, separated by a comma. For example: 555-555-5555, 55 555 55 55 55, (555) 555 5555
Note: All non-numeric characters other than the comma, such as "-" and ".", will be ignored.
There is a 2,000 character limit in this field, so you can enter many numbers.
COM Port. Select the COM port you want to use with this notification.
Note: The list displays all ports associated with the GSM modem, including virtual and hard-wired, serial ports. You must select the port that is assigned to the modem in the Windows Device Manager.
Message. Enter the text message you want to send with this notification plus any desired percent variable codes. Keep in mind that if you use percent variables, this will greatly increase the character count.
Note: If the message exceeds 140 characters, the message may be broken into up to 3 parts and will be sent as separate messages ("1 of 3", "1 of 2", etc.), each message containing up to 140 characters, for a total of up to 420 characters. Spaces are counted in the total number of characters.
4 Click OK to save changes.
Using WhatsUp Gold 14.4
280
Configuring an SMS Direct Action on the console
To configure an SMS Direct Action on the console:
1 From the main menu bar of the console, select Configure > Action Library. The Action Library appears.
2 In the Action Library, do one of the following:
Click New, then select SMS Direct.
- or -
Select an existing SMS Direct Action, then click Edit.
The action properties page appears.
3 Enter or select the appropriate information in the following fields.
Name. Enter a name for this notification. This name is for your reference only and will never be displayed to the notification recipient.
Description. Enter or modify the description. This description appears in the Action Library and is for your reference only.
Phone number. Enter the cell phone number(s) of the intended SMS message recipients. You can enter multiple phone numbers, separated by a comma. For example: 555-555-5555, 55 555 55 55 55, (555) 555 5555
Note: All non-numeric characters other than the comma, such as "-" and ".", will be ignored.
There is a 2,000 character limit in this field, so you can enter many numbers.
COM Port. Select the COM port you want to use with this notification.
Note: The list displays all ports associated with the GSM modem, including virtual and hard-wired, serial ports. You must select the port that is assigned to the modem in the Windows Device Manager.
Message. Enter a text message plus any desired percent variable codes. Keep in mind that if you use percent variables, this will greatly increase the character count.
Note: If the message exceeds 140 characters, the message will be broken into up to 3 parts and will be sent as separate messages ("1 of 3", "1 of 2", etc.).
Tip: Click Mobile Device Status to insert a link to the device status in the message
4 Click OK to save changes.
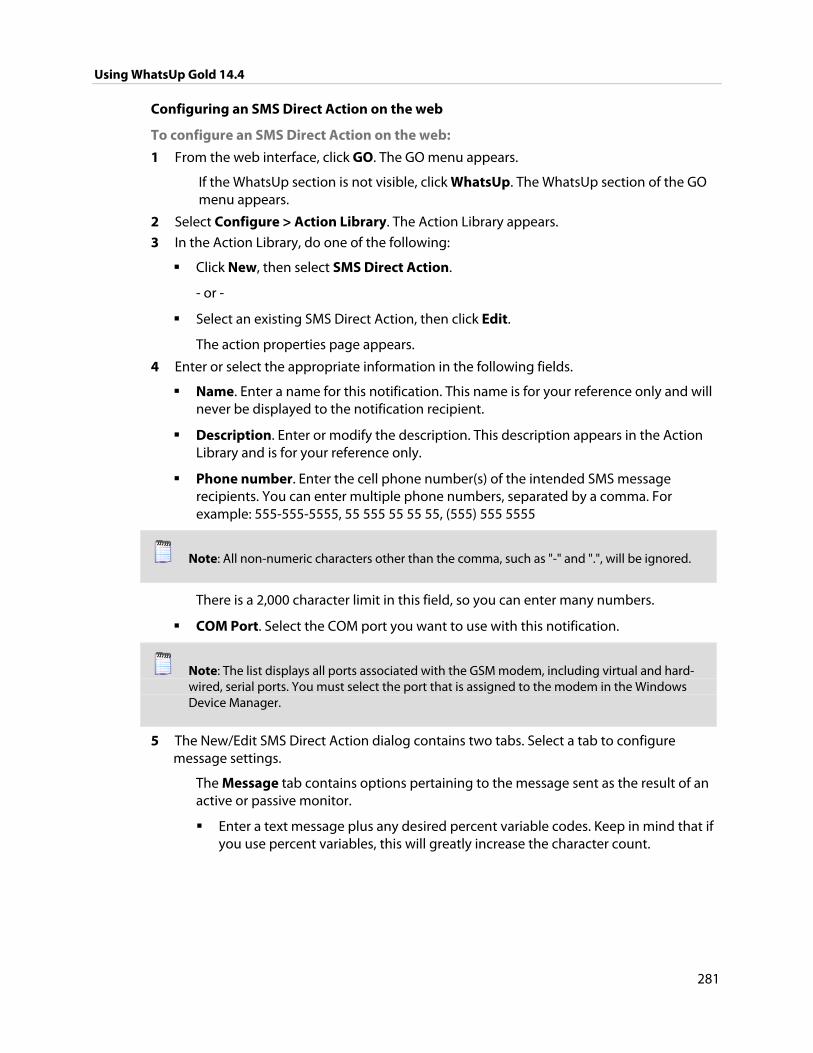
Using WhatsUp Gold 14.4
281
Configuring an SMS Direct Action on the web
To configure an SMS Direct Action on the web:
1 From the web interface, click GO. The GO menu appears.
If the WhatsUp section is not visible, click WhatsUp. The WhatsUp section of the GO menu appears.
2 Select Configure > Action Library. The Action Library appears.
3 In the Action Library, do one of the following:
Click New, then select SMS Direct Action.
- or -
Select an existing SMS Direct Action, then click Edit.
The action properties page appears.
4 Enter or select the appropriate information in the following fields.
Name. Enter a name for this notification. This name is for your reference only and will never be displayed to the notification recipient.
Description. Enter or modify the description. This description appears in the Action Library and is for your reference only.
Phone number. Enter the cell phone number(s) of the intended SMS message recipients. You can enter multiple phone numbers, separated by a comma. For example: 555-555-5555, 55 555 55 55 55, (555) 555 5555
Note: All non-numeric characters other than the comma, such as "-" and ".", will be ignored.
There is a 2,000 character limit in this field, so you can enter many numbers.
COM Port. Select the COM port you want to use with this notification.
Note: The list displays all ports associated with the GSM modem, including virtual and hard-wired, serial ports. You must select the port that is assigned to the modem in the Windows Device Manager.
5 The New/Edit SMS Direct Action dialog contains two tabs. Select a tab to configure message settings.
The Message tab contains options pertaining to the message sent as the result of an active or passive monitor.
Enter a text message plus any desired percent variable codes. Keep in mind that if you use percent variables, this will greatly increase the character count.

Using WhatsUp Gold 14.4
282
Note: If the message exceeds 140 characters, the message may be broken into up to 3 parts and will be sent as separate messages ("1 of 3", "1 of 2", etc.), each message containing up to 140 characters, for a total of up to 420 characters. Spaces are counted in the total number of characters.
The Alert Center Message tab contains options pertaining to the message that is to be sent from an WhatsUp Gold Alert Center notification.
Enter a text message plus any desired percent variable codes. Keep in mind that if you use percent variables, this will greatly increase the character count.
The Message tab contains options pertaining to the message sent as the result of an active or passive monitor.
Enter a text message plus any desired percent variable codes. Keep in mind that if you use percent variables, this will greatly increase the character count.
Note: If the message exceeds 140 characters, the message may be broken into up to 3 parts and will be sent as separate messages ("1 of 3", "1 of 2", etc.), each message containing up to 140 characters, for a total of up to 420 characters. Spaces are counted in the total number of characters.
The Alert Center Message tab contains options pertaining to the message that is to be sent from an WhatsUp Gold Alert Center notification.
Enter a text message plus any desired percent variable codes. Keep in mind that if you use percent variables, this will greatly increase the character count.
Tip: To enter Alert Center percent variables, right click inside the message box.
Note: If the message exceeds 140 characters, the message will be broken into up to 3 parts and will be sent as separate messages ("1 of 3", "1 of 2", etc.).
6 Click OK to save changes.
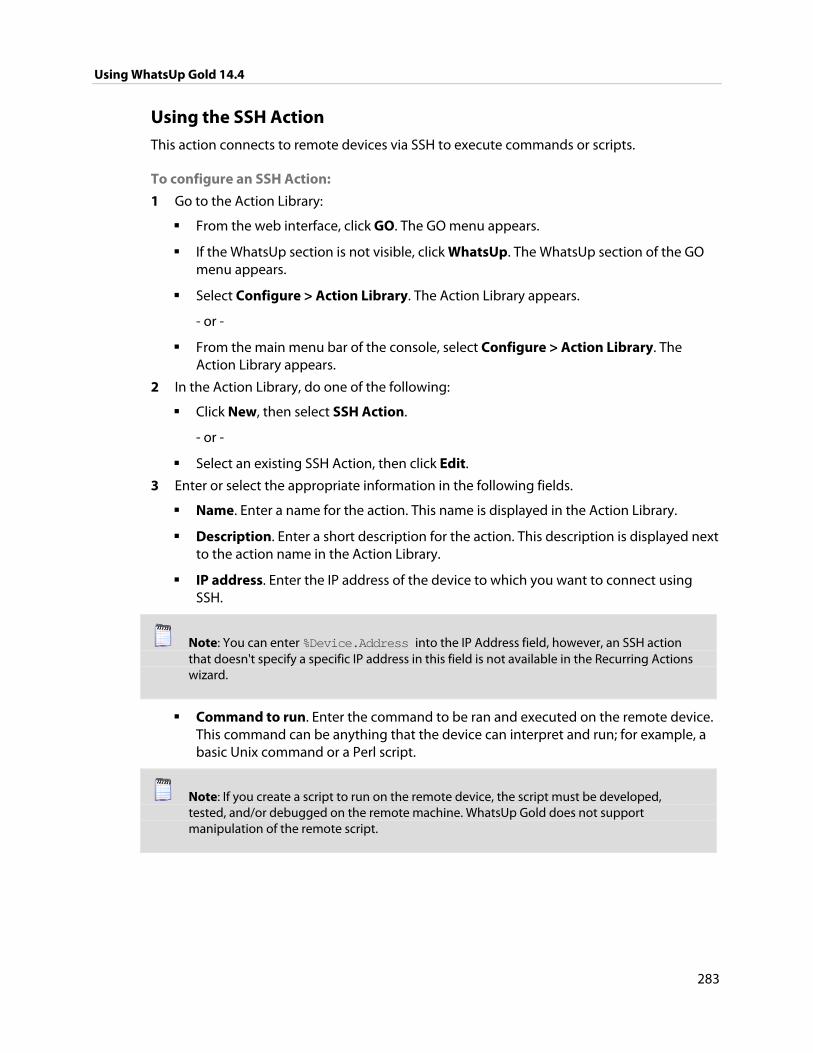
Using WhatsUp Gold 14.4
283
Using the SSH Action This action connects to remote devices via SSH to execute commands or scripts.
To configure an SSH Action:
1 Go to the Action Library:
From the web interface, click GO. The GO menu appears.
If the WhatsUp section is not visible, click WhatsUp. The WhatsUp section of the GO menu appears.
Select Configure > Action Library. The Action Library appears.
- or -
From the main menu bar of the console, select Configure > Action Library. The Action Library appears.
2 In the Action Library, do one of the following:
Click New, then select SSH Action.
- or -
Select an existing SSH Action, then click Edit.
3 Enter or select the appropriate information in the following fields.
Name. Enter a name for the action. This name is displayed in the Action Library.
Description. Enter a short description for the action. This description is displayed next to the action name in the Action Library.
IP address. Enter the IP address of the device to which you want to connect using SSH.
Note: You can enter %Device.Address into the IP Address field, however, an SSH action that doesn't specify a specific IP address in this field is not available in the Recurring Actions wizard.
Command to run. Enter the command to be ran and executed on the remote device. This command can be anything that the device can interpret and run; for example, a basic Unix command or a Perl script.
Note: If you create a script to run on the remote device, the script must be developed, tested, and/or debugged on the remote machine. WhatsUp Gold does not support manipulation of the remote script.
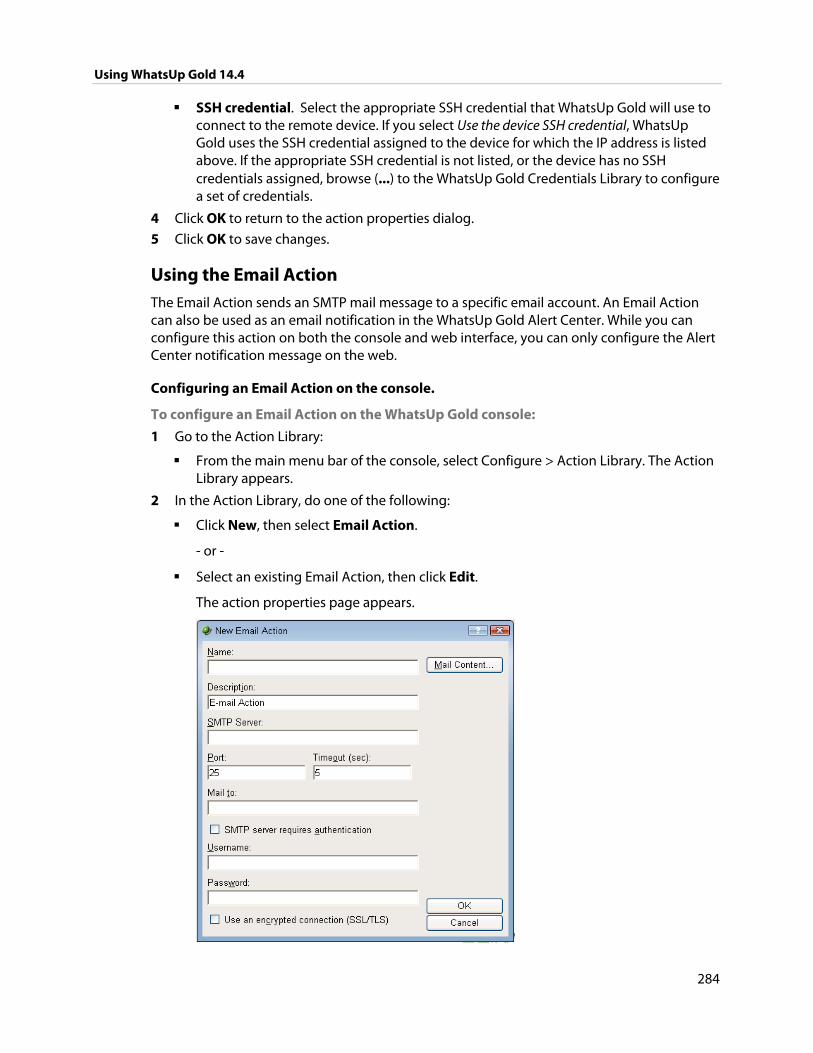
Using WhatsUp Gold 14.4
284
SSH credential. Select the appropriate SSH credential that WhatsUp Gold will use to connect to the remote device. If you select Use the device SSH credential, WhatsUp Gold uses the SSH credential assigned to the device for which the IP address is listed above. If the appropriate SSH credential is not listed, or the device has no SSH credentials assigned, browse (...) to the WhatsUp Gold Credentials Library to configure a set of credentials.
4 Click OK to return to the action properties dialog.
5 Click OK to save changes.
Using the Email Action The Email Action sends an SMTP mail message to a specific email account. An Email Action can also be used as an email notification in the WhatsUp Gold Alert Center. While you can configure this action on both the console and web interface, you can only configure the Alert Center notification message on the web.
Configuring an Email Action on the console.
To configure an Email Action on the WhatsUp Gold console:
1 Go to the Action Library:
From the main menu bar of the console, select Configure > Action Library. The Action Library appears.
2 In the Action Library, do one of the following:
Click New, then select Email Action.
- or -
Select an existing Email Action, then click Edit.
The action properties page appears.
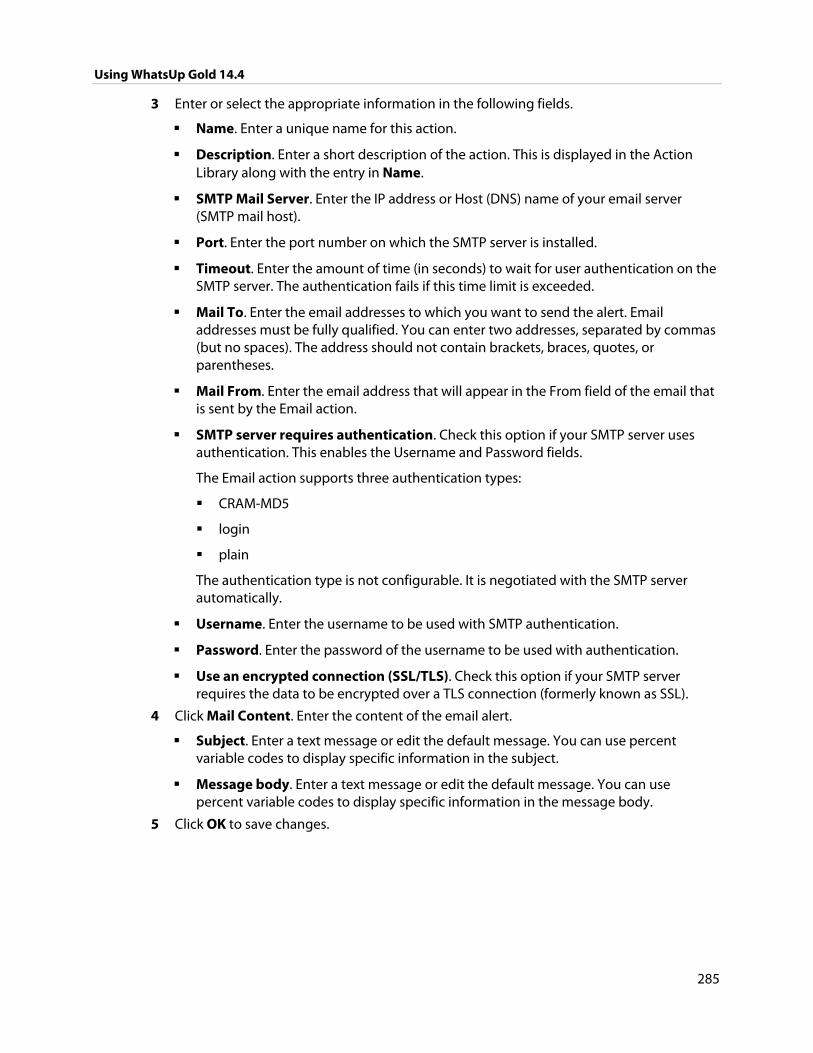
Using WhatsUp Gold 14.4
285
3 Enter or select the appropriate information in the following fields.
Name. Enter a unique name for this action.
Description. Enter a short description of the action. This is displayed in the Action Library along with the entry in Name.
SMTP Mail Server. Enter the IP address or Host (DNS) name of your email server (SMTP mail host).
Port. Enter the port number on which the SMTP server is installed.
Timeout. Enter the amount of time (in seconds) to wait for user authentication on the SMTP server. The authentication fails if this time limit is exceeded.
Mail To. Enter the email addresses to which you want to send the alert. Email addresses must be fully qualified. You can enter two addresses, separated by commas (but no spaces). The address should not contain brackets, braces, quotes, or parentheses.
Mail From. Enter the email address that will appear in the From field of the email that is sent by the Email action.
SMTP server requires authentication. Check this option if your SMTP server uses authentication. This enables the Username and Password fields.
The Email action supports three authentication types:
CRAM-MD5
login
plain
The authentication type is not configurable. It is negotiated with the SMTP server automatically.
Username. Enter the username to be used with SMTP authentication.
Password. Enter the password of the username to be used with authentication.
Use an encrypted connection (SSL/TLS). Check this option if your SMTP server requires the data to be encrypted over a TLS connection (formerly known as SSL).
4 Click Mail Content. Enter the content of the email alert.
Subject. Enter a text message or edit the default message. You can use percent variable codes to display specific information in the subject.
Message body. Enter a text message or edit the default message. You can use percent variable codes to display specific information in the message body.
5 Click OK to save changes.
Using WhatsUp Gold 14.4
286
Configuring an Email Action on the web interface
To configure an Email Action/Alert Center Notification on the WhatsUp Gold web interface:
1 Go to the Action Library:
From the web interface, click GO. The GO menu appears.
If the WhatsUp section is not visible, click WhatsUp. The WhatsUp section of the GO menu appears.
Select Configure > Action Library. The Action Library appears.
2 In the Action Library, do one of the following:
Click New, then select Email Action.
- or -
Select an existing Email Action, then click Edit.
The action properties page appears.
3 Enter or select the appropriate information in the following fields.
Specify a Name for the action as it will appear in the Action Libary.
Enter a short Description for the action. This description is displayed next to the action's name in the Action Library.
Tip: The New/Edit Email Action dialog contains three tabs. Select a tab to specify the appropriate tab-specific action settings.
The Configuration tab contains options pertaining to the action email's destination:
SMTP Mail Server. Enter the IP address or Host (DNS) name of your email server (SMTP mail host).
Port. Enter the port number on which the SMTP server is installed.
Timeout. Enter the amount of time (in seconds) to wait for user authentication on the SMTP server. The authentication fails if this time limit is exceeded.
Mail To. Enter the email addresses to which you want to send the alert. Email addresses must be fully qualified. You can enter two addresses, separated by commas (but no spaces). The address should not contain brackets, braces, quotes, or parentheses.
Mail From. Enter the email address that will appear in the From field of the email that is sent by the Email action.
Using WhatsUp Gold 14.4
287
SMTP server requires authentication. Check this option if your SMTP server uses authentication. This enables the Username and Password fields.
The Email action supports three authentication types:
CRAM-MD5
login
plain
The authentication type is not configurable. It is negotiated with the SMTP server automatically.
Username. Enter the username to be used with SMTP authentication.
Password. Enter the password of the username to be used with authentication.
Use an encrypted connection (SSL/TLS). Check this option if your SMTP server requires the data to be encrypted over a TLS connection (formerly known as SSL).
The Mail Content tab contains options pertaining to the message sent as the result of an active or passive monitor.
Subject. Enter a text message or edit the default message. You can use percent variable codes to display specific information in the subject.
Message body. Enter a text message or edit the default message. You can use percent variable codes to display specific information in the message body.
Tip: You can add a link to either or both the Device Status and Mobile Device Status reports by clicking the appropriate button.
The Alert Center Settings tab contains options pertaining to the message that is to be sent from an WhatsUp Gold Alert Center notification.
Alert Center Message Subject. Enter a subject for the message. This text appears as the subject in the email that is sent by the Alert Center notification. This subject can include percent variables.
Tip: To include Alert Center percent variables, right click inside the above field.
Alert Center Link
Select Include hyperlink to Alert Center in the email content to have a link to the Alert Center home page appear in the email message that is sent by the Alert Center notification.
Select to use either HTTP or HTTPS in the link address.
Select to either Use dynamic address or Use static hostname or IP address. If you select to use the dynamic address, WhatsUp Gold automatically renders the hostname or IP address at the time the action runs.
Specify the Hostname or IP address to include in the link address.
Using WhatsUp Gold 14.4
288
Specify the specific Port to include in the link address.
Important: The address you enter here must be the exact address of the Alert Center home page to which you want to connect. Verify the address and enter its exact contents in the above options.
4 Click OK to save changes.
Using an SNMP Set Action This action sends an SNMP Set to a device in order to change a specific SNMP action. You can configure SNMP Set Actions perform a number of tasks, including rebooting a device, changing the state of a network remotely, disabling or enabling a device feature, etc.
The SNMP Set Action can use any SNMP credential defined in the WhatsUp Gold Credential Library and supports all types of writable objects (strings, integers, timeticks, etc.).
If the action's operation fails, errors are reported to the Action Log.
To create an SNMP Set Action:
1 Go to the Action Library:
From the web interface, click GO. The GO menu appears.
If the WhatsUp section is not visible, click WhatsUp. The WhatsUp section of the GO menu appears.
Select Configure > Action Library. The Action Library appears.
- or -
From the main menu bar of the console, select Configure > Action Library. The Action Library appears.
2 In the Action Library, do one of the following:
Click New, then select SNMP Set Action.
- or -
Select an existing SNMP Set Action, then click Edit.
The action properties page appears.
3 Enter or select the appropriate information in the following fields.
Name. Enter a name for the monitor. This name is displayed in the Active Monitor Library.
Description. Enter a short description for the monitor. This description is displayed next to the monitor name in the Active Monitor Library.
IP address. Enter the IP address or hostname of the device to which the action to send the SNMP Set.
SNMP Credential. Select the SNMP credential that the action is to use. This list is populated with credentials currently configured in the Credentials Library.
Using WhatsUp Gold 14.4
289
Object Identifier. Enter the object identifier (OID) that the action is to use.
Instance. Enter the instance that coincides with the OID that the action is to use.
Tip: You can browse (...) to select both the OID and instance.
Type. Select the type of written object the action is to use.
Value. Enter a value for the type you have selected.
Note: The action only allows you to set one value at a time.
1 Click OK to save this action. The action now appears in the Action Library.
2 Assign the action to a device or a monitor. For more information, see Assigning an action to a device (on page 300) or Assigning an action to a monitor (on page 301).
Using the Syslog Action The Syslog Action sends a message to a host that is running a syslog server.
To configure a Syslog Action:
1 Go to the Action Library:
From the web interface, click GO. The GO menu appears.
If the WhatsUp section is not visible, click WhatsUp. The WhatsUp section of the GO menu appears.
Select Configure > Action Library. The Action Library appears.
- or -
From the main menu bar of the console, select Configure > Action Library. The Action Library appears.
2 In the Action Library, do one of the following:
Click New, then select Syslog Action.
- or -
Select an existing Syslog Action, then click Edit.
The action properties page appears.
Using WhatsUp Gold 14.4
290
3 Enter or select the appropriate information in the following fields.
Name. Enter a name for the action. This will appear in the Action Library.
Description. Enter a short description of the action. This is displayed in the Action Library along with the entry in Name.
Syslog Server. Enter the IP address of the machine that is running the Syslog server.
Port. Enter the UDP port that the Syslog listener is listening on. The default port is 514.
Message. Enter a text message to be sent to the Syslog server. This message may include notification variables. The Syslog message box limits input to 511 characters. If notification variables are used, then the message that actually gets sent will be limited to 1023 bytes, in order to comply with the Syslog protocol. Non-visible ASCII characters such as tabs and linefeeds will be replaced by space characters.
4 Click OK to save changes.
Using a Text-to-Speech Action The Text-To-Speech Action sends a text-to-speech notification to a specified computer.
Note: The Desktop Actions application must be running for the Sound and Text-to-Speech actions to work. For more information, see About the Task Tray and Desktop Actions applications (on page 20).
Note: If you want to bring the text-to-speech action sound to a Windows 2003 or Windows 2008 server class remote desktop (RDP) system, you need to enable audio mapping for the remote system's Terminal Services Configuration. 1. In Windows, click Start > Run, in the Run dialog enter TSCC.msc, then click OK. 2. In the Connections folder, double-click RDP-tcp. The RDP-TCP Properties dialog appears. 3. Select the Client Settings tab, then click to clear the Audio Mapping check box. When enabled, the text-to-speech action sound will only play on the remote desktop system.
To configure a Text-to-Speech Action:
1 Go to the Action Library:
From the web interface, click GO. The GO menu appears.
If the WhatsUp section is not visible, click WhatsUp. The WhatsUp section of the GO menu appears.
Select Configure > Action Library. The Action Library appears.
- or -
From the main menu bar of the console, select Configure > Action Library. The Action Library appears.
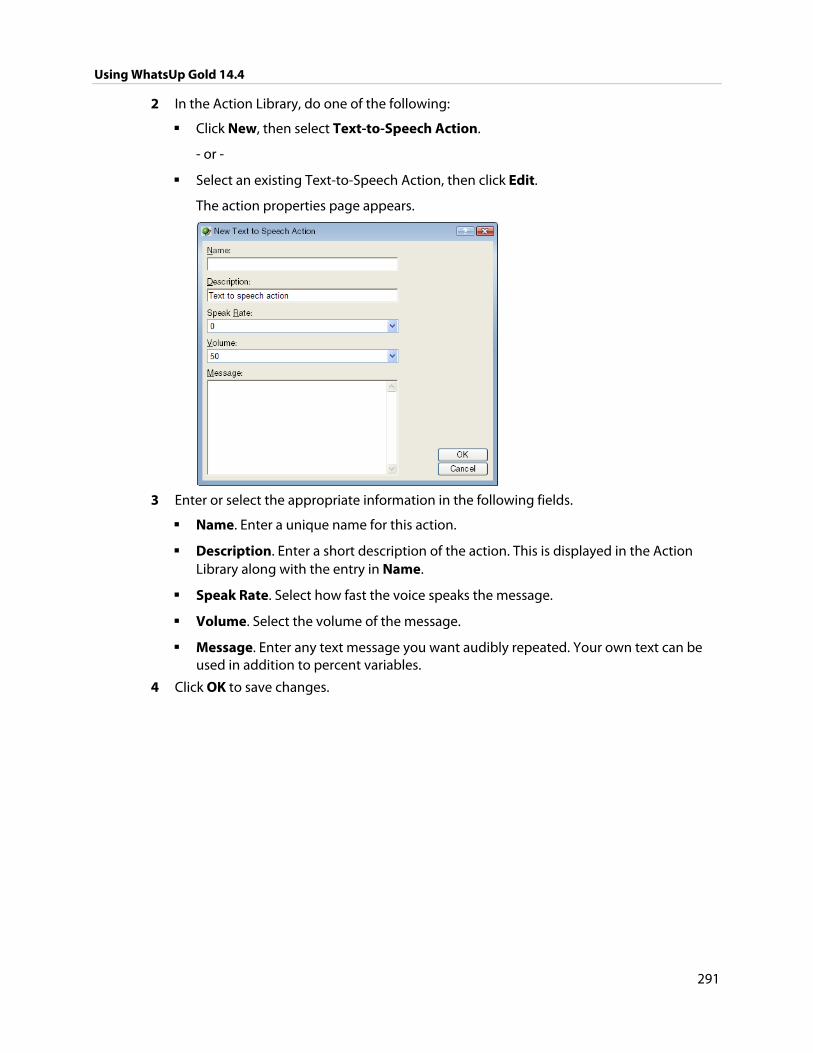
Using WhatsUp Gold 14.4
291
2 In the Action Library, do one of the following:
Click New, then select Text-to-Speech Action.
- or -
Select an existing Text-to-Speech Action, then click Edit.
The action properties page appears.
3 Enter or select the appropriate information in the following fields.
Name. Enter a unique name for this action.
Description. Enter a short description of the action. This is displayed in the Action Library along with the entry in Name.
Speak Rate. Select how fast the voice speaks the message.
Volume. Select the volume of the message.
Message. Enter any text message you want audibly repeated. Your own text can be used in addition to percent variables.
4 Click OK to save changes.
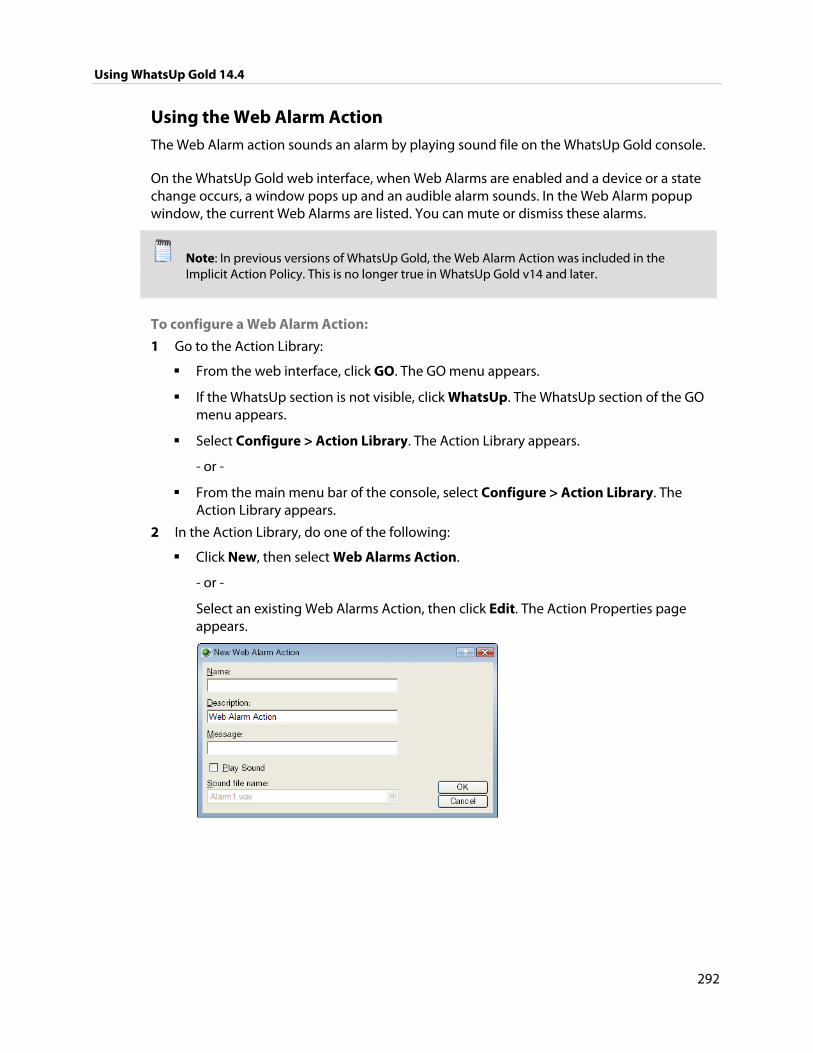
Using WhatsUp Gold 14.4
292
Using the Web Alarm Action The Web Alarm action sounds an alarm by playing sound file on the WhatsUp Gold console.
On the WhatsUp Gold web interface, when Web Alarms are enabled and a device or a state change occurs, a window pops up and an audible alarm sounds. In the Web Alarm popup window, the current Web Alarms are listed. You can mute or dismiss these alarms.
Note: In previous versions of WhatsUp Gold, the Web Alarm Action was included in the Implicit Action Policy. This is no longer true in WhatsUp Gold v14 and later.
To configure a Web Alarm Action:
1 Go to the Action Library:
From the web interface, click GO. The GO menu appears.
If the WhatsUp section is not visible, click WhatsUp. The WhatsUp section of the GO menu appears.
Select Configure > Action Library. The Action Library appears.
- or -
From the main menu bar of the console, select Configure > Action Library. The Action Library appears.
2 In the Action Library, do one of the following:
Click New, then select Web Alarms Action.
- or -
Select an existing Web Alarms Action, then click Edit. The Action Properties page appears.
Using WhatsUp Gold 14.4
293
3 Enter or select the appropriate information in the following fields.
Name. The name identifies the Web Alarm action in the Action Library list.
Description. A short description of the action. The description appears in the Action Library list.
Message. Enter a short message to send to the visual cue part of the Web Alarm in the web interface. You can use percent variable codes to display specific information in the message body.
Play Sound. Select this option to play the sound file whenever a web alarm action is fired. Clear this option to only have the visual cue appear in the Web Interface.
Sound file name. Select a sound file that has been installed in your \Program Files\Ipswitch\WhatsUp\HTML\1033\NMconsole\WebSounds directory. Custom sounds added to this directory appear in the drop-down list.
Note: For Web Alarms to work properly, your browser must support embedded sound files.
4 Click OK to save changes.
The Web Alarm popup window
When a Web Alarm Action is fired, and you are logged in to the WhatsUp Gold web interface, the Web Alarm popup box appears in your browser. From here, you dismiss one or all of the alarms listed. You can also mute them. Muting an alarm leaves the alarm listed, but stops the alarm from sounding.
Note: You cannot disable Web Alarms from the popup window.
Note: If there are web alarms in the list with different sounds configured for each, the oldest web alarm's sound takes priority. To hear a new or different sound for a web alarm, dismiss the previous web alarm from the list.
If you'd like more information on one of the devices listed in the popup window, you can double-click the device to bring up its Device Status Workspace.
Note: In order for a WhatsUp Gold user to view the Web Alarm popup window and hear the alarm that sounds, a user account must have the Manage Devices user right enabled. For more information, see About user rights (on page 77).
Enabling and disabling Web Alarms
While you can mute and dismiss Web Alarms from the Web Alarms popup window, you cannot disable, or turn them off, from here. Instead, you enable and disable Web Alarms on the web interface on the User Preferences dialog (Select GO. From the WhatsUp section, select Configure > Preferences). Also from the User Preferences dialog, you can adjust the Web Alarms refresh interval. The refresh interval indicates the number of seconds WhatsUp Gold waits until checking for new Web Alarms.
Using WhatsUp Gold 14.4
294
By default, Web Alarms are enabled on the web interface with a refresh interval of 120 seconds.
Accessing Web Alarms on the web interface
There are two places users can access Web Alarms from the WhatsUp Gold web interface:
The Web Alarm window. This appears when Web Alarms are enabled and a Web Alarm Action is fired. You can also access this window by selecting GO, then from the WhatsUp section, selecting Devices > Web Alarms.
The Web Alarm workspace report. This is a default workspace report located on the Problem Areas 1 workspace view of the Home Workspace.
Another way of listing and accessing your network's Web Alarms is creating a Dynamic Group which lists all of the current Web Alarms. For more information on Dynamic Groups in WhatsUp Gold, please see Using Dynamic Groups.
Using the Windows Event Log Action The Windows Event Log Action uses Percent Variables to gather information about your network devices and logs messages to the Windows Event Viewer dependent on the Percent Variable results. You can select to have messages logged as error, warning, or informational messages. You can easily sort messages in the Windows Event Viewer by the source that you specify in the action.
This action is useful to use if you typically check the Windows Event Viewer for network messages, as an alternative to receiving an email or SMS alert.
To configure a Windows Event Log Action:
1 Go to the Action Library:
From the web interface, click GO. The GO menu appears.
If the WhatsUp section is not visible, click WhatsUp. The WhatsUp section of the GO menu appears.
Select Configure > Action Library. The Action Library appears.
- or -
From the main menu bar of the console, select Configure > Action Library. The Action Library appears.
2 In the Action Library, do one of the following:
Click New, then select Windows Event Log.
- or -
Select an existing Windows Event Log Action, then click Edit. The action properties page appears.
Using WhatsUp Gold 14.4
295
3 Specify or select the appropriate information in the dialog fields.
Specify a Name for the action as it will appear in the Action Library.
Specify a short Description for the action as it will appear in the Action Library.
Specify the Source for the messages that are logged to the Windows Event Viewer. The default source is the Ipswitch WhatsUp Log Action.
Specify the Event ID for the messages that are logged to the Windows Event Viewer. The default event ID is 1000, the WhatsUp engine event ID.
Select the Level for which messages are logged to the Windows Event Viewer. You can select either Error, Warning, or Information. The default level is Error.
Enter the Log Message that will display in the Windows Event Viewer. This message supports percent variables. The default log message is: %Device.ActiveMonitorDownNames is %Device.State on %Device.Type: %Device.HostName (%Device.Address).
Details:
Monitors that are down include: %Device.ActiveMonitorDownNames
Monitors that are up include: %Device.ActiveMonitorUpNames
Notes on this device (from device property page):
%Device.Notes
----------------------------------------
This message was logged on %System.Date at %System.Time
Ipswitch WhatsUp Gold
Tip: Right-click in the Log Message field to select the percent variables you would like to use in the action.
4 Click OK to save changes.
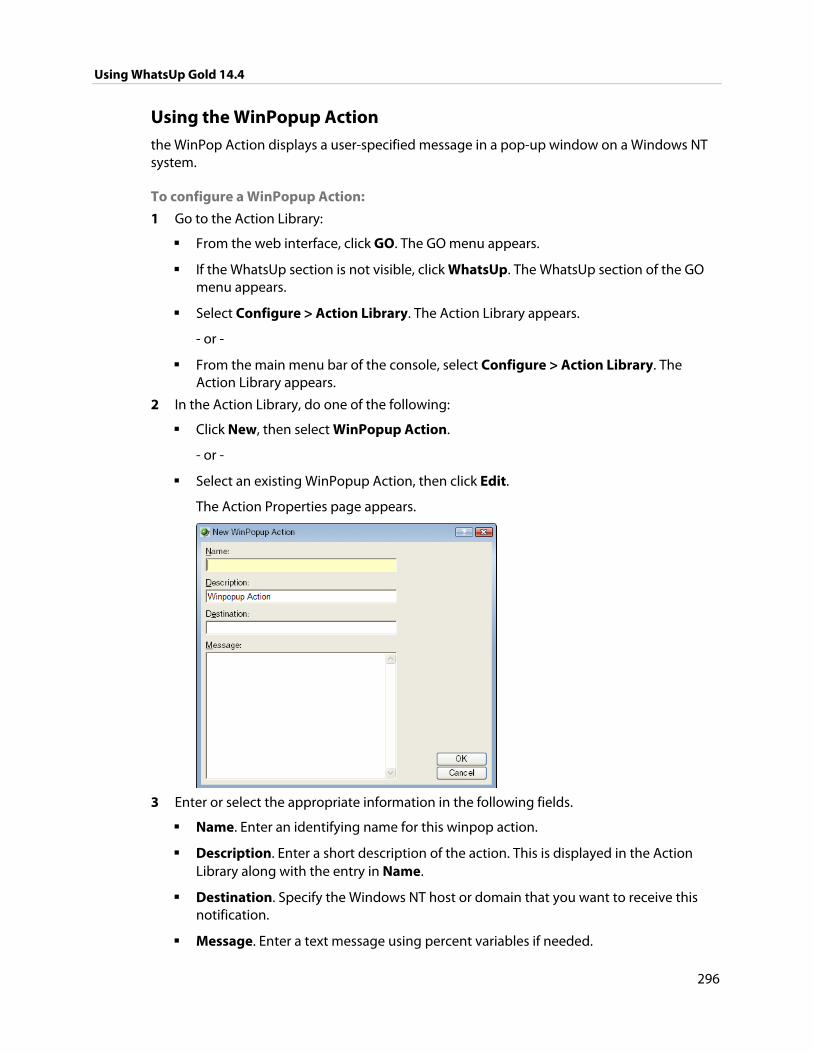
Using WhatsUp Gold 14.4
296
Using the WinPopup Action the WinPop Action displays a user-specified message in a pop-up window on a Windows NT system.
To configure a WinPopup Action:
1 Go to the Action Library:
From the web interface, click GO. The GO menu appears.
If the WhatsUp section is not visible, click WhatsUp. The WhatsUp section of the GO menu appears.
Select Configure > Action Library. The Action Library appears.
- or -
From the main menu bar of the console, select Configure > Action Library. The Action Library appears.
2 In the Action Library, do one of the following:
Click New, then select WinPopup Action.
- or -
Select an existing WinPopup Action, then click Edit.
The Action Properties page appears.
3 Enter or select the appropriate information in the following fields.
Name. Enter an identifying name for this winpop action.
Description. Enter a short description of the action. This is displayed in the Action Library along with the entry in Name.
Destination. Specify the Windows NT host or domain that you want to receive this notification.
Message. Enter a text message using percent variables if needed.
Using WhatsUp Gold 14.4
297
Refresh. Click this button to refresh the Destination list. This populates the list with all of the targets you can choose in which to send a winpop action.
4 Click OK to save changes.
About Percent Variables Percent variables allow you to customize the message notification sent from an action.
These variables can be used in all of the WhatsUp Gold actions, though we do not recommend that you use them in the Active Script Action, as they may cause the action's code to break.
Percent Variables You can customize an action's message by adding any of the percent variables in the following table.
Note: We do not recommend that you use percent variables in script text (Active Script Action), because they may resolve to text containing special characters (' ' (quotes), " " (double-quotes), % (percent), new line characters, and the like) that may break your script.
Active Monitor Variables Description
%ActiveMonitor.Argument SNMP instance number. This is only used when an action is associated directly with an active monitor, and not the device as a whole.
%ActiveMonitor.Comment The human readable name that coincides with the network switch. This is only used when an action is associated directly with an active monitor, and not the device as a whole.
%ActiveMonitor.Name
The name of the active monitor that fired an action. This is only used when an action is associated directly with an active monitor, and not the device as a whole.
%ActiveMonitor.NetworkInterfaceAddress IP address for the network interface. This is only used when an action is associated directly with an active monitor, and not the device as a whole.
%ActiveMonitor.Payload The payload returned by a WMI, Exchange, SQL, SNMP or Active Script active monitor. This is only used when an action is associated directly with an active monitor and not the devices as a whole.
For Active Script Active Monitors, the payload is the text that is passed to the SetResult() method in the script.
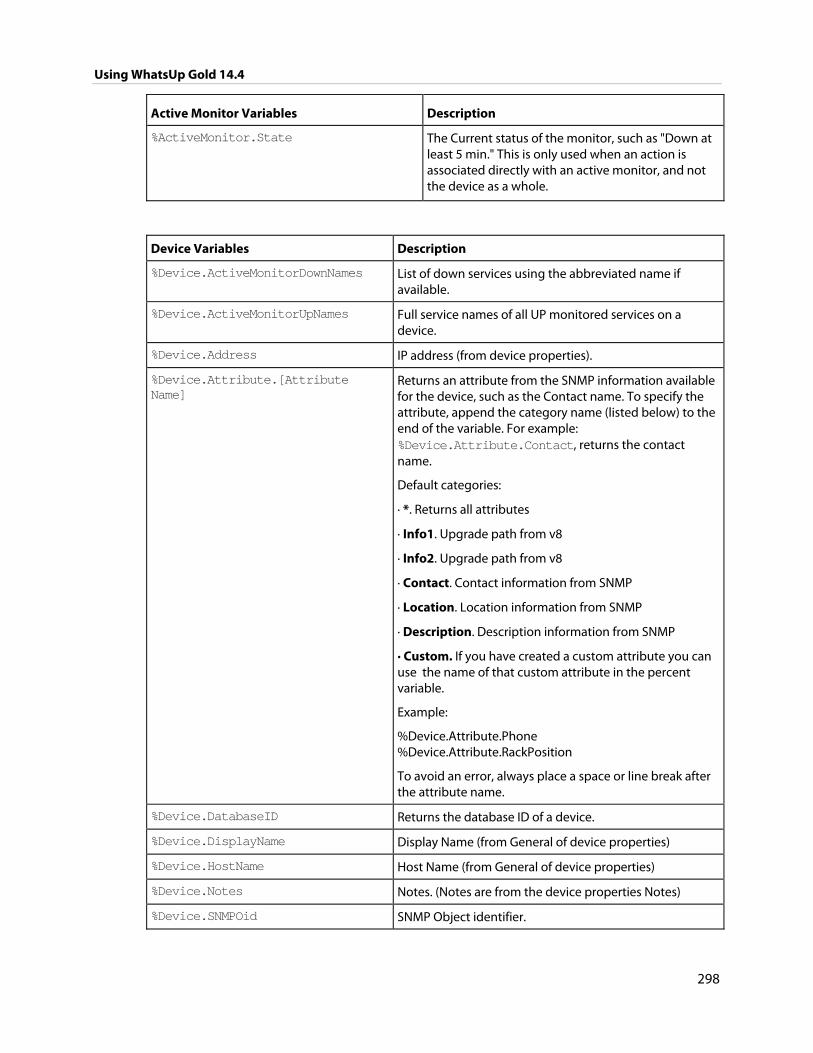
Using WhatsUp Gold 14.4
298
Active Monitor Variables Description
%ActiveMonitor.State
The Current status of the monitor, such as "Down at least 5 min." This is only used when an action is associated directly with an active monitor, and not the device as a whole.
Device Variables Description
%Device.ActiveMonitorDownNames List of down services using the abbreviated name if available.
%Device.ActiveMonitorUpNames Full service names of all UP monitored services on a device.
%Device.Address IP address (from device properties).
%Device.Attribute.[Attribute Name]
Returns an attribute from the SNMP information available for the device, such as the Contact name. To specify the attribute, append the category name (listed below) to the end of the variable. For example: %Device.Attribute.Contact, returns the contact name.
Default categories:
· *. Returns all attributes
· Info1. Upgrade path from v8
· Info2. Upgrade path from v8
· Contact. Contact information from SNMP
· Location. Location information from SNMP
· Description. Description information from SNMP
· Custom. If you have created a custom attribute you can use the name of that custom attribute in the percent variable.
Example:
%Device.Attribute.Phone %Device.Attribute.RackPosition
To avoid an error, always place a space or line break after the attribute name.
%Device.DatabaseID Returns the database ID of a device.
%Device.DisplayName Display Name (from General of device properties)
%Device.HostName Host Name (from General of device properties)
%Device.Notes Notes. (Notes are from the device properties Notes)
%Device.SNMPOid SNMP Object identifier.
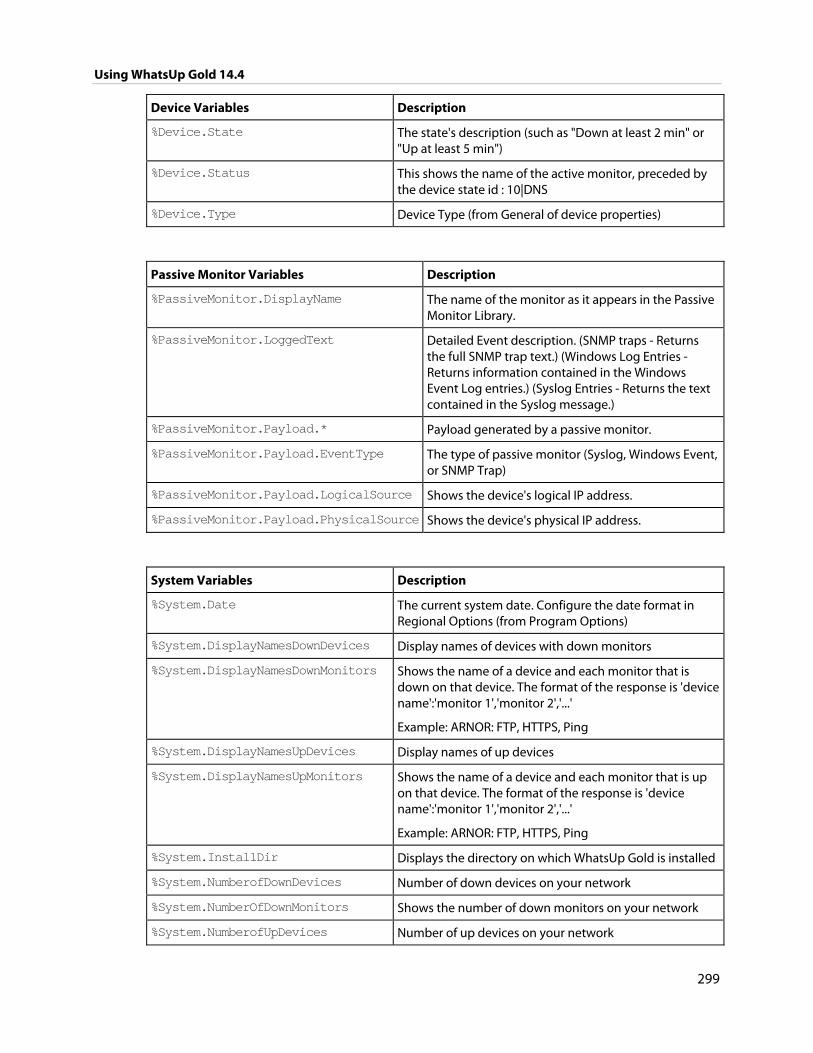
Using WhatsUp Gold 14.4
299
Device Variables Description
%Device.State The state's description (such as "Down at least 2 min" or "Up at least 5 min")
%Device.Status This shows the name of the active monitor, preceded by the device state id : 10|DNS
%Device.Type Device Type (from General of device properties)
Passive Monitor Variables Description
%PassiveMonitor.DisplayName The name of the monitor as it appears in the Passive Monitor Library.
%PassiveMonitor.LoggedText Detailed Event description. (SNMP traps - Returns the full SNMP trap text.) (Windows Log Entries - Returns information contained in the Windows Event Log entries.) (Syslog Entries - Returns the text contained in the Syslog message.)
%PassiveMonitor.Payload.* Payload generated by a passive monitor.
%PassiveMonitor.Payload.EventType The type of passive monitor (Syslog, Windows Event, or SNMP Trap)
%PassiveMonitor.Payload.LogicalSource Shows the device's logical IP address.
%PassiveMonitor.Payload.PhysicalSource Shows the device's physical IP address.
System Variables Description
%System.Date The current system date. Configure the date format in Regional Options (from Program Options)
%System.DisplayNamesDownDevices Display names of devices with down monitors
%System.DisplayNamesDownMonitors
Shows the name of a device and each monitor that is down on that device. The format of the response is 'device name':'monitor 1','monitor 2','...'
Example: ARNOR: FTP, HTTPS, Ping
%System.DisplayNamesUpDevices Display names of up devices
%System.DisplayNamesUpMonitors Shows the name of a device and each monitor that is up on that device. The format of the response is 'device name':'monitor 1','monitor 2','...'
Example: ARNOR: FTP, HTTPS, Ping
%System.InstallDir Displays the directory on which WhatsUp Gold is installed
%System.NumberofDownDevices Number of down devices on your network
%System.NumberOfDownMonitors Shows the number of down monitors on your network
%System.NumberofUpDevices Number of up devices on your network
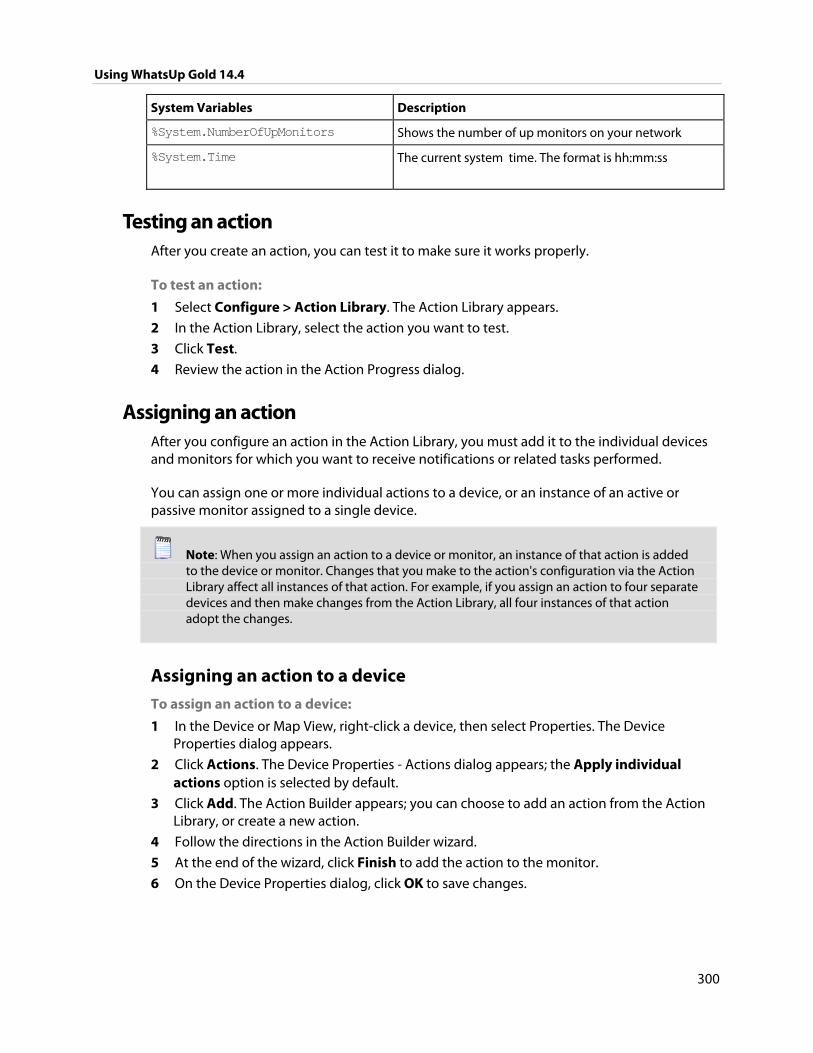
Using WhatsUp Gold 14.4
300
System Variables Description
%System.NumberOfUpMonitors Shows the number of up monitors on your network
%System.Time The current system time. The format is hh:mm:ss
Testing an action After you create an action, you can test it to make sure it works properly.
To test an action:
1 Select Configure > Action Library. The Action Library appears.
2 In the Action Library, select the action you want to test.
3 Click Test.
4 Review the action in the Action Progress dialog.
Assigning an action After you configure an action in the Action Library, you must add it to the individual devices and monitors for which you want to receive notifications or related tasks performed.
You can assign one or more individual actions to a device, or an instance of an active or passive monitor assigned to a single device.
Note: When you assign an action to a device or monitor, an instance of that action is added to the device or monitor. Changes that you make to the action's configuration via the Action Library affect all instances of that action. For example, if you assign an action to four separate devices and then make changes from the Action Library, all four instances of that action adopt the changes.
Assigning an action to a device
To assign an action to a device:
1 In the Device or Map View, right-click a device, then select Properties. The Device Properties dialog appears.
2 Click Actions. The Device Properties - Actions dialog appears; the Apply individual actions option is selected by default.
3 Click Add. The Action Builder appears; you can choose to add an action from the Action Library, or create a new action.
4 Follow the directions in the Action Builder wizard.
5 At the end of the wizard, click Finish to add the action to the monitor.
6 On the Device Properties dialog, click OK to save changes.
Using WhatsUp Gold 14.4
301
Assigning an action to an active monitor As you configure active monitors for a device, you have the opportunity to assign actions, however it is not require that you assign them at that time. If you decide to assign an action to the monitor at a later time, you can do so through the device's Properties.
To assign an action to an active monitor:
1 In the Device or Map View, right-click a device, then select Properties. The Device Properties dialog appears.
2 Click Active Monitors. The Device Properties - Active Monitors dialog appears.
3 Select the monitor to which you would like to assign an action, then click Edit. The monitor properties dialog appears; the Apply individual actions option is selected by default.
4 Click Add. The Action Builder appears; you can choose to add an action from the Action Library, or create a new action.
5 Follow the directions in the Action Builder wizard.
6 At the end of the wizard, click Finish to add the action to the monitor.
7 On the Device Properties dialog, click OK to save changes.
Assigning an action to a passive monitor As you configure passive monitors for a device, you have the opportunity to assign actions, however it is not require that you assign them at that time. If you decide to assign an action to the monitor at a later time, you can do so through the device's Properties.
To assign an action to a passive monitor:
1 In the Device or Map View, right-click a device, then select Properties. The Device Properties dialog appears.
2 Click Passive Monitors. The Device Properties -Passive Monitors dialog appears.
3 Select the monitor to which you would like to assign an action, then click Edit. The monitor properties dialog appears.
4 Click Add. The Action Builder appear.
5 Select the action you would like to assign to the monitor.
6 Optionally, create a Blackout Schedule.
7 Click OK to add the action to the monitor.
Using WhatsUp Gold 14.4
302
Removing an action Because actions are assigned to devices and monitors on an individual basis, actions can only be removed on the device- and monitor-level, and must be deleted from the Action Library. Additionally, if you have assigned action policies to your devices, you can remove the action from the policy itself.
When you remove an action from a device or monitor, the action still exists in the Active Monitor Library and is available for use with other devices and monitors. When you delete an action, you remove it from the database, and from all devices and monitors to which it is assigned; further, all report data related to the action is lost. Therefore, we recommend that you only delete an action when you are absolutely positive that you will not use it in the future, and feel that the related report data is not useful to your monitoring records.
Removing an action from a device
To remove an action from a device:
1 From Device or Map View, right-click the device from which you want to remove the active monitor, then click Properties. The Device Properties dialog appears.
2 Click Actions. The Device Properties - Actions dialog appears.
3 Select the action you want to remove, then click Remove. A dialog appears and asks you if you are sure you want to remove the action.
4 Click OK to remove the action.
Removing an action from an active monitor
To remove an action from an active monitor:
1 From the Device or Map View, right-click the device from which you want to remove the action, then click Properties. The Device Properties dialog appears.
2 Click Active Monitors. The Device Properties - Active Monitors dialog appears.
3 Select the monitor from which you want to remove the associated action, then click Edit. The Active Monitor Properties dialog appears.
4 Click Next. The Actions associated with the active monitor are listed.
5 Select the action you want to remove, then click Remove. A dialog appears and asks you if you are sure you want to remove the action.
6 Click Yes to remove the action, then click Finish.
Removing an action from a passive monitor
To remove an action from a passive monitor:
1 From the Device or Map View, right-click the device from which you want to remove the action, then click Properties. The Device Properties dialog appears.
2 Click Passive Monitors. The Device Properties - Passive Monitors dialog appears.
3 Select the monitor from which you want to remove the associated action, then click Edit. The Passive Monitor Properties dialog appears.
Using WhatsUp Gold 14.4
303
4 Under Actions for this passive monitor, select the action that you would like to remove, then click Remove. A dialog appears and asks you if you are sure you want to remove the action.
5 Click OK to remove the action.
Creating a Blackout Period You can create a Blackout Period to have WhatsUp Gold suspend specific actions during a scheduled period of time. Use this feature to keep from sending a notification to someone who is on vacation, or to keep from sounding a Web Alarm when there is no one near-by to hear the alert.
Note: Polling dependencies & blackouts only apply to the collection of device active monitors.
To create a Blackout period:
1 On the device from which you want to create a Blackout Period, right-click, then select Properties. The Device Properties dialog appears.
2 Click Actions. The Device Properties - Actions dialog appears.
3 Select the action for which you want to create the Blackout Period, then click Edit. The monitor properties dialog appears.
4 Click Edit. The Action Builder appears.
5 Click Blackout Period. The Weekly Blackout Schedule dialog appears.
6 Set the times for which you want the blackout to occur.
Note: The schedule that you set is repeated weekly.
7 Click OK.
About Action Policies Action policies allow you to group, or sequence, multiple actions together for use on any device or monitor.
If you make changes to actions in a policy, the changes are applied to all of the devices and monitors that use that particular policy.
For more information, see:
Creating an action policy (on page 304)
Editing action policies (on page 305)
Implicit Action Policy (on page 305)
Using WhatsUp Gold 14.4
304
Creating an action policy
To create an action policy:
1 Open the Action Policies dialog.
From the web interface, click GO. The GO menu appears.
If the WhatsUp section is not visible, click WhatsUp. The WhatsUp section of the GO menu appears.
Select Configure > Action Policies.
- or -
From the main menu on the console, select Configure > Action Policies. The Action Policies dialog appears.
2 Click New. The New Action Policy dialog appears.
3 Enter a name in Policy name. This name is used to identify the policy later, so you should make sure the name is something that will help you remember what is contained in this policy.
4 Click Add. The Action Builder wizard appears.
5 Follow the directions in the wizard.
6 Click Finish at the end of the wizard to add the action to the policy.
7 Add as many actions as you need to complete the policy. You can move actions up and down in the list by clicking Up and Down above the action list.
If you select Only execute first action, WhatsUp Gold executes the actions in the list for each state, starting at the top, and stops as soon as an action successfully fires.
8 After you have added all of the you would like for the policy, click OK to create the policy and add it to the active list.
Note: During Device Discovery, you can assign an existing action policy (if one has been created previously), create a simple action policy through a wizard, or access the Action Policy Editor to create an action policy yourself.
Assigning an action policy
To assign an action policy to a device:
1 In Device or Map View, right-click a device, then click Properties. The Device Properties dialog appears.
2 Click Actions. The Actions dialog appears.
3 Select Apply this Action Policy.
4 Select the action policy you want to use for this device. If you need to create a new action policy first, click Add to access the Action Builder dialog.
5 Click OK to save changes.
After an action has been added to the device, the action fires when that device reaches the specified state.
Using WhatsUp Gold 14.4
305
Editing action policies When you make changes to an action policy, all devices and monitors currently assigned to use the policy adopt these changes.
To edit an action policy:
1 Open the Action Policies dialog.
From the web interface, click GO. The GO menu appears.
If the WhatsUp section is not visible, click WhatsUp. The WhatsUp section of the GO menu appears.
Select Configure > Action Policies.
- or -
From the main menu of the console, Configure > Action Policies. The Action Policies dialog appears.
2 Select the policy you want to modify, then click Edit.
3 Make changes to the policy as necessary.
4 Click OK.
Implicit action policy The Implicit Action policy automatically assigns actions to all devices in your database. You cannot opt out of the Implicit Action policy.
Note: The Implicit Action Policy only assigns actions to devices. You must create separate action policies for device monitors.
If at any time during the normal operation of WhatsUp Gold you notice that actions are firing and you cannot find the action associated to the down device or monitor, remember to check the Implicit Action Policy.
Note: In previous versions of WhatsUp Gold, the Web Alarm action was included in the Implicit Action Policy. This is no longer true in Ipswitch WhatsUp Gold. For more information on the Web Alarm action, see About Web Alarms.
To configure the Implicit Action Policy
1 Open the Action Policies dialog.
From the web interface, click GO. The GO menu appears.
If the WhatsUp section is not visible, click WhatsUp. The WhatsUp section of the GO menu appears.
Select Configure > Action Policies.
- or -
Using WhatsUp Gold 14.4
306
From the main menu on the console, select Configure > Action Policies.
The Action Policies dialog appears.
2 Select the Implicit Action Policy, then click Edit. The Edit Action Policy dialog appears.
To add an action to the policy, click Add.
To modify an action in the policy, select it, then click Edit.
To delete an action from the policy, select it, then click Remove.
To have WhatsUp Gold execute only the first action in the list for each state, and stop when that action fires successfully, select Only execute first action.
Tip: Use Up and Down to modify an action's placement in the list.
3 Click OK to save changes.
Example: getting an Email alert when the Web server fails This example shows how to set up monitoring for your Web server so that an email alert is sent when the Web server fails, or when Web content is not available.
First, you need to set up the monitors for your Web server. Then, create an Email Action and assign it to the monitors.
Setting up monitors for a Web server and creating an Email Action that is assigned to monitors:
1 Open the properties for your Web server device:
In either Device or Map View, right-click on the web server device, then select Properties. The Device Properties dialog appears.
2 Click Active Monitors. The Device Properties - Active Monitors dialog appears.
3 Click Add. The Select Active Monitor Type dialog appears.
4 Use the following dialogs to add the HTTP active monitor to your Web server device; this monitor checks that HTTP (port 80) is active.
a) On the Select Active Monitor Type dialog, select HTTP, then click Next. The Set Polling Properties dialog appears.
b) Ensure that the default settings are selected (Enable polling for this Active Monitor and Use default network interface), then click Next. The Setup Actions for Monitor State Changes dialog appears.
c) Select Apply individual actions, then click Add. The Select or Create Action dialog appears.
d) Select Create a new action, then click Next. The Select Action Type dialog appears.
e) In the Select the actions type to create list, select E-Mail Action, then click Next. The Select State Change dialog appears.
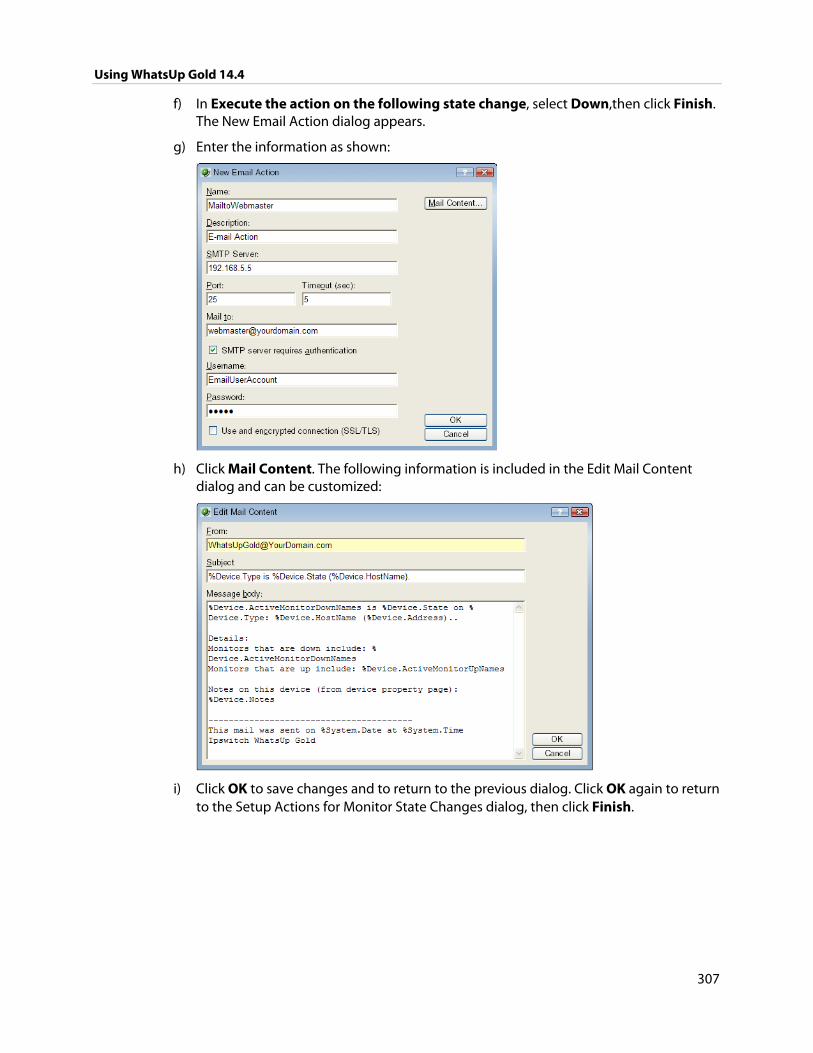
Using WhatsUp Gold 14.4
307
f) In Execute the action on the following state change, select Down,then click Finish. The New Email Action dialog appears.
g) Enter the information as shown:
h) Click Mail Content. The following information is included in the Edit Mail Content dialog and can be customized:
i) Click OK to save changes and to return to the previous dialog. Click OK again to return to the Setup Actions for Monitor State Changes dialog, then click Finish.
Using WhatsUp Gold 14.4
308
Setting up an HTTP Content active monitor with an email alert:
1 Open device properties for your Web server device:
In either Device or Map View, right-click on the web server device, then select Properties. The Device Properties dialog appears.
2 Click Active Monitors. The Device Properties - Active Monitors dialog appears.
3 Click Add. The Select Active Monitor Type dialog appears.
4 Use the same process to add the HTTP Content active monitor; this monitor checks that the Web server returns valid content in response to an HTTP request.
a) On the Select Active Monitor Type dialog, select HTTP Content, then click Next. The Set Polling Properties dialog appears.
b) Ensure that the default settings are selected (Enable polling for this Active Monitor and Use default network interface), then click Next. The Setup Actions for Monitor State Changes dialog appears.
c) Select Apply individual actions, then click Add. The Select or Create Action dialog appears.
d) Select Select an action from the Action Library, then click Next. The Select Action and State dialog appears.
e) Under Select an action from th Action Library, select MailtoWebmaster. Under Execute the actions on the following state change, select Down, then click Finish to save the changes and return to the Setup Actions for Monitor State Changes dialog.
f) On the Select Action and State dialog, select MailtoWebmaster, then click Finish to save the changes and return to the Setup Actions for Monitor State Changes dialog.
g) Click Finish.
The two active monitors and resulting email actions are now enabled.
When the Web server is down, the HTTP Active Monitor fails and triggers the Email Action, which sends an email message similar to the following:
Web1 is down on server: web1.YourDomain.com (192.168.5.5)
Details:
Monitors that are down include:
Monitors that are up include:
HTTP Content
Notes on this device (from device property page):
Lamar Bldg; 2nd floor
-----------------------
This mail was sent on 11/28/2007 at 15:34:01
Ipswitch WhatsUp Gold
Using WhatsUp Gold 14.4
309
If the Web server cannot return web content, the Email Action report reads:
HTTP Content is down on server: web1.YourDomain.com (192.168.5.5)
Any details or notes specified in the action are also reported.
Using Scripting Actions Active Script Actions can be configured to trigger when an active monitor's state changes. They can be programmed to perform a variety of tasks, from running automated remediation scripts to posting data to external, third party services via API.
Note: Please be aware that Ipswitch does not support the custom scripts that you create; only the ability to use them in the Active Script Monitor.
For more information, see Extending WhatsUp Gold with scripting (on page 493).
310
CHAPTER 18
Using Performance Monitors
In This Chapter
Performance monitors overview ................................................................ 310
About the Performance Monitor Library .................................................. 311
Configuring performance monitors .......................................................... 312
Enabling global performance monitors ................................................... 317
Enabling SNMP on Windows devices ........................................................ 318
Using the Active Script Performance Monitor ....................................... 329
About performance reporting ..................................................................... 330
Performance monitors overview Performance monitors are the WhatsUp Gold feature responsible for gathering data about several performance components of the devices running on your network, for example CPU and Memory utilization. The data is then used to create reports that trend utilization and availability of these device components.
WhatsUp Gold performance monitors gather data from the following five device components:
CPU utilization
Disk utilization
Interface utilization
Memory utilization
Ping latency and availability
Additionally, you can create custom performance monitors to track specific performance monitors for APC UPS, Printer, Active Script, SNMP, SSH, and WMI performance counters.
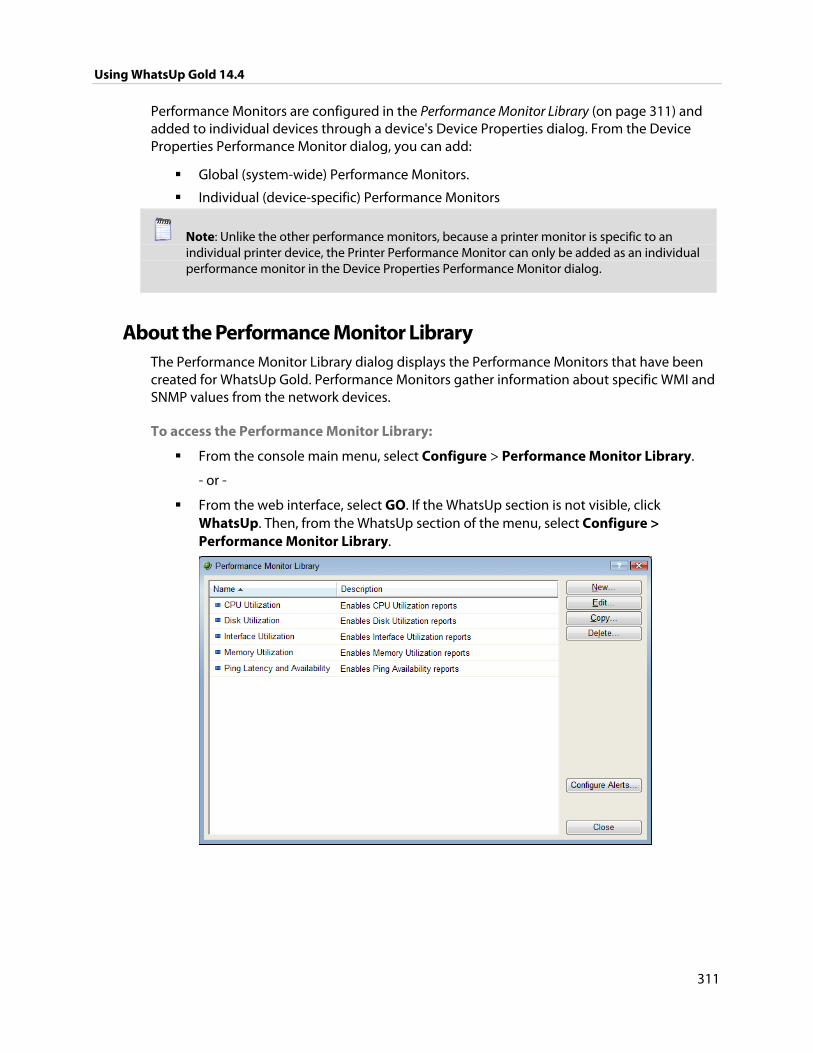
Using WhatsUp Gold 14.4
311
Performance Monitors are configured in the Performance Monitor Library (on page 311) and added to individual devices through a device's Device Properties dialog. From the Device Properties Performance Monitor dialog, you can add:
Global (system-wide) Performance Monitors.
Individual (device-specific) Performance Monitors
Note: Unlike the other performance monitors, because a printer monitor is specific to an individual printer device, the Printer Performance Monitor can only be added as an individual performance monitor in the Device Properties Performance Monitor dialog.
About the Performance Monitor Library The Performance Monitor Library dialog displays the Performance Monitors that have been created for WhatsUp Gold. Performance Monitors gather information about specific WMI and SNMP values from the network devices.
To access the Performance Monitor Library:
From the console main menu, select Configure > Performance Monitor Library.
- or -
From the web interface, select GO. If the WhatsUp section is not visible, click WhatsUp. Then, from the WhatsUp section of the menu, select Configure > Performance Monitor Library.
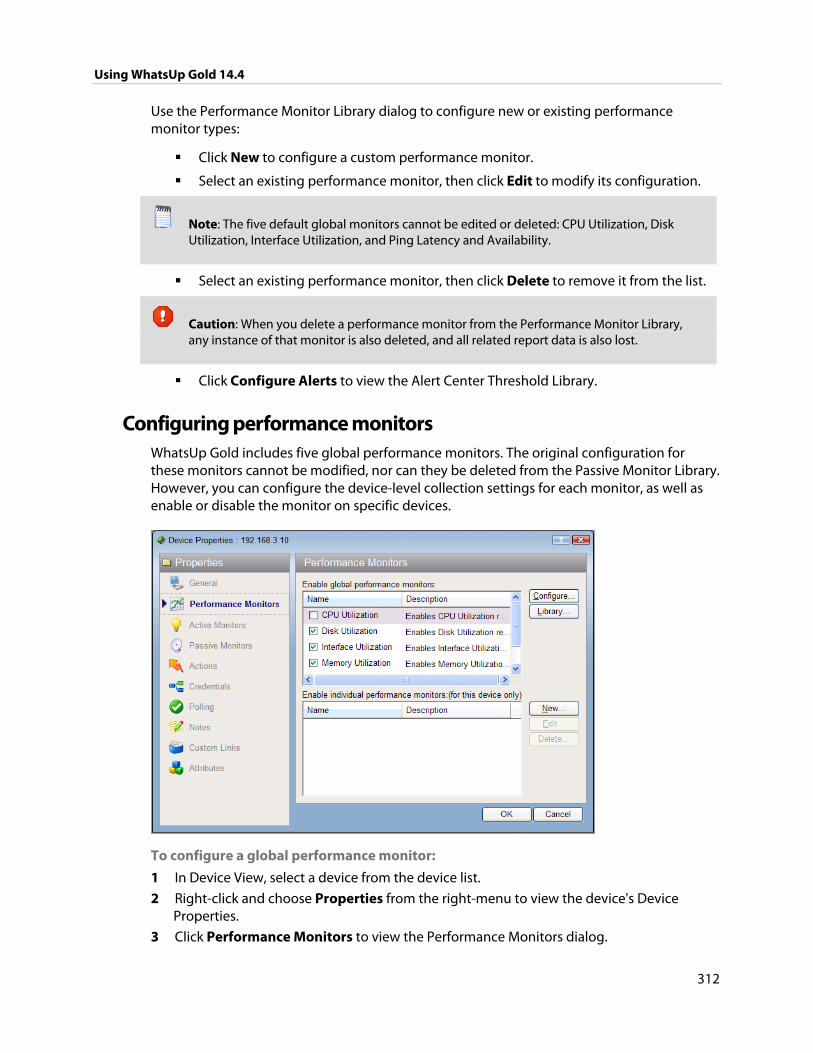
Using WhatsUp Gold 14.4
312
Use the Performance Monitor Library dialog to configure new or existing performance monitor types:
Click New to configure a custom performance monitor.
Select an existing performance monitor, then click Edit to modify its configuration.
Note: The five default global monitors cannot be edited or deleted: CPU Utilization, Disk Utilization, Interface Utilization, and Ping Latency and Availability.
Select an existing performance monitor, then click Delete to remove it from the list.
Caution: When you delete a performance monitor from the Performance Monitor Library, any instance of that monitor is also deleted, and all related report data is also lost.
Click Configure Alerts to view the Alert Center Threshold Library.
Configuring performance monitors WhatsUp Gold includes five global performance monitors. The original configuration for these monitors cannot be modified, nor can they be deleted from the Passive Monitor Library. However, you can configure the device-level collection settings for each monitor, as well as enable or disable the monitor on specific devices.
To configure a global performance monitor:
1 In Device View, select a device from the device list.
2 Right-click and choose Properties from the right-menu to view the device's Device Properties.
3 Click Performance Monitors to view the Performance Monitors dialog.
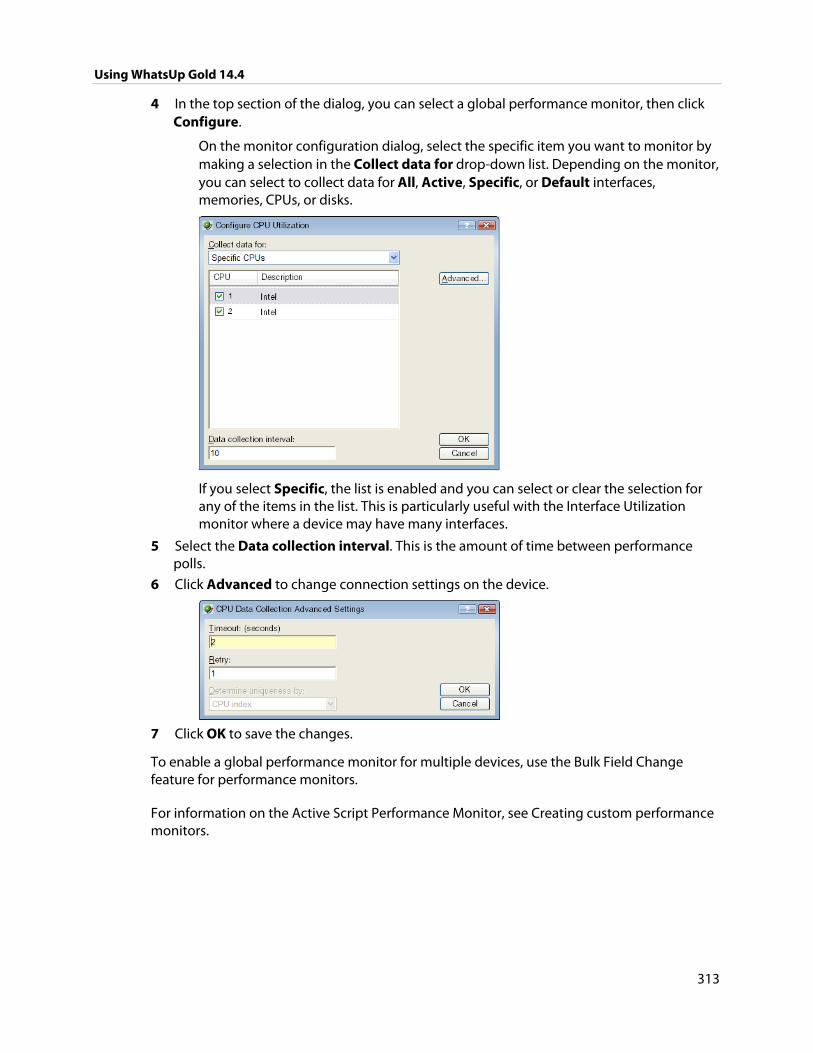
Using WhatsUp Gold 14.4
313
4 In the top section of the dialog, you can select a global performance monitor, then click Configure.
On the monitor configuration dialog, select the specific item you want to monitor by making a selection in the Collect data for drop-down list. Depending on the monitor, you can select to collect data for All, Active, Specific, or Default interfaces, memories, CPUs, or disks.
If you select Specific, the list is enabled and you can select or clear the selection for any of the items in the list. This is particularly useful with the Interface Utilization monitor where a device may have many interfaces.
5 Select the Data collection interval. This is the amount of time between performance polls.
6 Click Advanced to change connection settings on the device.
7 Click OK to save the changes.
To enable a global performance monitor for multiple devices, use the Bulk Field Change feature for performance monitors.
For information on the Active Script Performance Monitor, see Creating custom performance monitors.
Using WhatsUp Gold 14.4
314
Configuring the CPU monitor collection settings
To configure the CPU utilization monitor collection settings for a device:
1 On the Device or Map View, right-click a device, then select Properties. The Device Properties dialog appears.
2 Click Performance Monitors. The Device Properties - Performance Monitors dialog appears.
3 Under Enable global performance monitors, select CPU Utilization, then click Configure. The Configure CPU Utilization dialog appears.
4 Enter or select the appropriate information in the following fields.
Collect data for. Select the CPU(s) for which you want to gather data. You can choose to track all CPUs or a specific CPU. If you select All CPUs, all CPUs in the list are automatically selected.
Data collection interval. Enter how often (in minutes) you want data to be collected for the selected CPUs. This number represents the number of minutes between each collection.
Tip: Click Advanced to specify the timeout and number of retries, and how WhatsUp Gold is to determine uniqueness when the monitor is tracking more than one CPU.
5 Click OK to save changes.
Configuring the disk monitor collection settings
To configure the disk utilization monitor collection settings for a device:
1 On the Device or Map View, right-click a device, then select Properties. The Device Properties dialog appears.
2 Click Performance Monitors. The Device Properties - Performance Monitors dialog appears.
3 Under Enable global performance monitors, select Disk Utilization, then click Configure. The Configure Disk Utilization dialog appears.
4 Enter or select the appropriate information in the following fields.
Collect data for. Select the disk(s) for which you want to gather data. You can choose to track all disks, or a specific disk. If you select All disks, all disks in the list are automatically selected.
Data collection interval. Enter how often (in minutes) you want data to be collected for the selected disks. This number represents the number of minutes between each collection.
Tip: Click Advanced to specify the timeout and number of retries, and how WhatsUp Gold is to determine uniqueness when the monitor is tracking more than one disk.
5 Click OK to save changes.
Using WhatsUp Gold 14.4
315
Configuring the interface monitor collection settings
To configure the interface utilization monitor collection settings for a device:
1 On the Device or Map View, right-click a device, then select Properties. The Device Properties dialog appears.
2 Click Performance Monitors. The Device Properties - Performance Monitors dialog appears.
3 Under Enable global performance monitors, select Interface Utilization, then click Configure. The Configure Interface Utilization dialog appears.
4 Enter or select the appropriate information in the following fields.
Collect data for. Select the interface(s) for which you want to gather data. You can select all interfaces, active interfaces, specific interfaces, or custom active interfaces. If you select custom active interface, you will specify to track high speed interfaces, interfaces whose name contain a certain variable, or interfaces that match a certain type. Additionally, if you chose to track a specific interface, you can override the interface's Speed.
Note: When a device is discovered for the first time with Interface Utilization enabled in the discovery role (on page 63) or if the device previously existed with Interface Utilization enabled, the Collect errors and discards data for selected interfaces option is automatically selected.
Important: Be aware when you use the Collect errors and discards data for selected interfaces feature, it has potential to increase the database size quickly because there is potential for a significant amount of errors and discards data. You can set WhatsUp Health thresholds, in the Alert Center, to stay informed when the database size exceeds specified thresholds. For more information, see Configuring system thresholds (on page 373).
Tip:To disable the errors and discards data collection, you can disable for the individual device (Device Properties > Performance Monitor) or disable for multiple devices with the bulk field change option: 1. Select multiple devices that have the Interface Utilization performance monitor enabled, right-click, then select Bulk Field Change > Performance Monitors. The Bulk Field Change dialog appears. 2. In the Interface section of the dialog, under the Collect errors and discards data for enabled interfaces list, click Yes. For more information, see Editing multiple devices with the Bulk Field Change feature (on page 160).
Collect errors and discards data for all selected interfaces. Select this option to collect the following device interface data:
ifInErrors. Lists the number of inbound packets with errors, on the selected interface, that prevent the packets from being delivered to a higher-layer protocol. The associated OID is 1.3.6.1.2.1.2.2.1.14.
ifOutErrors. Lists the number of outbound packets with errors, on the selected interface, that prevent the packets from being delivered to a higher-layer protocol. The associated OID is 1.3.6.1.2.1.2.2.1.20.
Using WhatsUp Gold 14.4
316
ifInDiscards. List the number of inbound packets, on the selected interface, that were discarded though no errors were detected to prevent their transmission. One possible reason for discarding such a packet could be to free up buffer space. The associated OID is 1.3.6.1.2.1.2.2.1.13.
ifOutDiscards. List the number of outbound packets, on the selected interface, that were discarded though no errors were detected to prevent their transmission. One possible reason for discarding such a packet could be to free up buffer space. The associated OID is 1.3.6.1.2.1.2.2.1.19.
Note: All of the above OIDs point to values of type "counter," and therefore their raw value by itself is not meaningful. The difference between the values obtained from two consecutive polls provides meaningful data.
Data collection interval. Enter how often (in minutes) you want data to be collected for the selected interfaces. This number represents the number of minutes between each collection.
Tip: Click Advanced to specify the timeout and number of retries, how WhatsUp Gold is to determine uniqueness when the monitor is tracking more than one disk, and which interface traffic counters to poll.
5 Click OK to save changes.
Configuring the memory monitor collection settings
To configure the memory utilization monitor collection settings for a device:
1 On the Device or Map View, right-click a device, then select Properties. The Device Properties dialog appears.
2 Click Performance Monitors. The Device Properties - Performance Monitors dialog appears.
3 Under Enable global performance monitors, select Memory Utilization, then click Configure. The Configure Memory Utilization dialog appears.
4 Enter or select the appropriate information in the following fields.
Collect data for. Select the memory(s) for which you want to gather data. You can choose to track all memory items, or specific memory items. If you select all memory items, all memory items in the list are automatically selected.
Data collection interval. Enter how often (in minutes) you want data to be collected for the selected CPUs. This number represents the number of minutes between each collection.
Tip: Click Advanced to specify the timeout and number of retries, and how WhatsUp Gold is to determine uniqueness when the monitor is tracking more than one memory item.
5 Click OK to save changes.
Using WhatsUp Gold 14.4
317
Configuring the ping monitor collection settings
To configure the ping latency and availability monitor collection settings for a device:
1 On the Device or Map View, right-click a device, then select Properties. The Device Properties dialog appears.
2 Click Performance Monitors. The Device Properties - Performance Monitors dialog appears.
3 Under Enable global performance monitors, select Ping Latency and Availability, then click Configure. The Configure Ping Latency and Availability dialog appears.
4 Enter or select the appropriate information in the following fields.
Collect data for. Select the interface(s) for which you want to gather data. You can choose to track the default interface, all interfaces, or a specific interface. If you select All interfaces, all interfaces in the list are automatically selected.
Data collection interval. Enter how often (in minutes) you want data to be collected for the selected CPUs. This number represents the number of minutes between each collection.
Tip: Click Advanced to specify the timeout and number of iterations.
5 Click OK to save changes.
Enabling global performance monitors In order for a performance monitor to gather performance data from a device, it must be enabled to do so. You can enable a monitor on a single device (on page 317) through the Device Properties dialog, or enable a monitor on multiple devices (on page 318) through the Bulk Field Change feature.
Enabling a global performance monitor on a single device
To enable a global performance monitor for a single device:
1 In Device or Map View, right-click a device, then select Properties. The Device Properties dialog appears.
2 Click Performance Monitors. The Device Properties - Performance Monitors dialog appears.
3 Under Enable global performance monitors, select the global monitor you would like to enable.
Important: To enable a CPU, disk, interface, or memory global performance monitor, you must first select an SNMP credential for the device from the Credentials Library. For more information, see Using credentials (on page 100).
4 Click OK to save the changes.
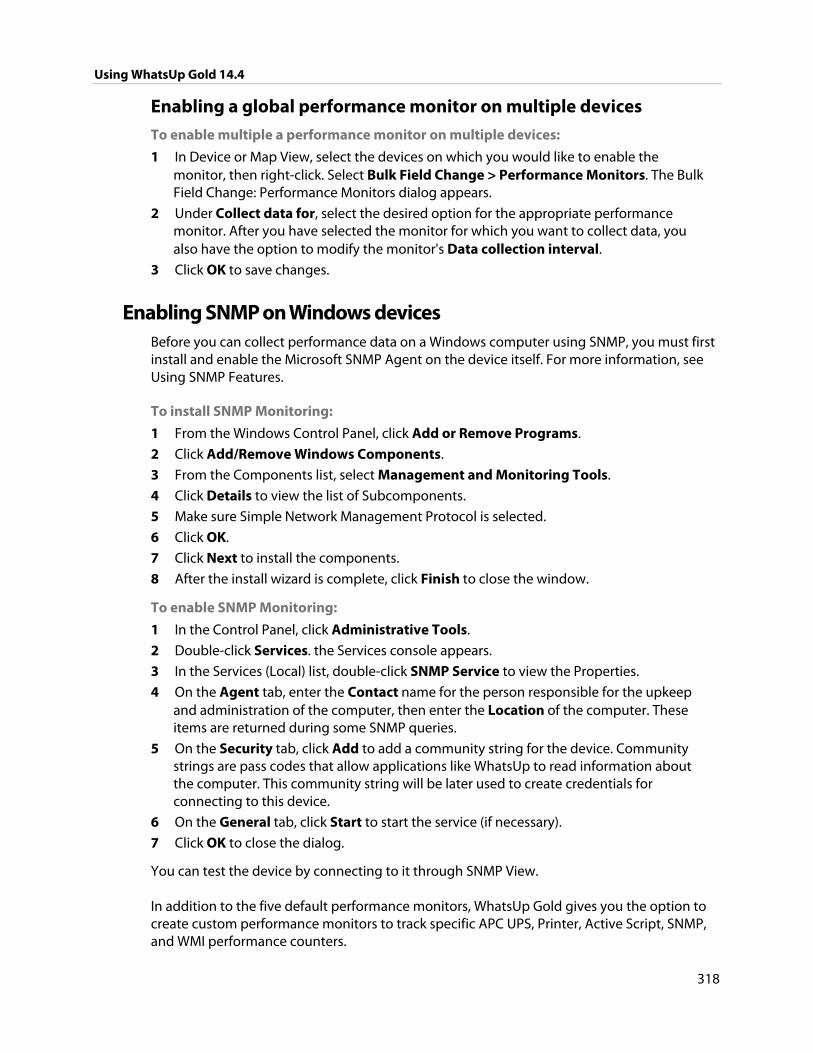
Using WhatsUp Gold 14.4
318
Enabling a global performance monitor on multiple devices
To enable multiple a performance monitor on multiple devices:
1 In Device or Map View, select the devices on which you would like to enable the monitor, then right-click. Select Bulk Field Change > Performance Monitors. The Bulk Field Change: Performance Monitors dialog appears.
2 Under Collect data for, select the desired option for the appropriate performance monitor. After you have selected the monitor for which you want to collect data, you also have the option to modify the monitor's Data collection interval.
3 Click OK to save changes.
Enabling SNMP on Windows devices Before you can collect performance data on a Windows computer using SNMP, you must first install and enable the Microsoft SNMP Agent on the device itself. For more information, see Using SNMP Features.
To install SNMP Monitoring:
1 From the Windows Control Panel, click Add or Remove Programs.
2 Click Add/Remove Windows Components.
3 From the Components list, select Management and Monitoring Tools.
4 Click Details to view the list of Subcomponents.
5 Make sure Simple Network Management Protocol is selected.
6 Click OK.
7 Click Next to install the components.
8 After the install wizard is complete, click Finish to close the window.
To enable SNMP Monitoring:
1 In the Control Panel, click Administrative Tools.
2 Double-click Services. the Services console appears.
3 In the Services (Local) list, double-click SNMP Service to view the Properties.
4 On the Agent tab, enter the Contact name for the person responsible for the upkeep and administration of the computer, then enter the Location of the computer. These items are returned during some SNMP queries.
5 On the Security tab, click Add to add a community string for the device. Community strings are pass codes that allow applications like WhatsUp to read information about the computer. This community string will be later used to create credentials for connecting to this device.
6 On the General tab, click Start to start the service (if necessary).
7 Click OK to close the dialog.
You can test the device by connecting to it through SNMP View.
In addition to the five default performance monitors, WhatsUp Gold gives you the option to create custom performance monitors to track specific APC UPS, Printer, Active Script, SNMP, and WMI performance counters.
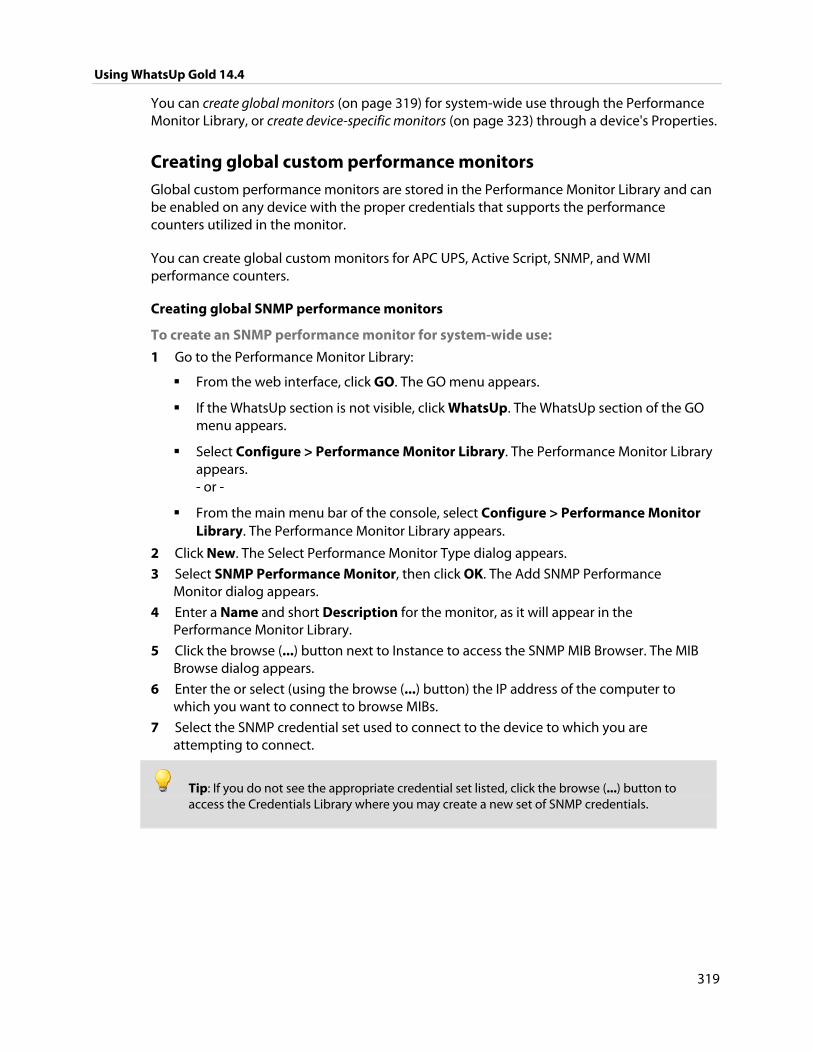
Using WhatsUp Gold 14.4
319
You can create global monitors (on page 319) for system-wide use through the Performance Monitor Library, or create device-specific monitors (on page 323) through a device's Properties.
Creating global custom performance monitors Global custom performance monitors are stored in the Performance Monitor Library and can be enabled on any device with the proper credentials that supports the performance counters utilized in the monitor.
You can create global custom monitors for APC UPS, Active Script, SNMP, and WMI performance counters.
Creating global SNMP performance monitors
To create an SNMP performance monitor for system-wide use:
1 Go to the Performance Monitor Library:
From the web interface, click GO. The GO menu appears.
If the WhatsUp section is not visible, click WhatsUp. The WhatsUp section of the GO menu appears.
Select Configure > Performance Monitor Library. The Performance Monitor Library appears. - or -
From the main menu bar of the console, select Configure > Performance Monitor Library. The Performance Monitor Library appears.
2 Click New. The Select Performance Monitor Type dialog appears.
3 Select SNMP Performance Monitor, then click OK. The Add SNMP Performance Monitor dialog appears.
4 Enter a Name and short Description for the monitor, as it will appear in the Performance Monitor Library.
5 Click the browse (...) button next to Instance to access the SNMP MIB Browser. The MIB Browse dialog appears.
6 Enter the or select (using the browse (...) button) the IP address of the computer to which you want to connect to browse MIBs.
7 Select the SNMP credential set used to connect to the device to which you are attempting to connect.
Tip: If you do not see the appropriate credential set listed, click the browse (...) button to access the Credentials Library where you may create a new set of SNMP credentials.
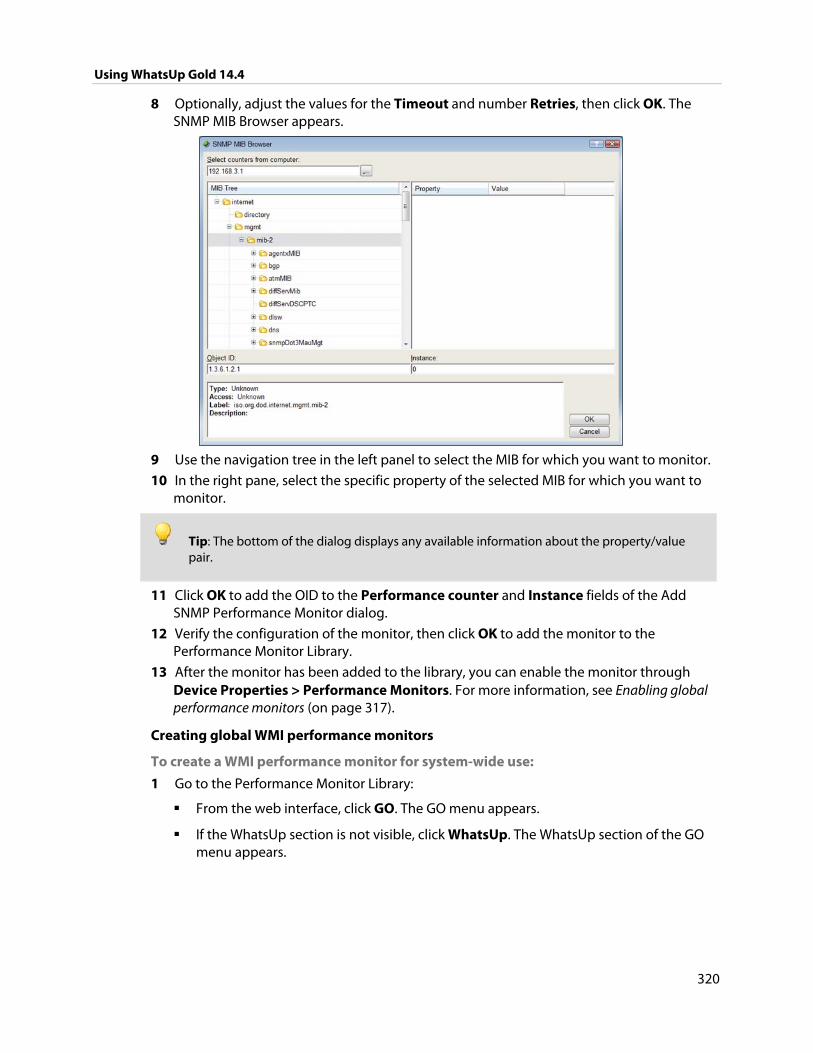
Using WhatsUp Gold 14.4
320
8 Optionally, adjust the values for the Timeout and number Retries, then click OK. The SNMP MIB Browser appears.
9 Use the navigation tree in the left panel to select the MIB for which you want to monitor.
10 In the right pane, select the specific property of the selected MIB for which you want to monitor.
Tip: The bottom of the dialog displays any available information about the property/value pair.
11 Click OK to add the OID to the Performance counter and Instance fields of the Add SNMP Performance Monitor dialog.
12 Verify the configuration of the monitor, then click OK to add the monitor to the Performance Monitor Library.
13 After the monitor has been added to the library, you can enable the monitor through Device Properties > Performance Monitors. For more information, see Enabling global performance monitors (on page 317).
Creating global WMI performance monitors
To create a WMI performance monitor for system-wide use:
1 Go to the Performance Monitor Library:
From the web interface, click GO. The GO menu appears.
If the WhatsUp section is not visible, click WhatsUp. The WhatsUp section of the GO menu appears.
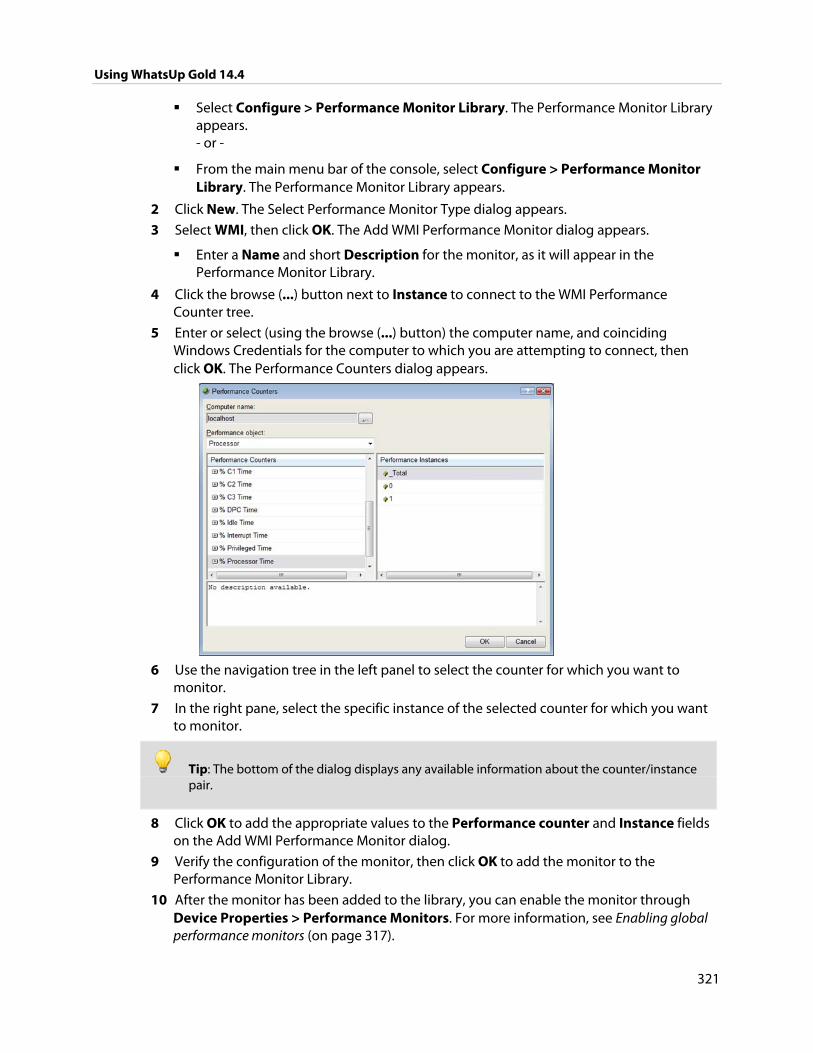
Using WhatsUp Gold 14.4
321
Select Configure > Performance Monitor Library. The Performance Monitor Library appears. - or -
From the main menu bar of the console, select Configure > Performance Monitor Library. The Performance Monitor Library appears.
2 Click New. The Select Performance Monitor Type dialog appears.
3 Select WMI, then click OK. The Add WMI Performance Monitor dialog appears.
Enter a Name and short Description for the monitor, as it will appear in the Performance Monitor Library.
4 Click the browse (...) button next to Instance to connect to the WMI Performance Counter tree.
5 Enter or select (using the browse (...) button) the computer name, and coinciding Windows Credentials for the computer to which you are attempting to connect, then click OK. The Performance Counters dialog appears.
6 Use the navigation tree in the left panel to select the counter for which you want to
monitor.
7 In the right pane, select the specific instance of the selected counter for which you want to monitor.
Tip: The bottom of the dialog displays any available information about the counter/instance pair.
8 Click OK to add the appropriate values to the Performance counter and Instance fields on the Add WMI Performance Monitor dialog.
9 Verify the configuration of the monitor, then click OK to add the monitor to the Performance Monitor Library.
10 After the monitor has been added to the library, you can enable the monitor through Device Properties > Performance Monitors. For more information, see Enabling global performance monitors (on page 317).
Using WhatsUp Gold 14.4
322
Creating global APC UPS performance monitors
To create an APC UPS performance monitor for system-wide use:
1 Go to the Performance Monitor Library:
From the web interface, click GO. The GO menu appears.
If the WhatsUp section is not visible, click WhatsUp. The WhatsUp section of the GO menu appears.
Select Configure > Performance Monitor Library. The Performance Monitor Library appears. - or -
From the main menu bar of the console, select Configure > Performance Monitor Library. The Performance Monitor Library appears.
2 Click New. The Select Performance Monitor Type dialog appears.
3 Select APC UPS Performance Monitor, then click OK. The Add APC UPS Performance Monitor dialog appears.
4 Enter a Name and short Description for the monitor, as it will appear in the Performance Monitor Library.
5 After the monitor has been added to the library, you can enable the monitor through Device Properties > Performance Monitors. For more information, see Enabling global performance monitors (on page 317).
Creating global SSH performance monitors
To create an SSH performance monitor for system-wide use:
1 Go to the Performance Monitor Library:
From the web interface, click GO. The GO menu appears.
If the WhatsUp section is not visible, click WhatsUp. The WhatsUp section of the GO menu appears.
Select Configure > Performance Monitor Library. The Performance Monitor Library appears. - or -
From the main menu bar of the console, select Configure > Performance Monitor Library. The Performance Monitor Library appears.
2 Click New. The Select Performance Monitor Type dialog appears.
3 Select SSH Performance Monitor. The New SSH Performance Monitor dialog appears.
Using WhatsUp Gold 14.4
323
4 Enter or select the appropriate information in the following fields.
Name. Enter a name for the monitor. This name is displayed in the Performance Monitor Library.
Description. Enter a short description for the monitor. This description is displayed next to the monitor name in the Performance Monitor Library.
Command to run. Enter the command that is to be ran and executed on the remote device. This command can be anything that the device can interpret and run; for example, a basic Unix command or a Perl script.
Important: The command or script must return a single numeric value.
Note: If you create a script to run on the remote device, the script must be developed, tested, and/or debugged on the remote machine. WhatsUp Gold does not support manipulation of the remote script.
SSH Credential. Select the appropriate SSH credential that WhatsUp Gold will use to connect to the remote device. If you select Use the device SSH credential, WhatsUp Gold uses the SSH credential assigned to the device to which the monitor is assigned. If the appropriate SSH credential is not listed, or the device has no SSH credentials assigned, browse (...) to the WhatsUp Gold Credentials Library to configure a set of credentials.
5 Click OK to return to the New SSH Performance Monitor dialog.
6 Click OK to save changes.
Creating device-specific custom performance monitors Device-specific custom performance monitors are configured for use only on the devices for which they are configured.
You can create device-specific custom monitors for APC UPS, Printer, Active Script, SNMP, and WMI performance counters.
Creating device-specific SNMP performance monitors
To create a device-specific SNMP performance monitor:
1 In Device or Map View, right-click a device, then select Properties. The Device Properties dialog appears.
2 Click Performance Monitors. The Device Properties - Performance Monitors dialog appears.
3 Under Enable individual performance monitors, click New. The Select Performance Monitor Type dialog appears.
4 Select SNMP, then click OK. The Add SNMP Performance Monitor dialog appears.
5 Enter a Name and short Description for the monitor, as it will appear in the Performance Monitor Library.
6 Click the browse (...) button next to Instance to access the SNMP MIB Browser. The MIB Browse dialog appears.
Using WhatsUp Gold 14.4
324
7 Enter the or select (using the browse (...) button) the IP address of the computer to which you want to connect to browse MIBs.
8 Select the SNMP credential set used to connect to the device to which you are attempting to connect.
Tip: If you do not see the appropriate credential set listed, click the browse (...) button to access the Credentials Library where you may create a new set of SNMP credentials.
9 Optionally, adjust the values for the Timeout and number Retries, then click OK. The SNMP MIB Browser appears.
10 Use the navigation tree in the left panel to select the MIB for which you want to monitor.
11 In the right pane, select the specific property of the selected MIB for which you want to monitor.
Tip: The bottom of the dialog displays any available information about the property/value pair.
12 Click OK to add the OID to the Performance counter and Instance fields of the Add SNMP Performance Monitor dialog.
13 Verify the configuration of the monitor, then click OK to add the monitor to the device's Properties.
Creating device-specific WMI performance monitors
To create a device-specific WMI performance monitor:
1 In Device or Map View, right-click a device, then select Properties. The Device Properties dialog appears.
2 Click Performance Monitors. The Device Properties - Performance Monitors dialog appears.
3 Under Enable individual performance monitors, click New. The Select Performance Monitor Type dialog appears.
4 Select WMI, then click OK. The Add WMI Performance Monitor dialog appears.
5 Name and short Description for the monitor, as it will appear in the Performance Monitor Library.
6 Click the browse (...) button next to Instance to connect to the WMI Performance Counter tree.
7 Enter or select (using the browse (...) button) the computer name, and coinciding Windows Credentials for the computer to which you are attempting to connect, then click OK. The Performance Counters dialog appears.
8 Use the navigation tree in the left panel to select the counter for which you want to monitor.
Using WhatsUp Gold 14.4
325
9 In the right pane, select the specific instance of the selected counter for which you want to monitor.
Tip: The bottom of the dialog displays any available information about the counter/instance pair.
10 Click OK to add the appropriate values to the Performance counter and Instance fields on the Add WMI Performance Monitor dialog.
11 Verify the configuration of the monitor, then click OK to add the monitor to the device's Properties.
Creating device-specific APC UPS performance monitors
To create a device-specific APC UPS performance monitor:
1 In Device or Map View, right-click a device, then select Properties. The Device Properties dialog appears.
2 Click Performance Monitors. The Device Properties - Performance Monitors dialog appears.
3 Under Enable individual performance monitors, click New. The Select Performance Monitor Type dialog appears.
4 Select APC UPS Performance Monitor, then click OK. The Add APC UPS Performance Monitor dialog appears.
5 Enter the Name and short Description for the monitor, as it will appear in the Performance Monitor Library.
6 Enter or select the appropriate information in the following fields.
Data collection interval. Enter how often (in minutes) you want data to be collected for the selected APC UPS. This number represents the number of minutes between each collection.
Timeout. Enter the amount of time (in seconds) WhatsUp Gold should wait for a response to the poll.
Retries. Enter the number of times you want to attempt to make the connection to the selected device.
7 Verify the configuration of the monitor, then click OK to add the monitor to the device's Properties.
Using WhatsUp Gold 14.4
326
Creating device-specific Printer performance monitors
To create a device-specific Printer performance monitor:
1 In Device or Map View, right-click a device, then select Properties. The Device Properties dialog appears.
Important: In order for the Printer Performance Monitor to work, in addition to being SNMP-enabled, the printer you are attempting to monitor must also support the Standard Printer MIB. Make sure that you select a device that supports the Standard Printer MIB.
2 Click Performance Monitors. The Device Properties - Performance Monitors dialog appears.
3 Under Enable individual performance monitors, click New. The Select Performance Monitor Type dialog appears.
4 Select Printer Performance Monitor, then click OK. The New Printer Performance Monitor dialog appears.
5 Enter the Name and short Description for the monitor, as it will appear in the Performance Monitor Library.
6 Select the ink/toner cartridge from which you want to collect ink/toner level data.
Note: You must set up a Printer performance monitor for each color ink/toner cartridge you want to monitor.
7 Select the Collection interval (in minutes) for how often you want data to be collected for the selected toner cartridge. This number represents the number of minutes between each collection.
8 You can click the Advanced button to select Advanced options:
Timeout. Enter the timeout in seconds. If a device does not respond to within this time, the monitor is considered down.
Retries. Enter the number of attempts to communicate with the device over the network. After this number is exceeded, the monitor is considered down.
9 Verify the configuration of the monitor, then click OK to add the monitor to the device's Properties.
Creating device-specific SSH performance monitors
To create a device-specific SSH performance monitor:
1 In Device or Map View, right-click a device, then select Properties. The Device Properties dialog appears.
2 Click Performance Monitors. The Device Properties - Performance Monitors dialog appears.
3 Under Enable individual performance monitors, click New. The Select Performance Monitor Type dialog appears.
4 Select SSH Performance Monitor, then click OK. The New SSH Performance Monitor dialog appears.
Using WhatsUp Gold 14.4
327
5 Enter the Name and short Description for the monitor, as it will appear in the Performance Monitor Library.
6 Enter the Command to run, or the command that is to be executed on the remote device. This command can be anything that the device can interpret and run; for example, a basic Unix command or Perl script.
Important: The command or script must return a single numeric value.
Note: If you create a script to run on the remote device, the script must be developed, tested and/or debugged on the remote machine. WhatsUp Gold does not support manipulation of the remote script.
7 Select the appropriate SSH credential that WhatsUp Gold will use to connect to the remote device. If you select Use the device SSH credential, WhatsUp Gold uses the SSH credential assigned to the device to which the monitor is assigned. If the appropriate SSH credential is not listed, or the device has no SSH credentials assigned, browse (...) to the WhatsUp Gold Credentials Library to configure a set of credentials.
8 Click OK to return to the monitor properties dialog.
9 Verify the configuration of the monitor, then click OK to add the monitor to the device's Properties.
Example: monitoring router bandwidth You can configure WhatsUp Gold to gather bandwidth usage on your SNMP enabled devices (routers, switches, etc.) and then track that usage through performance reports. For bandwidth monitoring, the Interface Utilization monitor is the most useful as it illustrates percent utilization and throughput.
The Interface Utilization monitor gathers statistics on the volume of bytes traveling to and from the active interfaces on a device. You can collect data on all interfaces, active interfaces, or specific interfaces. This monitor is configured and enabled through Device Properties > Performance Monitors.
Note: Before you can configure the monitor for a device, you must enable SNMP and assign the proper credentials via the Credentials Library. The Performance Monitoring system uses these credentials to connect to the device during the configuration process, and during normal performance gathering. For more information, see Enabling SNMP on Windows devices (on page 318).
Using WhatsUp Gold 14.4
328
Configuring the monitor The Interface Utilization Performance Monitor is one of the default performance monitors installed with WhatsUp Gold, and needs no global configuration to configure the monitor for a single device.
To configure the Bandwidth Monitor:
1 In either the Device List or Map View, right-click on a device, then select Properties from the right-click menu.
2 Select Performance Monitors on the Device Properties dialog.
3 Select the Interface Utilization monitor from the list.
4 Click Configure to set up the monitor for the device. WhatsUp Gold scans the device and discovers the interfaces on the device.
When the scan completes, the Configure Interface Data Collection dialog appears. If the credentials for the device are not configured properly, the scan will fail (return to the Credentials Library to fix it). If the device is not SNMP-enabled, the scan will fail.
5 Select the interfaces you want to collect data for. From the Collect data for list, select All, Active, Specific, or Custom active. If you select Specific, select just the interfaces you want to monitor in the list below. By default, active interfaces are measured.
6 Optionally, click Advanced to change the retry and timeout settings for the SNMP connection to the device. Click OK to save the changes to the Advanced Settings.
7 On the Configure Interface Data Collection dialog, enter a time interval (in minutes) for how long you want the application to wait between polls. The default is 10 minutes. See, “ProOptions - Report Data for more information on data collection and roll-up.”
8 Click OK to save the Interface Utilization configuration.
Viewing the data WhatsUp Gold will take several polling cycles to produce meaningful graphs (with a 10 minute poll interval, this may mean a few hours). After enough data is gathered, several reports display this data.
By Device. For device-specific data, view the Interface Utilization report; or the Device Status report, which shows graphical statistics of all monitors configured on a device.
By Group. Access the Group Interface Statistics report to view summarized statistics for all devices in the selected group that have interface statistics enabled.
System Wide. Use the Top 10 report to view the top performers in terms of bandwidth utilization across your network. You can also view system-wide data by running the Group Interface Utilization report against the All Devices dynamic group.
Using WhatsUp Gold 14.4
329
Example: troubleshooting a slow network connection The real-time reporting provided by performance monitors can provide both the raw data and the data trend analysis that can help you isolate network problems. For example, we recently experienced a problem with a network connection between two of our Ipswitch office sites. This example shows how we used Performance Monitors to troubleshoot the slow network connection.
First, the scenario is described, then the steps taken by the network administrator to solve the problem are outlined.
Scenario: A developer working in Augusta, GA on an Atlanta-based project complained of a slow network connection between the Augusta and Atlanta offices. He stated it took 40 minutes to check-in files to the source library over the T1 connection.
The Atlanta office network administrator reacted by completing the following steps:
1 On the WhatsUp Gold web interface, he goes to the Reports tab to select the Ping Response Time report.
2 From here, he checks the connection from the Atlanta WhatsUp Gold application to the Augusta primary server. The report shows an increased response time beginning at 11:45 a.m.
Note: This connection has been configured with the appropriate Performance Monitors and has been gathering data for weeks. To set up this type of monitor for a connection, configure the Ping Latency and Availability monitor on a device located on the other end of the connection. For more information, see Configuring performance monitors (on page 312).
Using the Active Script Performance Monitor Active Script Performance Monitors let you write VBScript and JScript to easily poll one or more SNMP or WMI values, perform math or other operations on those values, and graph a single output value. You should only use the Active Script Performance Monitor when you need to perform calculations on the polled values. A variety of Active Script resources are available on the Active Scripts resources page. (http://www.whatsupgold.com/cd/resources/active_script)
Note: Please be aware that Ipswitch does not support the custom scripts that you create; only the ability to use them in the Active Script Monitor.
For more information, see Extending WhatsUp Gold with scripting (on page 493).
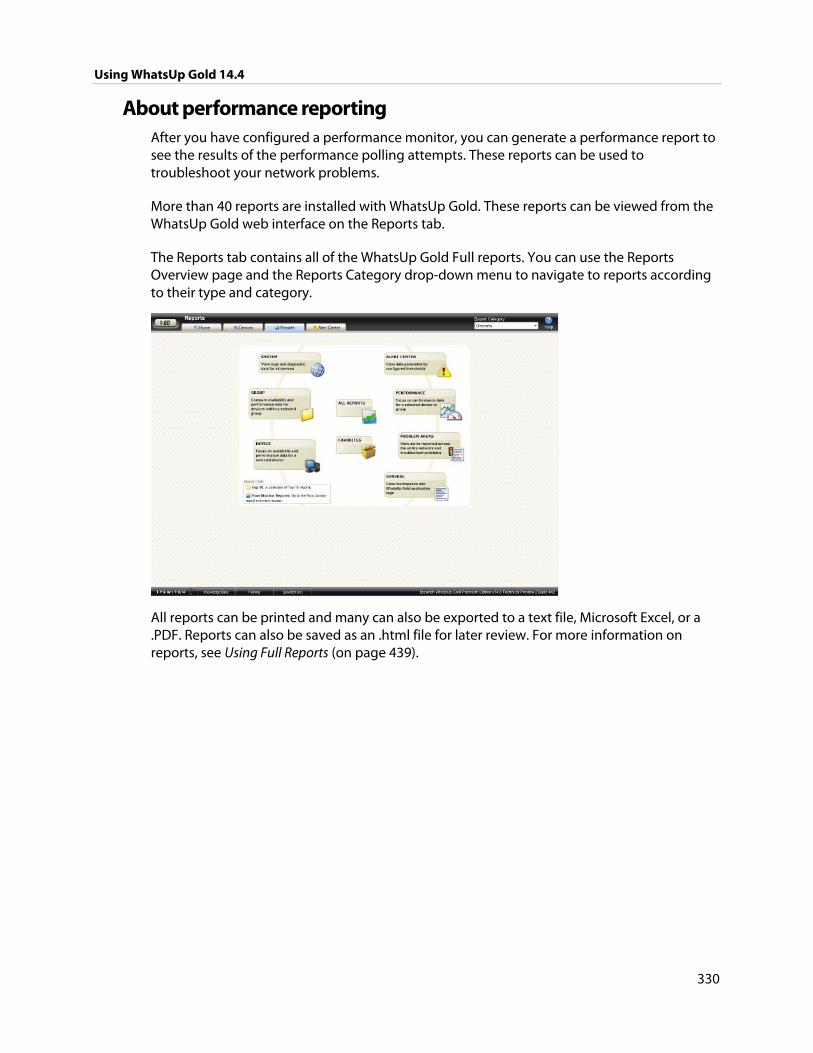
Using WhatsUp Gold 14.4
330
About performance reporting After you have configured a performance monitor, you can generate a performance report to see the results of the performance polling attempts. These reports can be used to troubleshoot your network problems.
More than 40 reports are installed with WhatsUp Gold. These reports can be viewed from the WhatsUp Gold web interface on the Reports tab.
The Reports tab contains all of the WhatsUp Gold Full reports. You can use the Reports Overview page and the Reports Category drop-down menu to navigate to reports according to their type and category.
All reports can be printed and many can also be exported to a text file, Microsoft Excel, or a .PDF. Reports can also be saved as an .html file for later review. For more information on reports, see Using Full Reports (on page 439).
331
CHAPTER 19
Using the Alert Center
In This Chapter
About Alert Center ........................................................................................... 331
Navigating Alert Center ................................................................................. 332
About the Threshold Library ........................................................................ 339
About the Alert Center Notification Library ............................................ 380
About notification policies ............................................................................ 386
Using Alert Center reports ............................................................................. 388
About Alert Center WhatsUp Gold Alert Center handles alerting on performance monitors, passive monitors, WhatsUp Gold system health, and WhatsUp Gold Flow Monitor plug-in through user-configured thresholds and notification policies.
Thresholds
Thresholds are the benchmark mechanisms Alert Center uses to check against the database. If WhatsUp Gold finds that an aspect has exceeded or fallen below the parameters you set in a threshold, it is considered out of threshold. These out of threshold aspects are logged as items. You can find data for Alert Center items on the Alert Center Home page and in Alert Center reports. For more information, see Configuring Alert Center thresholds (on page 340).
Notification policies
When an aspect goes out of threshold and is logged as an item, associated notification policies begin sending notifications to alert users of the problem. These policies can include multiple steps that begin at user-specified intervals to notify multiple people of persisting problems. After you have have fixed a problem, you can notify other users of the fix and stop subsequent steps of a running notification policy. For more information, see About notification policies (on page 386).
Alert Center Home
Alert Center Home is Alert Center's control page. Similar to the WhatsUp Gold Home page, Alert Center Home displays threshold data in workspace reports. From these threshold workspace reports, you can update out of threshold items. For more information, see About Alert Center Home (on page 334).
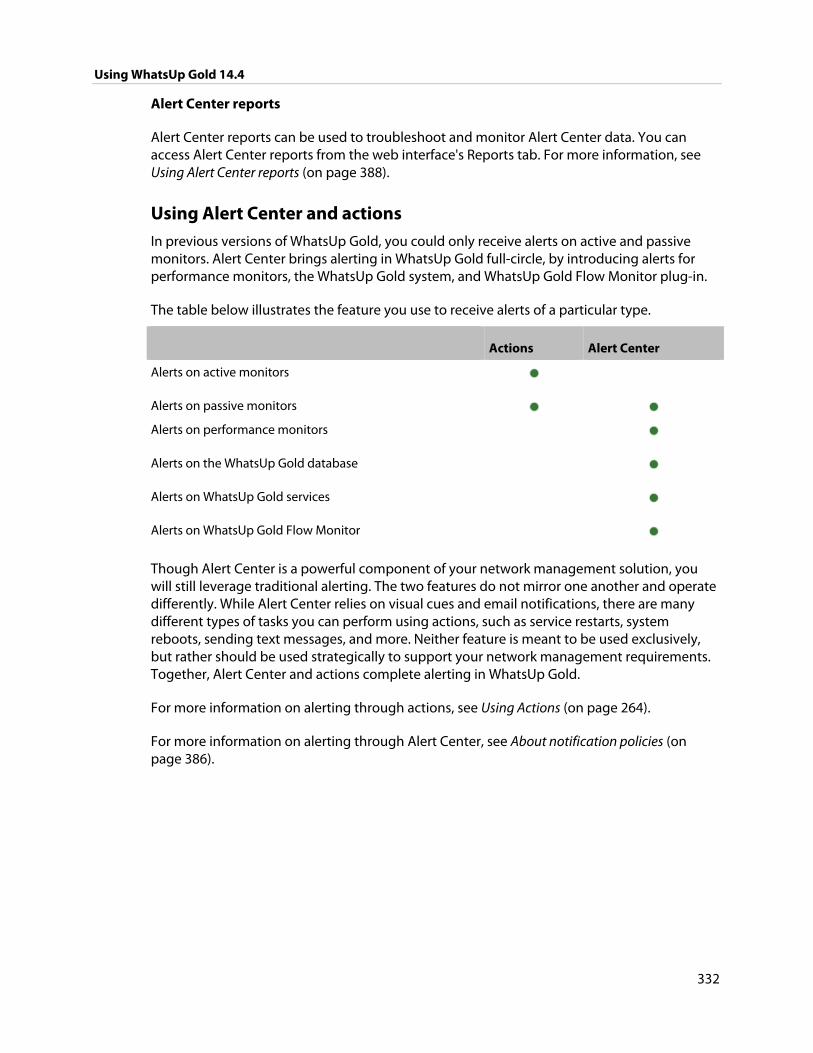
Using WhatsUp Gold 14.4
332
Alert Center reports
Alert Center reports can be used to troubleshoot and monitor Alert Center data. You can access Alert Center reports from the web interface's Reports tab. For more information, see Using Alert Center reports (on page 388).
Using Alert Center and actions In previous versions of WhatsUp Gold, you could only receive alerts on active and passive monitors. Alert Center brings alerting in WhatsUp Gold full-circle, by introducing alerts for performance monitors, the WhatsUp Gold system, and WhatsUp Gold Flow Monitor plug-in.
The table below illustrates the feature you use to receive alerts of a particular type.
Actions Alert Center
Alerts on active monitors
Alerts on passive monitors
Alerts on performance monitors
Alerts on the WhatsUp Gold database
Alerts on WhatsUp Gold services
Alerts on WhatsUp Gold Flow Monitor
Though Alert Center is a powerful component of your network management solution, you will still leverage traditional alerting. The two features do not mirror one another and operate differently. While Alert Center relies on visual cues and email notifications, there are many different types of tasks you can perform using actions, such as service restarts, system reboots, sending text messages, and more. Neither feature is meant to be used exclusively, but rather should be used strategically to support your network management requirements. Together, Alert Center and actions complete alerting in WhatsUp Gold.
For more information on alerting through actions, see Using Actions (on page 264).
For more information on alerting through Alert Center, see About notification policies (on page 386).
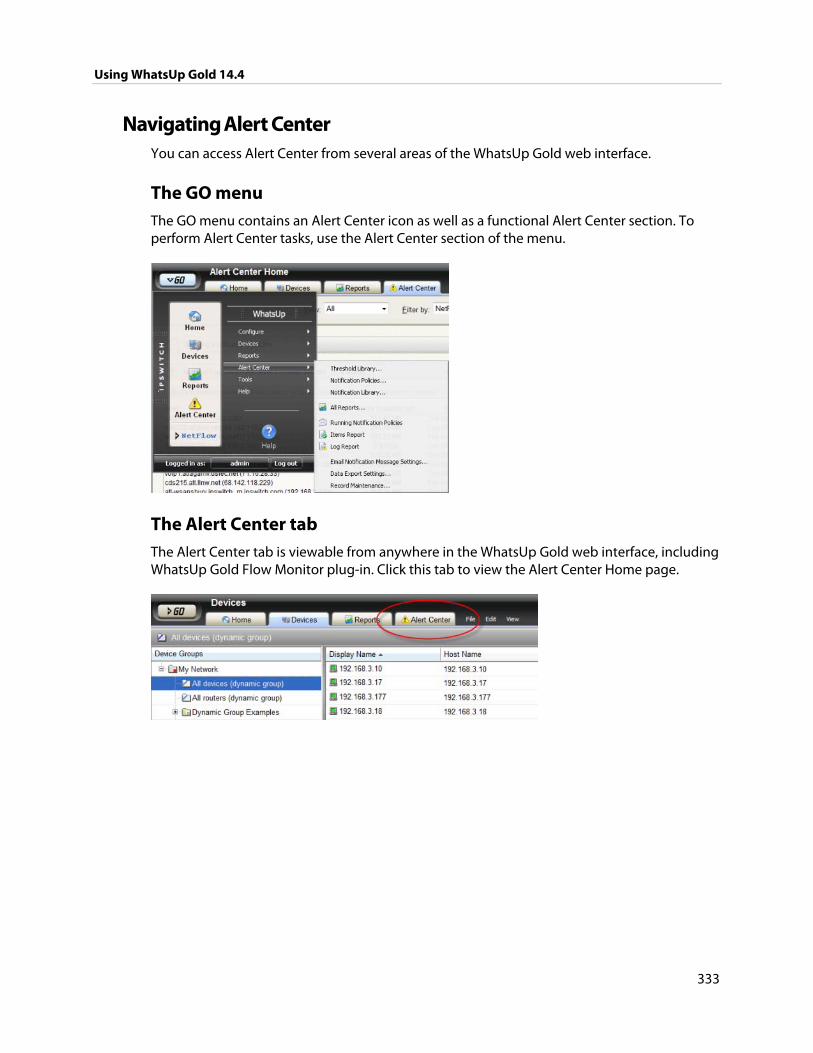
Using WhatsUp Gold 14.4
333
Navigating Alert Center You can access Alert Center from several areas of the WhatsUp Gold web interface.
The GO menu The GO menu contains an Alert Center icon as well as a functional Alert Center section. To perform Alert Center tasks, use the Alert Center section of the menu.
The Alert Center tab The Alert Center tab is viewable from anywhere in the WhatsUp Gold web interface, including WhatsUp Gold Flow Monitor plug-in. Click this tab to view the Alert Center Home page.
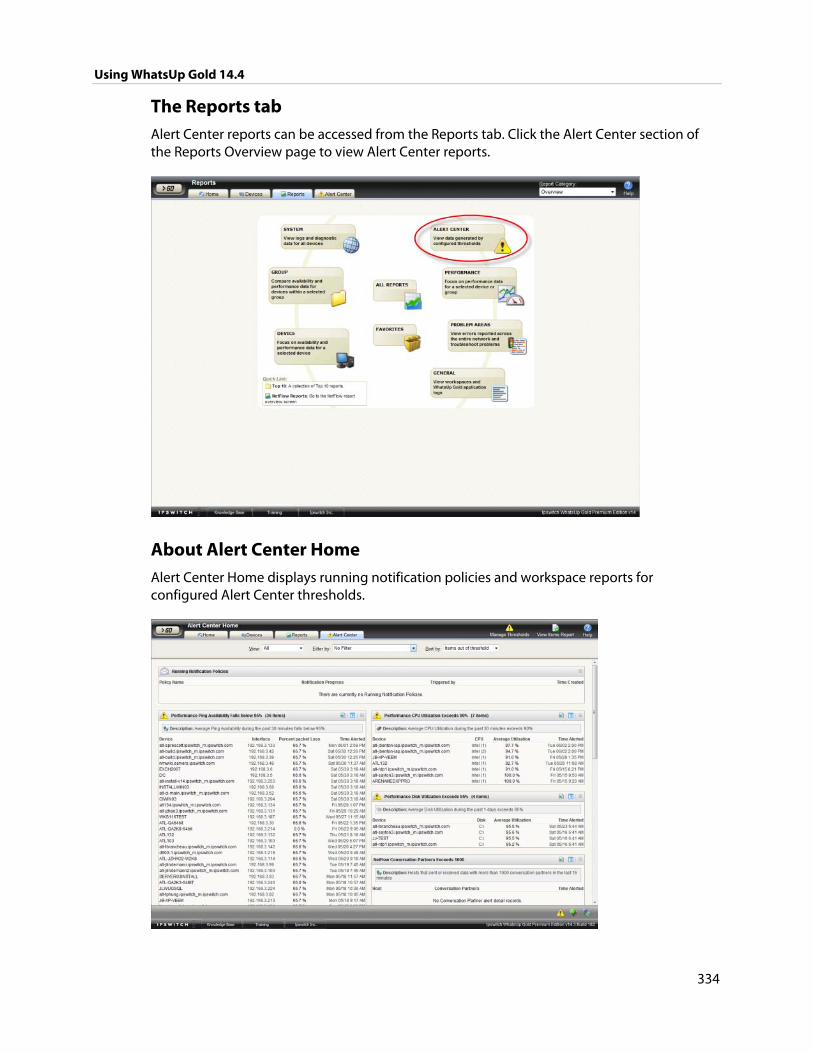
Using WhatsUp Gold 14.4
334
The Reports tab Alert Center reports can be accessed from the Reports tab. Click the Alert Center section of the Reports Overview page to view Alert Center reports.
About Alert Center Home Alert Center Home displays running notification policies and workspace reports for configured Alert Center thresholds.
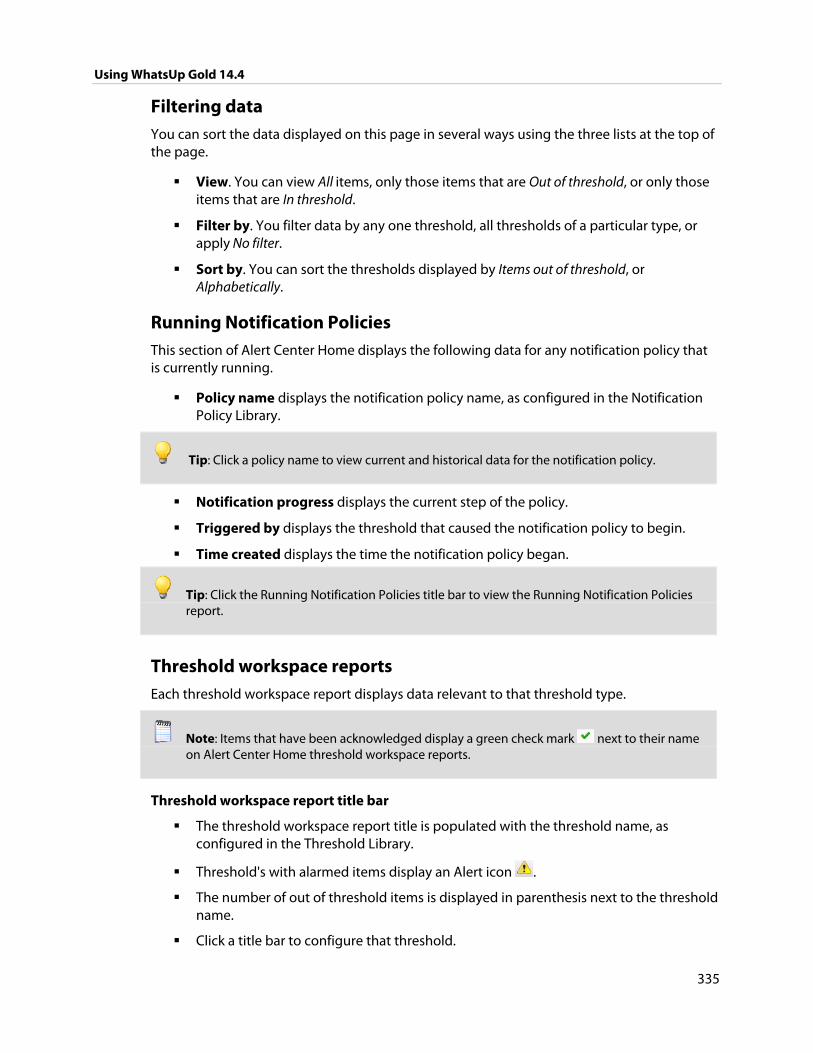
Using WhatsUp Gold 14.4
335
Filtering data You can sort the data displayed on this page in several ways using the three lists at the top of the page.
View. You can view All items, only those items that are Out of threshold, or only those items that are In threshold.
Filter by. You filter data by any one threshold, all thresholds of a particular type, or apply No filter.
Sort by. You can sort the thresholds displayed by Items out of threshold, or Alphabetically.
Running Notification Policies This section of Alert Center Home displays the following data for any notification policy that is currently running.
Policy name displays the notification policy name, as configured in the Notification Policy Library.
Tip: Click a policy name to view current and historical data for the notification policy.
Notification progress displays the current step of the policy.
Triggered by displays the threshold that caused the notification policy to begin.
Time created displays the time the notification policy began.
Tip: Click the Running Notification Policies title bar to view the Running Notification Policies report.
Threshold workspace reports Each threshold workspace report displays data relevant to that threshold type.
Note: Items that have been acknowledged display a green check mark next to their name on Alert Center Home threshold workspace reports.
Threshold workspace report title bar
The threshold workspace report title is populated with the threshold name, as configured in the Threshold Library.
Threshold's with alarmed items display an Alert icon .
The number of out of threshold items is displayed in parenthesis next to the threshold name.
Click a title bar to configure that threshold.
Using WhatsUp Gold 14.4
336
Click the Export button to export data for a workspace report to a text file, Microsoft Excel, or a .PDF. For more information, see Alert Center Export Settings.
Click the Help button to view help for a threshold workspace report.
Use the expand and collapse buttons on the workspace report title bar to show or hide threshold report data.
Service icons WhatsUp Gold service icons are located at the bottom right of the page. These icons display information about the Alert Center, WhatsUp Gold, and Flow Monitor service. Position the mouse cursor over an icon to view status information.
Position the mouse cursor over the Alert Center service icon to view the service's current status. Click the icon to view the Alert Center Service dialog, where you can stop and restart the service.
Position the mouse cursor over the WhatsUp Engine service icon to view the service's current status. Click the icon to view the WhatsUp Engine Service dialog, where you can stop and restart the service.
Position the mouse cursor over the Flow Service icon to view the service's current status. Click the icon to view the Flow Service dialog, where you can stop and restart the service.
Title bar quick links There are several quick links at the top of the page you can use to access different parts of the Alert Center or Online Help.
Click Manage Thresholds to view the Threshold Library.
Click View Items Report to view the Alert Center Items Report.
Click Help to view help for this page.
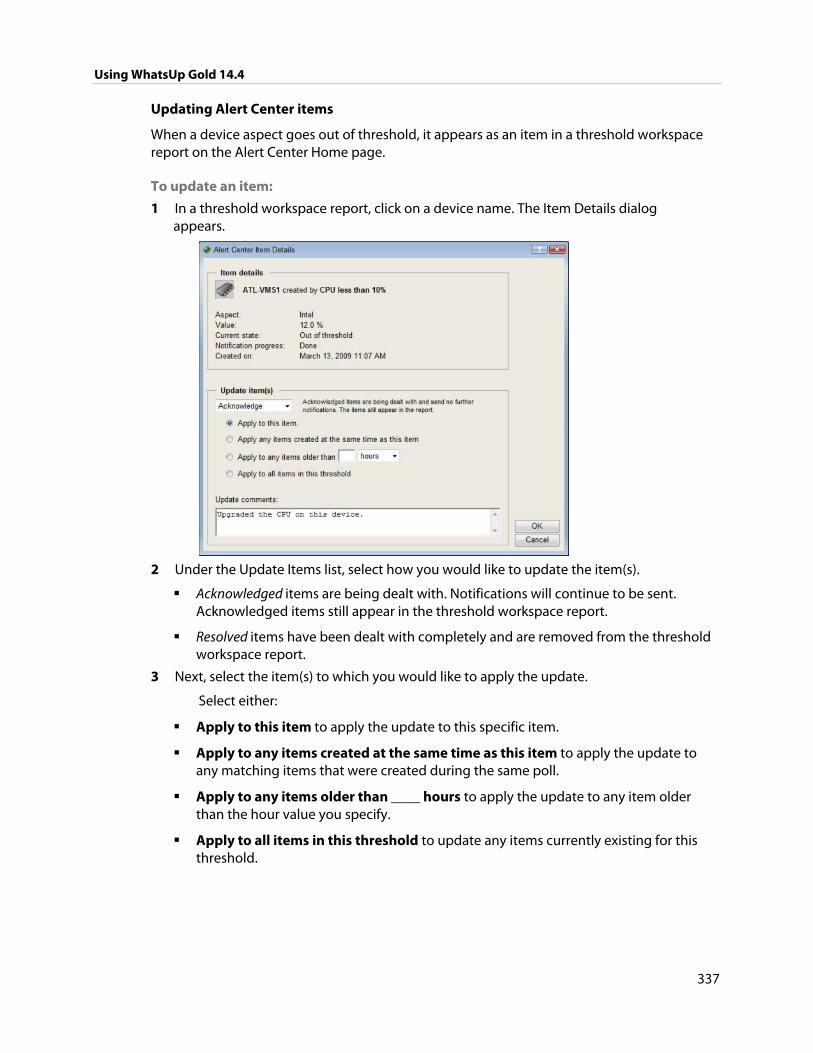
Using WhatsUp Gold 14.4
337
Updating Alert Center items
When a device aspect goes out of threshold, it appears as an item in a threshold workspace report on the Alert Center Home page.
To update an item:
1 In a threshold workspace report, click on a device name. The Item Details dialog appears.
2 Under the Update Items list, select how you would like to update the item(s).
Acknowledged items are being dealt with. Notifications will continue to be sent. Acknowledged items still appear in the threshold workspace report.
Resolved items have been dealt with completely and are removed from the threshold workspace report.
3 Next, select the item(s) to which you would like to apply the update.
Select either:
Apply to this item to apply the update to this specific item.
Apply to any items created at the same time as this item to apply the update to any matching items that were created during the same poll.
Apply to any items older than ____ hours to apply the update to any item older than the hour value you specify.
Apply to all items in this threshold to update any items currently existing for this threshold.
Using WhatsUp Gold 14.4
338
4 After selecting the appropriate update, enter a brief Update comment that explains what was done to take care of the problem.
Note: It is not required that you enter an explanatory comment, though we suggest that you do so for record-keeping purposes.
5 Click OK to save changes.
Note: Items that have been acknowledged display a green check mark next to their name on Alert Center Home threshold workspace reports.
A note about resolving items
When you mark an out-of-threshold item as resolved, the Alert Center ignores the item until the sample period does not include the time the item was resolved. This gives you one full sample period to fix the problem.
For example, you have a disk utilization threshold with a sample time period of 1 day, and a polling interval of 1 hour. At 1:00 p.m. on Tuesday, you see that a device has exceeded the percentage specified in the threshold. At 1:05 p.m., you mark that item as resolved and make a note to go out and get more disk space for the device.
If before 1:05 p.m. on Wednesday, you have purchased and installed more drive space on the device, the item does not reappear in the list of out of threshold items the next time the Alert Center checks the database at 2:00 p.m.. Likewise, if you have forgotten and did not update the device with more disk space, the item reappears in the list of out of threshold items the next time the Alert Center checks the database, even though you marked it as resolved on Tuesday.
In another example, you have an SNMP trap threshold with a sample period of 1 hour, and a polling interval of 30 minutes. At 1:00 p.m. the Alert Center checks the database for the 12:00 p.m. to 1:00 p.m. hour, and finds that a device has exceeded the number of SNMP traps specified in the threshold. You see the item and update it as resolved at 1:10 p.m..
The next time the Alert Center checks the database at 1:30 p.m., it ignores the item you have marked as resolved. If by 2:00 p.m., you have turned off the SNMP trap agent on the offending device, the item does not reappear in the list of out of threshold items. Likewise, if you have not taken steps to fix the problem, the item reappears in the list of out of threshold items even though you previously marked it as resolved.
Note: This method of resolving items does not apply to the WhatsUp Health threshold.
Using WhatsUp Gold 14.4
339
A note about notifications
When you acknowledge or resolve an item or group of items, corresponding notifications are affected dependent upon how you choose to acknowledge or resolve the items.
Read the scenarios listed below to better understand how notifications react when items are acknowledged or resolved.
One-item threshold
When one item exists in a threshold and you acknowledge or resolve that item, a corresponding notification is also deleted and no more notifications for the item are sent.
Multiple-item threshold
Several items fall out of threshold at the same time and one notification is sent for the group of items. If you acknowledge or resolve only one item from the group of offending items, a corresponding notification will persist for all other unacknowledge and unresolved items. However, if you select one item from the group, acknowledge or resolve it, and then select Apply to any items created at the same time as this item, the corresponding notification ceases for all items that were created at the same time as the item you selected.
About the Threshold Library The Threshold Library displays the Threshold types that have been configured for use with the WhatsUp Gold Alert Center.
Four types of thresholds are available for use in the Alert Center:
Performance
Passive
Flow
System
Note: Flow thresholds are only available if your license supports WhatsUp Gold Flow Monitor plug-in. To update your license to purchase WhatsUp Gold Flow Monitor, visit the MyIpswitch portal (http://www.myipswitch.com).
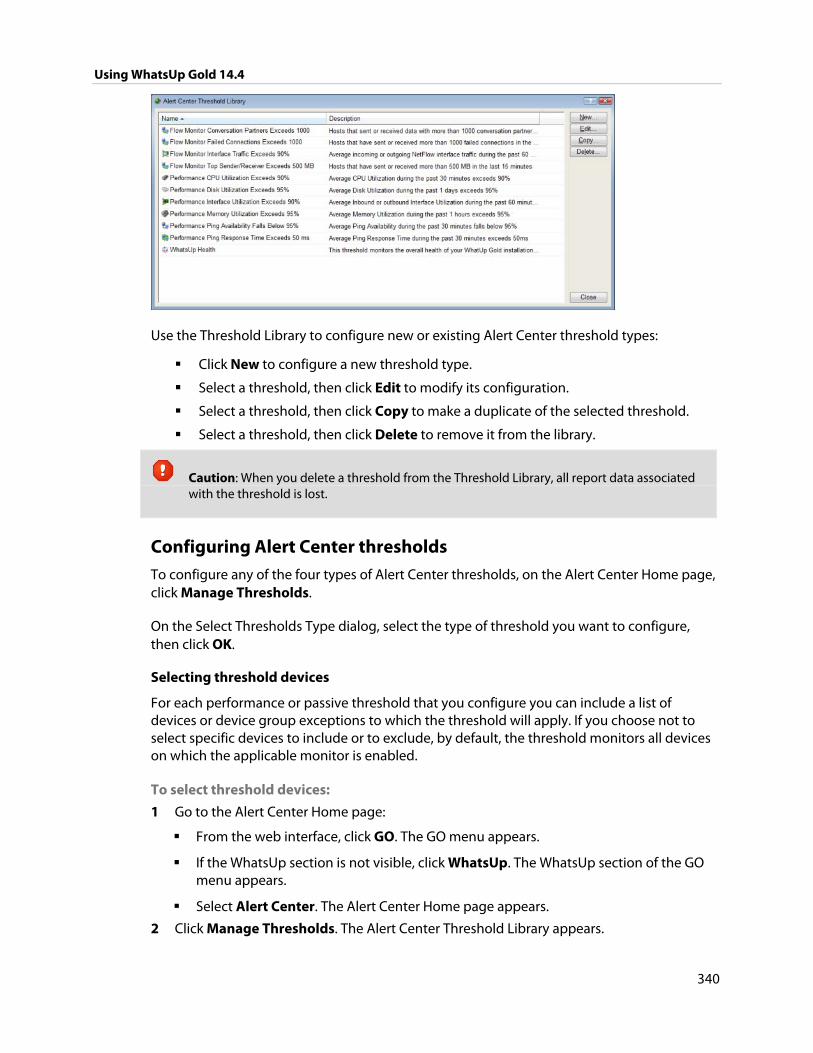
Using WhatsUp Gold 14.4
340
Use the Threshold Library to configure new or existing Alert Center threshold types:
Click New to configure a new threshold type.
Select a threshold, then click Edit to modify its configuration.
Select a threshold, then click Copy to make a duplicate of the selected threshold.
Select a threshold, then click Delete to remove it from the library.
Caution: When you delete a threshold from the Threshold Library, all report data associated with the threshold is lost.
Configuring Alert Center thresholds To configure any of the four types of Alert Center thresholds, on the Alert Center Home page, click Manage Thresholds.
On the Select Thresholds Type dialog, select the type of threshold you want to configure, then click OK.
Selecting threshold devices
For each performance or passive threshold that you configure you can include a list of devices or device group exceptions to which the threshold will apply. If you choose not to select specific devices to include or to exclude, by default, the threshold monitors all devices on which the applicable monitor is enabled.
To select threshold devices:
1 Go to the Alert Center Home page:
From the web interface, click GO. The GO menu appears.
If the WhatsUp section is not visible, click WhatsUp. The WhatsUp section of the GO menu appears.
Select Alert Center. The Alert Center Home page appears.
2 Click Manage Thresholds. The Alert Center Threshold Library appears.
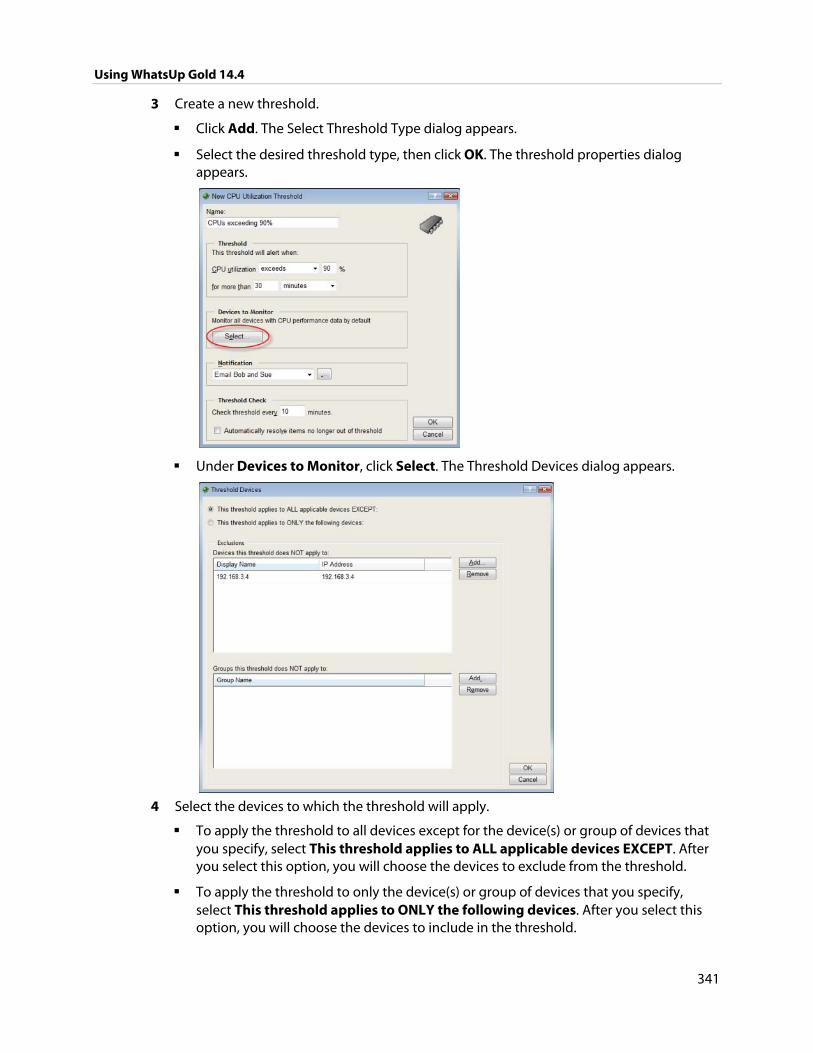
Using WhatsUp Gold 14.4
341
3 Create a new threshold.
Click Add. The Select Threshold Type dialog appears.
Select the desired threshold type, then click OK. The threshold properties dialog appears.
Under Devices to Monitor, click Select. The Threshold Devices dialog appears.
4 Select the devices to which the threshold will apply.
To apply the threshold to all devices except for the device(s) or group of devices that you specify, select This threshold applies to ALL applicable devices EXCEPT. After you select this option, you will choose the devices to exclude from the threshold.
To apply the threshold to only the device(s) or group of devices that you specify, select This threshold applies to ONLY the following devices. After you select this option, you will choose the devices to include in the threshold.
Using WhatsUp Gold 14.4
342
5 Select the specific devices to include or exclude from the threshold.
To specify a device to exclude or include in the threshold, in the upper section of the dialog, click Add.
To specify a group of devices to exclude or include in the threshold, in the lower section of the dialog, click Add.
Note: You can select Dynamic Groups.
Note: When you add a device group to the list of exceptions, all devices within the device group, as well as any sub-groups contained within the group (and devices in those sub-groups), are excluded from the threshold. Additionally, if you add a device group to the list of exceptions that contains a device shortcut, then that device is excluded from the threshold--even if that device is also a member of another group which is not part of the list of excluded groups.
Tip: To delete a device or device group from the list, select it, then click Remove.
6 Click OK to save changes.
Selecting Flow Monitor threshold hosts
For each Flow threshold that you configure you can include a list of Flow Monitor groups, hosts, or a range of IP addresses to which the threshold will not apply.
To configure a list of Flow threshold exceptions:
1 Go to the Alert Center Home page:
From the web interface, click GO. The GO menu appears.
If the WhatsUp section is not visible, click WhatsUp. The WhatsUp section of the GO menu appears.
Select Alert Center. The Alert Center Home page appears.
2 Click Manage Thresholds. The Alert Center Threshold Library appears.
3 Create a new Flow threshold.
Click Add. The Select Threshold Type dialog appears.
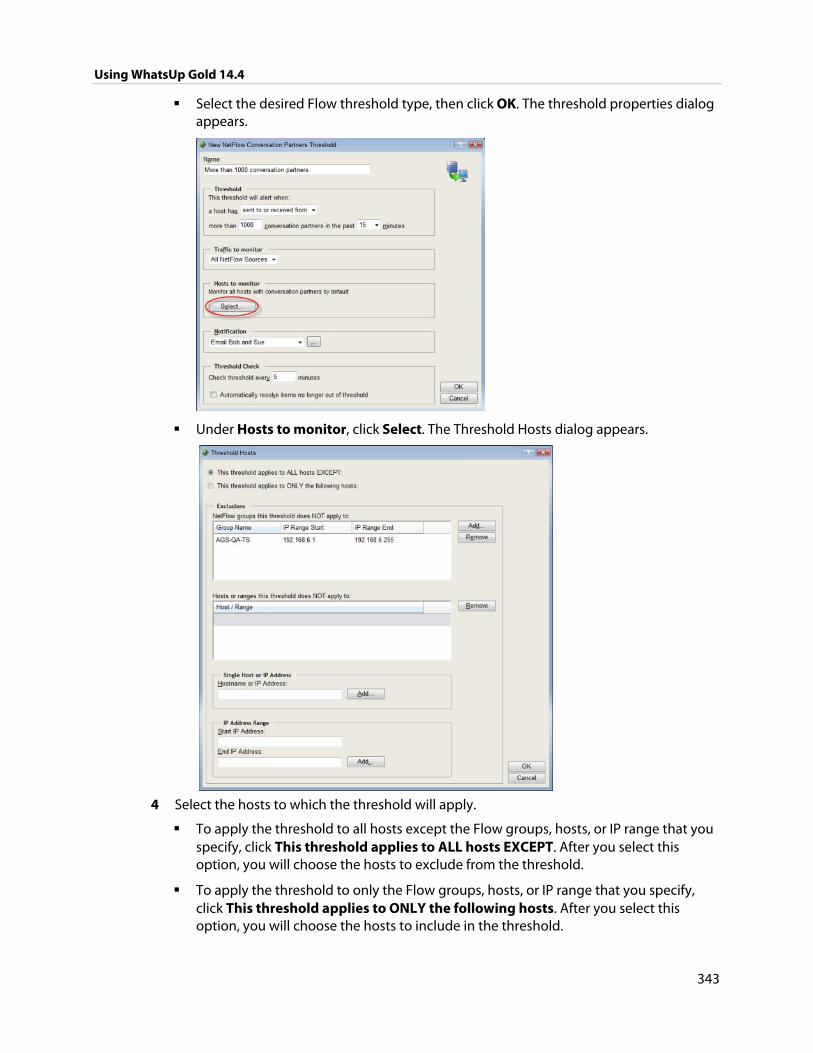
Using WhatsUp Gold 14.4
343
Select the desired Flow threshold type, then click OK. The threshold properties dialog appears.
Under Hosts to monitor, click Select. The Threshold Hosts dialog appears.
4 Select the hosts to which the threshold will apply.
To apply the threshold to all hosts except the Flow groups, hosts, or IP range that you specify, click This threshold applies to ALL hosts EXCEPT. After you select this option, you will choose the hosts to exclude from the threshold.
To apply the threshold to only the Flow groups, hosts, or IP range that you specify, click This threshold applies to ONLY the following hosts. After you select this option, you will choose the hosts to include in the threshold.
Using WhatsUp Gold 14.4
344
5 Select the specific hosts to include or exclude from the threshold.
To specify a Flow Group to include or exclude from this threshold, in the upper section of the dialog, click Add.
Tip: To delete a Flow group, host, or IP range from the list, select it, then click Remove.
To specify a single host or IP address to include or exclude from this threshold, enter a Hostname or IP Address, then click Add.
To specify an IP address range to include or exclude from this threshold, enter a Start IP Address and an End IP Address, then click Add.
6 Click OK to save changes.
About performance thresholds
Alert Center performance thresholds notify you on WhatsUp Gold performance monitors that have gone out of the parameters of the threshold you configure. You can create the following performance threshold types:
CPU (on page 344)
Custom Performance Monitor (on page 346)
Disk (on page 348)
Interface (on page 349)
Interface Errors and Discards (on page 351)
Memory (on page 353)
Ping Availability (on page 355)
Ping Response Time (on page 356)
Configuring a CPU utilization threshold
To configure a CPU utilization threshold:
1 Go to the Alert Center Home page:
From the web interface, click GO. The GO menu appears.
If the WhatsUp section is not visible, click WhatsUp. The WhatsUp section of the GO menu appears.
Select Alert Center. The Alert Center Home page appears.
Click Manage Thresholds. The Alert Center Threshold Library appears.
2 Click New. The Select Threshold Type dialog appears.
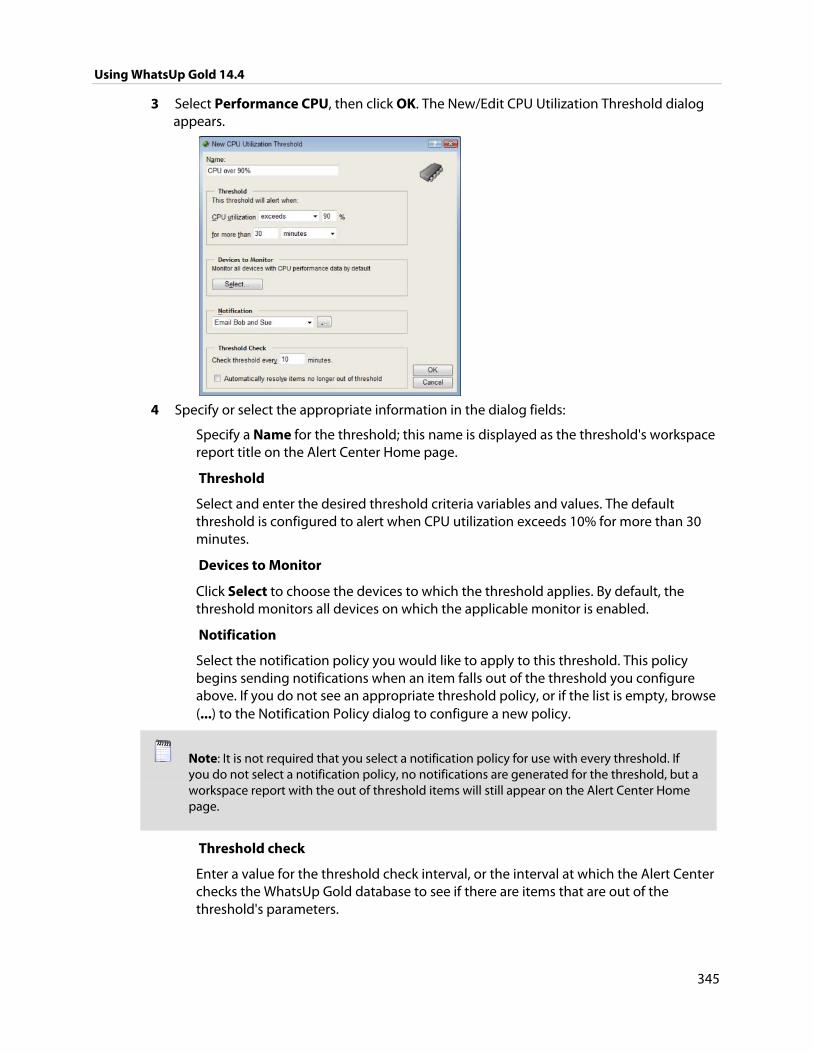
Using WhatsUp Gold 14.4
345
3 Select Performance CPU, then click OK. The New/Edit CPU Utilization Threshold dialog appears.
4 Specify or select the appropriate information in the dialog fields:
Specify a Name for the threshold; this name is displayed as the threshold's workspace report title on the Alert Center Home page.
Threshold
Select and enter the desired threshold criteria variables and values. The default threshold is configured to alert when CPU utilization exceeds 10% for more than 30 minutes.
Devices to Monitor
Click Select to choose the devices to which the threshold applies. By default, the threshold monitors all devices on which the applicable monitor is enabled.
Notification
Select the notification policy you would like to apply to this threshold. This policy begins sending notifications when an item falls out of the threshold you configure above. If you do not see an appropriate threshold policy, or if the list is empty, browse (...) to the Notification Policy dialog to configure a new policy.
Note: It is not required that you select a notification policy for use with every threshold. If you do not select a notification policy, no notifications are generated for the threshold, but a workspace report with the out of threshold items will still appear on the Alert Center Home page.
Threshold check
Enter a value for the threshold check interval, or the interval at which the Alert Center checks the WhatsUp Gold database to see if there are items that are out of the threshold's parameters.
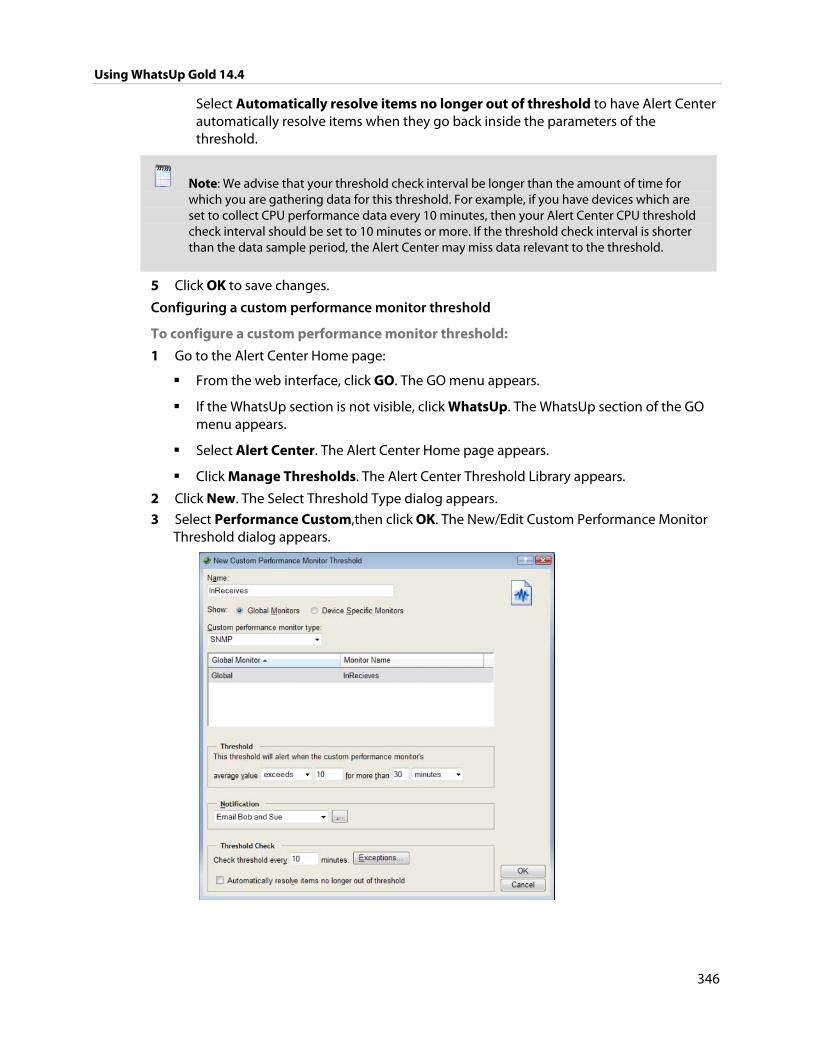
Using WhatsUp Gold 14.4
346
Select Automatically resolve items no longer out of threshold to have Alert Center automatically resolve items when they go back inside the parameters of the threshold.
Note: We advise that your threshold check interval be longer than the amount of time for which you are gathering data for this threshold. For example, if you have devices which are set to collect CPU performance data every 10 minutes, then your Alert Center CPU threshold check interval should be set to 10 minutes or more. If the threshold check interval is shorter than the data sample period, the Alert Center may miss data relevant to the threshold.
5 Click OK to save changes.
Configuring a custom performance monitor threshold
To configure a custom performance monitor threshold:
1 Go to the Alert Center Home page:
From the web interface, click GO. The GO menu appears.
If the WhatsUp section is not visible, click WhatsUp. The WhatsUp section of the GO menu appears.
Select Alert Center. The Alert Center Home page appears.
Click Manage Thresholds. The Alert Center Threshold Library appears.
2 Click New. The Select Threshold Type dialog appears.
3 Select Performance Custom,then click OK. The New/Edit Custom Performance Monitor Threshold dialog appears.
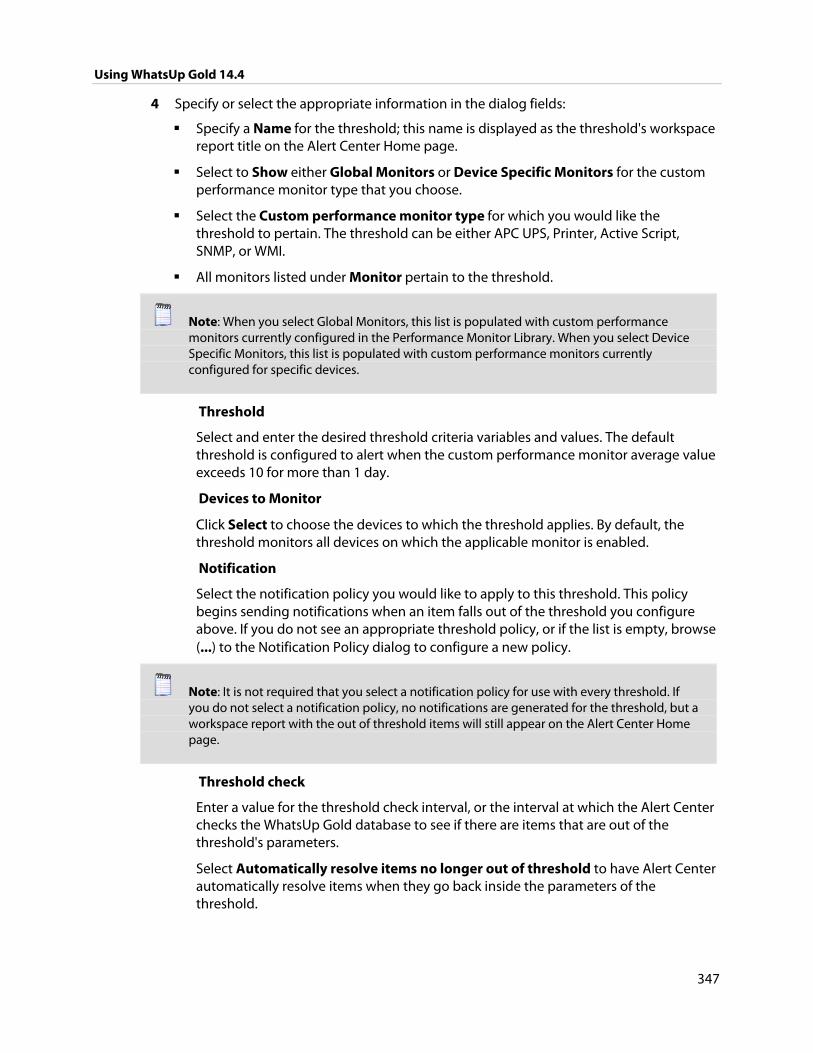
Using WhatsUp Gold 14.4
347
4 Specify or select the appropriate information in the dialog fields:
Specify a Name for the threshold; this name is displayed as the threshold's workspace report title on the Alert Center Home page.
Select to Show either Global Monitors or Device Specific Monitors for the custom performance monitor type that you choose.
Select the Custom performance monitor type for which you would like the threshold to pertain. The threshold can be either APC UPS, Printer, Active Script, SNMP, or WMI.
All monitors listed under Monitor pertain to the threshold.
Note: When you select Global Monitors, this list is populated with custom performance monitors currently configured in the Performance Monitor Library. When you select Device Specific Monitors, this list is populated with custom performance monitors currently configured for specific devices.
Threshold
Select and enter the desired threshold criteria variables and values. The default threshold is configured to alert when the custom performance monitor average value exceeds 10 for more than 1 day.
Devices to Monitor
Click Select to choose the devices to which the threshold applies. By default, the threshold monitors all devices on which the applicable monitor is enabled.
Notification
Select the notification policy you would like to apply to this threshold. This policy begins sending notifications when an item falls out of the threshold you configure above. If you do not see an appropriate threshold policy, or if the list is empty, browse (...) to the Notification Policy dialog to configure a new policy.
Note: It is not required that you select a notification policy for use with every threshold. If you do not select a notification policy, no notifications are generated for the threshold, but a workspace report with the out of threshold items will still appear on the Alert Center Home page.
Threshold check
Enter a value for the threshold check interval, or the interval at which the Alert Center checks the WhatsUp Gold database to see if there are items that are out of the threshold's parameters.
Select Automatically resolve items no longer out of threshold to have Alert Center automatically resolve items when they go back inside the parameters of the threshold.
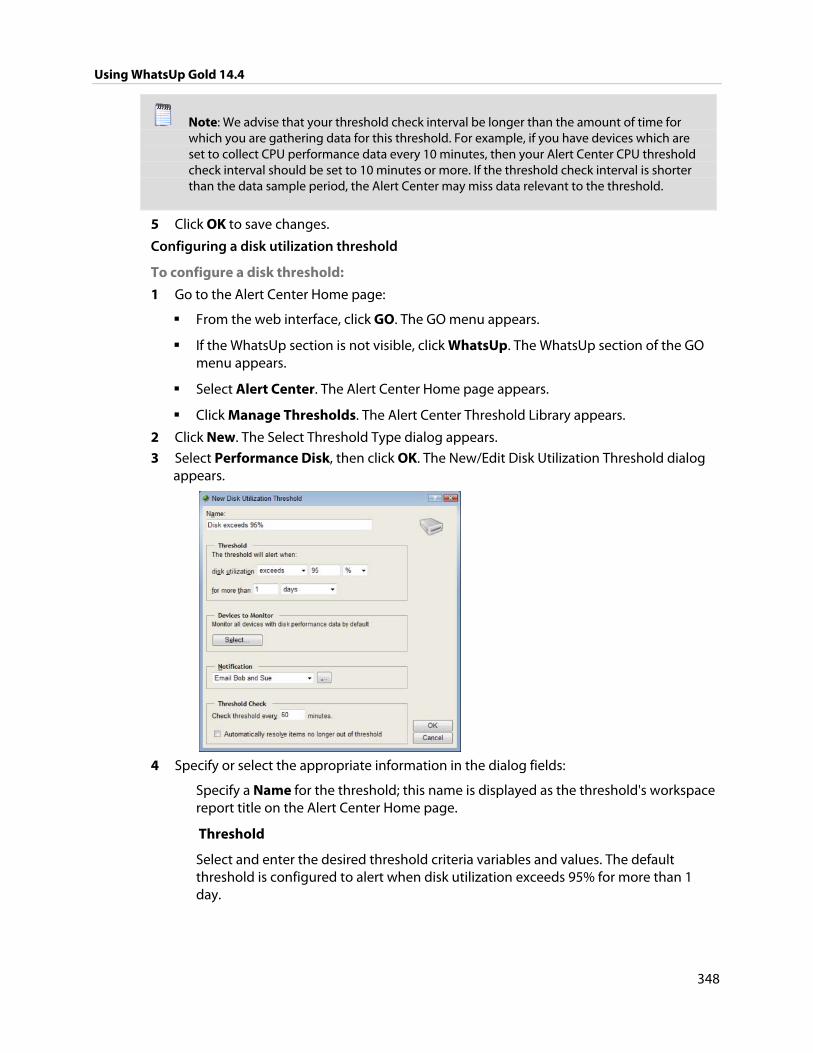
Using WhatsUp Gold 14.4
348
Note: We advise that your threshold check interval be longer than the amount of time for which you are gathering data for this threshold. For example, if you have devices which are set to collect CPU performance data every 10 minutes, then your Alert Center CPU threshold check interval should be set to 10 minutes or more. If the threshold check interval is shorter than the data sample period, the Alert Center may miss data relevant to the threshold.
5 Click OK to save changes.
Configuring a disk utilization threshold
To configure a disk threshold:
1 Go to the Alert Center Home page:
From the web interface, click GO. The GO menu appears.
If the WhatsUp section is not visible, click WhatsUp. The WhatsUp section of the GO menu appears.
Select Alert Center. The Alert Center Home page appears.
Click Manage Thresholds. The Alert Center Threshold Library appears.
2 Click New. The Select Threshold Type dialog appears.
3 Select Performance Disk, then click OK. The New/Edit Disk Utilization Threshold dialog appears.
4 Specify or select the appropriate information in the dialog fields:
Specify a Name for the threshold; this name is displayed as the threshold's workspace report title on the Alert Center Home page.
Threshold
Select and enter the desired threshold criteria variables and values. The default threshold is configured to alert when disk utilization exceeds 95% for more than 1 day.

Using WhatsUp Gold 14.4
349
Devices to Monitor
Click Select to choose the devices to which the threshold applies. By default, the threshold monitors all devices on which the applicable monitor is enabled.
Notification
Select the notification policy you would like to apply to this threshold. This policy begins sending notifications when an item falls out of the threshold you configure above. If you do not see an appropriate threshold policy, or if the list is empty, browse (...) to the Notification Policy dialog to configure a new policy.
Note: It is not required that you select a notification policy for use with every threshold. If you do not select a notification policy, no notifications are generated for the threshold, but a workspace report with the out of threshold items will still appear on the Alert Center Home page.
Threshold check
Enter a value for the threshold check interval, or the interval at which the Alert Center checks the WhatsUp Gold database to see if there are items that are out of the threshold's parameters.
Select Automatically resolve items no longer out of threshold to have Alert Center automatically resolve items when they go back inside the parameters of the threshold.
Note: We advise that your threshold check interval be longer than the amount of time for which you are gathering data for this threshold. For example, if you have devices which are set to collect CPU performance data every 10 minutes, then your Alert Center CPU threshold check interval should be set to 10 minutes or more. If the threshold check interval is shorter than the data sample period, the Alert Center may miss data relevant to the threshold.
5 Click OK to save changes.
Configuring an interface utilization threshold
To configure an interface utilization threshold:
1 Go to the Alert Center Home page:
From the web interface, click GO. The GO menu appears.
If the WhatsUp section is not visible, click WhatsUp. The WhatsUp section of the GO menu appears.
Select Alert Center. The Alert Center Home page appears.
Click Manage Thresholds. The Alert Center Threshold Library appears.
2 Click New. The Select Threshold Type dialog appears.
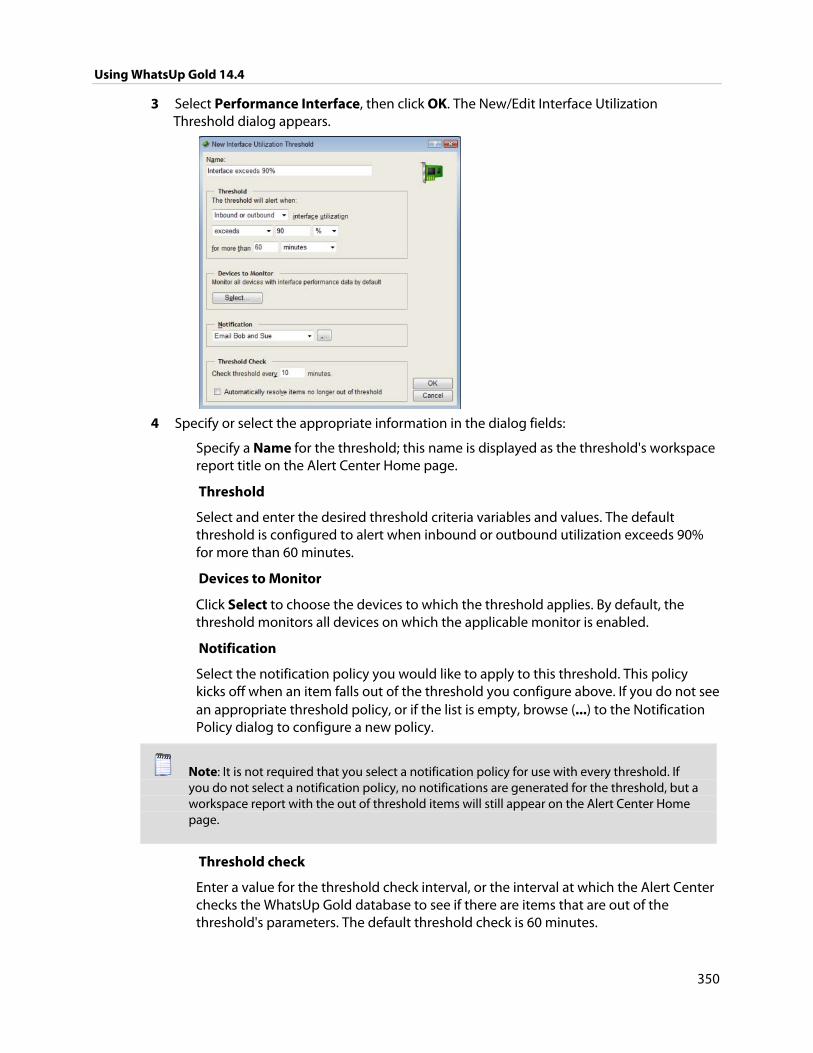
Using WhatsUp Gold 14.4
350
3 Select Performance Interface, then click OK. The New/Edit Interface Utilization Threshold dialog appears.
4 Specify or select the appropriate information in the dialog fields:
Specify a Name for the threshold; this name is displayed as the threshold's workspace report title on the Alert Center Home page.
Threshold
Select and enter the desired threshold criteria variables and values. The default threshold is configured to alert when inbound or outbound utilization exceeds 90% for more than 60 minutes.
Devices to Monitor
Click Select to choose the devices to which the threshold applies. By default, the threshold monitors all devices on which the applicable monitor is enabled.
Notification
Select the notification policy you would like to apply to this threshold. This policy kicks off when an item falls out of the threshold you configure above. If you do not see an appropriate threshold policy, or if the list is empty, browse (...) to the Notification Policy dialog to configure a new policy.
Note: It is not required that you select a notification policy for use with every threshold. If you do not select a notification policy, no notifications are generated for the threshold, but a workspace report with the out of threshold items will still appear on the Alert Center Home page.
Threshold check
Enter a value for the threshold check interval, or the interval at which the Alert Center checks the WhatsUp Gold database to see if there are items that are out of the threshold's parameters. The default threshold check is 60 minutes.
Using WhatsUp Gold 14.4
351
Select Automatically resolve items for this threshold to have Alert Center automatically resolve items when they go back inside the parameters of the threshold.
Note: We advise that your polling interval be shorter than the amount of time for which you are gathering data for this threshold. For example, if you configure a threshold that checks CPU data every 10 minutes, your polling interval should be 9 minutes or less. If the polling interval is longer than the data sample period, the Alert Center may miss data relevant to the threshold.
5 Click OK to save changes.
Configuring an interface utilization errors and discards threshold
To configure an interface utilization discard and error threshold:
1 Go to the Alert Center Home page:
From the web interface, click GO. The GO menu appears.
If the WhatsUp section is not visible, click WhatsUp. The WhatsUp section of the GO menu appears.
Select Alert Center. The Alert Center Home page appears.
Click Manage Thresholds. The Alert Center Threshold Library appears.
2 Click New. The Select Threshold Type dialog appears.
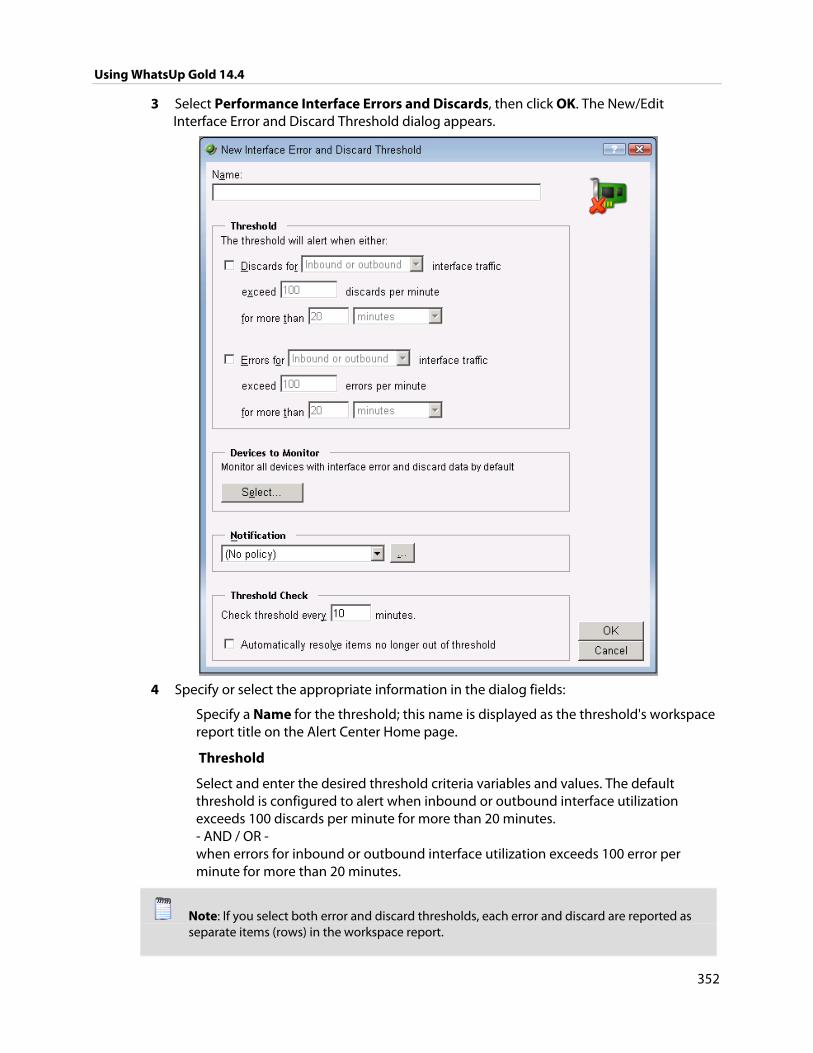
Using WhatsUp Gold 14.4
352
3 Select Performance Interface Errors and Discards, then click OK. The New/Edit Interface Error and Discard Threshold dialog appears.
4 Specify or select the appropriate information in the dialog fields:
Specify a Name for the threshold; this name is displayed as the threshold's workspace report title on the Alert Center Home page.
Threshold
Select and enter the desired threshold criteria variables and values. The default threshold is configured to alert when inbound or outbound interface utilization exceeds 100 discards per minute for more than 20 minutes. - AND / OR - when errors for inbound or outbound interface utilization exceeds 100 error per minute for more than 20 minutes.
Note: If you select both error and discard thresholds, each error and discard are reported as separate items (rows) in the workspace report.
Using WhatsUp Gold 14.4
353
Devices to Monitor
Click Select to choose the devices to which the threshold applies. By default, the threshold monitors all devices on which the applicable monitor is enabled.
Notification
Select the notification policy you would like to apply to this threshold. This policy kicks off when an item falls out of the threshold you configure above. If you do not see an appropriate threshold policy, or if the list is empty, browse (...) to the Notification Policy dialog to configure a new policy.
Note: It is not required that you select a notification policy for use with every threshold. If you do not select a notification policy, no notifications are generated for the threshold, but a workspace report with the out of threshold items will still appear on the Alert Center Home page.
Threshold check
Enter a value for the threshold check interval, or the interval at which the Alert Center checks the WhatsUp Gold database to see if there are items that are out of the threshold's parameters. The default threshold check is 10 minutes.
Select Automatically resolve items for this threshold to have Alert Center automatically resolve items when they go back inside the parameters of the threshold.
Note: We advise that your polling interval be shorter than the amount of time for which you are gathering data for this threshold. For example, if you configure a threshold that checks CPU data every 10 minutes, your polling interval should be 9 minutes or less. If the polling interval is longer than the data sample period, the Alert Center may miss data relevant to the threshold.
5 Click OK to save changes.
Configuring a memory utilization threshold
To configure a memory utilization threshold:
1 Go to the Alert Center Home page:
From the web interface, click GO. The GO menu appears.
If the WhatsUp section is not visible, click WhatsUp. The WhatsUp section of the GO menu appears.
Select Alert Center. The Alert Center Home page appears.
Click Manage Thresholds. The Alert Center Threshold Library appears.
2 Click New. The Select Threshold Type dialog appears.

Using WhatsUp Gold 14.4
354
3 Select Performance Memory, then click OK. The New/Edit Memory Utilization Threshold dialog appears.
4 Specify or select the appropriate information in the dialog fields:
Specify a Name for the threshold; this name is displayed as the threshold's workspace report title on the Alert Center Home page.
Threshold
Select and enter the desired threshold criteria variables and values. The default threshold is configured to alert when disk utilization exceeds 95% for more than 1 hour.
Devices to Monitor
Click Select to choose the devices to which the threshold applies. By default, the threshold monitors all devices on which the applicable monitor is enabled.
Notification
Select the notification policy you would like to apply to this threshold. This policy begins sending notifications when an item falls out of the threshold you configure above. If you do not see an appropriate threshold policy, or if the list is empty, browse (...) to the Notification Policy dialog to configure a new policy.
Note: It is not required that you select a notification policy for use with every threshold. If you do not select a notification policy, no notifications are generated for the threshold, but a workspace report with the out of threshold items will still appear on the Alert Center Home page.
Threshold check
Enter a value for the threshold check interval, or the interval at which the Alert Center checks the WhatsUp Gold database to see if there are items that are out of the threshold's parameters.
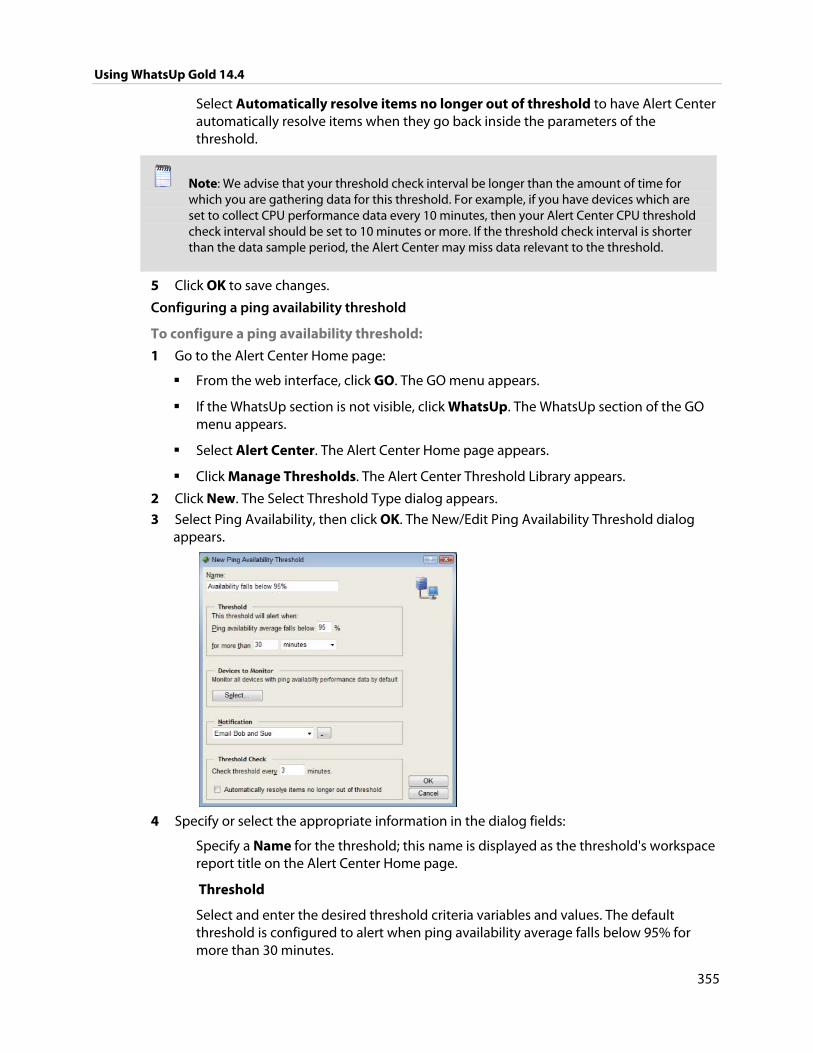
Using WhatsUp Gold 14.4
355
Select Automatically resolve items no longer out of threshold to have Alert Center automatically resolve items when they go back inside the parameters of the threshold.
Note: We advise that your threshold check interval be longer than the amount of time for which you are gathering data for this threshold. For example, if you have devices which are set to collect CPU performance data every 10 minutes, then your Alert Center CPU threshold check interval should be set to 10 minutes or more. If the threshold check interval is shorter than the data sample period, the Alert Center may miss data relevant to the threshold.
5 Click OK to save changes.
Configuring a ping availability threshold
To configure a ping availability threshold:
1 Go to the Alert Center Home page:
From the web interface, click GO. The GO menu appears.
If the WhatsUp section is not visible, click WhatsUp. The WhatsUp section of the GO menu appears.
Select Alert Center. The Alert Center Home page appears.
Click Manage Thresholds. The Alert Center Threshold Library appears.
2 Click New. The Select Threshold Type dialog appears.
3 Select Ping Availability, then click OK. The New/Edit Ping Availability Threshold dialog appears.
4 Specify or select the appropriate information in the dialog fields:
Specify a Name for the threshold; this name is displayed as the threshold's workspace report title on the Alert Center Home page.
Threshold
Select and enter the desired threshold criteria variables and values. The default threshold is configured to alert when ping availability average falls below 95% for more than 30 minutes.
Using WhatsUp Gold 14.4
356
Devices to Monitor
Click Select to choose the devices to which the threshold applies. By default, the threshold monitors all devices on which the applicable monitor is enabled.
Notification
Select the notification policy you would like to apply to this threshold. This policy begins sending notifications when an item falls out of the threshold you configure above. If you do not see an appropriate threshold policy, or if the list is empty, browse (...) to the Notification Policy dialog to configure a new policy.
Note: It is not required that you select a notification policy for use with every threshold. If you do not select a notification policy, no notifications are generated for the threshold, but a workspace report with the out of threshold items will still appear on the Alert Center Home page.
Threshold check
Enter a value for the threshold check interval, or the interval at which the Alert Center checks the WhatsUp Gold database to see if there are items that are out of the threshold's parameters.
Select Automatically resolve items no longer out of threshold to have Alert Center automatically resolve items when they go back inside the parameters of the threshold.
Note: We advise that your threshold check interval be longer than the amount of time for which you are gathering data for this threshold. For example, if you have devices which are set to collect CPU performance data every 10 minutes, then your Alert Center CPU threshold check interval should be set to 10 minutes or more. If the threshold check interval is shorter than the data sample period, the Alert Center may miss data relevant to the threshold.
5 Click OK to save changes.
Configuring a ping response time threshold
To configure a ping response time threshold:
1 Go to the Alert Center Home page:
From the web interface, click GO. The GO menu appears.
If the WhatsUp section is not visible, click WhatsUp. The WhatsUp section of the GO menu appears.
Select Alert Center. The Alert Center Home page appears.
Click Manage Thresholds. The Alert Center Threshold Library appears.
2 Click New. The Select Threshold Type dialog appears.
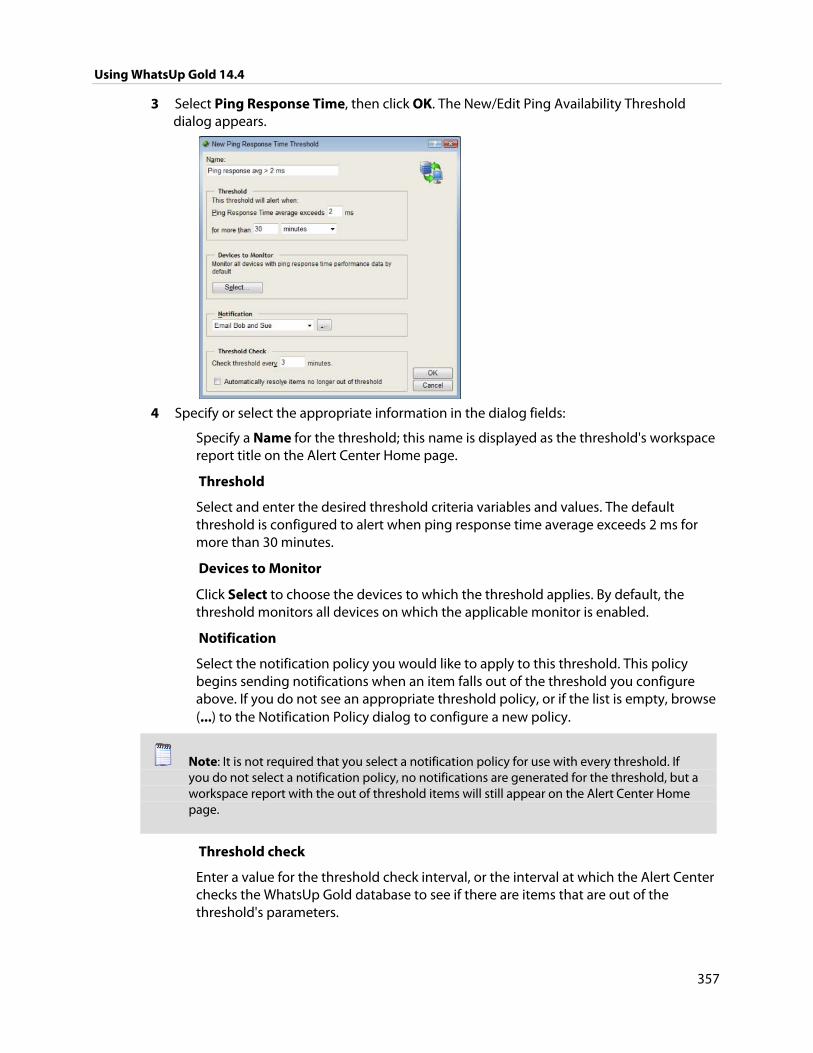
Using WhatsUp Gold 14.4
357
3 Select Ping Response Time, then click OK. The New/Edit Ping Availability Threshold dialog appears.
4 Specify or select the appropriate information in the dialog fields:
Specify a Name for the threshold; this name is displayed as the threshold's workspace report title on the Alert Center Home page.
Threshold
Select and enter the desired threshold criteria variables and values. The default threshold is configured to alert when ping response time average exceeds 2 ms for more than 30 minutes.
Devices to Monitor
Click Select to choose the devices to which the threshold applies. By default, the threshold monitors all devices on which the applicable monitor is enabled.
Notification
Select the notification policy you would like to apply to this threshold. This policy begins sending notifications when an item falls out of the threshold you configure above. If you do not see an appropriate threshold policy, or if the list is empty, browse (...) to the Notification Policy dialog to configure a new policy.
Note: It is not required that you select a notification policy for use with every threshold. If you do not select a notification policy, no notifications are generated for the threshold, but a workspace report with the out of threshold items will still appear on the Alert Center Home page.
Threshold check
Enter a value for the threshold check interval, or the interval at which the Alert Center checks the WhatsUp Gold database to see if there are items that are out of the threshold's parameters.
Using WhatsUp Gold 14.4
358
Select Automatically resolve items no longer out of threshold to have Alert Center automatically resolve items when they go back inside the parameters of the threshold.
Note: We advise that your threshold check interval be longer than the amount of time for which you are gathering data for this threshold. For example, if you have devices which are set to collect CPU performance data every 10 minutes, then your Alert Center CPU threshold check interval should be set to 10 minutes or more. If the threshold check interval is shorter than the data sample period, the Alert Center may miss data relevant to the threshold.
5 Click OK to save changes.
Configuring passive thresholds
Alert Center passive thresholds notify you when WhatsUp Gold passive monitors fall out of the parameters of the thresholds you configure. You can create three passive threshold types:
SNMP trap (on page 358)
Syslog (on page 360)
Windows Event Log
Several things to keep in mind when configuring thresholds for passive monitors:
For a passive threshold to work, the passive monitor for which you are creating a threshold must be assigned to and collecting traps from at least one device.
For each type of passive threshold, the list of available monitors for which you can create a threshold is populated with monitors currently configured for use in the Passive Monitor Library. However, the monitors in this list are not necessarily assigned to any devices. You can create a dynamic group to find the devices to which a particular passive monitor is assigned to see if that particular monitor warrants an Alert Center threshold. For more information, see Dynamic Group Examples (on page 126).
There is no mechanism in the Alert Center to monitor unsolicited traps.
Configuring an SNMP trap threshold
To configure an SNMP trap threshold:
1 Go to the Alert Center Home page:
From the web interface, click GO. The GO menu appears.
If the WhatsUp section is not visible, click WhatsUp. The WhatsUp section of the GO menu appears.
Select Alert Center. The Alert Center Home page appears.
Click Manage Thresholds. The Alert Center Threshold Library appears.
2 Click New. The Select Threshold Type dialog appears.
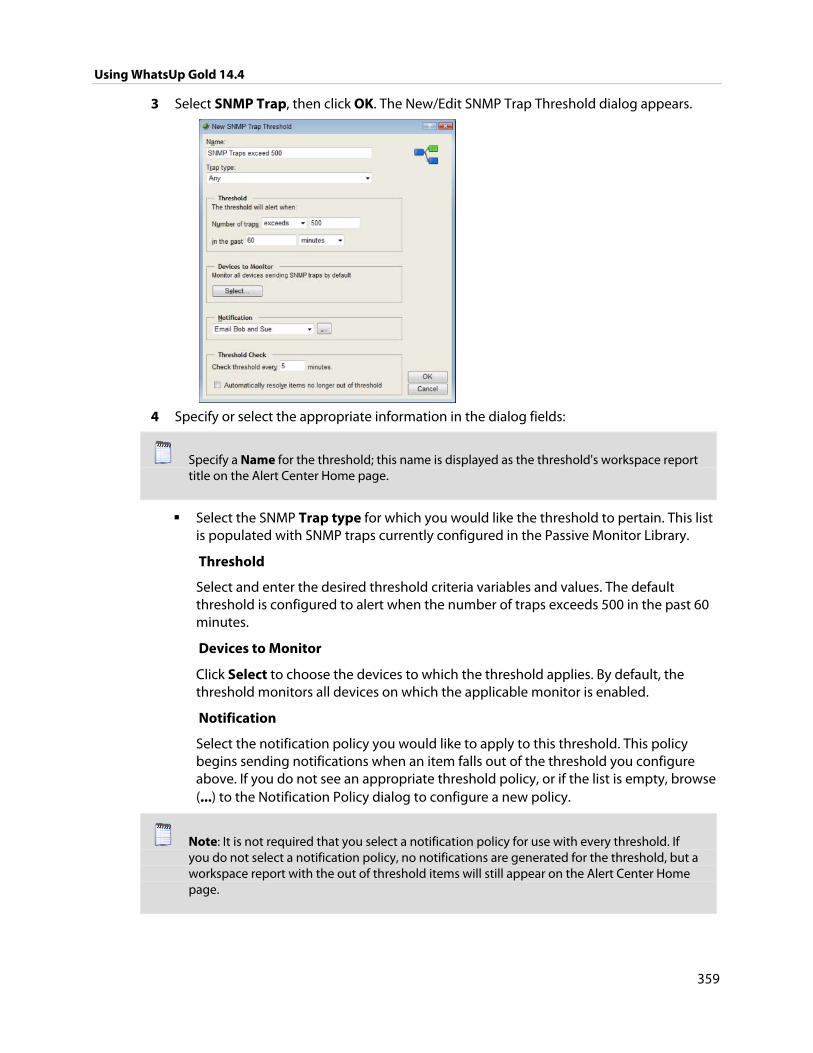
Using WhatsUp Gold 14.4
359
3 Select SNMP Trap, then click OK. The New/Edit SNMP Trap Threshold dialog appears.
4 Specify or select the appropriate information in the dialog fields:
Specify a Name for the threshold; this name is displayed as the threshold's workspace report title on the Alert Center Home page.
Select the SNMP Trap type for which you would like the threshold to pertain. This list is populated with SNMP traps currently configured in the Passive Monitor Library.
Threshold
Select and enter the desired threshold criteria variables and values. The default threshold is configured to alert when the number of traps exceeds 500 in the past 60 minutes.
Devices to Monitor
Click Select to choose the devices to which the threshold applies. By default, the threshold monitors all devices on which the applicable monitor is enabled.
Notification
Select the notification policy you would like to apply to this threshold. This policy begins sending notifications when an item falls out of the threshold you configure above. If you do not see an appropriate threshold policy, or if the list is empty, browse (...) to the Notification Policy dialog to configure a new policy.
Note: It is not required that you select a notification policy for use with every threshold. If you do not select a notification policy, no notifications are generated for the threshold, but a workspace report with the out of threshold items will still appear on the Alert Center Home page.
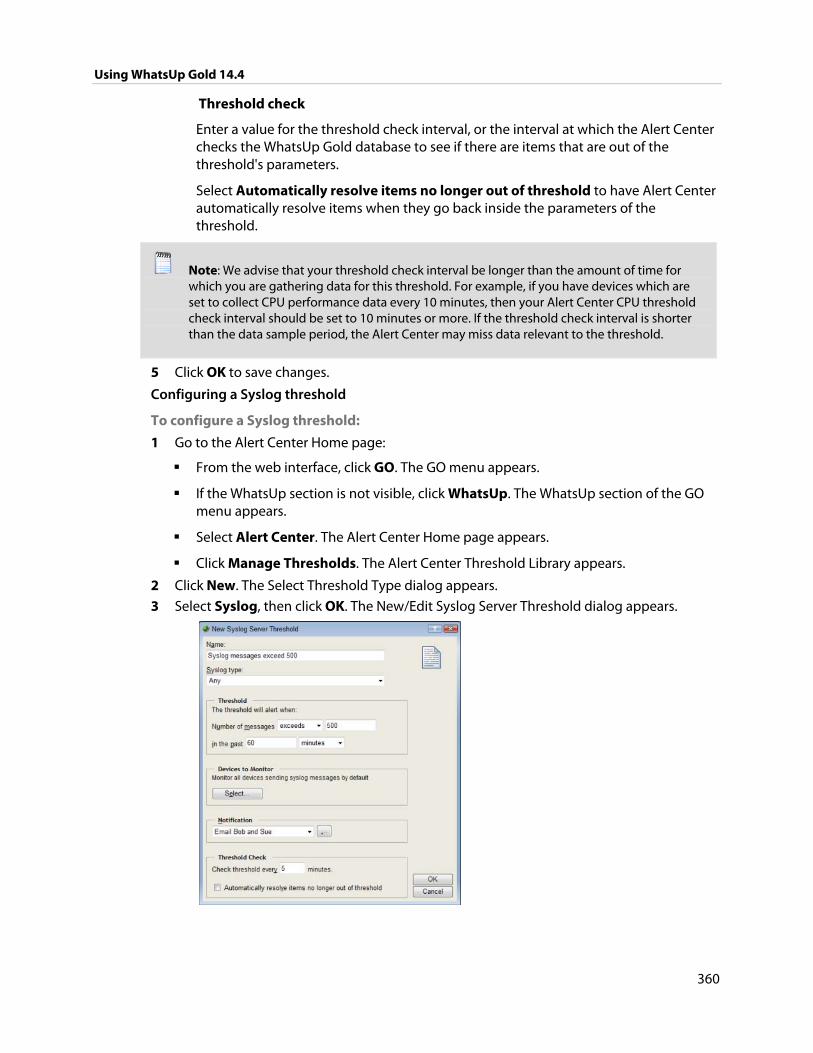
Using WhatsUp Gold 14.4
360
Threshold check
Enter a value for the threshold check interval, or the interval at which the Alert Center checks the WhatsUp Gold database to see if there are items that are out of the threshold's parameters.
Select Automatically resolve items no longer out of threshold to have Alert Center automatically resolve items when they go back inside the parameters of the threshold.
Note: We advise that your threshold check interval be longer than the amount of time for which you are gathering data for this threshold. For example, if you have devices which are set to collect CPU performance data every 10 minutes, then your Alert Center CPU threshold check interval should be set to 10 minutes or more. If the threshold check interval is shorter than the data sample period, the Alert Center may miss data relevant to the threshold.
5 Click OK to save changes.
Configuring a Syslog threshold
To configure a Syslog threshold:
1 Go to the Alert Center Home page:
From the web interface, click GO. The GO menu appears.
If the WhatsUp section is not visible, click WhatsUp. The WhatsUp section of the GO menu appears.
Select Alert Center. The Alert Center Home page appears.
Click Manage Thresholds. The Alert Center Threshold Library appears.
2 Click New. The Select Threshold Type dialog appears.
3 Select Syslog, then click OK. The New/Edit Syslog Server Threshold dialog appears.
Using WhatsUp Gold 14.4
361
4 Specify or select the appropriate information in the dialog fields:
Specify a Name for the threshold; this name is displayed as the threshold's workspace report title on the Alert Center Home page.
Select the Syslog type for which you would like the threshold to pertain. This list is populated with Syslog monitors currently configured in the Passive Monitor Library.
Threshold
Select and enter the desired threshold criteria variables and values. The default threshold is configured to alert when the number of messages exceeds 500 in the past 60 minutes.
Devices to Monitor
Click Select to choose the devices to which the threshold applies. By default, the threshold monitors all devices on which the applicable monitor is enabled.
Notification
Select the notification policy you would like to apply to this threshold. This policy begins sending notifications when an item falls out of the threshold you configure above. If you do not see an appropriate threshold policy, or if the list is empty, browse (...) to the Notification Policy dialog to configure a new policy.
Note: It is not required that you select a notification policy for use with every threshold. If you do not select a notification policy, no notifications are generated for the threshold, but a workspace report with the out of threshold items will still appear on the Alert Center Home page.
Threshold check
Enter a value for the threshold check interval, or the interval at which the Alert Center checks the WhatsUp Gold database to see if there are items that are out of the threshold's parameters.
Select Automatically resolve items no longer out of threshold to have Alert Center automatically resolve items when they go back inside the parameters of the threshold.
Note: We advise that your threshold check interval be longer than the amount of time for which you are gathering data for this threshold. For example, if you have devices which are set to collect CPU performance data every 10 minutes, then your Alert Center CPU threshold check interval should be set to 10 minutes or more. If the threshold check interval is shorter than the data sample period, the Alert Center may miss data relevant to the threshold.
5 Click OK to save changes.
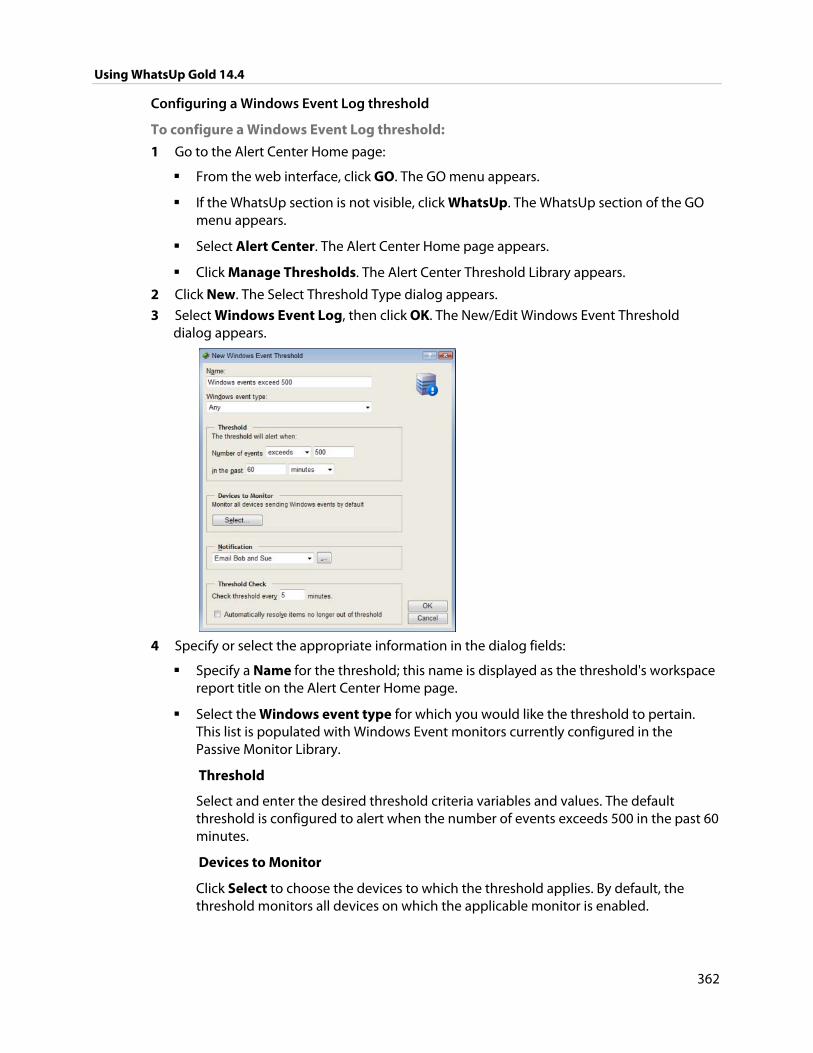
Using WhatsUp Gold 14.4
362
Configuring a Windows Event Log threshold
To configure a Windows Event Log threshold:
1 Go to the Alert Center Home page:
From the web interface, click GO. The GO menu appears.
If the WhatsUp section is not visible, click WhatsUp. The WhatsUp section of the GO menu appears.
Select Alert Center. The Alert Center Home page appears.
Click Manage Thresholds. The Alert Center Threshold Library appears.
2 Click New. The Select Threshold Type dialog appears.
3 Select Windows Event Log, then click OK. The New/Edit Windows Event Threshold dialog appears.
4 Specify or select the appropriate information in the dialog fields:
Specify a Name for the threshold; this name is displayed as the threshold's workspace report title on the Alert Center Home page.
Select the Windows event type for which you would like the threshold to pertain. This list is populated with Windows Event monitors currently configured in the Passive Monitor Library.
Threshold
Select and enter the desired threshold criteria variables and values. The default threshold is configured to alert when the number of events exceeds 500 in the past 60 minutes.
Devices to Monitor
Click Select to choose the devices to which the threshold applies. By default, the threshold monitors all devices on which the applicable monitor is enabled.

Using WhatsUp Gold 14.4
363
Notification
Select the notification policy you would like to apply to this threshold. This policy begins sending notifications when an item falls out of the threshold you configure above. If you do not see an appropriate threshold policy, or if the list is empty, browse (...) to the Notification Policy dialog to configure a new policy.
Note: It is not required that you select a notification policy for use with every threshold. If you do not select a notification policy, no notifications are generated for the threshold, but a workspace report with the out of threshold items will still appear on the Alert Center Home page.
Threshold check
Enter a value for the threshold check interval, or the interval at which the Alert Center checks the WhatsUp Gold database to see if there are items that are out of the threshold's parameters.
Select Automatically resolve items no longer out of threshold to have Alert Center automatically resolve items when they go back inside the parameters of the threshold.
Note: We advise that your threshold check interval be longer than the amount of time for which you are gathering data for this threshold. For example, if you have devices which are set to collect CPU performance data every 10 minutes, then your Alert Center CPU threshold check interval should be set to 10 minutes or more. If the threshold check interval is shorter than the data sample period, the Alert Center may miss data relevant to the threshold.
5 Click OK to save changes.
Configuring Flow Monitor thresholds
Alert Center Flow Monitor thresholds notify you on WhatsUp Gold Flow Monitor plug-in aspects that fall out of the parameters of the thresholds you create.
You can create five Flow Monitor threshold types:
Flow Monitor conversation partners (on page 363)
Flow Monitor custom threshold (on page 365)
Flow Monitor failed connections (on page 367)
Flow Monitor interface traffic (on page 369)
Flow Monitor top sender/receiver (on page 371)
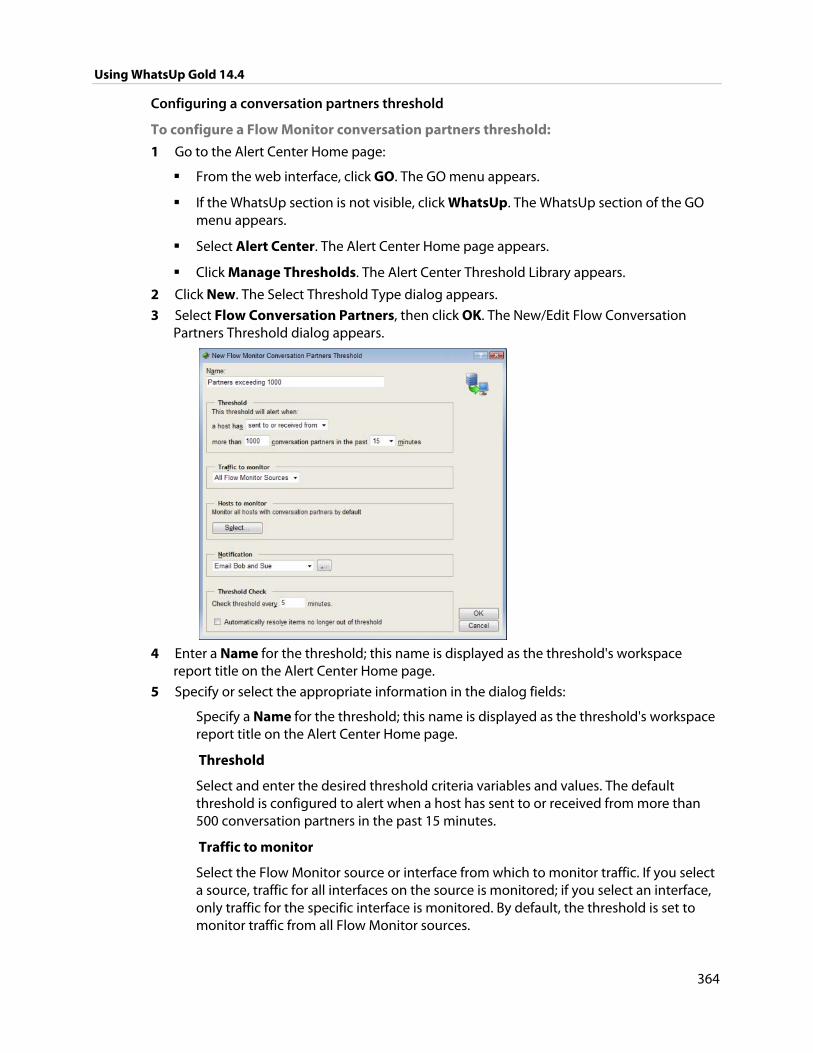
Using WhatsUp Gold 14.4
364
Configuring a conversation partners threshold
To configure a Flow Monitor conversation partners threshold:
1 Go to the Alert Center Home page:
From the web interface, click GO. The GO menu appears.
If the WhatsUp section is not visible, click WhatsUp. The WhatsUp section of the GO menu appears.
Select Alert Center. The Alert Center Home page appears.
Click Manage Thresholds. The Alert Center Threshold Library appears.
2 Click New. The Select Threshold Type dialog appears.
3 Select Flow Conversation Partners, then click OK. The New/Edit Flow Conversation Partners Threshold dialog appears.
4 Enter a Name for the threshold; this name is displayed as the threshold's workspace
report title on the Alert Center Home page.
5 Specify or select the appropriate information in the dialog fields:
Specify a Name for the threshold; this name is displayed as the threshold's workspace report title on the Alert Center Home page.
Threshold
Select and enter the desired threshold criteria variables and values. The default threshold is configured to alert when a host has sent to or received from more than 500 conversation partners in the past 15 minutes.
Traffic to monitor
Select the Flow Monitor source or interface from which to monitor traffic. If you select a source, traffic for all interfaces on the source is monitored; if you select an interface, only traffic for the specific interface is monitored. By default, the threshold is set to monitor traffic from all Flow Monitor sources.
Using WhatsUp Gold 14.4
365
Note: Sources sending sampled data are not displayed as a selection option in the Traffic to monitor list because Flow Monitor cannot determine that traffic has failed on sampled data.
Hosts to monitor
Click Select to choose the hosts to which the threshold applies. By default, the threshold monitors all applicable hosts.
Notification
Select the notification policy you would like to apply to this threshold. This policy begins sending notifications when an item falls out of the threshold you configure above. If you do not see an appropriate threshold policy, or if the list is empty, browse (...) to the Notification Policy dialog to configure a new policy.
Note: It is not required that you select a notification policy for use with every threshold. If you do not select a notification policy, no notifications are generated for the threshold, but a workspace report with the out of threshold items will still appear on the Alert Center Home page.
Threshold check
Enter a value for the threshold check interval, or the interval at which the Alert Center checks the WhatsUp Gold database to see if there are items that are out of the threshold's parameters. The default polling interval is 3 minutes.
Select Automatically resolve items no longer out of threshold to have Alert Center automatically resolve items when they go back inside the parameters of the threshold.
Note: We advise that your threshold check interval be longer than the amount of time for which you are gathering data for this threshold. For example, if you have devices which are set to collect CPU performance data every 10 minutes, then your Alert Center CPU threshold check interval should be set to 10 minutes or more. If the threshold check interval is shorter than the data sample period, the Alert Center may miss data relevant to the threshold.
6 Click OK to save changes.
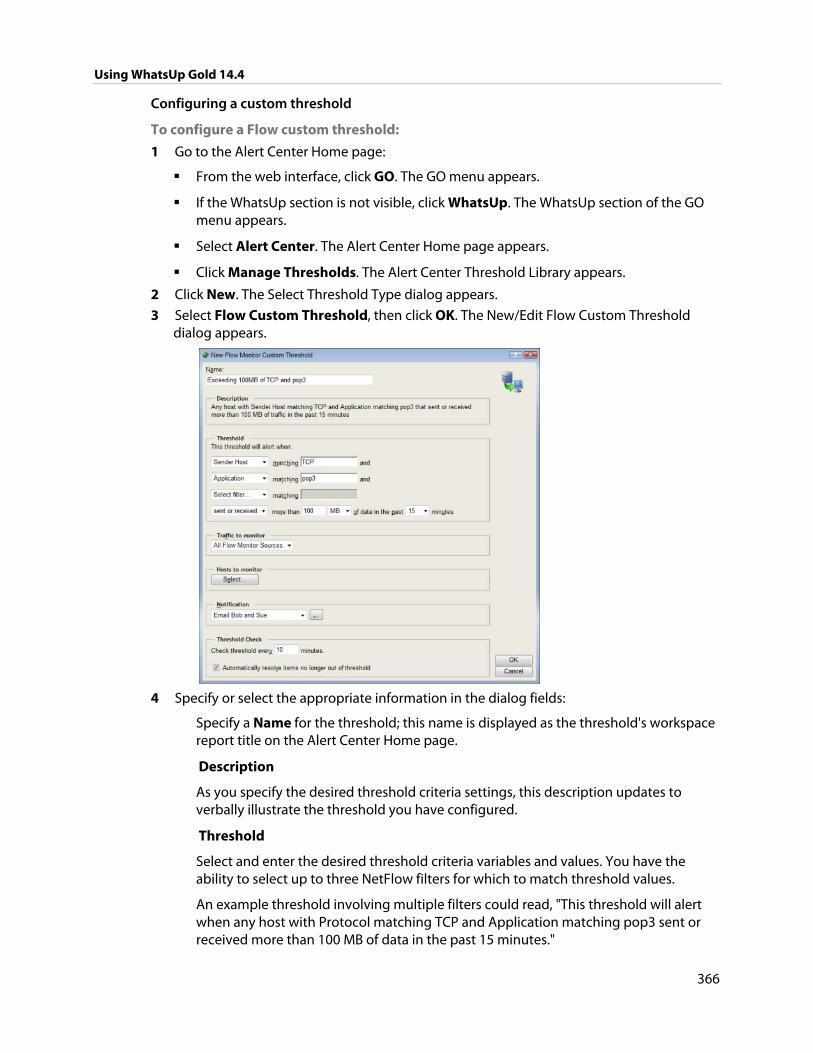
Using WhatsUp Gold 14.4
366
Configuring a custom threshold
To configure a Flow custom threshold:
1 Go to the Alert Center Home page:
From the web interface, click GO. The GO menu appears.
If the WhatsUp section is not visible, click WhatsUp. The WhatsUp section of the GO menu appears.
Select Alert Center. The Alert Center Home page appears.
Click Manage Thresholds. The Alert Center Threshold Library appears.
2 Click New. The Select Threshold Type dialog appears.
3 Select Flow Custom Threshold, then click OK. The New/Edit Flow Custom Threshold dialog appears.
4 Specify or select the appropriate information in the dialog fields:
Specify a Name for the threshold; this name is displayed as the threshold's workspace report title on the Alert Center Home page.
Description
As you specify the desired threshold criteria settings, this description updates to verbally illustrate the threshold you have configured.
Threshold
Select and enter the desired threshold criteria variables and values. You have the ability to select up to three NetFlow filters for which to match threshold values.
An example threshold involving multiple filters could read, "This threshold will alert when any host with Protocol matching TCP and Application matching pop3 sent or received more than 100 MB of data in the past 15 minutes."
Using WhatsUp Gold 14.4
367
The default threshold time value is data in the past 15 minutes.
Traffic to monitor
Select the Flow Monitor source or interface from which to monitor traffic. If you select a source, traffic for all interfaces on the source is monitored; if you select an interface, only traffic for the specific interface is monitored. By default, the threshold is set to monitor traffic from all Flow Monitor sources.
Note: Sources sending sampled data are not displayed as a selection option in the Traffic to monitor list because Flow Monitor cannot determine that traffic has failed on sampled data.
Hosts to monitor
Click Select to choose the hosts to which the threshold applies. By default, the threshold monitors all applicable hosts.
Notification
Select the notification policy you would like to apply to this threshold. This policy begins sending notifications when an item falls out of the threshold you configure above. If you do not see an appropriate threshold policy, or if the list is empty, browse (...) to the Notification Policy dialog to configure a new policy.
Note: It is not required that you select a notification policy for use with every threshold. If you do not select a notification policy, no notifications are generated for the threshold, but a workspace report with the out of threshold items will still appear on the Alert Center Home page.
Threshold check
Enter a value for the threshold check interval, or the interval at which the Alert Center checks the WhatsUp Gold database to see if there are items that are out of the threshold's parameters. The default polling interval is 3 minutes.
Select Automatically resolve items no longer out of threshold to have Alert Center automatically resolve items when they go back inside the parameters of the threshold.
Note: We advise that your threshold check interval be longer than the amount of time for which you are gathering data for this threshold. For example, if you have devices which are set to collect CPU performance data every 10 minutes, then your Alert Center CPU threshold check interval should be set to 10 minutes or more. If the threshold check interval is shorter than the data sample period, the Alert Center may miss data relevant to the threshold.
5 Click OK to save changes.
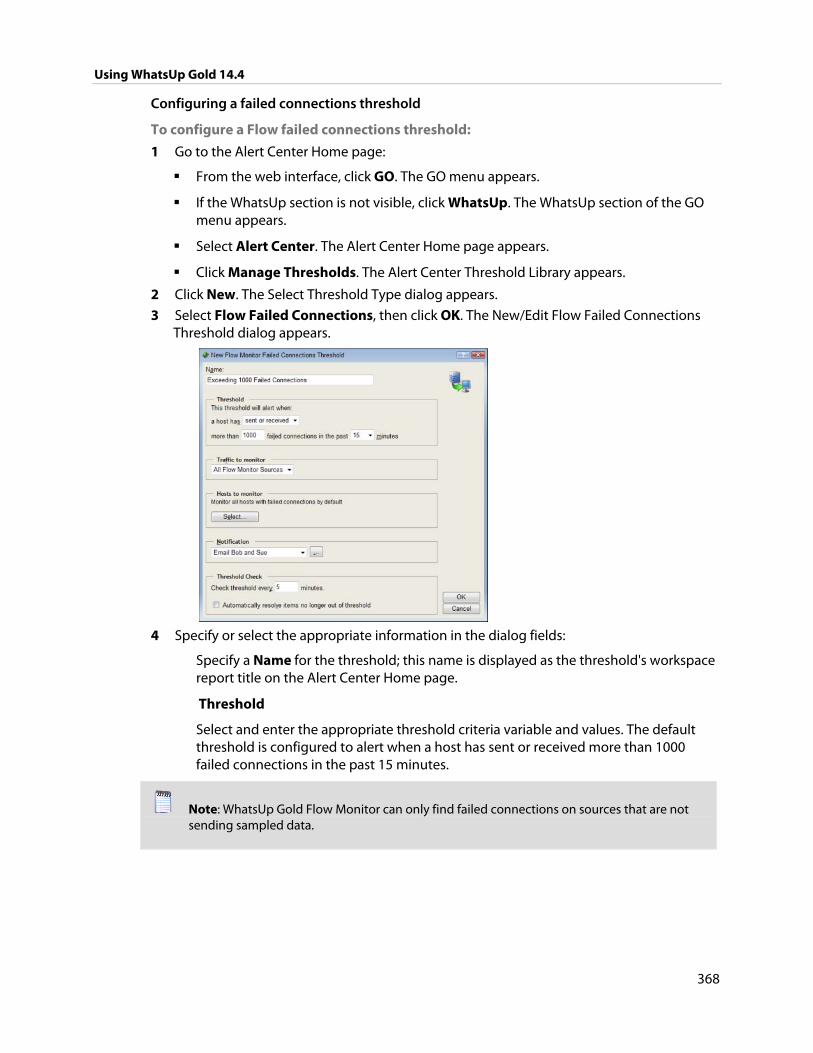
Using WhatsUp Gold 14.4
368
Configuring a failed connections threshold
To configure a Flow failed connections threshold:
1 Go to the Alert Center Home page:
From the web interface, click GO. The GO menu appears.
If the WhatsUp section is not visible, click WhatsUp. The WhatsUp section of the GO menu appears.
Select Alert Center. The Alert Center Home page appears.
Click Manage Thresholds. The Alert Center Threshold Library appears.
2 Click New. The Select Threshold Type dialog appears.
3 Select Flow Failed Connections, then click OK. The New/Edit Flow Failed Connections Threshold dialog appears.
4 Specify or select the appropriate information in the dialog fields:
Specify a Name for the threshold; this name is displayed as the threshold's workspace report title on the Alert Center Home page.
Threshold
Select and enter the appropriate threshold criteria variable and values. The default threshold is configured to alert when a host has sent or received more than 1000 failed connections in the past 15 minutes.
Note: WhatsUp Gold Flow Monitor can only find failed connections on sources that are not sending sampled data.
Using WhatsUp Gold 14.4
369
Traffic to monitor
Select the Flow Monitor source or interface from which to monitor traffic. If you select a source, traffic for all interfaces on the source is monitored; if you select an interface, only traffic for the specific interface is monitored. By default, the threshold is set to monitor traffic from all Flow Monitor sources.
Note: Sources sending sampled data are not displayed as a selection option in the Traffic to monitor list because Flow Monitor cannot determine that traffic has failed on sampled data.
Hosts to monitor
Click Select to choose the hosts to which the threshold applies. By default, the threshold monitors all applicable hosts.
Notification
Select the notification policy you would like to apply to this threshold. This policy begins sending notifications when an item falls out of the threshold you configure above. If you do not see an appropriate threshold policy, or if the list is empty, browse (...) to the Notification Policy dialog to configure a new policy.
Note: It is not required that you select a notification policy for use with every threshold. If you do not select a notification policy, no notifications are generated for the threshold, but a workspace report with the out of threshold items will still appear on the Alert Center Home page.
Threshold check
Enter a value for the threshold check interval, or the interval at which the Alert Center checks the WhatsUp Gold database to see if there are items that are out of the threshold's parameters. The default polling interval is 3 minutes.
Select Automatically resolve items no longer out of threshold to have Alert Center automatically resolve items when they go back inside the parameters of the threshold.
Note: We advise that your threshold check interval be longer than the amount of time for which you are gathering data for this threshold. For example, if you have devices which are set to collect CPU performance data every 10 minutes, then your Alert Center CPU threshold check interval should be set to 10 minutes or more. If the threshold check interval is shorter than the data sample period, the Alert Center may miss data relevant to the threshold.
5 Click OK to save changes.
Configuring a Flow Monitor interface traffic threshold
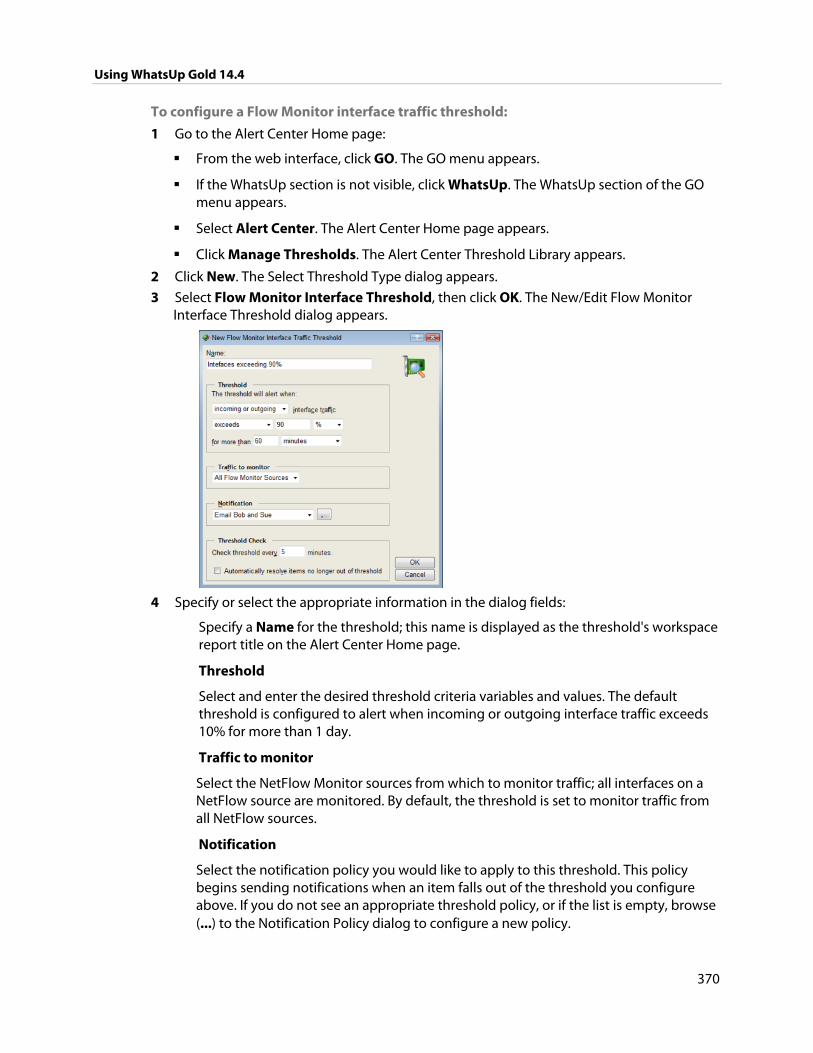
Using WhatsUp Gold 14.4
370
To configure a Flow Monitor interface traffic threshold:
1 Go to the Alert Center Home page:
From the web interface, click GO. The GO menu appears.
If the WhatsUp section is not visible, click WhatsUp. The WhatsUp section of the GO menu appears.
Select Alert Center. The Alert Center Home page appears.
Click Manage Thresholds. The Alert Center Threshold Library appears.
2 Click New. The Select Threshold Type dialog appears.
3 Select Flow Monitor Interface Threshold, then click OK. The New/Edit Flow Monitor Interface Threshold dialog appears.
4 Specify or select the appropriate information in the dialog fields:
Specify a Name for the threshold; this name is displayed as the threshold's workspace report title on the Alert Center Home page.
Threshold
Select and enter the desired threshold criteria variables and values. The default threshold is configured to alert when incoming or outgoing interface traffic exceeds 10% for more than 1 day.
Traffic to monitor
Select the NetFlow Monitor sources from which to monitor traffic; all interfaces on a NetFlow source are monitored. By default, the threshold is set to monitor traffic from all NetFlow sources.
Notification
Select the notification policy you would like to apply to this threshold. This policy begins sending notifications when an item falls out of the threshold you configure above. If you do not see an appropriate threshold policy, or if the list is empty, browse (...) to the Notification Policy dialog to configure a new policy.
Using WhatsUp Gold 14.4
371
Note: It is not required that you select a notification policy for use with every threshold. If you do not select a notification policy, no notifications are generated for the threshold, but a workspace report with the out of threshold items will still appear on the Alert Center Home page.
Threshold check
Enter a value for the threshold check interval, or the interval at which the Alert Center checks the WhatsUp Gold database to see if there are items that are out of the threshold's parameters. The default polling interval is 3 minutes.
Select Automatically resolve items no longer out of threshold to have Alert Center automatically resolve items when they go back inside the parameters of the threshold.
Note: We advise that your threshold check interval be shorter than the amount of time for which you are gathering data for this threshold. For example, if you configure a threshold that checks CPU data every 10 minutes, your threshold check interval should be 9 minutes or less. If the threshold check interval is longer than the data sample period, the Alert Center may miss data relevant to the threshold.
5 Click OK to save changes.
Configuring a top sender/receiver threshold
To configure a Flow Monitor top sender/receiver threshold:
1 Go to the Alert Center Home page:
From the web interface, click GO. The GO menu appears.
If the WhatsUp section is not visible, click WhatsUp. The WhatsUp section of the GO menu appears.
Select Alert Center. The Alert Center Home page appears.
Click Manage Thresholds. The Alert Center Threshold Library appears.
2 Click New. The Select Threshold Type dialog appears.
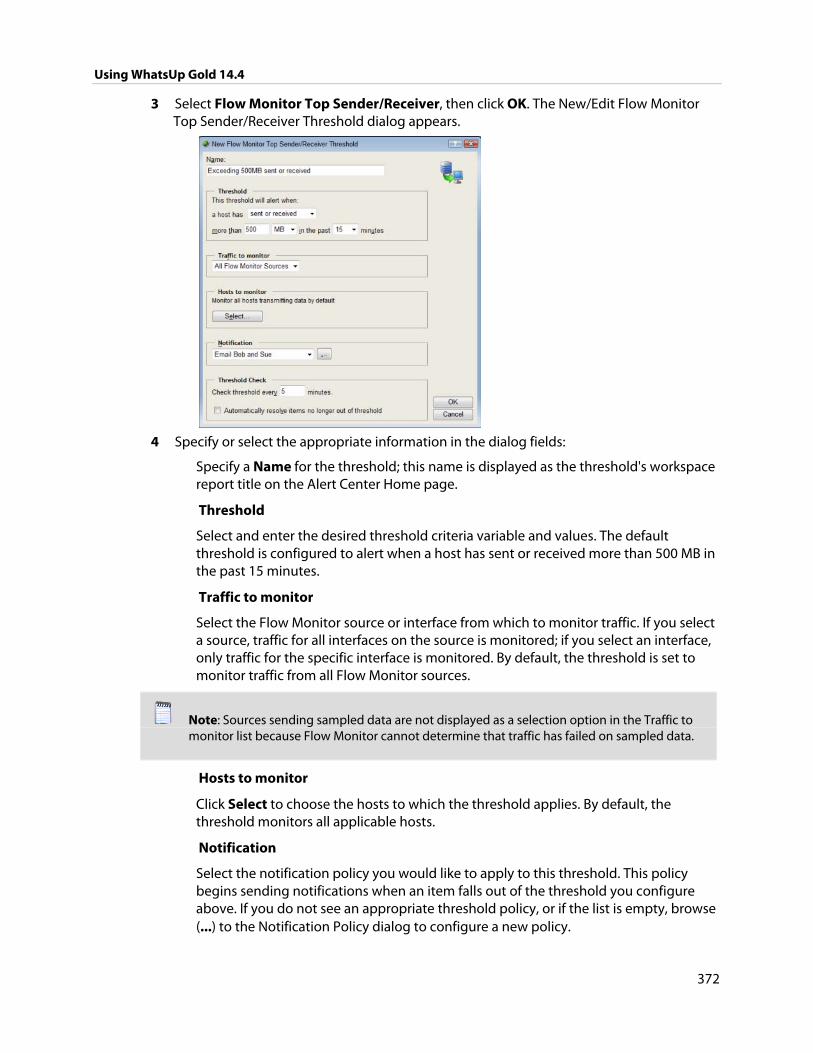
Using WhatsUp Gold 14.4
372
3 Select Flow Monitor Top Sender/Receiver, then click OK. The New/Edit Flow Monitor Top Sender/Receiver Threshold dialog appears.
4 Specify or select the appropriate information in the dialog fields:
Specify a Name for the threshold; this name is displayed as the threshold's workspace report title on the Alert Center Home page.
Threshold
Select and enter the desired threshold criteria variable and values. The default threshold is configured to alert when a host has sent or received more than 500 MB in the past 15 minutes.
Traffic to monitor
Select the Flow Monitor source or interface from which to monitor traffic. If you select a source, traffic for all interfaces on the source is monitored; if you select an interface, only traffic for the specific interface is monitored. By default, the threshold is set to monitor traffic from all Flow Monitor sources.
Note: Sources sending sampled data are not displayed as a selection option in the Traffic to monitor list because Flow Monitor cannot determine that traffic has failed on sampled data.
Hosts to monitor
Click Select to choose the hosts to which the threshold applies. By default, the threshold monitors all applicable hosts.
Notification
Select the notification policy you would like to apply to this threshold. This policy begins sending notifications when an item falls out of the threshold you configure above. If you do not see an appropriate threshold policy, or if the list is empty, browse (...) to the Notification Policy dialog to configure a new policy.

Using WhatsUp Gold 14.4
373
Note: It is not required that you select a notification policy for use with every threshold. If you do not select a notification policy, no notifications are generated for the threshold, but a workspace report with the out of threshold items will still appear on the Alert Center Home page.
Threshold check
Enter a value for the threshold check interval, or the interval at which the Alert Center checks the WhatsUp Gold database to see if there are items that are out of the threshold's parameters. The default polling interval is 3 minutes.
Select Automatically resolve items no longer out of threshold to have Alert Center automatically resolve items when they go back inside the parameters of the threshold.
Note: We advise that your threshold check interval be longer than the amount of time for which you are gathering data for this threshold. For example, if you have devices which are set to collect CPU performance data every 10 minutes, then your Alert Center CPU threshold check interval should be set to 10 minutes or more. If the threshold check interval is shorter than the data sample period, the Alert Center may miss data relevant to the threshold.
5 Click OK to save changes.
Configuring system thresholds
Alert Center system thresholds alert you on aspects of your WhatsUp Gold system according to the threshold parameters you configure. You can create four system threshold types:
Blackout Summary (on page 373)
Failover (on page 375)
WhatsUp Health
WhatsVirtual Events
Configuring a Blackout Summary threshold
To configure a Blackout Summary threshold:
1 Go to the Alert Center Home page:
From the web interface, click GO. The GO menu appears.
If the WhatsUp section is not visible, click WhatsUp. The WhatsUp section of the GO menu appears.
Select Alert Center. The Alert Center Home page appears.
Click Manage Thresholds. The Alert Center Threshold Library appears.
2 Click New. The Select Threshold Type dialog appears.
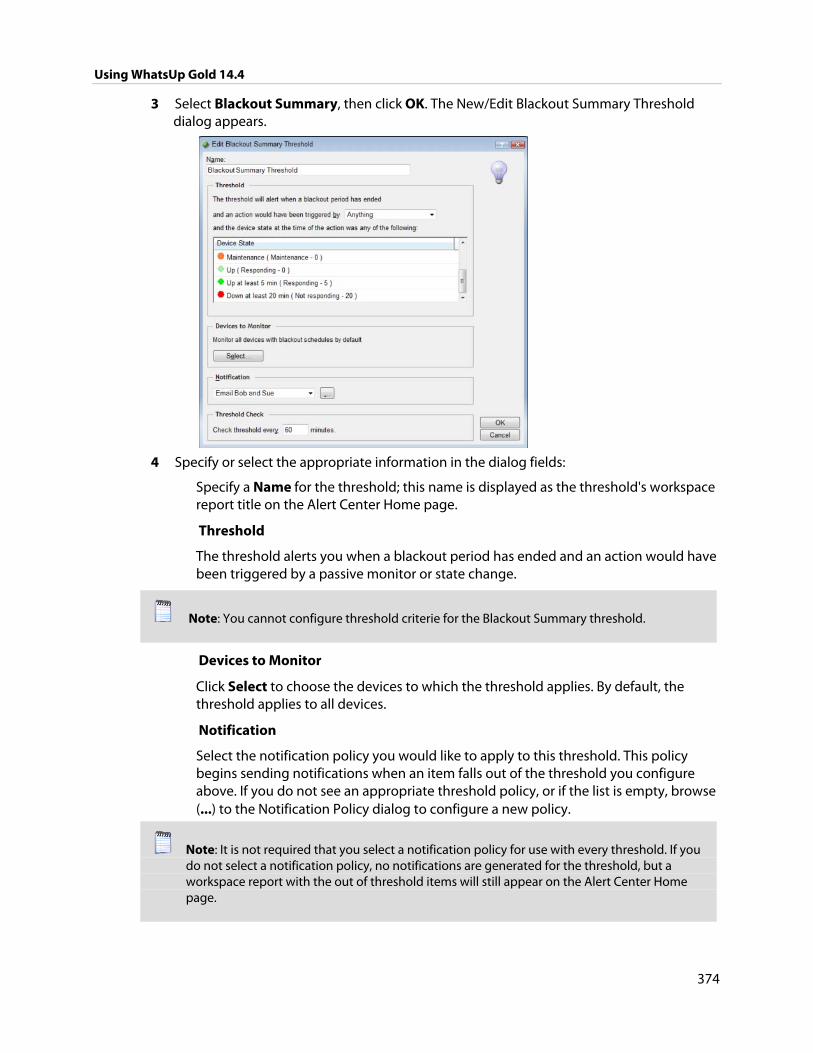
Using WhatsUp Gold 14.4
374
3 Select Blackout Summary, then click OK. The New/Edit Blackout Summary Threshold dialog appears.
4 Specify or select the appropriate information in the dialog fields:
Specify a Name for the threshold; this name is displayed as the threshold's workspace report title on the Alert Center Home page.
Threshold
The threshold alerts you when a blackout period has ended and an action would have been triggered by a passive monitor or state change.
Note: You cannot configure threshold criterie for the Blackout Summary threshold.
Devices to Monitor
Click Select to choose the devices to which the threshold applies. By default, the threshold applies to all devices.
Notification
Select the notification policy you would like to apply to this threshold. This policy begins sending notifications when an item falls out of the threshold you configure above. If you do not see an appropriate threshold policy, or if the list is empty, browse (...) to the Notification Policy dialog to configure a new policy.
Note: It is not required that you select a notification policy for use with every threshold. If you do not select a notification policy, no notifications are generated for the threshold, but a workspace report with the out of threshold items will still appear on the Alert Center Home page.
Using WhatsUp Gold 14.4
375
Threshold check
Enter a value for the threshold check interval, or the interval at which the Alert Center checks the WhatsUp Gold database to see if there are actions that weren't triggered because of a scheduled blackout period that has finished.
1 Click OK to save changes.
Configuring a Failover threshold
To configure a failover threshold:
1 Go to the Alert Center Home page:
From the web interface, click GO. The GO menu appears.
If the WhatsUp section is not visible, click WhatsUp. The WhatsUp section of the GO menu appears.
Select Alert Center. The Alert Center Home page appears.
Click Manage Thresholds. The Alert Center Threshold Library appears.
2 Click New. The Select Threshold Type dialog appears.
3 Select Failover, then click OK. The New/Edit Failover Threshold dialog appears
4 Specify or select the appropriate information in the dialog fields.
Specify a Name for the threshold; this name is displayed as the threshold's workspace report title on the Alert Center Home page.
Description
As you specify the desired threshold criteria settings, this description updates to verbally illustrate the threshold you have configured.
Threshold
Select the desired threshold criteria variables and values. You can configure the threshold to alert you when any event occurs, when an error occurs, or when an informational event occurs. By default, the threshold is configured to alert you when any event has occurred in Failover.
Notification
Select the notification policy you would like to apply to this threshold. This policy begins sending notifications when an item falls out of the threshold you configure above. If you do not see an appropriate threshold policy, or if the list is empty, browse (...) to the Notification Policy dialog to configure a new policy.
Note: It is not required that you select a notification policy for use with every threshold. If you do not select a notification policy, no notifications are generated for the threshold, but a workspace report with the out of threshold items will still appear on the Alert Center Home page.
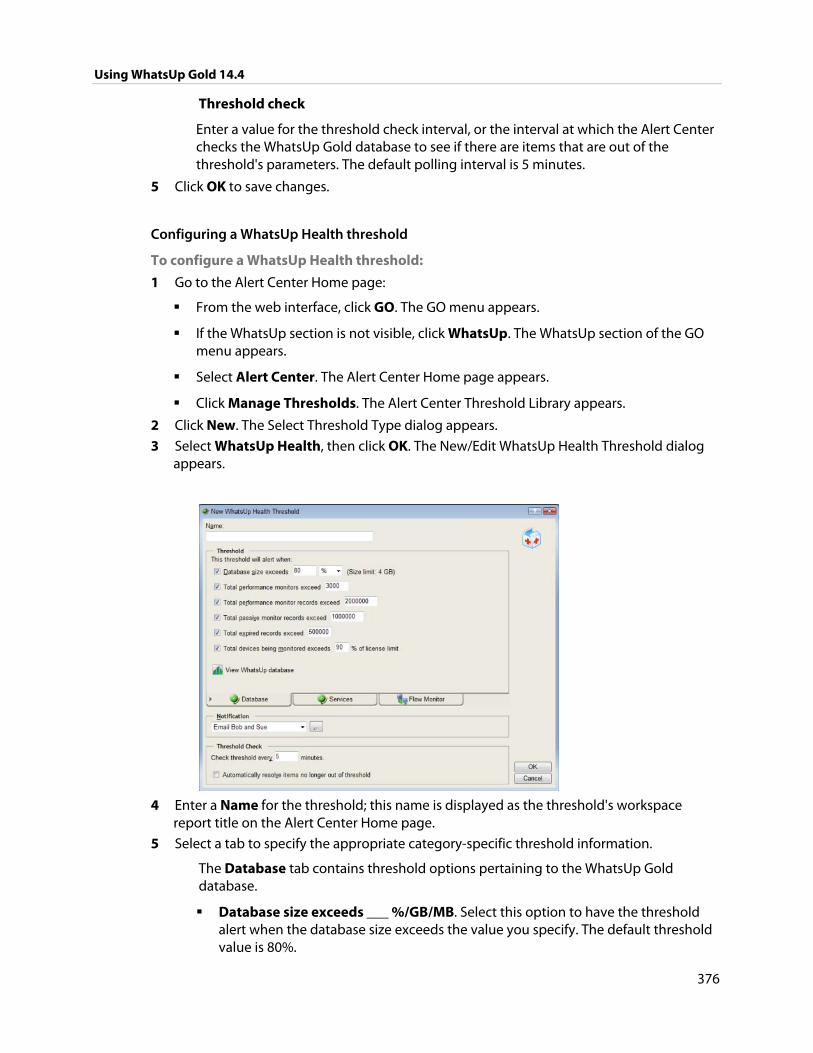
Using WhatsUp Gold 14.4
376
Threshold check
Enter a value for the threshold check interval, or the interval at which the Alert Center checks the WhatsUp Gold database to see if there are items that are out of the threshold's parameters. The default polling interval is 5 minutes.
5 Click OK to save changes.
Configuring a WhatsUp Health threshold
To configure a WhatsUp Health threshold:
1 Go to the Alert Center Home page:
From the web interface, click GO. The GO menu appears.
If the WhatsUp section is not visible, click WhatsUp. The WhatsUp section of the GO menu appears.
Select Alert Center. The Alert Center Home page appears.
Click Manage Thresholds. The Alert Center Threshold Library appears.
2 Click New. The Select Threshold Type dialog appears.
3 Select WhatsUp Health, then click OK. The New/Edit WhatsUp Health Threshold dialog appears.
4 Enter a Name for the threshold; this name is displayed as the threshold's workspace
report title on the Alert Center Home page.
5 Select a tab to specify the appropriate category-specific threshold information.
The Database tab contains threshold options pertaining to the WhatsUp Gold database.
Database size exceeds ___ %/GB/MB. Select this option to have the threshold alert when the database size exceeds the value you specify. The default threshold value is 80%.
Using WhatsUp Gold 14.4
377
Note: If you have an unlimited-size database, WhatsUp Gold uses a 4GB cap to calculate the size of your database.
Total performance monitors exceed ____. Select this option to have the threshold alert when the total number of performance monitors exceeds the number you specify. The default number of total performance monitors is 3,000.
Total performance monitor records exceed ____. Select this option to have the threshold alert when the total number of performance monitor records exceeds the number you specify. The default number of total performance monitor records is 2,000,000.
Total passive monitor records exceed ____. Select this option to have the threshold alert when the total number of passive monitor records exceeds the number you specify. The default number of total passive monitor records is 1,000,000.
Total expired records exceed ____. Select this option to have the threshold alert when the total number of expired records exceeds the number you specify. The default number of total expired records is 500,000.
Total devices being monitored exceeds ____ % of license limit. Select this option to have the threshold alert when the total number of devices being monitored exceeds the percentage of the license limit you specify. The default percentage of the license limit is 90%.
Tip: Click View WhatsUp database usage to view a graph of the current WhatsUp database usage.
The Services tab contains threshold options pertaining to the WhatsUp Gold service and Web service.
The WhatsUp polling service is down ____ minutes. Select this option to have the threshold alert when the WhatsUp service has been down for the number of minutes you specify. The default threshold value is 5 minutes.
The WhatsUp polling service SQL queries exceed ____ ms on average. Select this option to have the threshold alert when SQL queries exceed the number of ms on average that you specify. The default number is 750 ms.
WhatsUp web service is down ____ minutes. Select this option to have the threshold alert when the web service is down for the number of minutes you specify. The default number is 5 minutes.
WhatsUp web service HTTP responses exceed ____ ms on average. Select this option to have the threshold alert when HTTP responses from the web service exceed the number of ms on average you specify. The default number is 1,000 ms on average.
WhatsUp web service SQL queries exceed ____ ms on average. Select this option to have the threshold alert when web service SQL queries exceed the
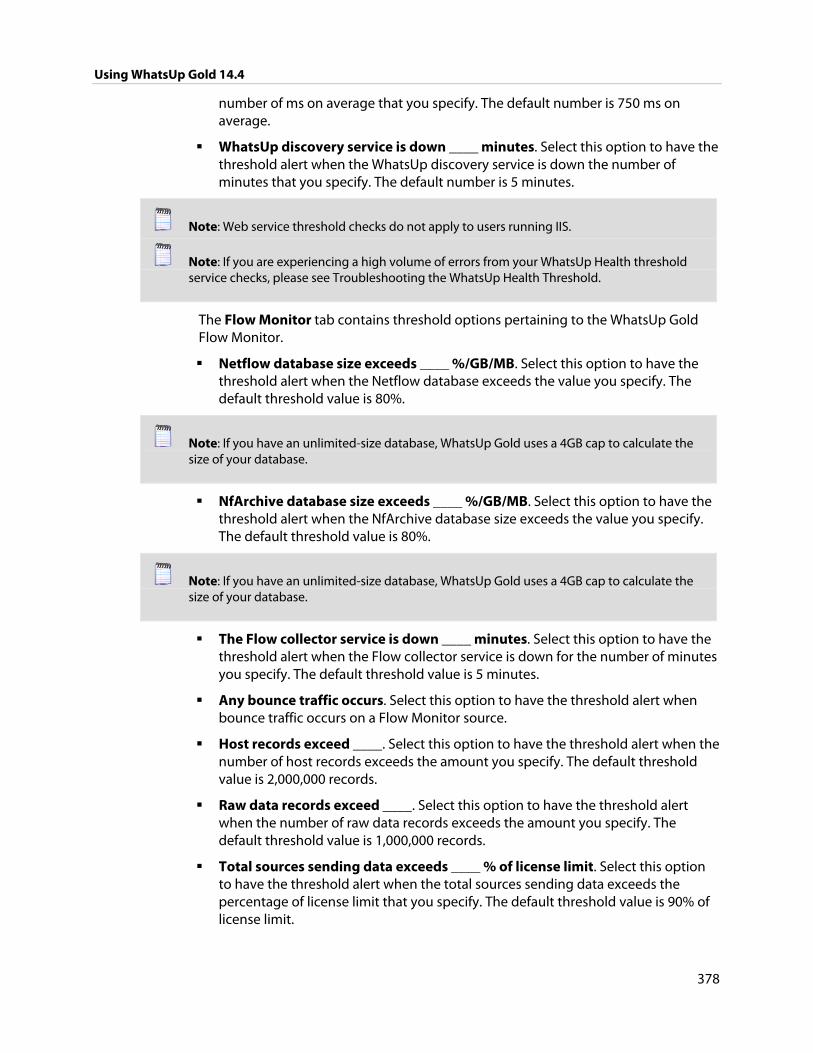
Using WhatsUp Gold 14.4
378
number of ms on average that you specify. The default number is 750 ms on average.
WhatsUp discovery service is down ____ minutes. Select this option to have the threshold alert when the WhatsUp discovery service is down the number of minutes that you specify. The default number is 5 minutes.
Note: Web service threshold checks do not apply to users running IIS.
Note: If you are experiencing a high volume of errors from your WhatsUp Health threshold service checks, please see Troubleshooting the WhatsUp Health Threshold.
The Flow Monitor tab contains threshold options pertaining to the WhatsUp Gold Flow Monitor.
Netflow database size exceeds ____ %/GB/MB. Select this option to have the threshold alert when the Netflow database exceeds the value you specify. The default threshold value is 80%.
Note: If you have an unlimited-size database, WhatsUp Gold uses a 4GB cap to calculate the size of your database.
NfArchive database size exceeds ____ %/GB/MB. Select this option to have the threshold alert when the NfArchive database size exceeds the value you specify. The default threshold value is 80%.
Note: If you have an unlimited-size database, WhatsUp Gold uses a 4GB cap to calculate the size of your database.
The Flow collector service is down ____ minutes. Select this option to have the threshold alert when the Flow collector service is down for the number of minutes you specify. The default threshold value is 5 minutes.
Any bounce traffic occurs. Select this option to have the threshold alert when bounce traffic occurs on a Flow Monitor source.
Host records exceed ____. Select this option to have the threshold alert when the number of host records exceeds the amount you specify. The default threshold value is 2,000,000 records.
Raw data records exceed ____. Select this option to have the threshold alert when the number of raw data records exceeds the amount you specify. The default threshold value is 1,000,000 records.
Total sources sending data exceeds ____ % of license limit. Select this option to have the threshold alert when the total sources sending data exceeds the percentage of license limit that you specify. The default threshold value is 90% of license limit.
Using WhatsUp Gold 14.4
379
Tip: Click View Netflow database usage to view a graph of the current Netflow database usage. Click View NfArchive database usage to view a graph of the current NfArchive database usage.
6 After selecting the desired options for each tab and entering the appropriate threshold variables and values, specify your choices for the Notification and Polling sections of the dialog.
Notification
Select the notification policy you would like to apply to this threshold. This policy kicks off when an item falls out of the threshold you configure above. If you do not see an appropriate threshold policy, or if the list is empty, browse (...) to the Notification Policy dialog to configure a new policy.
Note: It is not required that you select a notification policy for use with every threshold. If you do not select a notification policy, while no notifications will generate for the threshold, a workspace report with the out of threshold items will still appear on the Alert Center Home page, and out of threshold items will be listed on the Items Report.
Polling
Enter a value for the polling interval, or the interval at which the Alert Center checks the WhatsUp Gold database to see if there are items out of the threshold's parameters. The default polling interval is 3 minutes.
Note: We advise that your polling interval be shorter than the amount of time for which you are gathering data for this threshold. For example, if you configure a threshold that checks CPU data every 10 minutes, your polling interval should be 9 minutes or less. If the polling interval is longer than the data sample period, the Alert Center may miss data relevant to the threshold.
7 Click OK to save changes.
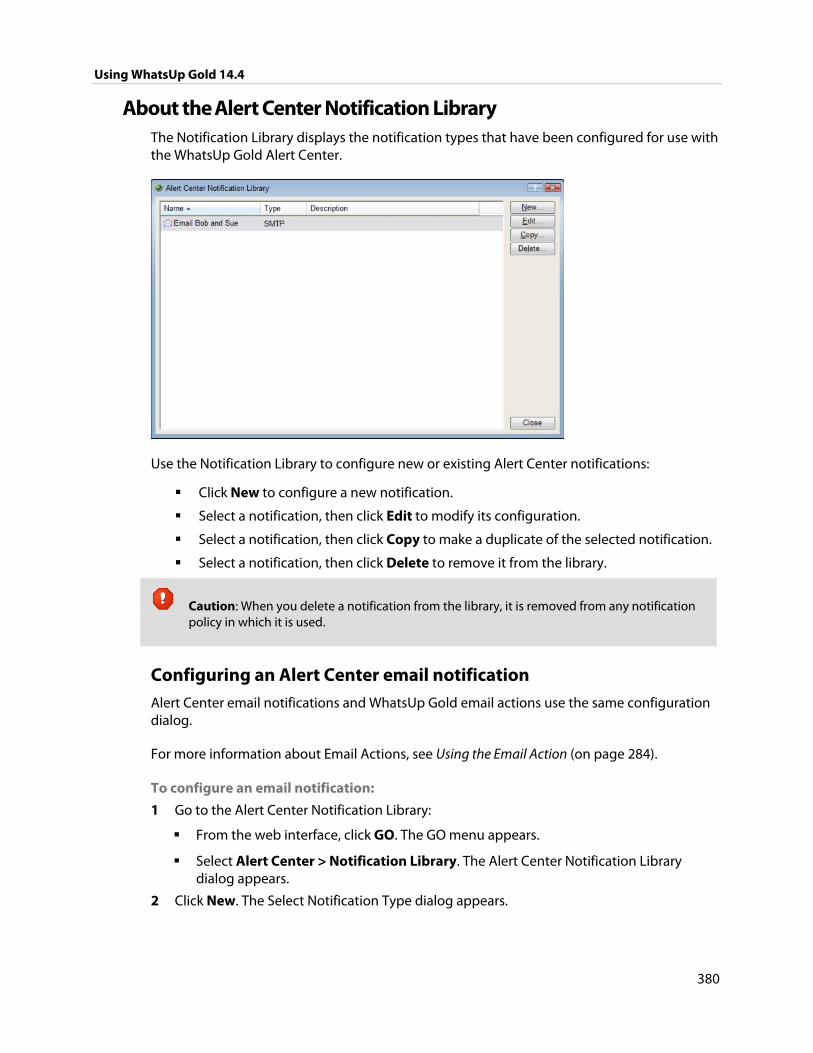
Using WhatsUp Gold 14.4
380
About the Alert Center Notification Library The Notification Library displays the notification types that have been configured for use with the WhatsUp Gold Alert Center.
Use the Notification Library to configure new or existing Alert Center notifications:
Click New to configure a new notification.
Select a notification, then click Edit to modify its configuration.
Select a notification, then click Copy to make a duplicate of the selected notification.
Select a notification, then click Delete to remove it from the library.
Caution: When you delete a notification from the library, it is removed from any notification policy in which it is used.
Configuring an Alert Center email notification Alert Center email notifications and WhatsUp Gold email actions use the same configuration dialog.
For more information about Email Actions, see Using the Email Action (on page 284).
To configure an email notification:
1 Go to the Alert Center Notification Library:
From the web interface, click GO. The GO menu appears.
Select Alert Center > Notification Library. The Alert Center Notification Library dialog appears.
2 Click New. The Select Notification Type dialog appears.
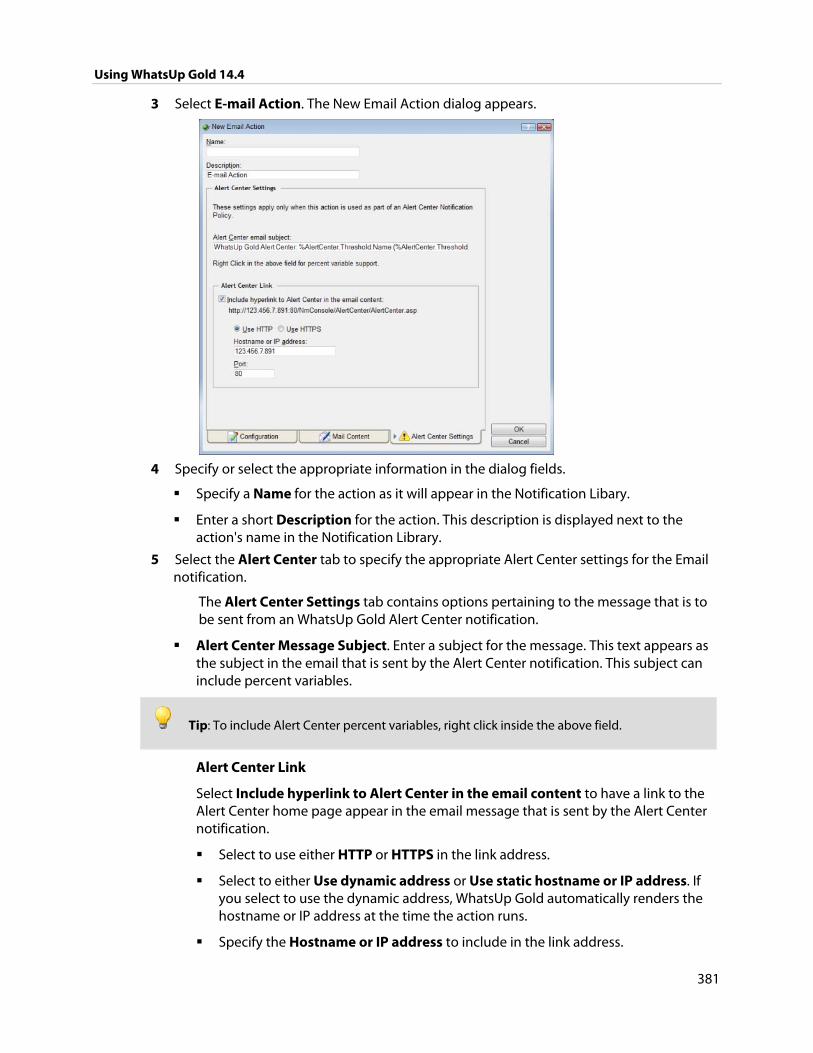
Using WhatsUp Gold 14.4
381
3 Select E-mail Action. The New Email Action dialog appears.
4 Specify or select the appropriate information in the dialog fields.
Specify a Name for the action as it will appear in the Notification Libary.
Enter a short Description for the action. This description is displayed next to the action's name in the Notification Library.
5 Select the Alert Center tab to specify the appropriate Alert Center settings for the Email notification.
The Alert Center Settings tab contains options pertaining to the message that is to be sent from an WhatsUp Gold Alert Center notification.
Alert Center Message Subject. Enter a subject for the message. This text appears as the subject in the email that is sent by the Alert Center notification. This subject can include percent variables.
Tip: To include Alert Center percent variables, right click inside the above field.
Alert Center Link
Select Include hyperlink to Alert Center in the email content to have a link to the Alert Center home page appear in the email message that is sent by the Alert Center notification.
Select to use either HTTP or HTTPS in the link address.
Select to either Use dynamic address or Use static hostname or IP address. If you select to use the dynamic address, WhatsUp Gold automatically renders the hostname or IP address at the time the action runs.
Specify the Hostname or IP address to include in the link address.
Using WhatsUp Gold 14.4
382
Specify the specific Port to include in the link address.
Important: The address you enter here must be the exact address of the Alert Center home page to which you want to connect. Verify the address and enter its exact contents in the above options.
6 Click OK to save changes.
Configuring an Alert Center SMS notification Alert Center SMS notifications and WhatsUp Gold SMS actions use the same configuration dialog.
For more information about SMS Actions, see Using the SMS Action.
To configure an SMS notification:
1 Go to the Alert Center Notification Library:
From the web interface, click GO. The GO menu appears.
Select Alert Center > Notification Library. The Alert Center Notification Library dialog appears.
2 Click New. The Select Notification Type dialog appears.
3 Select SMS Action. The New SMS Action dialog appears.
4 Specify or select the appropriate information in the dialog fields.
Name. Enter a unique display name to identify the SMS notification.
Description. Enter a short description of the action. This is displayed in the Action Library along with the entry in Name.
Country. Using the list box, select the country for the SMS provider.
Provider. Using the list box, select the desired provider.
Note: If the provider list is incomplete and/or incorrect, you can click the Providers button to add, edit, or delete providers in this list.
Mode. Either Email or Dialup, depending on how the Provider was created in the system.
Email to. If the connection setting is Email, enter the email address of the SMS device.
Phone Number. If the connection setting is Dialup, enter the phone number to call with the message. You can enter multiple phone numbers, separated by a comma. There is a 2,000 character limit in this field, so you can enter many numbers.
Note: Non-numeric characters such as "-" and "." will be ignored.
Using WhatsUp Gold 14.4
383
5 Select the Alert Center Message tab to specify the appropriate settings for the SMS notification message.
The Alert Center Settings tab contains options pertaining to the message that is to be sent from an WhatsUp Gold Alert Center notification.
Enter a text message plus any desired percent variable codes. Keep in mind that if you use percent variables, this will greatly increase the character count.
Tip: To enter Alert Center percent variables, right click inside the message box.
Note: If the message exceeds 140 characters, the message will be broken into up to 3 parts and will be sent as separate messages ("1 of 3", "1 of 2", etc.).
6 Click OK to save changes.
Configuring an Alert Center SMS Direct notification Alert Center SMS Direct notifications and WhatsUp Gold SMS Direct actions use the same configuration dialog.
For more information about SMS Direct Actions, see Using the SMS Direct Action.
To configure an SMS Direct notification:
1 Go to the Alert Center Notification Library:
From the web interface, click GO. The GO menu appears.
Select Alert Center > Notification Library. The Alert Center Notification Library dialog appears.
2 Click New. The Select Notification Type dialog appears.
3 Select SMS Direct Action. The New SMS Direct Action appears.
4 Specify or select the appropriate information in the dialog fields.
Name. Enter a name for this notification. This name is for your reference only and will never be displayed to the notification recipient.
Description. Enter or modify the description. This description appears in the Action Library and is for your reference only.
Phone number. Enter the cell phone number(s) of the intended SMS message recipients. You can enter multiple phone numbers, separated by a comma. For example: 555-555-5555, 55 555 55 55 55, (555) 555 5555
Note: All non-numeric characters other than the comma, such as "-" and ".", will be ignored.
Using WhatsUp Gold 14.4
384
There is a 2,000 character limit in this field, so you can enter many numbers.
COM Port. Select the COM port you want to use with this notification.
Note: The list displays all ports associated with the GSM modem, including virtual and hard-wired, serial ports. You must select the port that is assigned to the modem in the Windows Device Manager.
5 Select the Alert Center Message tab to specify the appropriate settings for the SMS notification message.
The Alert Center Message tab contains options pertaining to the message that is to be sent from an WhatsUp Gold Alert Center notification.
Enter a text message plus any desired percent variable codes. Keep in mind that if you use percent variables, this will greatly increase the character count.
Tip: To enter Alert Center percent variables, right click inside the message box.
Note: If the message exceeds 140 characters, the message will be broken into up to 3 parts and will be sent as separate messages ("1 of 3", "1 of 2", etc.).
6 Click OK to save changes.
Alert Center Percent Variables The Email, SMS, and SMS Direct Actions can include three types of percent variables in Alert Center notification message:
Threshold
Notification Policy
System
Using WhatsUp Gold 14.4
385
Threshold percent variables Name Description
%AlertCenter.Threshold.ID The threshold ID listed in the ProActiveAlert table.
%AlertCenter.Threshold.Name The threshold's name.
%AlertCenter.Threshold.Description The threshold's description.
%AlertCenter.Threshold.DeviceName The names of the device or devices that caused the alert.
%AlertCenter.Threshold.PollingInterval The threshold's polling interval.
%AlertCenter.Threshold.TotalItems The total new new and current items out of threshold.
%AlertCenter.Threshold.TotalNewItems The total of newly alerted items.
%AlertCenter.Threshold.TotalCurrentItems The total of existing items out of threshold (not including new items).
%AlertCenter.Threshold.TotalMonitoredItems The count of items that can be evaluated in the threshold, i.e. there are 22 devices that have a Disk Performance Monitor configured.
%AlertCenter.Threshold.TotalAutoResolvedItems The number of items automatically resolved.
%AlertCenter.Threshold.NewItemNames The display name of each new item in an alert.
%AlertCenter.Threshold.CurrentItemNames The display name of each current item in an alert.
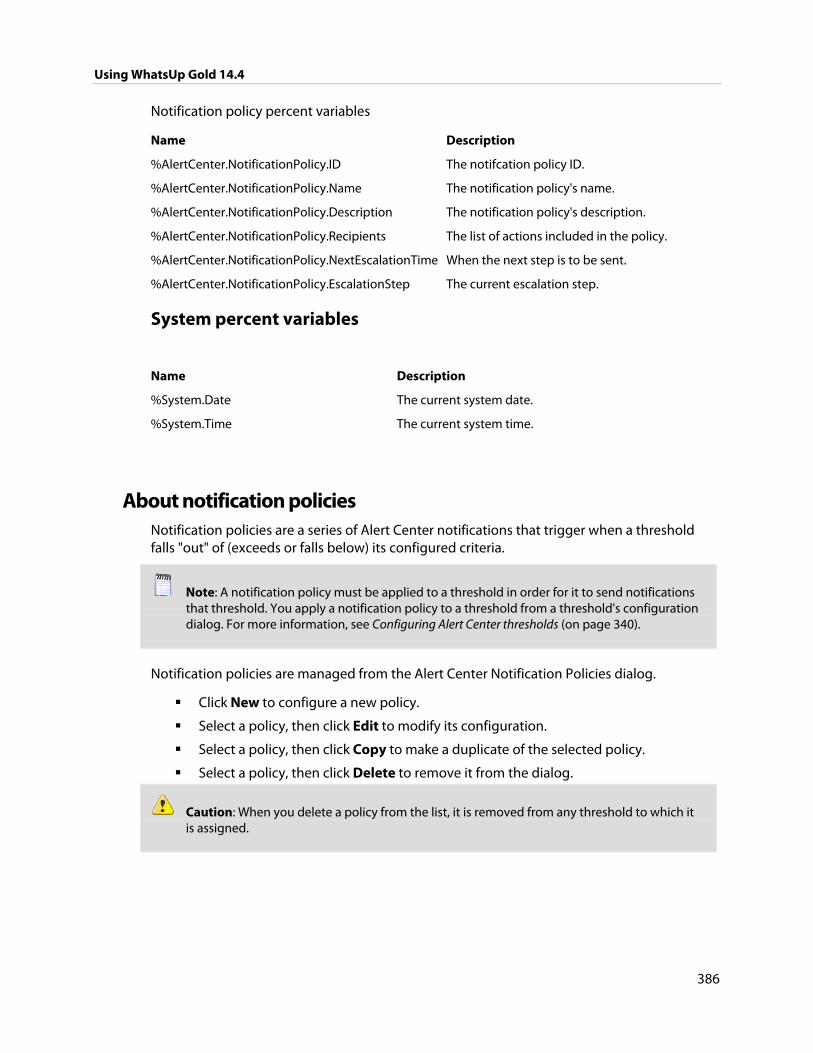
Using WhatsUp Gold 14.4
386
Notification policy percent variables
Name Description
%AlertCenter.NotificationPolicy.ID The notifcation policy ID.
%AlertCenter.NotificationPolicy.Name The notification policy's name.
%AlertCenter.NotificationPolicy.Description The notification policy's description.
%AlertCenter.NotificationPolicy.Recipients The list of actions included in the policy.
%AlertCenter.NotificationPolicy.NextEscalationTime When the next step is to be sent.
%AlertCenter.NotificationPolicy.EscalationStep The current escalation step.
System percent variables
Name Description
%System.Date The current system date.
%System.Time The current system time.
About notification policies Notification policies are a series of Alert Center notifications that trigger when a threshold falls "out" of (exceeds or falls below) its configured criteria.
Note: A notification policy must be applied to a threshold in order for it to send notifications that threshold. You apply a notification policy to a threshold from a threshold's configuration dialog. For more information, see Configuring Alert Center thresholds (on page 340).
Notification policies are managed from the Alert Center Notification Policies dialog.
Click New to configure a new policy.
Select a policy, then click Edit to modify its configuration.
Select a policy, then click Copy to make a duplicate of the selected policy.
Select a policy, then click Delete to remove it from the dialog.
Caution: When you delete a policy from the list, it is removed from any threshold to which it is assigned.
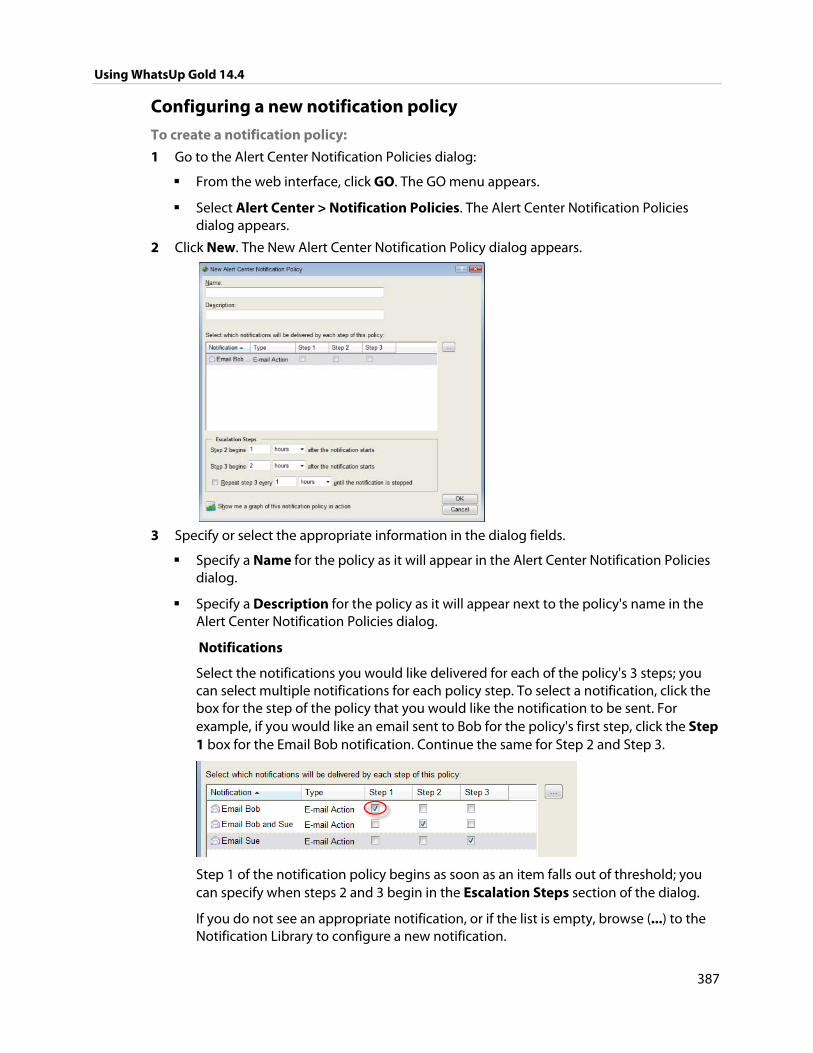
Using WhatsUp Gold 14.4
387
Configuring a new notification policy
To create a notification policy:
1 Go to the Alert Center Notification Policies dialog:
From the web interface, click GO. The GO menu appears.
Select Alert Center > Notification Policies. The Alert Center Notification Policies dialog appears.
2 Click New. The New Alert Center Notification Policy dialog appears.
3 Specify or select the appropriate information in the dialog fields.
Specify a Name for the policy as it will appear in the Alert Center Notification Policies dialog.
Specify a Description for the policy as it will appear next to the policy's name in the Alert Center Notification Policies dialog.
Notifications
Select the notifications you would like delivered for each of the policy's 3 steps; you can select multiple notifications for each policy step. To select a notification, click the box for the step of the policy that you would like the notification to be sent. For example, if you would like an email sent to Bob for the policy's first step, click the Step 1 box for the Email Bob notification. Continue the same for Step 2 and Step 3.
Step 1 of the notification policy begins as soon as an item falls out of threshold; you can specify when steps 2 and 3 begin in the Escalation Steps section of the dialog.
If you do not see an appropriate notification, or if the list is empty, browse (...) to the Notification Library to configure a new notification.
Using WhatsUp Gold 14.4
388
Escalation Steps
Specify a start time for steps 2 and 3 of the policy. By default, step 2 is set to begin 1 hour after the policy's first notification, and step 3 is set to begin 2 hours after the first notification.
You can choose to repeat step 3 of the policy at a regular interval until the notification is stopped. By default, the policy is set to repeat step 3 every hour until the notification is stopped.
Note: In order for this repeat function to work properly, step 3 must be enabled for at least one notification in the policy.
Tip: You can view a graph of the notification policy in action by clicking Show me a graph of this notification policy in action.
4 Click OK to save changes.
Using Alert Center reports Alert Center reports are used to troubleshoot and monitor Alert Center data.
There are three Alert Center reports:
Running Notifications Report (on page 388)
Alert Center Log (on page 390)
Alert Center Items (on page 390)
About Running Notifications This report displays a list of notification policies currently running for Alert Center thresholds.
For each policy, the report displays the following information:
The notification policy name and the triggering threshold.
The time the notification policy started.
The individual notifications fired for each step of the policy, and their status of success or failure.
Tip: Click a failed status to view the Alert Center Log; the reason the notification failed will be listed in the log.
The number of new and current items for each triggering threshold.
Using WhatsUp Gold 14.4
389
Stopping notifications
After resolving a problem, you can stop proceeding steps in a notification policy using the Stop Notification dialog.
To stop a notification policy:
1 Go to the Running Notification Policies report:
From the web interface, click GO. The GO menu appears.
If the WhatsUp section is not visible, click WhatsUp. The WhatsUp section of the GO menu appears.
Select Alert Center > Running Notification Policies. The Alert Center Running Notifications report appears.
2 Next to the notification policy that you want to stop, click Stop notification... . The Stop Notification dialog appears.
3 Click Stop to prevent further steps in the notification policy from firing.
Tip: Before stopping the policy, you can send a message to the recipients listed in this dialog to notify them that you have resolved the problem and are stopping the notification policy from this point forward.
If you choose to do so, select Send a message to the recipients listed above, and enter a Subject and Body for the message.
Note: SMS message recipients only receive the message body contents; the message subject is not included.
Configuring email notification message settings
To configure email notification message settings:
1 Go to the Configure Email Notification Message dialog:
From the web interface, click GO. The GO menu appears.
If the WhatsUp section is not visible, click WhatsUp. The WhatsUp section of the GO menu appears.
Select Alert Center > Email Notification Message Settings. The Configure Email Notification Message dialog appears.
2 Select or specify the appropriate information into the dialog fields.
Max email items
Enter a number for the Maximum newly alarmed items that are to be displayed in an email message.
Select Show currently alarmed items to display currently alarmed items in email messages.
Enter a number for the Maximum currently alarmed items that is to be displayed in an email message.
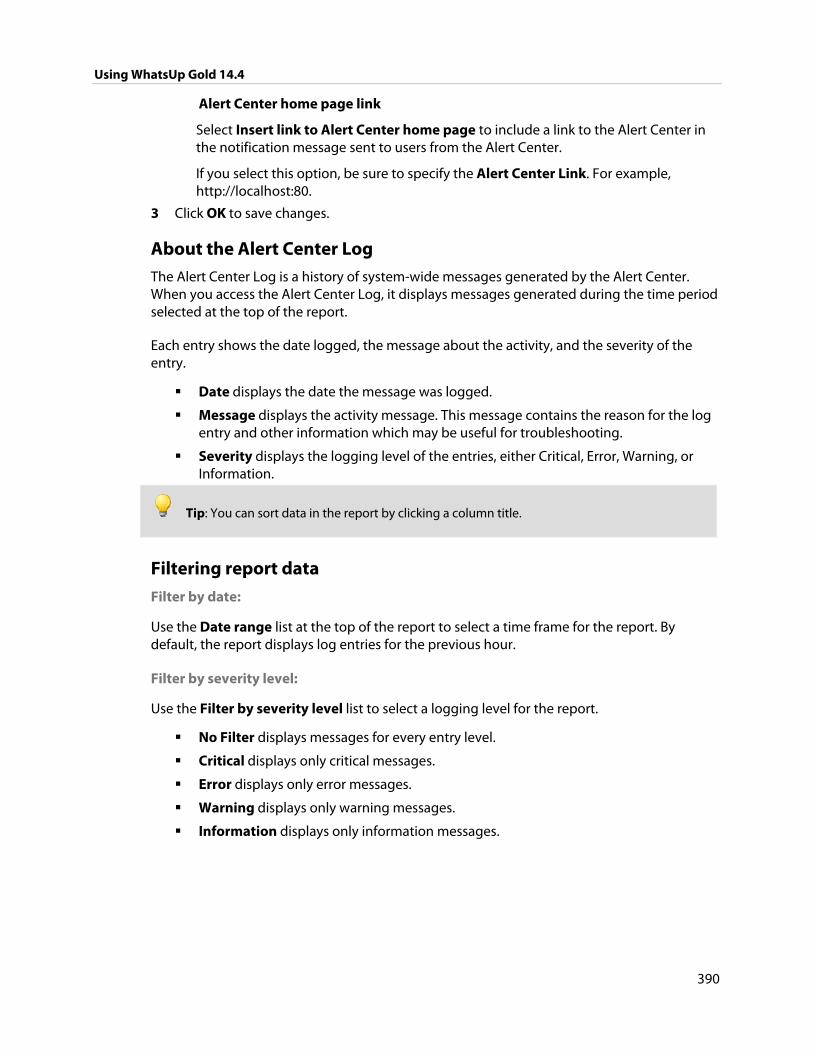
Using WhatsUp Gold 14.4
390
Alert Center home page link
Select Insert link to Alert Center home page to include a link to the Alert Center in the notification message sent to users from the Alert Center.
If you select this option, be sure to specify the Alert Center Link. For example, http://localhost:80.
3 Click OK to save changes.
About the Alert Center Log The Alert Center Log is a history of system-wide messages generated by the Alert Center. When you access the Alert Center Log, it displays messages generated during the time period selected at the top of the report.
Each entry shows the date logged, the message about the activity, and the severity of the entry.
Date displays the date the message was logged.
Message displays the activity message. This message contains the reason for the log entry and other information which may be useful for troubleshooting.
Severity displays the logging level of the entries, either Critical, Error, Warning, or Information.
Tip: You can sort data in the report by clicking a column title.
Filtering report data
Filter by date:
Use the Date range list at the top of the report to select a time frame for the report. By default, the report displays log entries for the previous hour.
Filter by severity level:
Use the Filter by severity level list to select a logging level for the report.
No Filter displays messages for every entry level.
Critical displays only critical messages.
Error displays only error messages.
Warning displays only warning messages.
Information displays only information messages.
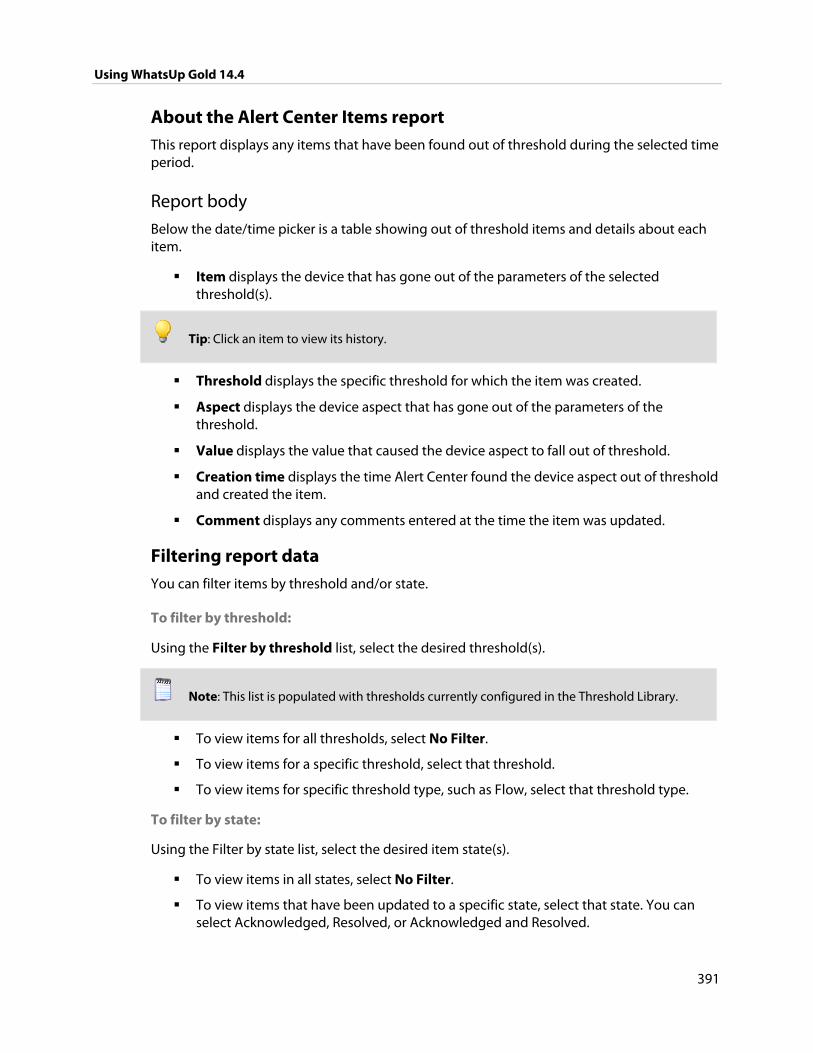
Using WhatsUp Gold 14.4
391
About the Alert Center Items report This report displays any items that have been found out of threshold during the selected time period.
Report body Below the date/time picker is a table showing out of threshold items and details about each item.
Item displays the device that has gone out of the parameters of the selected threshold(s).
Tip: Click an item to view its history.
Threshold displays the specific threshold for which the item was created.
Aspect displays the device aspect that has gone out of the parameters of the threshold.
Value displays the value that caused the device aspect to fall out of threshold.
Creation time displays the time Alert Center found the device aspect out of threshold and created the item.
Comment displays any comments entered at the time the item was updated.
Filtering report data You can filter items by threshold and/or state.
To filter by threshold:
Using the Filter by threshold list, select the desired threshold(s).
Note: This list is populated with thresholds currently configured in the Threshold Library.
To view items for all thresholds, select No Filter.
To view items for a specific threshold, select that threshold.
To view items for specific threshold type, such as Flow, select that threshold type.
To filter by state:
Using the Filter by state list, select the desired item state(s).
To view items in all states, select No Filter.
To view items that have been updated to a specific state, select that state. You can select Acknowledged, Resolved, or Acknowledged and Resolved.
Using WhatsUp Gold 14.4
392
To filter by date:
Use the date/time picker at the top of the report to select a date range and time frame.
In the Date range list, some reports also allow you to specify and customize the business hour report times for reports to display. This allows you to view the network activity only for specified business hours. The date and time format for the date on this report matches the format specified in Program Options > Regional set in the WhatsUp Gold console.
Viewing item's history
This report tracks an item through the system from creation to completion.
The report header displays the item name, the threshold that triggered the item, the aspect that is being monitored, and the threshold description.
Report body Below the header, the report displays the following information for the selected item.
State displays the item's current state. Can be either Out of threshold, In threshold, or Disabled.
Notification progress displays the progress of an assigned notification policy. Can be either Pending, Step 1, Step 2, Step 3, Done, Acknowledged, Resolved, or Repeating Step 3.
Value displays the aspect value that caused the item to go out of threshold.
Comment displays any comments entered by the user or the system at the time the item was updated.
Entry time displays the time the item was updated.
Duration displays how long the item spent in the displayed state after it went out of threshold.
About Alert Center record maintenance You can configure the amount of time to keep Alert Center data in your database on the Configure Database Record Expiration dialog.
To configure Alert Center data expiration settings:
1 Go to the Configure Database Record Expiration dialog:
From the web interface, click GO. The GO menu appears.
If the WhatsUp section is not visible, click WhatsUp. The WhatsUp section of the GO menu appears.
Select Alert Center > Record Maintenance. The Configure Database Record Expiration dialog appears.
Using WhatsUp Gold 14.4
393
2 Specify expiration settings:
Alert Center Log
Enter a number of days and/or hours after which you would like to expire data for this report. Data that is expired is deleted from the database.
Alert Center Items
Enter a number of days and/or hours after which you would like to expire data for this report.
3 Click OK to save changes.
394
CHAPTER 20
Monitoring Performance Data in Real Time
In This Chapter
About Real-Time Data features ................................................................... 394
Using InstantInfo popups .............................................................................. 394
Using Network Tools to view real-time data .......................................... 396
Using Split Second Graph Workspace Reports ...................................... 398
Viewing Real-time Data in Full Reports .................................................... 399
About Real-Time Data features
Note: These features are only available in WhatsUp Gold Premium Edition, WhatsUp Gold MSP Edition, and WhatsUp Gold Distributed Edition.
The historical performance data that WhatsUp Gold tracks helps you discover and analyze network usage trends that have already occurred; however, at times you need to view device usage data immediately, in real time.
WhatsUp Gold includes several features that enable you to monitor performance data in real time.
InstantInfo popups. Throughout workspaces and full reports, you can hover over some links (such as hard drive names or network interfaces) to see real-time data.
Web Task Manager and Web Performance Monitor. These Web-based network tools extend the functionality of familiar Windows tools to every device you monitor in real time--even for devices that do not run Windows.
Split Second Graphs Workspace Reports. These reports allow you to add real-time data into any workspace view.
Real-time data in Full Reports. Many full reports now include a graph that updates with up-to-the-minute information. This real-time data is paired with historical data to give you a comprehensive report.
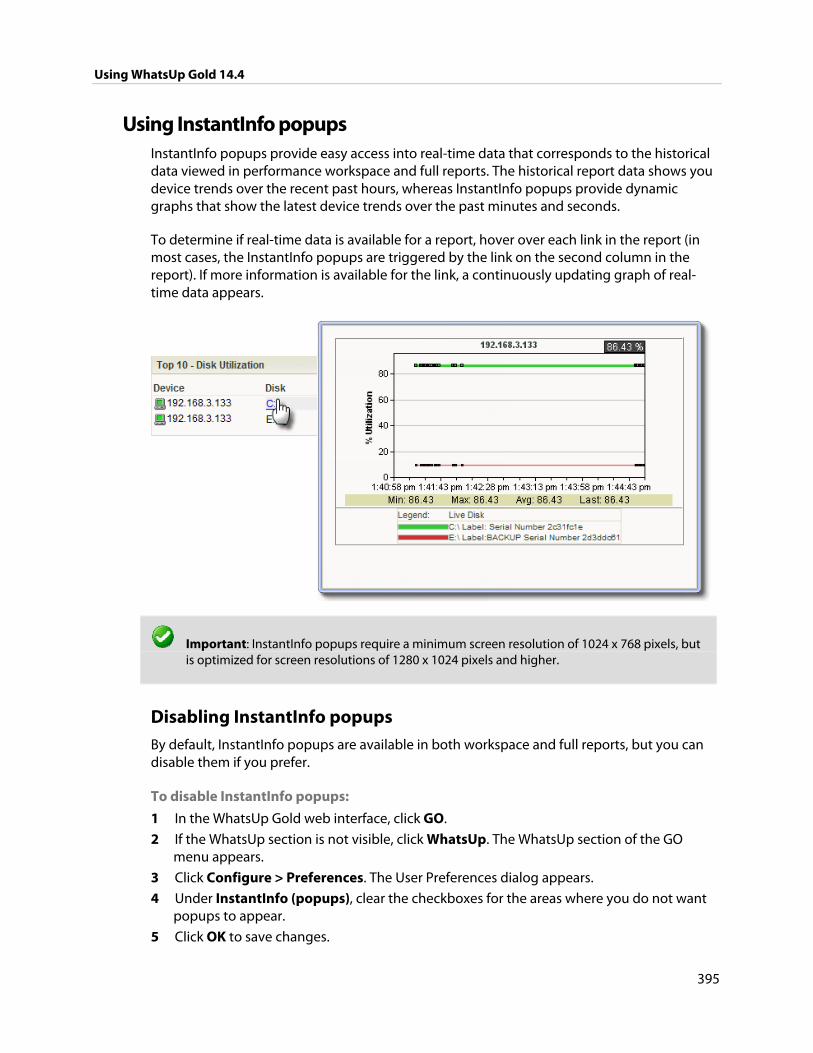
Using WhatsUp Gold 14.4
395
Using InstantInfo popups InstantInfo popups provide easy access into real-time data that corresponds to the historical data viewed in performance workspace and full reports. The historical report data shows you device trends over the recent past hours, whereas InstantInfo popups provide dynamic graphs that show the latest device trends over the past minutes and seconds.
To determine if real-time data is available for a report, hover over each link in the report (in most cases, the InstantInfo popups are triggered by the link on the second column in the report). If more information is available for the link, a continuously updating graph of real-time data appears.
Important: InstantInfo popups require a minimum screen resolution of 1024 x 768 pixels, but is optimized for screen resolutions of 1280 x 1024 pixels and higher.
Disabling InstantInfo popups By default, InstantInfo popups are available in both workspace and full reports, but you can disable them if you prefer.
To disable InstantInfo popups:
1 In the WhatsUp Gold web interface, click GO.
2 If the WhatsUp section is not visible, click WhatsUp. The WhatsUp section of the GO menu appears.
3 Click Configure > Preferences. The User Preferences dialog appears.
4 Under InstantInfo (popups), clear the checkboxes for the areas where you do not want popups to appear.
5 Click OK to save changes.
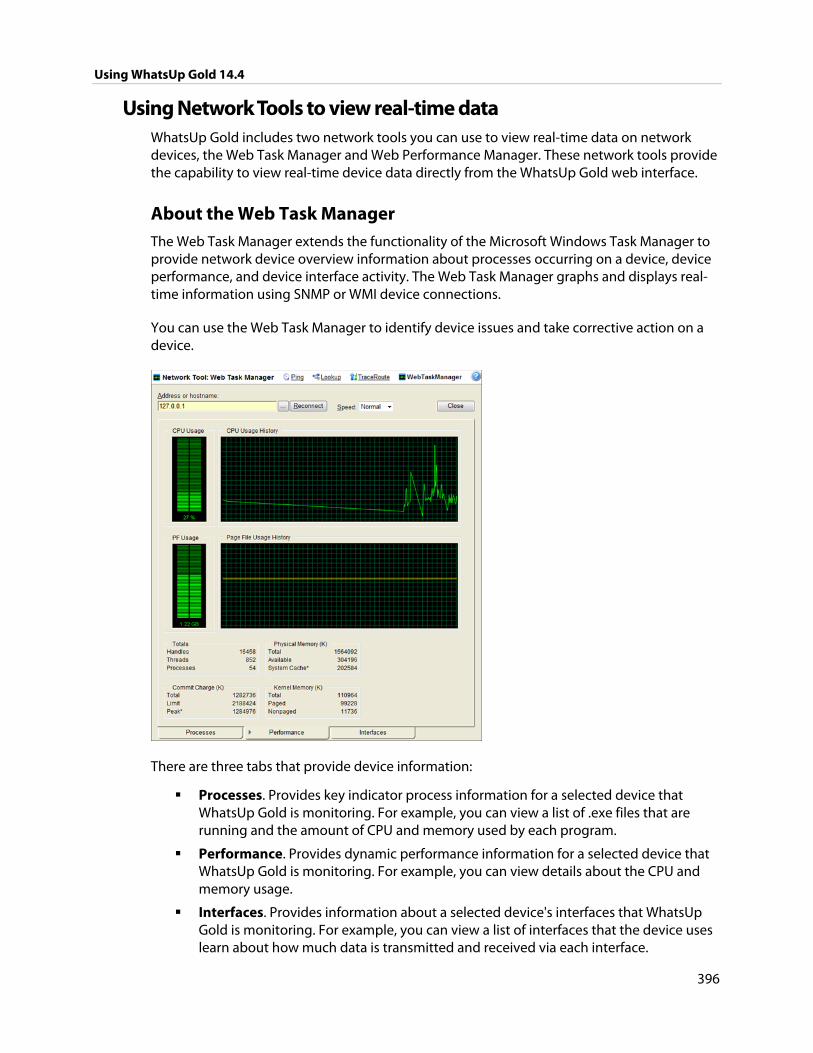
Using WhatsUp Gold 14.4
396
Using Network Tools to view real-time data WhatsUp Gold includes two network tools you can use to view real-time data on network devices, the Web Task Manager and Web Performance Manager. These network tools provide the capability to view real-time device data directly from the WhatsUp Gold web interface.
About the Web Task Manager The Web Task Manager extends the functionality of the Microsoft Windows Task Manager to provide network device overview information about processes occurring on a device, device performance, and device interface activity. The Web Task Manager graphs and displays real-time information using SNMP or WMI device connections.
You can use the Web Task Manager to identify device issues and take corrective action on a device.
There are three tabs that provide device information:
Processes. Provides key indicator process information for a selected device that WhatsUp Gold is monitoring. For example, you can view a list of .exe files that are running and the amount of CPU and memory used by each program.
Performance. Provides dynamic performance information for a selected device that WhatsUp Gold is monitoring. For example, you can view details about the CPU and memory usage.
Interfaces. Provides information about a selected device's interfaces that WhatsUp Gold is monitoring. For example, you can view a list of interfaces that the device uses learn about how much data is transmitted and received via each interface.
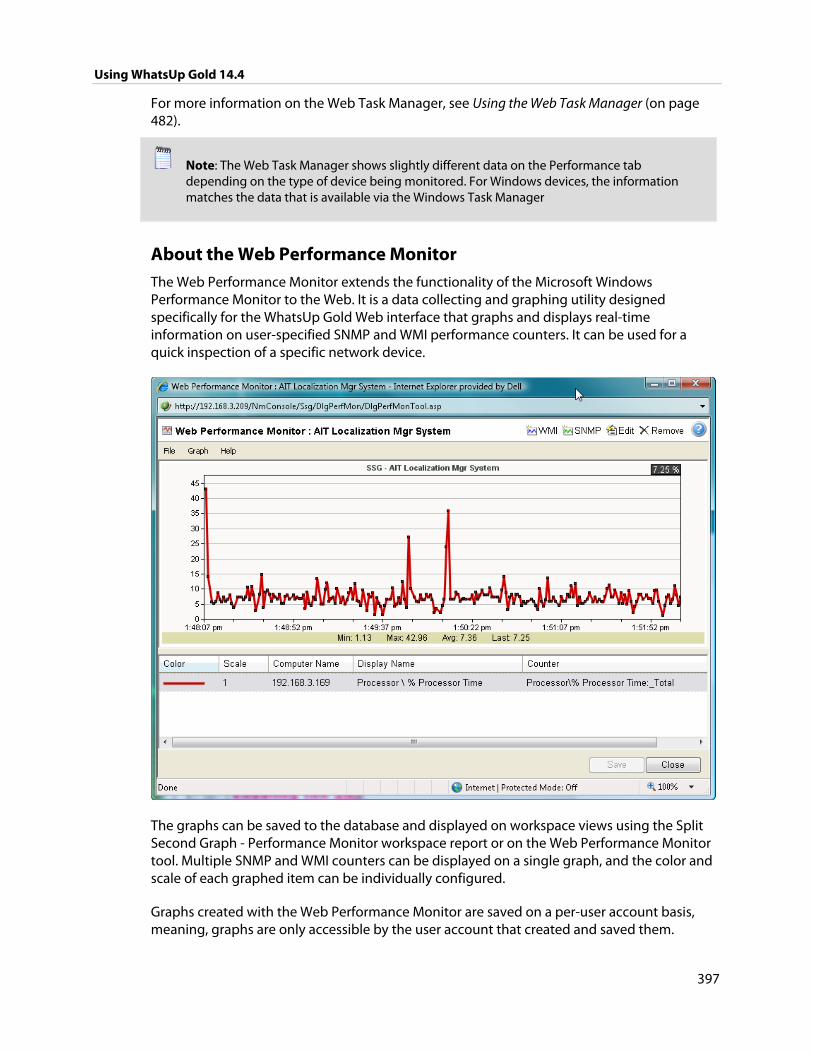
Using WhatsUp Gold 14.4
397
For more information on the Web Task Manager, see Using the Web Task Manager (on page 482).
Note: The Web Task Manager shows slightly different data on the Performance tab depending on the type of device being monitored. For Windows devices, the information matches the data that is available via the Windows Task Manager
About the Web Performance Monitor The Web Performance Monitor extends the functionality of the Microsoft Windows Performance Monitor to the Web. It is a data collecting and graphing utility designed specifically for the WhatsUp Gold Web interface that graphs and displays real-time information on user-specified SNMP and WMI performance counters. It can be used for a quick inspection of a specific network device.
The graphs can be saved to the database and displayed on workspace views using the Split Second Graph - Performance Monitor workspace report or on the Web Performance Monitor tool. Multiple SNMP and WMI counters can be displayed on a single graph, and the color and scale of each graphed item can be individually configured.
Graphs created with the Web Performance Monitor are saved on a per-user account basis, meaning, graphs are only accessible by the user account that created and saved them.
Using WhatsUp Gold 14.4
398
The Web Performance Monitor has two purposes:
To provide a Web enabled WMI and SNMP performance counter poller and grapher. It supports WMI for Windows servers, and SNMP for network devices such as switches, routers, and UNIX devices.
To build and edit graphs for use by the Performance Monitor workspace report. You can use this workspace report to display any saved graph.
For more information, see Using the Web Performance Monitor (on page 480).
Using Split Second Graph Workspace Reports With Split Second Graph Workspace Reports, you can embed the real-time data that is available from InstantInfo popups, the Web Task Manager, and the Web Performance Monitor into any workspace view.
For information on how to add a Workspace Report to a workspace view, see Adding workspace reports to a workspace view (on page 410).
Using the Performance Monitor workspace report The Performance Monitor workspace report allows you to add a graph that you create in the Web Performance Monitor to a home workspace view.
To use the Performance Monitor workspace report:
1 In Web Performance Monitor, create and save the graph you want to use in the Performance Monitor workspace report.
a) From the web interface, click GO. The GO menu appears.
b) If the WhatsUp section is not visible, click WhatsUp. The WhatsUp section of the GO menu appears.
c) Select Tools > Web Performance Monitor. The Web Performance Monitor appears.
d) From the Graph menu, add the WMI and SMP counters that you want to graph.
e) After the graph is configured to show the data you want to see in the Performance Monitor workspace report, select File > Save Graph as. The Save Graph dialog appears.
f) Enter a name for the graph, then click OK. Your graph is saved and ready to use in the Performance Monitor workspace report.
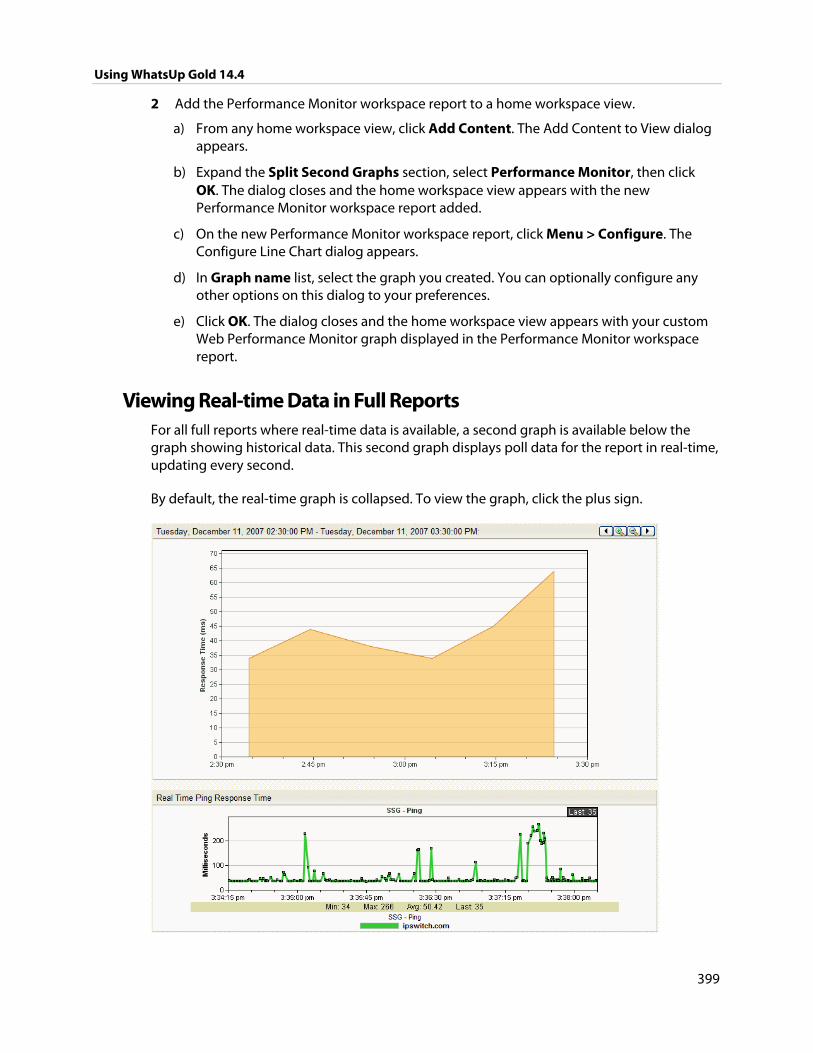
Using WhatsUp Gold 14.4
399
2 Add the Performance Monitor workspace report to a home workspace view.
a) From any home workspace view, click Add Content. The Add Content to View dialog appears.
b) Expand the Split Second Graphs section, select Performance Monitor, then click OK. The dialog closes and the home workspace view appears with the new Performance Monitor workspace report added.
c) On the new Performance Monitor workspace report, click Menu > Configure. The Configure Line Chart dialog appears.
d) In Graph name list, select the graph you created. You can optionally configure any other options on this dialog to your preferences.
e) Click OK. The dialog closes and the home workspace view appears with your custom Web Performance Monitor graph displayed in the Performance Monitor workspace report.
Viewing Real-time Data in Full Reports For all full reports where real-time data is available, a second graph is available below the graph showing historical data. This second graph displays poll data for the report in real-time, updating every second.
By default, the real-time graph is collapsed. To view the graph, click the plus sign.
400
Using Reporting Features
CHAPTER 21
Understanding and Using Workspaces
In This Chapter
Learning about workspaces ......................................................................... 400
About types of workspaces ........................................................................... 401
Managing Workspace Views ........................................................................ 407
Navigating Workspace Views ....................................................................... 410
About workspace content ............................................................................. 410
Adding workspace reports to a workspace view .................................. 410
Learning about workspaces The WhatsUp Gold Home workspace is the first screen you see after logging in to the web interface. This is your personal, customizable Home portal, or workspace.
Workspaces in WhatsUp Gold are designed to be user-specific, and are configurable to include workspace reports specific to users' needs. Workspaces contain multiple views that let you organize various workspace reports by the type of information they display. When you begin customizing your workspace views, you should consider the types of information you need to view most often, the devices in which you need to pay closest attention, and what level of detail you want to monitor through a particular workspace view. You should also take into consideration the type of workspace, and the types of workspace reports you can add to a particular workspace type.
Home and Device Status workspaces
Home workspaces can display both Home- and Device-level workspace reports. You can place any workspace report on a Home workspace; mixing and matching summary, group, and device-specific data.
Changes that you make to a workspace view only affect your user account. If you decide to completely change all of the workspace views under your account, your user account will be the only account affected by these changes. For more information, see Managing workspace views (on page 407).
Using WhatsUp Gold 14.4
401
Device Status workspaces are limited to display only Device-level workspace reports. Only workspace reports specific to a single device can be placed on a device workspace. When you change the device-in-context, the reports displayed show data corresponding to the newly selected device. For more information, see Adding workspace reports to a workspace view (on page 410).
Top 10 workspaces display Top 10 full reports for your network devices.
About types of workspaces The WhatsUp web interface has three types of workspaces:
Home (on page 402)
Device Status
Top 10 (on page 405)
Each of the workspace types supports multiple user-defined views and up to 15 small reports known as workspace reports can be displayed within each view. These workspace reports show content ranging from Current Interface and CPU utilization to Syslog messages. It’s up to you to decide which content is most important.
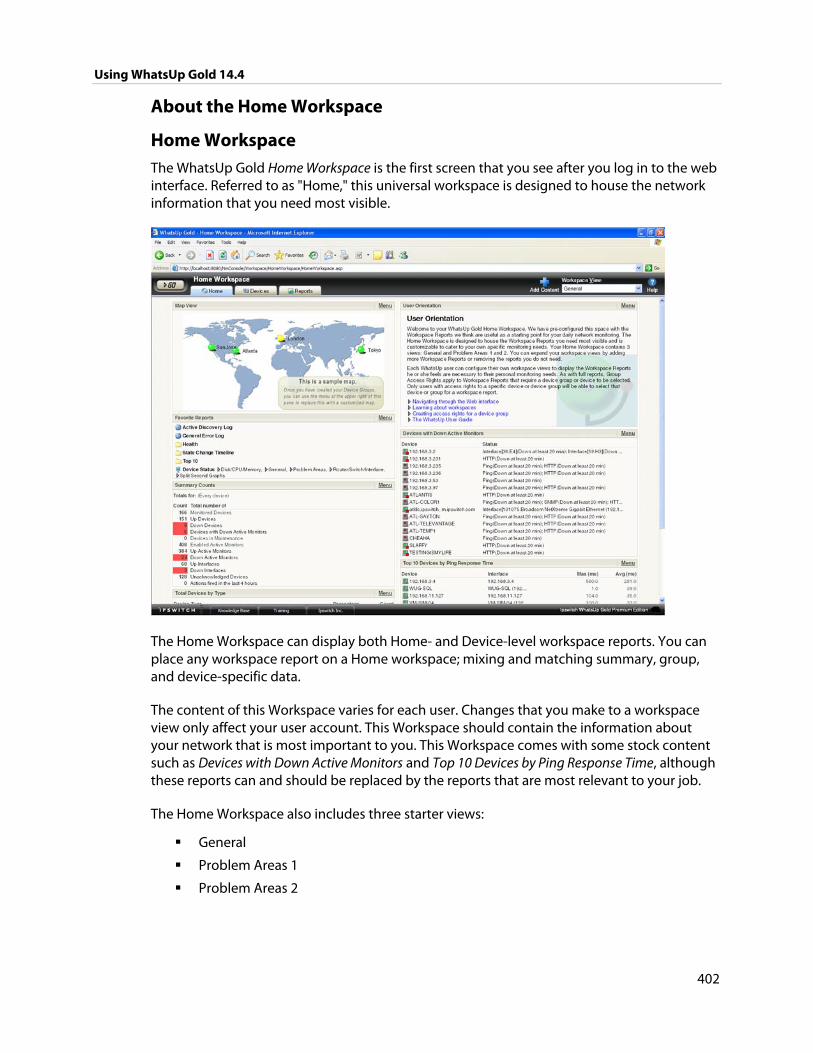
Using WhatsUp Gold 14.4
402
About the Home Workspace
Home Workspace The WhatsUp Gold Home Workspace is the first screen that you see after you log in to the web interface. Referred to as "Home," this universal workspace is designed to house the network information that you need most visible.
The Home Workspace can display both Home- and Device-level workspace reports. You can place any workspace report on a Home workspace; mixing and matching summary, group, and device-specific data.
The content of this Workspace varies for each user. Changes that you make to a workspace view only affect your user account. This Workspace should contain the information about your network that is most important to you. This Workspace comes with some stock content such as Devices with Down Active Monitors and Top 10 Devices by Ping Response Time, although these reports can and should be replaced by the reports that are most relevant to your job.
The Home Workspace also includes three starter views:
General
Problem Areas 1
Problem Areas 2
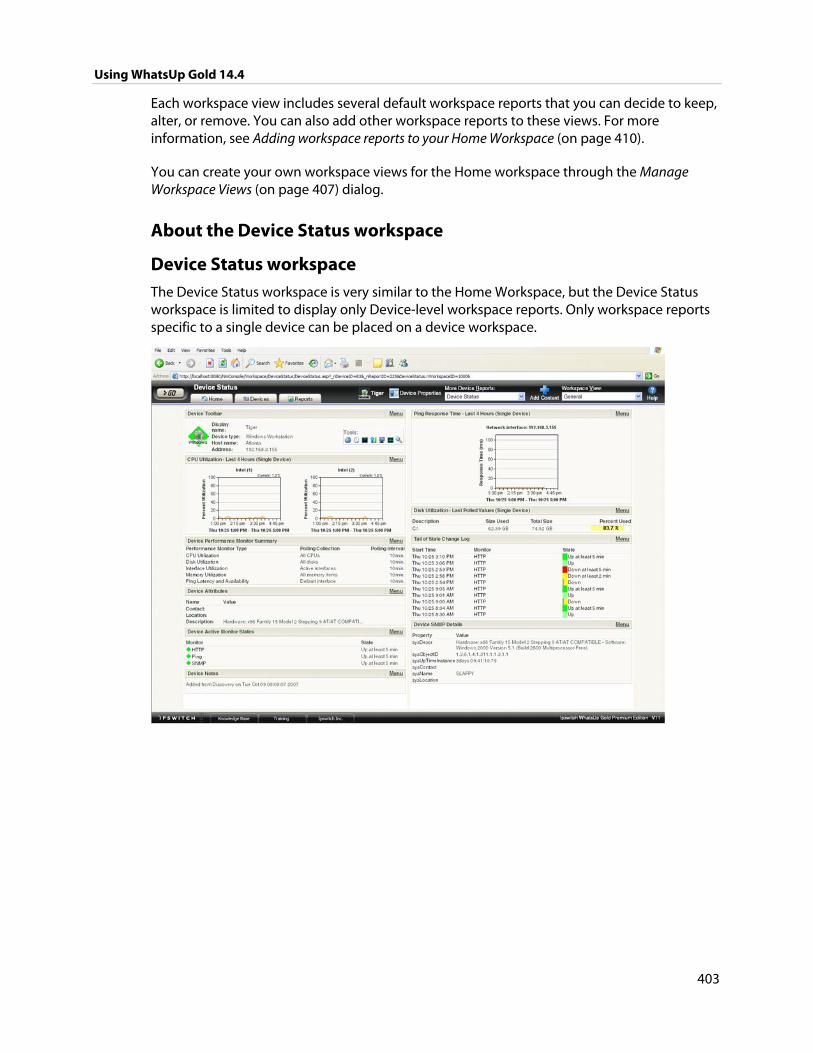
Using WhatsUp Gold 14.4
403
Each workspace view includes several default workspace reports that you can decide to keep, alter, or remove. You can also add other workspace reports to these views. For more information, see Adding workspace reports to your Home Workspace (on page 410).
You can create your own workspace views for the Home workspace through the Manage Workspace Views (on page 407) dialog.
About the Device Status workspace
Device Status workspace The Device Status workspace is very similar to the Home Workspace, but the Device Status workspace is limited to display only Device-level workspace reports. Only workspace reports specific to a single device can be placed on a device workspace.
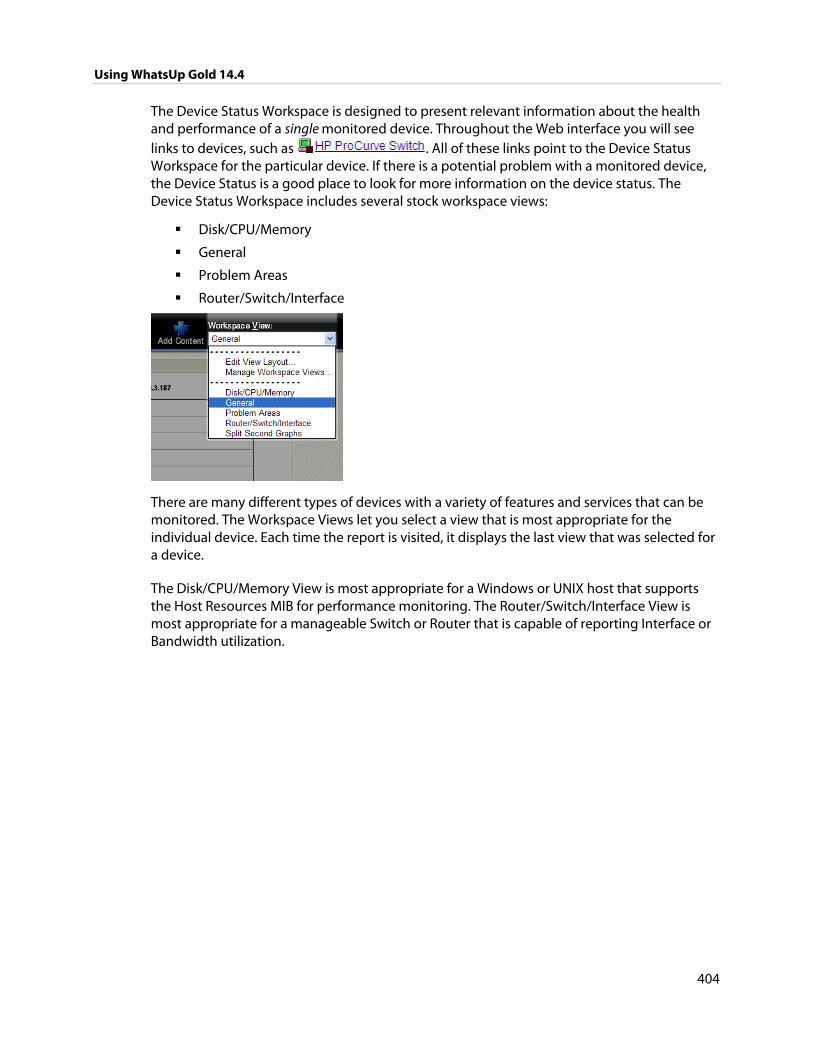
Using WhatsUp Gold 14.4
404
The Device Status Workspace is designed to present relevant information about the health and performance of a single monitored device. Throughout the Web interface you will see links to devices, such as . All of these links point to the Device Status Workspace for the particular device. If there is a potential problem with a monitored device, the Device Status is a good place to look for more information on the device status. The Device Status Workspace includes several stock workspace views:
Disk/CPU/Memory
General
Problem Areas
Router/Switch/Interface
There are many different types of devices with a variety of features and services that can be monitored. The Workspace Views let you select a view that is most appropriate for the individual device. Each time the report is visited, it displays the last view that was selected for a device.
The Disk/CPU/Memory View is most appropriate for a Windows or UNIX host that supports the Host Resources MIB for performance monitoring. The Router/Switch/Interface View is most appropriate for a manageable Switch or Router that is capable of reporting Interface or Bandwidth utilization.
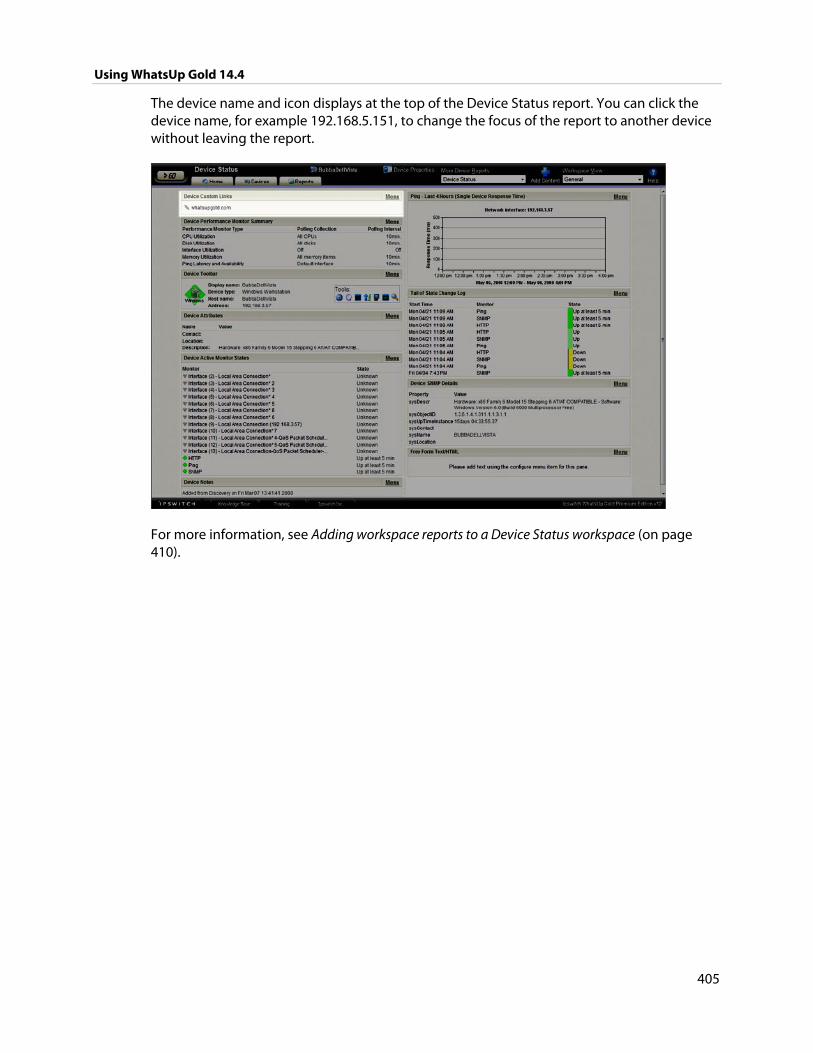
Using WhatsUp Gold 14.4
405
The device name and icon displays at the top of the Device Status report. You can click the device name, for example 192.168.5.151, to change the focus of the report to another device without leaving the report.
For more information, see Adding workspace reports to a Device Status workspace (on page 410).
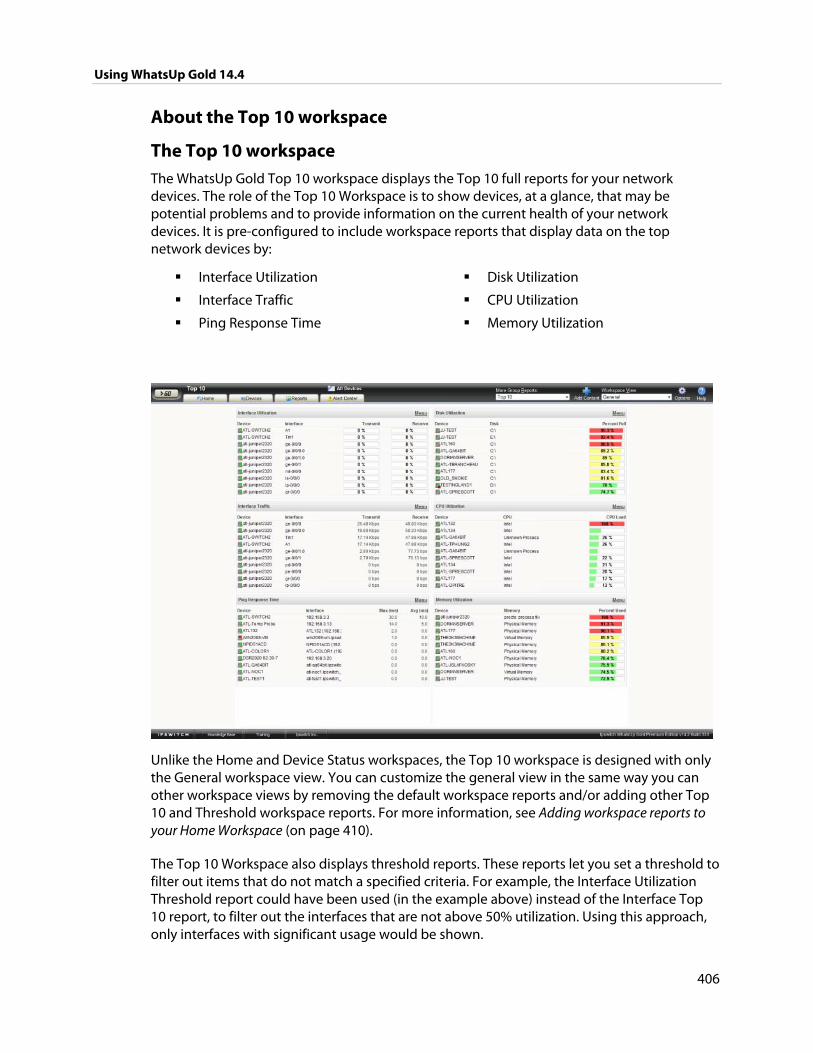
Using WhatsUp Gold 14.4
406
About the Top 10 workspace
The Top 10 workspace The WhatsUp Gold Top 10 workspace displays the Top 10 full reports for your network devices. The role of the Top 10 Workspace is to show devices, at a glance, that may be potential problems and to provide information on the current health of your network devices. It is pre-configured to include workspace reports that display data on the top network devices by:
Interface Utilization
Interface Traffic
Ping Response Time
Disk Utilization
CPU Utilization
Memory Utilization
Unlike the Home and Device Status workspaces, the Top 10 workspace is designed with only the General workspace view. You can customize the general view in the same way you can other workspace views by removing the default workspace reports and/or adding other Top 10 and Threshold workspace reports. For more information, see Adding workspace reports to your Home Workspace (on page 410).
The Top 10 Workspace also displays threshold reports. These reports let you set a threshold to filter out items that do not match a specified criteria. For example, the Interface Utilization Threshold report could have been used (in the example above) instead of the Interface Top 10 report, to filter out the interfaces that are not above 50% utilization. Using this approach, only interfaces with significant usage would be shown.
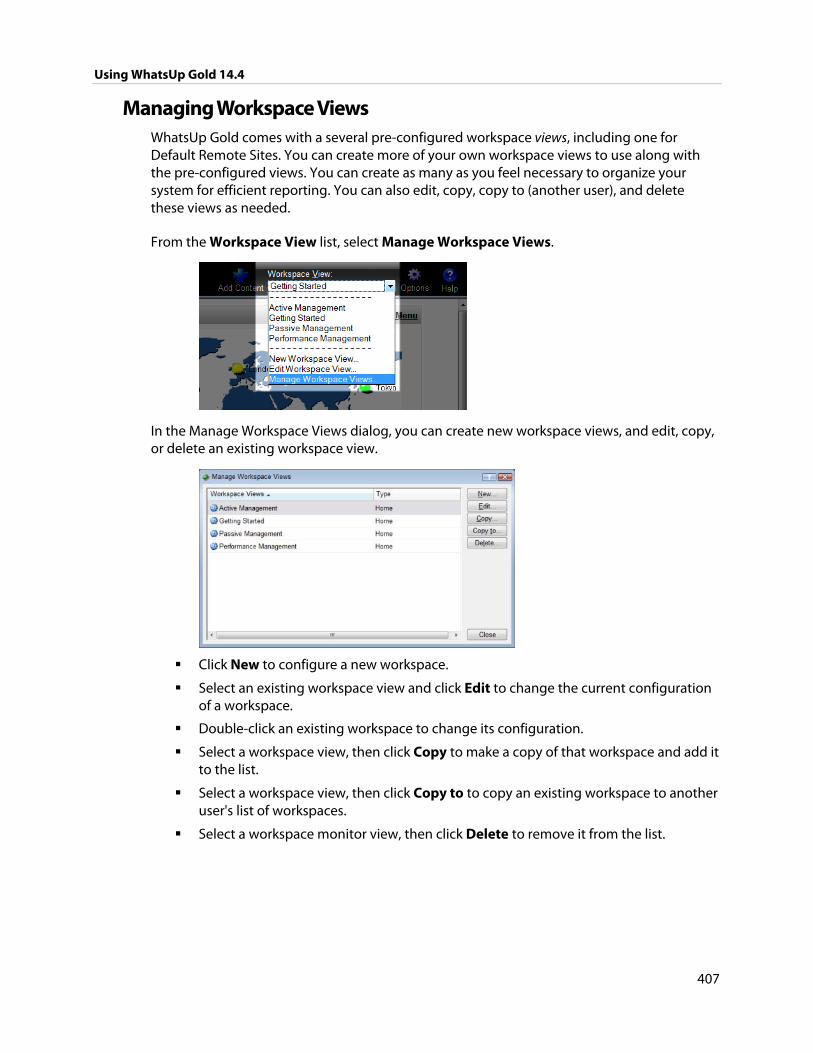
Using WhatsUp Gold 14.4
407
Managing Workspace Views WhatsUp Gold comes with a several pre-configured workspace views, including one for Default Remote Sites. You can create more of your own workspace views to use along with the pre-configured views. You can create as many as you feel necessary to organize your system for efficient reporting. You can also edit, copy, copy to (another user), and delete these views as needed.
From the Workspace View list, select Manage Workspace Views.
In the Manage Workspace Views dialog, you can create new workspace views, and edit, copy, or delete an existing workspace view.
Click New to configure a new workspace.
Select an existing workspace view and click Edit to change the current configuration of a workspace.
Double-click an existing workspace to change its configuration.
Select a workspace view, then click Copy to make a copy of that workspace and add it to the list.
Select a workspace view, then click Copy to to copy an existing workspace to another user's list of workspaces.
Select a workspace monitor view, then click Delete to remove it from the list.
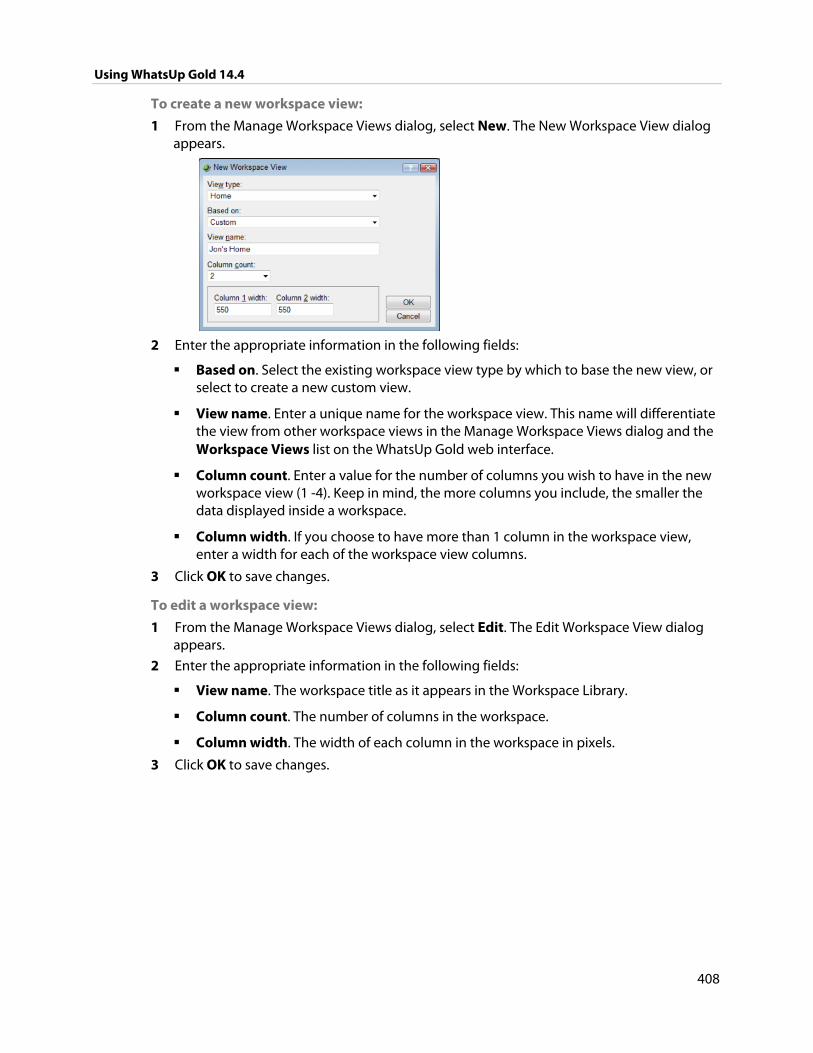
Using WhatsUp Gold 14.4
408
To create a new workspace view:
1 From the Manage Workspace Views dialog, select New. The New Workspace View dialog appears.
2 Enter the appropriate information in the following fields:
Based on. Select the existing workspace view type by which to base the new view, or select to create a new custom view.
View name. Enter a unique name for the workspace view. This name will differentiate the view from other workspace views in the Manage Workspace Views dialog and the Workspace Views list on the WhatsUp Gold web interface.
Column count. Enter a value for the number of columns you wish to have in the new workspace view (1 -4). Keep in mind, the more columns you include, the smaller the data displayed inside a workspace.
Column width. If you choose to have more than 1 column in the workspace view, enter a width for each of the workspace view columns.
3 Click OK to save changes.
To edit a workspace view:
1 From the Manage Workspace Views dialog, select Edit. The Edit Workspace View dialog appears.
2 Enter the appropriate information in the following fields:
View name. The workspace title as it appears in the Workspace Library.
Column count. The number of columns in the workspace.
Column width. The width of each column in the workspace in pixels.
3 Click OK to save changes.
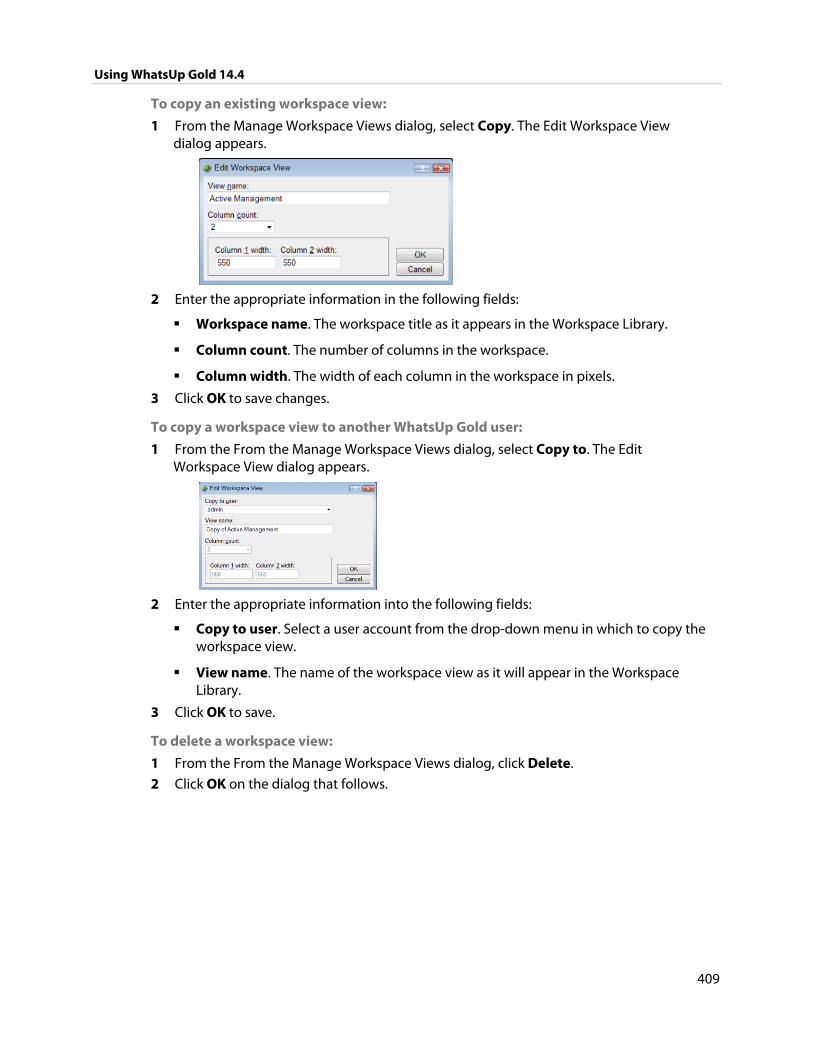
Using WhatsUp Gold 14.4
409
To copy an existing workspace view:
1 From the Manage Workspace Views dialog, select Copy. The Edit Workspace View dialog appears.
2 Enter the appropriate information in the following fields:
Workspace name. The workspace title as it appears in the Workspace Library.
Column count. The number of columns in the workspace.
Column width. The width of each column in the workspace in pixels.
3 Click OK to save changes.
To copy a workspace view to another WhatsUp Gold user:
1 From the From the Manage Workspace Views dialog, select Copy to. The Edit Workspace View dialog appears.
2 Enter the appropriate information into the following fields:
Copy to user. Select a user account from the drop-down menu in which to copy the workspace view.
View name. The name of the workspace view as it will appear in the Workspace Library.
3 Click OK to save.
To delete a workspace view:
1 From the From the Manage Workspace Views dialog, click Delete.
2 Click OK on the dialog that follows.
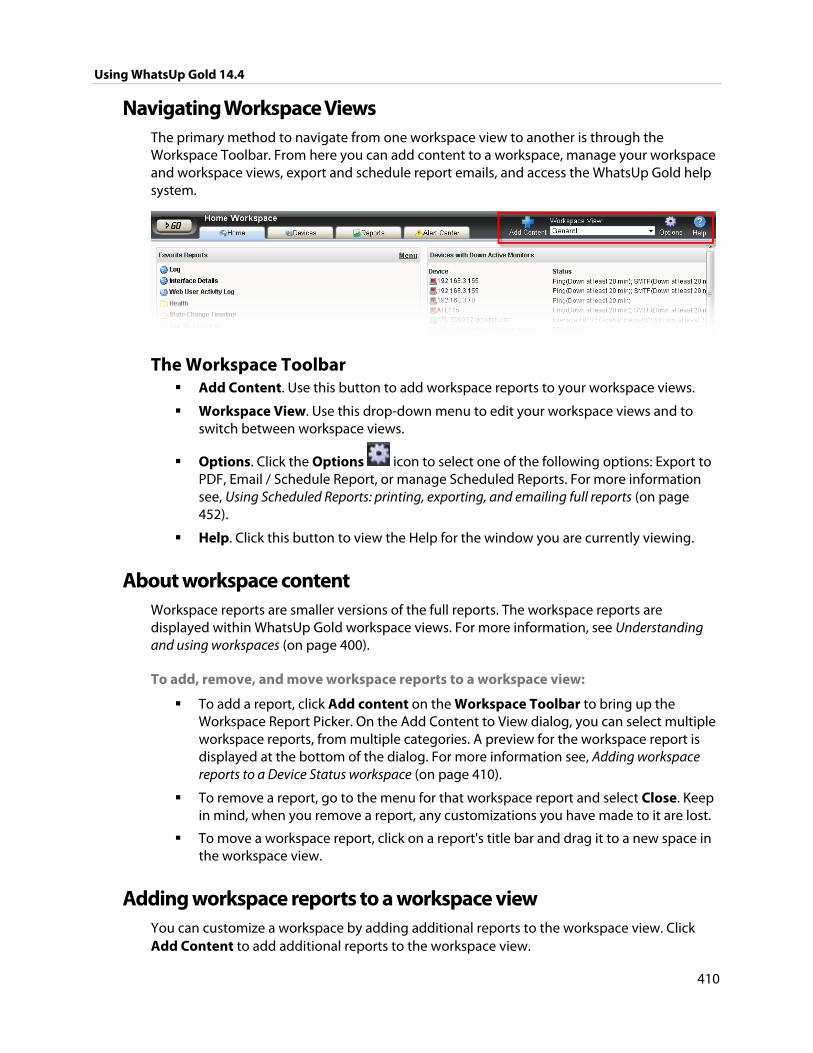
Using WhatsUp Gold 14.4
410
Navigating Workspace Views The primary method to navigate from one workspace view to another is through the Workspace Toolbar. From here you can add content to a workspace, manage your workspace and workspace views, export and schedule report emails, and access the WhatsUp Gold help system.
The Workspace Toolbar Add Content. Use this button to add workspace reports to your workspace views.
Workspace View. Use this drop-down menu to edit your workspace views and to switch between workspace views.
Options. Click the Options icon to select one of the following options: Export to PDF, Email / Schedule Report, or manage Scheduled Reports. For more information see, Using Scheduled Reports: printing, exporting, and emailing full reports (on page 452).
Help. Click this button to view the Help for the window you are currently viewing.
About workspace content Workspace reports are smaller versions of the full reports. The workspace reports are displayed within WhatsUp Gold workspace views. For more information, see Understanding and using workspaces (on page 400).
To add, remove, and move workspace reports to a workspace view:
To add a report, click Add content on the Workspace Toolbar to bring up the Workspace Report Picker. On the Add Content to View dialog, you can select multiple workspace reports, from multiple categories. A preview for the workspace report is displayed at the bottom of the dialog. For more information see, Adding workspace reports to a Device Status workspace (on page 410).
To remove a report, go to the menu for that workspace report and select Close. Keep in mind, when you remove a report, any customizations you have made to it are lost.
To move a workspace report, click on a report's title bar and drag it to a new space in the workspace view.
Adding workspace reports to a workspace view You can customize a workspace by adding additional reports to the workspace view. Click Add Content to add additional reports to the workspace view.
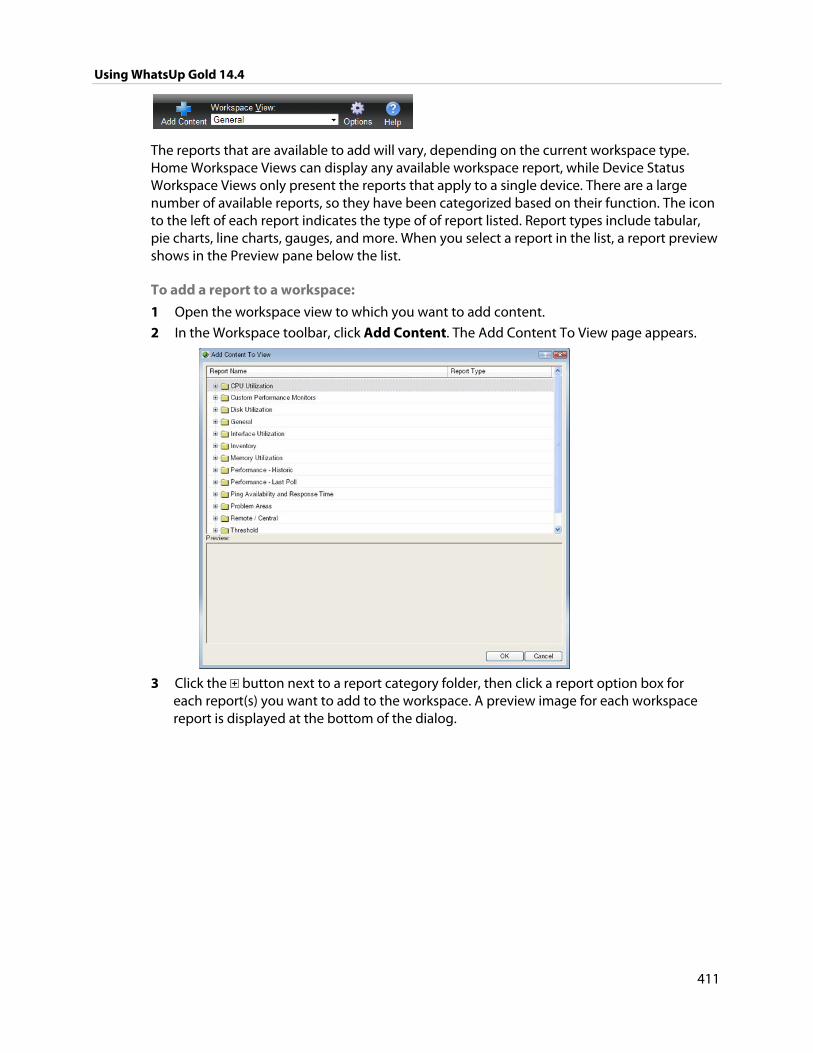
Using WhatsUp Gold 14.4
411
The reports that are available to add will vary, depending on the current workspace type. Home Workspace Views can display any available workspace report, while Device Status Workspace Views only present the reports that apply to a single device. There are a large number of available reports, so they have been categorized based on their function. The icon to the left of each report indicates the type of of report listed. Report types include tabular, pie charts, line charts, gauges, and more. When you select a report in the list, a report preview shows in the Preview pane below the list.
To add a report to a workspace:
1 Open the workspace view to which you want to add content.
2 In the Workspace toolbar, click Add Content. The Add Content To View page appears.
3 Click the button next to a report category folder, then click a report option box for
each report(s) you want to add to the workspace. A preview image for each workspace report is displayed at the bottom of the dialog.
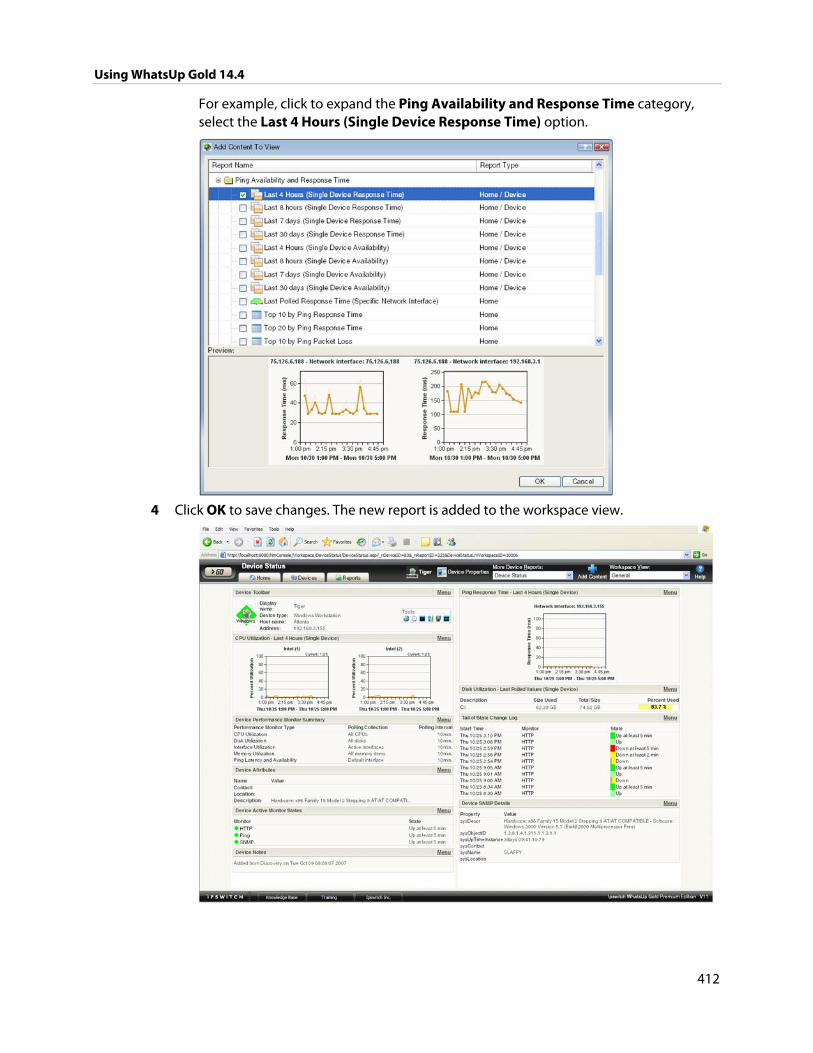
Using WhatsUp Gold 14.4
412
For example, click to expand the Ping Availability and Response Time category, select the Last 4 Hours (Single Device Response Time) option.
4 Click OK to save changes. The new report is added to the workspace view.
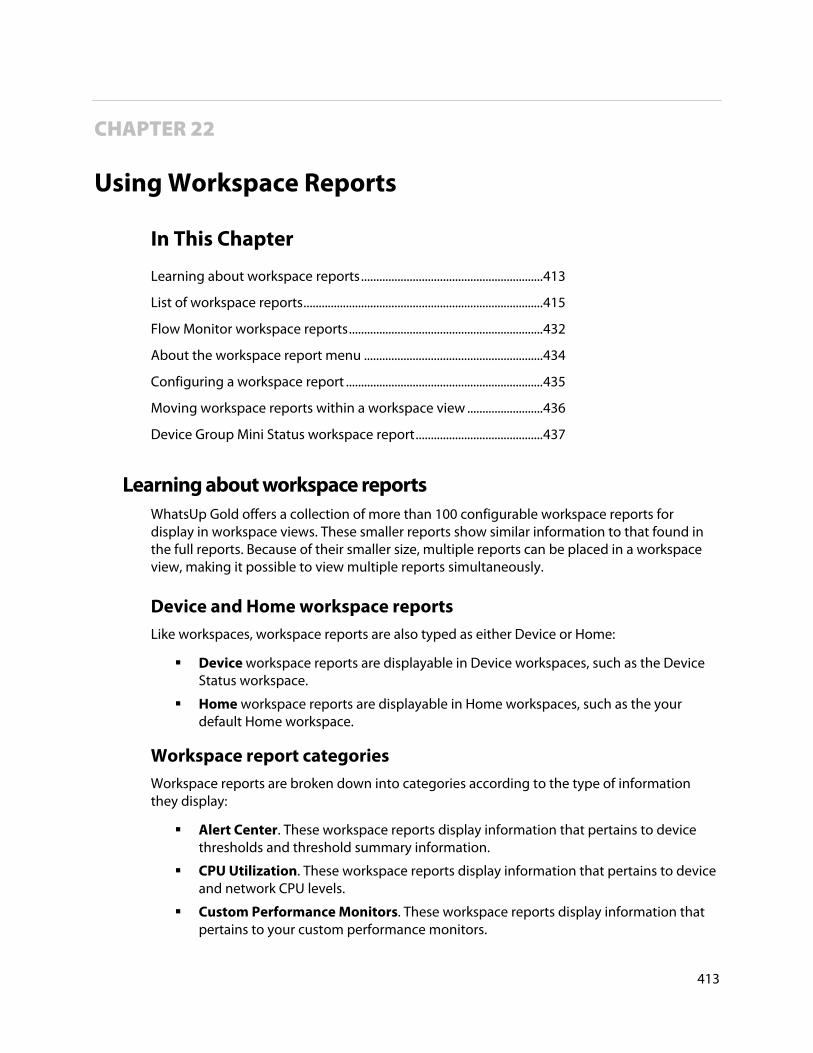
413
CHAPTER 22
Using Workspace Reports
In This Chapter
Learning about workspace reports ............................................................ 413
List of workspace reports ............................................................................... 415
Flow Monitor workspace reports ................................................................ 432
About the workspace report menu ........................................................... 434
Configuring a workspace report ................................................................. 435
Moving workspace reports within a workspace view ......................... 436
Device Group Mini Status workspace report .......................................... 437
Learning about workspace reports WhatsUp Gold offers a collection of more than 100 configurable workspace reports for display in workspace views. These smaller reports show similar information to that found in the full reports. Because of their smaller size, multiple reports can be placed in a workspace view, making it possible to view multiple reports simultaneously.
Device and Home workspace reports Like workspaces, workspace reports are also typed as either Device or Home:
Device workspace reports are displayable in Device workspaces, such as the Device Status workspace.
Home workspace reports are displayable in Home workspaces, such as the your default Home workspace.
Workspace report categories Workspace reports are broken down into categories according to the type of information they display:
Alert Center. These workspace reports display information that pertains to device thresholds and threshold summary information.
CPU Utilization. These workspace reports display information that pertains to device and network CPU levels.
Custom Performance Monitors. These workspace reports display information that pertains to your custom performance monitors.
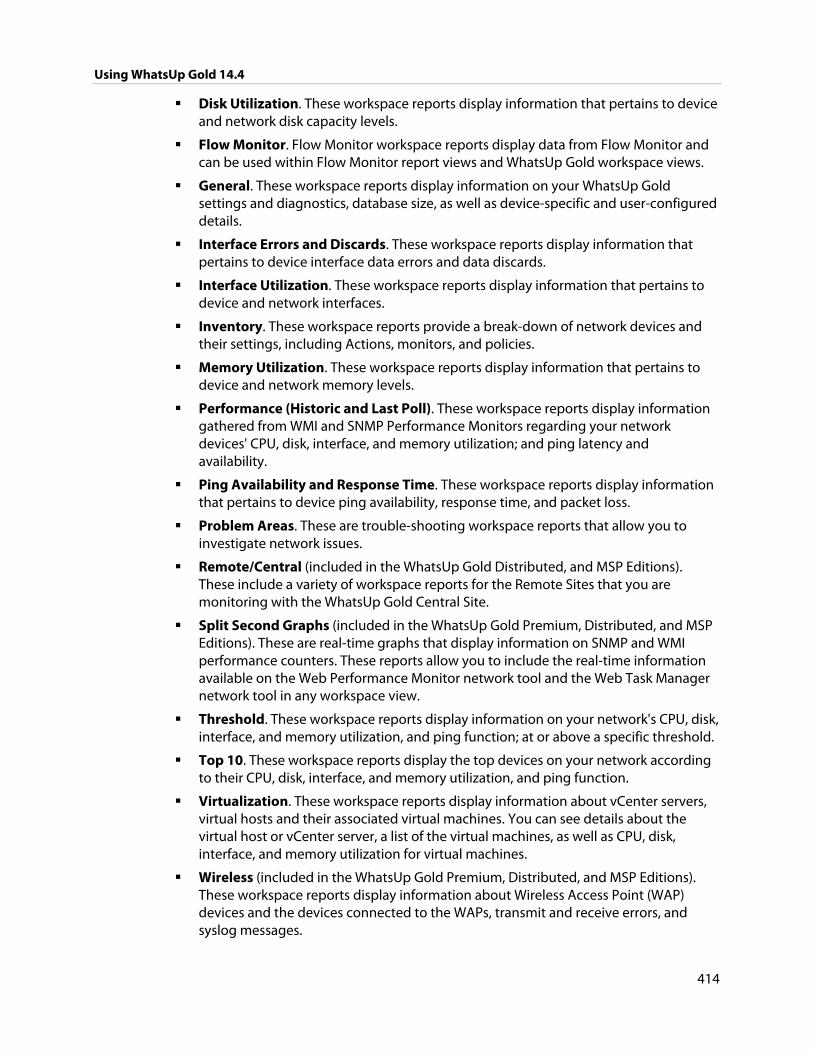
Using WhatsUp Gold 14.4
414
Disk Utilization. These workspace reports display information that pertains to device and network disk capacity levels.
Flow Monitor. Flow Monitor workspace reports display data from Flow Monitor and can be used within Flow Monitor report views and WhatsUp Gold workspace views.
General. These workspace reports display information on your WhatsUp Gold settings and diagnostics, database size, as well as device-specific and user-configured details.
Interface Errors and Discards. These workspace reports display information that pertains to device interface data errors and data discards.
Interface Utilization. These workspace reports display information that pertains to device and network interfaces.
Inventory. These workspace reports provide a break-down of network devices and their settings, including Actions, monitors, and policies.
Memory Utilization. These workspace reports display information that pertains to device and network memory levels.
Performance (Historic and Last Poll). These workspace reports display information gathered from WMI and SNMP Performance Monitors regarding your network devices' CPU, disk, interface, and memory utilization; and ping latency and availability.
Ping Availability and Response Time. These workspace reports display information that pertains to device ping availability, response time, and packet loss.
Problem Areas. These are trouble-shooting workspace reports that allow you to investigate network issues.
Remote/Central (included in the WhatsUp Gold Distributed, and MSP Editions). These include a variety of workspace reports for the Remote Sites that you are monitoring with the WhatsUp Gold Central Site.
Split Second Graphs (included in the WhatsUp Gold Premium, Distributed, and MSP Editions). These are real-time graphs that display information on SNMP and WMI performance counters. These reports allow you to include the real-time information available on the Web Performance Monitor network tool and the Web Task Manager network tool in any workspace view.
Threshold. These workspace reports display information on your network's CPU, disk, interface, and memory utilization, and ping function; at or above a specific threshold.
Top 10. These workspace reports display the top devices on your network according to their CPU, disk, interface, and memory utilization, and ping function.
Virtualization. These workspace reports display information about vCenter servers, virtual hosts and their associated virtual machines. You can see details about the virtual host or vCenter server, a list of the virtual machines, as well as CPU, disk, interface, and memory utilization for virtual machines.
Wireless (included in the WhatsUp Gold Premium, Distributed, and MSP Editions). These workspace reports display information about Wireless Access Point (WAP) devices and the devices connected to the WAPs, transmit and receive errors, and syslog messages.
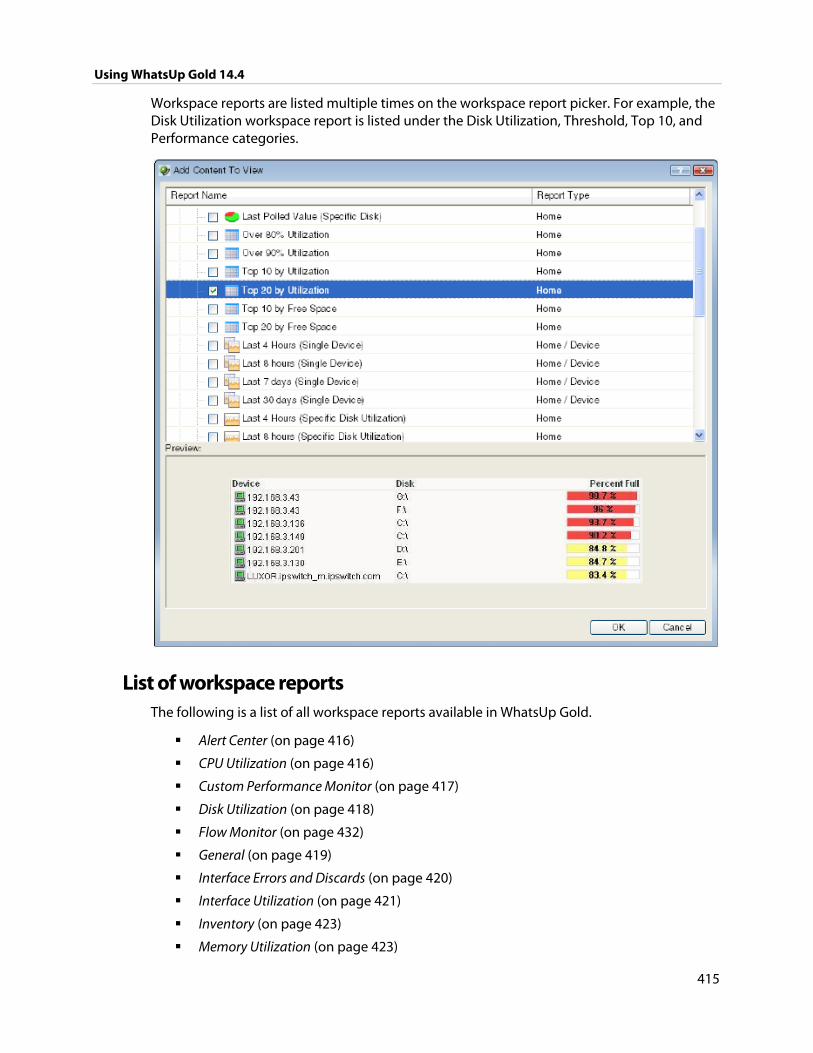
Using WhatsUp Gold 14.4
415
Workspace reports are listed multiple times on the workspace report picker. For example, the Disk Utilization workspace report is listed under the Disk Utilization, Threshold, Top 10, and Performance categories.
List of workspace reports The following is a list of all workspace reports available in WhatsUp Gold.
Alert Center (on page 416)
CPU Utilization (on page 416)
Custom Performance Monitor (on page 417)
Disk Utilization (on page 418)
Flow Monitor (on page 432)
General (on page 419)
Interface Errors and Discards (on page 420)
Interface Utilization (on page 421)
Inventory (on page 423)
Memory Utilization (on page 423)
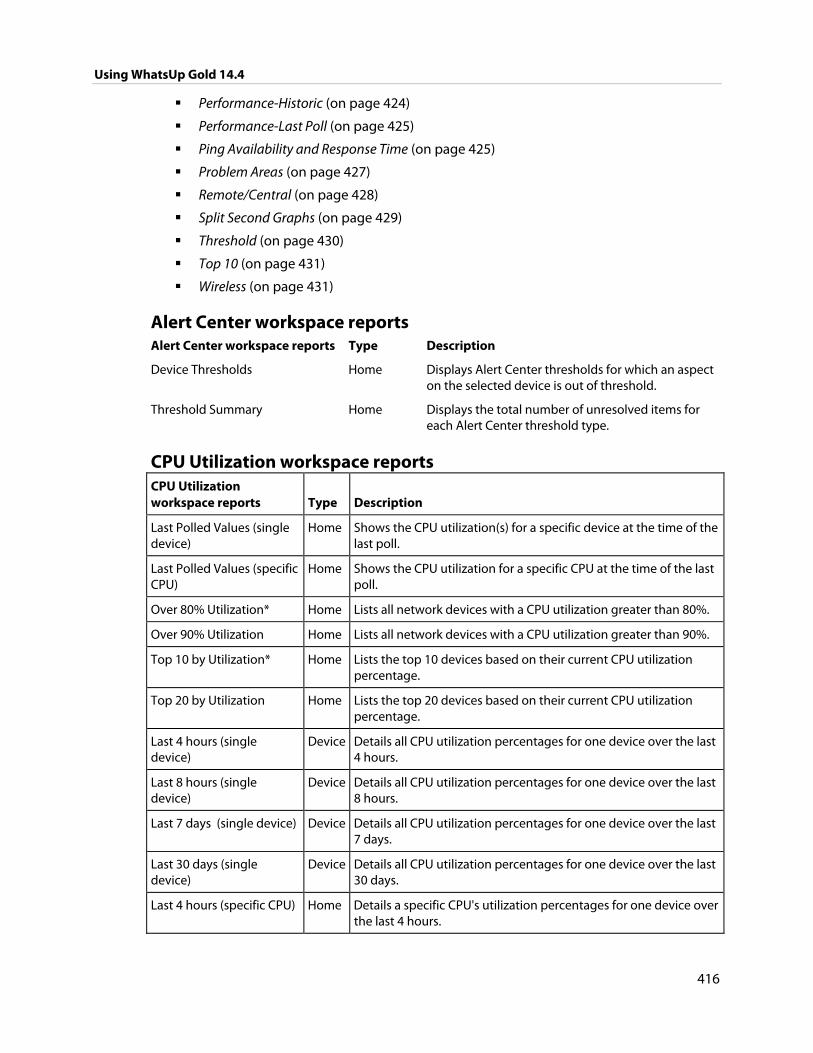
Using WhatsUp Gold 14.4
416
Performance-Historic (on page 424)
Performance-Last Poll (on page 425)
Ping Availability and Response Time (on page 425)
Problem Areas (on page 427)
Remote/Central (on page 428)
Split Second Graphs (on page 429)
Threshold (on page 430)
Top 10 (on page 431)
Wireless (on page 431)
Alert Center workspace reports Alert Center workspace reports Type Description
Device Thresholds Home Displays Alert Center thresholds for which an aspect on the selected device is out of threshold.
Threshold Summary Home Displays the total number of unresolved items for each Alert Center threshold type.
CPU Utilization workspace reports CPU Utilization workspace reports Type Description
Last Polled Values (single device)
Home Shows the CPU utilization(s) for a specific device at the time of the last poll.
Last Polled Values (specific CPU)
Home Shows the CPU utilization for a specific CPU at the time of the last poll.
Over 80% Utilization* Home Lists all network devices with a CPU utilization greater than 80%.
Over 90% Utilization Home Lists all network devices with a CPU utilization greater than 90%.
Top 10 by Utilization* Home Lists the top 10 devices based on their current CPU utilization percentage.
Top 20 by Utilization Home Lists the top 20 devices based on their current CPU utilization percentage.
Last 4 hours (single device)
Device Details all CPU utilization percentages for one device over the last 4 hours.
Last 8 hours (single device)
Device Details all CPU utilization percentages for one device over the last 8 hours.
Last 7 days (single device) Device Details all CPU utilization percentages for one device over the last 7 days.
Last 30 days (single device)
Device Details all CPU utilization percentages for one device over the last 30 days.
Last 4 hours (specific CPU) Home Details a specific CPU's utilization percentages for one device over the last 4 hours.
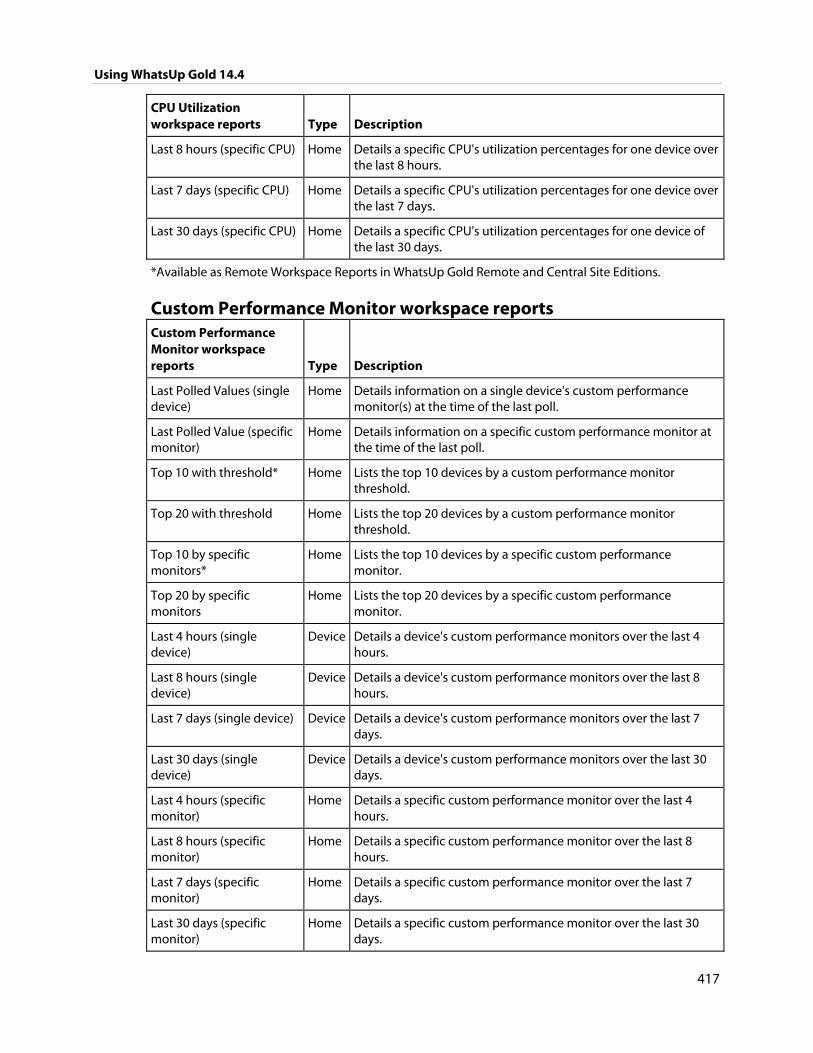
Using WhatsUp Gold 14.4
417
CPU Utilization workspace reports Type Description
Last 8 hours (specific CPU) Home Details a specific CPU's utilization percentages for one device over the last 8 hours.
Last 7 days (specific CPU) Home Details a specific CPU's utilization percentages for one device over the last 7 days.
Last 30 days (specific CPU) Home Details a specific CPU's utilization percentages for one device of the last 30 days.
*Available as Remote Workspace Reports in WhatsUp Gold Remote and Central Site Editions.
Custom Performance Monitor workspace reports Custom Performance Monitor workspace reports Type Description
Last Polled Values (single device)
Home Details information on a single device's custom performance monitor(s) at the time of the last poll.
Last Polled Value (specific monitor)
Home Details information on a specific custom performance monitor at the time of the last poll.
Top 10 with threshold* Home Lists the top 10 devices by a custom performance monitor threshold.
Top 20 with threshold Home Lists the top 20 devices by a custom performance monitor threshold.
Top 10 by specific monitors*
Home Lists the top 10 devices by a specific custom performance monitor.
Top 20 by specific monitors
Home Lists the top 20 devices by a specific custom performance monitor.
Last 4 hours (single device)
Device Details a device's custom performance monitors over the last 4 hours.
Last 8 hours (single device)
Device Details a device's custom performance monitors over the last 8 hours.
Last 7 days (single device) Device Details a device's custom performance monitors over the last 7 days.
Last 30 days (single device)
Device Details a device's custom performance monitors over the last 30 days.
Last 4 hours (specific monitor)
Home Details a specific custom performance monitor over the last 4 hours.
Last 8 hours (specific monitor)
Home Details a specific custom performance monitor over the last 8 hours.
Last 7 days (specific monitor)
Home Details a specific custom performance monitor over the last 7 days.
Last 30 days (specific monitor)
Home Details a specific custom performance monitor over the last 30 days.
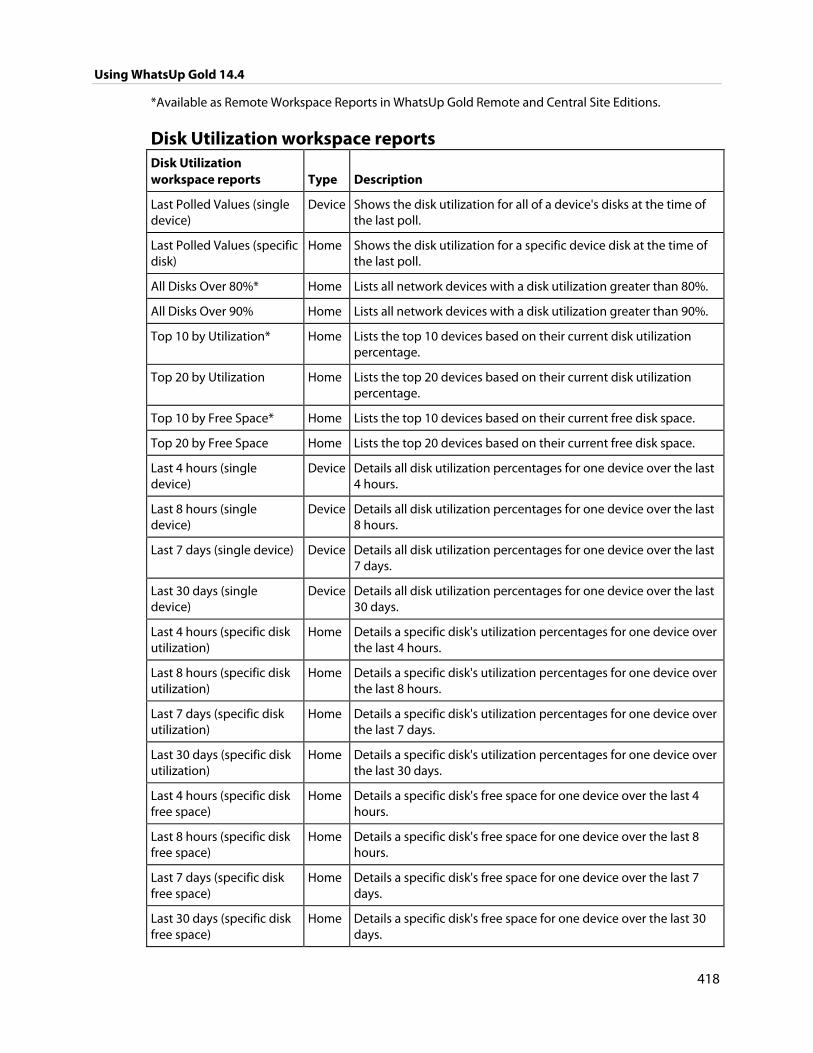
Using WhatsUp Gold 14.4
418
*Available as Remote Workspace Reports in WhatsUp Gold Remote and Central Site Editions.
Disk Utilization workspace reports Disk Utilization workspace reports Type Description
Last Polled Values (single device)
Device Shows the disk utilization for all of a device's disks at the time of the last poll.
Last Polled Values (specific disk)
Home Shows the disk utilization for a specific device disk at the time of the last poll.
All Disks Over 80%* Home Lists all network devices with a disk utilization greater than 80%.
All Disks Over 90% Home Lists all network devices with a disk utilization greater than 90%.
Top 10 by Utilization* Home Lists the top 10 devices based on their current disk utilization percentage.
Top 20 by Utilization Home Lists the top 20 devices based on their current disk utilization percentage.
Top 10 by Free Space* Home Lists the top 10 devices based on their current free disk space.
Top 20 by Free Space Home Lists the top 20 devices based on their current free disk space.
Last 4 hours (single device)
Device Details all disk utilization percentages for one device over the last 4 hours.
Last 8 hours (single device)
Device Details all disk utilization percentages for one device over the last 8 hours.
Last 7 days (single device) Device Details all disk utilization percentages for one device over the last 7 days.
Last 30 days (single device)
Device Details all disk utilization percentages for one device over the last 30 days.
Last 4 hours (specific disk utilization)
Home Details a specific disk's utilization percentages for one device over the last 4 hours.
Last 8 hours (specific disk utilization)
Home Details a specific disk's utilization percentages for one device over the last 8 hours.
Last 7 days (specific disk utilization)
Home Details a specific disk's utilization percentages for one device over the last 7 days.
Last 30 days (specific disk utilization)
Home Details a specific disk's utilization percentages for one device over the last 30 days.
Last 4 hours (specific disk free space)
Home Details a specific disk's free space for one device over the last 4 hours.
Last 8 hours (specific disk free space)
Home Details a specific disk's free space for one device over the last 8 hours.
Last 7 days (specific disk free space)
Home Details a specific disk's free space for one device over the last 7 days.
Last 30 days (specific disk free space)
Home Details a specific disk's free space for one device over the last 30 days.
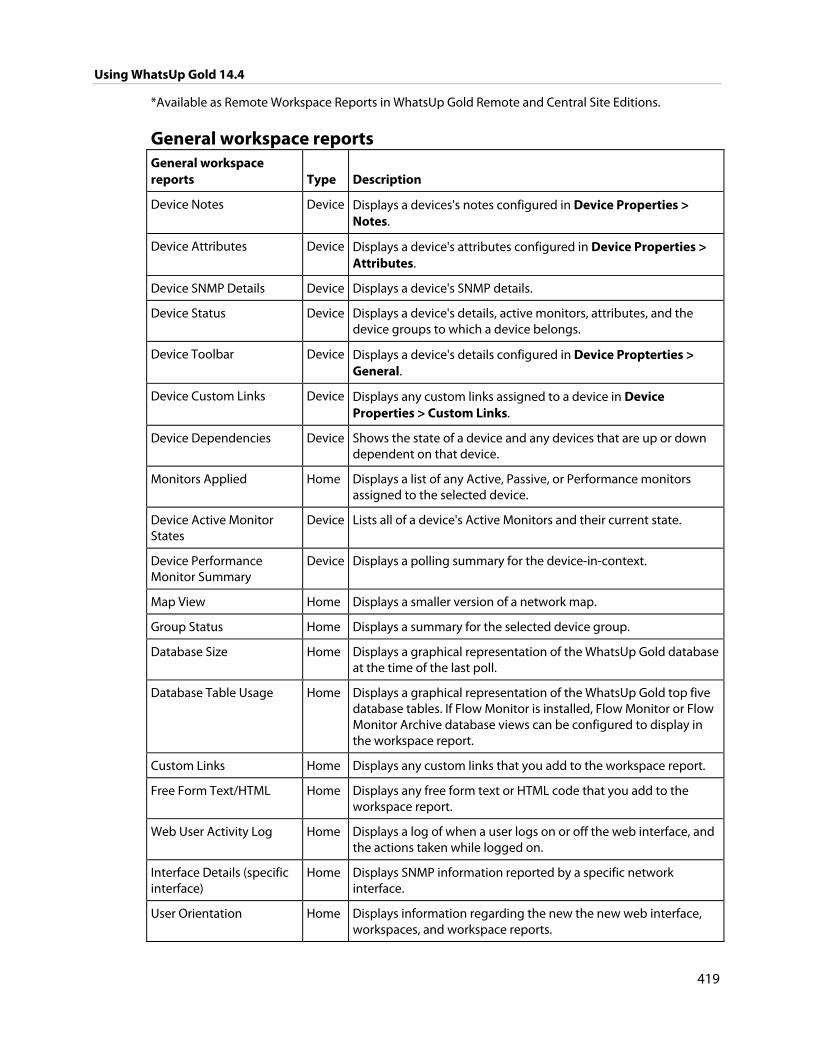
Using WhatsUp Gold 14.4
419
*Available as Remote Workspace Reports in WhatsUp Gold Remote and Central Site Editions.
General workspace reports General workspace reports Type Description
Device Notes Device Displays a devices's notes configured in Device Properties > Notes.
Device Attributes Device Displays a device's attributes configured in Device Properties > Attributes.
Device SNMP Details Device Displays a device's SNMP details.
Device Status Device Displays a device's details, active monitors, attributes, and the device groups to which a device belongs.
Device Toolbar Device Displays a device's details configured in Device Propterties > General.
Device Custom Links Device Displays any custom links assigned to a device in Device Properties > Custom Links.
Device Dependencies Device Shows the state of a device and any devices that are up or down dependent on that device.
Monitors Applied Home Displays a list of any Active, Passive, or Performance monitors assigned to the selected device.
Device Active Monitor States
Device Lists all of a device's Active Monitors and their current state.
Device Performance Monitor Summary
Device Displays a polling summary for the device-in-context.
Map View Home Displays a smaller version of a network map.
Group Status Home Displays a summary for the selected device group.
Database Size Home Displays a graphical representation of the WhatsUp Gold database at the time of the last poll.
Database Table Usage Home Displays a graphical representation of the WhatsUp Gold top five database tables. If Flow Monitor is installed, Flow Monitor or Flow Monitor Archive database views can be configured to display in the workspace report.
Custom Links Home Displays any custom links that you add to the workspace report.
Free Form Text/HTML Home Displays any free form text or HTML code that you add to the workspace report.
Web User Activity Log Home Displays a log of when a user logs on or off the web interface, and the actions taken while logged on.
Interface Details (specific interface)
Home Displays SNMP information reported by a specific network interface.
User Orientation Home Displays information regarding the new the new web interface, workspaces, and workspace reports.
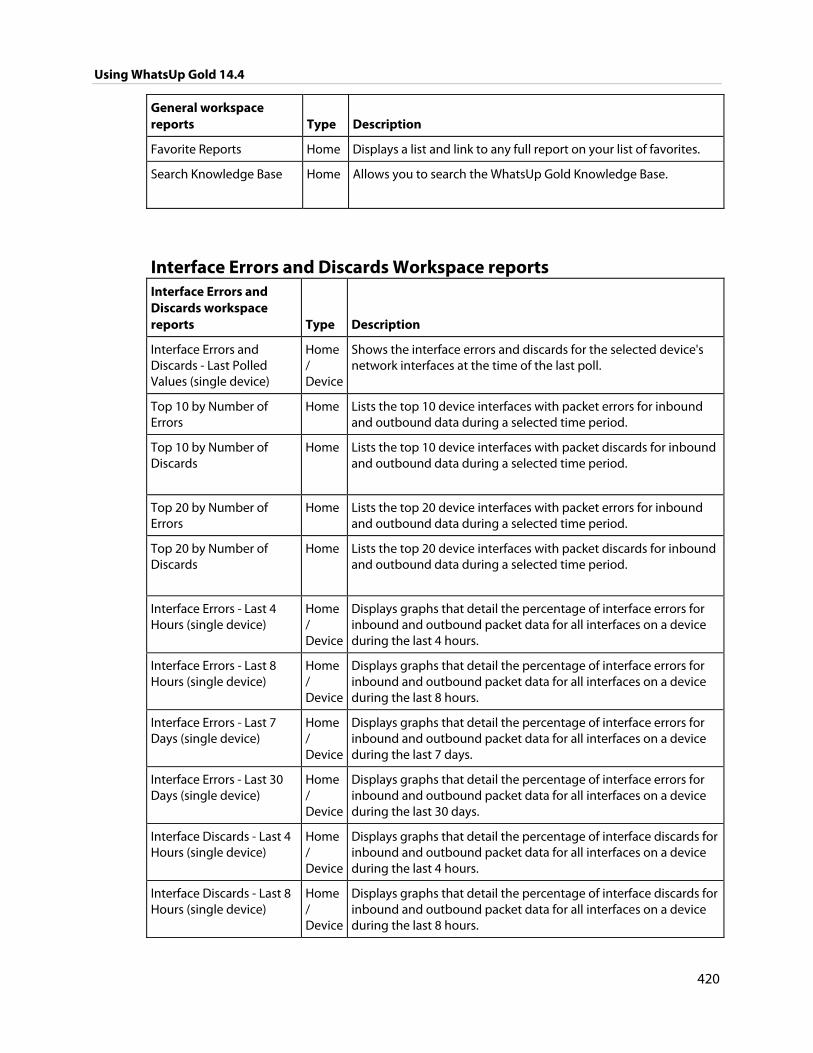
Using WhatsUp Gold 14.4
420
General workspace reports Type Description
Favorite Reports Home Displays a list and link to any full report on your list of favorites.
Search Knowledge Base Home Allows you to search the WhatsUp Gold Knowledge Base.
Interface Errors and Discards Workspace reports Interface Errors and Discards workspace reports Type Description
Interface Errors and Discards - Last Polled Values (single device)
Home / Device
Shows the interface errors and discards for the selected device's network interfaces at the time of the last poll.
Top 10 by Number of Errors
Home Lists the top 10 device interfaces with packet errors for inbound and outbound data during a selected time period.
Top 10 by Number of Discards
Home Lists the top 10 device interfaces with packet discards for inbound and outbound data during a selected time period.
Top 20 by Number of Errors
Home Lists the top 20 device interfaces with packet errors for inbound and outbound data during a selected time period.
Top 20 by Number of Discards
Home Lists the top 20 device interfaces with packet discards for inbound and outbound data during a selected time period.
Interface Errors - Last 4 Hours (single device)
Home / Device
Displays graphs that detail the percentage of interface errors for inbound and outbound packet data for all interfaces on a device during the last 4 hours.
Interface Errors - Last 8 Hours (single device)
Home / Device
Displays graphs that detail the percentage of interface errors for inbound and outbound packet data for all interfaces on a device during the last 8 hours.
Interface Errors - Last 7 Days (single device)
Home / Device
Displays graphs that detail the percentage of interface errors for inbound and outbound packet data for all interfaces on a device during the last 7 days.
Interface Errors - Last 30 Days (single device)
Home / Device
Displays graphs that detail the percentage of interface errors for inbound and outbound packet data for all interfaces on a device during the last 30 days.
Interface Discards - Last 4 Hours (single device)
Home / Device
Displays graphs that detail the percentage of interface discards for inbound and outbound packet data for all interfaces on a device during the last 4 hours.
Interface Discards - Last 8 Hours (single device)
Home / Device
Displays graphs that detail the percentage of interface discards for inbound and outbound packet data for all interfaces on a device during the last 8 hours.
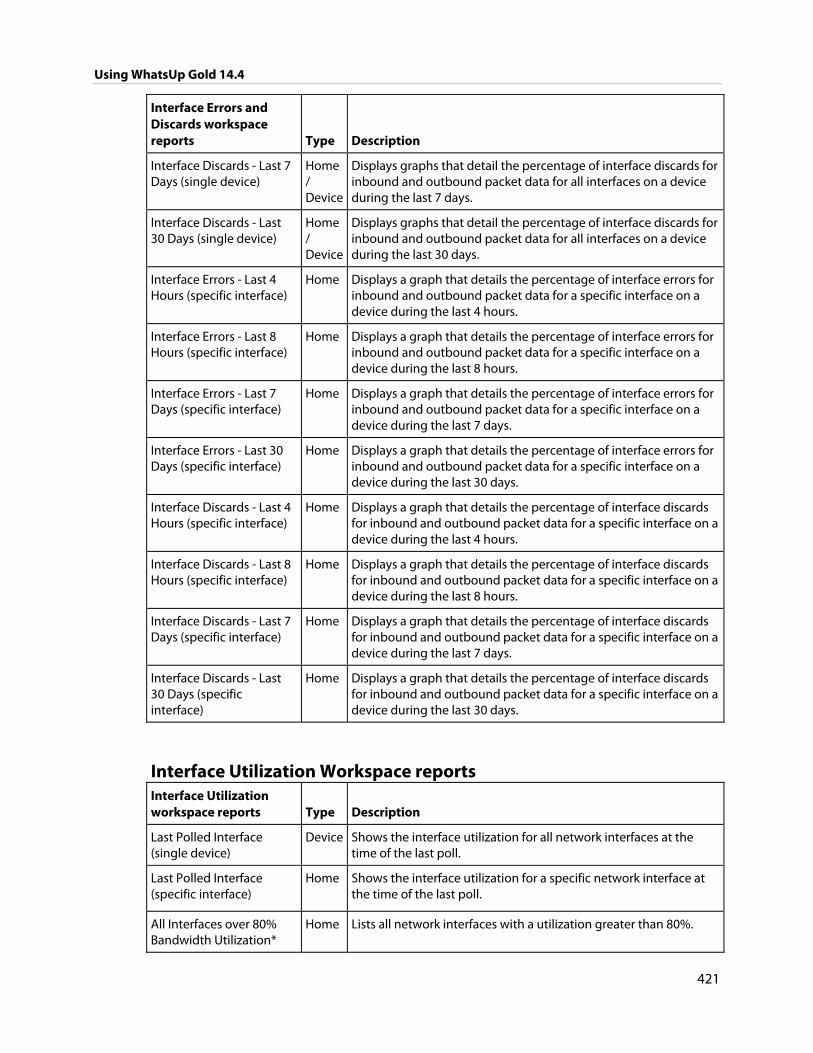
Using WhatsUp Gold 14.4
421
Interface Errors and Discards workspace reports Type Description
Interface Discards - Last 7 Days (single device)
Home / Device
Displays graphs that detail the percentage of interface discards for inbound and outbound packet data for all interfaces on a device during the last 7 days.
Interface Discards - Last 30 Days (single device)
Home / Device
Displays graphs that detail the percentage of interface discards for inbound and outbound packet data for all interfaces on a device during the last 30 days.
Interface Errors - Last 4 Hours (specific interface)
Home Displays a graph that details the percentage of interface errors for inbound and outbound packet data for a specific interface on a device during the last 4 hours.
Interface Errors - Last 8 Hours (specific interface)
Home Displays a graph that details the percentage of interface errors for inbound and outbound packet data for a specific interface on a device during the last 8 hours.
Interface Errors - Last 7 Days (specific interface)
Home Displays a graph that details the percentage of interface errors for inbound and outbound packet data for a specific interface on a device during the last 7 days.
Interface Errors - Last 30 Days (specific interface)
Home Displays a graph that details the percentage of interface errors for inbound and outbound packet data for a specific interface on a device during the last 30 days.
Interface Discards - Last 4 Hours (specific interface)
Home Displays a graph that details the percentage of interface discards for inbound and outbound packet data for a specific interface on a device during the last 4 hours.
Interface Discards - Last 8 Hours (specific interface)
Home Displays a graph that details the percentage of interface discards for inbound and outbound packet data for a specific interface on a device during the last 8 hours.
Interface Discards - Last 7 Days (specific interface)
Home Displays a graph that details the percentage of interface discards for inbound and outbound packet data for a specific interface on a device during the last 7 days.
Interface Discards - Last 30 Days (specific interface)
Home Displays a graph that details the percentage of interface discards for inbound and outbound packet data for a specific interface on a device during the last 30 days.
Interface Utilization Workspace reports Interface Utilization workspace reports Type Description
Last Polled Interface (single device)
Device Shows the interface utilization for all network interfaces at the time of the last poll.
Last Polled Interface (specific interface)
Home Shows the interface utilization for a specific network interface at the time of the last poll.
All Interfaces over 80% Bandwidth Utilization*
Home Lists all network interfaces with a utilization greater than 80%.
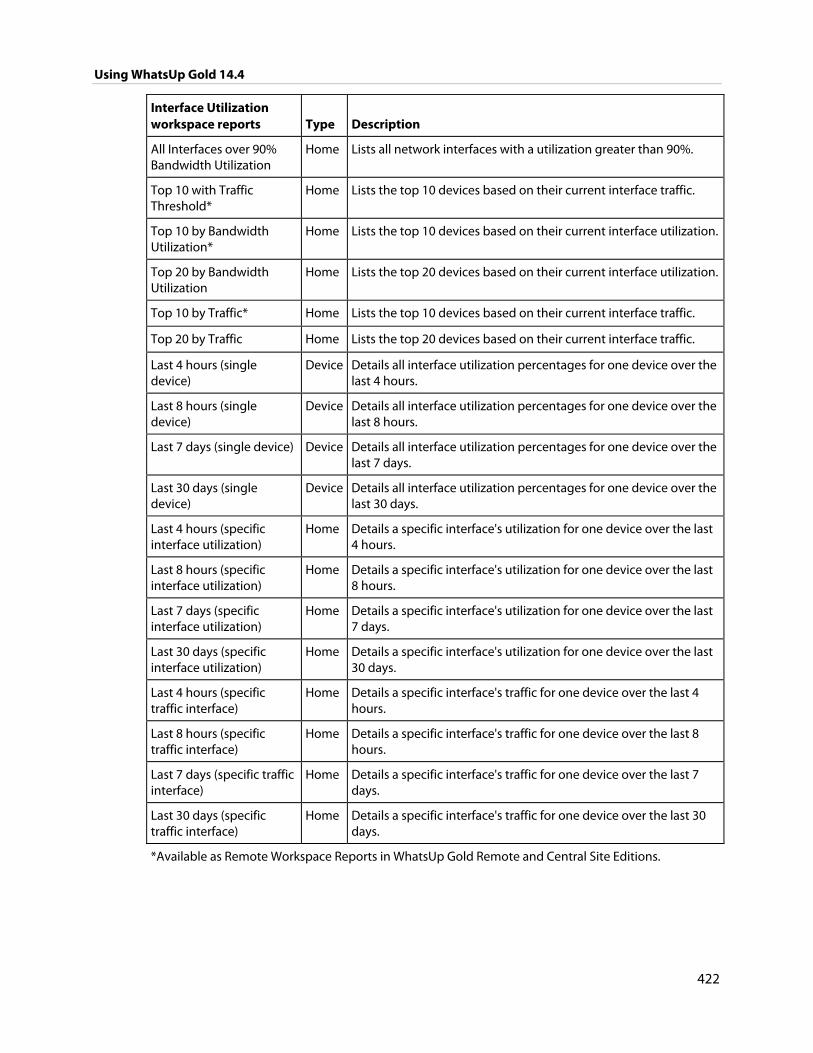
Using WhatsUp Gold 14.4
422
Interface Utilization workspace reports Type Description
All Interfaces over 90% Bandwidth Utilization
Home Lists all network interfaces with a utilization greater than 90%.
Top 10 with Traffic Threshold*
Home Lists the top 10 devices based on their current interface traffic.
Top 10 by Bandwidth Utilization*
Home Lists the top 10 devices based on their current interface utilization.
Top 20 by Bandwidth Utilization
Home Lists the top 20 devices based on their current interface utilization.
Top 10 by Traffic* Home Lists the top 10 devices based on their current interface traffic.
Top 20 by Traffic Home Lists the top 20 devices based on their current interface traffic.
Last 4 hours (single device)
Device Details all interface utilization percentages for one device over the last 4 hours.
Last 8 hours (single device)
Device Details all interface utilization percentages for one device over the last 8 hours.
Last 7 days (single device) Device Details all interface utilization percentages for one device over the last 7 days.
Last 30 days (single device)
Device Details all interface utilization percentages for one device over the last 30 days.
Last 4 hours (specific interface utilization)
Home Details a specific interface's utilization for one device over the last 4 hours.
Last 8 hours (specific interface utilization)
Home Details a specific interface's utilization for one device over the last 8 hours.
Last 7 days (specific interface utilization)
Home Details a specific interface's utilization for one device over the last 7 days.
Last 30 days (specific interface utilization)
Home Details a specific interface's utilization for one device over the last 30 days.
Last 4 hours (specific traffic interface)
Home Details a specific interface's traffic for one device over the last 4 hours.
Last 8 hours (specific traffic interface)
Home Details a specific interface's traffic for one device over the last 8 hours.
Last 7 days (specific traffic interface)
Home Details a specific interface's traffic for one device over the last 7 days.
Last 30 days (specific traffic interface)
Home Details a specific interface's traffic for one device over the last 30 days.
*Available as Remote Workspace Reports in WhatsUp Gold Remote and Central Site Editions.
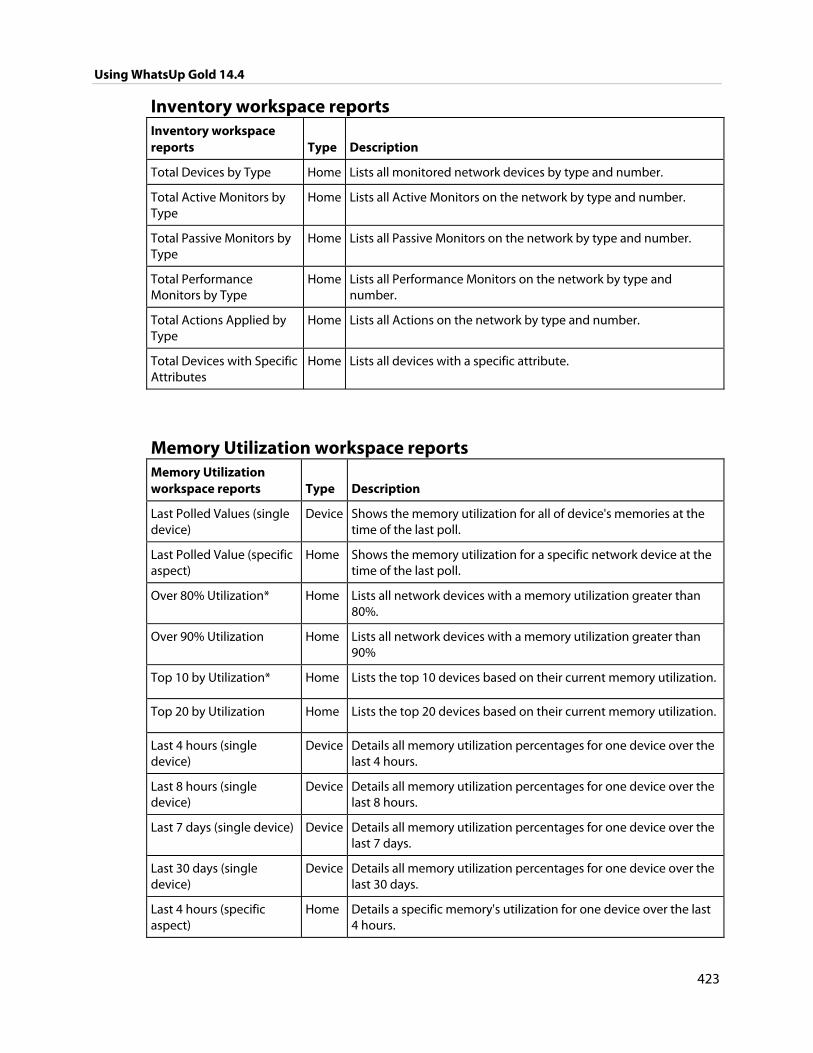
Using WhatsUp Gold 14.4
423
Inventory workspace reports Inventory workspace reports Type Description
Total Devices by Type Home Lists all monitored network devices by type and number.
Total Active Monitors by Type
Home Lists all Active Monitors on the network by type and number.
Total Passive Monitors by Type
Home Lists all Passive Monitors on the network by type and number.
Total Performance Monitors by Type
Home Lists all Performance Monitors on the network by type and number.
Total Actions Applied by Type
Home Lists all Actions on the network by type and number.
Total Devices with Specific Attributes
Home Lists all devices with a specific attribute.
Memory Utilization workspace reports Memory Utilization workspace reports Type Description
Last Polled Values (single device)
Device Shows the memory utilization for all of device's memories at the time of the last poll.
Last Polled Value (specific aspect)
Home Shows the memory utilization for a specific network device at the time of the last poll.
Over 80% Utilization* Home Lists all network devices with a memory utilization greater than 80%.
Over 90% Utilization Home Lists all network devices with a memory utilization greater than 90%
Top 10 by Utilization* Home Lists the top 10 devices based on their current memory utilization.
Top 20 by Utilization Home Lists the top 20 devices based on their current memory utilization.
Last 4 hours (single device)
Device Details all memory utilization percentages for one device over the last 4 hours.
Last 8 hours (single device)
Device Details all memory utilization percentages for one device over the last 8 hours.
Last 7 days (single device) Device Details all memory utilization percentages for one device over the last 7 days.
Last 30 days (single device)
Device Details all memory utilization percentages for one device over the last 30 days.
Last 4 hours (specific aspect)
Home Details a specific memory's utilization for one device over the last 4 hours.
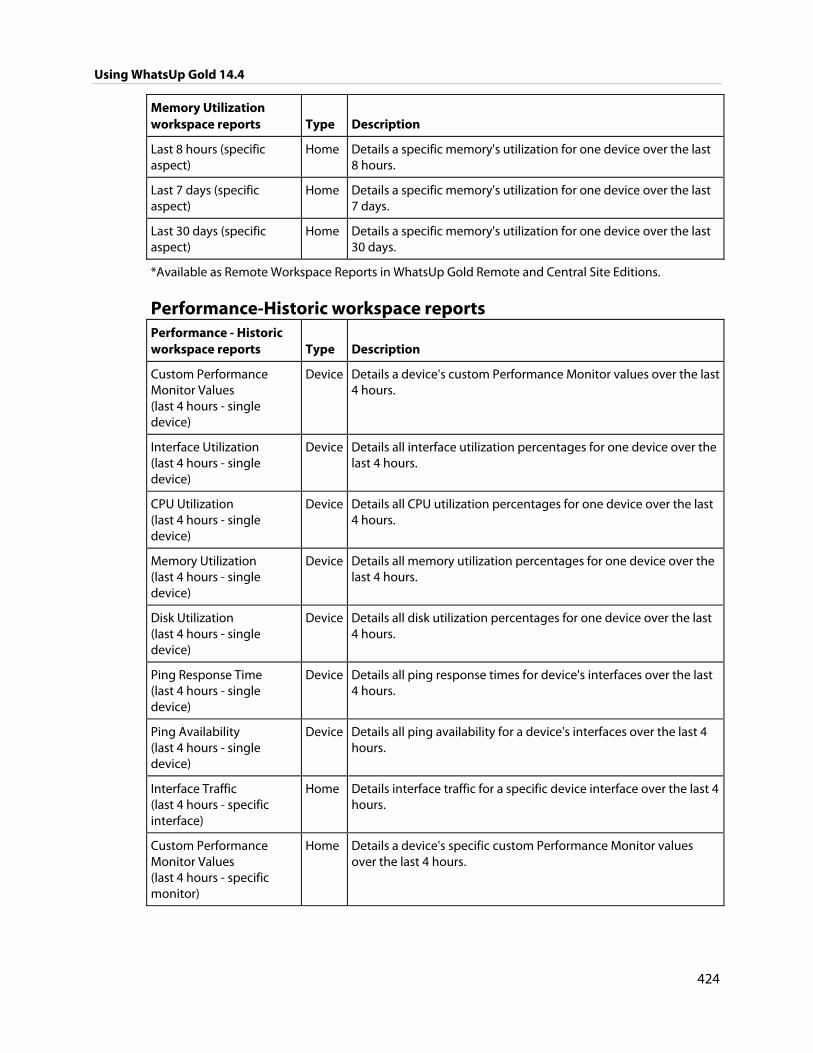
Using WhatsUp Gold 14.4
424
Memory Utilization workspace reports Type Description
Last 8 hours (specific aspect)
Home Details a specific memory's utilization for one device over the last 8 hours.
Last 7 days (specific aspect)
Home Details a specific memory's utilization for one device over the last 7 days.
Last 30 days (specific aspect)
Home Details a specific memory's utilization for one device over the last 30 days.
*Available as Remote Workspace Reports in WhatsUp Gold Remote and Central Site Editions.
Performance-Historic workspace reports Performance - Historic workspace reports Type Description
Custom Performance Monitor Values (last 4 hours - single device)
Device Details a device's custom Performance Monitor values over the last 4 hours.
Interface Utilization (last 4 hours - single device)
Device Details all interface utilization percentages for one device over the last 4 hours.
CPU Utilization (last 4 hours - single device)
Device Details all CPU utilization percentages for one device over the last 4 hours.
Memory Utilization (last 4 hours - single device)
Device Details all memory utilization percentages for one device over the last 4 hours.
Disk Utilization (last 4 hours - single device)
Device Details all disk utilization percentages for one device over the last 4 hours.
Ping Response Time (last 4 hours - single device)
Device Details all ping response times for device's interfaces over the last 4 hours.
Ping Availability (last 4 hours - single device)
Device Details all ping availability for a device's interfaces over the last 4 hours.
Interface Traffic (last 4 hours - specific interface)
Home Details interface traffic for a specific device interface over the last 4 hours.
Custom Performance Monitor Values (last 4 hours - specific monitor)
Home Details a device's specific custom Performance Monitor values over the last 4 hours.
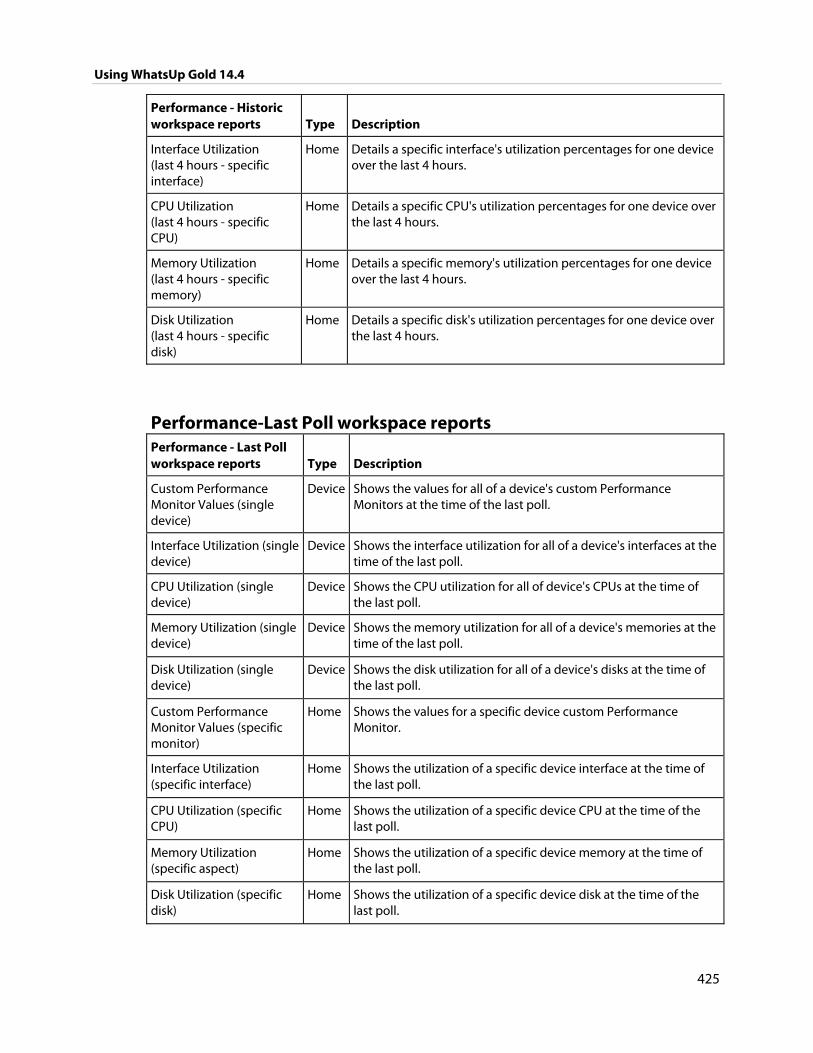
Using WhatsUp Gold 14.4
425
Performance - Historic workspace reports Type Description
Interface Utilization (last 4 hours - specific interface)
Home Details a specific interface's utilization percentages for one device over the last 4 hours.
CPU Utilization (last 4 hours - specific CPU)
Home Details a specific CPU's utilization percentages for one device over the last 4 hours.
Memory Utilization (last 4 hours - specific memory)
Home Details a specific memory's utilization percentages for one device over the last 4 hours.
Disk Utilization (last 4 hours - specific disk)
Home Details a specific disk's utilization percentages for one device over the last 4 hours.
Performance-Last Poll workspace reports Performance - Last Poll workspace reports Type Description
Custom Performance Monitor Values (single device)
Device Shows the values for all of a device's custom Performance Monitors at the time of the last poll.
Interface Utilization (single device)
Device Shows the interface utilization for all of a device's interfaces at the time of the last poll.
CPU Utilization (single device)
Device Shows the CPU utilization for all of device's CPUs at the time of the last poll.
Memory Utilization (single device)
Device Shows the memory utilization for all of a device's memories at the time of the last poll.
Disk Utilization (single device)
Device Shows the disk utilization for all of a device's disks at the time of the last poll.
Custom Performance Monitor Values (specific monitor)
Home Shows the values for a specific device custom Performance Monitor.
Interface Utilization (specific interface)
Home Shows the utilization of a specific device interface at the time of the last poll.
CPU Utilization (specific CPU)
Home Shows the utilization of a specific device CPU at the time of the last poll.
Memory Utilization (specific aspect)
Home Shows the utilization of a specific device memory at the time of the last poll.
Disk Utilization (specific disk)
Home Shows the utilization of a specific device disk at the time of the last poll.
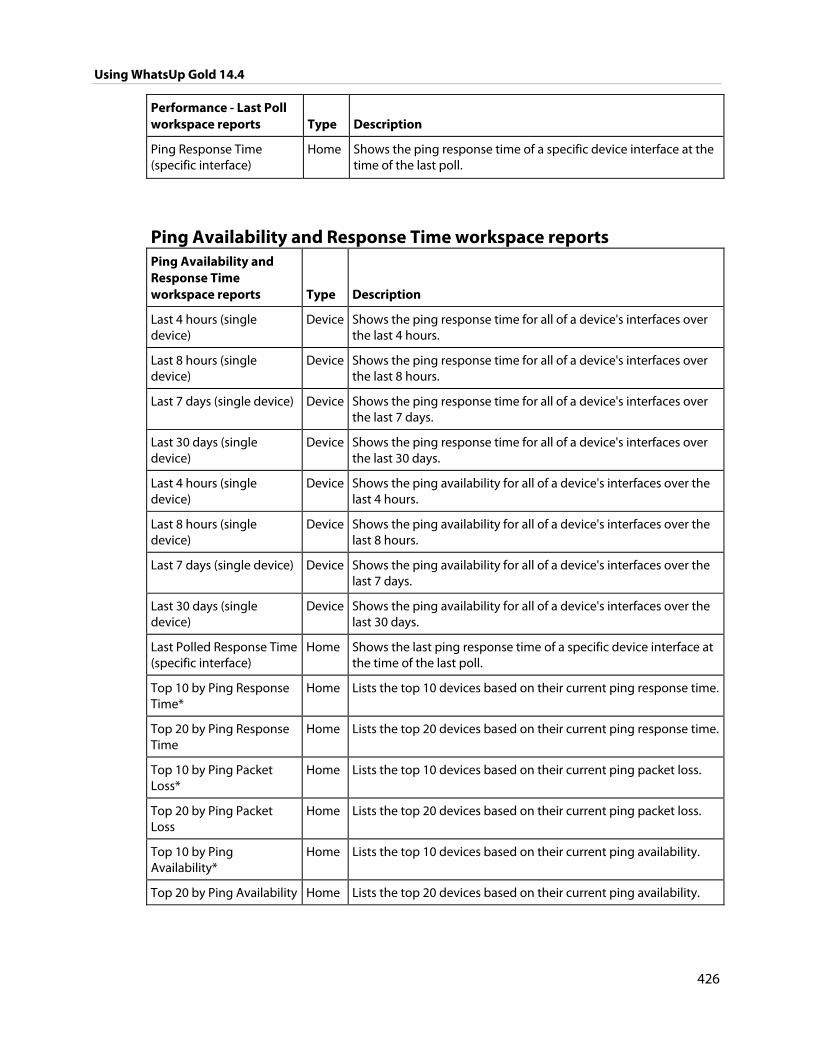
Using WhatsUp Gold 14.4
426
Performance - Last Poll workspace reports Type Description
Ping Response Time (specific interface)
Home Shows the ping response time of a specific device interface at the time of the last poll.
Ping Availability and Response Time workspace reports Ping Availability and Response Time workspace reports Type Description
Last 4 hours (single device)
Device Shows the ping response time for all of a device's interfaces over the last 4 hours.
Last 8 hours (single device)
Device Shows the ping response time for all of a device's interfaces over the last 8 hours.
Last 7 days (single device) Device Shows the ping response time for all of a device's interfaces over the last 7 days.
Last 30 days (single device)
Device Shows the ping response time for all of a device's interfaces over the last 30 days.
Last 4 hours (single device)
Device Shows the ping availability for all of a device's interfaces over the last 4 hours.
Last 8 hours (single device)
Device Shows the ping availability for all of a device's interfaces over the last 8 hours.
Last 7 days (single device) Device Shows the ping availability for all of a device's interfaces over the last 7 days.
Last 30 days (single device)
Device Shows the ping availability for all of a device's interfaces over the last 30 days.
Last Polled Response Time (specific interface)
Home Shows the last ping response time of a specific device interface at the time of the last poll.
Top 10 by Ping Response Time*
Home Lists the top 10 devices based on their current ping response time.
Top 20 by Ping Response Time
Home Lists the top 20 devices based on their current ping response time.
Top 10 by Ping Packet Loss*
Home Lists the top 10 devices based on their current ping packet loss.
Top 20 by Ping Packet Loss
Home Lists the top 20 devices based on their current ping packet loss.
Top 10 by Ping Availability*
Home Lists the top 10 devices based on their current ping availability.
Top 20 by Ping Availability Home Lists the top 20 devices based on their current ping availability.
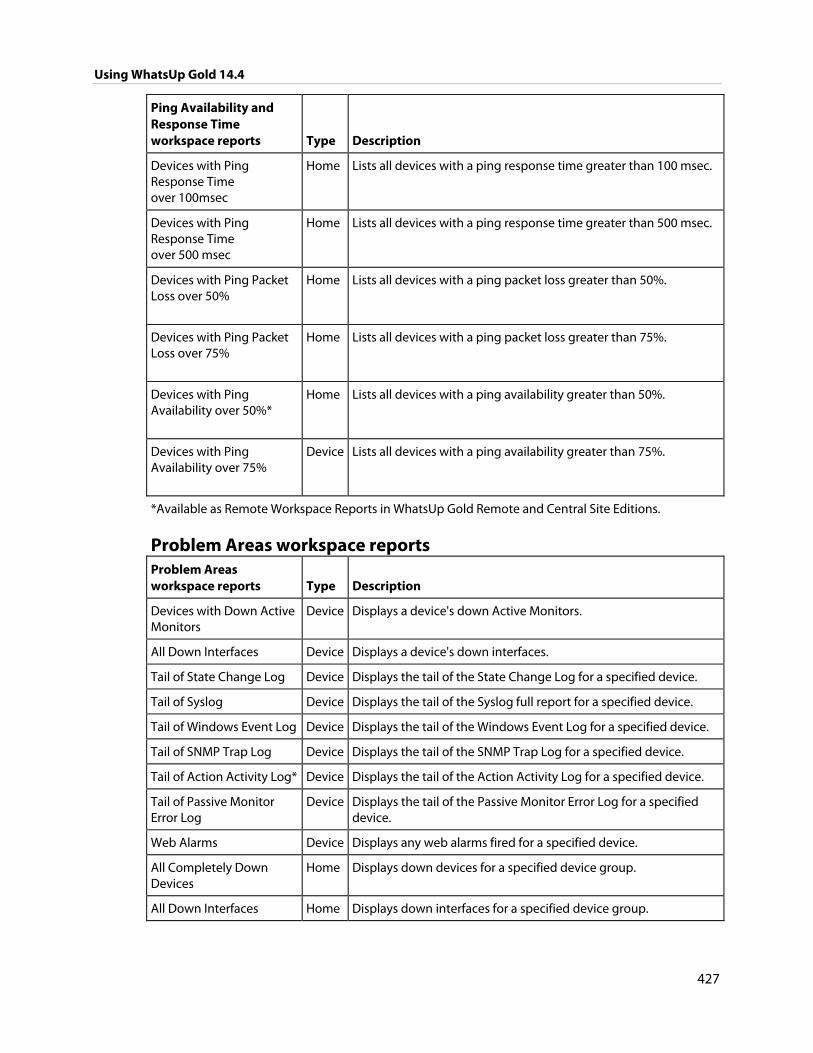
Using WhatsUp Gold 14.4
427
Ping Availability and Response Time workspace reports Type Description
Devices with Ping Response Time over 100msec
Home Lists all devices with a ping response time greater than 100 msec.
Devices with Ping Response Time over 500 msec
Home Lists all devices with a ping response time greater than 500 msec.
Devices with Ping Packet Loss over 50%
Home Lists all devices with a ping packet loss greater than 50%.
Devices with Ping Packet Loss over 75%
Home Lists all devices with a ping packet loss greater than 75%.
Devices with Ping Availability over 50%*
Home Lists all devices with a ping availability greater than 50%.
Devices with Ping Availability over 75%
Device Lists all devices with a ping availability greater than 75%.
*Available as Remote Workspace Reports in WhatsUp Gold Remote and Central Site Editions.
Problem Areas workspace reports Problem Areas workspace reports Type Description
Devices with Down Active Monitors
Device Displays a device's down Active Monitors.
All Down Interfaces Device Displays a device's down interfaces.
Tail of State Change Log Device Displays the tail of the State Change Log for a specified device.
Tail of Syslog Device Displays the tail of the Syslog full report for a specified device.
Tail of Windows Event Log Device Displays the tail of the Windows Event Log for a specified device.
Tail of SNMP Trap Log Device Displays the tail of the SNMP Trap Log for a specified device.
Tail of Action Activity Log* Device Displays the tail of the Action Activity Log for a specified device.
Tail of Passive Monitor Error Log
Device Displays the tail of the Passive Monitor Error Log for a specified device.
Web Alarms Device Displays any web alarms fired for a specified device.
All Completely Down Devices
Home Displays down devices for a specified device group.
All Down Interfaces Home Displays down interfaces for a specified device group.

Using WhatsUp Gold 14.4
428
Problem Areas workspace reports Type Description
Devices with Down Active Monitors
Home Displays devices with down Active Monitors within a specified device group.
Unacknowledged Devices Home Displays unacknowledged devices within a specified device group.
Devices that have fired an Action in the last X hours
Home Displays devices that have fired an action over the selected time period.
Tail of State Change Log Home Displays a tail of the State Change Log for your network.
Summary Counts* Home Displays a summary of a specified device group.
Tail of Syslog Home Displays the tail of the Syslog full report for your network.
Tail of Windows Event Log Home Displays the tail of the Windows Event Log for your network.
Tail of SNMP Trap Log Home Displays the tail of the SNMP Trap Log for your network.
Tail of Action Activity Log* Home Displays the tail of the Action Activity Log for your network.
Tail of Passive Monitor Error Log
Home Displays the tail of the Passive Monitor Error Log for your network.
Map View Home Displays a smaller version of a network map.
Device Group Mini Status Home Lists all devices in a device group and displays their status by color.
Web Alarms Home Shows a snap shot of the most recent web alarms fired on your network.
General Error Log Home Displays the tail of the General Error Log for your network.
*Available as Remote Workspace Reports in WhatsUp Gold Remote and Central Site Editions.
Remote/Central workspace reports Remote/Central workspace reports Type Description
(Only available in distributed editions)
Summary Counts (Remote)
Home Provides a summary for a remote site by the total number of its monitored devices, up devices, down devices, devices with down active monitors, devices in maintenance, active monitors, down active monitors, up interfaces, down interfaces, actions fired in the last four hours.
Active Monitor States (Remote)
Home Displays Active Monitor states for a remote site at the time of the last refresh.
Tail of Action Activity Log (Remote)
Home Provides the tail (last 10 records) of the Action Log for a device group on a remote site.
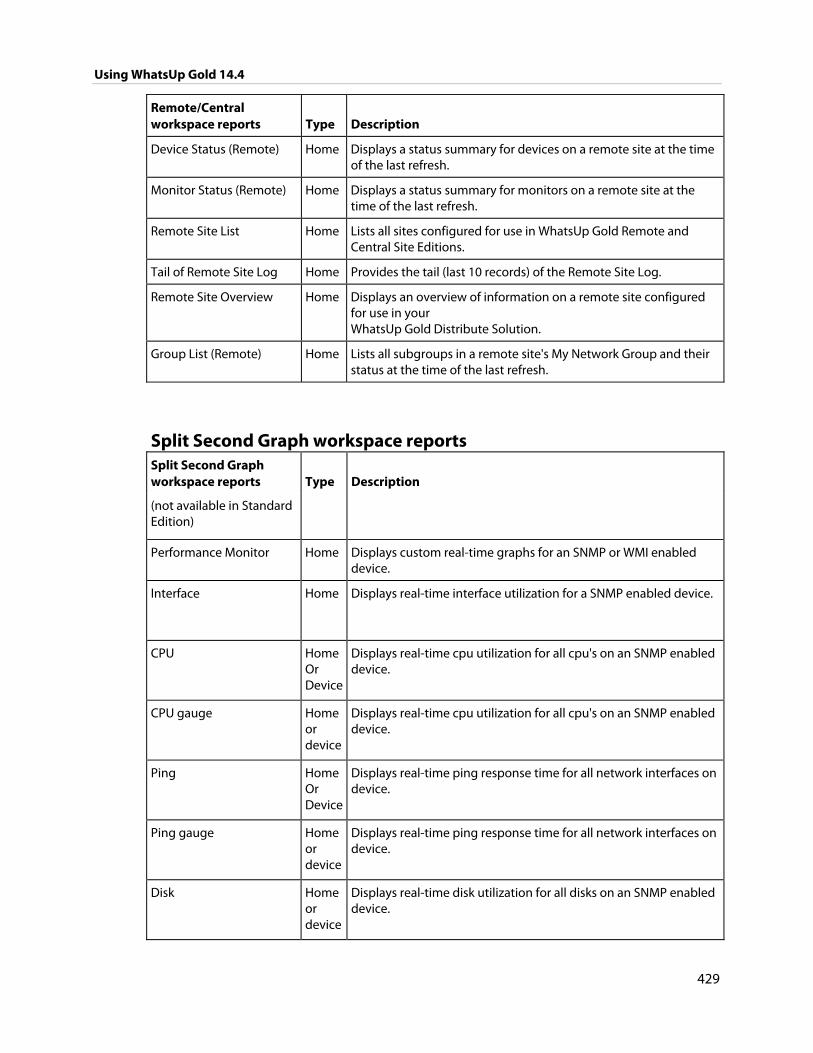
Using WhatsUp Gold 14.4
429
Remote/Central workspace reports Type Description
Device Status (Remote) Home Displays a status summary for devices on a remote site at the time of the last refresh.
Monitor Status (Remote) Home Displays a status summary for monitors on a remote site at the time of the last refresh.
Remote Site List Home Lists all sites configured for use in WhatsUp Gold Remote and Central Site Editions.
Tail of Remote Site Log Home Provides the tail (last 10 records) of the Remote Site Log.
Remote Site Overview Home Displays an overview of information on a remote site configured for use in your WhatsUp Gold Distribute Solution.
Group List (Remote) Home Lists all subgroups in a remote site's My Network Group and their status at the time of the last refresh.
Split Second Graph workspace reports Split Second Graph workspace reports Type Description
(not available in Standard Edition)
Performance Monitor Home Displays custom real-time graphs for an SNMP or WMI enabled device.
Interface Home Displays real-time interface utilization for a SNMP enabled device.
CPU Home Or Device
Displays real-time cpu utilization for all cpu's on an SNMP enabled device.
CPU gauge Home or device
Displays real-time cpu utilization for all cpu's on an SNMP enabled device.
Ping Home Or Device
Displays real-time ping response time for all network interfaces on device.
Ping gauge Home or device
Displays real-time ping response time for all network interfaces on device.
Disk Home or device
Displays real-time disk utilization for all disks on an SNMP enabled device.
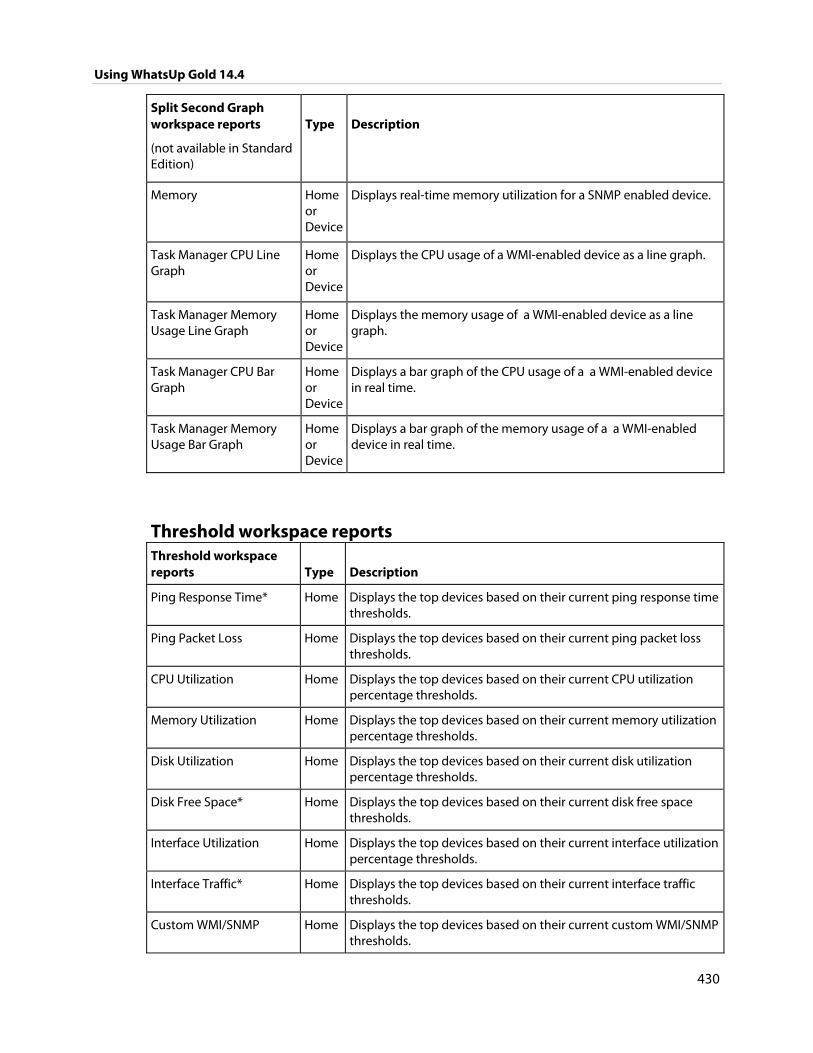
Using WhatsUp Gold 14.4
430
Split Second Graph workspace reports Type Description
(not available in Standard Edition)
Memory Home or Device
Displays real-time memory utilization for a SNMP enabled device.
Task Manager CPU Line Graph
Home or Device
Displays the CPU usage of a WMI-enabled device as a line graph.
Task Manager Memory Usage Line Graph
Home or Device
Displays the memory usage of a WMI-enabled device as a line graph.
Task Manager CPU Bar Graph
Home or Device
Displays a bar graph of the CPU usage of a a WMI-enabled device in real time.
Task Manager Memory Usage Bar Graph
Home or Device
Displays a bar graph of the memory usage of a a WMI-enabled device in real time.
Threshold workspace reports Threshold workspace reports Type Description
Ping Response Time* Home Displays the top devices based on their current ping response time thresholds.
Ping Packet Loss Home Displays the top devices based on their current ping packet loss thresholds.
CPU Utilization Home Displays the top devices based on their current CPU utilization percentage thresholds.
Memory Utilization Home Displays the top devices based on their current memory utilization percentage thresholds.
Disk Utilization Home Displays the top devices based on their current disk utilization percentage thresholds.
Disk Free Space* Home Displays the top devices based on their current disk free space thresholds.
Interface Utilization Home Displays the top devices based on their current interface utilization percentage thresholds.
Interface Traffic* Home Displays the top devices based on their current interface traffic thresholds.
Custom WMI/SNMP Home Displays the top devices based on their current custom WMI/SNMP thresholds.
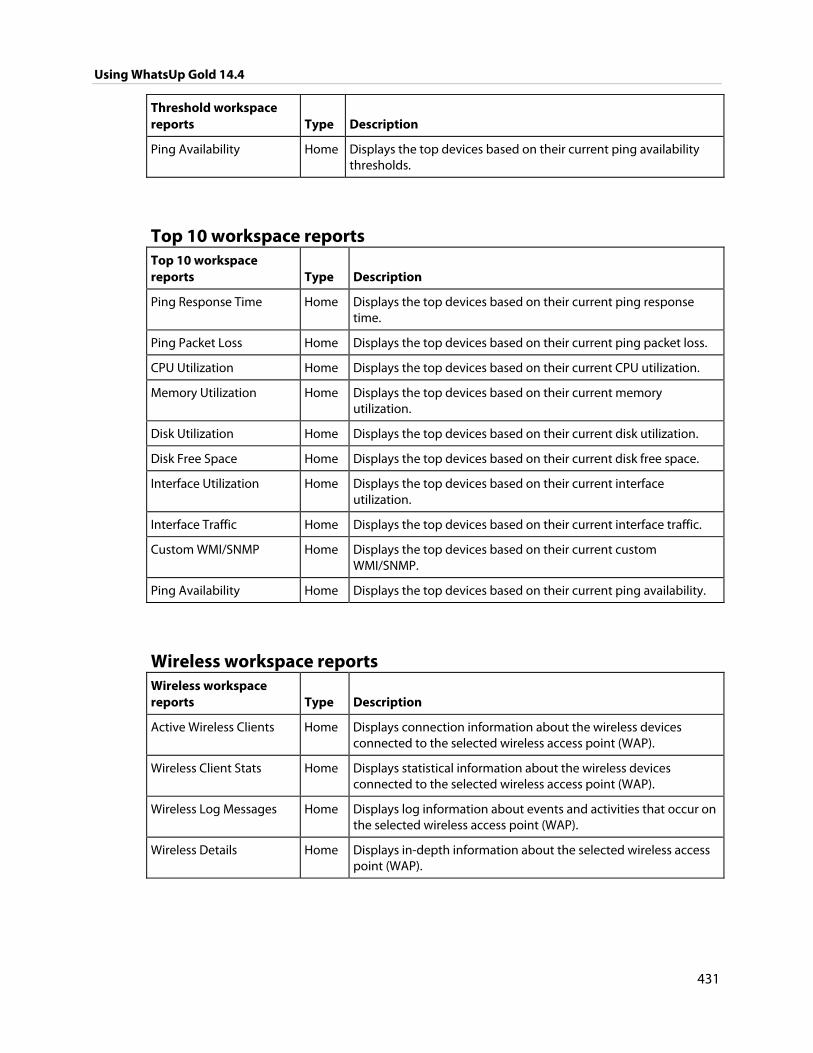
Using WhatsUp Gold 14.4
431
Threshold workspace reports Type Description
Ping Availability Home Displays the top devices based on their current ping availability thresholds.
Top 10 workspace reports Top 10 workspace reports Type Description
Ping Response Time Home Displays the top devices based on their current ping response time.
Ping Packet Loss Home Displays the top devices based on their current ping packet loss.
CPU Utilization Home Displays the top devices based on their current CPU utilization.
Memory Utilization Home Displays the top devices based on their current memory utilization.
Disk Utilization Home Displays the top devices based on their current disk utilization.
Disk Free Space Home Displays the top devices based on their current disk free space.
Interface Utilization Home Displays the top devices based on their current interface utilization.
Interface Traffic Home Displays the top devices based on their current interface traffic.
Custom WMI/SNMP Home Displays the top devices based on their current custom WMI/SNMP.
Ping Availability Home Displays the top devices based on their current ping availability.
Wireless workspace reports Wireless workspace reports Type Description
Active Wireless Clients Home Displays connection information about the wireless devices connected to the selected wireless access point (WAP).
Wireless Client Stats Home Displays statistical information about the wireless devices connected to the selected wireless access point (WAP).
Wireless Log Messages Home Displays log information about events and activities that occur on the selected wireless access point (WAP).
Wireless Details Home Displays in-depth information about the selected wireless access point (WAP).
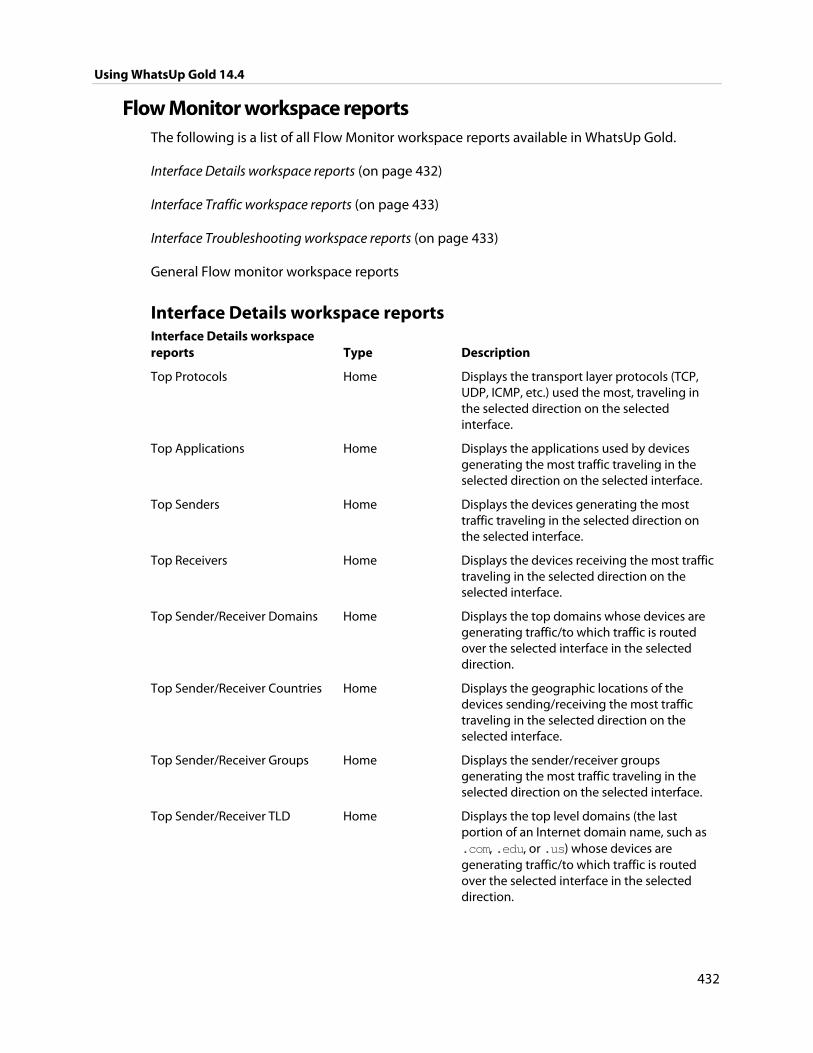
Using WhatsUp Gold 14.4
432
Flow Monitor workspace reports The following is a list of all Flow Monitor workspace reports available in WhatsUp Gold.
Interface Details workspace reports (on page 432)
Interface Traffic workspace reports (on page 433)
Interface Troubleshooting workspace reports (on page 433)
General Flow monitor workspace reports
Interface Details workspace reports Interface Details workspace reports Type Description
Top Protocols Home Displays the transport layer protocols (TCP, UDP, ICMP, etc.) used the most, traveling in the selected direction on the selected interface.
Top Applications Home Displays the applications used by devices generating the most traffic traveling in the selected direction on the selected interface.
Top Senders Home Displays the devices generating the most traffic traveling in the selected direction on the selected interface.
Top Receivers Home Displays the devices receiving the most traffic traveling in the selected direction on the selected interface.
Top Sender/Receiver Domains Home Displays the top domains whose devices are generating traffic/to which traffic is routed over the selected interface in the selected direction.
Top Sender/Receiver Countries Home Displays the geographic locations of the devices sending/receiving the most traffic traveling in the selected direction on the selected interface.
Top Sender/Receiver Groups Home Displays the sender/receiver groups generating the most traffic traveling in the selected direction on the selected interface.
Top Sender/Receiver TLD Home Displays the top level domains (the last portion of an Internet domain name, such as .com, .edu, or .us) whose devices are generating traffic/to which traffic is routed over the selected interface in the selected direction.
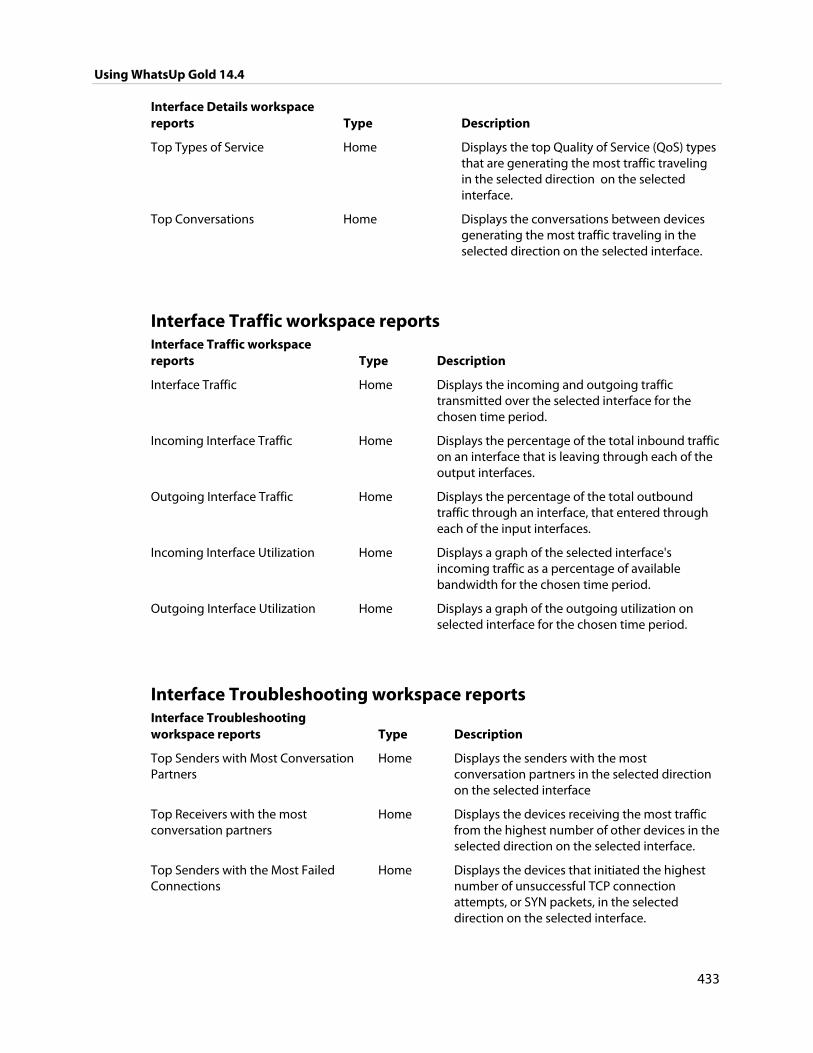
Using WhatsUp Gold 14.4
433
Interface Details workspace reports Type Description
Top Types of Service Home Displays the top Quality of Service (QoS) types that are generating the most traffic traveling in the selected direction on the selected interface.
Top Conversations Home Displays the conversations between devices generating the most traffic traveling in the selected direction on the selected interface.
Interface Traffic workspace reports Interface Traffic workspace reports Type Description
Interface Traffic Home Displays the incoming and outgoing traffic transmitted over the selected interface for the chosen time period.
Incoming Interface Traffic Home Displays the percentage of the total inbound traffic on an interface that is leaving through each of the output interfaces.
Outgoing Interface Traffic Home Displays the percentage of the total outbound traffic through an interface, that entered through each of the input interfaces.
Incoming Interface Utilization Home Displays a graph of the selected interface's incoming traffic as a percentage of available bandwidth for the chosen time period.
Outgoing Interface Utilization Home Displays a graph of the outgoing utilization on selected interface for the chosen time period.
Interface Troubleshooting workspace reports Interface Troubleshooting workspace reports Type Description
Top Senders with Most Conversation Partners
Home Displays the senders with the most conversation partners in the selected direction on the selected interface
Top Receivers with the most conversation partners
Home Displays the devices receiving the most traffic from the highest number of other devices in the selected direction on the selected interface.
Top Senders with the Most Failed Connections
Home Displays the devices that initiated the highest number of unsuccessful TCP connection attempts, or SYN packets, in the selected direction on the selected interface.
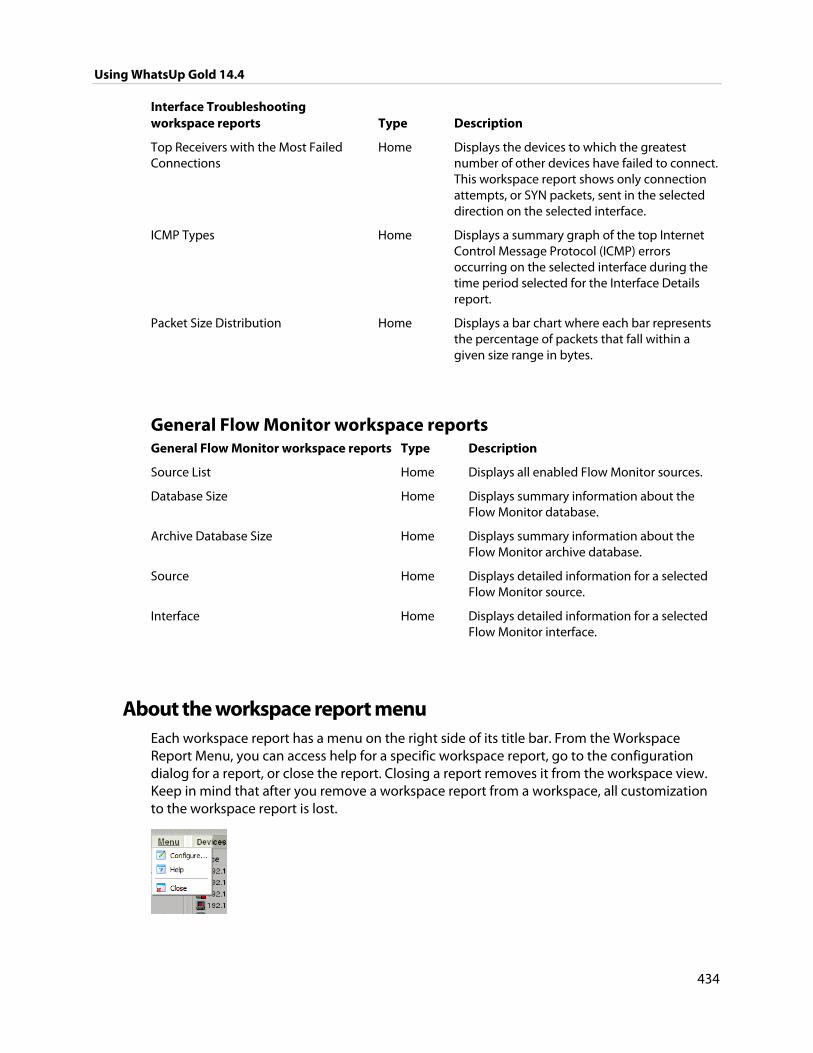
Using WhatsUp Gold 14.4
434
Interface Troubleshooting workspace reports Type Description
Top Receivers with the Most Failed Connections
Home Displays the devices to which the greatest number of other devices have failed to connect. This workspace report shows only connection attempts, or SYN packets, sent in the selected direction on the selected interface.
ICMP Types Home Displays a summary graph of the top Internet Control Message Protocol (ICMP) errors occurring on the selected interface during the time period selected for the Interface Details report.
Packet Size Distribution Home Displays a bar chart where each bar represents the percentage of packets that fall within a given size range in bytes.
General Flow Monitor workspace reports General Flow Monitor workspace reports Type Description
Source List Home Displays all enabled Flow Monitor sources.
Database Size Home Displays summary information about the Flow Monitor database.
Archive Database Size Home Displays summary information about the Flow Monitor archive database.
Source Home Displays detailed information for a selected Flow Monitor source.
Interface Home Displays detailed information for a selected Flow Monitor interface.
About the workspace report menu Each workspace report has a menu on the right side of its title bar. From the Workspace Report Menu, you can access help for a specific workspace report, go to the configuration dialog for a report, or close the report. Closing a report removes it from the workspace view. Keep in mind that after you remove a workspace report from a workspace, all customization to the workspace report is lost.
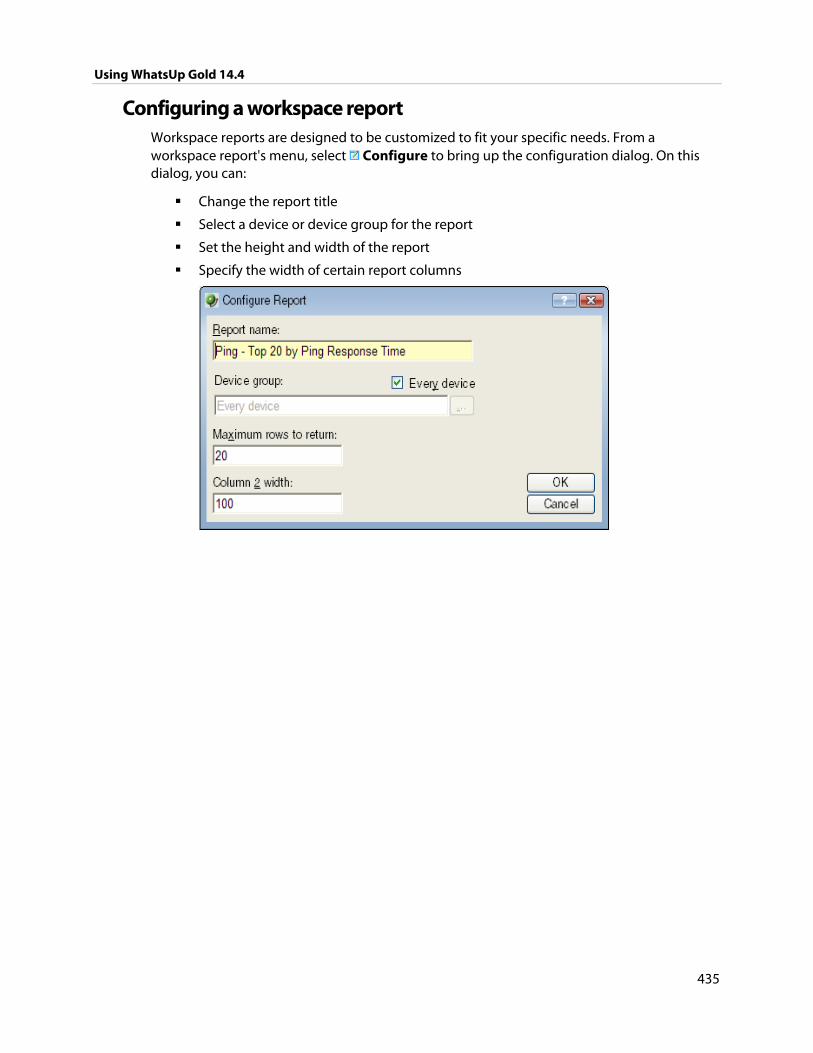
Using WhatsUp Gold 14.4
435
Configuring a workspace report Workspace reports are designed to be customized to fit your specific needs. From a workspace report's menu, select Configure to bring up the configuration dialog. On this dialog, you can:
Change the report title
Select a device or device group for the report
Set the height and width of the report
Specify the width of certain report columns
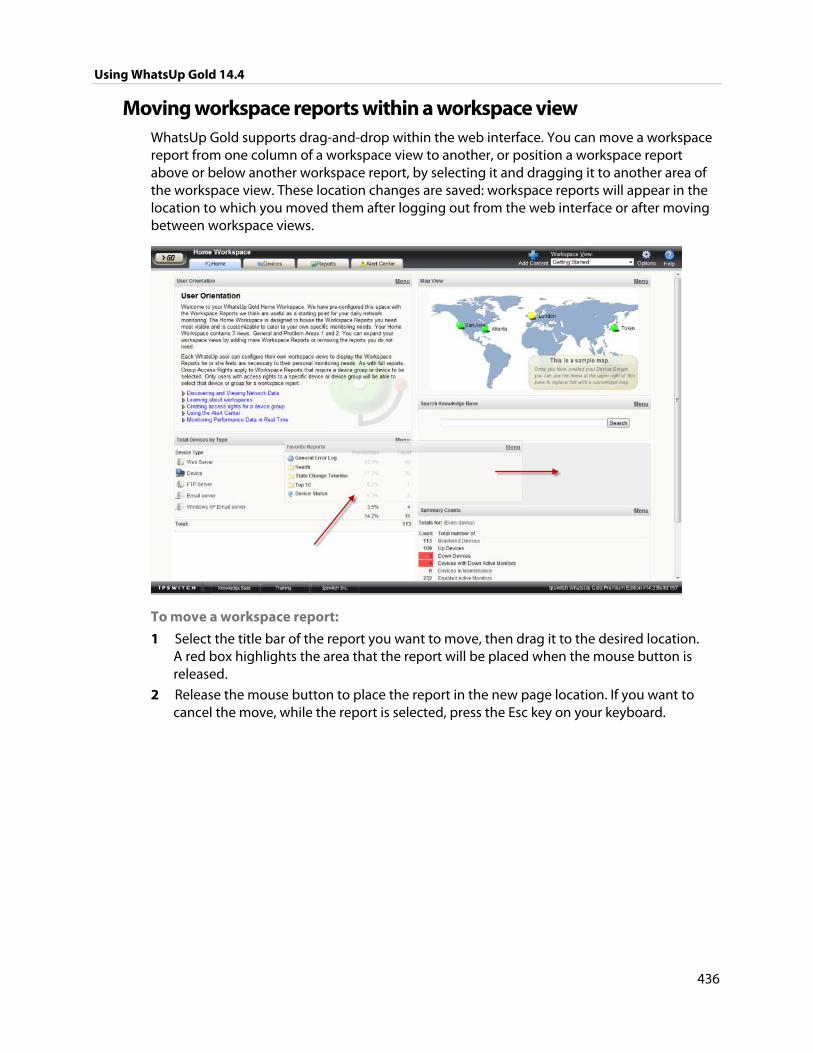
Using WhatsUp Gold 14.4
436
Moving workspace reports within a workspace view WhatsUp Gold supports drag-and-drop within the web interface. You can move a workspace report from one column of a workspace view to another, or position a workspace report above or below another workspace report, by selecting it and dragging it to another area of the workspace view. These location changes are saved: workspace reports will appear in the location to which you moved them after logging out from the web interface or after moving between workspace views.
To move a workspace report:
1 Select the title bar of the report you want to move, then drag it to the desired location. A red box highlights the area that the report will be placed when the mouse button is released.
2 Release the mouse button to place the report in the new page location. If you want to cancel the move, while the report is selected, press the Esc key on your keyboard.
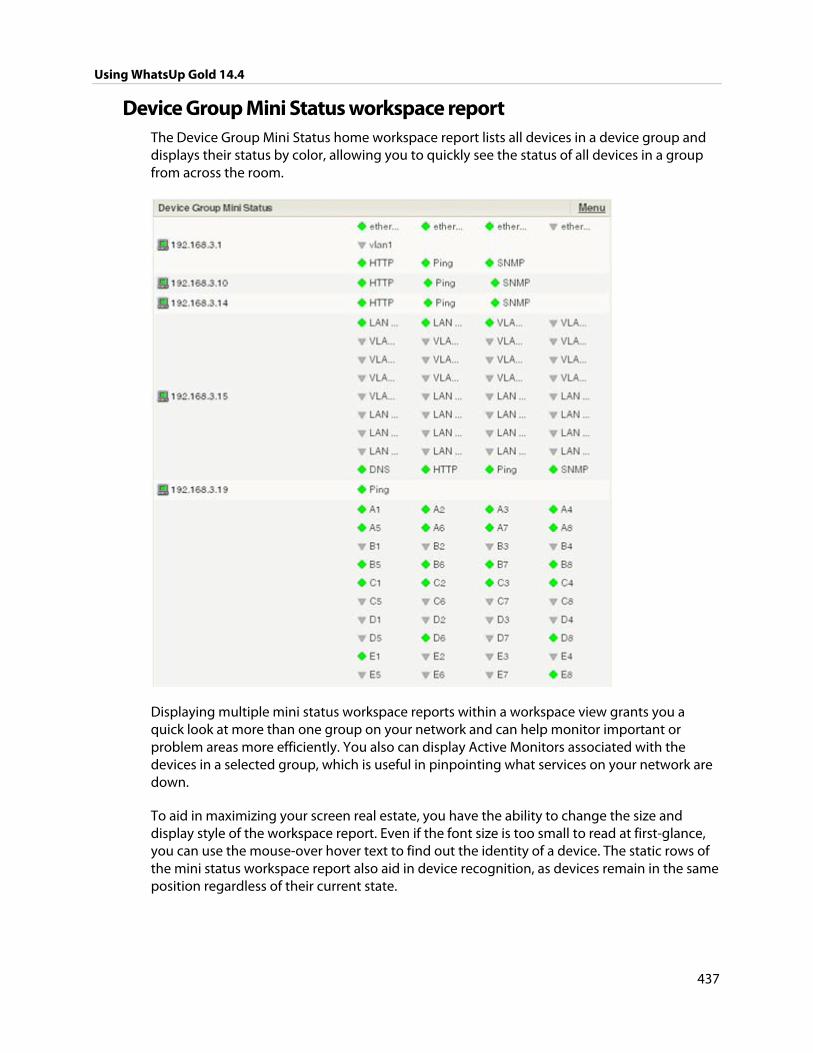
Using WhatsUp Gold 14.4
437
Device Group Mini Status workspace report The Device Group Mini Status home workspace report lists all devices in a device group and displays their status by color, allowing you to quickly see the status of all devices in a group from across the room.
Displaying multiple mini status workspace reports within a workspace view grants you a quick look at more than one group on your network and can help monitor important or problem areas more efficiently. You also can display Active Monitors associated with the devices in a selected group, which is useful in pinpointing what services on your network are down.
To aid in maximizing your screen real estate, you have the ability to change the size and display style of the workspace report. Even if the font size is too small to read at first-glance, you can use the mouse-over hover text to find out the identity of a device. The static rows of the mini status workspace report also aid in device recognition, as devices remain in the same position regardless of their current state.
Using WhatsUp Gold 14.4
438
To configure the Device Group Mini Status workspace report:
1 On the workspace report menu, select Configure.
2 Enter the appropriate information in the following fields:
Name. Enter a title for the workspace report.
Device group. Select a device group by clicking the browse (...) button. To select every device on the network, regardless of their subgroup, select Every device.
Every device. Select this option to display every device in the system regardless of group. However, only devices that you have permissions to view will be displayed.
Style. Select the style and size in which you would like the mini status displayed.
Normal. Displays device and active monitor status with icons.
High Contrast. Displays device and active monitor status with bright colors.
Show Active Monitors. Select this option to display the active monitors associated with the group's devices.
Active Monitors per Row. Select the number of active monitors displayed per row.
Active Monitors Cell Width. Enter a cell width in pixels.
3 Click OK to save changes.
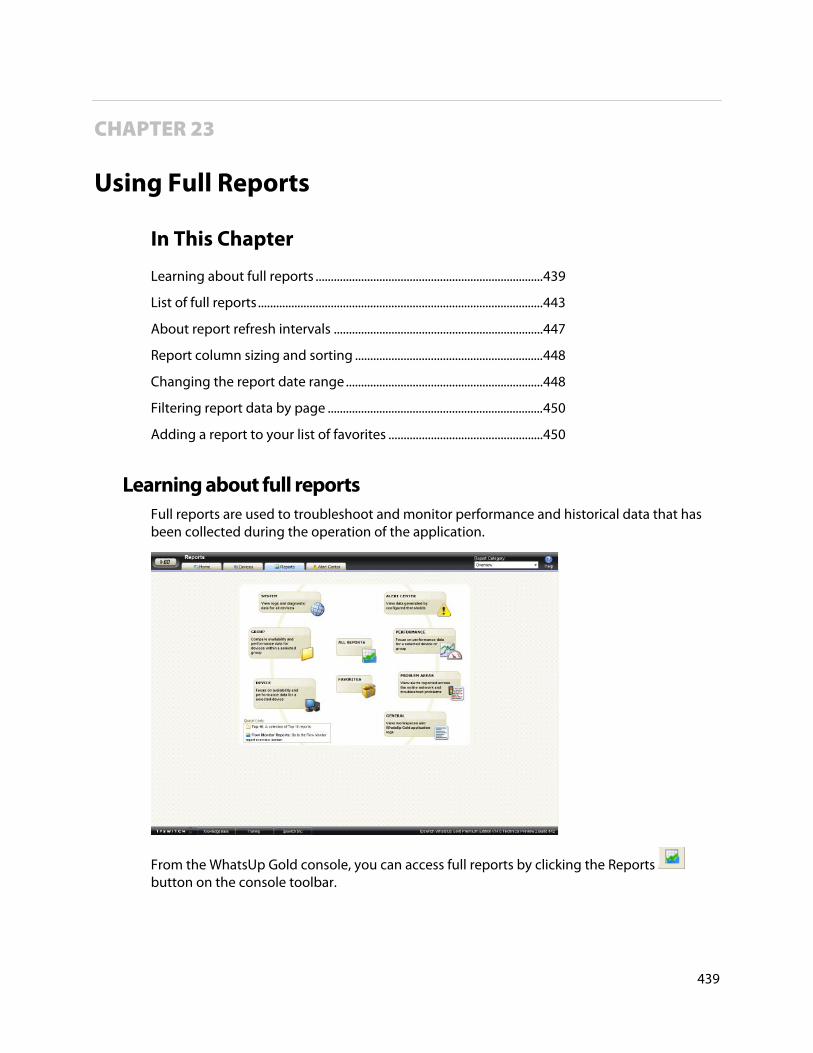
439
CHAPTER 23
Using Full Reports
In This Chapter
Learning about full reports ........................................................................... 439
List of full reports .............................................................................................. 443
About report refresh intervals ..................................................................... 447
Report column sizing and sorting .............................................................. 448
Changing the report date range ................................................................. 448
Filtering report data by page ....................................................................... 450
Adding a report to your list of favorites ................................................... 450
Learning about full reports Full reports are used to troubleshoot and monitor performance and historical data that has been collected during the operation of the application.
From the WhatsUp Gold console, you can access full reports by clicking the Reports button on the console toolbar.
Using WhatsUp Gold 14.4
440
Report categories Reports in WhatsUp Gold are broken down by the scope and the type of information displayed within each report.
There are three categories for full reports based on the scope of information displayed:
System. These reports display system-wide information. System reports do not focus on a particular device nor a specific device group. For example, the General Error Log and the Web User Activity Log are system reports.
Group. These reports display information relating to a specific device group. For example, the Group State Change Timeline and the Group Actions Applied reports are group reports.
Device. These reports display information relating to a specific device. For example, the Device Status Report is a device report.
There are three categories for full reports based on the type of information displayed:
Performance. These reports display information gathered from WMI and SNMP Performance Monitors regarding your network devices' CPU, disk, interface, and memory utilization; and ping latency and availability. For example, the Device Custom Performance Monitors and the Group Memory Utilization reports are performance reports.
Note: By default, performance data is not collected for the monitors assigned to the devices in your database. To begin collecting performance data for a device, right-click on a device on the Devices tab and select Properties from the context menu. In the Device Properties dialog, select Performance Monitors and choose the monitors you want to apply to the selected device.
Problem Areas. These are troubleshooting reports that allow you to investigate network issues. For example, the Group Active Monitor Outage and the Passive Monitor Error Log are problem area reports.
General. These reports display information on your WhatsUp Gold settings and diagnostics, as well as device-specific and user-configured details. For example, the Home, Top 10, and Device Status workspaces/full reports are general reports.
Advantages of full Reports Larger than workspace reports, full reports give you a larger data view, which can be
useful in pin-pointing the time an event occurred or viewing multiple graphed items. Many workspace reports link to full reports, so that you can view this larger data view to troubleshoot.
The date range on full reports can be zoomed in or out so that you can get a smaller or larger picture of what's going on with an aspect of the network.
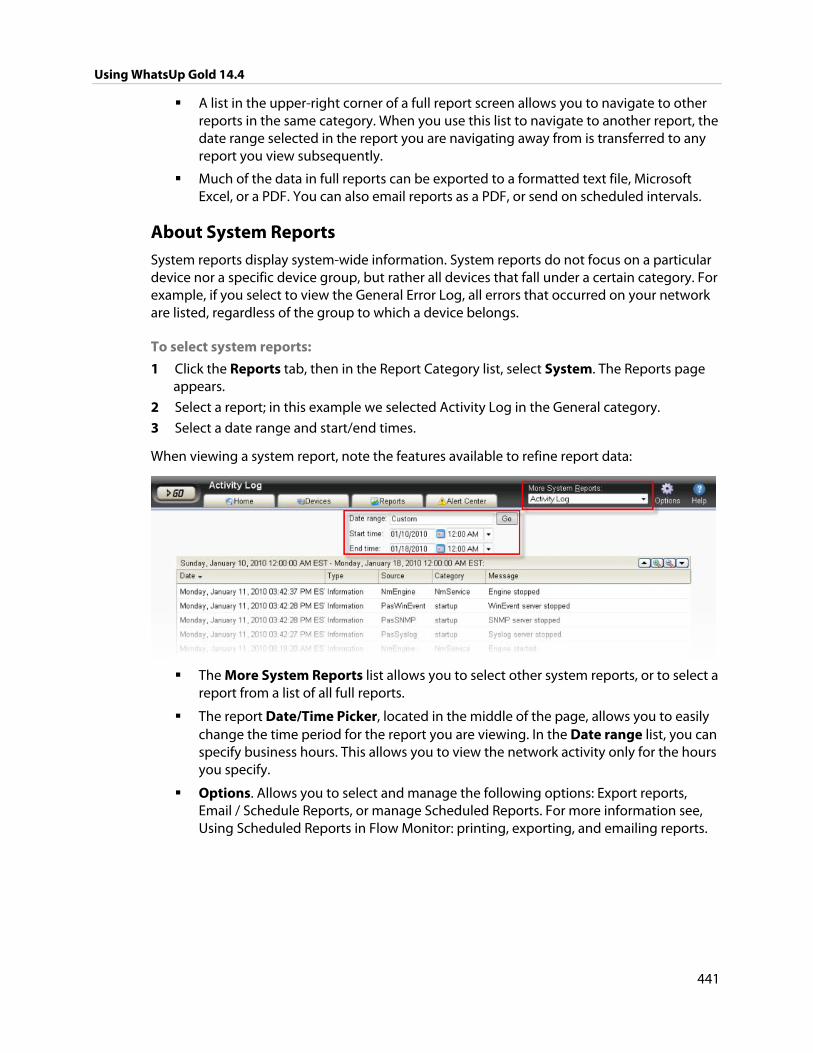
Using WhatsUp Gold 14.4
441
A list in the upper-right corner of a full report screen allows you to navigate to other reports in the same category. When you use this list to navigate to another report, the date range selected in the report you are navigating away from is transferred to any report you view subsequently.
Much of the data in full reports can be exported to a formatted text file, Microsoft Excel, or a PDF. You can also email reports as a PDF, or send on scheduled intervals.
About System Reports System reports display system-wide information. System reports do not focus on a particular device nor a specific device group, but rather all devices that fall under a certain category. For example, if you select to view the General Error Log, all errors that occurred on your network are listed, regardless of the group to which a device belongs.
To select system reports:
1 Click the Reports tab, then in the Report Category list, select System. The Reports page appears.
2 Select a report; in this example we selected Activity Log in the General category.
3 Select a date range and start/end times.
When viewing a system report, note the features available to refine report data:
The More System Reports list allows you to select other system reports, or to select a report from a list of all full reports.
The report Date/Time Picker, located in the middle of the page, allows you to easily change the time period for the report you are viewing. In the Date range list, you can specify business hours. This allows you to view the network activity only for the hours you specify.
Options. Allows you to select and manage the following options: Export reports, Email / Schedule Reports, or manage Scheduled Reports. For more information see, Using Scheduled Reports in Flow Monitor: printing, exporting, and emailing reports.
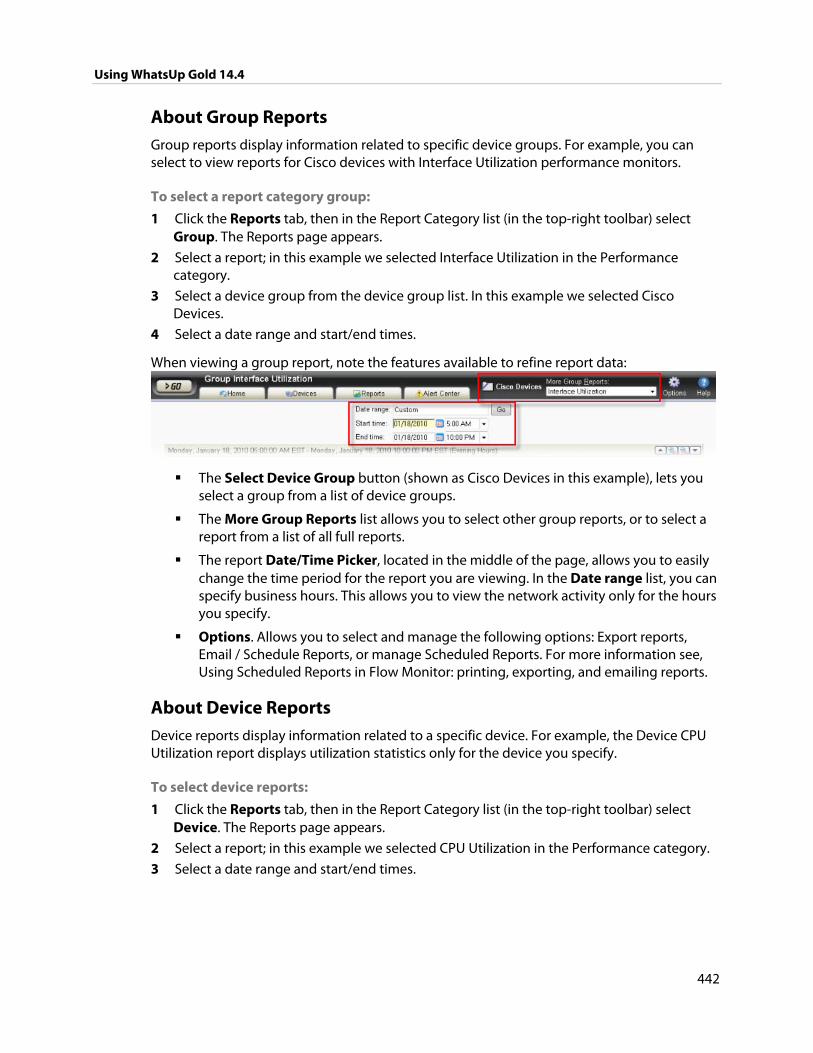
Using WhatsUp Gold 14.4
442
About Group Reports Group reports display information related to specific device groups. For example, you can select to view reports for Cisco devices with Interface Utilization performance monitors.
To select a report category group:
1 Click the Reports tab, then in the Report Category list (in the top-right toolbar) select Group. The Reports page appears.
2 Select a report; in this example we selected Interface Utilization in the Performance category.
3 Select a device group from the device group list. In this example we selected Cisco Devices.
4 Select a date range and start/end times.
When viewing a group report, note the features available to refine report data:
The Select Device Group button (shown as Cisco Devices in this example), lets you select a group from a list of device groups.
The More Group Reports list allows you to select other group reports, or to select a report from a list of all full reports.
The report Date/Time Picker, located in the middle of the page, allows you to easily change the time period for the report you are viewing. In the Date range list, you can specify business hours. This allows you to view the network activity only for the hours you specify.
Options. Allows you to select and manage the following options: Export reports, Email / Schedule Reports, or manage Scheduled Reports. For more information see, Using Scheduled Reports in Flow Monitor: printing, exporting, and emailing reports.
About Device Reports Device reports display information related to a specific device. For example, the Device CPU Utilization report displays utilization statistics only for the device you specify.
To select device reports:
1 Click the Reports tab, then in the Report Category list (in the top-right toolbar) select Device. The Reports page appears.
2 Select a report; in this example we selected CPU Utilization in the Performance category.
3 Select a date range and start/end times.
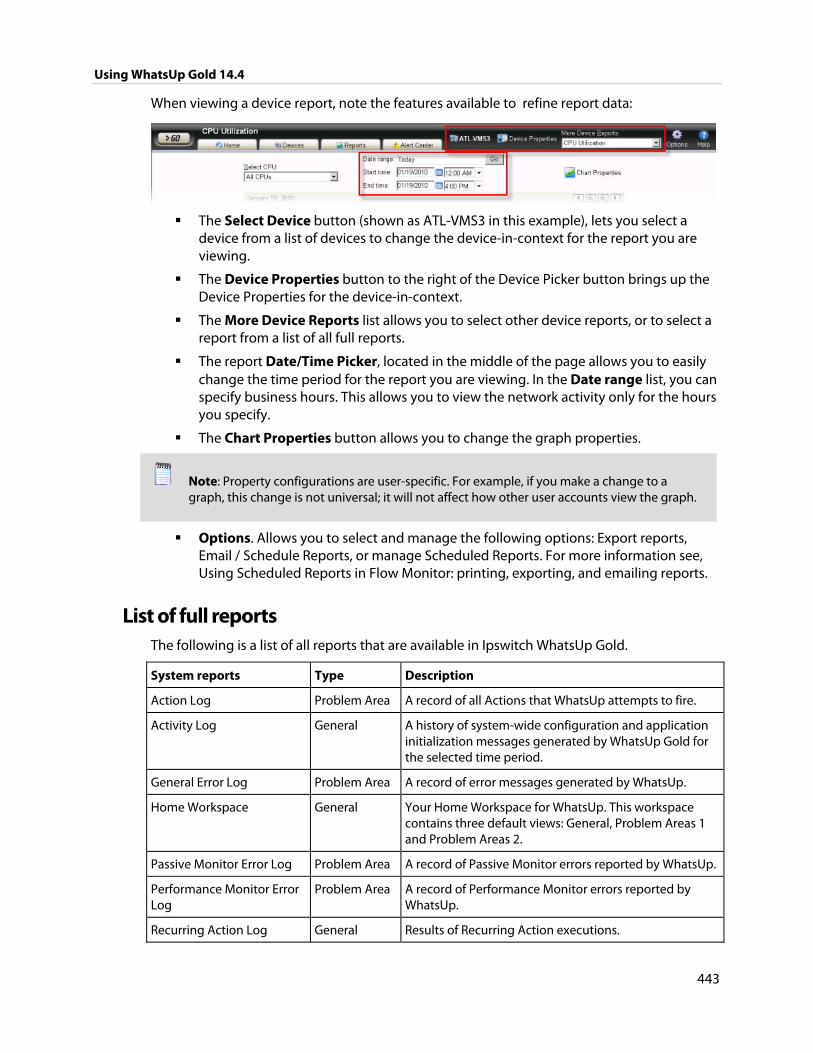
Using WhatsUp Gold 14.4
443
When viewing a device report, note the features available to refine report data:
The Select Device button (shown as ATL-VMS3 in this example), lets you select a device from a list of devices to change the device-in-context for the report you are viewing.
The Device Properties button to the right of the Device Picker button brings up the Device Properties for the device-in-context.
The More Device Reports list allows you to select other device reports, or to select a report from a list of all full reports.
The report Date/Time Picker, located in the middle of the page allows you to easily change the time period for the report you are viewing. In the Date range list, you can specify business hours. This allows you to view the network activity only for the hours you specify.
The Chart Properties button allows you to change the graph properties.
Note: Property configurations are user-specific. For example, if you make a change to a graph, this change is not universal; it will not affect how other user accounts view the graph.
Options. Allows you to select and manage the following options: Export reports, Email / Schedule Reports, or manage Scheduled Reports. For more information see, Using Scheduled Reports in Flow Monitor: printing, exporting, and emailing reports.
List of full reports The following is a list of all reports that are available in Ipswitch WhatsUp Gold.
System reports Type Description
Action Log Problem Area A record of all Actions that WhatsUp attempts to fire.
Activity Log General A history of system-wide configuration and application initialization messages generated by WhatsUp Gold for the selected time period.
General Error Log Problem Area A record of error messages generated by WhatsUp.
Home Workspace General Your Home Workspace for WhatsUp. This workspace contains three default views: General, Problem Areas 1 and Problem Areas 2.
Passive Monitor Error Log Problem Area A record of Passive Monitor errors reported by WhatsUp.
Performance Monitor Error Log
Problem Area A record of Performance Monitor errors reported by WhatsUp.
Recurring Action Log General Results of Recurring Action executions.
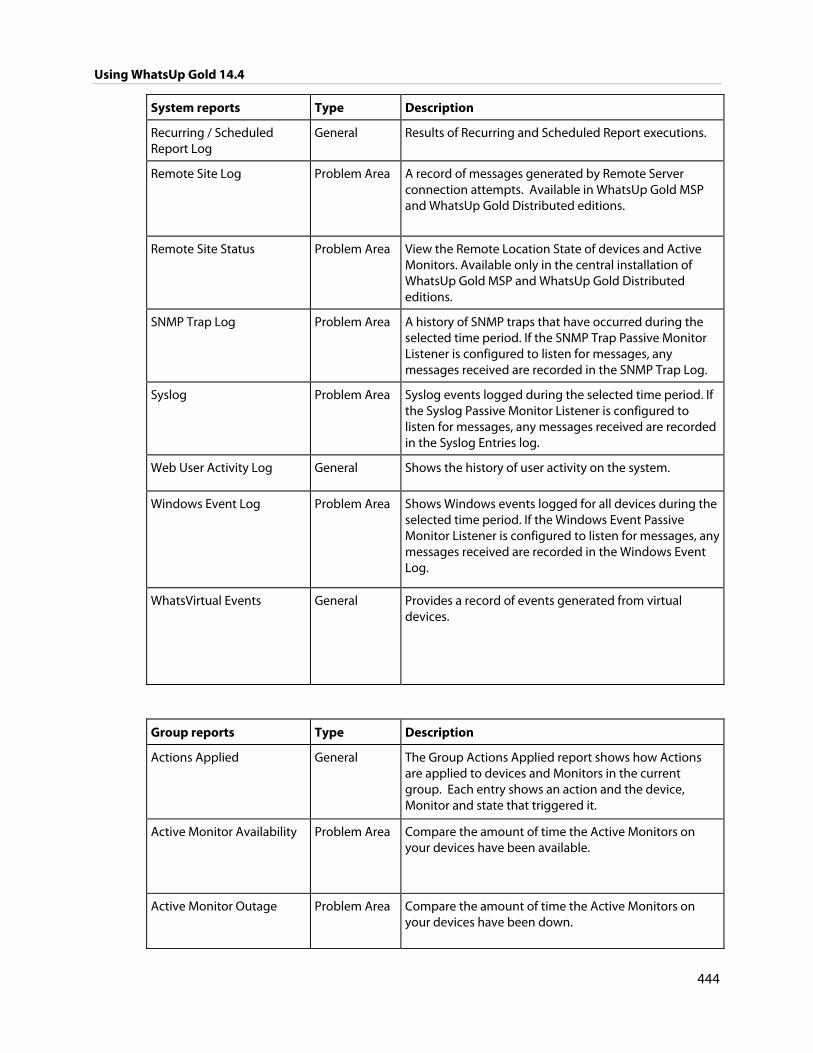
Using WhatsUp Gold 14.4
444
System reports Type Description
Recurring / Scheduled Report Log
General Results of Recurring and Scheduled Report executions.
Remote Site Log Problem Area A record of messages generated by Remote Server connection attempts. Available in WhatsUp Gold MSP and WhatsUp Gold Distributed editions.
Remote Site Status Problem Area View the Remote Location State of devices and Active Monitors. Available only in the central installation of WhatsUp Gold MSP and WhatsUp Gold Distributed editions.
SNMP Trap Log Problem Area A history of SNMP traps that have occurred during the selected time period. If the SNMP Trap Passive Monitor Listener is configured to listen for messages, any messages received are recorded in the SNMP Trap Log.
Syslog Problem Area Syslog events logged during the selected time period. If the Syslog Passive Monitor Listener is configured to listen for messages, any messages received are recorded in the Syslog Entries log.
Web User Activity Log General Shows the history of user activity on the system.
Windows Event Log Problem Area Shows Windows events logged for all devices during the selected time period. If the Windows Event Passive Monitor Listener is configured to listen for messages, any messages received are recorded in the Windows Event Log.
WhatsVirtual Events General Provides a record of events generated from virtual devices.
Group reports Type Description
Actions Applied General The Group Actions Applied report shows how Actions are applied to devices and Monitors in the current group. Each entry shows an action and the device, Monitor and state that triggered it.
Active Monitor Availability Problem Area Compare the amount of time the Active Monitors on your devices have been available.
Active Monitor Outage Problem Area Compare the amount of time the Active Monitors on your devices have been down.
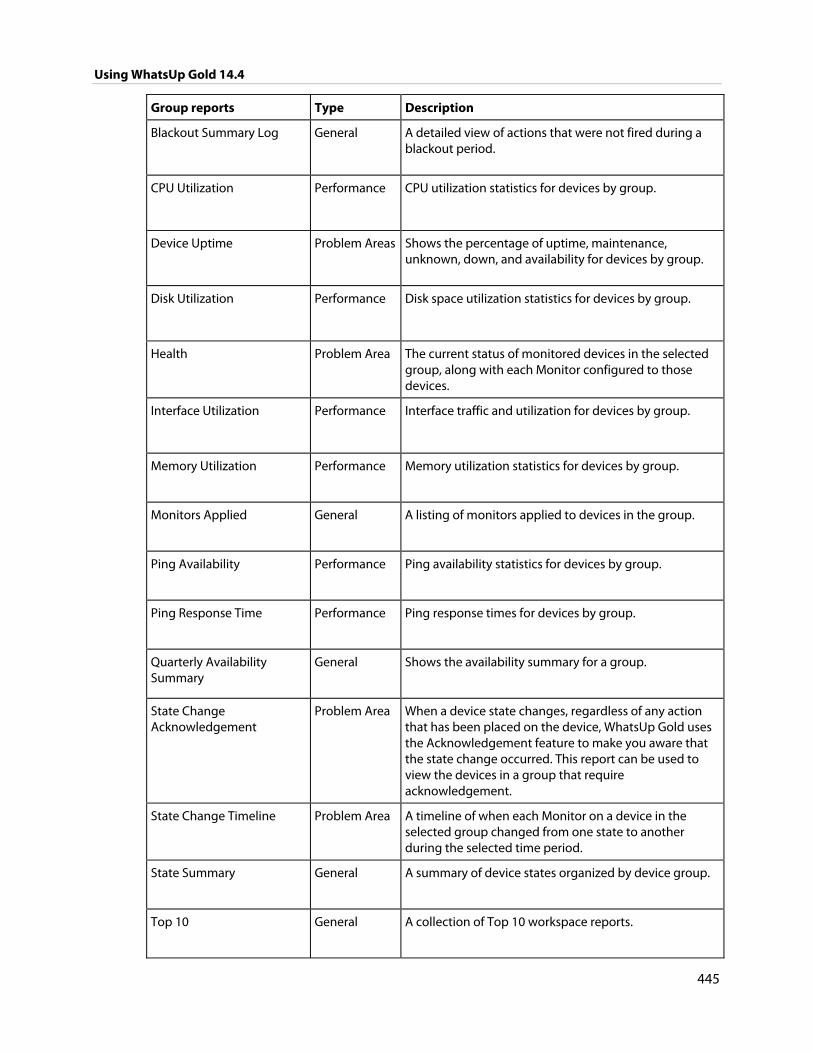
Using WhatsUp Gold 14.4
445
Group reports Type Description
Blackout Summary Log General A detailed view of actions that were not fired during a blackout period.
CPU Utilization Performance CPU utilization statistics for devices by group.
Device Uptime Problem Areas Shows the percentage of uptime, maintenance, unknown, down, and availability for devices by group.
Disk Utilization Performance Disk space utilization statistics for devices by group.
Health Problem Area The current status of monitored devices in the selected group, along with each Monitor configured to those devices.
Interface Utilization Performance Interface traffic and utilization for devices by group.
Memory Utilization Performance Memory utilization statistics for devices by group.
Monitors Applied General A listing of monitors applied to devices in the group.
Ping Availability Performance Ping availability statistics for devices by group.
Ping Response Time Performance Ping response times for devices by group.
Quarterly Availability Summary
General Shows the availability summary for a group.
State Change Acknowledgement
Problem Area When a device state changes, regardless of any action that has been placed on the device, WhatsUp Gold uses the Acknowledgement feature to make you aware that the state change occurred. This report can be used to view the devices in a group that require acknowledgement.
State Change Timeline Problem Area A timeline of when each Monitor on a device in the selected group changed from one state to another during the selected time period.
State Summary General A summary of device states organized by device group.
Top 10 General A collection of Top 10 workspace reports.
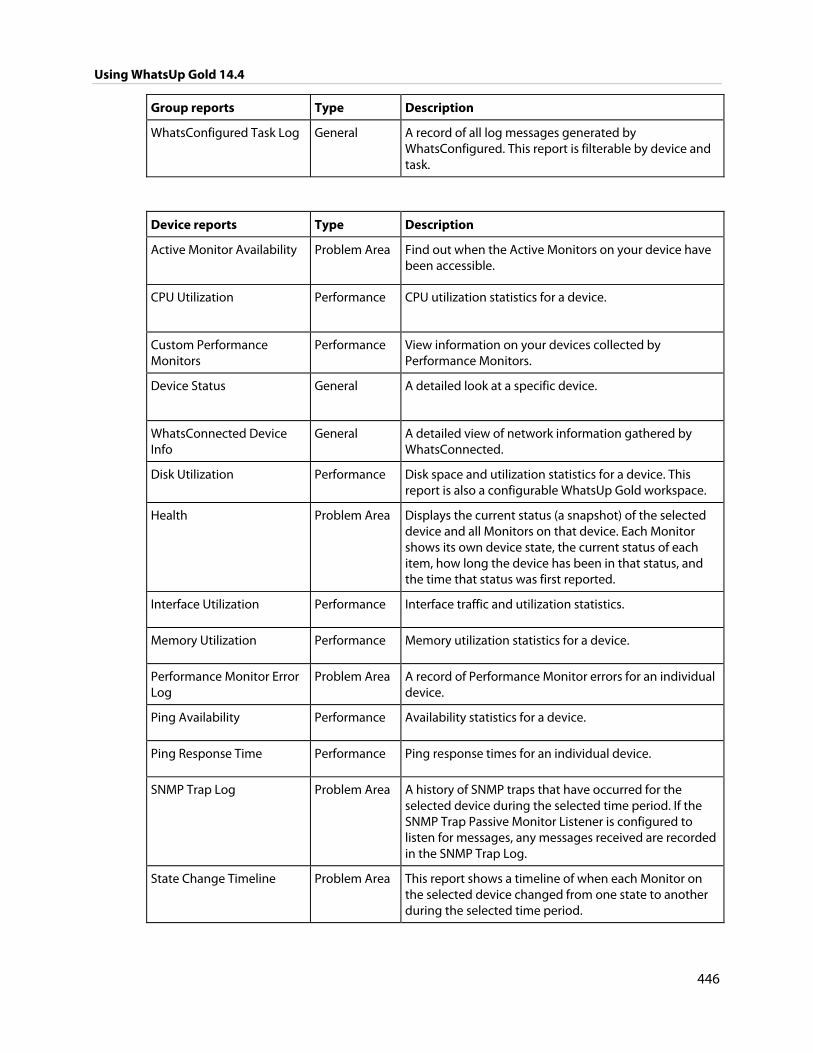
Using WhatsUp Gold 14.4
446
Group reports Type Description
WhatsConfigured Task Log General A record of all log messages generated by WhatsConfigured. This report is filterable by device and task.
Device reports Type Description
Active Monitor Availability Problem Area Find out when the Active Monitors on your device have been accessible.
CPU Utilization Performance CPU utilization statistics for a device.
Custom Performance Monitors
Performance View information on your devices collected by Performance Monitors.
Device Status General A detailed look at a specific device.
WhatsConnected Device Info
General A detailed view of network information gathered by WhatsConnected.
Disk Utilization Performance Disk space and utilization statistics for a device. This report is also a configurable WhatsUp Gold workspace.
Health Problem Area Displays the current status (a snapshot) of the selected device and all Monitors on that device. Each Monitor shows its own device state, the current status of each item, how long the device has been in that status, and the time that status was first reported.
Interface Utilization Performance Interface traffic and utilization statistics.
Memory Utilization Performance Memory utilization statistics for a device.
Performance Monitor Error Log
Problem Area A record of Performance Monitor errors for an individual device.
Ping Availability Performance Availability statistics for a device.
Ping Response Time Performance Ping response times for an individual device.
SNMP Trap Log Problem Area A history of SNMP traps that have occurred for the selected device during the selected time period. If the SNMP Trap Passive Monitor Listener is configured to listen for messages, any messages received are recorded in the SNMP Trap Log.
State Change Timeline Problem Area This report shows a timeline of when each Monitor on the selected device changed from one state to another during the selected time period.
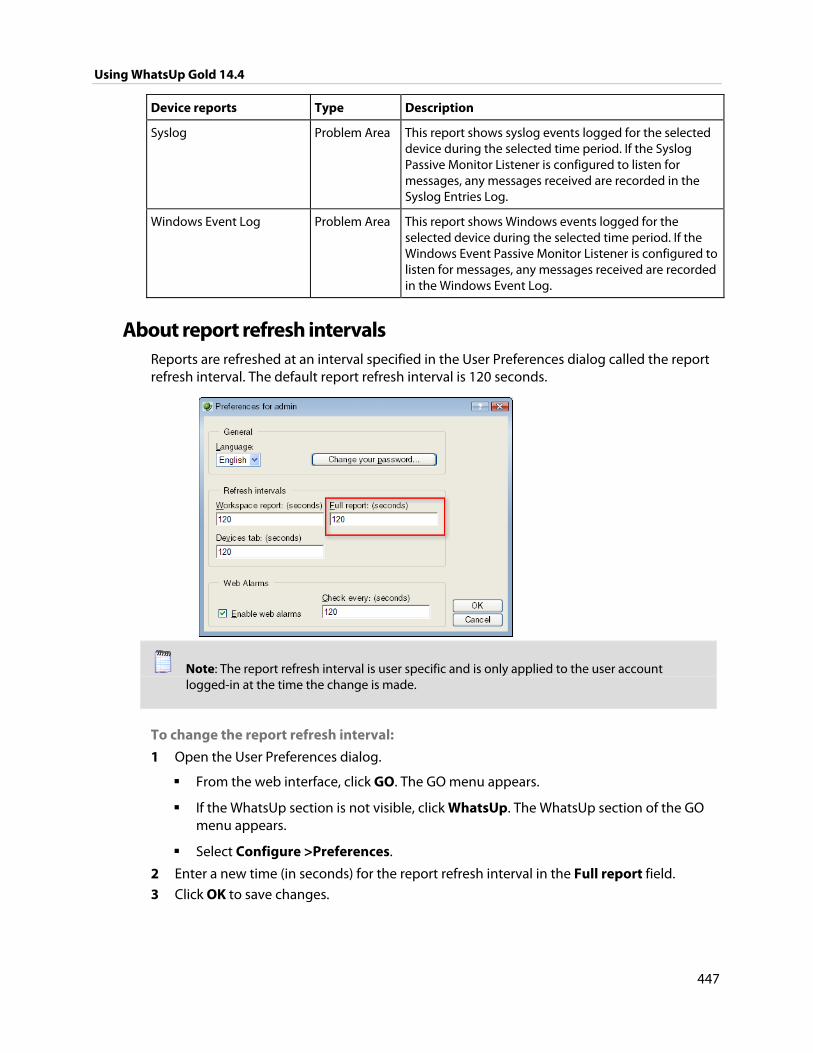
Using WhatsUp Gold 14.4
447
Device reports Type Description
Syslog Problem Area This report shows syslog events logged for the selected device during the selected time period. If the Syslog Passive Monitor Listener is configured to listen for messages, any messages received are recorded in the Syslog Entries Log.
Windows Event Log Problem Area This report shows Windows events logged for the selected device during the selected time period. If the Windows Event Passive Monitor Listener is configured to listen for messages, any messages received are recorded in the Windows Event Log.
About report refresh intervals Reports are refreshed at an interval specified in the User Preferences dialog called the report refresh interval. The default report refresh interval is 120 seconds.
Note: The report refresh interval is user specific and is only applied to the user account logged-in at the time the change is made.
To change the report refresh interval:
1 Open the User Preferences dialog.
From the web interface, click GO. The GO menu appears.
If the WhatsUp section is not visible, click WhatsUp. The WhatsUp section of the GO menu appears.
Select Configure >Preferences.
2 Enter a new time (in seconds) for the report refresh interval in the Full report field.
3 Click OK to save changes.
Using WhatsUp Gold 14.4
448
Report column sizing and sorting All full report columns can be resized. You can resize a report column by clicking on the edge of the report title box and moving it either left or right.
When a report column is resized, the new size is saved and used again each time the report is viewed.
Most full report columns can be sorted. You can sort by left-clicking a column heading. The report column then automatically sorts itself either ascending or descending. The column's sort direction is indicated with an upward, or downward pointing arrow.
As in column sizing, column sorting settings are saved and are used again each time the report is viewed.
Both column sizing and sorting are maintained on a per user basis, and only for the report in which the column changes are made.
Changing the report date range
Date/Time picker Most full reports have a date range selection tool (date/time picker) that you can use to change the range of data you are viewing in the report. This tool helps control the amount of information that you are viewing on a report.
You can select both start and end times for the report.
You can select from the following date ranges:
Today
Yesterday
Last Week
Previous Month
Week To Date
Month To Date
Last 2 Hours
Last 4 Hours
Last 8 Hours
Last 3 Days
Last 7 Days
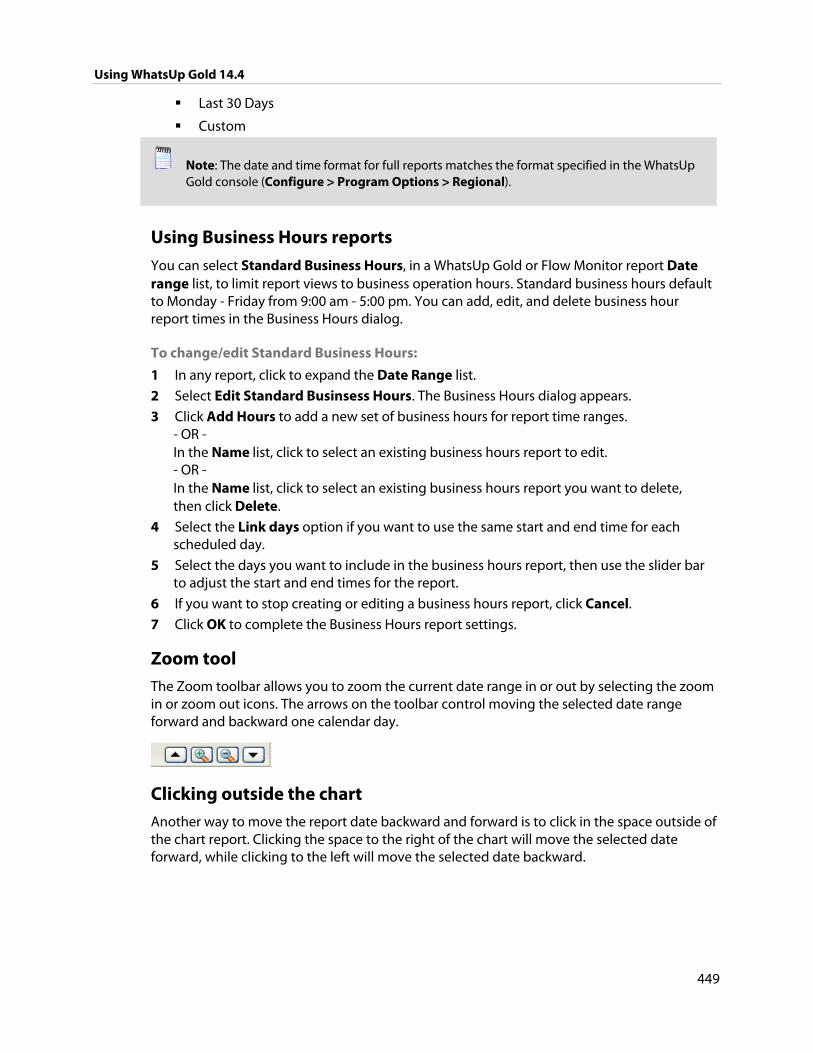
Using WhatsUp Gold 14.4
449
Last 30 Days
Custom
Note: The date and time format for full reports matches the format specified in the WhatsUp Gold console (Configure > Program Options > Regional).
Using Business Hours reports
You can select Standard Business Hours, in a WhatsUp Gold or Flow Monitor report Date range list, to limit report views to business operation hours. Standard business hours default to Monday - Friday from 9:00 am - 5:00 pm. You can add, edit, and delete business hour report times in the Business Hours dialog.
To change/edit Standard Business Hours:
1 In any report, click to expand the Date Range list.
2 Select Edit Standard Businsess Hours. The Business Hours dialog appears.
3 Click Add Hours to add a new set of business hours for report time ranges. - OR - In the Name list, click to select an existing business hours report to edit. - OR - In the Name list, click to select an existing business hours report you want to delete, then click Delete.
4 Select the Link days option if you want to use the same start and end time for each scheduled day.
5 Select the days you want to include in the business hours report, then use the slider bar to adjust the start and end times for the report.
6 If you want to stop creating or editing a business hours report, click Cancel. 7 Click OK to complete the Business Hours report settings.
Zoom tool The Zoom toolbar allows you to zoom the current date range in or out by selecting the zoom in or zoom out icons. The arrows on the toolbar control moving the selected date range forward and backward one calendar day.
Clicking outside the chart Another way to move the report date backward and forward is to click in the space outside of the chart report. Clicking the space to the right of the chart will move the selected date forward, while clicking to the left will move the selected date backward.
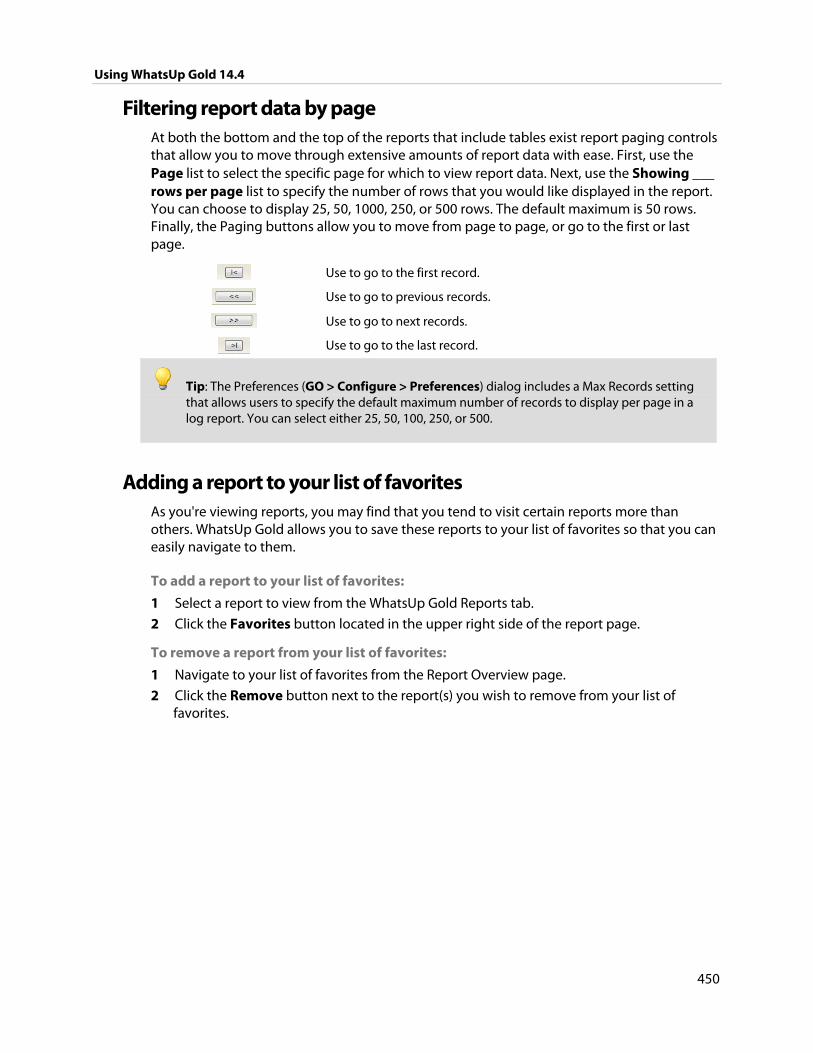
Using WhatsUp Gold 14.4
450
Filtering report data by page At both the bottom and the top of the reports that include tables exist report paging controls that allow you to move through extensive amounts of report data with ease. First, use the Page list to select the specific page for which to view report data. Next, use the Showing ___ rows per page list to specify the number of rows that you would like displayed in the report. You can choose to display 25, 50, 1000, 250, or 500 rows. The default maximum is 50 rows. Finally, the Paging buttons allow you to move from page to page, or go to the first or last page.
Use to go to the first record.
Use to go to previous records.
Use to go to next records.
Use to go to the last record.
Tip: The Preferences (GO > Configure > Preferences) dialog includes a Max Records setting that allows users to specify the default maximum number of records to display per page in a log report. You can select either 25, 50, 100, 250, or 500.
Adding a report to your list of favorites As you're viewing reports, you may find that you tend to visit certain reports more than others. WhatsUp Gold allows you to save these reports to your list of favorites so that you can easily navigate to them.
To add a report to your list of favorites:
1 Select a report to view from the WhatsUp Gold Reports tab.
2 Click the Favorites button located in the upper right side of the report page.
To remove a report from your list of favorites:
1 Navigate to your list of favorites from the Report Overview page.
2 Click the Remove button next to the report(s) you wish to remove from your list of favorites.
451
CHAPTER 24
Using Scheduled Reports (web interface) / Recurring Reports (console)
In This Chapter
Using Scheduled Reports: printing, exporting, and emailing reports452
Using Recurring Reports (WhatsUp Gold console) ............................... 454
Recurring and scheduled reports let you send a "snapshot" of selected WhatsUp Gold Workspace Report (on page 400) or Full Report (on page 439) to email addresses at regularly scheduled intervals. This feature provides a way to easily receive reports or send to other team members who need to view reports at specified intervals.
About scheduled reports in the WhatsUp Gold web interface You can set up scheduled reports in the WhatsUp Gold web interface. The reports can be sent on a scheduled interval as PDF document attachment. For more information, see Using Scheduled Reports: printing, exporting, and emailing reports (on page 452).
About recurring reports in the WhatsUp Gold Console You can set up recurring reports in the WhatsUp Gold console. The reports can be sent either in the body of the email message or as an attached Archived Web Page (.mht) file. For more information, see Configuring Recurring Reports (on page 454).
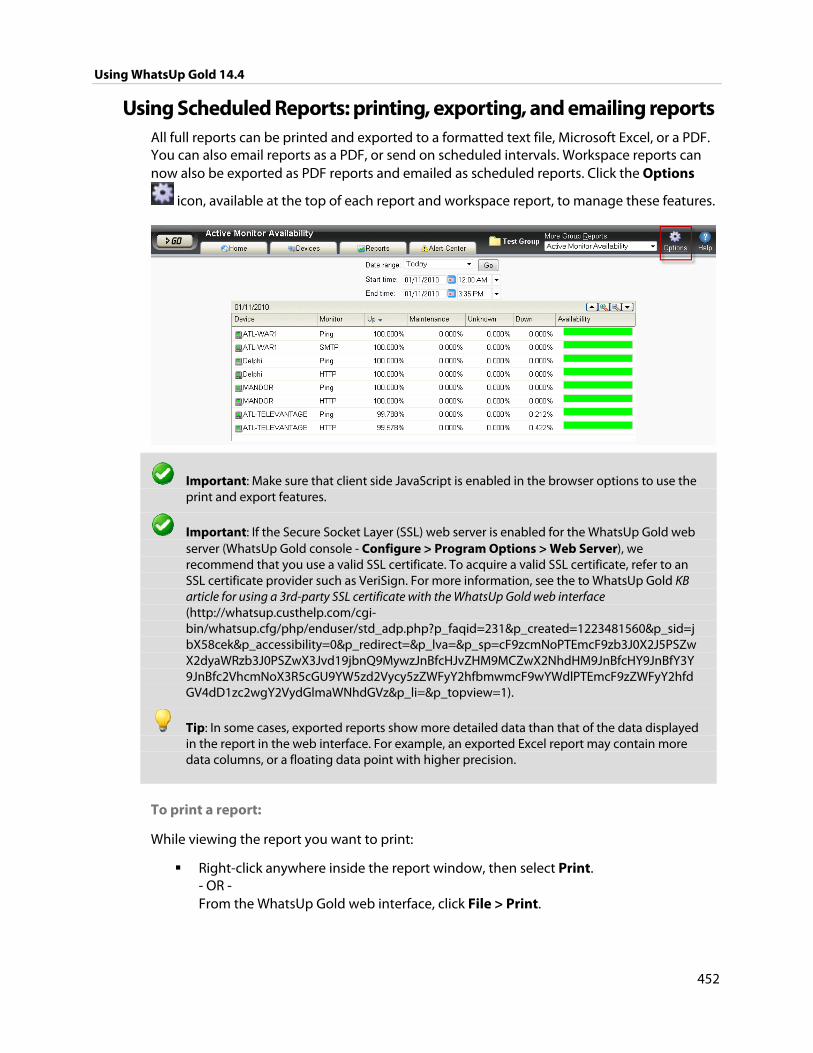
Using WhatsUp Gold 14.4
452
Using Scheduled Reports: printing, exporting, and emailing reports All full reports can be printed and exported to a formatted text file, Microsoft Excel, or a PDF. You can also email reports as a PDF, or send on scheduled intervals. Workspace reports can now also be exported as PDF reports and emailed as scheduled reports. Click the Options
icon, available at the top of each report and workspace report, to manage these features.
Important: Make sure that client side JavaScript is enabled in the browser options to use the print and export features.
Important: If the Secure Socket Layer (SSL) web server is enabled for the WhatsUp Gold web server (WhatsUp Gold console - Configure > Program Options > Web Server), we recommend that you use a valid SSL certificate. To acquire a valid SSL certificate, refer to an SSL certificate provider such as VeriSign. For more information, see the to WhatsUp Gold KB article for using a 3rd-party SSL certificate with the WhatsUp Gold web interface (http://whatsup.custhelp.com/cgi-bin/whatsup.cfg/php/enduser/std_adp.php?p_faqid=231&p_created=1223481560&p_sid=jbX58cek&p_accessibility=0&p_redirect=&p_lva=&p_sp=cF9zcmNoPTEmcF9zb3J0X2J5PSZwX2dyaWRzb3J0PSZwX3Jvd19jbnQ9MywzJnBfcHJvZHM9MCZwX2NhdHM9JnBfcHY9JnBfY3Y9JnBfc2VhcmNoX3R5cGU9YW5zd2Vycy5zZWFyY2hfbmwmcF9wYWdlPTEmcF9zZWFyY2hfdGV4dD1zc2wgY2VydGlmaWNhdGVz&p_li=&p_topview=1).
Tip: In some cases, exported reports show more detailed data than that of the data displayed in the report in the web interface. For example, an exported Excel report may contain more data columns, or a floating data point with higher precision.
To print a report:
While viewing the report you want to print:
Right-click anywhere inside the report window, then select Print. - OR - From the WhatsUp Gold web interface, click File > Print.
Using WhatsUp Gold 14.4
453
To export a report to a text file (full reports only):
While viewing the full report you want to export:
1 From the WhatsUp Gold web interface, on the Report Toolbar, click the Options icon. The Report Options list appears.
2 Select Export to Text.
3 Clear or select the following options: Include report title, Include column names to either include or remove the report title or column names from the exported file.
4 Select a Column delimiter from the list.
5 Select a Text qualifier from the list.
6 Click OK to export the report to text.
To export a report to Microsoft Excel (full reports only):
While viewing the full report you want to export:
1 From the WhatsUp Gold web interface, on the Report Toolbar, click the Options icon. The Report Options list appears.
2 Select Export to Excel. 3 Clear or select the following options: Include report title, Include column names to
either include or remove the report title or column names from the exported file.
4 Select a Column delimiter from the list.
5 Select a Text qualifier from the list.
6 Click OK to export the report to Excel.
To export a report to a PDF:
While viewing the full report you want to export:
1 From the WhatsUp Gold web interface, on the Report Toolbar, click the Options icon. The Report Options list appears.
2 Select Export to PDF. The Export to PDF dialog appears.
3 Select the following options:
Page size. Select from the list of page size options.
Auto size. Enable this option to, generally, make the best automatic adjustment to fit all page content on the PDF.
Page orientation. Select Portrait or Landscape PDF.
4 Select the Live links option if you want to include clickable url links in the PDF report.
5 Click Export to export the report to a PDF.
Using WhatsUp Gold 14.4
454
To email a report as a PDF:
While viewing the full report you want to export:
1 From the WhatsUp Gold web interface, on the Report Toolbar, click the Options icon. The Report Options list appears.
2 Select Email PDF.
3 Enter the following information for the email: To, Subject, URL, select the PDF Options. Refer to the dialog help for more information.
4 Click Send Email to send a PDF email immediately or click OK to complete the scheduled email settings.
To send a full report as a scheduled report:
While viewing the full report you want to export:
1 From the WhatsUp Gold web interface, on the Report Toolbar, click the Options icon. The Report Options list appears.
2 Select Recurring Reports.
3 Enter the following information for the email: To, Subject, URL, select the PDF Options. Refer to the dialog help for more information.
4 Click Test Email to send a PDF test email immediately or click OK to complete the scheduled email settings.
Using Recurring Reports (WhatsUp Gold console) You can set up recurring reports in the WhatsUp Gold console. The reports can be sent either in the body of the email message or as an attached Archived Web Page (.mht) file. You can also use the Scheduled Reports feature to set up scheduled reports in the WhatsUp Gold web interface. The reports can be sent as .pdf document attachment. For more information, see Using Scheduled Reports: printing, exporting, and emailing reports (on page 452).
To create a new Recurring Report:
Important: Recurring reports for workspace reports that include Split Second Graphs display a user rights error. Currently, Split Second Graphs are not supported in recurring reports.
Note: Recurring reports are sent in a fixed format that cannot be modified. They may not appear as expected, depending on your email client and your email preferences. If this is the case, you can send the reports as attachments.
Note: Recurring reports of workspace reports can only be sent as attachments.
1 From the WhatsUp Gold console, select Configure > Recurring Reports. 2 On the Recurring Reports dialog, click New to create a new report.
3 On the General dialog, enter a title for the report in the Report name box.
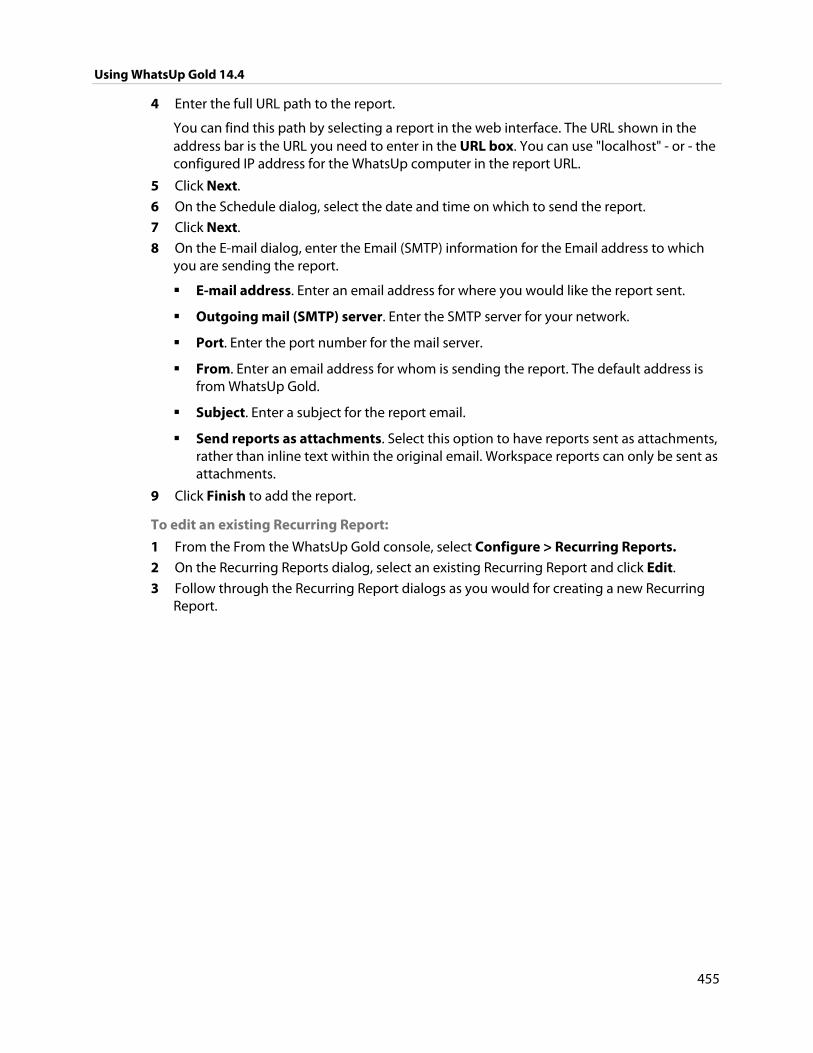
Using WhatsUp Gold 14.4
455
4 Enter the full URL path to the report.
You can find this path by selecting a report in the web interface. The URL shown in the address bar is the URL you need to enter in the URL box. You can use "localhost" - or - the configured IP address for the WhatsUp computer in the report URL.
5 Click Next.
6 On the Schedule dialog, select the date and time on which to send the report.
7 Click Next.
8 On the E-mail dialog, enter the Email (SMTP) information for the Email address to which you are sending the report.
E-mail address. Enter an email address for where you would like the report sent.
Outgoing mail (SMTP) server. Enter the SMTP server for your network.
Port. Enter the port number for the mail server.
From. Enter an email address for whom is sending the report. The default address is from WhatsUp Gold.
Subject. Enter a subject for the report email.
Send reports as attachments. Select this option to have reports sent as attachments, rather than inline text within the original email. Workspace reports can only be sent as attachments.
9 Click Finish to add the report.
To edit an existing Recurring Report:
1 From the From the WhatsUp Gold console, select Configure > Recurring Reports. 2 On the Recurring Reports dialog, select an existing Recurring Report and click Edit.
3 Follow through the Recurring Report dialogs as you would for creating a new Recurring Report.
456
APPENDIX A
Using SNMP Features
In This Chapter
SNMP overview ................................................................................................. 456
Monitoring an SNMP Service ........................................................................ 457
About the SNMP Agent or Manager .......................................................... 457
About the SNMP Management Information Base ................................ 457
About SNMP Object Names and Identifiers ............................................ 458
Using the SNMP MIB Manager ..................................................................... 459
Using the SNMP MIB Manager to troubleshoot MIB files ................... 459
About the SNMP operations ......................................................................... 462
Using a custom name for SNMP device interfaces ............................... 462
About SNMP Security ...................................................................................... 466
Using the Trap Definition Import Tool ...................................................... 466
SNMP overview
The Simple Network Management Protocol (SNMP) defines a method by which a remote user can view or change management information for a device (a host, gateway, server, etc.).
A monitoring or management application on the remote user's system uses the protocol to communicate with an SNMP agent on the device to access the management data.
The SNMP agent on each device can provide information about the device's network configuration and operations, such as the device's network interfaces, routing tables, IP packets sent and received, and IP packets lost. This information, called SNMP objects, is stored in a standard format defined in the Management Information Base (MIB). The MIB defines the SNMP objects that can be managed and the format for each object.
The SNMP protocol together with the MIB provide a standard way to view and change network management information on devices from different vendors. Any application that implements SNMP can access MIB data on a specified device. For a detailed description of SNMP, see Request for Comments (RFC) 1157. For a description of the MIB, see RFC 1213. The MIB information used by WhatsUp Gold is contained in MIB files in the MIB directory (..\Program Files\Ipswitch\WhatsUp\Data\Mibs).
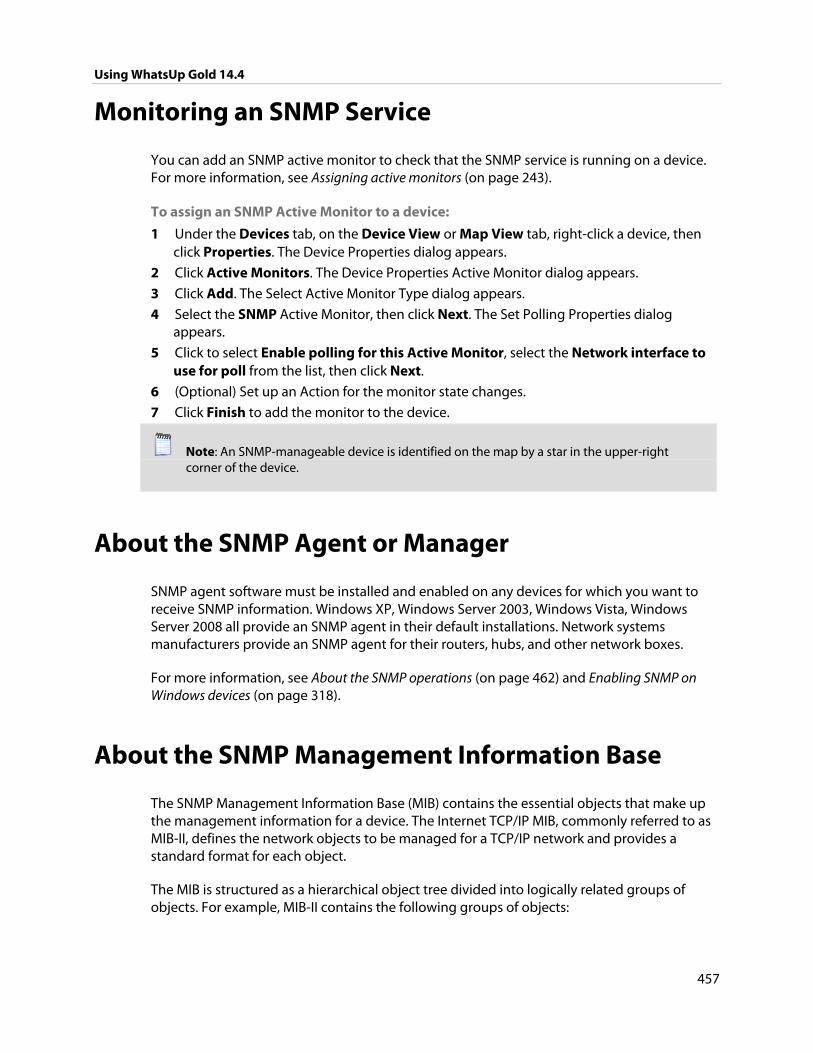
Using WhatsUp Gold 14.4
457
Monitoring an SNMP Service
You can add an SNMP active monitor to check that the SNMP service is running on a device. For more information, see Assigning active monitors (on page 243).
To assign an SNMP Active Monitor to a device:
1 Under the Devices tab, on the Device View or Map View tab, right-click a device, then click Properties. The Device Properties dialog appears.
2 Click Active Monitors. The Device Properties Active Monitor dialog appears.
3 Click Add. The Select Active Monitor Type dialog appears.
4 Select the SNMP Active Monitor, then click Next. The Set Polling Properties dialog appears.
5 Click to select Enable polling for this Active Monitor, select the Network interface to use for poll from the list, then click Next.
6 (Optional) Set up an Action for the monitor state changes.
7 Click Finish to add the monitor to the device.
Note: An SNMP-manageable device is identified on the map by a star in the upper-right corner of the device.
About the SNMP Agent or Manager
SNMP agent software must be installed and enabled on any devices for which you want to receive SNMP information. Windows XP, Windows Server 2003, Windows Vista, Windows Server 2008 all provide an SNMP agent in their default installations. Network systems manufacturers provide an SNMP agent for their routers, hubs, and other network boxes.
For more information, see About the SNMP operations (on page 462) and Enabling SNMP on Windows devices (on page 318).
About the SNMP Management Information Base
The SNMP Management Information Base (MIB) contains the essential objects that make up the management information for a device. The Internet TCP/IP MIB, commonly referred to as MIB-II, defines the network objects to be managed for a TCP/IP network and provides a standard format for each object.
The MIB is structured as a hierarchical object tree divided into logically related groups of objects. For example, MIB-II contains the following groups of objects:
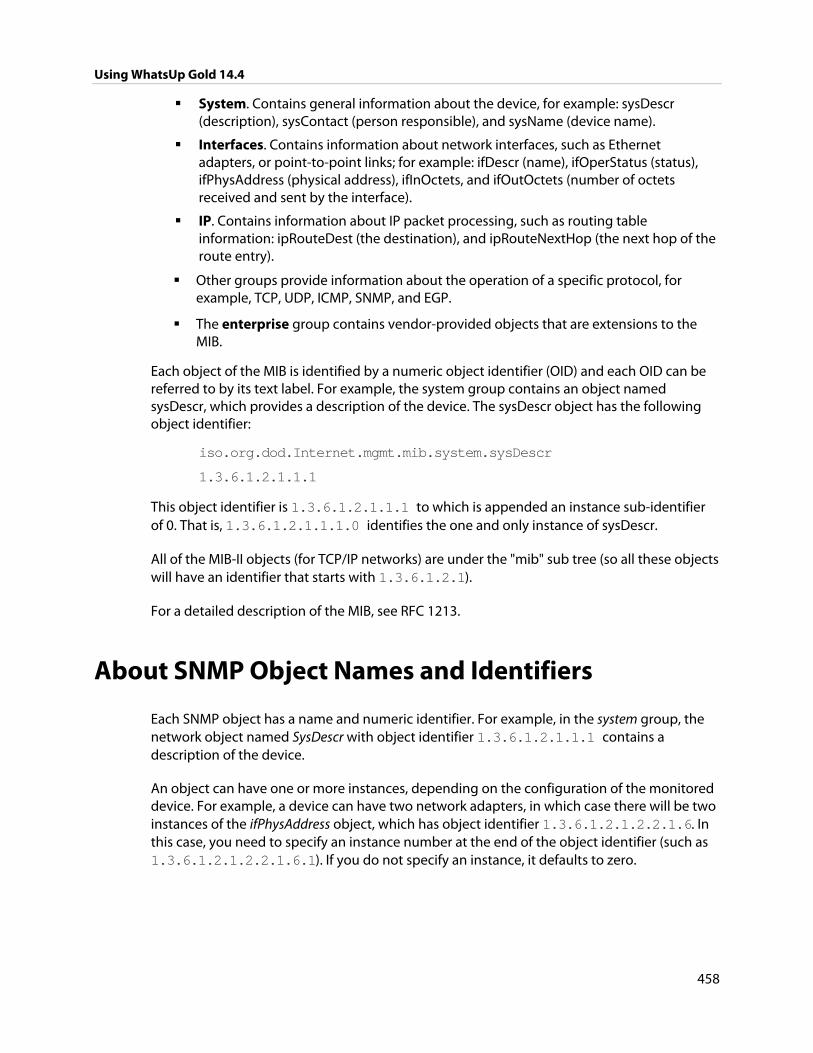
Using WhatsUp Gold 14.4
458
System. Contains general information about the device, for example: sysDescr (description), sysContact (person responsible), and sysName (device name).
Interfaces. Contains information about network interfaces, such as Ethernet adapters, or point-to-point links; for example: ifDescr (name), ifOperStatus (status), ifPhysAddress (physical address), ifInOctets, and ifOutOctets (number of octets received and sent by the interface).
IP. Contains information about IP packet processing, such as routing table information: ipRouteDest (the destination), and ipRouteNextHop (the next hop of the route entry).
Other groups provide information about the operation of a specific protocol, for example, TCP, UDP, ICMP, SNMP, and EGP.
The enterprise group contains vendor-provided objects that are extensions to the MIB.
Each object of the MIB is identified by a numeric object identifier (OID) and each OID can be referred to by its text label. For example, the system group contains an object named sysDescr, which provides a description of the device. The sysDescr object has the following object identifier:
iso.org.dod.Internet.mgmt.mib.system.sysDescr
1.3.6.1.2.1.1.1
This object identifier is 1.3.6.1.2.1.1.1 to which is appended an instance sub-identifier of 0. That is, 1.3.6.1.2.1.1.1.0 identifies the one and only instance of sysDescr.
All of the MIB-II objects (for TCP/IP networks) are under the "mib" sub tree (so all these objects will have an identifier that starts with 1.3.6.1.2.1).
For a detailed description of the MIB, see RFC 1213.
About SNMP Object Names and Identifiers
Each SNMP object has a name and numeric identifier. For example, in the system group, the network object named SysDescr with object identifier 1.3.6.1.2.1.1.1 contains a description of the device.
An object can have one or more instances, depending on the configuration of the monitored device. For example, a device can have two network adapters, in which case there will be two instances of the ifPhysAddress object, which has object identifier 1.3.6.1.2.1.2.2.1.6. In this case, you need to specify an instance number at the end of the object identifier (such as 1.3.6.1.2.1.2.2.1.6.1). If you do not specify an instance, it defaults to zero.
Using WhatsUp Gold 14.4
459
Using the SNMP MIB Manager
The SNMP MIB Manager provides a list of all of the MIB files installed in the WhatsUp Gold MIB directory. Using this tool, you can import new MIB files to the MIB Manager. SNMP MIB Manager validates imported MIB files and flags errors if there is a problem with a file.
To use the SNMP MIB Manager:
1 Go to the SNMP MIB Manager.
From the web interface, click GO. The GO menu appears.
If the WhatsUp section is not visible, click WhatsUp. The WhatsUp section of the GO menu appears.
Select Configure > SNMP MIB Manager. The SNMP MIB Manager dialog opens.
2 Use the following options in the SNMP MIB Manager:
View. Select a MIB file in the list, then click View to open the MIB and view the code.
Add. Click Add to import a MIB file to the MIB Manager. Follow the dialogs to complete the process.
Note: If you need to add a large number of MIB files, you can manually copy them to the \Program Files\Ipswitch\WhatsUp\Data\Mibs\ directory, then click Reload in the SNMP MIB Manager dialog to update and validate their status.
Reload. When you import a new MIB file or are troubleshooting code in a MIB file, click Reload to refresh the MIB Module list and the Status list.
Using the SNMP MIB Manager to troubleshoot MIB files
The SNMP MIB Manager validates all MIB files that are imported into or already exists in WhatsUp Gold. If an error is identified in a MIB file, the Status column displays the number of errors and warnings in the file. If the MIB file syntax is correct and all MIB file dependencies are fulfilled, then a check mark is displayed next to the MIB file name and a Success message displays in the Status column.
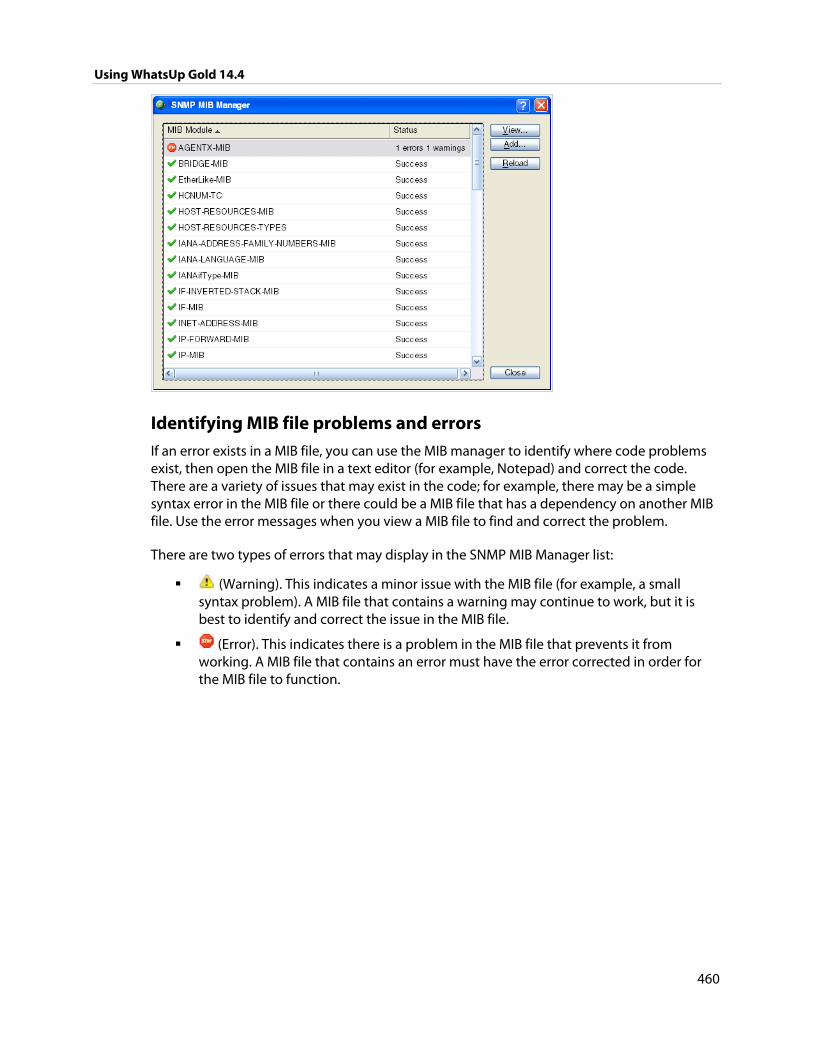
Using WhatsUp Gold 14.4
460
Identifying MIB file problems and errors If an error exists in a MIB file, you can use the MIB manager to identify where code problems exist, then open the MIB file in a text editor (for example, Notepad) and correct the code. There are a variety of issues that may exist in the code; for example, there may be a simple syntax error in the MIB file or there could be a MIB file that has a dependency on another MIB file. Use the error messages when you view a MIB file to find and correct the problem.
There are two types of errors that may display in the SNMP MIB Manager list:
(Warning). This indicates a minor issue with the MIB file (for example, a small syntax problem). A MIB file that contains a warning may continue to work, but it is best to identify and correct the issue in the MIB file.
(Error). This indicates there is a problem in the MIB file that prevents it from working. A MIB file that contains an error must have the error corrected in order for the MIB file to function.
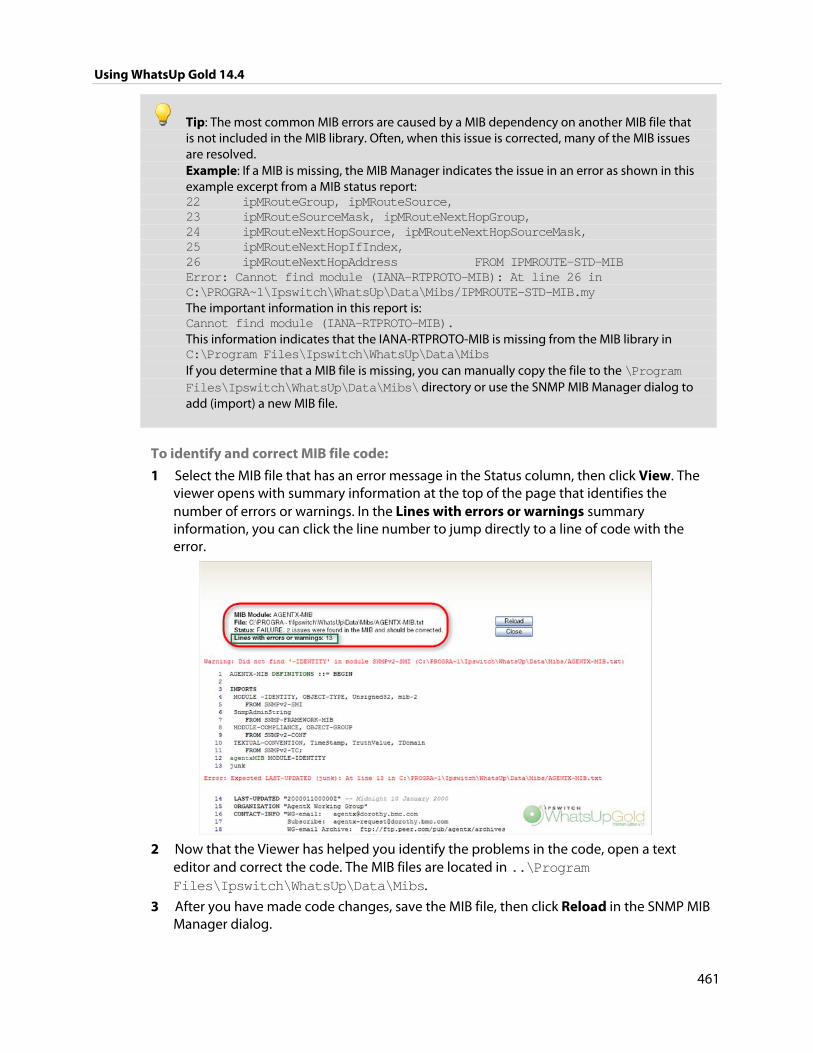
Using WhatsUp Gold 14.4
461
Tip: The most common MIB errors are caused by a MIB dependency on another MIB file that is not included in the MIB library. Often, when this issue is corrected, many of the MIB issues are resolved. Example: If a MIB is missing, the MIB Manager indicates the issue in an error as shown in this example excerpt from a MIB status report: 22 ipMRouteGroup, ipMRouteSource, 23 ipMRouteSourceMask, ipMRouteNextHopGroup, 24 ipMRouteNextHopSource, ipMRouteNextHopSourceMask, 25 ipMRouteNextHopIfIndex, 26 ipMRouteNextHopAddress FROM IPMROUTE-STD-MIB Error: Cannot find module (IANA-RTPROTO-MIB): At line 26 in C:\PROGRA~1\Ipswitch\WhatsUp\Data\Mibs/IPMROUTE-STD-MIB.my The important information in this report is: Cannot find module (IANA-RTPROTO-MIB). This information indicates that the IANA-RTPROTO-MIB is missing from the MIB library in C:\Program Files\Ipswitch\WhatsUp\Data\Mibs If you determine that a MIB file is missing, you can manually copy the file to the \Program Files\Ipswitch\WhatsUp\Data\Mibs\ directory or use the SNMP MIB Manager dialog to add (import) a new MIB file.
To identify and correct MIB file code:
1 Select the MIB file that has an error message in the Status column, then click View. The viewer opens with summary information at the top of the page that identifies the number of errors or warnings. In the Lines with errors or warnings summary information, you can click the line number to jump directly to a line of code with the error.
2 Now that the Viewer has helped you identify the problems in the code, open a text
editor and correct the code. The MIB files are located in ..\Program Files\Ipswitch\WhatsUp\Data\Mibs.
3 After you have made code changes, save the MIB file, then click Reload in the SNMP MIB Manager dialog.
Using WhatsUp Gold 14.4
462
4 Look for the MIB file, that you made changes to, in the list to determine of all the errors have been corrected. If all the errors have been corrected, click Close. If the SNMP MIB Manager dialog (validator) displays errors, continue repeating steps 1 through 3 until you have corrected all of the code issues.
About the SNMP operations
An SNMP application can read values for the SNMP objects (for monitoring of devices) and some applications can also change the variables (to provide remote management of devices). Basic SNMP operations include:
Get. Gets a specified SNMP object for a device.
Get next. Gets the next object in a table or list.
Set. Sets the value of an SNMP object on a device.
Trap. Sends a message about an event (that occurs on the device) to the management application.
The SNMP agent software on a device listens on port 161 for requests from an SNMP application. The SNMP agent and application communicate using User Datagram Protocol (UDP). Trap messages, which are unsolicited messages from a device, are sent to port 162.
Note: If an SNMP application makes a request for information about a device but an SNMP agent is not enabled on the device, the UDP packets are discarded.
Using a custom name for SNMP device interfaces
This feature lets you rename SNMP device interfaces to help you manage network interfaces more efficiently and intuitively. Without this feature you must reference device interface names, on a router for example, by their default names. Often, the device interface names are not intuitive and it is difficult to determine the specific interface you are selecting when setting up an interface utilization monitor for performance monitors and active monitors. This feature also helps you easily select the interface you want to view in interface utilization performance reports and other applicable workspace reports and split second graphs.
Configuring a custom name (ifAlias) for an SNMP device interface In order to configure a custom name (IfAlias) for a device's SNMP interface, you need to access the device configuration console and rename each interface according to your naming convention preference.

Using WhatsUp Gold 14.4
463
After the interface(s) are renamed, you can add them as performance monitors and active monitors. You can also select the custom interface in various workspace reports and split second graphs. If the device interface(s) already have performance monitors and/or active monitors set up, the new interface name displays in WhatsUp Gold accordingly.
Use the following example instructions for how to change a Cisco router interface name. If you have other devices, refer to the device documentation for instructions on how to change interface names.
To configure a device custom name for an SNMP interface on a Cisco router:
Open the Cisco Command Line Interface (CLI) and enter the following commands:
Cisco1812# configure
Cisco1812(config)# interface FastEthernet 9
Cisco1812(config-if)# description CUSTOM NAME
Cisco1812(config-if)# ^Z
Cisco1812#
To add a Performance Monitor for a newly renamed device interface:
1 On the Devices tab, in Device View or Map View, right-click a device, then click Properties. The Device Properties dialog appears.
2 Click Performance Monitors. The Performance Monitors dialog appears.
3 In the Enable global performance monitors section, click to select the Interface Utilization option, then click Configure. The Configure Interface Data Collection dialog appears.
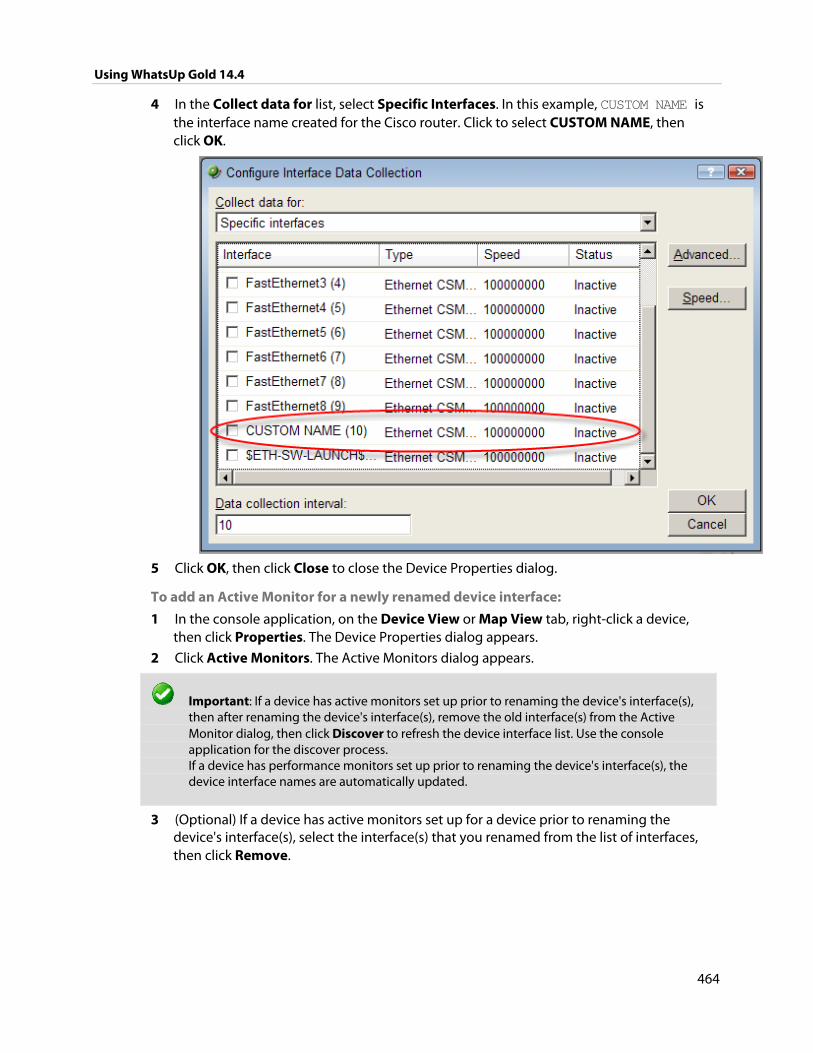
Using WhatsUp Gold 14.4
464
4 In the Collect data for list, select Specific Interfaces. In this example, CUSTOM NAME is the interface name created for the Cisco router. Click to select CUSTOM NAME, then click OK.
5 Click OK, then click Close to close the Device Properties dialog.
To add an Active Monitor for a newly renamed device interface:
1 In the console application, on the Device View or Map View tab, right-click a device, then click Properties. The Device Properties dialog appears.
2 Click Active Monitors. The Active Monitors dialog appears.
Important: If a device has active monitors set up prior to renaming the device's interface(s), then after renaming the device's interface(s), remove the old interface(s) from the Active Monitor dialog, then click Discover to refresh the device interface list. Use the console application for the discover process. If a device has performance monitors set up prior to renaming the device's interface(s), the device interface names are automatically updated.
3 (Optional) If a device has active monitors set up for a device prior to renaming the device's interface(s), select the interface(s) that you renamed from the list of interfaces, then click Remove.
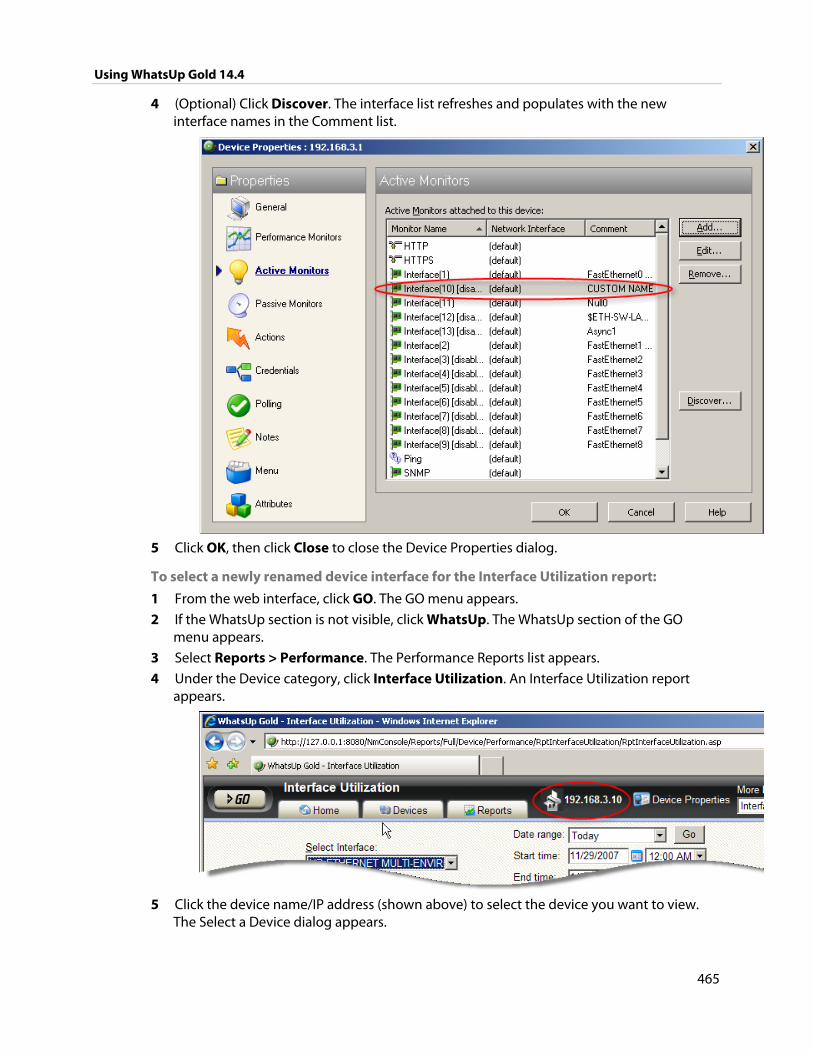
Using WhatsUp Gold 14.4
465
4 (Optional) Click Discover. The interface list refreshes and populates with the new interface names in the Comment list.
5 Click OK, then click Close to close the Device Properties dialog.
To select a newly renamed device interface for the Interface Utilization report:
1 From the web interface, click GO. The GO menu appears.
2 If the WhatsUp section is not visible, click WhatsUp. The WhatsUp section of the GO menu appears.
3 Select Reports > Performance. The Performance Reports list appears.
4 Under the Device category, click Interface Utilization. An Interface Utilization report appears.
5 Click the device name/IP address (shown above) to select the device you want to view.
The Select a Device dialog appears.
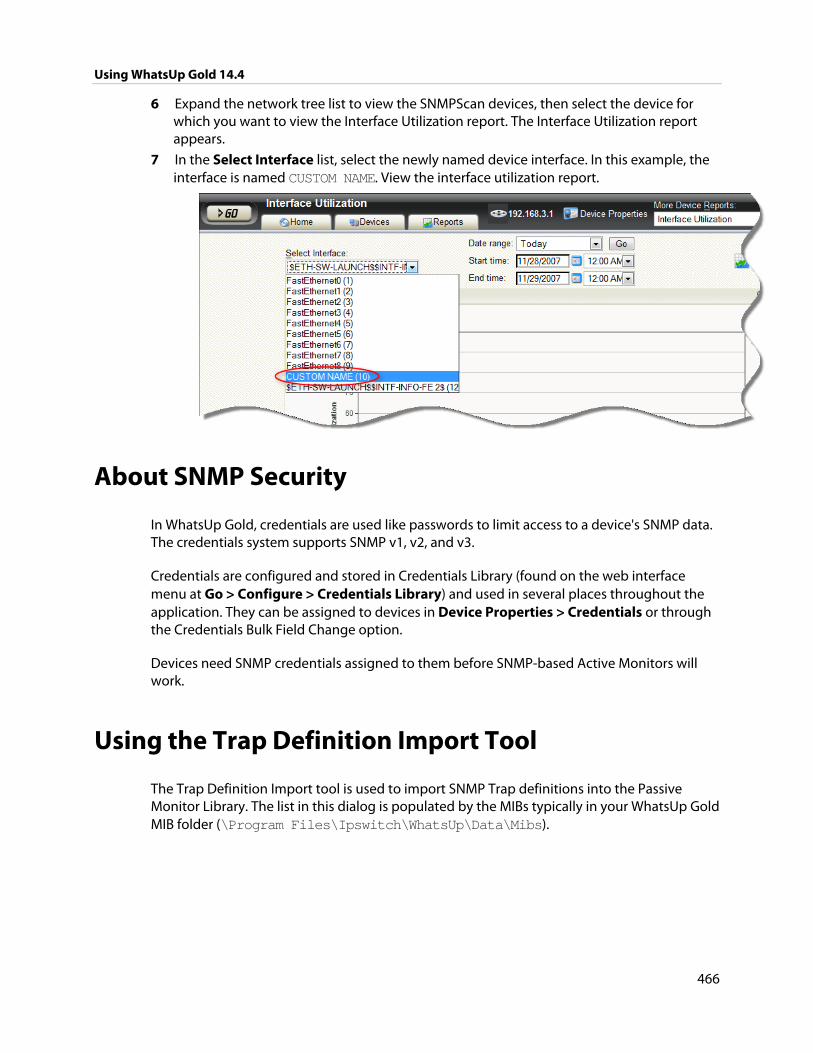
Using WhatsUp Gold 14.4
466
6 Expand the network tree list to view the SNMPScan devices, then select the device for which you want to view the Interface Utilization report. The Interface Utilization report appears.
7 In the Select Interface list, select the newly named device interface. In this example, the interface is named CUSTOM NAME. View the interface utilization report.
About SNMP Security
In WhatsUp Gold, credentials are used like passwords to limit access to a device's SNMP data. The credentials system supports SNMP v1, v2, and v3.
Credentials are configured and stored in Credentials Library (found on the web interface menu at Go > Configure > Credentials Library) and used in several places throughout the application. They can be assigned to devices in Device Properties > Credentials or through the Credentials Bulk Field Change option.
Devices need SNMP credentials assigned to them before SNMP-based Active Monitors will work.
Using the Trap Definition Import Tool
The Trap Definition Import tool is used to import SNMP Trap definitions into the Passive Monitor Library. The list in this dialog is populated by the MIBs typically in your WhatsUp Gold MIB folder (\Program Files\Ipswitch\WhatsUp\Data\Mibs).
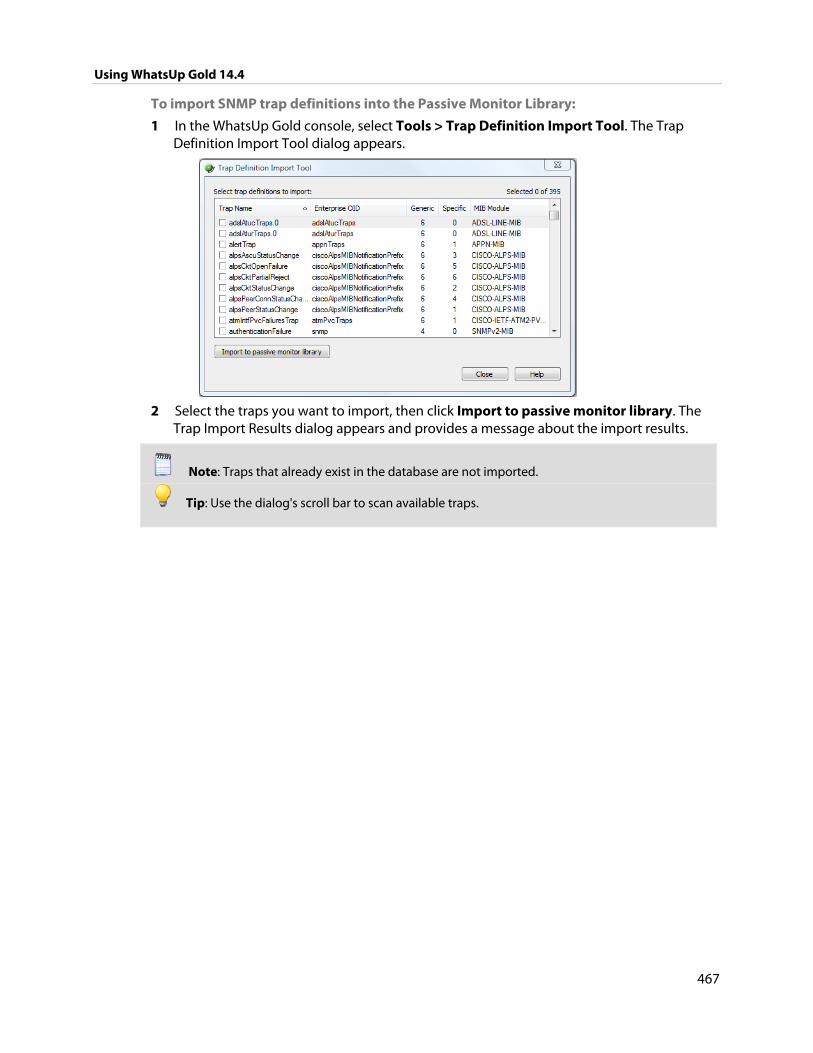
Using WhatsUp Gold 14.4
467
To import SNMP trap definitions into the Passive Monitor Library:
1 In the WhatsUp Gold console, select Tools > Trap Definition Import Tool. The Trap Definition Import Tool dialog appears.
2 Select the traps you want to import, then click Import to passive monitor library. The
Trap Import Results dialog appears and provides a message about the import results.
Note: Traps that already exist in the database are not imported.
Tip: Use the dialog's scroll bar to scan available traps.
468
APPENDIX B
Using Network Tools
In This Chapter
About Network Tools ...................................................................................... 468
Using the Ping tool .......................................................................................... 470
Using the Traceroute tool .............................................................................. 470
Using the Lookup tool .................................................................................... 471
Using the Telnet tool ....................................................................................... 472
Using the SNMP MIB Walker ......................................................................... 472
Using the SNMP MIB Explorer ...................................................................... 476
Using the MAC Address Tool ........................................................................ 477
Using the Diagnostic Tool ............................................................................. 479
Using the Web Performance Monitor ....................................................... 480
Using the Web Task Manager ...................................................................... 482
Using the database backup and restore backup utility ...................... 492
About Network Tools
WhatsUp Gold includes several network tools. These troubleshooting tools allow you to take a closer look at the status of your network devices.
Note: Network Tools are only available on the WhatsUp Gold web interface.
The following tools help you check the connectivity of networked devices:
Ping Tool (on page 470)
Trace Route Tool (on page 470)
Lookup Tool (on page 471)
Telnet Tool (on page 472)
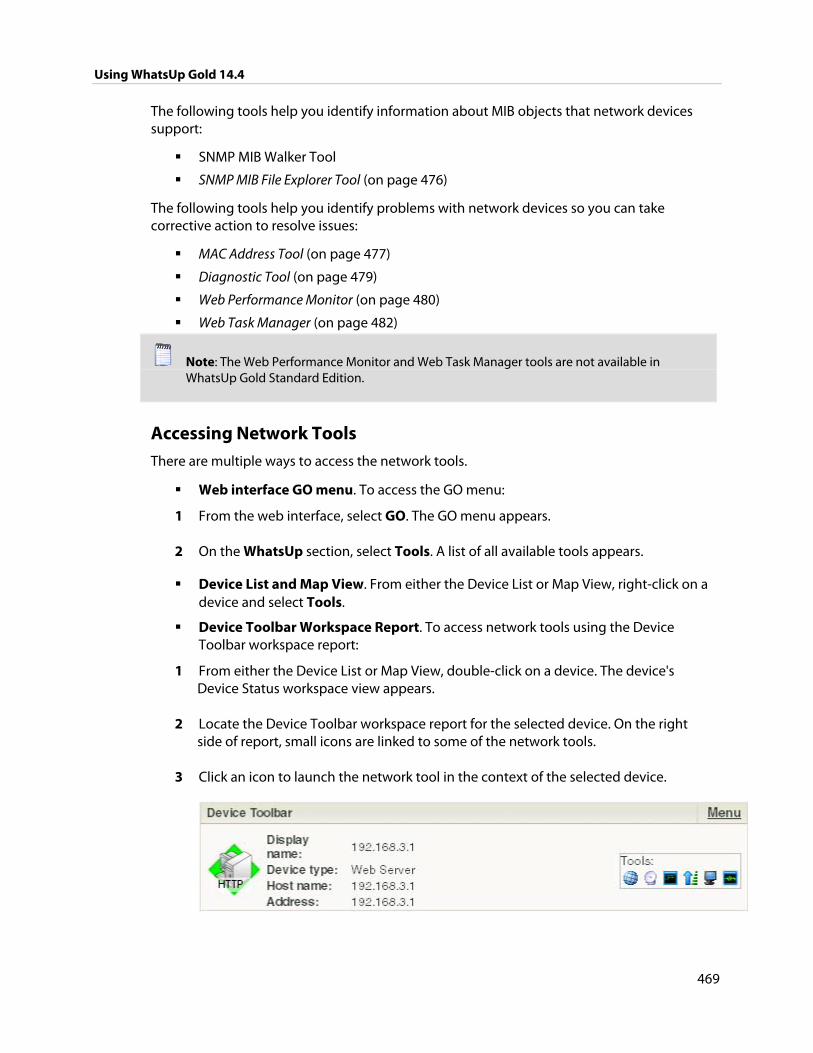
Using WhatsUp Gold 14.4
469
The following tools help you identify information about MIB objects that network devices support:
SNMP MIB Walker Tool
SNMP MIB File Explorer Tool (on page 476)
The following tools help you identify problems with network devices so you can take corrective action to resolve issues:
MAC Address Tool (on page 477)
Diagnostic Tool (on page 479)
Web Performance Monitor (on page 480)
Web Task Manager (on page 482)
Note: The Web Performance Monitor and Web Task Manager tools are not available in WhatsUp Gold Standard Edition.
Accessing Network Tools There are multiple ways to access the network tools.
Web interface GO menu. To access the GO menu:
1 From the web interface, select GO. The GO menu appears.
2 On the WhatsUp section, select Tools. A list of all available tools appears.
Device List and Map View. From either the Device List or Map View, right-click on a device and select Tools.
Device Toolbar Workspace Report. To access network tools using the Device Toolbar workspace report:
1 From either the Device List or Map View, double-click on a device. The device's Device Status workspace view appears.
2 Locate the Device Toolbar workspace report for the selected device. On the right side of report, small icons are linked to some of the network tools.
3 Click an icon to launch the network tool in the context of the selected device.
Using WhatsUp Gold 14.4
470
Using the Ping tool
The Ping tool sends out an ICMP (Internet Control Message Protocol) echo request to the networked device identified in Address/Hostname.
Tool results The results of this request appears after the request has been made.
Destination. The address specified in Address/Hostname.
Packets. The number of data packets sent, received, and lost during the device ping.
RTT. Round trip time in milliseconds; the amount of time it takes for the ping request to be returned from the remote device.
Status. Success or failure. If failure, a reason is stated for the failure. For example, "Failure: Request timed out."
To use the Ping Tool:
1 Enter or select the appropriate information in the following fields.
Address/Hostname. The target of the Ping echo request. Enter the host name or IP address of the device you want to check.
Note: The Ping tool supports IPv6 addresses.
Timeout. Enter the amount of time (in milliseconds) for the tool to wait on a response from the device. The Ping fails if this time limit is exceeded.
Count. Enter the number of data packets sent by the Ping tool.
Packet size. Enter the size (in bytes) of the packets you want the Ping tool to send. 32 bytes is the default.
2 Click Ping to run the tool.
Using the Traceroute tool
This tool sends out echo requests to a specific device, then traces the path it takes to get to that IP address or host name. This tool is often used to determine where, on the network, a data transmission interruption occurs.
Tool results The results of this request appear in the bottom of the page after the tool has run:
Result. Success or Failure. This is the general result of each hop in the Trace Route process.
Using WhatsUp Gold 14.4
471
Ping 1/2/3. The tool sends out three ping requests to each hop in the route to the device. These columns show the round trip time for each of the requests.
Address. The IP address of each device encountered on the path.
Host name. The host name of each device encountered on the path.
To use the Traceroute Tool:
1 Enter or select the appropriate information in the following fields.
Address/Host name. Enter the host name or IP address of the device you want to trace the route to.
Note: The Trace Route tool supports IPv6 addresses.
Timeout. Enter the amount of time (in milliseconds) for the tool to wait on a response from the device. The Trace Route fails if this time limit is exceeded.
Max hops. Enter the maximum number of hops you want to limit the route to. It is generally felt that 32 hops should be enough to find any device on the internet.
2 Click Traceroute to run the test.
Using the Lookup tool
This is a debugging tool that lets you query your Internet domain name system (DNS) server for information about a domain and its registered hosts. Lookup can show you what happens when an application on your network uses your DNS server to find the address of a remote host.
To use the Lookup Tool:
1 Enter or select the appropriate information in the following fields.
Address/Host name. Enter the host name or IP address of the device you want to trace the route to.
Lookup Type. Select the lookup type from the drop-down list:
A. Look up the host's Internet address from the hostname.
AAAA. Look up for the host IPv6 address from a hostname.
All. Display all available information about the host.
CNAME. Display alias names for the host.
HINFO. Display the CPU type and operating system type of the host.
MX. Display the hostname of the mail exchanger for the domain.
NS. Display the hostnames of name servers for the named zone.
PTR. Look up the hostname from the Internet address.
Using WhatsUp Gold 14.4
472
SOA. Display the domain's Start of Authority information, which indicates the primary name server for the domain and additional administrative information.
SRV. Look up any SRV record configured on this DNS server. SRV records specify the location of services on the network.
TXT. Look up any arbitrary text information the DNS server may have for this domain name or host.
ZONE. Display the zone listing for the domain. The zone listing describes the domains for which the name server is the primary name server) and lists all registered hosts in the domain.
DNS. Select the method of the look up:
Stack. Use the OS TCP/IP stack look up routines.
Default. Use the default DNS server configured on the computer WhatsUp Gold is running on.
Custom. Query a custom DNS server. You must then enter the hostname or IP address of the domain name server you want to use.
Timeout. Enter the amount of time (in milliseconds) for the tool to wait on a response from the device. The Trace Route fails if this time limit is exceeded.
2 Click Lookup to run the tool.
Using the Telnet tool
Telnet is a simple service monitor that checks for a Telnet server on port 23. If no telnet service responds on this port, then the service is considered down.
To begin the service check, click the Telnet button. Refer to the Telnet application Help for more information.
Important: The Telnet protocol handler is disabled by default in Microsoft Internet Explorer 7. To re-enable it, see Re-enabling the Telnet protocol handler (on page 541).
Using WhatsUp Gold 14.4
473
Using the SNMP MIB Walker
This network tool lets you discover, or explore in detail, the SNMP objects that a device supports and that can be monitored with WhatsUp Gold. The SNMP MIB Walker actively polls for objects. It does not require MIB files for the polled objects to be loaded.
An SNMP walk is a succession of SNMP getnext reads starting with the configured Object ID (the root of the subtree walked) until there are no next objects in the MIB subtree or until the specified number of lines in the MIB have been walked. As results return from the MIB Walker, you can click an object (node) for more detailed information about the SNMP object and to walk further down the list of objects. You can also hover the mouse cursor over a node to display SNMP object details.
To use the SNMP MIB Walker:
1 Enter or select the appropriate information in the following fields.
Address or hostname. Enter an IP address hostname for the device.
Credentials. Select the appropriate credentials for the device from the list. For more information, see Using Credentials (on page 100).
Object ID. Enter the numeric or label ID for the object for which you want information. A default OID is displayed in the box.
Filter. (Optional) Enter a filter to narrow down the search by returning only OIDs whose values match the filter criteria.
Tip: This is a regular expression, non-case-sensitive filter. For more information, see Regular Expression Syntax.
Click the Advanced button to change the value for the search timeout and retries, output types (tree, list-numeric OIDs, list-labels), and the maximum number of lines displayed.
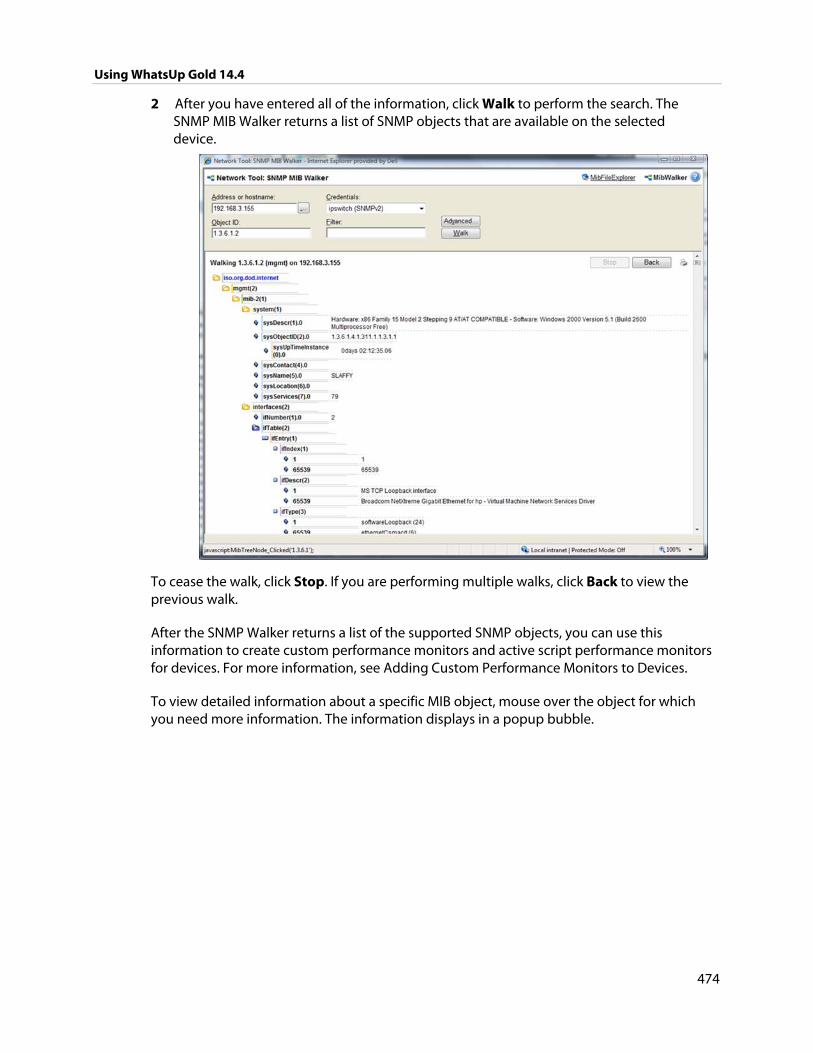
Using WhatsUp Gold 14.4
474
2 After you have entered all of the information, click Walk to perform the search. The SNMP MIB Walker returns a list of SNMP objects that are available on the selected device.
To cease the walk, click Stop. If you are performing multiple walks, click Back to view the previous walk.
After the SNMP Walker returns a list of the supported SNMP objects, you can use this information to create custom performance monitors and active script performance monitors for devices. For more information, see Adding Custom Performance Monitors to Devices.
To view detailed information about a specific MIB object, mouse over the object for which you need more information. The information displays in a popup bubble.
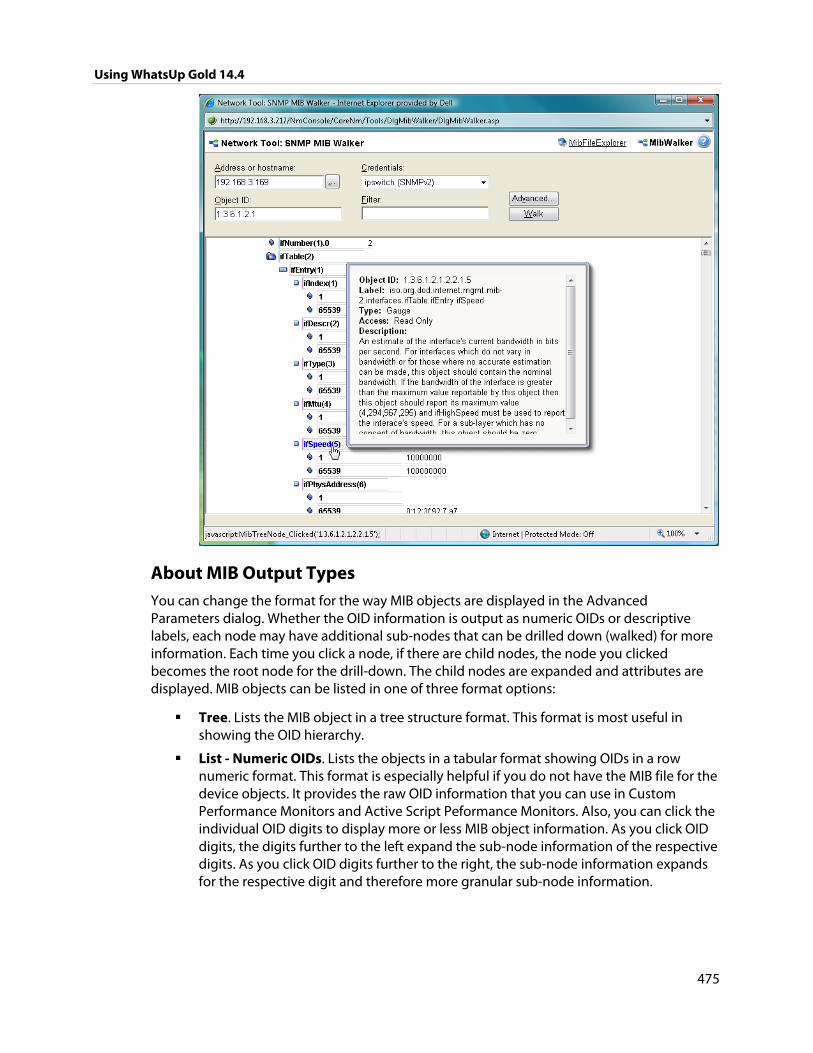
Using WhatsUp Gold 14.4
475
About MIB Output Types You can change the format for the way MIB objects are displayed in the Advanced Parameters dialog. Whether the OID information is output as numeric OIDs or descriptive labels, each node may have additional sub-nodes that can be drilled down (walked) for more information. Each time you click a node, if there are child nodes, the node you clicked becomes the root node for the drill-down. The child nodes are expanded and attributes are displayed. MIB objects can be listed in one of three format options:
Tree. Lists the MIB object in a tree structure format. This format is most useful in showing the OID hierarchy.
List - Numeric OIDs. Lists the objects in a tabular format showing OIDs in a row numeric format. This format is especially helpful if you do not have the MIB file for the device objects. It provides the raw OID information that you can use in Custom Performance Monitors and Active Script Peformance Monitors. Also, you can click the individual OID digits to display more or less MIB object information. As you click OID digits, the digits further to the left expand the sub-node information of the respective digits. As you click OID digits further to the right, the sub-node information expands for the respective digit and therefore more granular sub-node information.
Using WhatsUp Gold 14.4
476
List - Labels. Lists the objects in a tabular format with user friendly labels. If the MIB for the object is not loaded, labels will default to numeric OIDs. Click an OID label name to expand the sub-nodes and view more information.
Note: You can switch to the WhatsUp Gold MIB Explorer by clicking on the MIB Explorer link on the upper-right side of this dialog.
Using the SNMP MIB Explorer
This network tool lets you search for, or explore through, SNMP objects defined in MIB files. The MIB File Explorer has three search/explore options.
As results return from the MIB File Explorer you can click an object (node) for more detailed information about the SNMP object. You can also hover the mouse cursor over a node to display SNMP object details.
To search by object ID:
Enter an object label or object ID in the Object ID field, then click Detail.
To search by MIB module:
Select a module from the MIB Module list, then click Display.
To search objects by type or description:
First, select Type or Description from the Search Object list, then proceed appropriately:
To search by object Type:
Select a type from the list, then click Find.
To search by object Description:
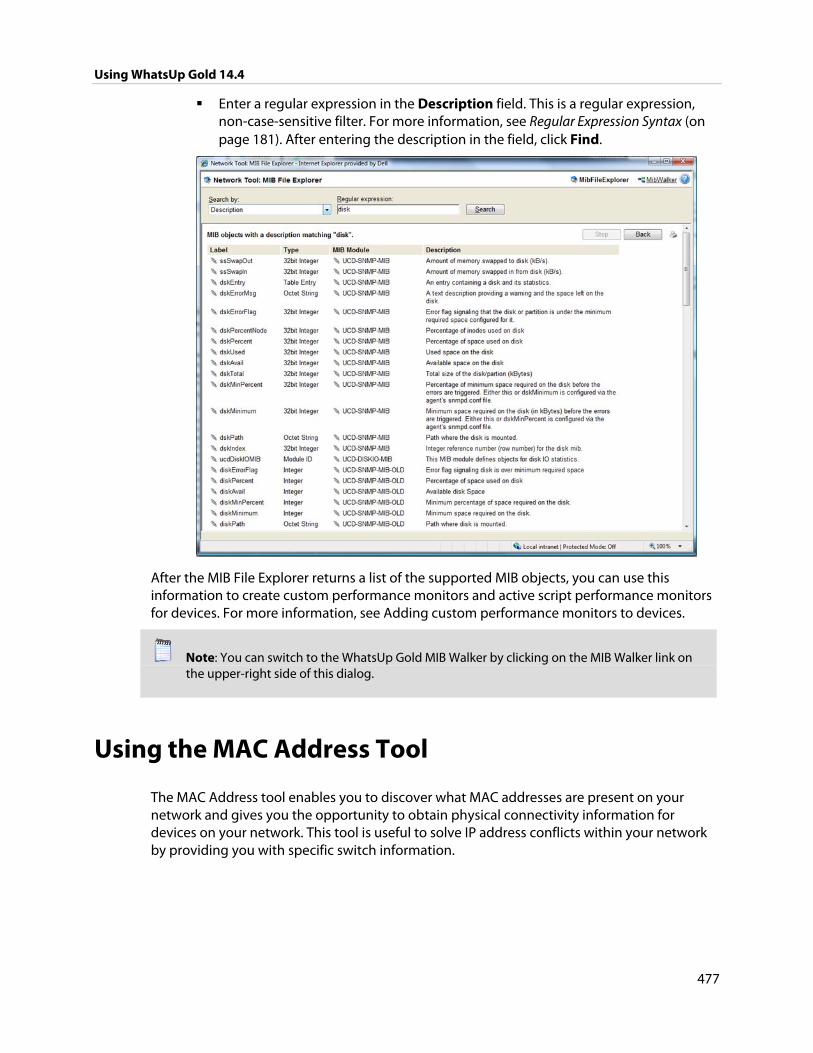
Using WhatsUp Gold 14.4
477
Enter a regular expression in the Description field. This is a regular expression, non-case-sensitive filter. For more information, see Regular Expression Syntax (on page 181). After entering the description in the field, click Find.
After the MIB File Explorer returns a list of the supported MIB objects, you can use this information to create custom performance monitors and active script performance monitors for devices. For more information, see Adding custom performance monitors to devices.
Note: You can switch to the WhatsUp Gold MIB Walker by clicking on the MIB Walker link on the upper-right side of this dialog.
Using the MAC Address Tool
The MAC Address tool enables you to discover what MAC addresses are present on your network and gives you the opportunity to obtain physical connectivity information for devices on your network. This tool is useful to solve IP address conflicts within your network by providing you with specific switch information.
Using WhatsUp Gold 14.4
478
Tool results After running the tool, the results of the test are displayed at the bottom of the page.
If Get connectivity information using SNMP is not selected when the tool is run, the results include the following columns:
IP Address. The IP addresses of devices on your network.
MAC Address. The MAC addresses of devices on your network.
Hostname. The hostnames of devices on your network.
If Get connectivity information using SNMP is selected when the tool is run, the results include the following columns:
IP Address. The IP addresses of devices on your network.
MAC Address. The MAC addresses of devices on your network.
Hostname. The hostnames of devices on your network.
Port. The port numbers of the switch ports that are connected to the devices that own the listed MAC addresses.
Index. The unique value assigned to each interface. This number typically corresponds with the interface port number.
Note: If Port and Index report values of -1, WhatsUp Gold did not understand the response from the switch or the request timed out. Verify that credentials are correct and that you can view other SNMP information from the switch, and then run the MAC Address tool again.
Description. The interface description of the interface to which a device is connected. Listed as a letter and a numeral, such as "B4". The interface description allows you to identify the physical connector on the switch.
To use the MAC Address Tool:
1 Enter or select the appropriate information in the following fields.
Local subnet. Enter the subnet on which you would like to find MAC addresses.
Get connectivity information using SNMP. If you would like switch-specific connectivity information for a device in the network, select this option. If this option is selected, the following options are enabled. If this option is cleared, the following options are disabled.
Switch IP address. Enter the switch IP address.
SNMP credential. Select the SNMP credential that you use to poll this device. If the credential you want to use is not listed, you can add it using the Credential Library.
Timeout (seconds). Enter the amount of time for the tool to wait on a response from the switch. The MAC address discovery fails if this time limit is exceeded.
Using WhatsUp Gold 14.4
479
Retries. Enter the maximum number of retries when polling the switch using SNMP.
2 Click Discover to discover the MAC addresses present on your network.
Using the Diagnostic Tool
This tool diagnoses problems within your database by running a diagnostic scan.
To use the Diagnostic Tool:
1 To begin the scan, click the Diagnostic button.
2 After you have looked over and noted any problems, click Close.
3 To print the report, click the printer icon in the upper right corner of the window. If the tool finds any problems, instructions on how to resolve the problems appear onscreen.
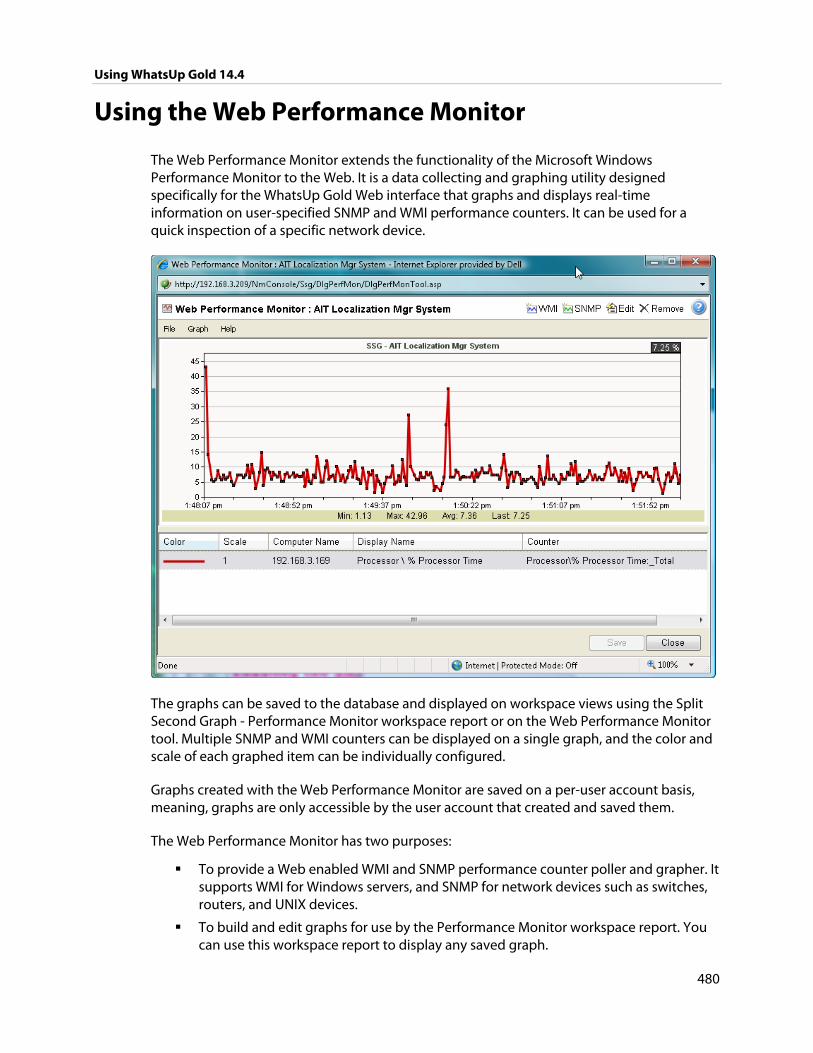
Using WhatsUp Gold 14.4
480
Using the Web Performance Monitor
The Web Performance Monitor extends the functionality of the Microsoft Windows Performance Monitor to the Web. It is a data collecting and graphing utility designed specifically for the WhatsUp Gold Web interface that graphs and displays real-time information on user-specified SNMP and WMI performance counters. It can be used for a quick inspection of a specific network device.
The graphs can be saved to the database and displayed on workspace views using the Split Second Graph - Performance Monitor workspace report or on the Web Performance Monitor tool. Multiple SNMP and WMI counters can be displayed on a single graph, and the color and scale of each graphed item can be individually configured.
Graphs created with the Web Performance Monitor are saved on a per-user account basis, meaning, graphs are only accessible by the user account that created and saved them.
The Web Performance Monitor has two purposes:
To provide a Web enabled WMI and SNMP performance counter poller and grapher. It supports WMI for Windows servers, and SNMP for network devices such as switches, routers, and UNIX devices.
To build and edit graphs for use by the Performance Monitor workspace report. You can use this workspace report to display any saved graph.
Using WhatsUp Gold 14.4
481
To add a WMI performance counter to the Web Performance Monitor:
1 Open the Web Performance Monitor.
From the web interface, click GO. The GO menu appears.
If the WhatsUp section is not visible, click WhatsUp. The WhatsUp section of the GO menu appears.
Select Tools > Web Performance Monitor. The Web Performance Monitor appears.
2 Click Graph > Add WMI Performance Monitor.
- or -
Click the WMI button in the top-right side of the dialog (see the Toolbar buttons table below). The Add WMI Performance Counter dialog appears.
3 Enter the appropriate information into the dialog fields.
4 Click OK to save changes.
To add a SNMP performance counter to the Web Performance Monitor:
1 Open the Web Performance Monitor.
From the web interface, click GO. The GO menu appears.
If the WhatsUp section is not visible, click WhatsUp. The WhatsUp section of the GO menu appears.
Select Tools > Web Performance Monitor. The Web Performance Monitor appears.
2 Select Graph > Add SNMP Performance Monitor.
- or -
Click the SNMP button in the top-right side of the dialog (see the Toolbar buttons table below).
The Add SNMP Performance Counter dialog appears.
3 Enter the appropriate information into the dialog fields.
4 Click OK to save changes.
Web Performance Monitor menu items The Web Performance Monitor menu is located at the top left corner of the window.
File menu
File > New Graph. This menu item resets the graph back to a blank graph.
File > Edit Graph Name. This menu item lets you change the name of the selected graph.
File > Load Graph. This opens the Load Graph dialog, which displays a list of saved graph files on the Web server.
File > Save Graph. This saves the current graph to the database. If no filename is specified, it launches the Save Graph dialog, which allows a filename to be specified. All files are saved to the WhatsUp database.
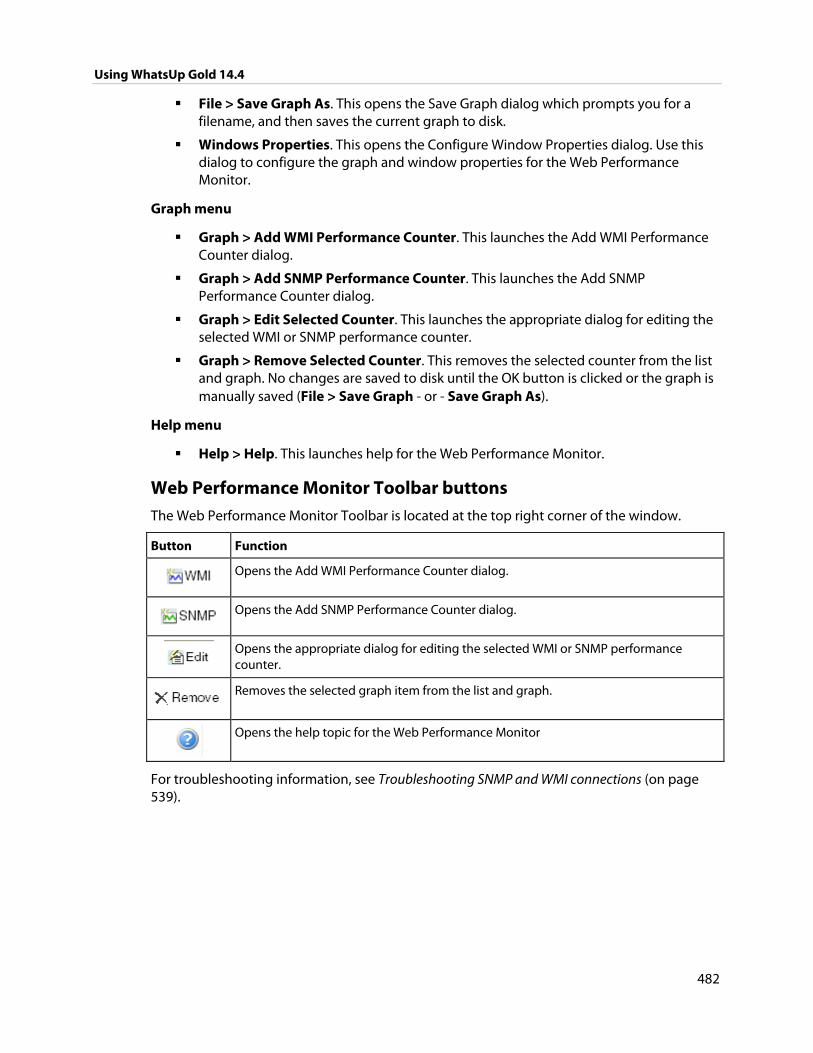
Using WhatsUp Gold 14.4
482
File > Save Graph As. This opens the Save Graph dialog which prompts you for a filename, and then saves the current graph to disk.
Windows Properties. This opens the Configure Window Properties dialog. Use this dialog to configure the graph and window properties for the Web Performance Monitor.
Graph menu
Graph > Add WMI Performance Counter. This launches the Add WMI Performance Counter dialog.
Graph > Add SNMP Performance Counter. This launches the Add SNMP Performance Counter dialog.
Graph > Edit Selected Counter. This launches the appropriate dialog for editing the selected WMI or SNMP performance counter.
Graph > Remove Selected Counter. This removes the selected counter from the list and graph. No changes are saved to disk until the OK button is clicked or the graph is manually saved (File > Save Graph - or - Save Graph As).
Help menu
Help > Help. This launches help for the Web Performance Monitor.
Web Performance Monitor Toolbar buttons The Web Performance Monitor Toolbar is located at the top right corner of the window.
Button Function
Opens the Add WMI Performance Counter dialog.
Opens the Add SNMP Performance Counter dialog.
Opens the appropriate dialog for editing the selected WMI or SNMP performance counter.
Removes the selected graph item from the list and graph.
Opens the help topic for the Web Performance Monitor
For troubleshooting information, see Troubleshooting SNMP and WMI connections (on page 539).
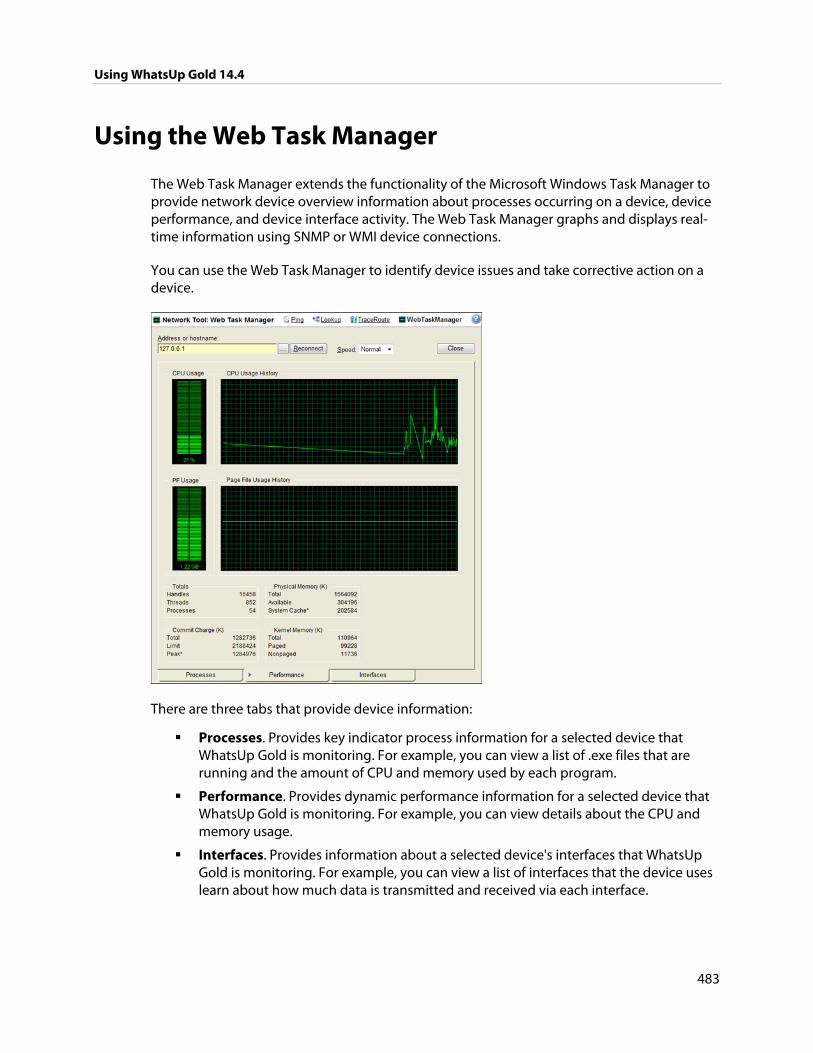
Using WhatsUp Gold 14.4
483
Using the Web Task Manager
The Web Task Manager extends the functionality of the Microsoft Windows Task Manager to provide network device overview information about processes occurring on a device, device performance, and device interface activity. The Web Task Manager graphs and displays real-time information using SNMP or WMI device connections.
You can use the Web Task Manager to identify device issues and take corrective action on a device.
There are three tabs that provide device information:
Processes. Provides key indicator process information for a selected device that WhatsUp Gold is monitoring. For example, you can view a list of .exe files that are running and the amount of CPU and memory used by each program.
Performance. Provides dynamic performance information for a selected device that WhatsUp Gold is monitoring. For example, you can view details about the CPU and memory usage.
Interfaces. Provides information about a selected device's interfaces that WhatsUp Gold is monitoring. For example, you can view a list of interfaces that the device uses learn about how much data is transmitted and received via each interface.
Using WhatsUp Gold 14.4
484
Note: When viewing information for devices running Microsoft Windows, information gathered via WMI is displayed in real time. Information gathered by SNMP, however, may reflect a delay of one minute or more. This delay is caused by a limitation in how often Microsoft Windows updates SNMP values.
To use the Web Task Manager:
1 Open the Web Task Manager.
From the web interface, click GO. The GO menu appears.
If the WhatsUp section is not visible, click WhatsUp. The WhatsUp section of the GO menu appears.
Select Tools > Web Task Manager. The Web Task Manager appears.
2 Enter or select the appropriate information for the following fields:
Address or hostname. Enter a device IP address to select a device for which you want to view process information. Click Reconnect to connect with a device that has disconnected from the Web Task Manager.
Browse (...). Click to open the Web Task Manager Credentials dialog and set a WMI user name and password or an SNMP read community. The credential options are provided from the credentials stored in the Credentials Library.
Speed. Select the speed at which you want to monitor the device performance.
Normal. Updates device information every one second.
Medium. Updates device information every five seconds.
Slow. Updates device information every ten seconds.
Paused. Stops updating device information.
Connect using. Select the device protocol (WMI or SNMP) used to monitor and manage the device. The credentials stored in the Credentials Library are used to connect and read information on the selected device.
Note: When viewing information for devices running Microsoft Windows, information gathered by SNMP may reflect a delay of one minute or more. This delay is caused by a limitation in how often Microsoft Windows updates SNMP values. For this reason, we recommend using a Speed of Medium or Slow when using SNMP to view interface information about a device running Microsoft Windows.
3 At the bottom of the Task Manager page, select the tab that you want to use (Processes, Performance, or Interfaces).
4 For troubleshooting information, see Troubleshooting SNMP and WMI connections (on page 539).
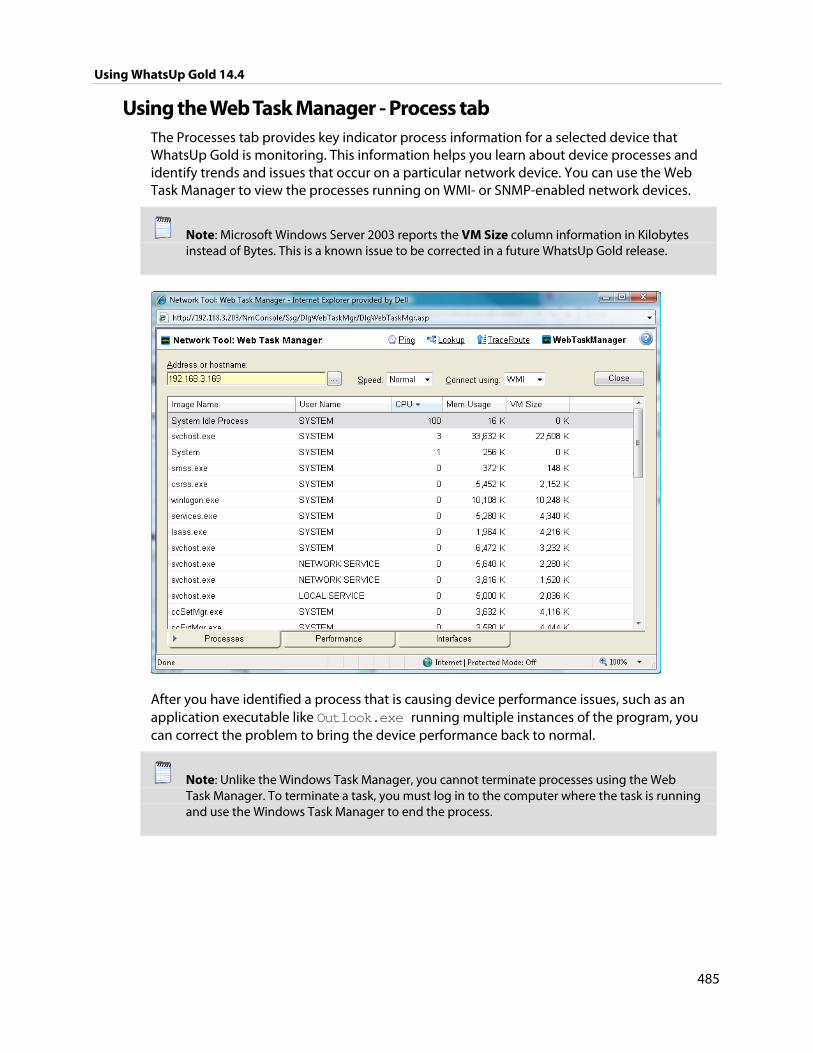
Using WhatsUp Gold 14.4
485
Using the Web Task Manager - Process tab The Processes tab provides key indicator process information for a selected device that WhatsUp Gold is monitoring. This information helps you learn about device processes and identify trends and issues that occur on a particular network device. You can use the Web Task Manager to view the processes running on WMI- or SNMP-enabled network devices.
Note: Microsoft Windows Server 2003 reports the VM Size column information in Kilobytes instead of Bytes. This is a known issue to be corrected in a future WhatsUp Gold release.
After you have identified a process that is causing device performance issues, such as an application executable like Outlook.exe running multiple instances of the program, you can correct the problem to bring the device performance back to normal.
Note: Unlike the Windows Task Manager, you cannot terminate processes using the Web Task Manager. To terminate a task, you must log in to the computer where the task is running and use the Windows Task Manager to end the process.
Using WhatsUp Gold 14.4
486
To use the Web Task Manager:
1 Open the Web Task Manager.
From the web interface, click GO. The GO menu appears.
If the WhatsUp section is not visible, click WhatsUp. The WhatsUp section of the GO menu appears.
Select Tools > Web Task Manager. The Web Task Manager appears.
2 Enter or select the appropriate information for the following fields:
Address or hostname. Enter a device IP address to select a device for which you want to view process information. Click Reconnect to connect with a device that has disconnected from the Web Task Manager.
Browse (...). Click to open the Web Task Manager Credentials dialog and set a WMI user name and password or an SNMP read community. The credential options are provided from the credentials stored in the Credentials Library.
Speed. Select the speed at which you want to monitor the device performance.
Normal. Updates device information every one second.
Medium. Updates device information every five seconds.
Slow. Updates device information every ten seconds.
Paused. Stops updating device information.
Connect using. Select the device protocol (WMI or SNMP) used to monitor and manage the device. The credentials stored in the Credentials Library are used to connect and read information on the selected device.
Note: When viewing information for devices running Microsoft Windows, information gathered by SNMP may reflect a delay of one minute or more. This delay is caused by a limitation in how often Microsoft Windows updates SNMP values. For this reason, we recommend using a Speed of Medium or Slow when using SNMP to view interface information about a device running Microsoft Windows.
3 At the bottom of the Task Manager page, select the tab that you want to use (Processes, Performance, or Interfaces).
4 For troubleshooting information, see Troubleshooting SNMP and WMI connections (on page 539).
Note: Some differences exist in column names between the Web Task Manager and Windows Task Manager in Windows Vista and Windows 2008. The Mem Usage column in Web Task Manager is named Working Set (Memory) in Windows Task Manager on Windows Vista and Windows 2008. The VM Size column in Web Task Manager has no corresponding column in Windows Task Manager on Windows Vista and Windows 2008.
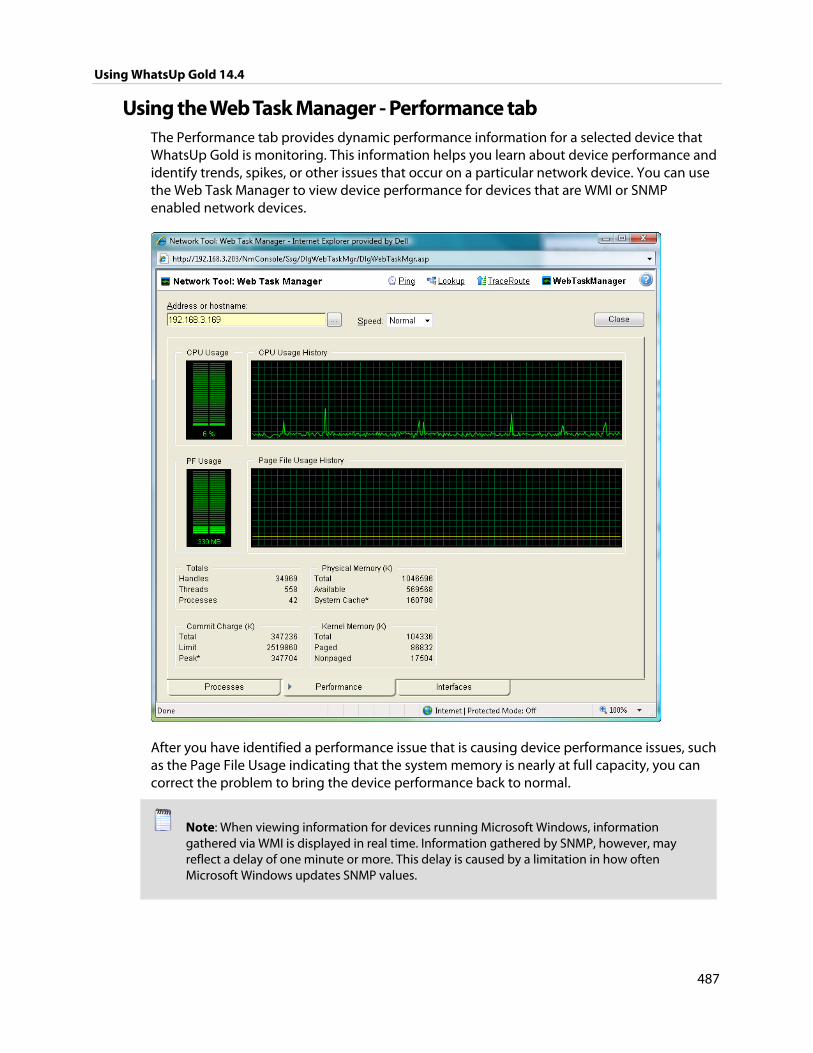
Using WhatsUp Gold 14.4
487
Using the Web Task Manager - Performance tab The Performance tab provides dynamic performance information for a selected device that WhatsUp Gold is monitoring. This information helps you learn about device performance and identify trends, spikes, or other issues that occur on a particular network device. You can use the Web Task Manager to view device performance for devices that are WMI or SNMP enabled network devices.
After you have identified a performance issue that is causing device performance issues, such as the Page File Usage indicating that the system memory is nearly at full capacity, you can correct the problem to bring the device performance back to normal.
Note: When viewing information for devices running Microsoft Windows, information gathered via WMI is displayed in real time. Information gathered by SNMP, however, may reflect a delay of one minute or more. This delay is caused by a limitation in how often Microsoft Windows updates SNMP values.
Using WhatsUp Gold 14.4
488
To use the Web Task Manager:
1 Open the Web Task Manager.
From the web interface, click GO. The GO menu appears.
If the WhatsUp section is not visible, click WhatsUp. The WhatsUp section of the GO menu appears.
Select Tools > Web Task Manager. The Web Task Manager appears.
2 Enter or select the appropriate information for the following fields:
Address or hostname. Enter a device IP address to select a device for which you want to view process information. Click Reconnect to connect with a device that has disconnected from the Web Task Manager.
Browse (...). Click to open the Web Task Manager Credentials dialog and set a WMI user name and password or an SNMP read community. The credential options are provided from the credentials stored in the Credentials Library.
Speed. Select the speed at which you want to monitor the device performance.
Normal. Updates device information every one second.
Medium. Updates device information every five seconds.
Slow. Updates device information every ten seconds.
Paused. Stops updating device information.
Connect using. Select the device protocol (WMI or SNMP) used to monitor and manage the device. The credentials stored in the Credentials Library are used to connect and read information on the selected device.
Note: When viewing information for devices running Microsoft Windows, information gathered by SNMP may reflect a delay of one minute or more. This delay is caused by a limitation in how often Microsoft Windows updates SNMP values. For this reason, we recommend using a Speed of Medium or Slow when using SNMP to view interface information about a device running Microsoft Windows.
3 At the bottom of the Task Manager page, select the tab that you want to use (Processes, Performance, or Interfaces).
4 For troubleshooting information, see Troubleshooting SNMP and WMI connections (on page 539).
The following are examples of information that is provided when you connect to and view a WMI enabled device. Note, this information varies by operating system:
CPU Usage. This graph indicates the percentage of time the processor is operating. Use this graph to view how much the processor is operating.
CPU Usage History. This graph indicates how much the processor has operated over time. You can change the Speed option (High, Normal, Slow, Paused). The Speed option determines how often updates occur to the CPU Usage History.
PF Usage. This graph indicates how much page file memory is used.
Using WhatsUp Gold 14.4
489
Page File Usage History. This graph indicates how much the page file memory is used over time. If page file memory usage is high, you may want to increase the available page file memory.
Totals. This provides the total number of Handles, Threads, and Processes occurring on the selected device.
Commit Charge (K). Provides information about the memory (Total, Limit, and Peak) allocated to the operating system and applications running on the device.
Physical Memory (K). Provides information about the amount of physical memory (Total, Available, and System Cache) installed on the device.
Kernel Memory (K). Provides information about how much memory (Total, Paged, and Nonpaged) the operating system kernel and device drivers are using.
Note: Values reported for Peak and System Cache will differ from values reported by the Windows Task Manager on the actual device. In the Web Task Manager, Peak reflects the peak value for the time that the Web Task Manager has been open only, and System Cache does not include the size of the free page list.
The following information are examples of the information that is provided when you connect to and view a SNMP enabled device. Note, this information varies by operating system:
In (PKTS). Provides detailed information about the network packets that this device receives.
Out (PKTS). Provides detailed information about the network packets that this device sends.
System. Provides general system information about CPU performance, the number of interfaces that are running on the device, the total amount of time the device has been operating in the up mode, and the version number of Cisco software running on the device (if applicable).
For troubleshooting information, see Troubleshooting SNMP and WMI connections (on page 539).
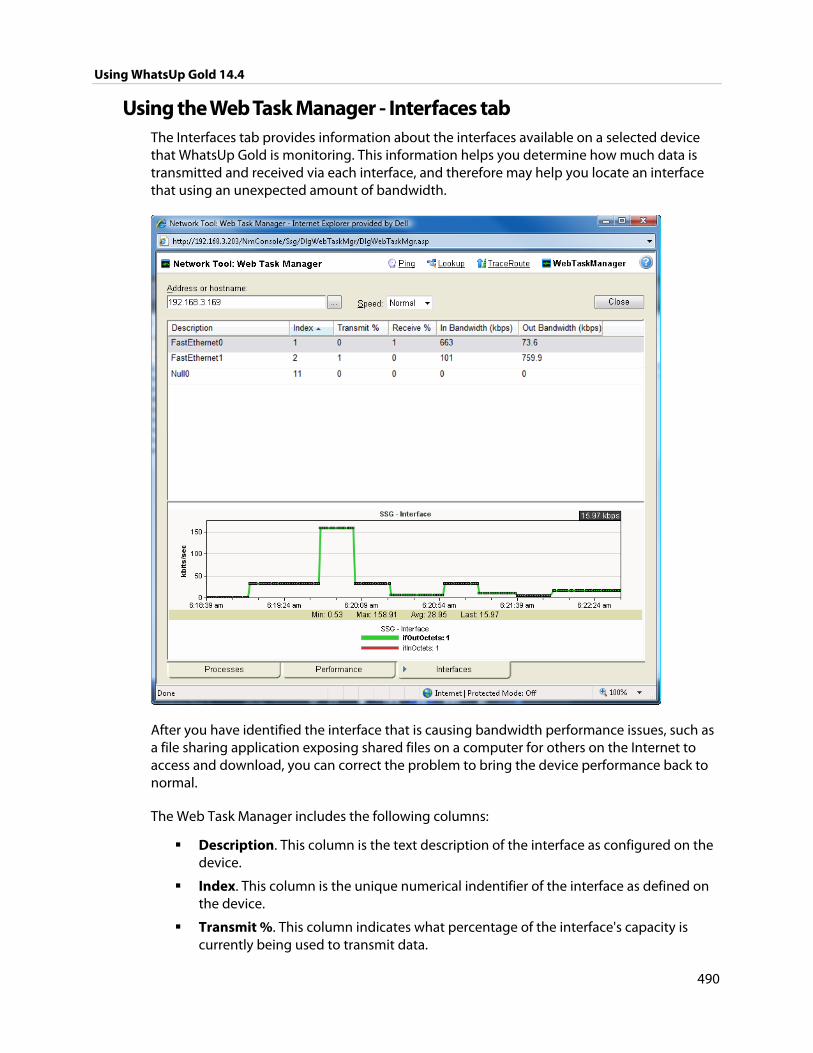
Using WhatsUp Gold 14.4
490
Using the Web Task Manager - Interfaces tab The Interfaces tab provides information about the interfaces available on a selected device that WhatsUp Gold is monitoring. This information helps you determine how much data is transmitted and received via each interface, and therefore may help you locate an interface that using an unexpected amount of bandwidth.
After you have identified the interface that is causing bandwidth performance issues, such as a file sharing application exposing shared files on a computer for others on the Internet to access and download, you can correct the problem to bring the device performance back to normal.
The Web Task Manager includes the following columns:
Description. This column is the text description of the interface as configured on the device.
Index. This column is the unique numerical indentifier of the interface as defined on the device.
Transmit %. This column indicates what percentage of the interface's capacity is currently being used to transmit data.
Using WhatsUp Gold 14.4
491
Receive %. This column indicates what percentage of the interface's capacity is currently being used to receive data.
In Bandwidth (kbps). This column shows the amount of data received by the device in kilobits per second.
Out Bandwidth (kbps). This column shows the amount of data transmitted by the device in kilobits per second.
To use the Web Task Manager:
1 Open the Web Task Manager.
From the web interface, click GO. The GO menu appears.
If the WhatsUp section is not visible, click WhatsUp. The WhatsUp section of the GO menu appears.
Select Tools > Web Task Manager. The Web Task Manager appears.
2 Enter or select the appropriate information for the following fields:
Address or hostname. Enter a device IP address to select a device for which you want to view process information. Click Reconnect to connect with a device that has disconnected from the Web Task Manager.
Browse (...). Click to open the Web Task Manager Credentials dialog and set a WMI user name and password or an SNMP read community. The credential options are provided from the credentials stored in the Credentials Library.
Speed. Select the speed at which you want to monitor the device performance.
Normal. Updates device information every one second.
Medium. Updates device information every five seconds.
Slow. Updates device information every ten seconds.
Paused. Stops updating device information.
Connect using. Select the device protocol (WMI or SNMP) used to monitor and manage the device. The credentials stored in the Credentials Library are used to connect and read information on the selected device.
Note: When viewing information for devices running Microsoft Windows, information gathered by SNMP may reflect a delay of one minute or more. This delay is caused by a limitation in how often Microsoft Windows updates SNMP values. For this reason, we recommend using a Speed of Medium or Slow when using SNMP to view interface information about a device running Microsoft Windows.
3 At the bottom of the Task Manager page, select the tab that you want to use (Processes, Performance, or Interfaces).
4 For troubleshooting information, see Troubleshooting SNMP and WMI connections (on page 539).
Using WhatsUp Gold 14.4
492
Using the database backup and restore backup utility
Through this feature, you can back up your complete WhatsUp Gold SQL Server database to any mapped directory you have on your network. The file is saved as a .bak file and can be restored at any time. Using Backup, your data is saved to a .bak file. Restore reverses this process, overwriting your current database with the data in a .bak file.
Important: Make sure that you close the Discovery Console before running a database restore. Running the Discovery Console while running a database restore could crash the console.
Important: You can use this feature with any local instance of SQL Server whose database is named WHATSUP. This feature does not work with remote databases.
If you want to back up the SQL database to a mapped drive, you may need to change the Logon settings for the SQL Server (WHATSUP) service (or your customized SQL service). The account must have write access to the mapped drive for the backup to be successful.
To change the SQL database logon settings:
1 Click Start > Control Panel > Administrative Tools > Services, then double click SQL Server (WHATSUP). The SQL Service Properties dialog appears.
2 Click the Log On tab on the Properties dialog.
3 Change the account logon settings as required.
Important: This is a complete backup and restore, so any change that you make after the backup will be overwritten if a restore process is done.
To access the Database Utilities Backup and Restore features:
From the main menu in the WhatsUp Gold console, select Tools > Database Utilities > Back Up SQL Database.
- or -
Tools > Database Utilities > Restore SQL Database.
493
APPENDIX C
Extending WhatsUp Gold with custom scripting
In This Chapter
Extending WhatsUp Gold with scripting.................................................. 493
Scripting Active Monitors .............................................................................. 494
Scripting Performance Monitors ................................................................. 511
Scripting Actions ............................................................................................... 520
Using the SNMP API ......................................................................................... 525
Extending WhatsUp Gold with scripting
This section explains how to use the native development tools included in WhatsUp Gold to extend the product beyond its stock capabilities with Active Script Active Monitors, Performance Monitors, and Actions.
WhatsUp Gold includes three types of Active Scripts, which allow you to write custom JScript and VBScript code to do tasks that WhatsUp Gold cannot natively perform.
Active Script Active Monitors perform specific customized checks on a device. They report their status as a success or failure, and the monitor's status effects the device's status in the same way that stock active monitors do. For more information, see Scripting Active Monitors (on page 494).
Active Script Performance Monitors track specific values over time and can be used to generate reports and graphs of historical data. For more information, see Scripting Performance Monitors (on page 511).
Active Script Actions can be configured to trigger when an active monitor's state changes. They can be programmed to perform a variety of tasks, from running automated remediation scripts to posting data to external, third party services via API. For more information, see Scripting Actions (on page 520).
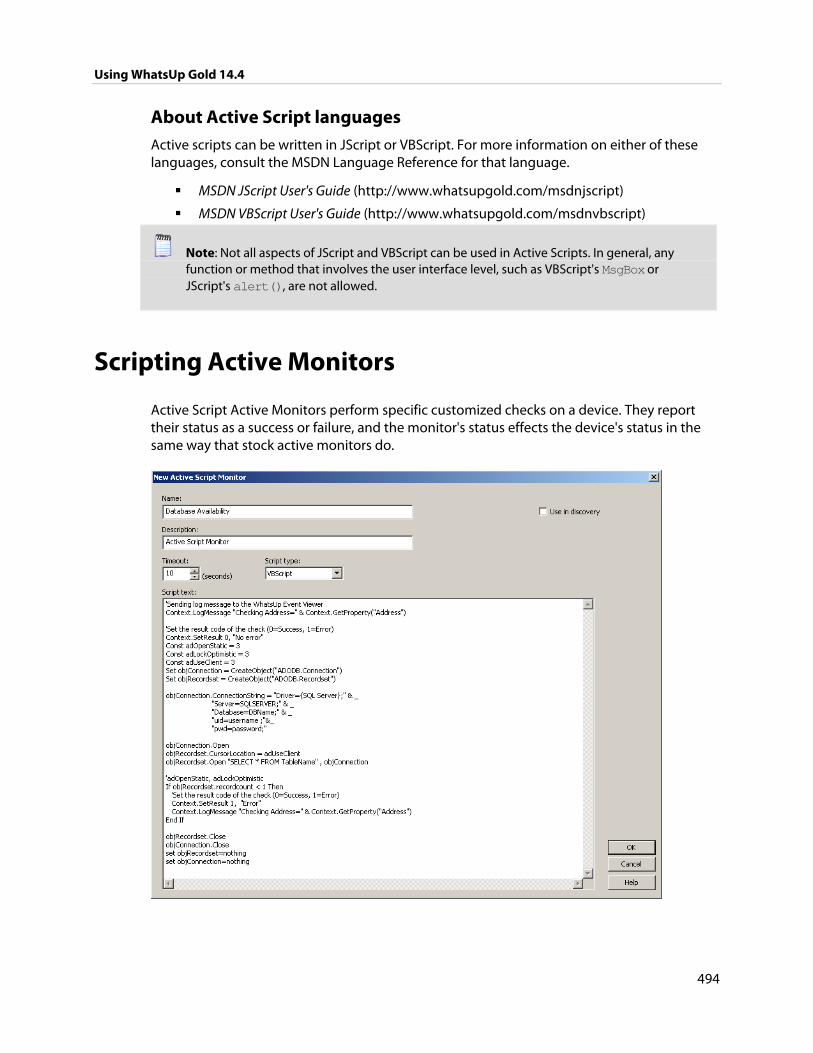
Using WhatsUp Gold 14.4
494
About Active Script languages Active scripts can be written in JScript or VBScript. For more information on either of these languages, consult the MSDN Language Reference for that language.
MSDN JScript User's Guide (http://www.whatsupgold.com/msdnjscript)
MSDN VBScript User's Guide (http://www.whatsupgold.com/msdnvbscript)
Note: Not all aspects of JScript and VBScript can be used in Active Scripts. In general, any function or method that involves the user interface level, such as VBScript's MsgBox or JScript's alert(), are not allowed.
Scripting Active Monitors
Active Script Active Monitors perform specific customized checks on a device. They report their status as a success or failure, and the monitor's status effects the device's status in the same way that stock active monitors do.
Using WhatsUp Gold 14.4
495
Keep In Mind You need to include error handling in your monitor script. You must use Context.SetResult to report the status of the script to WhatsUp Gold.
Errors from this active monitor appear in EventViewer.exe.
Using the Context object with Active Monitors The context object provides an interface for your script to interact with WhatsUp Gold.
All methods and properties are retrieved using the Context namespace.
Methods Method description
LogMessage(sText); This method allows for a message to be written to the WhatsUp Gold debug log.
Example
JScript
Context.LogMessage( "Checking Monitor name using
Context.GetProperty()");
VBScript
Context.LogMessage "Checking Address using Context.GetProperty()"
PutProperty(sPropertyName); This method allows you to store a value in the INMSerialize object. This value is retained across polls.
Example
JScript
var nCount = parselnt(nNum) +1;
Context.PutProperty("MyNumeric",nCount);
SetResult(nCode, sText); This method allows for a result code and result message to be set. This is how you can tell the WhatsUp Gold system if the monitor succeeded or not.
Every script should call SetResult. If SetResult is not called, the script is always assumed to have succeeded.
Example
JScript
Context.SetResult(0, "Script completed successfully.");
//Success
Context.SetResult(1, "An error occurred."); //Failure

Using WhatsUp Gold 14.4
496
VBScript
Context.SetResult 1, "An error occurred."
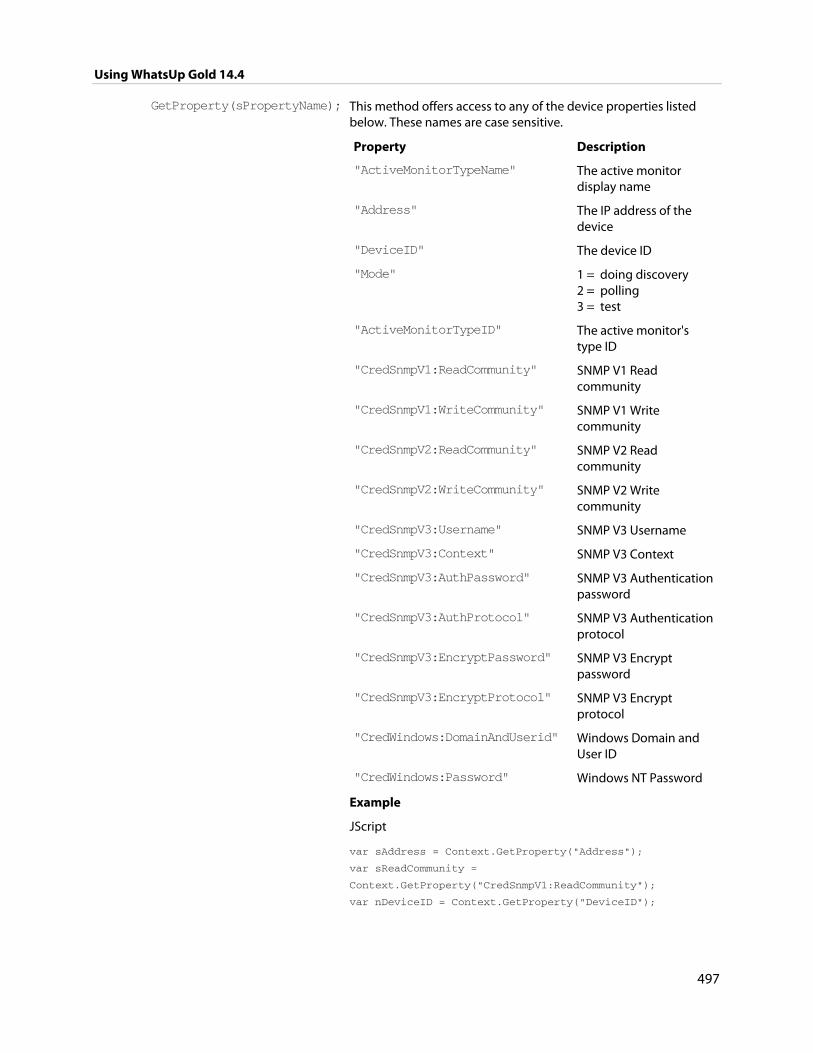
Using WhatsUp Gold 14.4
497
GetProperty(sPropertyName); This method offers access to any of the device properties listed below. These names are case sensitive.
Property Description
"ActiveMonitorTypeName" The active monitor display name
"Address" The IP address of the device
"DeviceID" The device ID
"Mode" 1 = doing discovery 2 = polling 3 = test
"ActiveMonitorTypeID" The active monitor's type ID
"CredSnmpV1:ReadCommunity" SNMP V1 Read community
"CredSnmpV1:WriteCommunity" SNMP V1 Write community
"CredSnmpV2:ReadCommunity" SNMP V2 Read community
"CredSnmpV2:WriteCommunity" SNMP V2 Write community
"CredSnmpV3:Username" SNMP V3 Username
"CredSnmpV3:Context" SNMP V3 Context
"CredSnmpV3:AuthPassword" SNMP V3 Authentication password
"CredSnmpV3:AuthProtocol" SNMP V3 Authentication protocol
"CredSnmpV3:EncryptPassword" SNMP V3 Encrypt password
"CredSnmpV3:EncryptProtocol" SNMP V3 Encrypt protocol
"CredWindows:DomainAndUserid" Windows Domain and User ID
"CredWindows:Password" Windows NT Password
Example
JScript
var sAddress = Context.GetProperty("Address");
var sReadCommunity =
Context.GetProperty("CredSnmpV1:ReadCommunity");
var nDeviceID = Context.GetProperty("DeviceID");
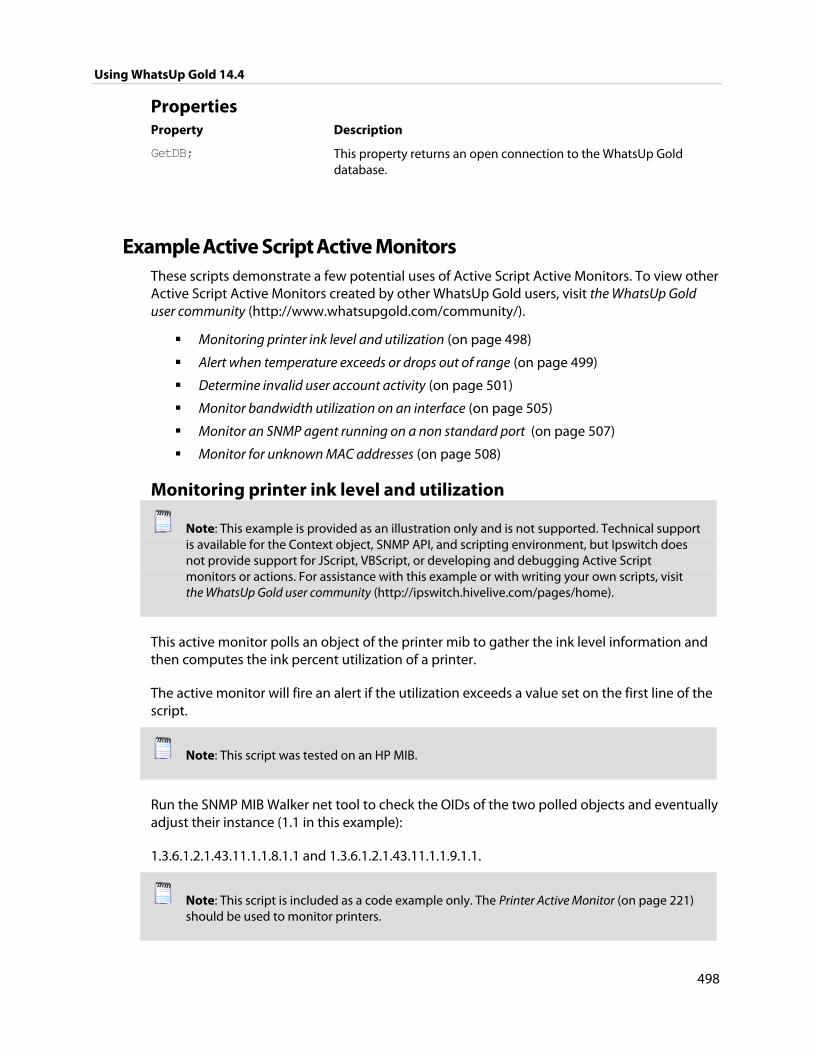
Using WhatsUp Gold 14.4
498
Properties Property Description
GetDB; This property returns an open connection to the WhatsUp Gold database.
Example Active Script Active Monitors These scripts demonstrate a few potential uses of Active Script Active Monitors. To view other Active Script Active Monitors created by other WhatsUp Gold users, visit the WhatsUp Gold user community (http://www.whatsupgold.com/community/).
Monitoring printer ink level and utilization (on page 498)
Alert when temperature exceeds or drops out of range (on page 499)
Determine invalid user account activity (on page 501)
Monitor bandwidth utilization on an interface (on page 505)
Monitor an SNMP agent running on a non standard port (on page 507)
Monitor for unknown MAC addresses (on page 508)
Monitoring printer ink level and utilization
Note: This example is provided as an illustration only and is not supported. Technical support is available for the Context object, SNMP API, and scripting environment, but Ipswitch does not provide support for JScript, VBScript, or developing and debugging Active Script monitors or actions. For assistance with this example or with writing your own scripts, visit the WhatsUp Gold user community (http://ipswitch.hivelive.com/pages/home).
This active monitor polls an object of the printer mib to gather the ink level information and then computes the ink percent utilization of a printer.
The active monitor will fire an alert if the utilization exceeds a value set on the first line of the script.
Note: This script was tested on an HP MIB.
Run the SNMP MIB Walker net tool to check the OIDs of the two polled objects and eventually adjust their instance (1.1 in this example):
1.3.6.1.2.1.43.11.1.1.8.1.1 and 1.3.6.1.2.1.43.11.1.1.9.1.1.
Note: This script is included as a code example only. The Printer Active Monitor (on page 221) should be used to monitor printers.
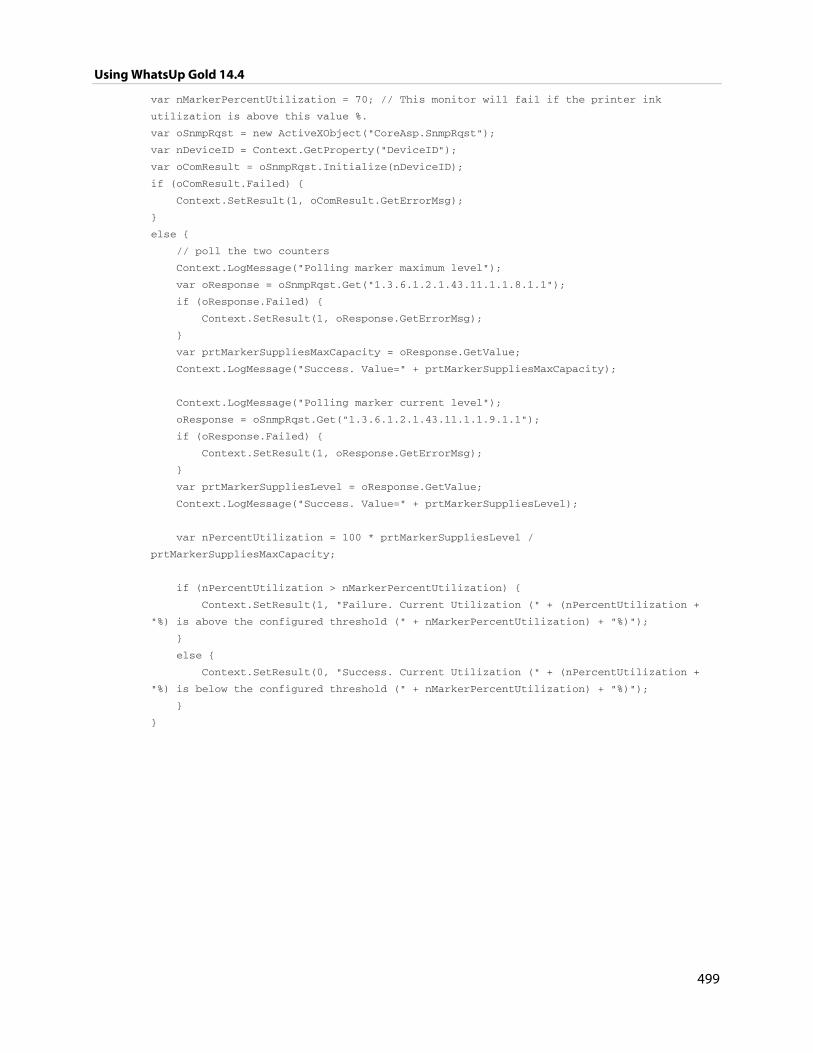
Using WhatsUp Gold 14.4
499
var nMarkerPercentUtilization = 70; // This monitor will fail if the printer ink
utilization is above this value %.
var oSnmpRqst = new ActiveXObject("CoreAsp.SnmpRqst");
var nDeviceID = Context.GetProperty("DeviceID");
var oComResult = oSnmpRqst.Initialize(nDeviceID);
if (oComResult.Failed) {
Context.SetResult(1, oComResult.GetErrorMsg);
}
else {
// poll the two counters
Context.LogMessage("Polling marker maximum level");
var oResponse = oSnmpRqst.Get("1.3.6.1.2.1.43.11.1.1.8.1.1");
if (oResponse.Failed) {
Context.SetResult(1, oResponse.GetErrorMsg);
}
var prtMarkerSuppliesMaxCapacity = oResponse.GetValue;
Context.LogMessage("Success. Value=" + prtMarkerSuppliesMaxCapacity);
Context.LogMessage("Polling marker current level");
oResponse = oSnmpRqst.Get("1.3.6.1.2.1.43.11.1.1.9.1.1");
if (oResponse.Failed) {
Context.SetResult(1, oResponse.GetErrorMsg);
}
var prtMarkerSuppliesLevel = oResponse.GetValue;
Context.LogMessage("Success. Value=" + prtMarkerSuppliesLevel);
var nPercentUtilization = 100 * prtMarkerSuppliesLevel /
prtMarkerSuppliesMaxCapacity;
if (nPercentUtilization > nMarkerPercentUtilization) {
Context.SetResult(1, "Failure. Current Utilization (" + (nPercentUtilization +
"%) is above the configured threshold (" + nMarkerPercentUtilization) + "%)");
}
else {
Context.SetResult(0, "Success. Current Utilization (" + (nPercentUtilization +
"%) is below the configured threshold (" + nMarkerPercentUtilization) + "%)");
}
}
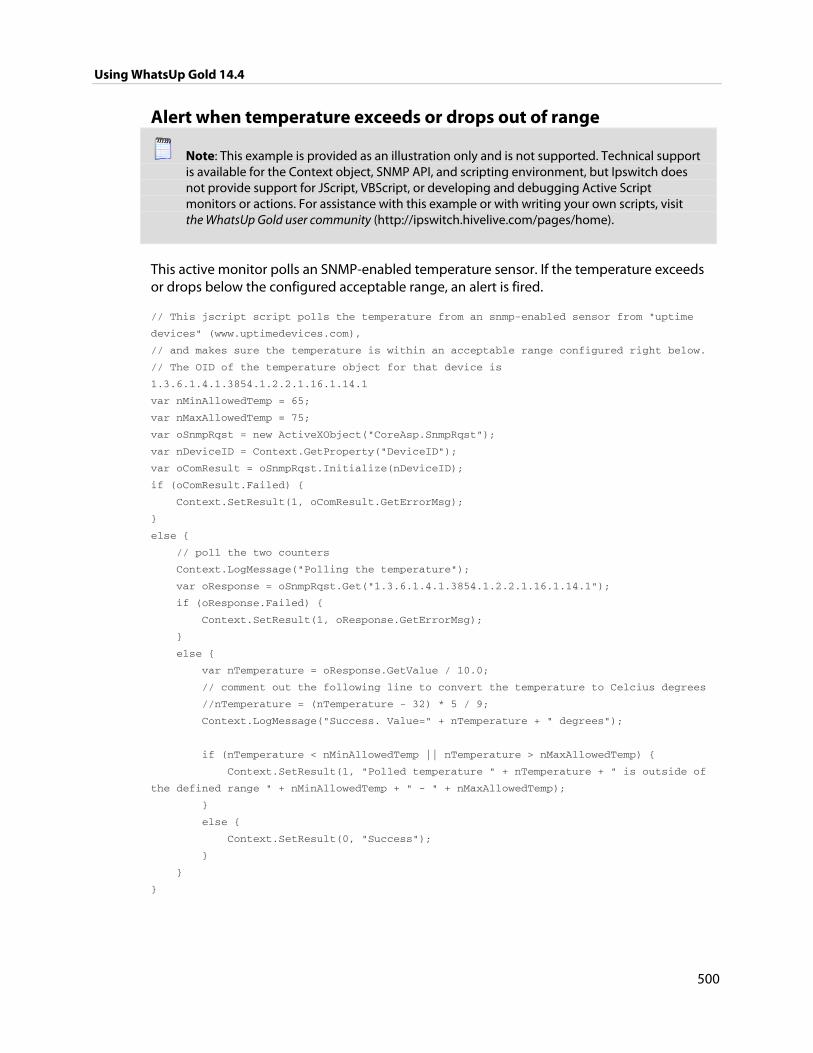
Using WhatsUp Gold 14.4
500
Alert when temperature exceeds or drops out of range
Note: This example is provided as an illustration only and is not supported. Technical support is available for the Context object, SNMP API, and scripting environment, but Ipswitch does not provide support for JScript, VBScript, or developing and debugging Active Script monitors or actions. For assistance with this example or with writing your own scripts, visit the WhatsUp Gold user community (http://ipswitch.hivelive.com/pages/home).
This active monitor polls an SNMP-enabled temperature sensor. If the temperature exceeds or drops below the configured acceptable range, an alert is fired.
// This jscript script polls the temperature from an snmp-enabled sensor from "uptime
devices" (www.uptimedevices.com),
// and makes sure the temperature is within an acceptable range configured right below.
// The OID of the temperature object for that device is
1.3.6.1.4.1.3854.1.2.2.1.16.1.14.1
var nMinAllowedTemp = 65;
var nMaxAllowedTemp = 75;
var oSnmpRqst = new ActiveXObject("CoreAsp.SnmpRqst");
var nDeviceID = Context.GetProperty("DeviceID");
var oComResult = oSnmpRqst.Initialize(nDeviceID);
if (oComResult.Failed) {
Context.SetResult(1, oComResult.GetErrorMsg);
}
else {
// poll the two counters
Context.LogMessage("Polling the temperature");
var oResponse = oSnmpRqst.Get("1.3.6.1.4.1.3854.1.2.2.1.16.1.14.1");
if (oResponse.Failed) {
Context.SetResult(1, oResponse.GetErrorMsg);
}
else {
var nTemperature = oResponse.GetValue / 10.0;
// comment out the following line to convert the temperature to Celcius degrees
//nTemperature = (nTemperature - 32) * 5 / 9;
Context.LogMessage("Success. Value=" + nTemperature + " degrees");
if (nTemperature < nMinAllowedTemp || nTemperature > nMaxAllowedTemp) {
Context.SetResult(1, "Polled temperature " + nTemperature + " is outside of
the defined range " + nMinAllowedTemp + " - " + nMaxAllowedTemp);
}
else {
Context.SetResult(0, "Success");
}
}
}
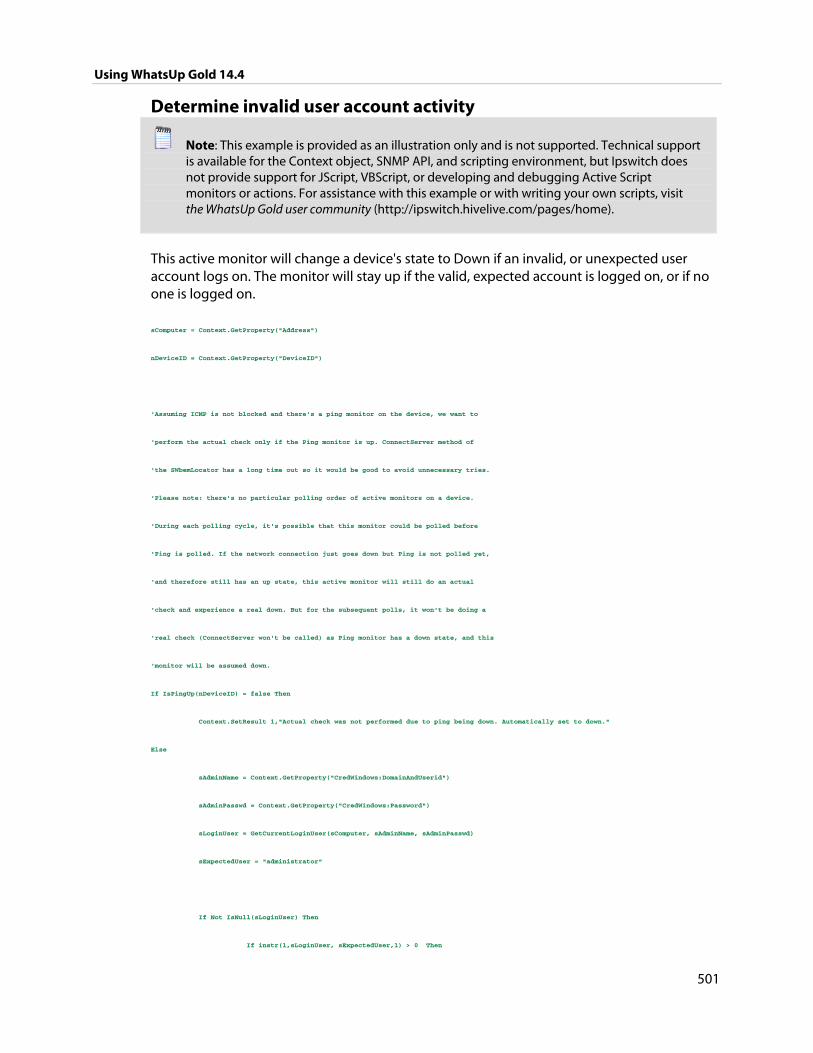
Using WhatsUp Gold 14.4
501
Determine invalid user account activity
Note: This example is provided as an illustration only and is not supported. Technical support is available for the Context object, SNMP API, and scripting environment, but Ipswitch does not provide support for JScript, VBScript, or developing and debugging Active Script monitors or actions. For assistance with this example or with writing your own scripts, visit the WhatsUp Gold user community (http://ipswitch.hivelive.com/pages/home).
This active monitor will change a device's state to Down if an invalid, or unexpected user account logs on. The monitor will stay up if the valid, expected account is logged on, or if no one is logged on.
sComputer = Context.GetProperty("Address")
nDeviceID = Context.GetProperty("DeviceID")
'Assuming ICMP is not blocked and there's a ping monitor on the device, we want to
'perform the actual check only if the Ping monitor is up. ConnectServer method of
'the SWbemLocator has a long time out so it would be good to avoid unnecessary tries.
'Please note: there's no particular polling order of active monitors on a device.
'During each polling cycle, it's possible that this monitor could be polled before
'Ping is polled. If the network connection just goes down but Ping is not polled yet,
'and therefore still has an up state, this active monitor will still do an actual
'check and experience a real down. But for the subsequent polls, it won't be doing a
'real check (ConnectServer won't be called) as Ping monitor has a down state, and this
'monitor will be assumed down.
If IsPingUp(nDeviceID) = false Then
Context.SetResult 1,"Actual check was not performed due to ping being down. Automatically set to down."
Else
sAdminName = Context.GetProperty("CredWindows:DomainAndUserid")
sAdminPasswd = Context.GetProperty("CredWindows:Password")
sLoginUser = GetCurrentLoginUser(sComputer, sAdminName, sAdminPasswd)
sExpectedUser = "administrator"
If Not IsNull(sLoginUser) Then
If instr(1,sLoginUser, sExpectedUser,1) > 0 Then
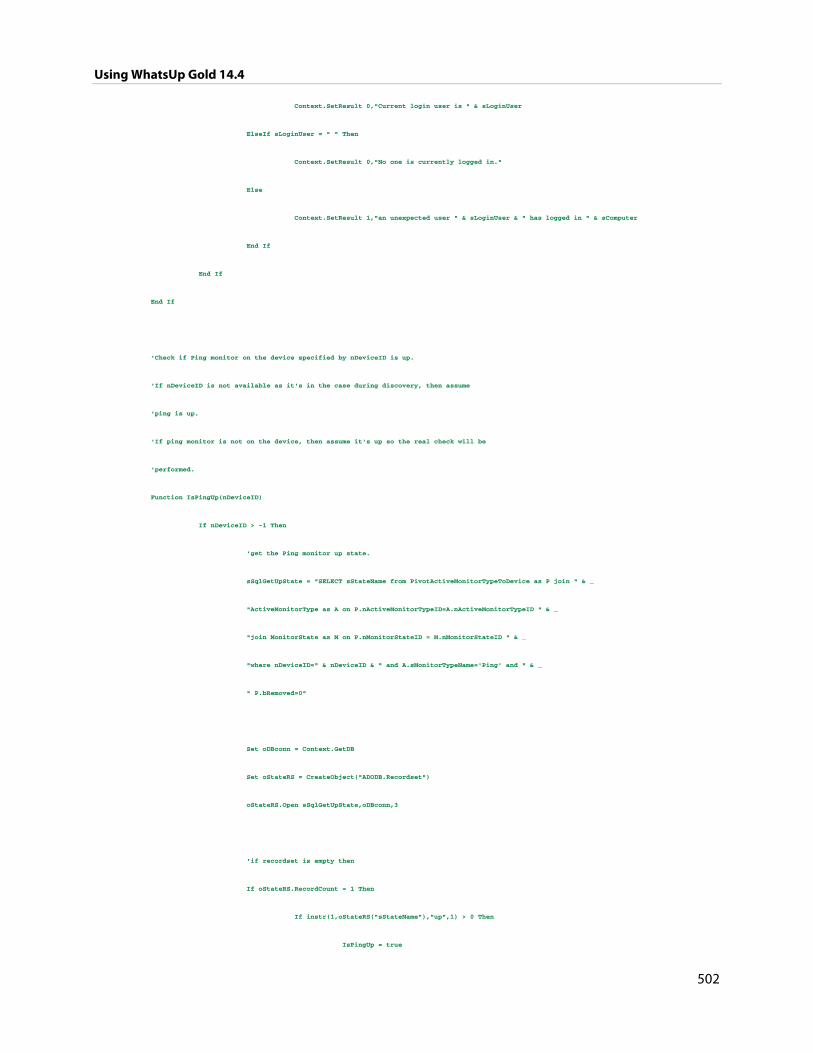
Using WhatsUp Gold 14.4
502
Context.SetResult 0,"Current login user is " & sLoginUser
ElseIf sLoginUser = " " Then
Context.SetResult 0,"No one is currently logged in."
Else
Context.SetResult 1,"an unexpected user " & sLoginUser & " has logged in " & sComputer
End If
End If
End If
'Check if Ping monitor on the device specified by nDeviceID is up.
'If nDeviceID is not available as it's in the case during discovery, then assume
'ping is up.
'If ping monitor is not on the device, then assume it's up so the real check will be
'performed.
Function IsPingUp(nDeviceID)
If nDeviceID > -1 Then
'get the Ping monitor up state.
sSqlGetUpState = "SELECT sStateName from PivotActiveMonitorTypeToDevice as P join " & _
"ActiveMonitorType as A on P.nActiveMonitorTypeID=A.nActiveMonitorTypeID " & _
"join MonitorState as M on P.nMonitorStateID = M.nMonitorStateID " & _
"where nDeviceID=" & nDeviceID & " and A.sMonitorTypeName='Ping' and " & _
" P.bRemoved=0"
Set oDBconn = Context.GetDB
Set oStateRS = CreateObject("ADODB.Recordset")
oStateRS.Open sSqlGetUpState,oDBconn,3
'if recordset is empty then
If oStateRS.RecordCount = 1 Then
If instr(1,oStateRS("sStateName"),"up",1) > 0 Then
IsPingUp = true
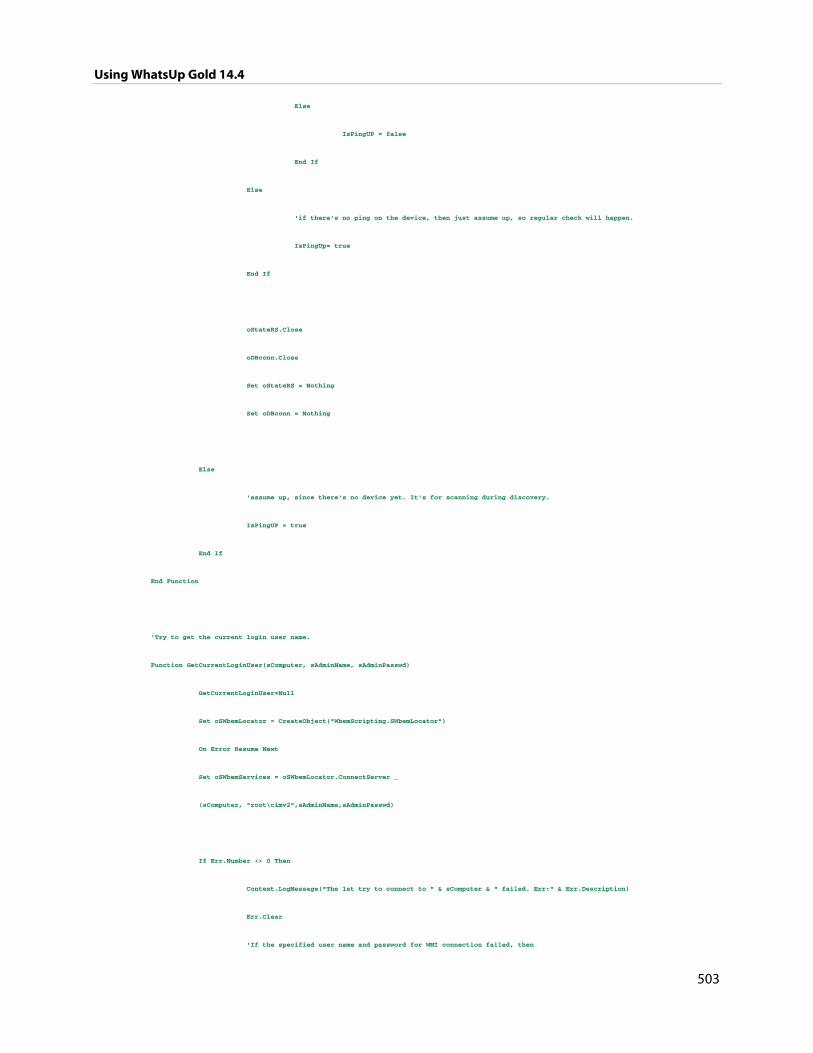
Using WhatsUp Gold 14.4
503
Else
IsPingUP = false
End If
Else
'if there's no ping on the device, then just assume up, so regular check will happen.
IsPingUp= true
End If
oStateRS.Close
oDBconn.Close
Set oStateRS = Nothing
Set oDBconn = Nothing
Else
'assume up, since there's no device yet. It's for scanning during discovery.
IsPingUP = true
End If
End Function
'Try to get the current login user name.
Function GetCurrentLoginUser(sComputer, sAdminName, sAdminPasswd)
GetCurrentLoginUser=Null
Set oSWbemLocator = CreateObject("WbemScripting.SWbemLocator")
On Error Resume Next
Set oSWbemServices = oSWbemLocator.ConnectServer _
(sComputer, "root\cimv2",sAdminName,sAdminPasswd)
If Err.Number <> 0 Then
Context.LogMessage("The 1st try to connect to " & sComputer & " failed. Err:" & Err.Description)
Err.Clear
'If the specified user name and password for WMI connection failed, then
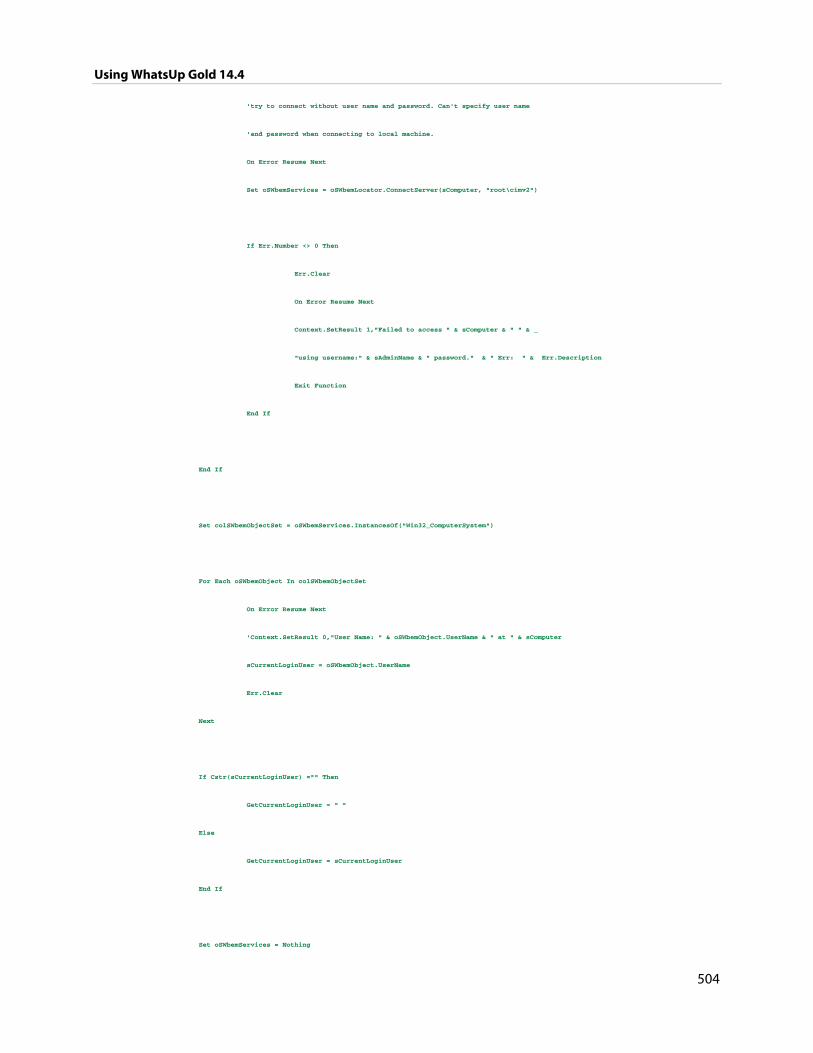
Using WhatsUp Gold 14.4
504
'try to connect without user name and password. Can't specify user name
'and password when connecting to local machine.
On Error Resume Next
Set oSWbemServices = oSWbemLocator.ConnectServer(sComputer, "root\cimv2")
If Err.Number <> 0 Then
Err.Clear
On Error Resume Next
Context.SetResult 1,"Failed to access " & sComputer & " " & _
"using username:" & sAdminName & " password." & " Err: " & Err.Description
Exit Function
End If
End If
Set colSWbemObjectSet = oSWbemServices.InstancesOf("Win32_ComputerSystem")
For Each oSWbemObject In colSWbemObjectSet
On Error Resume Next
'Context.SetResult 0,"User Name: " & oSWbemObject.UserName & " at " & sComputer
sCurrentLoginUser = oSWbemObject.UserName
Err.Clear
Next
If Cstr(sCurrentLoginUser) ="" Then
GetCurrentLoginUser = " "
Else
GetCurrentLoginUser = sCurrentLoginUser
End If
Set oSWbemServices = Nothing
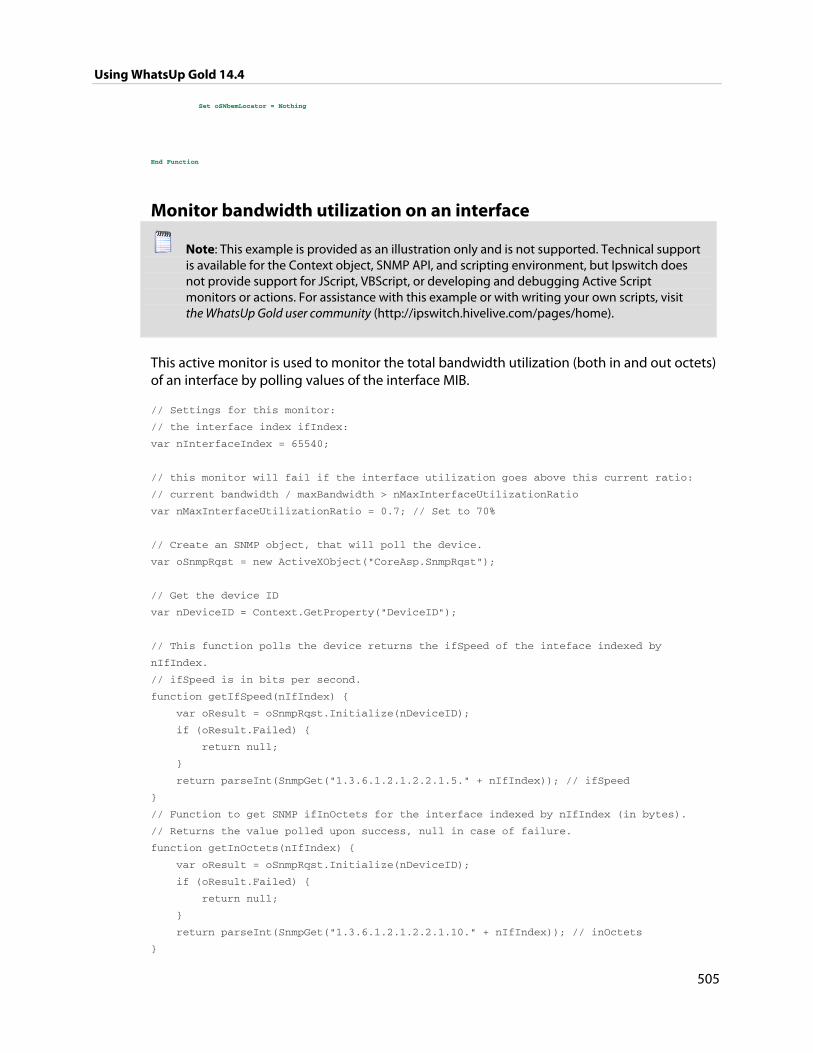
Using WhatsUp Gold 14.4
505
Set oSWbemLocator = Nothing
End Function
Monitor bandwidth utilization on an interface
Note: This example is provided as an illustration only and is not supported. Technical support is available for the Context object, SNMP API, and scripting environment, but Ipswitch does not provide support for JScript, VBScript, or developing and debugging Active Script monitors or actions. For assistance with this example or with writing your own scripts, visit the WhatsUp Gold user community (http://ipswitch.hivelive.com/pages/home).
This active monitor is used to monitor the total bandwidth utilization (both in and out octets) of an interface by polling values of the interface MIB.
// Settings for this monitor:
// the interface index ifIndex:
var nInterfaceIndex = 65540;
// this monitor will fail if the interface utilization goes above this current ratio:
// current bandwidth / maxBandwidth > nMaxInterfaceUtilizationRatio
var nMaxInterfaceUtilizationRatio = 0.7; // Set to 70%
// Create an SNMP object, that will poll the device.
var oSnmpRqst = new ActiveXObject("CoreAsp.SnmpRqst");
// Get the device ID
var nDeviceID = Context.GetProperty("DeviceID");
// This function polls the device returns the ifSpeed of the inteface indexed by
nIfIndex.
// ifSpeed is in bits per second.
function getIfSpeed(nIfIndex) {
var oResult = oSnmpRqst.Initialize(nDeviceID);
if (oResult.Failed) {
return null;
}
return parseInt(SnmpGet("1.3.6.1.2.1.2.2.1.5." + nIfIndex)); // ifSpeed
}
// Function to get SNMP ifInOctets for the interface indexed by nIfIndex (in bytes).
// Returns the value polled upon success, null in case of failure.
function getInOctets(nIfIndex) {
var oResult = oSnmpRqst.Initialize(nDeviceID);
if (oResult.Failed) {
return null;
}
return parseInt(SnmpGet("1.3.6.1.2.1.2.2.1.10." + nIfIndex)); // inOctets
}
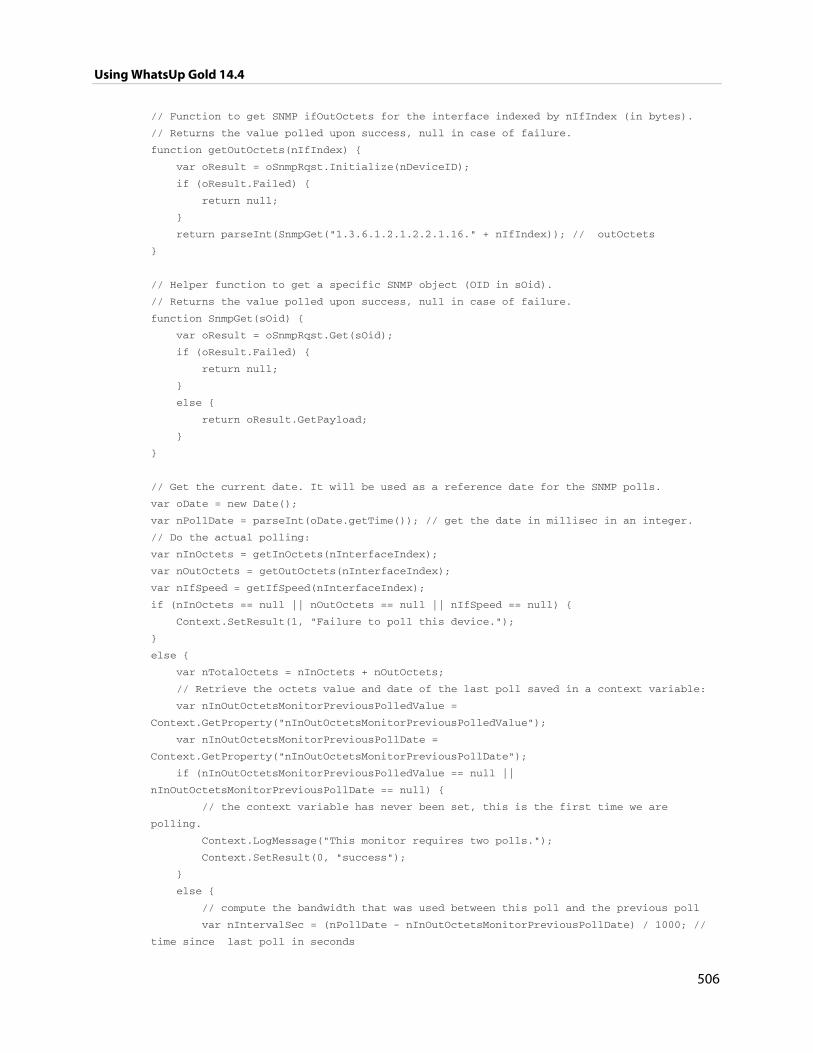
Using WhatsUp Gold 14.4
506
// Function to get SNMP ifOutOctets for the interface indexed by nIfIndex (in bytes).
// Returns the value polled upon success, null in case of failure.
function getOutOctets(nIfIndex) {
var oResult = oSnmpRqst.Initialize(nDeviceID);
if (oResult.Failed) {
return null;
}
return parseInt(SnmpGet("1.3.6.1.2.1.2.2.1.16." + nIfIndex)); // outOctets
}
// Helper function to get a specific SNMP object (OID in sOid).
// Returns the value polled upon success, null in case of failure.
function SnmpGet(sOid) {
var oResult = oSnmpRqst.Get(sOid);
if (oResult.Failed) {
return null;
}
else {
return oResult.GetPayload;
}
}
// Get the current date. It will be used as a reference date for the SNMP polls.
var oDate = new Date();
var nPollDate = parseInt(oDate.getTime()); // get the date in millisec in an integer.
// Do the actual polling:
var nInOctets = getInOctets(nInterfaceIndex);
var nOutOctets = getOutOctets(nInterfaceIndex);
var nIfSpeed = getIfSpeed(nInterfaceIndex);
if (nInOctets == null || nOutOctets == null || nIfSpeed == null) {
Context.SetResult(1, "Failure to poll this device.");
}
else {
var nTotalOctets = nInOctets + nOutOctets;
// Retrieve the octets value and date of the last poll saved in a context variable:
var nInOutOctetsMonitorPreviousPolledValue =
Context.GetProperty("nInOutOctetsMonitorPreviousPolledValue");
var nInOutOctetsMonitorPreviousPollDate =
Context.GetProperty("nInOutOctetsMonitorPreviousPollDate");
if (nInOutOctetsMonitorPreviousPolledValue == null ||
nInOutOctetsMonitorPreviousPollDate == null) {
// the context variable has never been set, this is the first time we are
polling.
Context.LogMessage("This monitor requires two polls.");
Context.SetResult(0, "success");
}
else {
// compute the bandwidth that was used between this poll and the previous poll
var nIntervalSec = (nPollDate - nInOutOctetsMonitorPreviousPollDate) / 1000; //
time since last poll in seconds
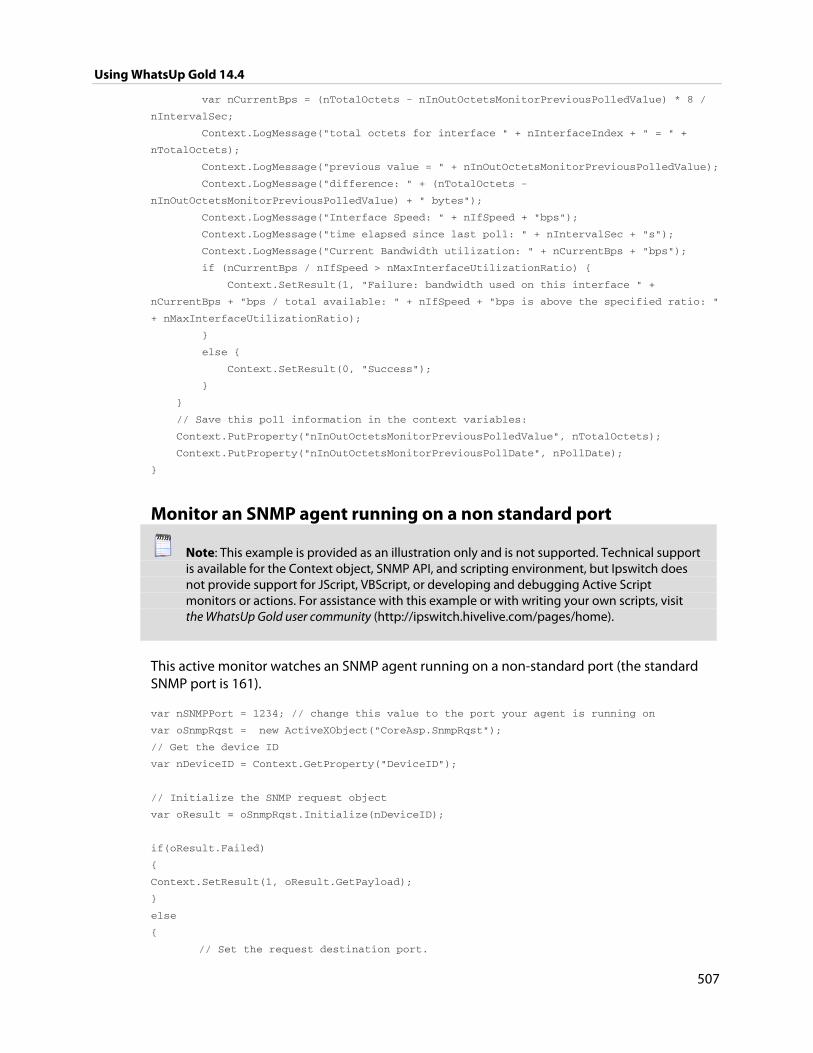
Using WhatsUp Gold 14.4
507
var nCurrentBps = (nTotalOctets - nInOutOctetsMonitorPreviousPolledValue) * 8 /
nIntervalSec;
Context.LogMessage("total octets for interface " + nInterfaceIndex + " = " +
nTotalOctets);
Context.LogMessage("previous value = " + nInOutOctetsMonitorPreviousPolledValue);
Context.LogMessage("difference: " + (nTotalOctets -
nInOutOctetsMonitorPreviousPolledValue) + " bytes");
Context.LogMessage("Interface Speed: " + nIfSpeed + "bps");
Context.LogMessage("time elapsed since last poll: " + nIntervalSec + "s");
Context.LogMessage("Current Bandwidth utilization: " + nCurrentBps + "bps");
if (nCurrentBps / nIfSpeed > nMaxInterfaceUtilizationRatio) {
Context.SetResult(1, "Failure: bandwidth used on this interface " +
nCurrentBps + "bps / total available: " + nIfSpeed + "bps is above the specified ratio: "
+ nMaxInterfaceUtilizationRatio);
}
else {
Context.SetResult(0, "Success");
}
}
// Save this poll information in the context variables:
Context.PutProperty("nInOutOctetsMonitorPreviousPolledValue", nTotalOctets);
Context.PutProperty("nInOutOctetsMonitorPreviousPollDate", nPollDate);
}
Monitor an SNMP agent running on a non standard port
Note: This example is provided as an illustration only and is not supported. Technical support is available for the Context object, SNMP API, and scripting environment, but Ipswitch does not provide support for JScript, VBScript, or developing and debugging Active Script monitors or actions. For assistance with this example or with writing your own scripts, visit the WhatsUp Gold user community (http://ipswitch.hivelive.com/pages/home).
This active monitor watches an SNMP agent running on a non-standard port (the standard SNMP port is 161).
var nSNMPPort = 1234; // change this value to the port your agent is running on
var oSnmpRqst = new ActiveXObject("CoreAsp.SnmpRqst");
// Get the device ID
var nDeviceID = Context.GetProperty("DeviceID");
// Initialize the SNMP request object
var oResult = oSnmpRqst.Initialize(nDeviceID);
if(oResult.Failed)
{
Context.SetResult(1, oResult.GetPayload);
}
else
{
// Set the request destination port.
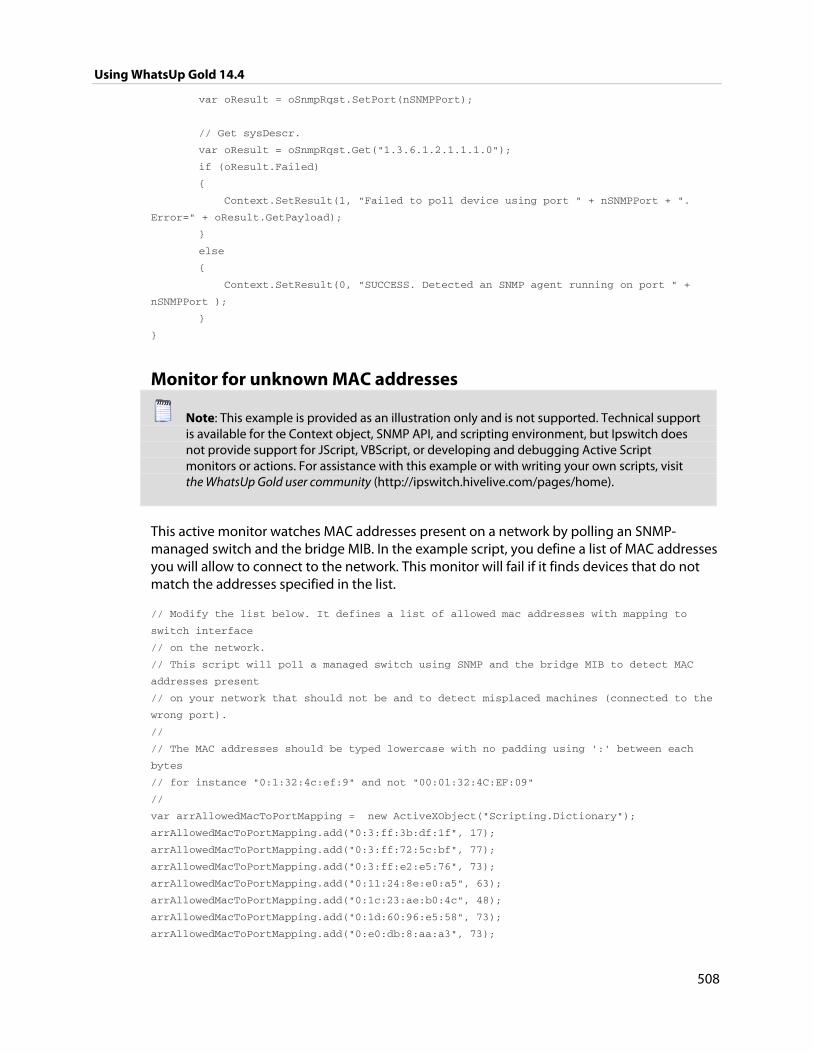
Using WhatsUp Gold 14.4
508
var oResult = oSnmpRqst.SetPort(nSNMPPort);
// Get sysDescr.
var oResult = oSnmpRqst.Get("1.3.6.1.2.1.1.1.0");
if (oResult.Failed)
{
Context.SetResult(1, "Failed to poll device using port " + nSNMPPort + ".
Error=" + oResult.GetPayload);
}
else
{
Context.SetResult(0, "SUCCESS. Detected an SNMP agent running on port " +
nSNMPPort );
}
}
Monitor for unknown MAC addresses
Note: This example is provided as an illustration only and is not supported. Technical support is available for the Context object, SNMP API, and scripting environment, but Ipswitch does not provide support for JScript, VBScript, or developing and debugging Active Script monitors or actions. For assistance with this example or with writing your own scripts, visit the WhatsUp Gold user community (http://ipswitch.hivelive.com/pages/home).
This active monitor watches MAC addresses present on a network by polling an SNMP-managed switch and the bridge MIB. In the example script, you define a list of MAC addresses you will allow to connect to the network. This monitor will fail if it finds devices that do not match the addresses specified in the list.
// Modify the list below. It defines a list of allowed mac addresses with mapping to
switch interface
// on the network.
// This script will poll a managed switch using SNMP and the bridge MIB to detect MAC
addresses present
// on your network that should not be and to detect misplaced machines (connected to the
wrong port).
//
// The MAC addresses should be typed lowercase with no padding using ':' between each
bytes
// for instance "0:1:32:4c:ef:9" and not "00:01:32:4C:EF:09"
//
var arrAllowedMacToPortMapping = new ActiveXObject("Scripting.Dictionary");
arrAllowedMacToPortMapping.add("0:3:ff:3b:df:1f", 17);
arrAllowedMacToPortMapping.add("0:3:ff:72:5c:bf", 77);
arrAllowedMacToPortMapping.add("0:3:ff:e2:e5:76", 73);
arrAllowedMacToPortMapping.add("0:11:24:8e:e0:a5", 63);
arrAllowedMacToPortMapping.add("0:1c:23:ae:b0:4c", 48);
arrAllowedMacToPortMapping.add("0:1d:60:96:e5:58", 73);
arrAllowedMacToPortMapping.add("0:e0:db:8:aa:a3", 73);
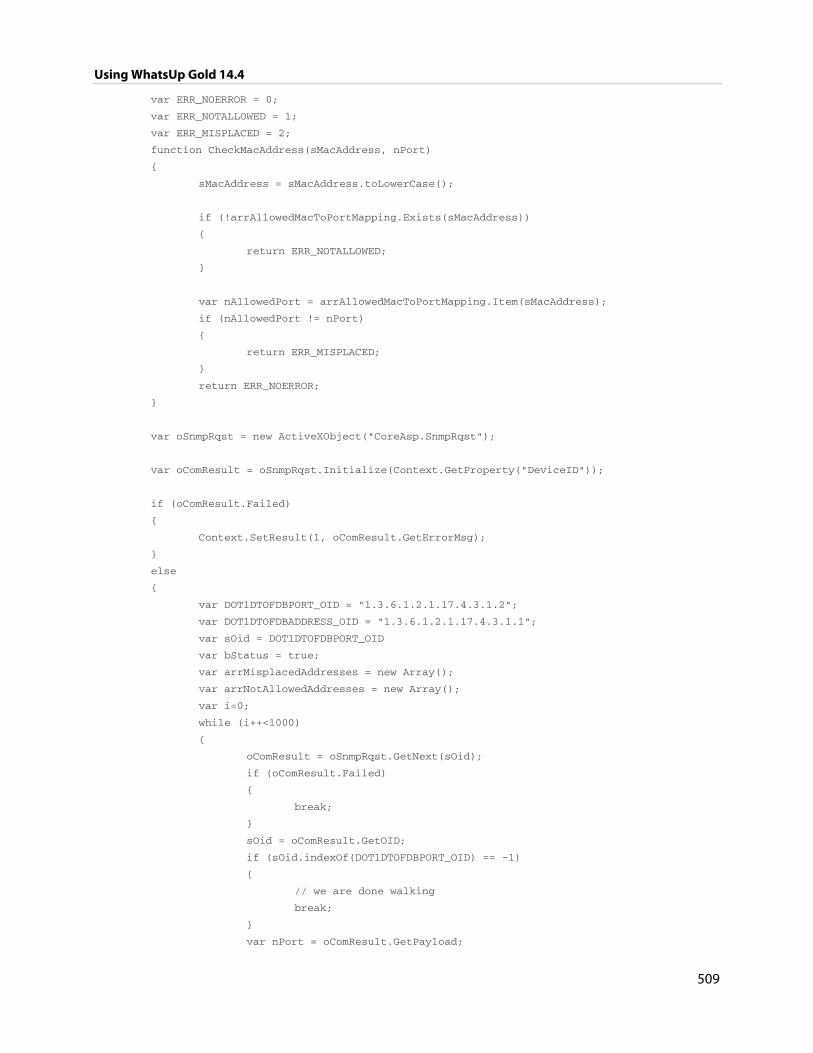
Using WhatsUp Gold 14.4
509
var ERR_NOERROR = 0;
var ERR_NOTALLOWED = 1;
var ERR_MISPLACED = 2;
function CheckMacAddress(sMacAddress, nPort)
{
sMacAddress = sMacAddress.toLowerCase();
if (!arrAllowedMacToPortMapping.Exists(sMacAddress))
{
return ERR_NOTALLOWED;
}
var nAllowedPort = arrAllowedMacToPortMapping.Item(sMacAddress);
if (nAllowedPort != nPort)
{
return ERR_MISPLACED;
}
return ERR_NOERROR;
}
var oSnmpRqst = new ActiveXObject("CoreAsp.SnmpRqst");
var oComResult = oSnmpRqst.Initialize(Context.GetProperty("DeviceID"));
if (oComResult.Failed)
{
Context.SetResult(1, oComResult.GetErrorMsg);
}
else
{
var DOT1DTOFDBPORT_OID = "1.3.6.1.2.1.17.4.3.1.2";
var DOT1DTOFDBADDRESS_OID = "1.3.6.1.2.1.17.4.3.1.1";
var sOid = DOT1DTOFDBPORT_OID
var bStatus = true;
var arrMisplacedAddresses = new Array();
var arrNotAllowedAddresses = new Array();
var i=0;
while (i++<1000)
{
oComResult = oSnmpRqst.GetNext(sOid);
if (oComResult.Failed)
{
break;
}
sOid = oComResult.GetOID;
if (sOid.indexOf(DOT1DTOFDBPORT_OID) == -1)
{
// we are done walking
break;
}
var nPort = oComResult.GetPayload;
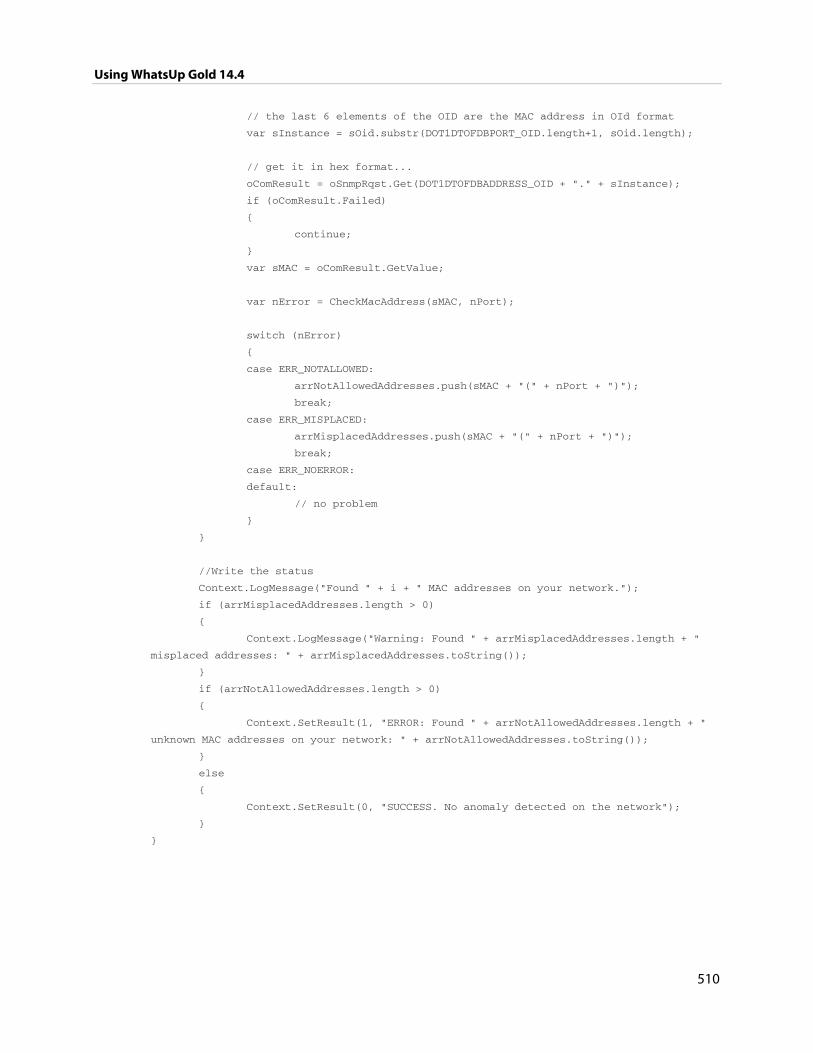
Using WhatsUp Gold 14.4
510
// the last 6 elements of the OID are the MAC address in OId format
var sInstance = sOid.substr(DOT1DTOFDBPORT_OID.length+1, sOid.length);
// get it in hex format...
oComResult = oSnmpRqst.Get(DOT1DTOFDBADDRESS_OID + "." + sInstance);
if (oComResult.Failed)
{
continue;
}
var sMAC = oComResult.GetValue;
var nError = CheckMacAddress(sMAC, nPort);
switch (nError)
{
case ERR_NOTALLOWED:
arrNotAllowedAddresses.push(sMAC + "(" + nPort + ")");
break;
case ERR_MISPLACED:
arrMisplacedAddresses.push(sMAC + "(" + nPort + ")");
break;
case ERR_NOERROR:
default:
// no problem
}
}
//Write the status
Context.LogMessage("Found " + i + " MAC addresses on your network.");
if (arrMisplacedAddresses.length > 0)
{
Context.LogMessage("Warning: Found " + arrMisplacedAddresses.length + "
misplaced addresses: " + arrMisplacedAddresses.toString());
}
if (arrNotAllowedAddresses.length > 0)
{
Context.SetResult(1, "ERROR: Found " + arrNotAllowedAddresses.length + "
unknown MAC addresses on your network: " + arrNotAllowedAddresses.toString());
}
else
{
Context.SetResult(0, "SUCCESS. No anomaly detected on the network");
}
}
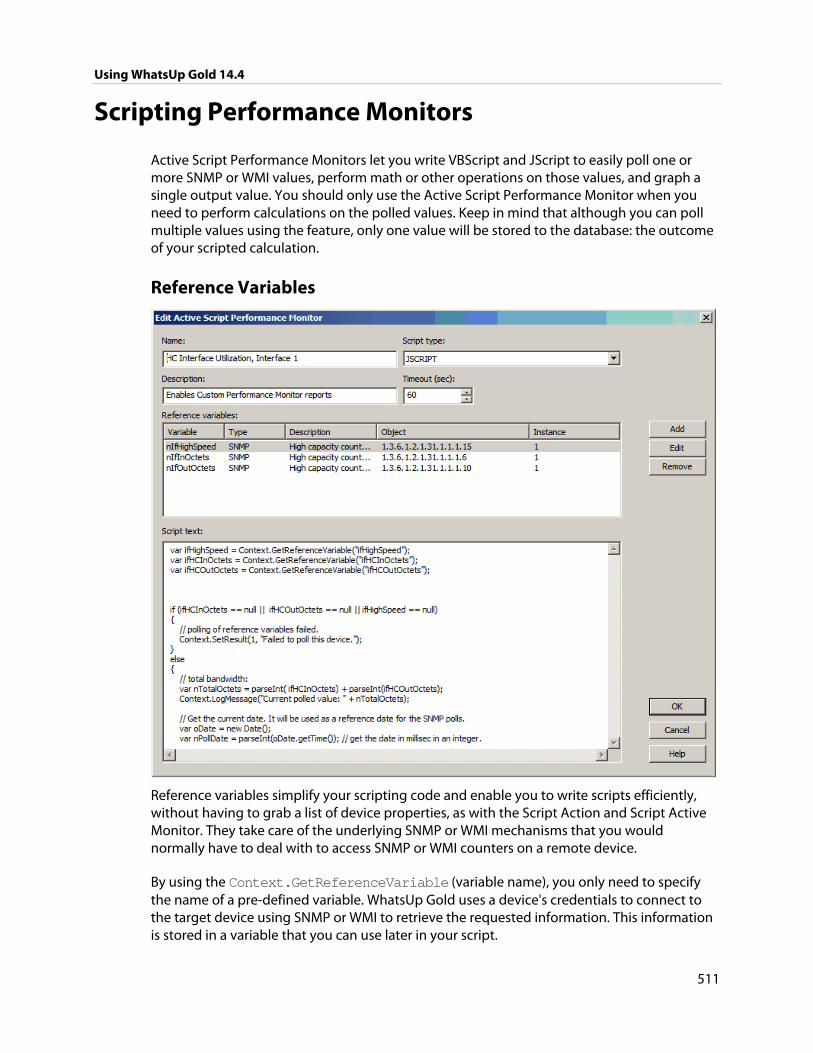
Using WhatsUp Gold 14.4
511
Scripting Performance Monitors
Active Script Performance Monitors let you write VBScript and JScript to easily poll one or more SNMP or WMI values, perform math or other operations on those values, and graph a single output value. You should only use the Active Script Performance Monitor when you need to perform calculations on the polled values. Keep in mind that although you can poll multiple values using the feature, only one value will be stored to the database: the outcome of your scripted calculation.
Reference Variables
Reference variables simplify your scripting code and enable you to write scripts efficiently, without having to grab a list of device properties, as with the Script Action and Script Active Monitor. They take care of the underlying SNMP or WMI mechanisms that you would normally have to deal with to access SNMP or WMI counters on a remote device.
By using the Context.GetReferenceVariable (variable name), you only need to specify the name of a pre-defined variable. WhatsUp Gold uses a device's credentials to connect to the target device using SNMP or WMI to retrieve the requested information. This information is stored in a variable that you can use later in your script.
Using WhatsUp Gold 14.4
512
Important: The use of reference variables in the Active Script Performance Monitor is optional. If you do use them, you must use Context.GetReferenceVariable,for reference variables to be polled and their data graphed.
Keep In Mind You need to include error handling in your monitor script. Your script either needs a
value to graph by using Context.SetValue, or you must use Context.SetResult to tell WhatsUp Gold that the script failed.
Context.GetReferenceVariable will return 'null' if the poll fails for any reason.
If you do not have a call to SetValue or SetResult, the script does not report any errors and no data is graphed.
If SetValue is used, it is not necessary to use SetResult, as SetValue implicitly sets SetResult to 0, or "good."
Results from this performance monitor are displayed on Custom Performance Monitors Full and Workspace reports.
Errors from this performance monitor are displayed in the Performance Monitor Error log as well as EventViewer.exe.
Using the Context object with Performance Monitors The context object provides an interface for your script to interact with WhatsUp Gold.
All methods and properties are retrieved using the Context namespace.
Note: You may have to remove the copyright information from the cut and paste if it appears when you copy from this help file.
Methods Method description
LogMessage(sText); This method allows for a message to be written to the WhatsUp Gold debug log.
Example
JScript
Context.LogMessage( "Checking Monitor name using
Context.GetProperty()");
VBScript
Context.LogMessage "Checking Address using Context.GetProperty()"
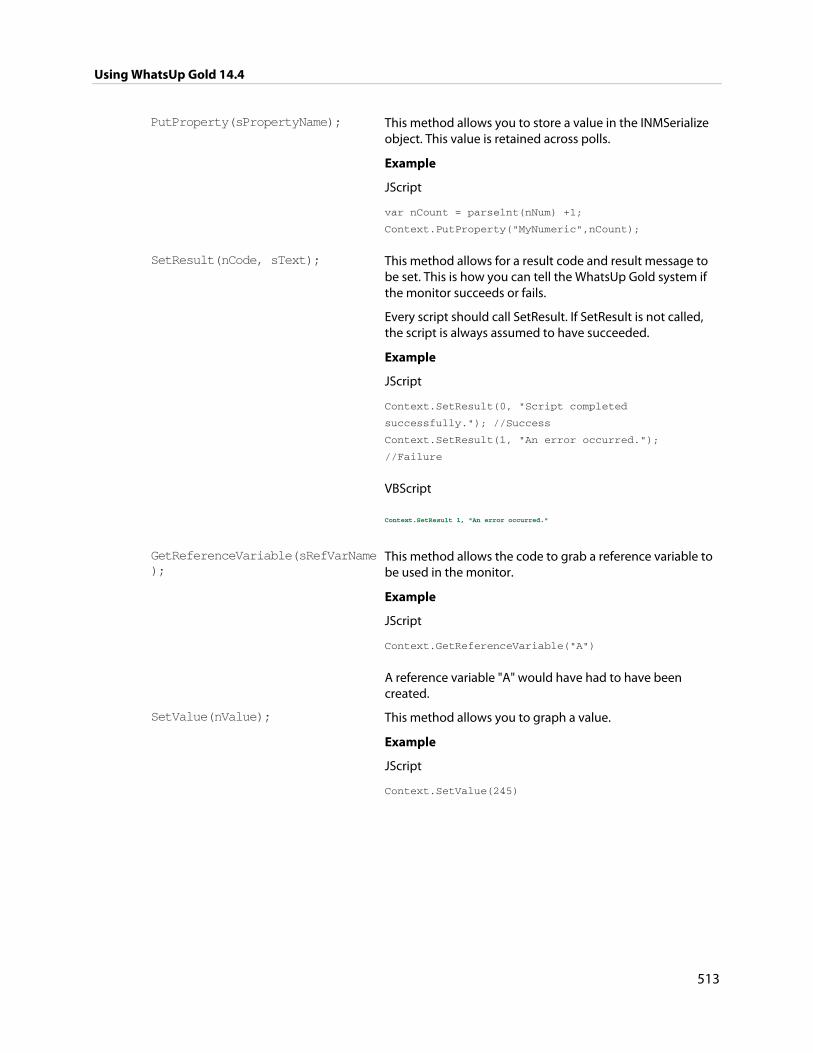
Using WhatsUp Gold 14.4
513
PutProperty(sPropertyName); This method allows you to store a value in the INMSerialize
object. This value is retained across polls.
Example
JScript
var nCount = parselnt(nNum) +1;
Context.PutProperty("MyNumeric",nCount);
SetResult(nCode, sText); This method allows for a result code and result message to be set. This is how you can tell the WhatsUp Gold system if the monitor succeeds or fails.
Every script should call SetResult. If SetResult is not called, the script is always assumed to have succeeded.
Example
JScript
Context.SetResult(0, "Script completed
successfully."); //Success
Context.SetResult(1, "An error occurred.");
//Failure
VBScript
Context.SetResult 1, "An error occurred."
GetReferenceVariable(sRefVarName );
This method allows the code to grab a reference variable to be used in the monitor.
Example
JScript
Context.GetReferenceVariable("A")
A reference variable "A" would have had to have been created.
SetValue(nValue); This method allows you to graph a value.
Example
JScript
Context.SetValue(245)
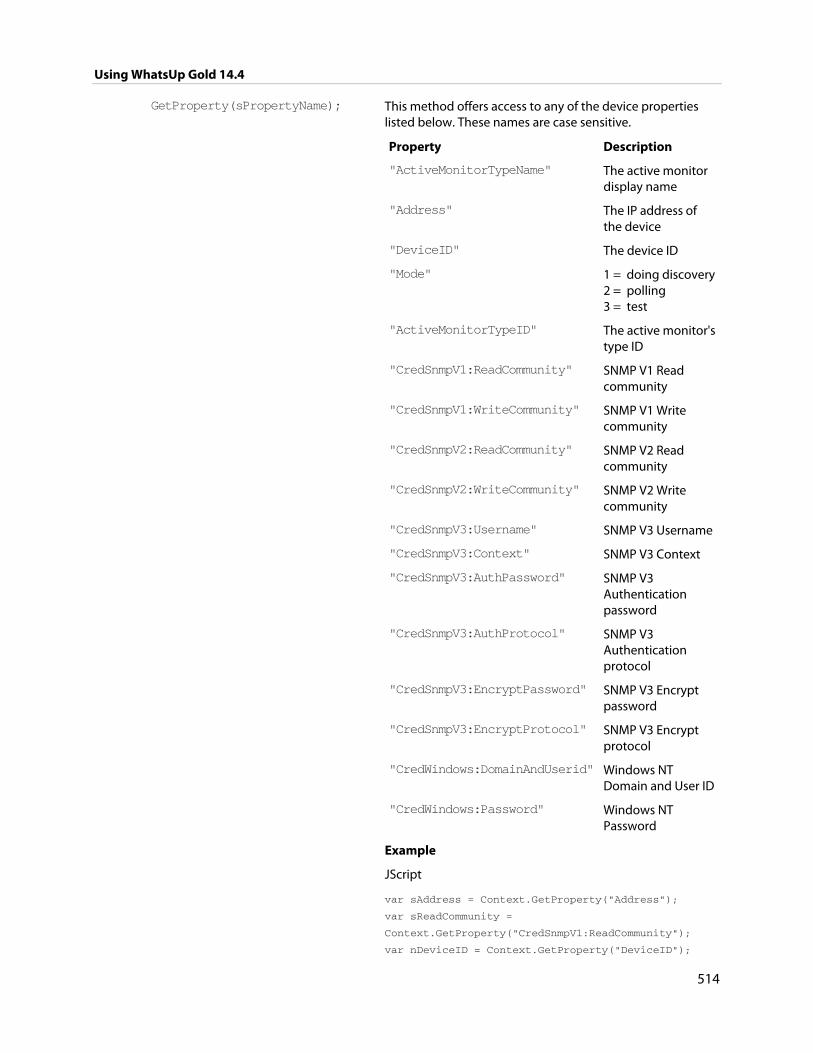
Using WhatsUp Gold 14.4
514
GetProperty(sPropertyName); This method offers access to any of the device properties listed below. These names are case sensitive.
Property Description
"ActiveMonitorTypeName" The active monitor display name
"Address" The IP address of the device
"DeviceID" The device ID
"Mode" 1 = doing discovery2 = polling 3 = test
"ActiveMonitorTypeID" The active monitor's type ID
"CredSnmpV1:ReadCommunity" SNMP V1 Read community
"CredSnmpV1:WriteCommunity" SNMP V1 Write community
"CredSnmpV2:ReadCommunity" SNMP V2 Read community
"CredSnmpV2:WriteCommunity" SNMP V2 Write community
"CredSnmpV3:Username" SNMP V3 Username
"CredSnmpV3:Context" SNMP V3 Context
"CredSnmpV3:AuthPassword" SNMP V3 Authentication password
"CredSnmpV3:AuthProtocol" SNMP V3 Authentication protocol
"CredSnmpV3:EncryptPassword" SNMP V3 Encrypt password
"CredSnmpV3:EncryptProtocol" SNMP V3 Encrypt protocol
"CredWindows:DomainAndUserid" Windows NT Domain and User ID
"CredWindows:Password" Windows NT Password
Example
JScript
var sAddress = Context.GetProperty("Address");
var sReadCommunity =
Context.GetProperty("CredSnmpV1:ReadCommunity");
var nDeviceID = Context.GetProperty("DeviceID");
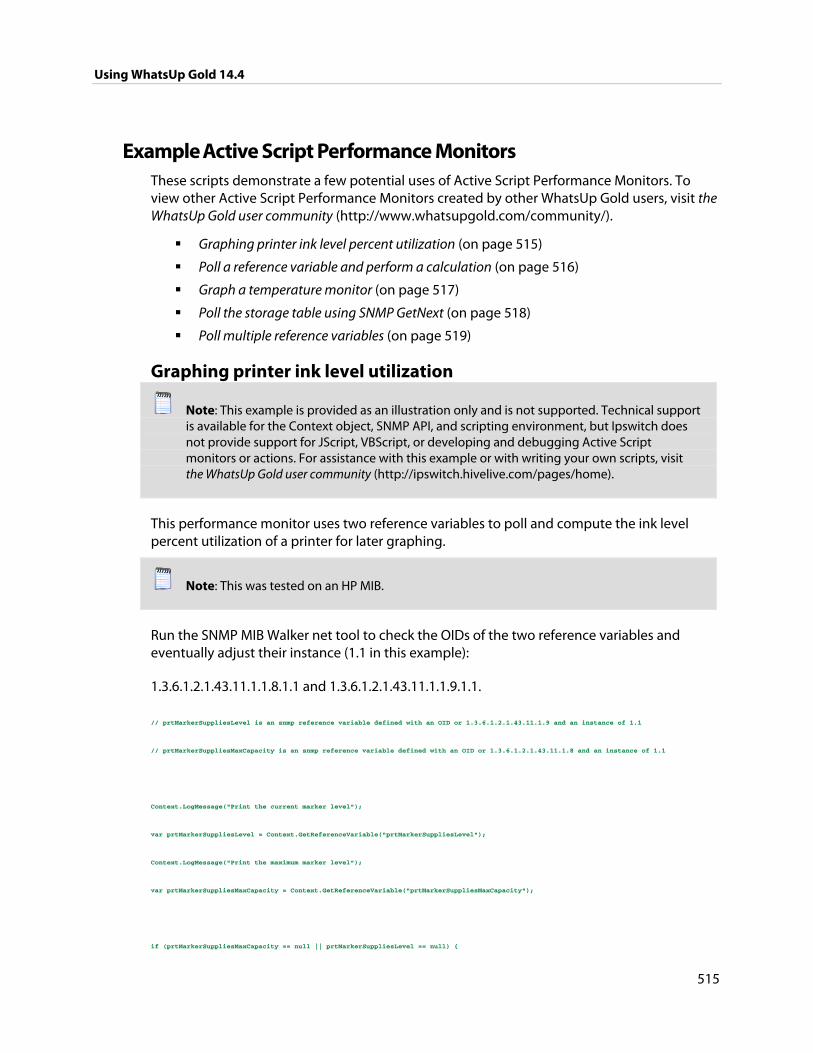
Using WhatsUp Gold 14.4
515
Example Active Script Performance Monitors These scripts demonstrate a few potential uses of Active Script Performance Monitors. To view other Active Script Performance Monitors created by other WhatsUp Gold users, visit the WhatsUp Gold user community (http://www.whatsupgold.com/community/).
Graphing printer ink level percent utilization (on page 515)
Poll a reference variable and perform a calculation (on page 516)
Graph a temperature monitor (on page 517)
Poll the storage table using SNMP GetNext (on page 518)
Poll multiple reference variables (on page 519)
Graphing printer ink level utilization
Note: This example is provided as an illustration only and is not supported. Technical support is available for the Context object, SNMP API, and scripting environment, but Ipswitch does not provide support for JScript, VBScript, or developing and debugging Active Script monitors or actions. For assistance with this example or with writing your own scripts, visit the WhatsUp Gold user community (http://ipswitch.hivelive.com/pages/home).
This performance monitor uses two reference variables to poll and compute the ink level percent utilization of a printer for later graphing.
Note: This was tested on an HP MIB.
Run the SNMP MIB Walker net tool to check the OIDs of the two reference variables and eventually adjust their instance (1.1 in this example):
1.3.6.1.2.1.43.11.1.1.8.1.1 and 1.3.6.1.2.1.43.11.1.1.9.1.1.
// prtMarkerSuppliesLevel is an snmp reference variable defined with an OID or 1.3.6.1.2.1.43.11.1.9 and an instance of 1.1
// prtMarkerSuppliesMaxCapacity is an snmp reference variable defined with an OID or 1.3.6.1.2.1.43.11.1.8 and an instance of 1.1
Context.LogMessage("Print the current marker level");
var prtMarkerSuppliesLevel = Context.GetReferenceVariable("prtMarkerSuppliesLevel");
Context.LogMessage("Print the maximum marker level");
var prtMarkerSuppliesMaxCapacity = Context.GetReferenceVariable("prtMarkerSuppliesMaxCapacity");
if (prtMarkerSuppliesMaxCapacity == null || prtMarkerSuppliesLevel == null) {
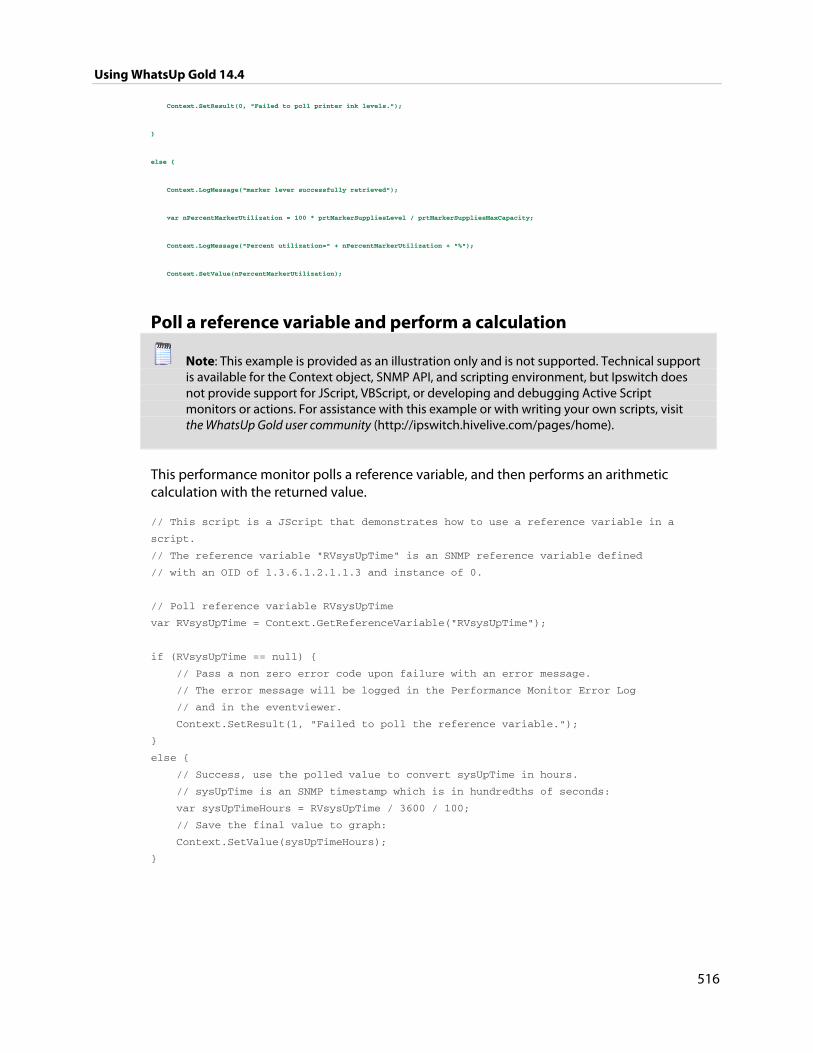
Using WhatsUp Gold 14.4
516
Context.SetResult(0, "Failed to poll printer ink levels.");
}
else {
Context.LogMessage("marker lever successfully retrieved");
var nPercentMarkerUtilization = 100 * prtMarkerSuppliesLevel / prtMarkerSuppliesMaxCapacity;
Context.LogMessage("Percent utilization=" + nPercentMarkerUtilization + "%");
Context.SetValue(nPercentMarkerUtilization);
Poll a reference variable and perform a calculation
Note: This example is provided as an illustration only and is not supported. Technical support is available for the Context object, SNMP API, and scripting environment, but Ipswitch does not provide support for JScript, VBScript, or developing and debugging Active Script monitors or actions. For assistance with this example or with writing your own scripts, visit the WhatsUp Gold user community (http://ipswitch.hivelive.com/pages/home).
This performance monitor polls a reference variable, and then performs an arithmetic calculation with the returned value.
// This script is a JScript that demonstrates how to use a reference variable in a
script.
// The reference variable "RVsysUpTime" is an SNMP reference variable defined
// with an OID of 1.3.6.1.2.1.1.3 and instance of 0.
// Poll reference variable RVsysUpTime
var RVsysUpTime = Context.GetReferenceVariable("RVsysUpTime");
if (RVsysUpTime == null) {
// Pass a non zero error code upon failure with an error message.
// The error message will be logged in the Performance Monitor Error Log
// and in the eventviewer.
Context.SetResult(1, "Failed to poll the reference variable.");
}
else {
// Success, use the polled value to convert sysUpTime in hours.
// sysUpTime is an SNMP timestamp which is in hundredths of seconds:
var sysUpTimeHours = RVsysUpTime / 3600 / 100;
// Save the final value to graph:
Context.SetValue(sysUpTimeHours);
}
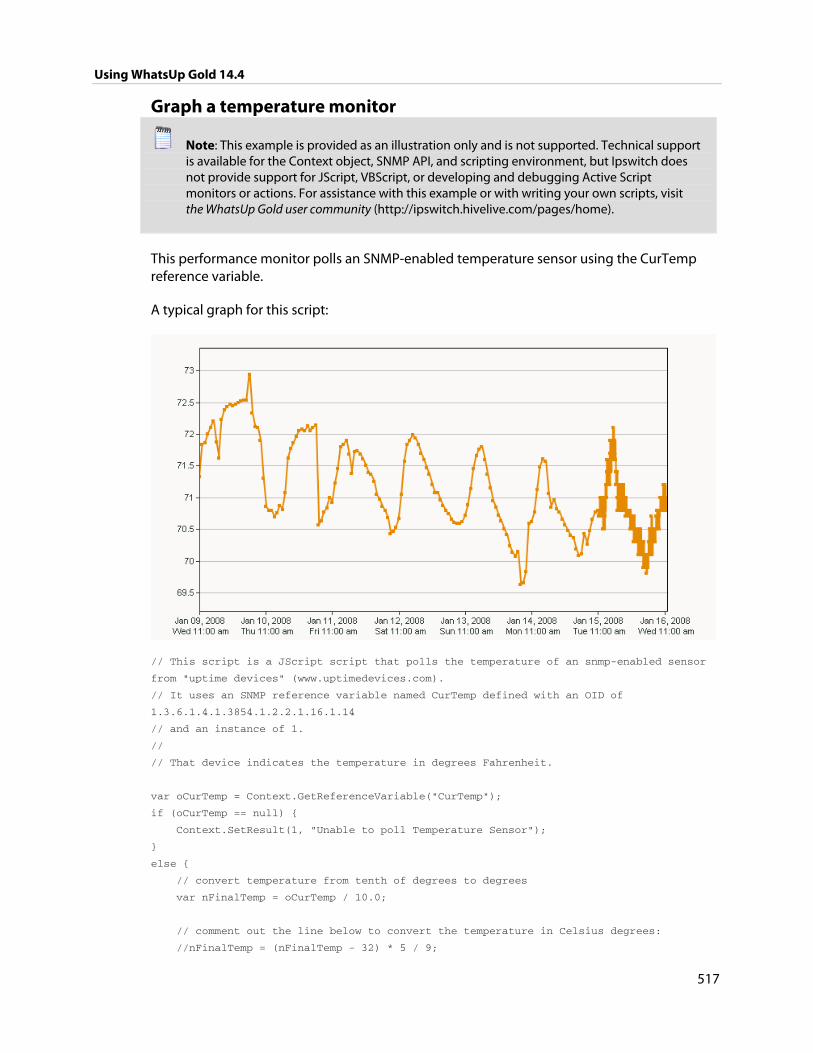
Using WhatsUp Gold 14.4
517
Graph a temperature monitor
Note: This example is provided as an illustration only and is not supported. Technical support is available for the Context object, SNMP API, and scripting environment, but Ipswitch does not provide support for JScript, VBScript, or developing and debugging Active Script monitors or actions. For assistance with this example or with writing your own scripts, visit the WhatsUp Gold user community (http://ipswitch.hivelive.com/pages/home).
This performance monitor polls an SNMP-enabled temperature sensor using the CurTemp reference variable.
A typical graph for this script:
// This script is a JScript script that polls the temperature of an snmp-enabled sensor
from "uptime devices" (www.uptimedevices.com).
// It uses an SNMP reference variable named CurTemp defined with an OID of
1.3.6.1.4.1.3854.1.2.2.1.16.1.14
// and an instance of 1.
//
// That device indicates the temperature in degrees Fahrenheit.
var oCurTemp = Context.GetReferenceVariable("CurTemp");
if (oCurTemp == null) {
Context.SetResult(1, "Unable to poll Temperature Sensor");
}
else {
// convert temperature from tenth of degrees to degrees
var nFinalTemp = oCurTemp / 10.0;
// comment out the line below to convert the temperature in Celsius degrees:
//nFinalTemp = (nFinalTemp - 32) * 5 / 9;
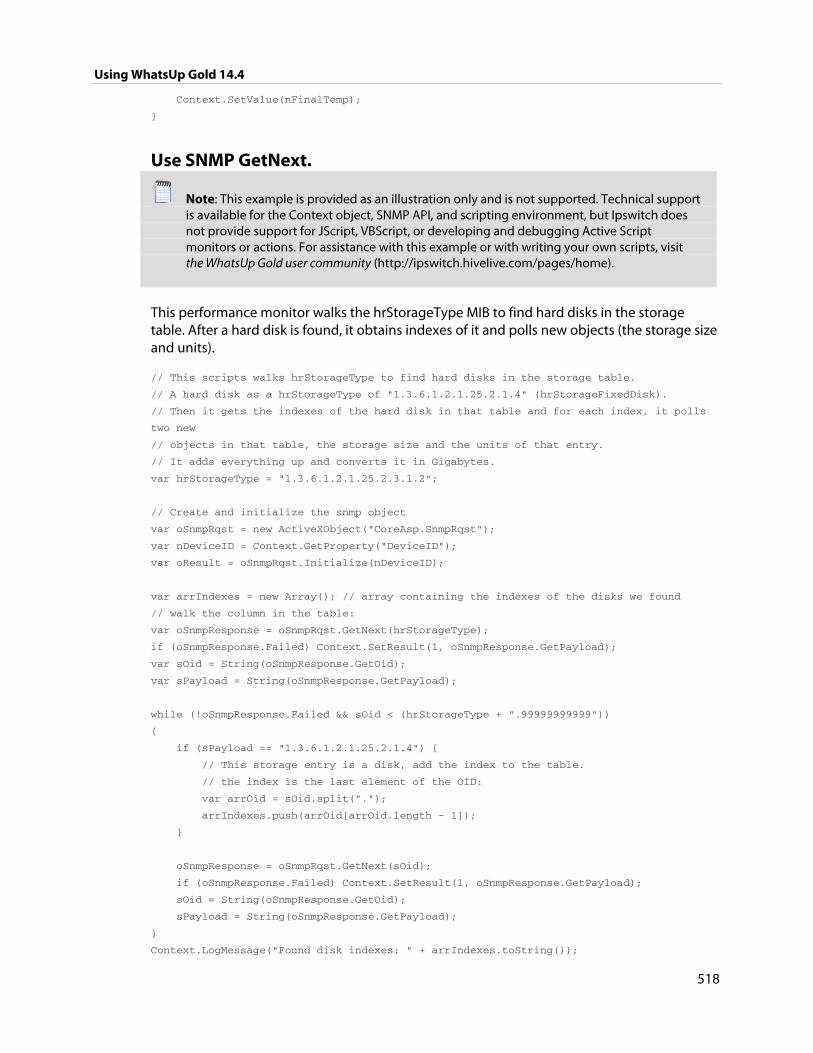
Using WhatsUp Gold 14.4
518
Context.SetValue(nFinalTemp);
}
Use SNMP GetNext.
Note: This example is provided as an illustration only and is not supported. Technical support is available for the Context object, SNMP API, and scripting environment, but Ipswitch does not provide support for JScript, VBScript, or developing and debugging Active Script monitors or actions. For assistance with this example or with writing your own scripts, visit the WhatsUp Gold user community (http://ipswitch.hivelive.com/pages/home).
This performance monitor walks the hrStorageType MIB to find hard disks in the storage table. After a hard disk is found, it obtains indexes of it and polls new objects (the storage size and units).
// This scripts walks hrStorageType to find hard disks in the storage table.
// A hard disk as a hrStorageType of "1.3.6.1.2.1.25.2.1.4" (hrStorageFixedDisk).
// Then it gets the indexes of the hard disk in that table and for each index, it polls
two new
// objects in that table, the storage size and the units of that entry.
// It adds everything up and converts it in Gigabytes.
var hrStorageType = "1.3.6.1.2.1.25.2.3.1.2";
// Create and initialize the snmp object
var oSnmpRqst = new ActiveXObject("CoreAsp.SnmpRqst");
var nDeviceID = Context.GetProperty("DeviceID");
var oResult = oSnmpRqst.Initialize(nDeviceID);
var arrIndexes = new Array(); // array containing the indexes of the disks we found
// walk the column in the table:
var oSnmpResponse = oSnmpRqst.GetNext(hrStorageType);
if (oSnmpResponse.Failed) Context.SetResult(1, oSnmpResponse.GetPayload);
var sOid = String(oSnmpResponse.GetOid);
var sPayload = String(oSnmpResponse.GetPayload);
while (!oSnmpResponse.Failed && sOid < (hrStorageType + ".99999999999"))
{
if (sPayload == "1.3.6.1.2.1.25.2.1.4") {
// This storage entry is a disk, add the index to the table.
// the index is the last element of the OID:
var arrOid = sOid.split(".");
arrIndexes.push(arrOid[arrOid.length - 1]);
}
oSnmpResponse = oSnmpRqst.GetNext(sOid);
if (oSnmpResponse.Failed) Context.SetResult(1, oSnmpResponse.GetPayload);
sOid = String(oSnmpResponse.GetOid);
sPayload = String(oSnmpResponse.GetPayload);
}
Context.LogMessage("Found disk indexes: " + arrIndexes.toString());
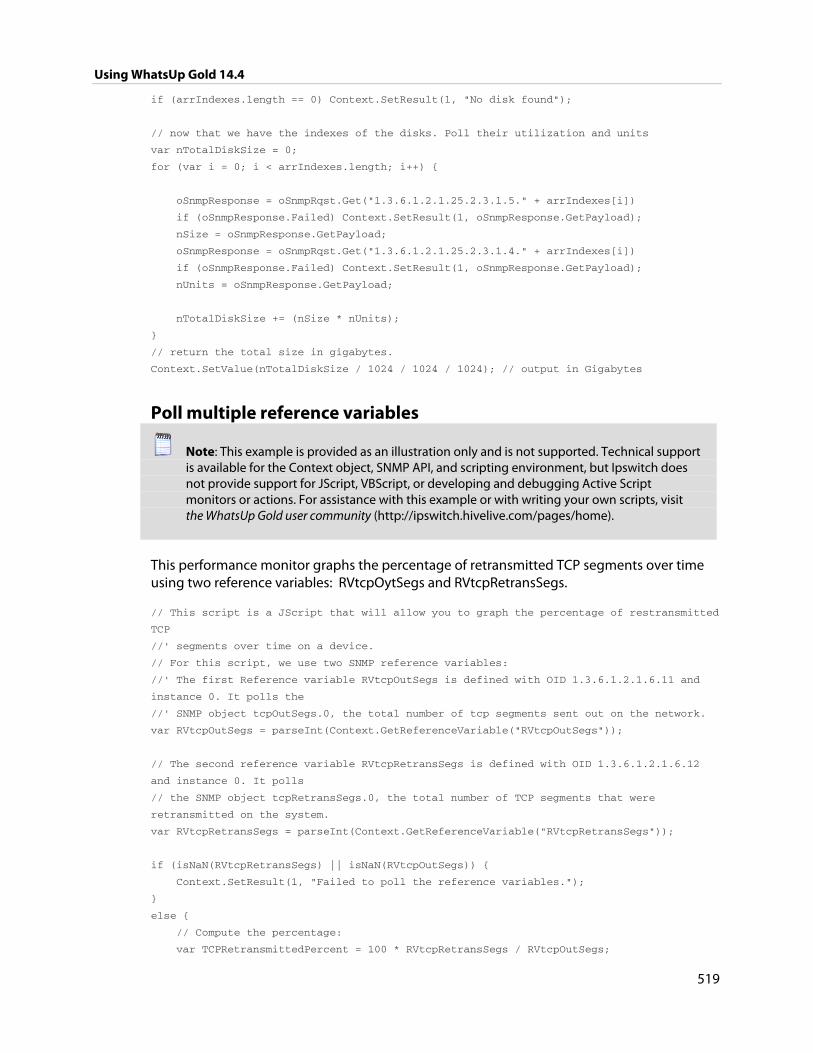
Using WhatsUp Gold 14.4
519
if (arrIndexes.length == 0) Context.SetResult(1, "No disk found");
// now that we have the indexes of the disks. Poll their utilization and units
var nTotalDiskSize = 0;
for (var i = 0; i < arrIndexes.length; i++) {
oSnmpResponse = oSnmpRqst.Get("1.3.6.1.2.1.25.2.3.1.5." + arrIndexes[i])
if (oSnmpResponse.Failed) Context.SetResult(1, oSnmpResponse.GetPayload);
nSize = oSnmpResponse.GetPayload;
oSnmpResponse = oSnmpRqst.Get("1.3.6.1.2.1.25.2.3.1.4." + arrIndexes[i])
if (oSnmpResponse.Failed) Context.SetResult(1, oSnmpResponse.GetPayload);
nUnits = oSnmpResponse.GetPayload;
nTotalDiskSize += (nSize * nUnits);
}
// return the total size in gigabytes.
Context.SetValue(nTotalDiskSize / 1024 / 1024 / 1024); // output in Gigabytes
Poll multiple reference variables
Note: This example is provided as an illustration only and is not supported. Technical support is available for the Context object, SNMP API, and scripting environment, but Ipswitch does not provide support for JScript, VBScript, or developing and debugging Active Script monitors or actions. For assistance with this example or with writing your own scripts, visit the WhatsUp Gold user community (http://ipswitch.hivelive.com/pages/home).
This performance monitor graphs the percentage of retransmitted TCP segments over time using two reference variables: RVtcpOytSegs and RVtcpRetransSegs.
// This script is a JScript that will allow you to graph the percentage of restransmitted
TCP
//' segments over time on a device.
// For this script, we use two SNMP reference variables:
//' The first Reference variable RVtcpOutSegs is defined with OID 1.3.6.1.2.1.6.11 and
instance 0. It polls the
//' SNMP object tcpOutSegs.0, the total number of tcp segments sent out on the network.
var RVtcpOutSegs = parseInt(Context.GetReferenceVariable("RVtcpOutSegs"));
// The second reference variable RVtcpRetransSegs is defined with OID 1.3.6.1.2.1.6.12
and instance 0. It polls
// the SNMP object tcpRetransSegs.0, the total number of TCP segments that were
retransmitted on the system.
var RVtcpRetransSegs = parseInt(Context.GetReferenceVariable("RVtcpRetransSegs"));
if (isNaN(RVtcpRetransSegs) || isNaN(RVtcpOutSegs)) {
Context.SetResult(1, "Failed to poll the reference variables.");
}
else {
// Compute the percentage:
var TCPRetransmittedPercent = 100 * RVtcpRetransSegs / RVtcpOutSegs;
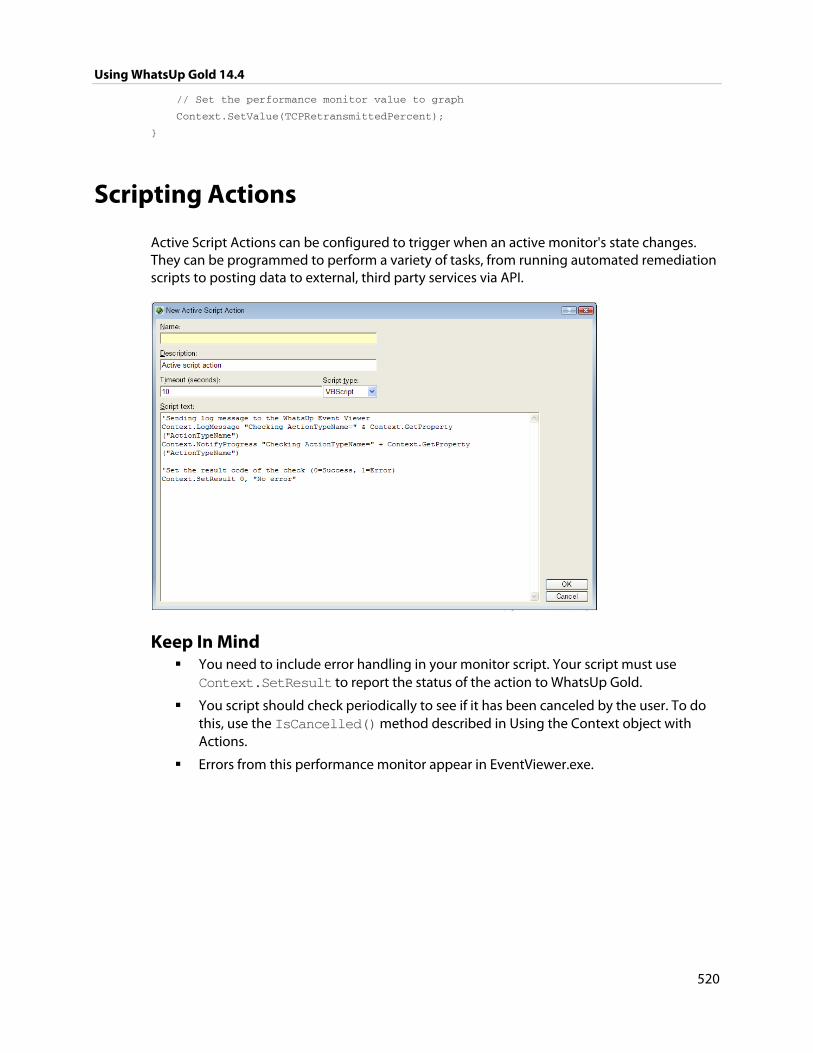
Using WhatsUp Gold 14.4
520
// Set the performance monitor value to graph
Context.SetValue(TCPRetransmittedPercent);
}
Scripting Actions
Active Script Actions can be configured to trigger when an active monitor's state changes. They can be programmed to perform a variety of tasks, from running automated remediation scripts to posting data to external, third party services via API.
Keep In Mind You need to include error handling in your monitor script. Your script must use Context.SetResult to report the status of the action to WhatsUp Gold.
You script should check periodically to see if it has been canceled by the user. To do this, use the IsCancelled() method described in Using the Context object with Actions.
Errors from this performance monitor appear in EventViewer.exe.
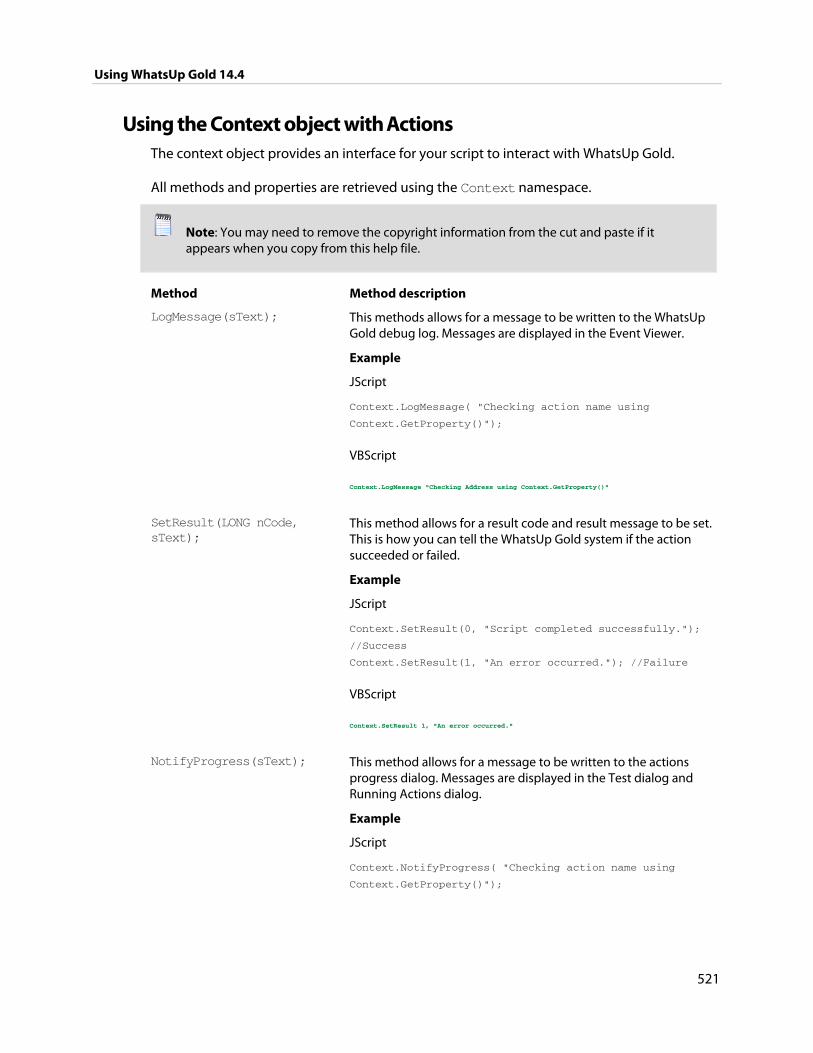
Using WhatsUp Gold 14.4
521
Using the Context object with Actions The context object provides an interface for your script to interact with WhatsUp Gold.
All methods and properties are retrieved using the Context namespace.
Note: You may need to remove the copyright information from the cut and paste if it appears when you copy from this help file.
Method Method description
LogMessage(sText); This methods allows for a message to be written to the WhatsUp Gold debug log. Messages are displayed in the Event Viewer.
Example
JScript
Context.LogMessage( "Checking action name using
Context.GetProperty()");
VBScript
Context.LogMessage "Checking Address using Context.GetProperty()"
SetResult(LONG nCode, sText);
This method allows for a result code and result message to be set. This is how you can tell the WhatsUp Gold system if the action succeeded or failed.
Example
JScript
Context.SetResult(0, "Script completed successfully.");
//Success
Context.SetResult(1, "An error occurred."); //Failure
VBScript
Context.SetResult 1, "An error occurred."
NotifyProgress(sText); This method allows for a message to be written to the actions progress dialog. Messages are displayed in the Test dialog and Running Actions dialog.
Example
JScript
Context.NotifyProgress( "Checking action name using
Context.GetProperty()");
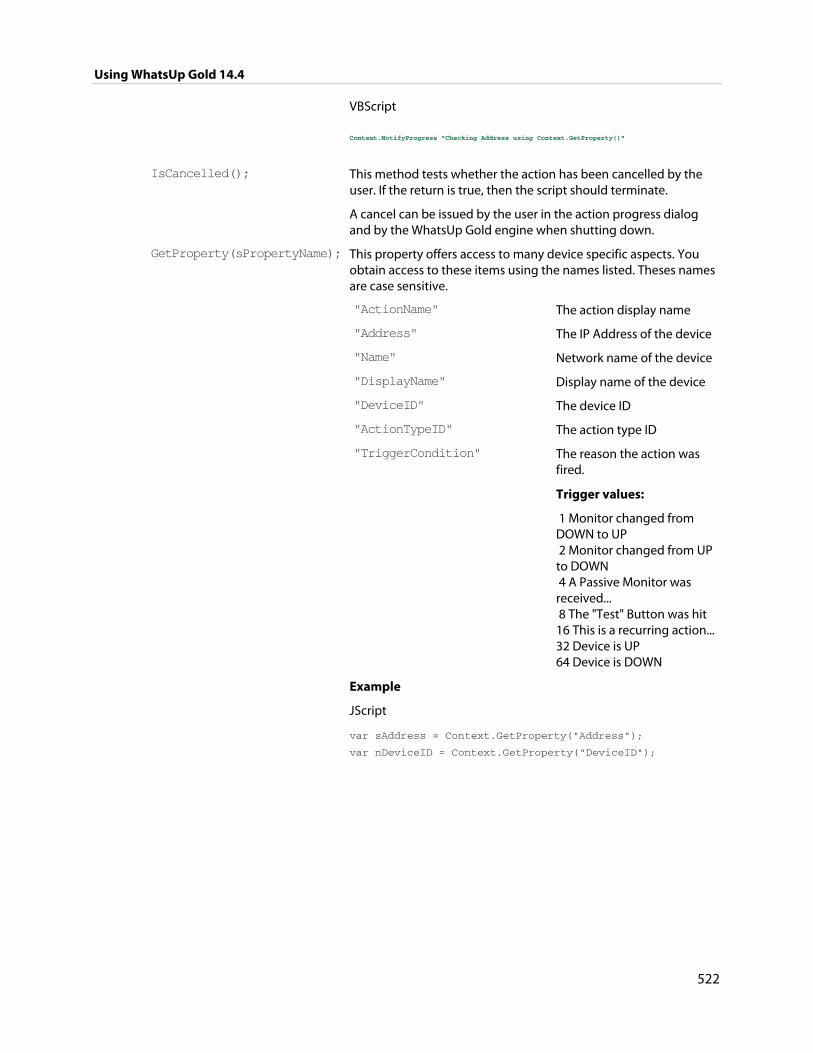
Using WhatsUp Gold 14.4
522
VBScript
Context.NotifyProgress "Checking Address using Context.GetProperty()"
IsCancelled(); This method tests whether the action has been cancelled by the user. If the return is true, then the script should terminate.
A cancel can be issued by the user in the action progress dialog and by the WhatsUp Gold engine when shutting down.
GetProperty(sPropertyName); This property offers access to many device specific aspects. You obtain access to these items using the names listed. Theses names are case sensitive.
"ActionName" The action display name
"Address" The IP Address of the device
"Name" Network name of the device
"DisplayName" Display name of the device
"DeviceID" The device ID
"ActionTypeID" The action type ID
"TriggerCondition" The reason the action was fired.
Trigger values:
1 Monitor changed from DOWN to UP 2 Monitor changed from UP to DOWN 4 A Passive Monitor was received... 8 The "Test" Button was hit 16 This is a recurring action...32 Device is UP 64 Device is DOWN
Example
JScript
var sAddress = Context.GetProperty("Address");
var nDeviceID = Context.GetProperty("DeviceID");
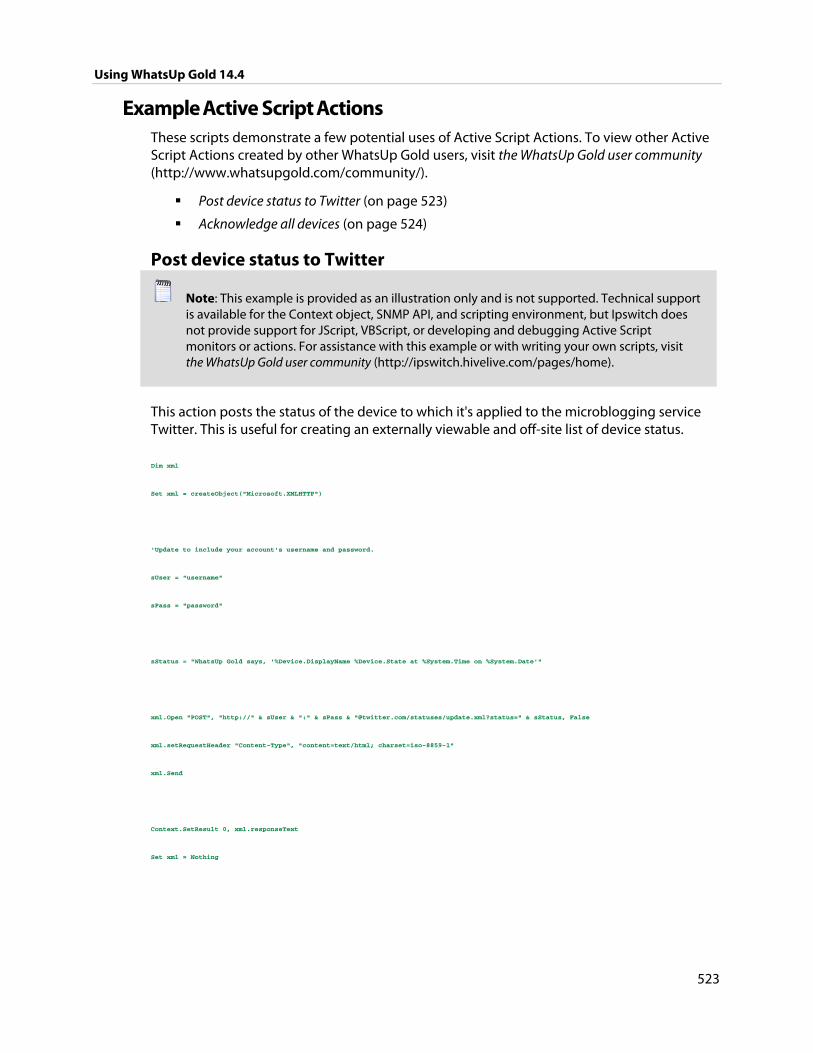
Using WhatsUp Gold 14.4
523
Example Active Script Actions These scripts demonstrate a few potential uses of Active Script Actions. To view other Active Script Actions created by other WhatsUp Gold users, visit the WhatsUp Gold user community (http://www.whatsupgold.com/community/).
Post device status to Twitter (on page 523)
Acknowledge all devices (on page 524)
Post device status to Twitter
Note: This example is provided as an illustration only and is not supported. Technical support is available for the Context object, SNMP API, and scripting environment, but Ipswitch does not provide support for JScript, VBScript, or developing and debugging Active Script monitors or actions. For assistance with this example or with writing your own scripts, visit the WhatsUp Gold user community (http://ipswitch.hivelive.com/pages/home).
This action posts the status of the device to which it's applied to the microblogging service Twitter. This is useful for creating an externally viewable and off-site list of device status.
Dim xml
Set xml = createObject("Microsoft.XMLHTTP")
'Update to include your account's username and password.
sUser = "username"
sPass = "password"
sStatus = "WhatsUp Gold says, '%Device.DisplayName %Device.State at %System.Time on %System.Date'"
xml.Open "POST", "http://" & sUser & ":" & sPass & "@twitter.com/statuses/update.xml?status=" & sStatus, False
xml.setRequestHeader "Content-Type", "content=text/html; charset=iso-8859-1"
xml.Send
Context.SetResult 0, xml.responseText
Set xml = Nothing
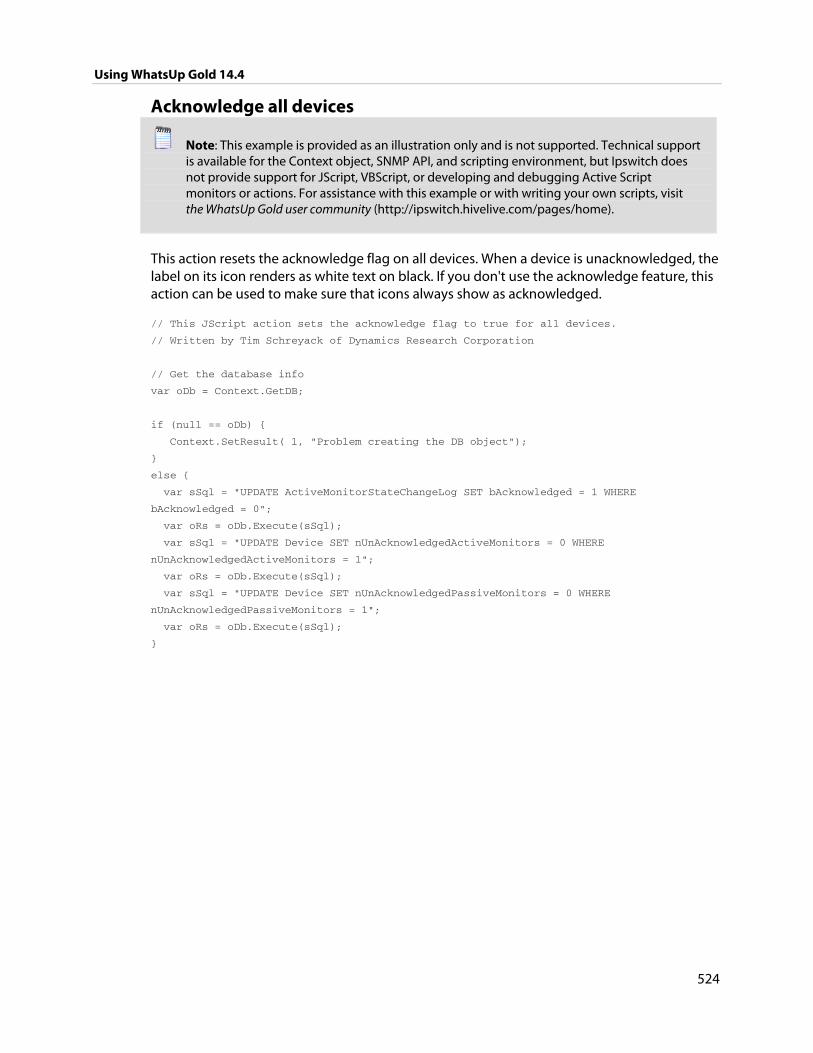
Using WhatsUp Gold 14.4
524
Acknowledge all devices
Note: This example is provided as an illustration only and is not supported. Technical support is available for the Context object, SNMP API, and scripting environment, but Ipswitch does not provide support for JScript, VBScript, or developing and debugging Active Script monitors or actions. For assistance with this example or with writing your own scripts, visit the WhatsUp Gold user community (http://ipswitch.hivelive.com/pages/home).
This action resets the acknowledge flag on all devices. When a device is unacknowledged, the label on its icon renders as white text on black. If you don't use the acknowledge feature, this action can be used to make sure that icons always show as acknowledged.
// This JScript action sets the acknowledge flag to true for all devices.
// Written by Tim Schreyack of Dynamics Research Corporation
// Get the database info
var oDb = Context.GetDB;
if (null == oDb) {
Context.SetResult( 1, "Problem creating the DB object");
}
else {
var sSql = "UPDATE ActiveMonitorStateChangeLog SET bAcknowledged = 1 WHERE
bAcknowledged = 0";
var oRs = oDb.Execute(sSql);
var sSql = "UPDATE Device SET nUnAcknowledgedActiveMonitors = 0 WHERE
nUnAcknowledgedActiveMonitors = 1";
var oRs = oDb.Execute(sSql);
var sSql = "UPDATE Device SET nUnAcknowledgedPassiveMonitors = 0 WHERE
nUnAcknowledgedPassiveMonitors = 1";
var oRs = oDb.Execute(sSql);
}
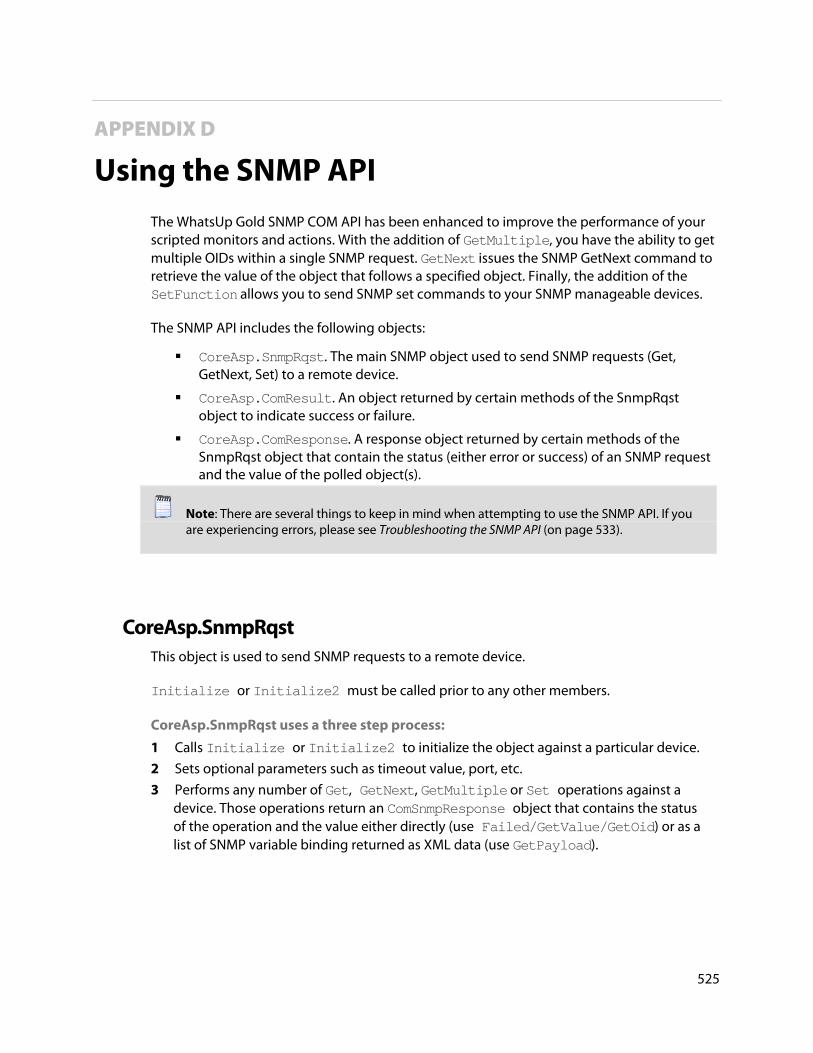
525
APPENDIX D
Using the SNMP API
The WhatsUp Gold SNMP COM API has been enhanced to improve the performance of your scripted monitors and actions. With the addition of GetMultiple, you have the ability to get multiple OIDs within a single SNMP request. GetNext issues the SNMP GetNext command to retrieve the value of the object that follows a specified object. Finally, the addition of the SetFunction allows you to send SNMP set commands to your SNMP manageable devices.
The SNMP API includes the following objects:
CoreAsp.SnmpRqst. The main SNMP object used to send SNMP requests (Get, GetNext, Set) to a remote device.
CoreAsp.ComResult. An object returned by certain methods of the SnmpRqst object to indicate success or failure.
CoreAsp.ComResponse. A response object returned by certain methods of the SnmpRqst object that contain the status (either error or success) of an SNMP request and the value of the polled object(s).
Note: There are several things to keep in mind when attempting to use the SNMP API. If you are experiencing errors, please see Troubleshooting the SNMP API (on page 533).
CoreAsp.SnmpRqst This object is used to send SNMP requests to a remote device.
Initialize or Initialize2 must be called prior to any other members.
CoreAsp.SnmpRqst uses a three step process:
1 Calls Initialize or Initialize2 to initialize the object against a particular device.
2 Sets optional parameters such as timeout value, port, etc.
3 Performs any number of Get, GetNext, GetMultiple or Set operations against a device. Those operations return an ComSnmpResponse object that contains the status of the operation and the value either directly (use Failed/GetValue/GetOid) or as a list of SNMP variable binding returned as XML data (use GetPayload).
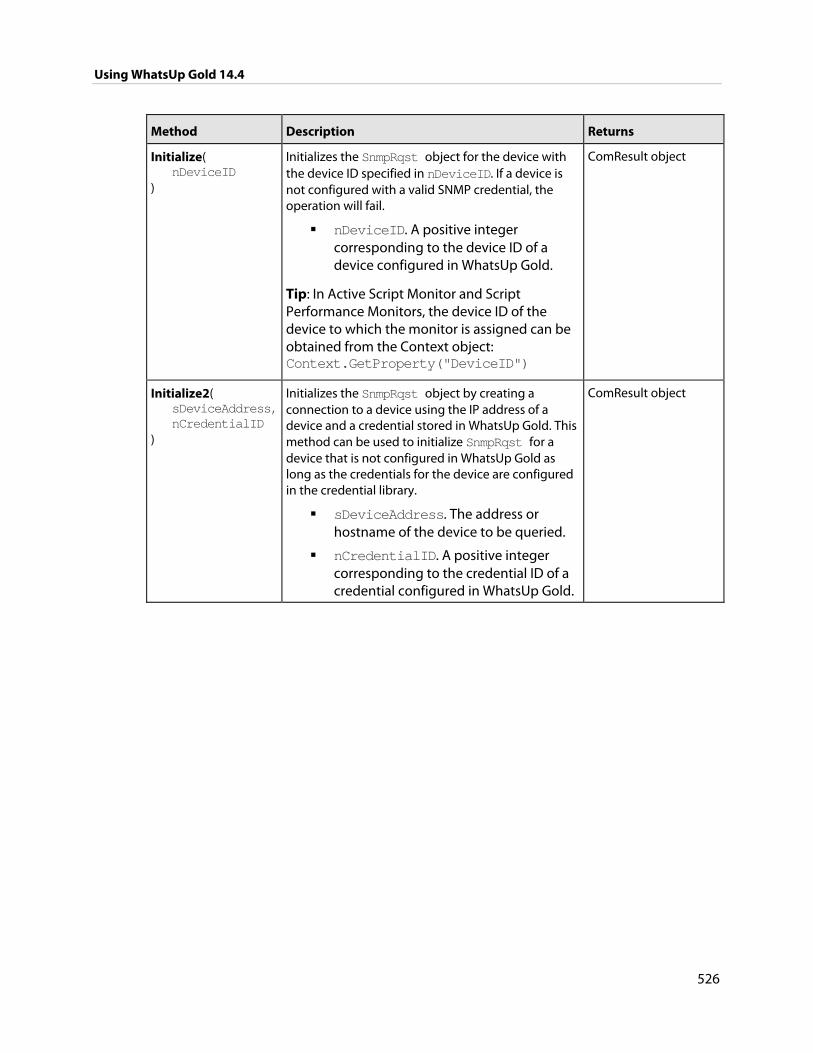
Using WhatsUp Gold 14.4
526
Method Description Returns
Initialize( nDeviceID )
Initializes the SnmpRqst object for the device with the device ID specified in nDeviceID. If a device is not configured with a valid SNMP credential, the operation will fail.
nDeviceID. A positive integer corresponding to the device ID of a device configured in WhatsUp Gold.
Tip: In Active Script Monitor and Script Performance Monitors, the device ID of the device to which the monitor is assigned can be obtained from the Context object: Context.GetProperty("DeviceID")
ComResult object
Initialize2( sDeviceAddress, nCredentialID )
Initializes the SnmpRqst object by creating a connection to a device using the IP address of a device and a credential stored in WhatsUp Gold. This method can be used to initialize SnmpRqst for a device that is not configured in WhatsUp Gold as long as the credentials for the device are configured in the credential library.
sDeviceAddress. The address or hostname of the device to be queried.
nCredentialID. A positive integer corresponding to the credential ID of a credential configured in WhatsUp Gold.
ComResult object
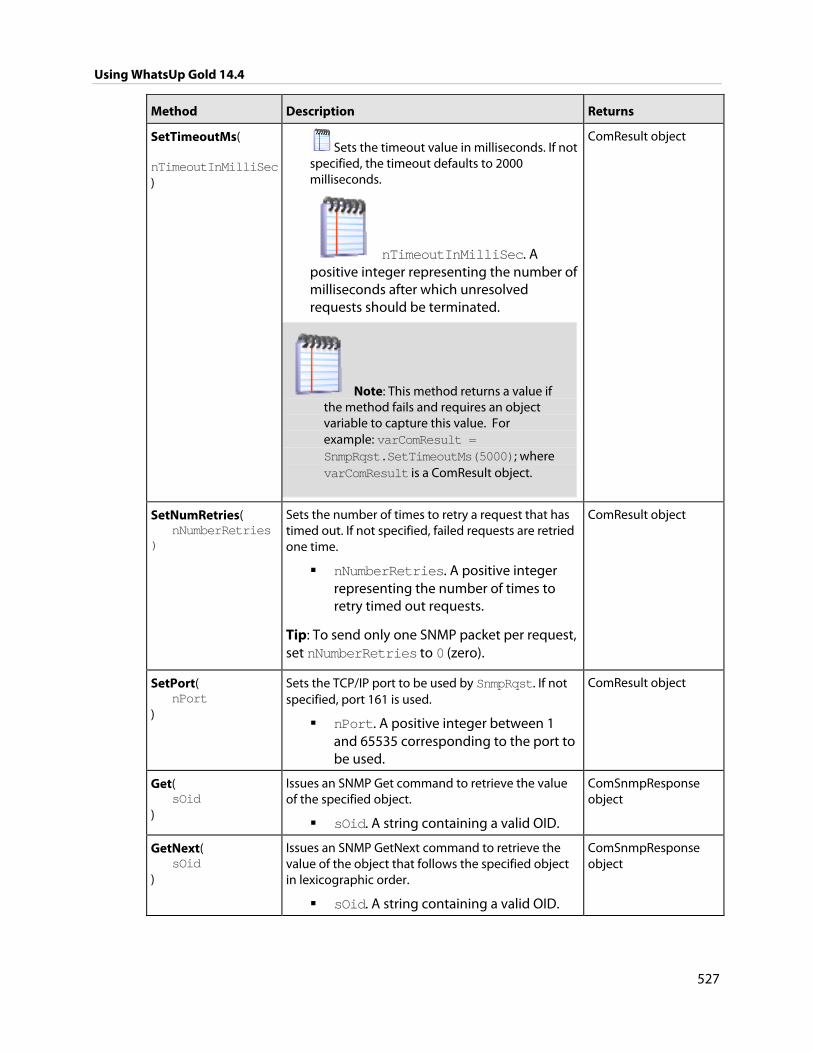
Using WhatsUp Gold 14.4
527
Method Description Returns
SetTimeoutMs( nTimeoutInMilliSec )
Sets the timeout value in milliseconds. If not specified, the timeout defaults to 2000 milliseconds.
nTimeoutInMilliSec. A positive integer representing the number of milliseconds after which unresolved requests should be terminated.
Note: This method returns a value if the method fails and requires an object variable to capture this value. For example: varComResult = SnmpRqst.SetTimeoutMs(5000); where varComResult is a ComResult object.
ComResult object
SetNumRetries( nNumberRetries )
Sets the number of times to retry a request that has timed out. If not specified, failed requests are retried one time.
nNumberRetries. A positive integer representing the number of times to retry timed out requests.
Tip: To send only one SNMP packet per request, set nNumberRetries to 0 (zero).
ComResult object
SetPort( nPort )
Sets the TCP/IP port to be used by SnmpRqst. If not specified, port 161 is used.
nPort. A positive integer between 1 and 65535 corresponding to the port to be used.
ComResult object
Get( sOid )
Issues an SNMP Get command to retrieve the value of the specified object.
sOid. A string containing a valid OID.
ComSnmpResponse object
GetNext( sOid )
Issues an SNMP GetNext command to retrieve the value of the object that follows the specified object in lexicographic order.
sOid. A string containing a valid OID.
ComSnmpResponse object
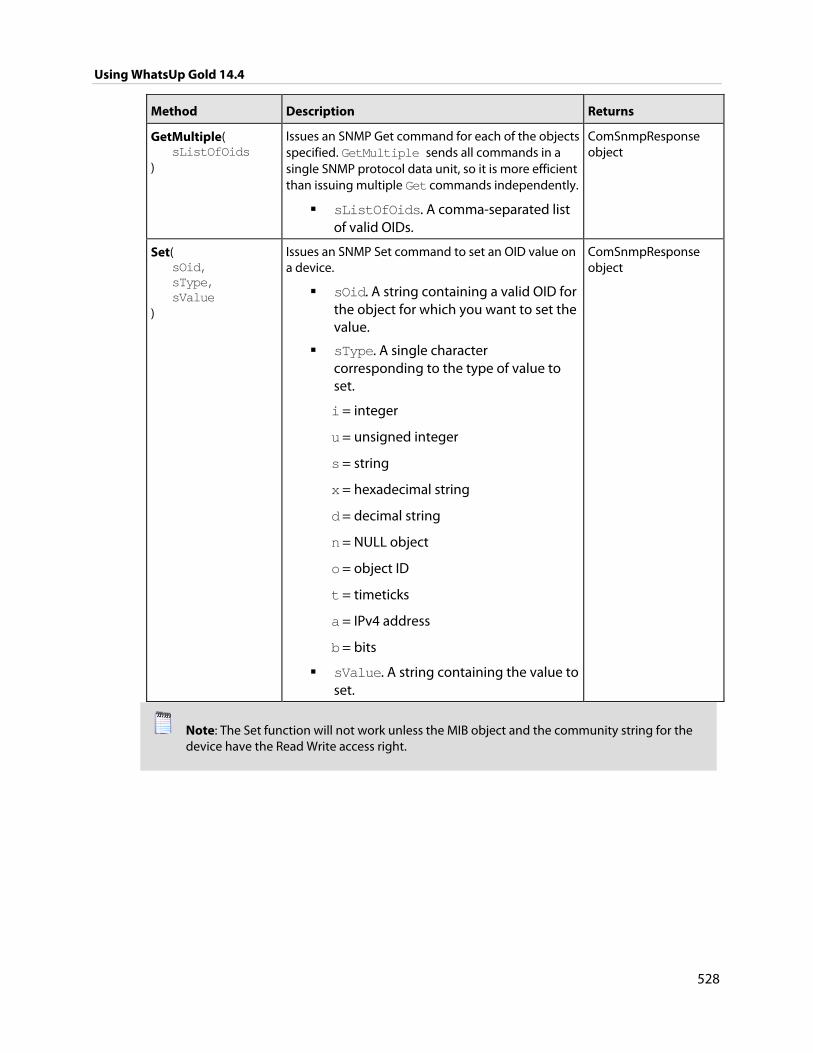
Using WhatsUp Gold 14.4
528
Method Description Returns
GetMultiple( sListOfOids )
Issues an SNMP Get command for each of the objects specified. GetMultiple sends all commands in a single SNMP protocol data unit, so it is more efficient than issuing multiple Get commands independently.
sListOfOids. A comma-separated list of valid OIDs.
ComSnmpResponse object
Set( sOid, sType, sValue )
Issues an SNMP Set command to set an OID value on a device.
sOid. A string containing a valid OID for the object for which you want to set the value.
sType. A single character corresponding to the type of value to set.
i = integer
u = unsigned integer
s = string
x = hexadecimal string
d = decimal string
n = NULL object
o = object ID
t = timeticks
a = IPv4 address
b = bits
sValue. A string containing the value to set.
ComSnmpResponse object
Note: The Set function will not work unless the MIB object and the community string for the device have the Read Write access right.
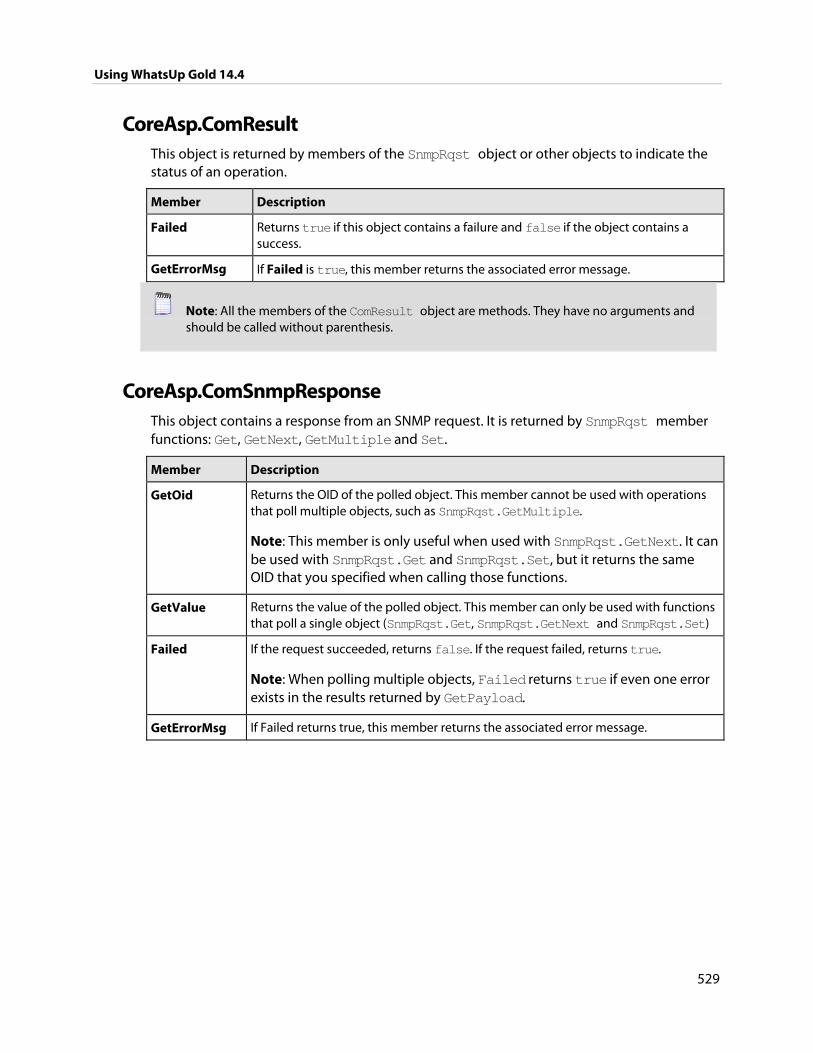
Using WhatsUp Gold 14.4
529
CoreAsp.ComResult This object is returned by members of the SnmpRqst object or other objects to indicate the status of an operation.
Member Description
Failed Returns true if this object contains a failure and false if the object contains a success.
GetErrorMsg If Failed is true, this member returns the associated error message.
Note: All the members of the ComResult object are methods. They have no arguments and should be called without parenthesis.
CoreAsp.ComSnmpResponse This object contains a response from an SNMP request. It is returned by SnmpRqst member functions: Get, GetNext, GetMultiple and Set.
Member Description
GetOid Returns the OID of the polled object. This member cannot be used with operations that poll multiple objects, such as SnmpRqst.GetMultiple.
Note: This member is only useful when used with SnmpRqst.GetNext. It can be used with SnmpRqst.Get and SnmpRqst.Set, but it returns the same OID that you specified when calling those functions.
GetValue Returns the value of the polled object. This member can only be used with functions that poll a single object (SnmpRqst.Get, SnmpRqst.GetNext and SnmpRqst.Set)
Failed If the request succeeded, returns false. If the request failed, returns true.
Note: When polling multiple objects, Failed returns true if even one error exists in the results returned by GetPayload.
GetErrorMsg If Failed returns true, this member returns the associated error message.
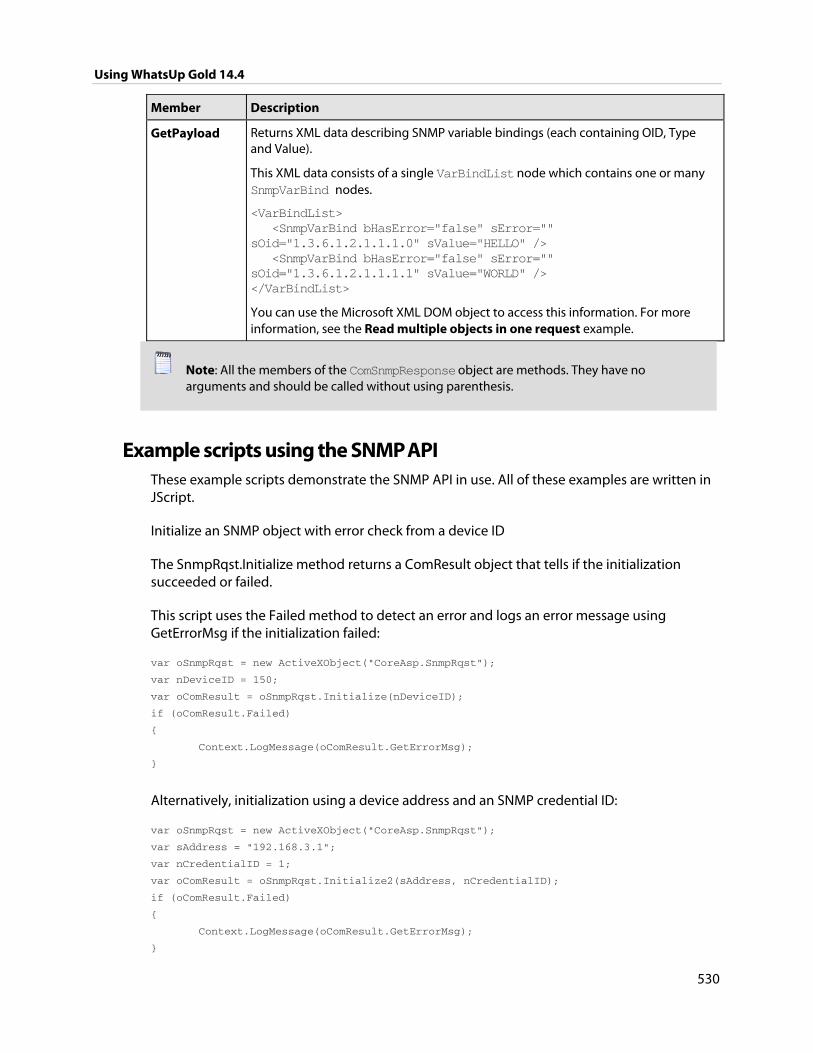
Using WhatsUp Gold 14.4
530
Member Description
GetPayload Returns XML data describing SNMP variable bindings (each containing OID, Type and Value).
This XML data consists of a single VarBindList node which contains one or many SnmpVarBind nodes.
<VarBindList> <SnmpVarBind bHasError="false" sError="" sOid="1.3.6.1.2.1.1.1.0" sValue="HELLO" /> <SnmpVarBind bHasError="false" sError="" sOid="1.3.6.1.2.1.1.1.1" sValue="WORLD" /> </VarBindList>
You can use the Microsoft XML DOM object to access this information. For more information, see the Read multiple objects in one request example.
Note: All the members of the ComSnmpResponse object are methods. They have no arguments and should be called without using parenthesis.
Example scripts using the SNMP API These example scripts demonstrate the SNMP API in use. All of these examples are written in JScript.
Initialize an SNMP object with error check from a device ID
The SnmpRqst.Initialize method returns a ComResult object that tells if the initialization succeeded or failed.
This script uses the Failed method to detect an error and logs an error message using GetErrorMsg if the initialization failed:
var oSnmpRqst = new ActiveXObject("CoreAsp.SnmpRqst");
var nDeviceID = 150;
var oComResult = oSnmpRqst.Initialize(nDeviceID);
if (oComResult.Failed)
{
Context.LogMessage(oComResult.GetErrorMsg);
}
Alternatively, initialization using a device address and an SNMP credential ID:
var oSnmpRqst = new ActiveXObject("CoreAsp.SnmpRqst");
var sAddress = "192.168.3.1";
var nCredentialID = 1;
var oComResult = oSnmpRqst.Initialize2(sAddress, nCredentialID);
if (oComResult.Failed)
{
Context.LogMessage(oComResult.GetErrorMsg);
}
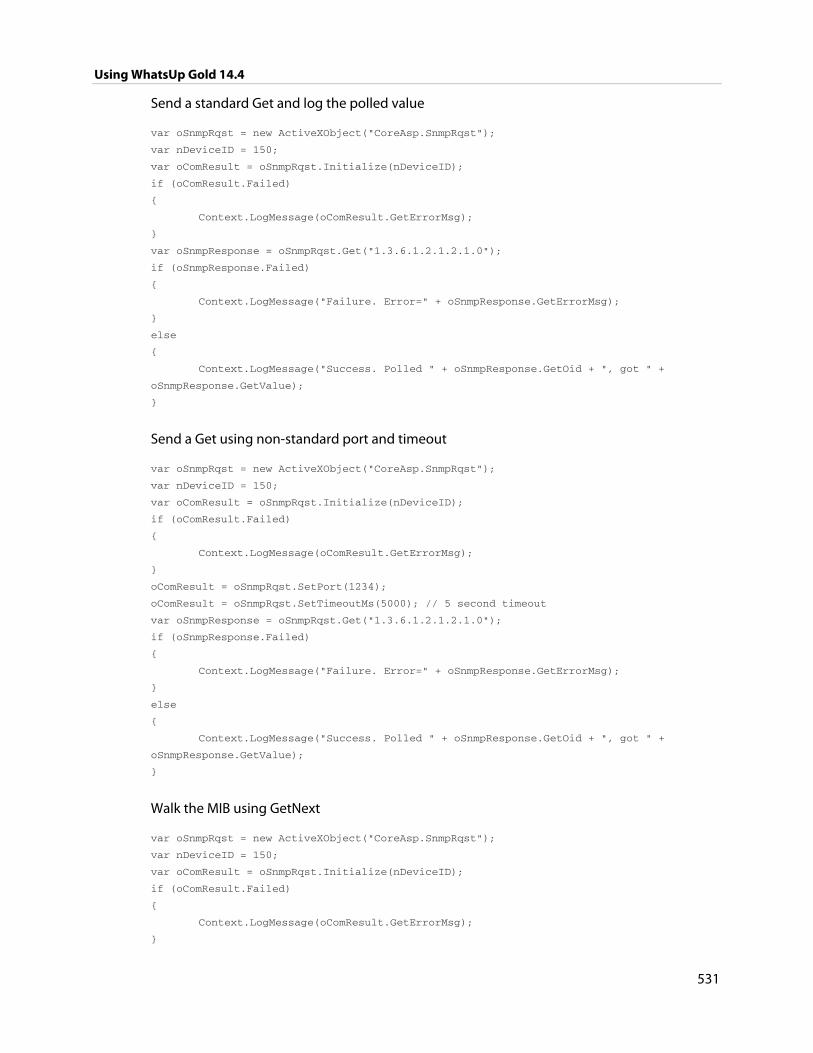
Using WhatsUp Gold 14.4
531
Send a standard Get and log the polled value
var oSnmpRqst = new ActiveXObject("CoreAsp.SnmpRqst");
var nDeviceID = 150;
var oComResult = oSnmpRqst.Initialize(nDeviceID);
if (oComResult.Failed)
{
Context.LogMessage(oComResult.GetErrorMsg);
}
var oSnmpResponse = oSnmpRqst.Get("1.3.6.1.2.1.2.1.0");
if (oSnmpResponse.Failed)
{
Context.LogMessage("Failure. Error=" + oSnmpResponse.GetErrorMsg);
}
else
{
Context.LogMessage("Success. Polled " + oSnmpResponse.GetOid + ", got " +
oSnmpResponse.GetValue);
}
Send a Get using non-standard port and timeout
var oSnmpRqst = new ActiveXObject("CoreAsp.SnmpRqst");
var nDeviceID = 150;
var oComResult = oSnmpRqst.Initialize(nDeviceID);
if (oComResult.Failed)
{
Context.LogMessage(oComResult.GetErrorMsg);
}
oComResult = oSnmpRqst.SetPort(1234);
oComResult = oSnmpRqst.SetTimeoutMs(5000); // 5 second timeout
var oSnmpResponse = oSnmpRqst.Get("1.3.6.1.2.1.2.1.0");
if (oSnmpResponse.Failed)
{
Context.LogMessage("Failure. Error=" + oSnmpResponse.GetErrorMsg);
}
else
{
Context.LogMessage("Success. Polled " + oSnmpResponse.GetOid + ", got " +
oSnmpResponse.GetValue);
}
Walk the MIB using GetNext
var oSnmpRqst = new ActiveXObject("CoreAsp.SnmpRqst");
var nDeviceID = 150;
var oComResult = oSnmpRqst.Initialize(nDeviceID);
if (oComResult.Failed)
{
Context.LogMessage(oComResult.GetErrorMsg);
}
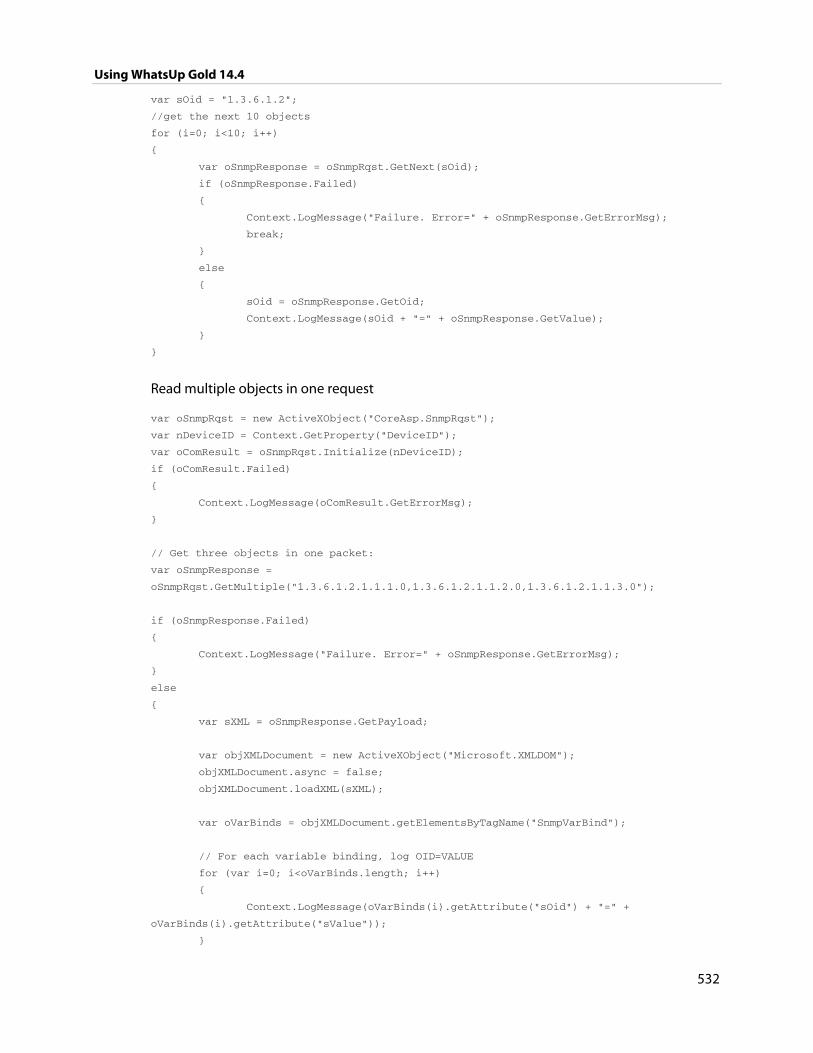
Using WhatsUp Gold 14.4
532
var sOid = "1.3.6.1.2";
//get the next 10 objects
for (i=0; i<10; i++)
{
var oSnmpResponse = oSnmpRqst.GetNext(sOid);
if (oSnmpResponse.Failed)
{
Context.LogMessage("Failure. Error=" + oSnmpResponse.GetErrorMsg);
break;
}
else
{
sOid = oSnmpResponse.GetOid;
Context.LogMessage(sOid + "=" + oSnmpResponse.GetValue);
}
}
Read multiple objects in one request
var oSnmpRqst = new ActiveXObject("CoreAsp.SnmpRqst");
var nDeviceID = Context.GetProperty("DeviceID");
var oComResult = oSnmpRqst.Initialize(nDeviceID);
if (oComResult.Failed)
{
Context.LogMessage(oComResult.GetErrorMsg);
}
// Get three objects in one packet:
var oSnmpResponse =
oSnmpRqst.GetMultiple("1.3.6.1.2.1.1.1.0,1.3.6.1.2.1.1.2.0,1.3.6.1.2.1.1.3.0");
if (oSnmpResponse.Failed)
{
Context.LogMessage("Failure. Error=" + oSnmpResponse.GetErrorMsg);
}
else
{
var sXML = oSnmpResponse.GetPayload;
var objXMLDocument = new ActiveXObject("Microsoft.XMLDOM");
objXMLDocument.async = false;
objXMLDocument.loadXML(sXML);
var oVarBinds = objXMLDocument.getElementsByTagName("SnmpVarBind");
// For each variable binding, log OID=VALUE
for (var i=0; i<oVarBinds.length; i++)
{
Context.LogMessage(oVarBinds(i).getAttribute("sOid") + "=" +
oVarBinds(i).getAttribute("sValue"));
}
Using WhatsUp Gold 14.4
533
}
Reboot a Cisco device using Set
Note: As of WhatsUp Gold v14, SNMP values can be set using the built-in SNMP Set Action. For more information, see Using an SNMP Set Action (on page 288).
var oSnmpRqst = new ActiveXObject("CoreAsp.SnmpRqst");
var nDeviceID = 150;
var oComResult = oSnmpRqst.Initialize(nDeviceID);
if (oComResult.Failed)
{
Context.LogMessage(oComResult.GetErrorMsg);
}
var oSnmpResponse = oSnmpRqst.Set("1.3.6.1.4.1.9.2.9.9.0", 'i', 2); /* reload */
if (oSnmpResponse.Failed)
{
Context.LogMessage("Failure. Error=" + oSnmpResponse.GetErrorMsg);
}
else
{
Context.LogMessage("Success. Polled " + oSnmpResponse.GetOid + ", got " +
oSnmpResponse.GetValue);
}
Troubleshooting the SNMP API There are several things to keep in mind as you attempt to use the SNMP API.
Different results for different versions Although the SNMP API works on all SNMP capable devices, the results returned depend on the SNMP version. For example, SNMPv1 and v2 return different results for the GetMultiple function. If one of the OIDs used in the fuction is incorrect, SNMPv1 returns only an error, while SNMPv2 returns results for the correct OIDs and an error for the incorrect OID.
The inability to work on certain versions of Windows with IPv6 The SNMP API does not work on the following versions of Windows when using IPv6:
Windows 2003
Windows XP
Windows Vista
Maximum packet size on routers and switches
Routers and switches have a default packet size limitation of 1500 bytes. The GetMultiple will return an error if the parameter size exceeds the limit.
Using WhatsUp Gold 14.4
534
APPENDIX E
Troubleshooting and Maintenance
In This Chapter
Troubleshooting your network ................................................................... 534
Maintaining the Database ............................................................................. 535
Recovering from a "Version Mismatch" error ......................................... 537
Task Tray Application fails on Windows Vista ........................................ 538
Connecting to a Remote Desktop .............................................................. 539
WhatsUp Gold engine message .................................................................. 539
Troubleshooting SNMP and WMI connections ...................................... 539
Re-enabling the Telnet protocol handler ................................................ 541
Passive Monitor payload limitation ........................................................... 541
Receiving entries in the SNMP Trap Log .................................................. 542
Restarting the WhatsUp Gold services from the command line ..... 542
Recommended SMS modems and troubleshooting tips ................... 543
Uninstalling Ipswitch WhatsUp Gold ........................................................ 544
Troubleshooting the WhatsUp Health Threshold................................. 545
Troubleshooting your network
WhatsUp Gold is a tool used to monitor your network. It is up to you to fix the items that WhatsUp Gold brings to light.
The following are questions you should think about while troubleshooting problems detected through WhatsUp Gold.
Is the entire subnet affected, or a single device?
Is the entire device affected, or a service monitor on the device?
What type of device is down?
Using WhatsUp Gold 14.4
535
Actions to take After you have determined the scope of the network problems, one of the following may help you fix the problem.
If it is the entire subnet that appears to be down, you should check your hub, router, or switch.
Begin with checking the physical connections of the device to the network and to the power supply. Check the network cables and power cables.
Check wireless network cards and signal strength.
Check the Health Detail Report to see whether a single monitor or the entire device is down. If the device is down, all of the monitors will appear to be down.
Using the Ping monitor, verify that the connection between the device and the network is up.
If a monitor appears to be down, try restarting the service that the monitor is watching. To restart a service, you must access the device directly; this cannot be done through WhatsUp Gold.
Maintaining the Database
You can use the WhatsUp database utilities to back up and restore the database and to perform database maintenance and troubleshooting. If you have a WhatsUp Gold Flow Monitor license, you can also back up and restore the Flow Monitor databases via the WhatsUp database utilities.
To access the database utilities, open the WhatsUp Gold console, then select Tools > Database Utilities from the main menu.
About the database tools The database tools let you manage index fragmentation and purge expired data.
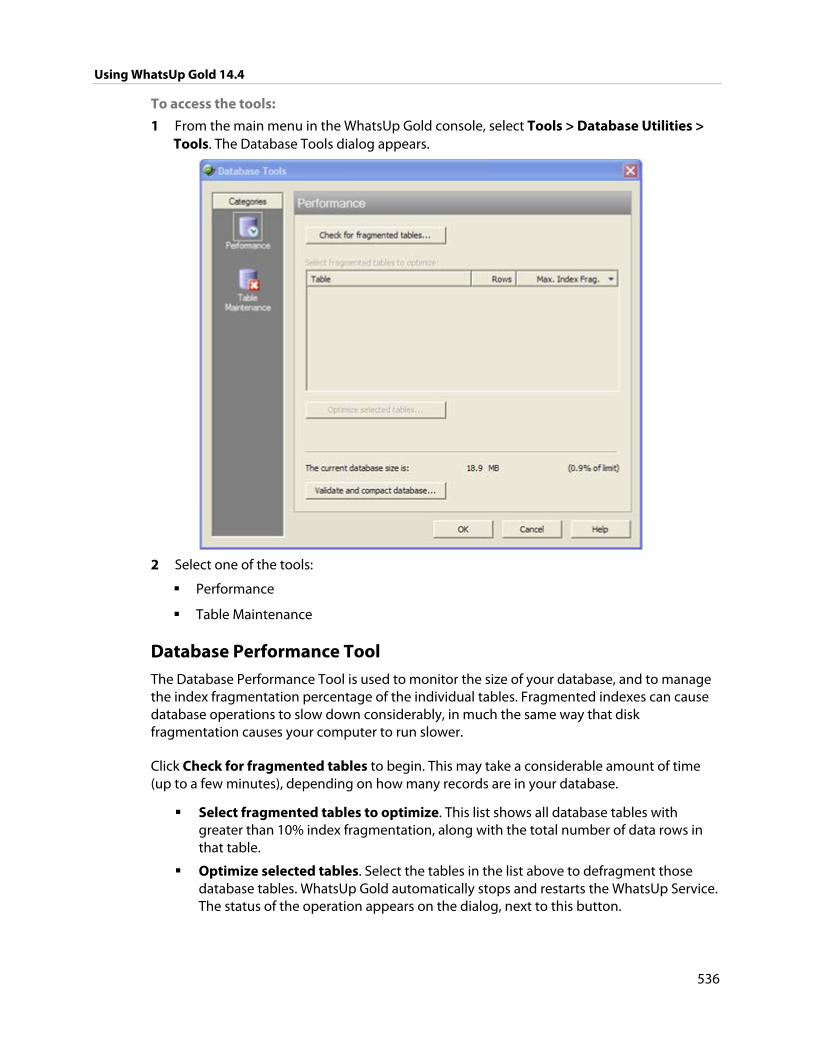
Using WhatsUp Gold 14.4
536
To access the tools:
1 From the main menu in the WhatsUp Gold console, select Tools > Database Utilities > Tools. The Database Tools dialog appears.
2 Select one of the tools:
Performance
Table Maintenance
Database Performance Tool The Database Performance Tool is used to monitor the size of your database, and to manage the index fragmentation percentage of the individual tables. Fragmented indexes can cause database operations to slow down considerably, in much the same way that disk fragmentation causes your computer to run slower.
Click Check for fragmented tables to begin. This may take a considerable amount of time (up to a few minutes), depending on how many records are in your database.
Select fragmented tables to optimize. This list shows all database tables with greater than 10% index fragmentation, along with the total number of data rows in that table.
Optimize selected tables. Select the tables in the list above to defragment those database tables. WhatsUp Gold automatically stops and restarts the WhatsUp Service. The status of the operation appears on the dialog, next to this button.
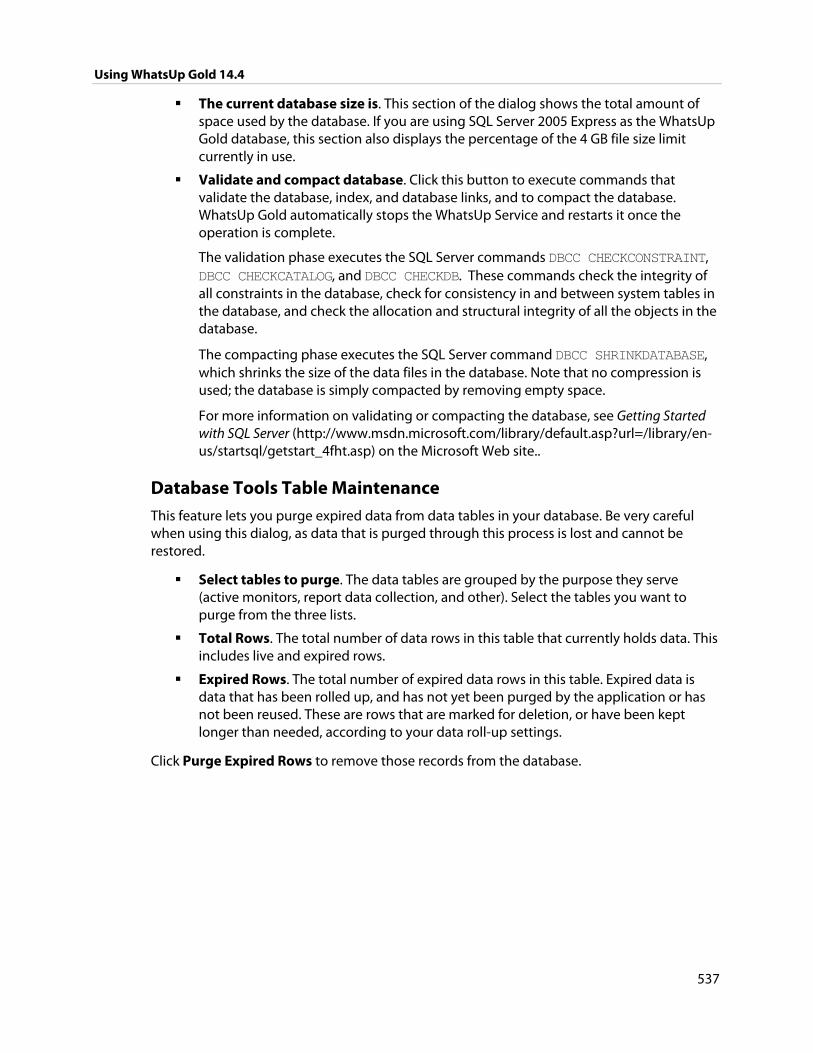
Using WhatsUp Gold 14.4
537
The current database size is. This section of the dialog shows the total amount of space used by the database. If you are using SQL Server 2005 Express as the WhatsUp Gold database, this section also displays the percentage of the 4 GB file size limit currently in use.
Validate and compact database. Click this button to execute commands that validate the database, index, and database links, and to compact the database. WhatsUp Gold automatically stops the WhatsUp Service and restarts it once the operation is complete.
The validation phase executes the SQL Server commands DBCC CHECKCONSTRAINT, DBCC CHECKCATALOG, and DBCC CHECKDB. These commands check the integrity of all constraints in the database, check for consistency in and between system tables in the database, and check the allocation and structural integrity of all the objects in the database.
The compacting phase executes the SQL Server command DBCC SHRINKDATABASE, which shrinks the size of the data files in the database. Note that no compression is used; the database is simply compacted by removing empty space.
For more information on validating or compacting the database, see Getting Started with SQL Server (http://www.msdn.microsoft.com/library/default.asp?url=/library/en-us/startsql/getstart_4fht.asp) on the Microsoft Web site..
Database Tools Table Maintenance This feature lets you purge expired data from data tables in your database. Be very careful when using this dialog, as data that is purged through this process is lost and cannot be restored.
Select tables to purge. The data tables are grouped by the purpose they serve (active monitors, report data collection, and other). Select the tables you want to purge from the three lists.
Total Rows. The total number of data rows in this table that currently holds data. This includes live and expired rows.
Expired Rows. The total number of expired data rows in this table. Expired data is data that has been rolled up, and has not yet been purged by the application or has not been reused. These are rows that are marked for deletion, or have been kept longer than needed, according to your data roll-up settings.
Click Purge Expired Rows to remove those records from the database.
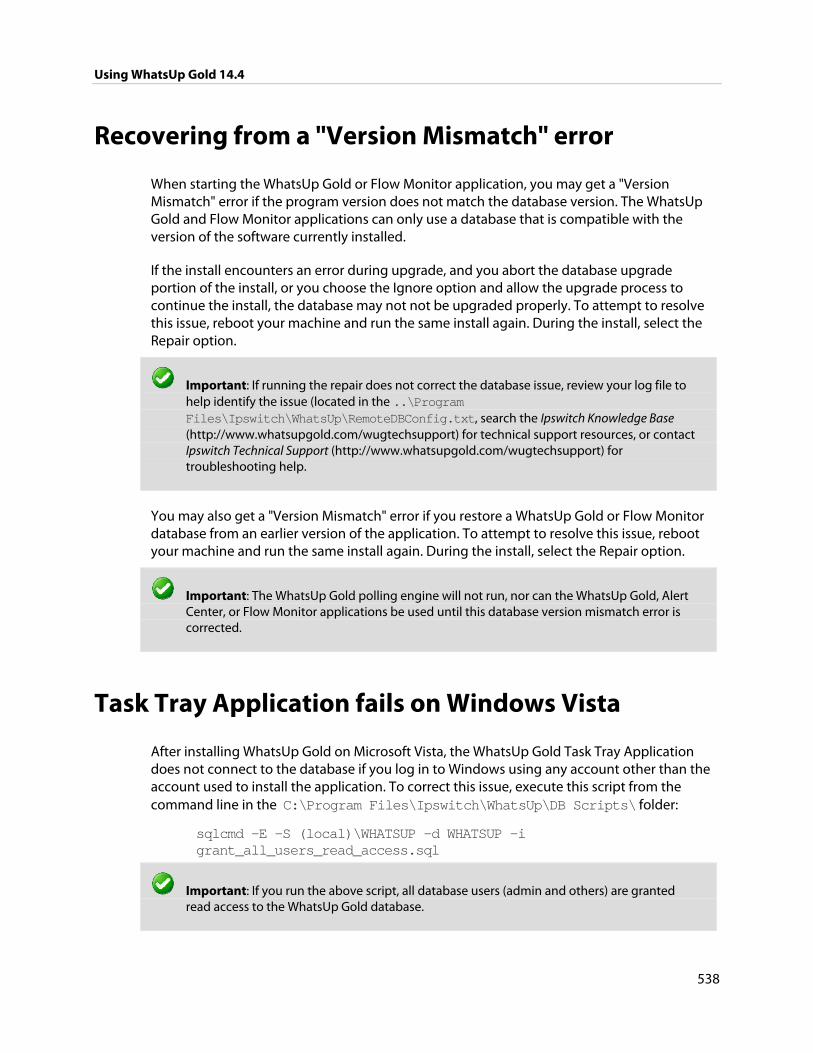
Using WhatsUp Gold 14.4
538
Recovering from a "Version Mismatch" error
When starting the WhatsUp Gold or Flow Monitor application, you may get a "Version Mismatch" error if the program version does not match the database version. The WhatsUp Gold and Flow Monitor applications can only use a database that is compatible with the version of the software currently installed.
If the install encounters an error during upgrade, and you abort the database upgrade portion of the install, or you choose the Ignore option and allow the upgrade process to continue the install, the database may not not be upgraded properly. To attempt to resolve this issue, reboot your machine and run the same install again. During the install, select the Repair option.
Important: If running the repair does not correct the database issue, review your log file to help identify the issue (located in the ..\Program Files\Ipswitch\WhatsUp\RemoteDBConfig.txt, search the Ipswitch Knowledge Base (http://www.whatsupgold.com/wugtechsupport) for technical support resources, or contact Ipswitch Technical Support (http://www.whatsupgold.com/wugtechsupport) for troubleshooting help.
You may also get a "Version Mismatch" error if you restore a WhatsUp Gold or Flow Monitor database from an earlier version of the application. To attempt to resolve this issue, reboot your machine and run the same install again. During the install, select the Repair option.
Important: The WhatsUp Gold polling engine will not run, nor can the WhatsUp Gold, Alert Center, or Flow Monitor applications be used until this database version mismatch error is corrected.
Task Tray Application fails on Windows Vista
After installing WhatsUp Gold on Microsoft Vista, the WhatsUp Gold Task Tray Application does not connect to the database if you log in to Windows using any account other than the account used to install the application. To correct this issue, execute this script from the command line in the C:\Program Files\Ipswitch\WhatsUp\DB Scripts\ folder:
sqlcmd -E -S (local)\WHATSUP -d WHATSUP -i grant_all_users_read_access.sql
Important: If you run the above script, all database users (admin and others) are granted read access to the WhatsUp Gold database.
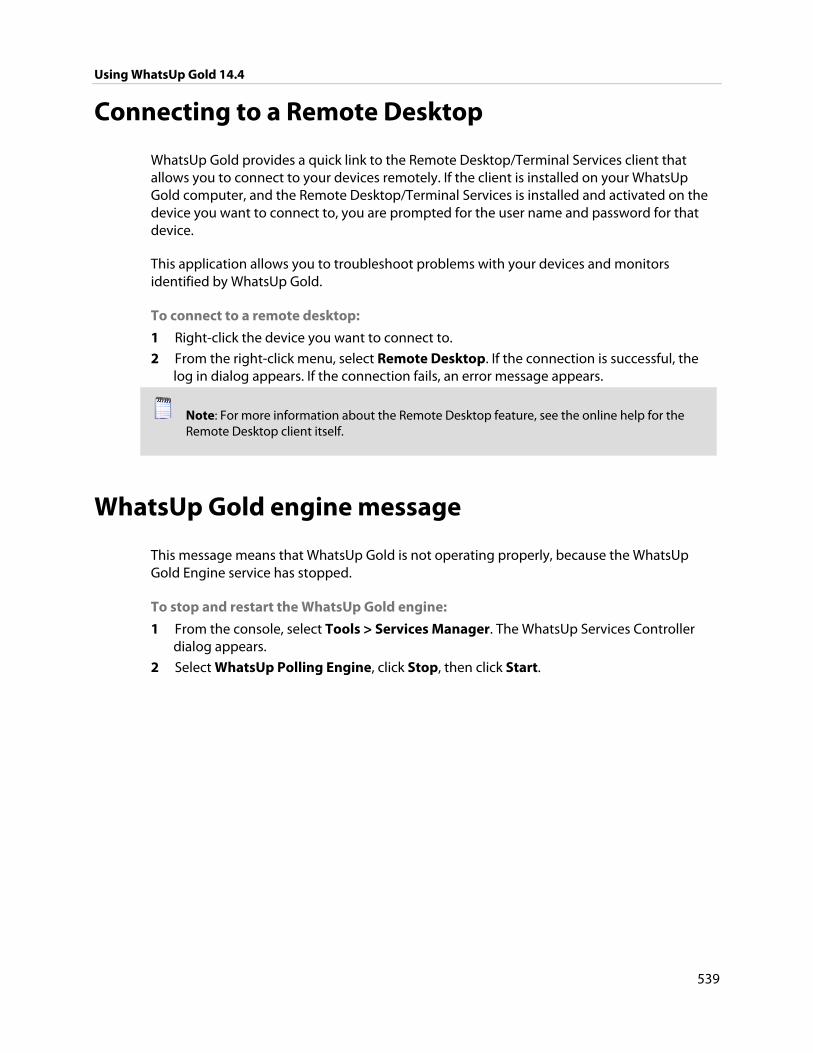
Using WhatsUp Gold 14.4
539
Connecting to a Remote Desktop
WhatsUp Gold provides a quick link to the Remote Desktop/Terminal Services client that allows you to connect to your devices remotely. If the client is installed on your WhatsUp Gold computer, and the Remote Desktop/Terminal Services is installed and activated on the device you want to connect to, you are prompted for the user name and password for that device.
This application allows you to troubleshoot problems with your devices and monitors identified by WhatsUp Gold.
To connect to a remote desktop:
1 Right-click the device you want to connect to.
2 From the right-click menu, select Remote Desktop. If the connection is successful, the log in dialog appears. If the connection fails, an error message appears.
Note: For more information about the Remote Desktop feature, see the online help for the Remote Desktop client itself.
WhatsUp Gold engine message
This message means that WhatsUp Gold is not operating properly, because the WhatsUp Gold Engine service has stopped.
To stop and restart the WhatsUp Gold engine:
1 From the console, select Tools > Services Manager. The WhatsUp Services Controller dialog appears.
2 Select WhatsUp Polling Engine, click Stop, then click Start.
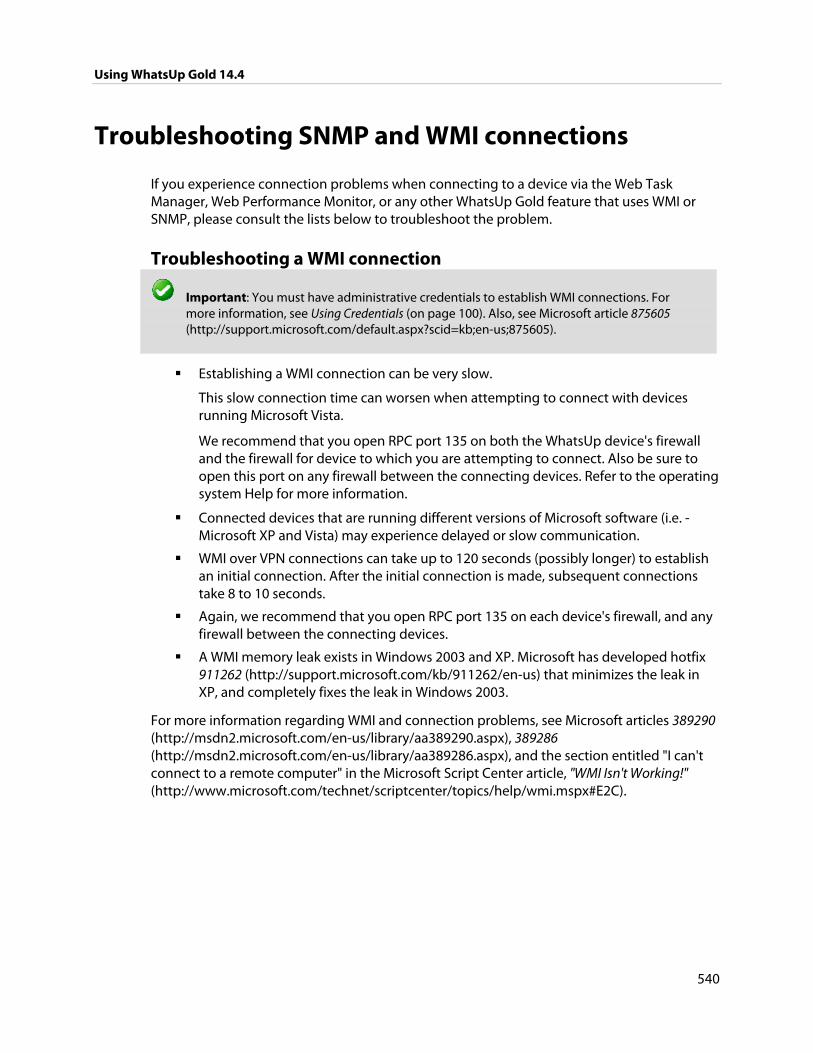
Using WhatsUp Gold 14.4
540
Troubleshooting SNMP and WMI connections
If you experience connection problems when connecting to a device via the Web Task Manager, Web Performance Monitor, or any other WhatsUp Gold feature that uses WMI or SNMP, please consult the lists below to troubleshoot the problem.
Troubleshooting a WMI connection
Important: You must have administrative credentials to establish WMI connections. For more information, see Using Credentials (on page 100). Also, see Microsoft article 875605 (http://support.microsoft.com/default.aspx?scid=kb;en-us;875605).
Establishing a WMI connection can be very slow.
This slow connection time can worsen when attempting to connect with devices running Microsoft Vista.
We recommend that you open RPC port 135 on both the WhatsUp device's firewall and the firewall for device to which you are attempting to connect. Also be sure to open this port on any firewall between the connecting devices. Refer to the operating system Help for more information.
Connected devices that are running different versions of Microsoft software (i.e. - Microsoft XP and Vista) may experience delayed or slow communication.
WMI over VPN connections can take up to 120 seconds (possibly longer) to establish an initial connection. After the initial connection is made, subsequent connections take 8 to 10 seconds.
Again, we recommend that you open RPC port 135 on each device's firewall, and any firewall between the connecting devices.
A WMI memory leak exists in Windows 2003 and XP. Microsoft has developed hotfix 911262 (http://support.microsoft.com/kb/911262/en-us) that minimizes the leak in XP, and completely fixes the leak in Windows 2003.
For more information regarding WMI and connection problems, see Microsoft articles 389290 (http://msdn2.microsoft.com/en-us/library/aa389290.aspx), 389286 (http://msdn2.microsoft.com/en-us/library/aa389286.aspx), and the section entitled "I can't connect to a remote computer" in the Microsoft Script Center article, "WMI Isn't Working!" (http://www.microsoft.com/technet/scriptcenter/topics/help/wmi.mspx#E2C).
Using WhatsUp Gold 14.4
541
Troubleshooting an SNMP connection
Important: The SNMP Trap Listener must be enabled to collect data for the SNMP Trap Log. To enable the WhatsUp Gold SNMP Trap Listener, the Microsoft SNMP Trap Listener must be disabled. Also, be sure to open SNMP port 162 for incoming SNMP traps.
If you receive invalid values when attempting to monitor the IfOperStatus OID from a device running Vista, download Microsoft's hotfix 935876 (http://support.microsoft.com/kb/935876) to solve the problem.
If you experience connection problems with a specific device, ensure that the device has SNMP enabled. Also ensure that SNMP port 161 is open on the device you are attempting to monitor.
If you get what looks like a "stair-step" in your CPU and Process Utilization graphs, this is caused by Microsoft's 60-second polling interval. Increasing WhatsUp Gold's polling interval could help compensate for the lengthy Microsoft polling interval.
Similarly, if you experience delays and/or unexpected, weird spikes in your graphs, try increasing the polling interval.
Re-enabling the Telnet protocol handler
The Telnet protocol handler is disabled by default in Microsoft Internet Explorer 7. In order to use the Telnet tool in WhatsUp Gold, you need to re-enable the Telnet protocol.
To re-enable the Telnet protocol:
1 Click Start > Run. The Run dialog box opens.
2 In the Open box, enter: Regedit, then click OK. The Registry Editor opens.
3 Go to the following key:
HKEY_LOCAL_MACHINE\SOFTWARE\Microsoft\Internet Explorer\Main\FeatureControl
4 Under the HKEY_LOCAL_MACHINE\SOFTWARE\Microsoft\Internet Explorer\Main\FeatureControl, create a new key named FEATURE_DISABLE_TELNET_PROTOCOL.
5 Add a DWORD value named iexplore.exe and set the value to 0 (decimal).
6 Close the Registry Editor and restart Microsoft Internet Explorer 7. The Telnet protocol is enabled.
Using WhatsUp Gold 14.4
542
Passive Monitor payload limitation
Passive monitors have a payload limitation of 3 KB for WMI, SNMP, and Syslog Passive Monitors.
Receiving entries in the SNMP Trap Log
In order for entries to be added to the SNMP Trap Log, the SNMP Trap Listener must be enabled. For more information, see Enabling the SNMP Trap Listener.
Additionally, if the trap receiving port is not on the firewall's list of exceptions, traps may not be receivable, and as a result, will not be added to the SNMP Trap Log. Please ensure that the trap receiving port is on the firewall's list of exceptions.
Restarting the WhatsUp Gold services from the command line
You can quickly restart the WhatsUp Gold polling engine and the Ipswitch Web Server using the NmServiceRestart.exe command line utility. This utility can be called directly from the command line or from batch scripts or scheduled tasks as part of your automated processes.
Usage NmServiceRestart.exe [/s] [/p] [/w]
Parameter Description
/s Run in silent mode. When this option is included, the utility does not report any feedback.
/p Restart the WhatsUp Gold polling engine only.
/w Restart the Ipswitch Web Server only.
Note: If both /p and /w are specified, the utility restarts both services. If only one is specified, the utility restarts only the service that is specified.
Tip: You can use the WhatsUp Services Controller dialog (Ipswitch Service Control Manager) to manage services. For more information, see About the WhatsUp Services Controller (on page 96).
Using WhatsUp Gold 14.4
543
Recommended SMS modems and troubleshooting tips
Ipswitch has tested the following SMS modems for use with the SMS Direct Action (not the SMS Action):
Motorola® RAZR V3 (http://www.motorola.com) (Recommended)
This cell phone was connected to the WhatsUp device acting as a GSM modem.
MultiModem® GPRS external wireless modem (http://www.multitech.com/PRODUCTS/Families/MultiModemGPRS/), model: MTCBA-G-F2
Siemens TC65 Terminal (http://www.usa.siemens.com)
Unlike the other modems that have their own drivers to install, this modem did not have specific drivers to install. The Windows Standard 56000 bps modem driver was used with the maximum port speed set to 115200.
Falcom Samba 75 (GSM/GPRS/EDGE) (http://www.falcomusa.com)
Note: Falcom Samba 75 modem is not supported on Windows Server operating systems.
Vodaphone USB modem for SMS Direct ( (http://www.vodafone.com/index.VF.html)tested on Huawei, Model E220, HSDPA USB modem)
ConiuGo GPRS GSM Quadband Modem / USB-Busp (850, 900, 1800 & 1900 MHz) http://www.coniugo.com/pdf/e_gprs_gsm_quadband_modem_rs232_usb.pdf
Zoom 56k serial modem (http://www.zoomtel.com/graphics/datasheets/dial_up/30481101.pdf)
To consider GSM networks operate in the 850/900/1800/1900 Mhz bands.
GSM modems are typically either dual or quad band.
Note: You must acquire a dual modem that operates at the correct frequency, or purchase a quad band modem.
European markets typically use 900/1800 Mhz capable devices.
The U.S. and Canada use 850/1900 Mhz capable devices.
Using WhatsUp Gold 14.4
544
Troubleshooting SMS Modems If an SMS modem is not working as expected, verify that the communications port (COM port) to which the modem is attached is configured to use settings supported by the modem.
1 In the Windows Control Panel, double-click Device Manager. The Device Manager appears.
2 Expand Ports.
3 Double-click the communications port used by the SMS modem. The Communications Port Properties dialog appears.
4 Select the Port Settings tab.
5 Using the documentation provided by the modem manufacturer, verify that the port settings listed are supported by the modem. If the listed settings are not supported, make any necessary changes.
Note: If you are using the MultiModem® GPRS external wireless modem, model MTCBA-G-F2, set Flow Control to Hardware.
6 Click OK to save changes.
Using line feeds and carriage returns to correct SMS modem issues Some SMS Direct enabled phones do not work correctly with SMS Direct Actions because new line characters are not always handled properly. This issue may be corrected by adding the following new registry key entry:
HKEY_LOCAL_MACHINE\SOFTWARE\Ipswitch\Network Monitor\Whatsup plug-ins\Actions\ActSmsDirect\NewLine
In the Value data box, enter a combination of a carriage return (\r) and/or line feed (\n) command. For example enter one of the following:
newline \r\n (recommended)
newline \r
newline \n
Using WhatsUp Gold 14.4
545
Uninstalling Ipswitch WhatsUp Gold
To uninstall Ipswitch WhatsUp Gold:
1 Select Start > Settings > Control Panel, then select Add or Remove Programs.
2 Select Ipswitch WhatsUp Gold.
3 Select Remove.
You can also run the Ipswitch WhatsUp Gold installation program, then select Remove.
Select one of the following dialog options:
Remove the WhatsUp Gold application, but leave network data I have collected intact. This uninstalls the WhatsUp Gold program but keeps all your WhatsUp configuration data as well as the monitoring data you have collected. SQL Server 2005 Express will not be uninstalled.
Remove both the WhatsUp Gold application, and all network data I have collected. This uninstalls the WhatsUp program and removes all of your WhatsUp configuration and monitoring data.
Also, remove the "WhatsUp" copy of SQL Server Express Edition. This also removes the "WhatsUp" SQL Server 2005 Express Edition instance that was created during the installation. Select this option to remove ALL WhatsUp components from the system.
Note: When this option is selected, WhatsUp Gold leaves SOME data behind, such as the \HTML directory and the \Data directory for situations where there may be user-modified or user-created files in those directories.
Troubleshooting the WhatsUp Health Threshold
If you are encountering errors in the Alert Center Log after configuring and running the WhatsUp Health Threshold's service checks, there are several steps you can take to troubleshoot the occurrence of these errors.
First, from a CMD window, run the following commands:
Windows XP and later
wmiadap/clearadap
wmiadap/resyncperf

Using WhatsUp Gold 14.4
546
Windows 2000
winmgmt/clearadap
winmgmt/resyncperf
Note: These commands may take some time to execute.
If after running these commands the errors persists, run the Microsoft WMI Diagnosis Utility, found on Microsoft's web site: http://www.microsoft.com/downloads/details.aspx?familyid=d7ba3cd6-18d1-4d05-b11e-4c64192ae97d&displaylang=en
Terminal Services
Additionally, you may encounter problems with your service-level threshold checks if you are using Microsoft Terminal Services (Remote Desktop Services) to run the WhatsUp Gold web server. If more than one person is logged in to Terminal Services at a time, the following WhatsUp Health Threshold service checks/performance counters may fail:
WhatsUp polling service SQL query check
WhatsUp web service HTTP response check
WhatsUp web service SQL query check
You may experience a high volume of errors logged to the Alert Center Log from these service checks until the number of Terminal Service users drops to one or none.
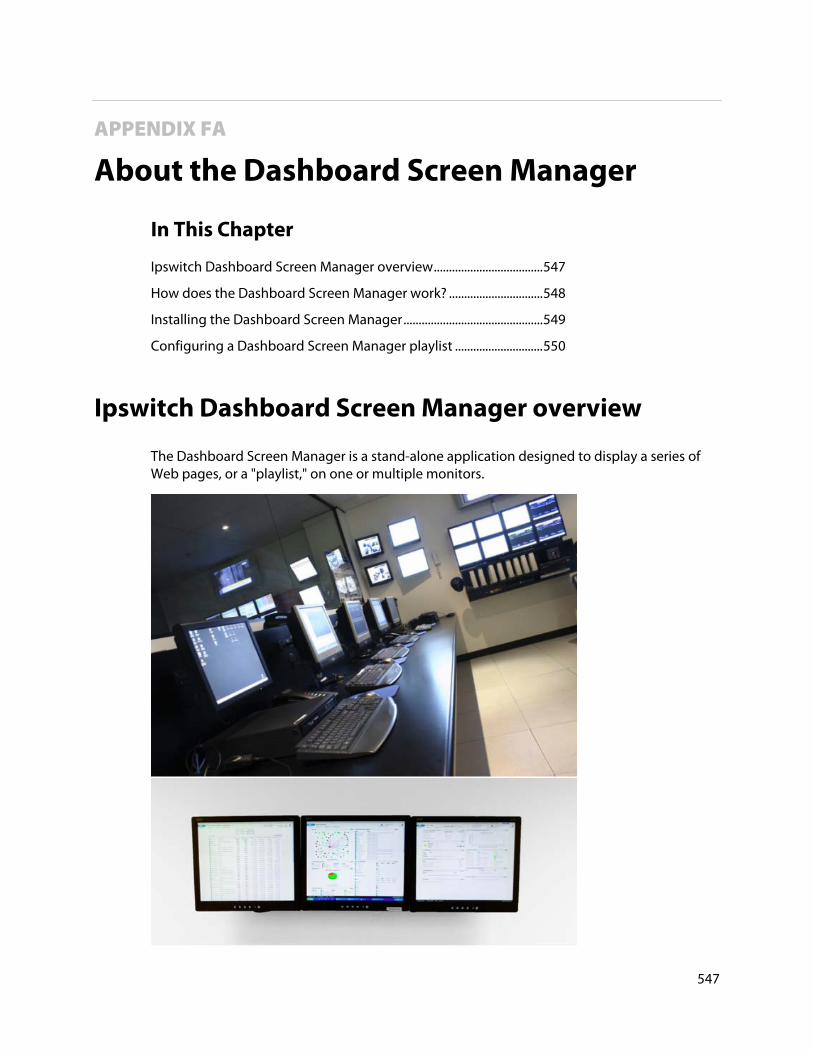
547
APPENDIX FA
About the Dashboard Screen Manager
In This Chapter
Ipswitch Dashboard Screen Manager overview .................................... 547
How does the Dashboard Screen Manager work? ............................... 548
Installing the Dashboard Screen Manager .............................................. 549
Configuring a Dashboard Screen Manager playlist ............................. 550
Ipswitch Dashboard Screen Manager overview
The Dashboard Screen Manager is a stand-alone application designed to display a series of Web pages, or a "playlist," on one or multiple monitors.
Using WhatsUp Gold 14.4
548
The Dashboard was created as a complement to the Ipswitch network monitoring application, WhatsUp Gold, and as an aid to keeping your network visible. The Dashboard application is included in the WhatsUp Gold and WhatsUp Gold Central and Remote Site installations.
The Dashboard can run on a display console and cycle through various pages from the WhatsUp Gold web interface. Network administrators then have important and pertinent network information on display at all times, cycling and changing on its own without the need of constant configuration. It also provides the capability to view multiple networks that you are monitoring simultaneously.
Though the Dashboard Screen Manager was created to work along-side WhatsUp Gold, it can display virtually any Web page. For example, an Internet business providing service to a small town in the desert glances at one screen on the Dashboard and sees that the connectivity to the town is down. By displaying the weather for this town on another screen at the same time, the network administrator is able to see that the extreme temperatures of the day have likely caused problems for the cable transmitters.
Note: If you want to display a password protected page for another Web application, you must supply a valid username and password for the page. For more information, see the Dashboard application Help.
For more information about the Dashboard playlists, see Configuring a Dashboard Playlist (on page 550).
For more information about configuring a multi-monitor network display, see Setting up a WhatsUp Multi-Monitor Network Display, located on the WhatsUp Gold Web site (http://www.whatsupgold.com/WhatsConfigured).
How does the Dashboard Screen Manager work?
In order for the Dashboard to work, it needs:
1 A monitor, or several monitors
2 A playlist for each monitor
The Dashboard displays a single playlist on every monitor you configure for use with the Dashboard. You can configure as many monitors as you would like for use with the Dashboard.
Using WhatsUp Gold 14.4
549
What is a Dashboard playlist? On the Dashboard Screen Manager, a playlist is a list of Web pages the Dashboard displays on a single monitor. A playlist can consist of one single, or multiple Web pages. When a playlist is configured with a single Web page, this single page is refreshed on a user-specified refresh interval. When a playlist is configured with multiple Web pages, the playlist cycles through the pages also on a user-specified interval.
Installing the Dashboard Screen Manager
On the device you wish to install the Ipswitch Dashboard Screen Manager:
1 Log on to an Administrator account.
2 Start the installation program:
If you downloaded the Dashboard from the Ipswitch Web site, run the downloaded installation application.
3 Read the Welcome screen. Click Next to continue.
4 Read the license agreement. Select the appropriate option, then click Next.
5 Select the install directory for the Dashboard. The default is:
C:\Program Files\Ipswitch\Dashboard
To browse and select an install directory different than that of the default location, click Change.
Click Next to continue.
6 Click Install to install the Ipswitch Dashboard.
Note: To terminate the installation once it has began, click Cancel.
7 Make your selection, then click Finish.
Disable script debugging in Internet Explorer After you have installed the Dashboard Screen Manager, it is important that you make sure script debugging is disabled. Otherwise, a debugging program will pop-up and could crash the Dashboard. By default, script debugging is disabled, but if you are unsure or know that you have it enabled, you can check this setting in Internet Explorer.
To disable script debugging in Internet Explorer:
1 Open Internet Explorer and go to Tools > Internet Options. The Internet Options dialog appears.
2 Select the Advanced tab.
3 Scroll down and check the Disable Script Debugging (Internet Explorer) and the Disable Script Debugging (Other) options.
4 Click OK to save changes.
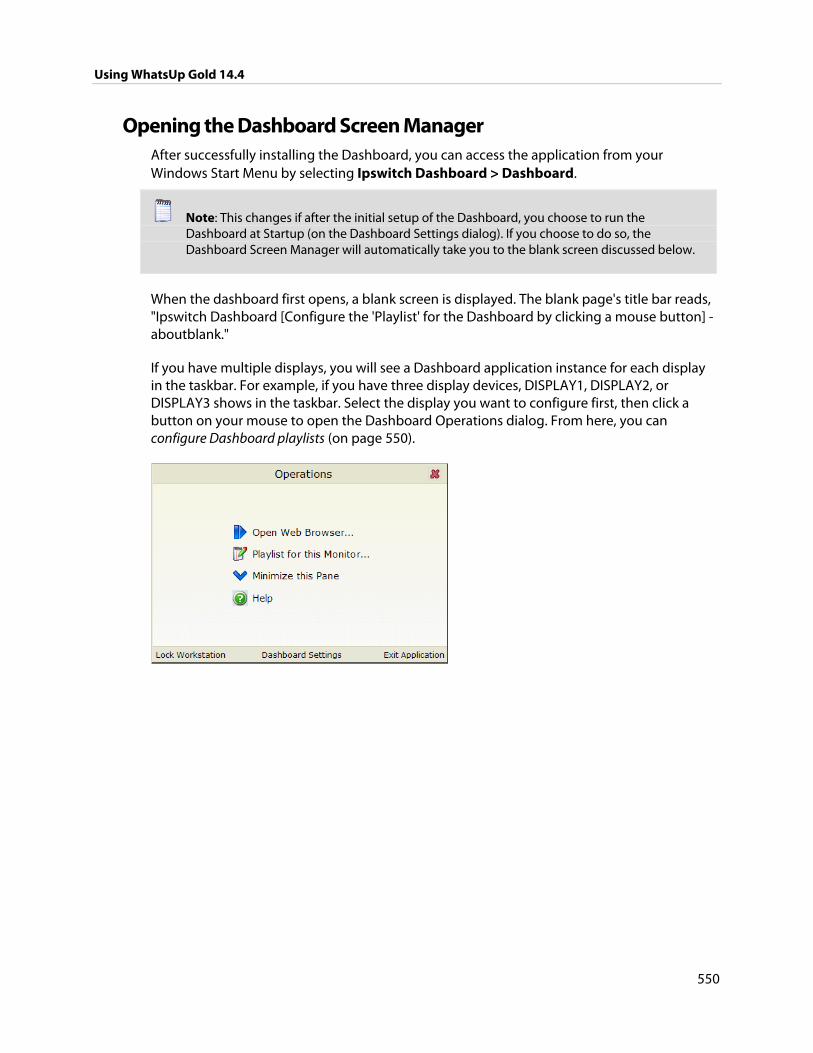
Using WhatsUp Gold 14.4
550
Opening the Dashboard Screen Manager After successfully installing the Dashboard, you can access the application from your Windows Start Menu by selecting Ipswitch Dashboard > Dashboard.
Note: This changes if after the initial setup of the Dashboard, you choose to run the Dashboard at Startup (on the Dashboard Settings dialog). If you choose to do so, the Dashboard Screen Manager will automatically take you to the blank screen discussed below.
When the dashboard first opens, a blank screen is displayed. The blank page's title bar reads, "Ipswitch Dashboard [Configure the 'Playlist' for the Dashboard by clicking a mouse button] - aboutblank."
If you have multiple displays, you will see a Dashboard application instance for each display in the taskbar. For example, if you have three display devices, DISPLAY1, DISPLAY2, or DISPLAY3 shows in the taskbar. Select the display you want to configure first, then click a button on your mouse to open the Dashboard Operations dialog. From here, you can configure Dashboard playlists (on page 550).
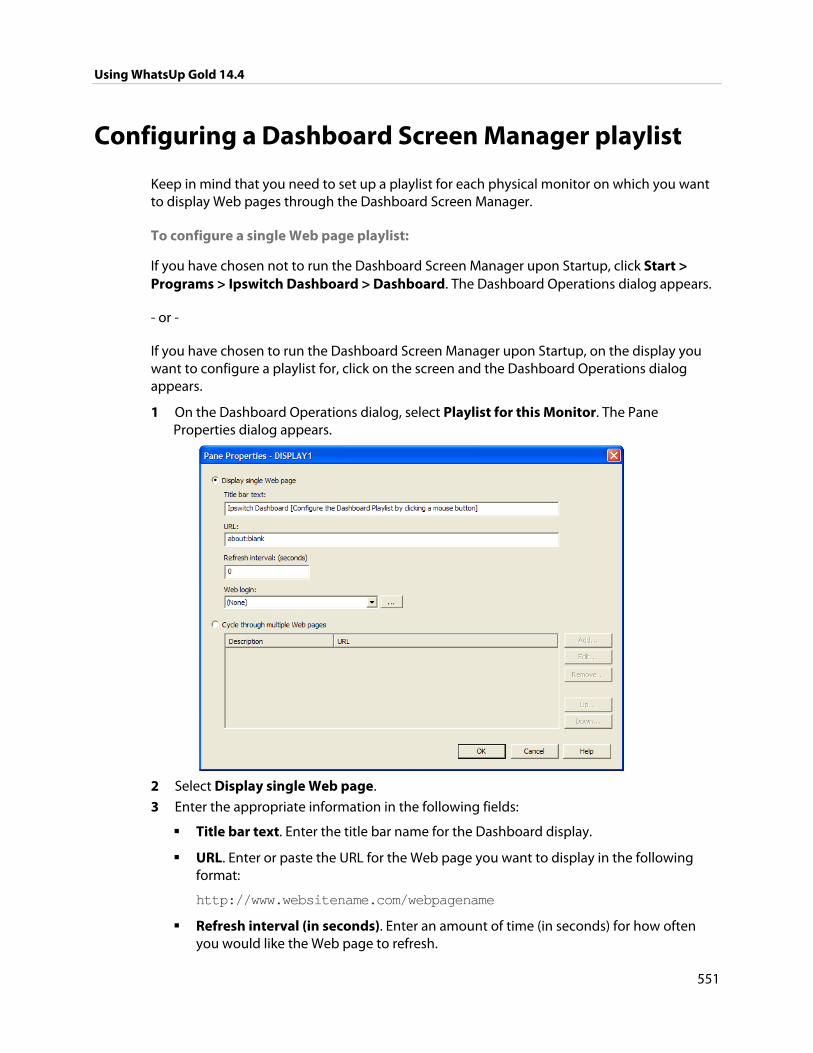
Using WhatsUp Gold 14.4
551
Configuring a Dashboard Screen Manager playlist
Keep in mind that you need to set up a playlist for each physical monitor on which you want to display Web pages through the Dashboard Screen Manager.
To configure a single Web page playlist:
If you have chosen not to run the Dashboard Screen Manager upon Startup, click Start > Programs > Ipswitch Dashboard > Dashboard. The Dashboard Operations dialog appears.
- or -
If you have chosen to run the Dashboard Screen Manager upon Startup, on the display you want to configure a playlist for, click on the screen and the Dashboard Operations dialog appears.
1 On the Dashboard Operations dialog, select Playlist for this Monitor. The Pane Properties dialog appears.
2 Select Display single Web page.
3 Enter the appropriate information in the following fields:
Title bar text. Enter the title bar name for the Dashboard display.
URL. Enter or paste the URL for the Web page you want to display in the following format:
http://www.websitename.com/webpagename
Refresh interval (in seconds). Enter an amount of time (in seconds) for how often you would like the Web page to refresh.
Using WhatsUp Gold 14.4
552
WhatsUp Gold Web login. Either select a user from the drop-down list, or click the browse (...) button to choose a user from the WhatsUp Gold Web Login Library. This user account is used for the Dashboard application to log-in to a password protected site. Without a proper user account, the application is not able to display a password-protected Web page. If you are using a non-WhatsUp Gold Web page, set the Web login to None.
Note: Other applications requiring a username and password to display Web pages can be used in the Dashboard Screen Manager. You can specify these other application username and passwords in the URL field, appended to the Web page URL.
4 Click OK to save changes.
Important: The Web Login drop-down list is empty until you populate the Web Login Library with users. You can do this via the Web Login Library dialog.
To configure a multiple Web page playlist:
If you have chosen not to run the Dashboard Screen Manager upon Startup, click Start > Programs > Ipswitch Dashboard > Dashboard. The Dashboard Operations dialog appears.
- or -
If you have chosen to run the Dashboard Screen Manager upon Startup, on the display you want to configure a playlist for, click on the screen and the Dashboard Operations dialog appears.
1 On the Dashboard Operations dialog, select Playlist for this Monitor. The Pane Properties dialog appears.
2 On the display you want to configure a playlist for, select Playlist for this Monitor. The Pane Properties dialog appears.
3 Select Cycle through multiple Web pages.
4 Click the Add button to add Web pages to the list. The Add URL to Playlist dialog appears.
5 Enter the appropriate information in the following fields:
Title bar text. Enter the title bar name for the Dashboard display.
URL. Enter or paste the URL for the Web page you want to display in the following format:
http://www.websitename.com/webpagename
Refresh interval (in seconds). Enter an amount of time (in seconds) for how long you would like the Web page to be on the screen.
Using WhatsUp Gold 14.4
553
WhatsUp Gold Web login. Either select a user from the drop-down list, or click the browse (...) button to choose a user from the WhatsUp Gold Web Login Library. This user account is used for the Dashboard application to log-in to a WhatsUp Gold Web page. Without a proper user account, the application is not able to display a password-protected Web page. If you are using a non-WhatsUp Gold Web page, set the Web login to None.
Note: Other applications requiring a username and password to display Web pages can be used in the Dashboard Screen Manager. You can specify these other application username and passwords in the URL field, appended to the Web page URL.
6 Click OK to add the new Web page to the playlist.
7 Edit and Remove Web pages by selecting a Web page from the list and then clicking the Edit or Remove button.
8 Click OK to save changes.
Using WhatsUp Gold 14.4
554
Copyright notice ©1991-2010 Ipswitch, Inc. All rights reserved.
This document, as well as the software described in it, is furnished under license and may be used or copied only in accordance with the terms of such license. Except as permitted by such license, no part of this publication may be reproduced, photocopied, stored on a retrieval system, or transmitted, in any form or by any means, electronic, mechanical, recording, or otherwise, without the expressed prior written consent of Ipswitch, Inc.
The content of this document is furnished for informational use only, is subject to change without notice, and should not be construed as a commitment by Ipswitch, Inc. While every effort has been made to assure the accuracy of the information contained herein, Ipswitch, Inc. assumes no responsibility for errors or omissions. Ipswitch, Inc., also assumes no liability for damages resulting from the use of the information contained in this document.
IMail, the IMail logo, WhatsUp, the WhatsUp Gold logo, WS_FTP, the WS_FTP logos, Ipswitch, and the Ipswitch logo are trademarks of Ipswitch, Inc. Other products and their brands or company names, are or may be trademarks or registered trademarks, and are the property of their respective companies.
This document was published on Monday, December 13, 2010 at 10:41.


![WhatsUp Gold v16 - Ipswitch · WhatsUp Gold v16.3 Database Migration ... See Executing SQL statements against the WhatsUp Gold database ... EXECUTE [sys]. [sp ...](https://static.fdocuments.us/doc/165x107/5b31f8547f8b9adf6c8bb1ed/whatsup-gold-v16-ipswitch-whatsup-gold-v163-database-migration-see-executing.jpg)