
Mission HIMpossible. Oooooops! Wrong Picture Mission HIMpossible Hi Handsome!

27
chapter 3
What’s Wrong with the
Picture of Progress?
Too much and too long, we seemed to have surrendered personal ex-cellence and community values in the mere accumulation of materi-al things. Our Gross National Product [GNP]… — if we shouldjudge America by that — …counts air pollution and cigarette ad-vertising, and ambulances to clear our highways of carnage. Itcounts special locks for our doors and the jails for the people whobreak them. It counts the destruction of the redwood and the loss ofour natural wonder in chaotic sprawl. It counts napalm and countsnuclear warheads and armored cars for the police to Šght the riots inour cities.… Yet the gross national product does not allow for thehealth of our children, the quality of their education or the joy oftheir play. It does not include the beauty of our poetry or thestrength of our marriages, the intelligence of our public debate orthe integrity of our public ofŠcials. It measures neither our wit norour courage, neither our wisdom nor our learning, neither our com-passion nor our devotion to our country, it measures everything inshort, except that which makes life worthwhile.
— Robert Kennedy, March 18, 19681
WHAT WE MEASURE rešects what we value and what matters most; whatwe use to measure and report progress gets our attention. Robert
EconoHappinessPress.qxp 4/19/2007 12:30 PM Page 27

Kennedy reminded us just how limited our measures of economic progress canbe. Virtually every nation tells its story of economic progress using gross do-mestic product (GDP): the monetary value of all the goods and services boughtand sold in an economy. We are led to believe by economists and politicians thatthe more the GDP grows the better off we are. But who really cares if the GDProse another few percentage points, representing billions more dollars in pro-duction of many things we don’t actually need more of, while ignoring deŠcitsof love, relationships and the health of the environment? The GDP is simply apoor measure of well-being and genuine progress, as Kennedy pointed out.
New research into well-being and happiness is showing that increasingeconomic growth does not necessarily improve well-being.2 Well-being ismore than making more money and even more than just happiness. Well-being means developing as a person, being fulŠlled, and making a meaning-ful contribution to the community.3 If economic measures of progress fail tomeasure that which makes life worthwhile — that is, well-being — wheredid we go wrong? What can we do to change the ways we measure and man-age progress so that they align with our values?
Many of us intuitively know there is something wrong with the currentpicture of progress where indicators like the GDP measure economic well-being solely in terms of what is bought and sold. We are continually told byeconomists and even presidents that improving our economic well-being re-quires stimulating the economy through more economic growth. “Stimulat-ing the economy” means producing more stuff, spending more, and consum-ing more even if our basic corporeal needs have been satisŠed. One of the mostpoignant moments for me was when President George W. Bush, followingthe horriŠc events on September 11, 2001, urged Americans to go shopping.Why? To ensure the economy kept going and growing even if many Americansand Canadians experienced the joys of slowing down, listening to nature asthe skies grew quiet from the noise of airplanes, and renewing friendshipswith neighbors and strengthening our relationships with those we love.
Behind President Bush’s invocation for more consumption and moregrowth is the fundamental economic belief that a rising tide of the GDP ulti-mately raises the well-being of all households in an economy. Economicgrowth has been the central objective of most governments over these last 50years, and the GDP has been the key measure of progress. But has the risingtide of the GDP led to improved conditions of well-being for the averageAmerican or Canadian? Are we any happier today with more income and
28 The Economics of Happiness
EconoHappinessPress.qxp 4/19/2007 12:30 PM Page 28

more material possessions than 40 years ago? Lynne Twist author of The Soulof Money notes that society is caught up in a myth that more growth, moreproduction and more consumption are good for our lives.4
If we examine leading economic indicators like the GDP, stock marketindices and consumer spending it is true that after 50 years of progress ourcapitalist western societies have enjoyed unparallel economic success. Wehave more GDP per capita, more income, more material possessions, largerhomes, more cars and more kitchen gadgets than at any time in history.The average American now spends almost 250 percent more (in inšation-adjusted dollars) in 2005 than she or he did in 1950. Consumer spending isthe key driver of the GDP. The following graph shows trends in economicgrowth in the US. Between 1950 and 2004 the US GDP rose 3,887% in cur-rent dollars while total stock market capitalization value rose a fantastic8,160% (even after the major correction in stock-market values following9-11-2001). According to economic logic these upward-sloping graphsshould mean that overall well-being in the US has improved.
As an economist, I was used to seeing GDP curves like this for the USand Canada. But as a member of my community I felt these indicators were
What’s Wrong with the Picture of Progress? 29
Figure 3.1. US GDP and Stock Market Valuations, 1950–2005. Credit: US Bureau of Economic Analysis & New York Stock Exchange (nyse.com)
EconoHappinessPress.qxp 4/19/2007 12:30 PM Page 29

masking what was really going on at the household level. While economistsand politicians bragged about rising GDP, my neighbors in Edmonton wouldlament that their personal economic well-being showed little improvement.
The Genuine Progress Indicator (GPI)The Genuine Progress Indicator or GPI was developed in 1995 by Cliff Cobb,an economist with the San Francisco economic-think tank RedeŠning Prog-ress as an alternative measure of economic well-being and progress to theGDP.5 If the GDP was designed to account for the total monetary value ofconsumption and production in an economy, the GPI was designed to indi-cate genuine progress in people’s quality of life and overall economic, socialand environmental well-being.
The GDP’s ideal economic hero is a chain-smoking, terminal cancer pa-tient going through an expensive divorce whose car is totaled in a 20-car pile-up, as a result of being distracted by his cell phone while munching on a fast-food hamburger — all activities which would contribute to the GDP. GPI,on the other hand, suggests that many of these “heroic” activities are regret-table and indeed should not be counted as genuine progress.
The GPI addresses seven major fallacies embodied in the GDP and sim-ilar national income accounts:
1. The GDP regards every expenditure as an addition to well-being, re-gardless what that expenditure is for and its effects. By this reasoning ahealthy person in a solid marriage that cooks at home, walks to work anddoesn’t smoke or gamble is an economic villain. The hero borrows andspends; the villain pays cash and saves for the kids’ education. Whateconomists call “growth,” in other words, is not always the same as whatmost people would consider good.
2. The GDP ignores the crucial economic functions that lie outside therealm of monetary exchange. The GDP excludes the value of unpaidhousework, child care, volunteer work and leisure. Parents do real work.So do neighbors, communities, open spaces, rivers and oceans, the atmos-phere and trees. Anyone who doubts this might try getting along with-out them. Such things contribute more to well-being than does muchthat we buy from the market. Yet the GDP regards these life-sustainingfunctions as worthless — until the economy destroys them and we haveto buy substitutes from the market or from government. Then the GDPsays that the economy has “grown.” When parents default and kids need
30 The Economics of Happiness
EconoHappinessPress.qxp 4/19/2007 12:30 PM Page 30

counseling or foster care, the GDP goes up because money has changedhands. When a parent cares for kids at home the GDP stagnates; whenthat same parent takes care of other peoples’ kids and calls it “daycare”the GDP goes up. When the city cuts down shade trees to widen a streetand homeowners have to buy air conditioners for cooling, the GDP goesup again. It looks like economic growth, but no real increases have oc-curred. Instead, something that used to be free now costs money; socialand environmental decay has been transmogriŠed into “growth” throughthe myopic lens of the GDP.
3. The GDP does not account for natural resources that are required to sus-tain current and future economic development — implying that the fu-ture has no value. The GDP excludes natural resource capital, environ-mental resources services, human resources, research and development.All that matters is the present. The implications of current economic ac-tivity for our kids and grandkids do not enter the calculation. For exam-ple, the GDP counts the depletion of natural resources as current incomerather than as the liquidation of an asset. This violates both basic account-ing principles and common sense. Similarly, saving doesn’t add much tothe GDP; economists actually chide Japan for its high savings rate. Butmaxing out on credit cards makes the GDP soar.
4. The GDP ignores totally the distribution of income, the social costs ofinequality and poverty. Changes in the GDP are insensitive to incomeinequality, poverty and the distribution of personal consumption andwealth. Even assuming that the GDP represents a rising tide of beneŠ-cence, it can’t have that effect unless all share. If the economy is gettingbigger but the beneŠts are going mainly to those who need it least, theresult are material accretion not economic advance. This is true even inconventional economic terms. For a family struggling on the minimumwage, a tenth that amount can mean the difference between macaroniand chicken for many nights.
5. The GDP contains intermediate and regrettable expenditures that donot contribute to economic welfare. It includes government spending forweapons. It also includes personal costs related to commuting, crime,environmental protection and automobile accidents.
6. The GDP minimizes the value of expenditures on education, health care,social services and environmental protection because it does not rešectthe outcomes or returns on investment from such expenditures. Such
What’s Wrong with the Picture of Progress? 31
EconoHappinessPress.qxp 4/19/2007 12:30 PM Page 31

outcomes might include physical well-being (e.g. life expectancy), intel-lectual and labor market skills, educational attainment and improvedquality of the environment.
7. The GDP does not directly measure investment in social capital. Socialcapital includes investments in the health and wellness of communities,social institutions and democratic processes.6
When you add up all of these fallacies, is it any wonder that economists andleaders may see current economic reality and the future as rosy and whilemany Americans and Canadians intuit there is something wrong with thepicture of progress they are given?
The GPI attempted to address these shortcomings of the GDP by measur-ing the social and environmental costs and beneŠts which the GDP eitherignores or counts as economic progress. The GPI made intuitive sense to meand seemed to address the fundamental challenges posed by one of the cre-ators of national income accounting, Simon Küznets. Küznets had deep reser-vations about the limits of the new national income accounting and in 1934cautioned the US Congress that “the welfare of a nation can scarcely be in-ferred from a measurement of national income [as deŠned by the GNP].” Al-most 30 years later Küznets had come to the conclusion that national incomeaccounting should be completely rethought. Writing in the New Republic in1962 he noted “Distinctions must be kept in mind between quantity andquality of growth, between costs and return, and between short and longrun.” He noted further that “Goals for more growth should specify moregrowth of what and for what.” Küznets foreshadowed the need for an alterna-tive measure of economic well-being stating that eventually “national in-come concepts will have to be either modiŠed or partly abandoned, in favor ofmore inclusive measures, less dependent on the appraisals of the market sys-tem. The eventual solution would obviously lie in devising a single yard-stick.”7 John Kenneth Galbraith, one of the 20th century’s greatest economists,echoed Küznets’ concern: “There is a major šaw in measuring the quality andachievement of life by the total of economic production — (GNP/GDP) —the total of everything we produce and everything we do for money.” Galbraithnoted that measures such as the GDP override and obscure deeper and moreimportant aspects of economic life, failing to take sufŠcient account of thevalue and enjoyment of what is produced.8
To calculate the GPI, we begin with the personal consumption expendi-
32 The Economics of Happiness
EconoHappinessPress.qxp 4/19/2007 12:30 PM Page 32

tures. We include capital investment, government spending and net exports.But the GPI adjusts personal consumption expenditures by:
• Adjusting GDP for income inequality — the gap between rich and poor• Adding the values of unpaid housework, parenting and volunteer work• Adding the value of the service from household infrastructure• Adding the value of the service from streets and highways• Subtracting the value of time including costs of lost leisure time, family
breakdown, commuting time, unemployment and underemployment• Subtracting the costs of crime, auto accidents and cost of consumer
durables• Subtracting the costs of long-term environmental degradation, air pol-
lution, water pollution, ozone depletion, noise pollution, loss of farm-land, loss of forests, loss of wetlands and
• Adjusting for net capital formation and net foreign borrowing
In other words, the GPI reveals hidden environmental costs as well as sever-al measures of both social progress (value of unpaid work) and decline whichthe GDP obfuscates. I realized that the GPI, while itself incomplete andmethodologically challenging, nevertheless represented one of the most heroicattempts in economics to present decision makers with a more meaningfuland accurate picture of human progress. In my mind, the GPI represented agold mine of economic research opportunities.
In 1999 I helped to update the US GPI to the year 1998 as a Senior Fel-low with RedeŠning Progress. The results in Figure 3.2 showed erosion ofnatural, human and social capital in the US while the GDP continued to rise.The loss of economic well-being since the mid-1970s went on through the1990s even when US stock markets were red hot. While the GDP per capitarose by 1.4 percent per annum throughout the 1990s the GPI was decliningat an average annual rate of 2.7 percent.
The key negative drivers or costs causing the sharp decline in the US GPIthrough the 90s included soaring income inequality (the gap between therich and everyone else), the cost of the depletion of nonrenewable resources($1.3 trillion), long-term environmental damage ($1.0 trillion), the cost ofcommuting and loss of leisure time ($638 billion combined) and increasingforeign indebtedness.
The strength of the GPI is that the results are expressed in the same dol-lar or monetary terms as the GDP. For example, the US GPI account update I
What’s Wrong with the Picture of Progress? 33
EconoHappinessPress.qxp 4/19/2007 12:30 PM Page 33

completed in 1999 revealed that personal consumption expenditures (whichmakes up 65% of US GDP) were $4.9 trillion (in 1992 dollars) in 1997. Butwhen the beneŠts of unpaid work (+$2.6 trillion) are added and the costs ofthe loss of nature, family breakdown and other social costs are deducted (-$5.7trillion) from economic progress, the result is a net GPI for 1997 of only $1.7trillion. Some of the positive social beneŠts included in GPI, but otherwiseunaccounted for in GDP, include the value of unpaid housework, parentingand volunteerism — a beneŠt of $1.97 trillion — that amounts to an equiva-lent of 27% of the value of the 1997 US GDP. On the negative side, the costsof pollution and environmental degradation — $1.44 trillion — represented20% of the 1997 US GDP. The cost of resource depletion (including loss offorests, farmland, wetlands) totaled $1.84 trillion or 25% of the US GDP.
Making money, growing poorerIn the fall of 1999, David Korten, author of When Corporations Rule the World,gave a public lecture at the University of Alberta. He presented a graphwhich he believed rešected the current state of US economic as well as quali-
34 The Economics of Happiness
Figure 3.2. US GDP versus the Genuine Progress Indicator (GPI),1950–1997Credit: Jonathan Rowe and Mark Anielski. The Genuine Progress Indicator 1998 Update — Executive Summary.RedeŠning Progress, 1999.
EconoHappinessPress.qxp 4/19/2007 12:30 PM Page 34

ty of life indicators. The lines on that graph were constructed with Šctitiousnumbers, so I decided to reconstruct Korten’s graph with actual data includ-ing 50 years of US statistics on GDP, stock market indices, the US GPI andother quality of life indicators. Being a student of the nature of money in oureconomy, I identiŠed a key indicator missing in Korten’s graph: the totalamount of outstanding household, business, government and foreign debt inthe US. The following graph emerged.
This graph shows an incredibly robust set of economic indicators: a ris-ing GDP as well as a rising stock market, with the noted collapse of stockmarket values following 9-11-2001. The current market capitalization valueof all domestic stocks traded in the US have risen over 12,254% (over 12times its value) since 1950 reaching a value of $16.9 trillion. Over the sameperiod the US GDP (in current dollars) has risen 4,143% reaching $12.5 tril-lion in 2005. The US GPI line is hardly noticeable while the estimated costsof environmental degradation and natural capital depletion in the US is evi-dent in the line which declines steadily. The most remarkable line in thisgraph is the total amount of outstanding US debt. This includes all forms of
What’s Wrong with the Picture of Progress? 35
Figure 3.3. US GDP, Stock Market Values, Debt, GPI and EnvironmentalDegradation Costs.Credit: 1: US GDP: US Bureau of Economic Analysis; 2. Stock Market Values: New York Stock Exchange(nyse.com); 3. US Total Credit Debt Outstanding: US Federal Reserve; 4. GPI: RedeŠning Progress; 5. Envi-ronmental Degradation Costs: RedeŠning Progress.
EconoHappinessPress.qxp 4/19/2007 12:30 PM Page 35
debt including government (public), household, business and foreign debt.Between 1950 and 2005, the total debt outstanding (as reported by US Fed-eral Reserve statistics) has risen 7,935% reaching a staggering $38.3 trillionby the second quarter of 2005. The increase in total debt is so dramatic that ithas reached parabolic heights which appear unsustainable in the long-run.
This graph clearly illustrated that while the US was making money itwas also growing poorer in genuine economic and environmental terms. Thisgraph also afŠrmed something I have come to appreciate: that there is a directrelationship between debt and the GDP. The graph shows that debt places apermanent claim on life’s capital, like an insatiable cancer cell sucking lifefrom its hosts. The graph implies that eventually the host/economy will diebecause outstanding debt can never be repaid out of current production. Wecan see how the unrepayable debt load of the US exerts insatiable pressure onthat economy to keep growing ad inŠnitum. Perhaps this is why PresidentGeorge W. Bush urged Americans to go shopping after the tragedy of 9-11;without continued spending the outstanding mountain of debt could not beserviced and the economy would face a heart attack. Moreover, the graphwarns that even if we want to pursue an economy of moderation based onethics of sufŠciency this would be impossible with the debt overhang that ex-ists in the US as in most nations.
The epiphanies of this analysis led me to examine other social quality oflife and environmental health indicators in contrast to the GDP. Graphingthe GDP in relationship with the GPI, the Index for Social Health, the WorldWildlife Fund’s Living Planet Index and an estimate of the ecological deŠcitfor the US (measured using Ecological Footprint analysis) showed that everykey life indicator has been in decline in the US since the mid-1970s.
For example, the Index for Social Health (ISH), a 17-indicator compos-ite measure of societal well-being developed by Marc Miringoff at FordhamUniversity, includes indicators such as suicide rates, teen pregnancy, incomeinequality, life expectancy and other intuitive social and human health indi-cators. It declined 45% between 1970 and 1993. Over the same period theGPI declined 29% since its peak in the mid-1970s. The Ecological FootprintdeŠcit9 of the US continued to rise (revealed by a declining trend line). As aproxy for world ecosystem health, the Living Planet Index — a measure of thehealth of the world’s forests, freshwater and oceans — declined 32% globallyover the same study period. There are indicators that show positive improve-ments in quality of life including increasing life expectancies and improved
36 The Economics of Happiness
EconoHappinessPress.qxp 4/19/2007 12:30 PM Page 36

air quality. But here again is strong evidence that the “progress” representedin conventional economic and Šnancial market indicators masks the cancer-ous state of many our life support systems.
Our afšuent society has been fueled largely by non-renewable fossilfuels. Our GDP, our food and much of our lifestyle is literally soaked in oil.For example, agricultural production is now roughly 90% dependent on oilinputs; our food is literally petroleum based.10 It takes about three-quarters ofa gallon of oil to produce a pound of beef.11 If all of the world ate the way theUnited States eats, humanity would exhaust all known global fossil-fuel re-serves in just seven years.12 Every second the world consumes 37,000 gallonsof oil, 480 tons of coal and 3 trillion cubic feet of natural gas.13 The US nowconsumes more than one-quarter of the world’s total fossil fuel production(more than 20 million barrels of day). According to some petroleum geolo-gists the world is facing a stark reality: peak world oil production. Peak oildescribes reaching the midpoint between discovery and depletion of Šnite re-
What’s Wrong with the Picture of Progress? 37
Figure 3.4. Genuine Well-being (Quality-of-Life) Indicators versus GDP(1970–100)Credit: 1. US GDP: US Bureau of Economic Analysis; 2. US GPI: RedeŠning Progress (rprogress.org); 3. Indexfor Social Health: Marc Miringoff. 4. UN HDI: UN Human Development Report 1999; 5. US Ecological Foot-print: derived from Wackernagel & Rees, Our Ecological Footprint, New Society, 1995 and rprogress.org; 6. Liv-ing Planet Index: World Wildlife Fund.
EconoHappinessPress.qxp 4/19/2007 12:30 PM Page 37

serves of oil, gas and other non-renewable energy. At the point of peak worldoil production, prices become more volatile as nations scramble to secure theremaining and diminishing supplies of oil. According to the Association forthe Study of Peak Oil and Gas (ASPO) the world reached a peak oil situationin 2005; the US and Canada reached peak of conventional oil and gas reservesin the early 1970s.14
Figure 3.5 pictures trends in US dependency on non-renewable fossilfuels relative to the GDP (current dollars) between 1950 and 2005. Thegraph clearly shows how US economic progress has been fueled by the use ofnon-renewable oil, gas and coal resources. However, the good news is that theUS economy is in fact much more energy efŠcient today than it was 50 yearsago — requiring only 6.8% as much total energy input in 2005 per dollarGDP than in 1950; in 1950 a dollar of GDP required roughly 20,314 barrelsof oil equivalent (117, 822 Btus) of total energy (fossil fuels, electricity andrenewable energy) compared to only 1,383 barrels of oil equivalent (8,020Btus) in 2005.15 This suggests that the US economy is in fact more frugalwith respect to energy inputs while maintaining high economic well-being.
38 The Economics of Happiness
Figure 3.5. US GDP versus total fossil fuel consumption, 1950–2005Credit: 1. US GDP: US Bureau of Economic Analysis; 2. US fuel consumption: US Department of Energy, An-nual Energy Review 2005, Section 2: Energy Consumption by Sector.
EconoHappinessPress.qxp 4/19/2007 12:30 PM Page 38

Yet the US faces a signiŠcant challenge from the pressures of peak oil andits continued dependency on fossil fuels. In 2005, of the 99,894 trillion Btusin total energy consumption, fossil fuels still made up 86% of energy con-sumption followed by nuclear energy (8.1% ) and renewable energy (6.1% ofwhich 45% is from hydroelectric power generation). The contribution of re-newable energy as a percentage of total energy consumption has actually de-clined from the high of 10.5% in 1971.
To examine whether the US as a whole was better off today than it was in1950, I constructed a large database. I wanted to compare trends in econom-ic indicators with quality of life indicators like average real incomes, incomeinequality, water quality, air quality, the extent of natural environments likewetlands and old growth forests, crime rates, car crashes and a number ofhealth indicators. I asked the simple question: “are today’s citizens happierand enjoy a higher quality of life than they enjoyed 50 years ago?” I organizedthe available indicators according to what I felt people might intuitively saythey would want more of and what they would want less of to improve theirquality of life. The results of my analysis for the US are sobering. Here I havecompared several well-being indicators in the year 2000 with the benchmarkyear 1950.
These indicators demonstrate again that many life conditions for the av-erage US citizen have grown worse despite increasing levels of GDP andbooming Šnancial markets.
The Alberta GPIAs the US GPI update project was nearing completion in January of 2000 Ibegan to construct a similar but more detailed GPI analysis for my homeprovince of Alberta in Canada. I was motivated by a simple question: wereAlbertans in general better off today in terms of economic, social, health andenvironmental well-being than they were in 1960 when I was born?
The Alberta GPI sustainable well-being accounts track 51 indicators ofeconomic, social and environmental conditions from 1961 to 1999. The ac-counts include variables shown in the graph below. These indicators can com-pare individually with GDP growth or with each other. We also designed aunique data indexing system which allowed us to aggregate indicators intocomposite indices such as an economic well-being index, a social-health well-being index and environmental well-being index. An overall Genuine Well-being Index was also created, combining all 51 indicators.
What’s Wrong with the Picture of Progress? 39
EconoHappinessPress.qxp 4/19/2007 12:30 PM Page 39

Figure 3.6. Is the US citizen better off or worse off today compared to 1950?
Better or WorseWhat we want Progress (compared more of…. Indicator with 1950) Description of Change in Quality of Life since 1950
Happiness Self-rated �Worse The number of Americans who say they are “veryhappiness happy” has declined from 35% in 1957 to 30% in
2002.16 The US ranked only 16th in the world in 2003 in terms of self-rated happiness.17
Longer lives Life Expectancy ☺ Better The average life expectancy has increased 6.0 years for American men and women between 1970 and 1997.18 However, the US ranks only 24th amongworld nations in terms of life expectancy with Iceland and Japan topping the list.
Overall societal Index for �Worse The Index of Social Health (ISH) has declined 45% well-being Social Health between 1970 and 1993.19
Healthy youth Youth suicide �Worse The teen suicide rate has more than tripled since therate 1950s.20
Prosperous Gross Domestic ☺ Better The US GDP has grown 164% (in real 1992 inflation-economy Product adjusted dollars) or 4,183% in current dollars.
Healthy markets Stock market ☺ Better Total stock market capitalization value of all US values (domestic) stocks stands at $16.9 trillion and has
increased 12,254% in current dollar value from 1950to 2005.21
More money Personal income ☺ Better Average real (adjusted for inflation) incomes have Real wages �Worse risen by 229% from $8389 in 1950 to $27,608 by
2005,22 however, average hourly real wages (in 2005 inflation-adjusted dollars) have remained virtually unchanged since the early 1960s ($16.11/hr. in 2005 compared to $15.94/hr. in 1964).
Genuine Progress Genuine Progress �Worse While the GPI per capita increased 22% from 1950 to Indicator (GPI) 1978 it declined 29% since 1978.
More material Consumption ☺ Better Real (inflation adjusted) personal consumption possessions expenditures spending on material possessions has increased by
249% from 1950 to 2005.23
More leisure time Leisure time �Worse The average US worker enjoys 19% less leisure time and time with today than in the 1950s. TV viewing per household family and friends has increased 58%.
Strong and Divorce rate �Worse The divorce rate has increased by 195%; the number healthy of kids impacted by divorce has increased 238%.relationships
Healthy farm Productive farm �Worse The area of productive farmland has decreased byland land 248% since 1950.
More time to Volunteer time ☺ Better 169% increase in average hours volunteered per give to others capita.
Reduced Fossil fuel use �Worse Fossil fuel consumption has increased by172% since dependency of versus renewable 1950, however, in 2005 it now takes one fourteenth fossil fuels energy as much energy to produce $1 of GDP. More than
consumption 86% of energy consumed in 2005 still comes from fossil fuels (compared with 91.4% in 1950). The percentage of energy from renewable energy sources is only 6.1% of total energy consumed, down from a high of 10.5% in 1971.
Credit: Updated by Mark Anielski. Originally published in Mark Anielski and Colin Soskolne. “Genuine Progress Indicator (GPI) Accounting: Relating EcologicalIntegrity to Human Health and Well-Being.”Chapter 9 in Just Ecological Integrity: The Ethics of Maintaining Planetary Life, eds. Peter Miller and Laura Westra. Rowmanand Littlefield, 2001, pp. 83-97.
EconoHappinessPress.qxp 4/19/2007 12:30 PM Page 40
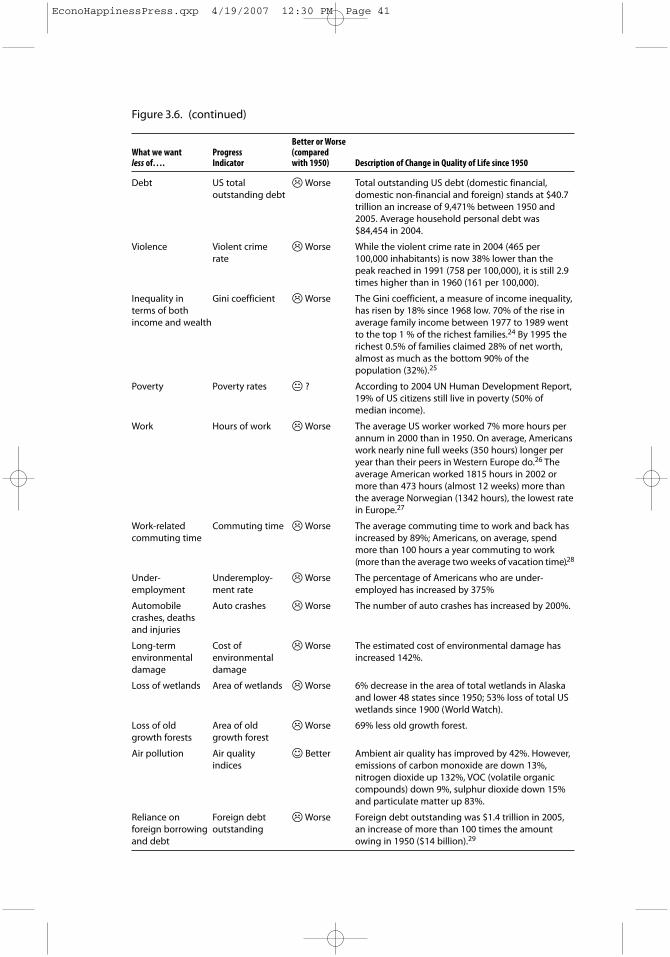
Figure 3.6. (continued)
Better or WorseWhat we want Progress (compared less of…. Indicator with 1950) Description of Change in Quality of Life since 1950
Debt US total �Worse Total outstanding US debt (domestic financial, outstanding debt domestic non-financial and foreign) stands at $40.7
trillion an increase of 9,471% between 1950 and2005. Average household personal debt was$84,454 in 2004.
Violence Violent crime �Worse While the violent crime rate in 2004 (465 per rate 100,000 inhabitants) is now 38% lower than the
peak reached in 1991 (758 per 100,000), it is still 2.9 times higher than in 1960 (161 per 100,000).
Inequality in Gini coefficient �Worse The Gini coefficient, a measure of income inequality, terms of both has risen by 18% since 1968 low. 70% of the rise in income and wealth average family income between 1977 to 1989 went
to the top 1 % of the richest families.24 By 1995 the richest 0.5% of families claimed 28% of net worth, almost as much as the bottom 90% of the population (32%).25
Poverty Poverty rates � ? According to 2004 UN Human Development Report, 19% of US citizens still live in poverty (50% of median income).
Work Hours of work �Worse The average US worker worked 7% more hours per annum in 2000 than in 1950. On average, Americans work nearly nine full weeks (350 hours) longer per year than their peers in Western Europe do.26 Theaverage American worked 1815 hours in 2002 or more than 473 hours (almost 12 weeks) more than the average Norwegian (1342 hours), the lowest rate in Europe.27
Work-related Commuting time �Worse The average commuting time to work and back hascommuting time increased by 89%; Americans, on average, spend
more than 100 hours a year commuting to work (more than the average two weeks of vacation time).28
Under- Underemploy- �Worse The percentage of Americans who are under-employment ment rate employed has increased by 375%
Automobile Auto crashes �Worse The number of auto crashes has increased by 200%.crashes, deathsand injuries
Long-term Cost of �Worse The estimated cost of environmental damage has environmental environmental increased 142%.damage damage
Loss of wetlands Area of wetlands �Worse 6% decrease in the area of total wetlands in Alaska and lower 48 states since 1950; 53% loss of total US wetlands since 1900 (World Watch).
Loss of old Area of old �Worse 69% less old growth forest.growth forests growth forest
Air pollution Air quality ☺ Better Ambient air quality has improved by 42%. However,indices emissions of carbon monoxide are down 13%,
nitrogen dioxide up 132%, VOC (volatile organic compounds) down 9%, sulphur dioxide down 15% and particulate matter up 83%.
Reliance on Foreign debt �Worse Foreign debt outstanding was $1.4 trillion in 2005, foreign borrowing outstanding an increase of more than 100 times the amount and debt owing in 1950 ($14 billion).29
EconoHappinessPress.qxp 4/19/2007 12:30 PM Page 41

The Alberta GPI project went beyond the original US GPI work bydeveloping well-being “ledgers” or accounts from which any number ofindicators of well-being could be derived and reported. I found the account-ing metaphors of ledgers, balance sheets and income statements useful tospeak not only to the business community but also to average Albertans. Awell-being balance sheet shows the conditions of Alberta’s human, social,natural, built and Šnancial or economic capital just like a company’s balancesheet reveals some of its key Šnancial and capital assets. It reveals both the as-sets (strengths), liabilities (weaknesses) and distribution of wealth and in-come in Alberta. I reasoned that such a balance sheet could lead to more in-formed and wiser stewardship of our common wealth.
42 The Economics of Happiness
Figure 3.7. The Alberta Genuine Progress Indicators
Economic Social EnvironmentalWell-Being Indicators Well-Being Indicators Well-Being Indicators
Economic growth Poverty Oil and gas reserve life
Economic diversity Income distribution Oilsands reserve life
Trade Unemployment Energy use intensity
Disposable income Underemployment Agriculture sustainability
Weekly wage rate Paid work time Timber sustainability
Personal expenditures Household work Forest fragmentation (ecological integrity)
Transportation expenditures Parenting and eldercare Fish and wildlife
Taxes Free time Parks and wilderness
Savings rate Volunteerism Wetland
Household debt Commuting time Peatland
Public infrastructure Life expectancy Water quality
Household infrastructure Premature mortality Air quality related emissions
Infant mortality Greenhouse gas emissions
Obesity Carbon budget deficit
Suicide Hazardous waste
Drug use Landfill waste
Auto crashes Ecological footprint
Divorce
Crime
Problem gambling
Voter participation
Educational attainment
Credit: Mark Anielski, Mary Griffiths, David Pollock, Amy Taylor, Jeffrey Wilson, and Sara Wilson. Alberta Sustainability Trends 2000: Genuine Progress Indicators Report 1961 to 1999. Pembina Institute for Appropriate Development, April 2001, p. 4. pembina.org/pdf/publications/gpi-ab2000-trends.pd.
EconoHappinessPress.qxp 4/19/2007 12:30 PM Page 42
A new income statement could adjust the GDP for a number of unac-counted beneŠts (e.g. the value of unpaid work such as volunteerism), net outregrettable expenditures (e.g. cleaning up auto crashes) and adjust for the de-preciation costs to human, social and natural capital as a result of their loss orconsumption. Such an income statement would provide a rough full cost-beneŠt accounting of Alberta’s economic progress. Moreover, it would help toassess the true beneŠts (or costs) of various economic development policies —such as forestry or oil and gas development policies or the introduction of legal-ized gambling (e.g. casinos and video-lottery terminals) in the province in theearly 1990s — over time.
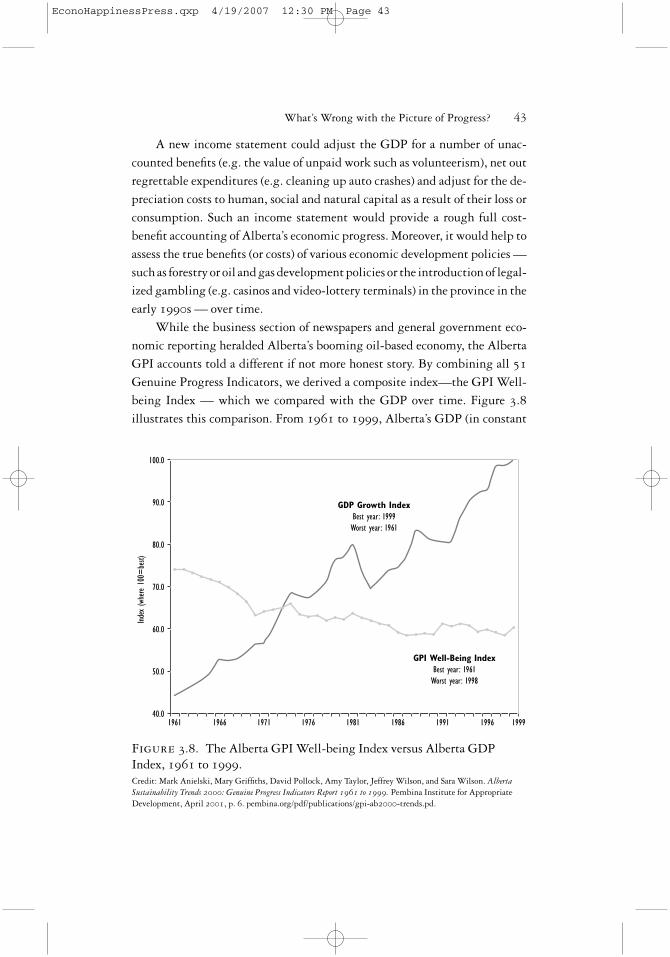
While the business section of newspapers and general government eco-nomic reporting heralded Alberta’s booming oil-based economy, the AlbertaGPI accounts told a different if not more honest story. By combining all 51Genuine Progress Indicators, we derived a composite index—the GPI Well-being Index — which we compared with the GDP over time. Figure 3.8illustrates this comparison. From 1961 to 1999, Alberta’s GDP (in constant
What’s Wrong with the Picture of Progress? 43
Figure 3.8. The Alberta GPI Well-being Index versus Alberta GDPIndex, 1961 to 1999.Credit: Mark Anielski, Mary GrifŠths, David Pollock, Amy Taylor, Jeffrey Wilson, and Sara Wilson. AlbertaSustainability Trends 2000: Genuine Progress Indicators Report 1961 to 1999. Pembina Institute for AppropriateDevelopment, April 2001, p. 6. pembina.org/pdf/publications/gpi-ab2000-trends.pd.
EconoHappinessPress.qxp 4/19/2007 12:30 PM Page 43

1998 dollars) increased by over 400%, or 4.4% per annum, while the AlbertaGPI Well-being Index declined at an annual rate of 0.5% per year. The GPIIndex was highest in the 1960s then declined to reach a plateau in the 1990sdespite continued economic growth. Our study indicates that the best GPIIndex was recorded in 1961 and the lowest in 1998. In the 1990s, the GDPper capita grew at an annual rate of 2.4% while the GPI per capita was virtu-ally stagnant, growing a mere 0.43% per year, on average.
We also presented all 51 indicators of well-being in a unique spidergraph: the Sustainable Well-being Circle Index. Using this graph, you cancompare relative conditions of well-being across all indicators regardless oftheir unit of measurement. This provides a full-length mirror of Alberta’swell-being in any given year.
The unique Genuine Well-being Circle Index clearly shows the strengthsand weaknesses of various conditions of well-being in Alberta in 1999. This
44 The Economics of Happiness
Figure 3.9. The Alberta GPI Sustainable Well-being Circle Index for 1999.Credit: Mark Anielski, Mary GrifŠths, David Pollock, Amy Taylor, Jeffrey Wilson, and Sara Wilson. Alberta Sus-tainability Trends 2000: Genuine Progress Indicators Report 1961 to 1999. Pembina Institute for Appropriate Develop-ment, April 2001, p. 7. pembina.org/pdf/publications/gpi-ab2000-trends.pd.
EconoHappinessPress.qxp 4/19/2007 12:30 PM Page 44
Index is like a company balance sheet on which each type of living and pro-duced capital is reported as an index score relative to historical conditions.This index shows the condition of all capital in Alberta in 1999, each indica-tor with its own score.30
The GPI Circle Index provides a powerful visual image of the overallcondition of economy, society and environment that could be applied at thelocal, state or provincial or national level. It provides an alternative to trendlines and shows clearly the contrast between the condition of the factors thatcontribute to quality of life. For example, health indicators such as life ex-pectancy, premature mortality and infant mortality are in good condition—that is, their scores are close to 100 points. Many social and environmental in-dicators, on the other hand, were in an unhealthy condition in 1999 comparedwith the previous 40 years. While we may not value each indicator equally(for example, timber sustainability cannot be compared with agriculturalsustainability), the presentation of all indicators together does show relativeconditions for any point in time. Moreover, each of the 51 indicators can beportrayed as an individual trend line allowing policy makers to visuallycontrast, for example, the trend in GDP compared to suicide rate or life ex-pectancy.
The story of 40 years of economic progress in Alberta can be told by com-paring GDP growth with changes in other living capital accounts. While realGDP per Albertan rose 126% between 1961 and 1999 to $109.7 billion or$37,005 per capita (1998 dollars) the following changes occurred in terms ofeconomic, social, human and environmental capital between 1961 and 1999:
• While GDP is up, disposable income levels remain stagnant throughoutthe 1990s suggesting that not all Albertans are sharing equally in theeconomic good times
• Taxes (per capita) have increased 494% to $5,172 per capita (1998$)• Total debt (federal, provincial, household, farm) per capita increased
262% to $48,182 per capita• Poverty (% living below the Low-Income-Cutoff) has increased 37%• Income inequality (after-tax income) has actually decreased thanks to the
positive impacts of a progressive income tax system and governmenttransfers
• The gap between rich and poor is still signiŠcant with the eight wealth-iest Albertans having an estimated hourly income of $33,307 per hourversus $5.90 per hour for a minimum wage earner
What’s Wrong with the Picture of Progress? 45
EconoHappinessPress.qxp 4/19/2007 12:30 PM Page 45

• Paid work hours fell 17% while underemployment is the highest in his-tory
• Unpaid work hours (per person) increased 4% and is valued at $32.6 bil-lion or 31% of the GDP
• Time with the kids and parents has fallen 33%• Family breakdown (divorce and separations) increased 312%• Life expectancy increased 10% to an average 79.3 years• Asthma amongst children is up dramatically• While Albertans have one of the lowest cancer rates in Canada, both the
incidence and mortality from all forms of cancer (particularly lung,breast, thyroid, prostate and colorectal cancers) are higher than in 1970
• Obesity has more than doubled since 1985• Suicide increased 30% to 14.4 suicides per 100,000 population at a soci-
etal cost of $365 million in 1999 (0.3% of GDP)• Auto crashes have increased 37% for a total societal cost of $3.97 billion
or 3.6% of GDP• Crime rates per capita increased 59% with total costs of crime amount-
ing to 2% of GDP • Intellectual capital has increased with over 54% of Alberta’s adult popu-
lation with some post-secondary education• Democracy is weaker with fewer Albertans voting in federal, provincial
and municipal elections than 30 years ago • Alberta’s ecological footprint increased 63% and is the fourth highest in
the world, while the Canadian average ranks 10th in the world• Forests are younger, more fragmented, and timber supply has become
unsustainable with less than 14% of Alberta’s boreal forests and less than1% of Alberta’s foothill forests remaining in a wilderness condition
• Oil and gas reserves are dwindling (except for oilsands) with less thannine years of natural gas and seven years of conventional crude oil reservesremaining. More than 300 years of oilsands reserves remain. If valuedcorrectly as depreciation of natural capital, the depreciation cost of oiland gas depletion in 1999 would be $9.9 billion and reduce Alberta’s1999 GDP by 9.4%
• Wetlands and peatlands have declined. Wetlands declining 58% in areasince pre-1880 settlement times reduces ecological services such as car-bon sequestration
• Alberta’s carbon budget deŠcit continues to increase with forests and
46 The Economics of Happiness
EconoHappinessPress.qxp 4/19/2007 12:30 PM Page 46

peatlands sequestering no more than 25% of total anthropogenic carbonemissions
• Slightly higher levels of fecal coliform, nitrogen and E.coli appear in someAlberta rivers along with reduced dissolved oxygen levels and lowerphosphorous levels
• Glacial melt in the Rocky Mountains is increasing and will impact riverwater šow rates
• Very little is known about the condition of groundwater aquifers eitherin terms of volume or quality or the potential risk to water from feedlotdevelopments
• Ecosystem health has declined dramatically if measured in terms of eco-system fragmentation with over 88% of Alberta’s forest ecosystem frag-mented by roads, seismic lines, well-sites and pipelines31
One of our key Šndings was that while Alberta’s GDP continued to increaseafter the recession of 1982, the economic well-being of Albertans (measured
What’s Wrong with the Picture of Progress? 47
Figure 3.10. Real Disposable Income, Personal Consumption Expendi-tures, Personal and Household Debt, Savings, and Taxes Paid per Albertan(1998$), 1961 to 1999Credit: Mark Anielski, Mary GrifŠths, David Pollock, Amy Taylor, Jeffrey Wilson, and Sara Wilson. AlbertaSustainability Trends 2000: Genuine Progress Indicators Report 1961 to 1999. Pembina Institute for AppropriateDevelopment, April 2001, p. 11. pembina.org/pdf/publications/gpi-ab2000-trends.pd.
EconoHappinessPress.qxp 4/19/2007 12:30 PM Page 47
in terms of income, taxes, debt and savings) had remained virtually un-changed for almost 20 years.
While the real GDP per capita rose 36% between 1982 and 1999, ouranalysis showed that disposable income (adjusted for inšation) and real week-ly wages per average Albertan have still not recovered to the highs reached in1982. Personal consumption expenditures per Albertan continued to rise al-though more slowly than GDP growth, but these expenditures are increas-ingly Šnanced through debt rather than through income.
Personal and household debt has increased signiŠcantly since 1982. In1997 for the Šrst time in history, this debt surpassed real disposable incomereaching an unprecedented rate of 109% of disposable income in 1999. Atthe same time, savings have fallen from their peak in 1982. The total of allgovernment taxes and fees paid by each Albertan exceeds the amount she orhe is saving.
The big story is that while more money changed hands between 1982and 1999 (i.e. the GDP was increasing), not all Albertans beneŠted equallyfrom this increased cash šow. The šow was caused by more economic output
48 The Economics of Happiness
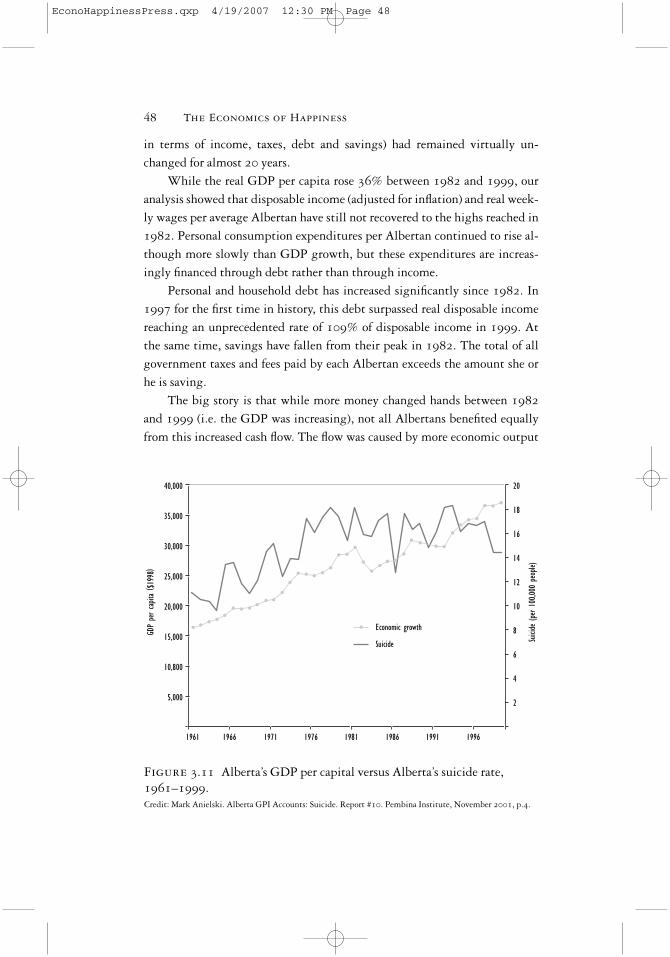
Figure 3.11 Alberta’s GDP per capital versus Alberta’s suicide rate,1961–1999.Credit: Mark Anielski. Alberta GPI Accounts: Suicide. Report #10. Pembina Institute, November 2001, p.4.
EconoHappinessPress.qxp 4/19/2007 12:30 PM Page 48

and more exports. The GPI accounts suggest that in 1999, average Albertansstruggled to keep their households ašoat against growing debt and higherlevels of total taxes (paid by persons), while their disposable income remainedin the doldrums, thus eroding their capacity to save for things like retirementand their children’s needs. Most Albertans I have talked to in person and onradio talk-shows in Edmonton relate to this evidence.
Figure 3.11 compares Alberta’s GDP with its suicide rate. While there isno statistically signiŠcant correlation between suicide and the GDP, the sui-cide rate has increased since the 1960s as did the GDP. Such a striking imageprovokes one to ask: if the GDP is up, how are other aspects of life?
In 2005, Amy Taylor, an economist with the Pembina Institute and oneof the key economic researchers on the original project , released an update toAlberta GPI on the centennial of Alberta as a province. The results showedthat most of the trends continued from the 2001 results: incomes, consumerspending and household debt were up but savings rates were down. Whilelife expectancy increased, the gap between rich and poor continued to in-crease along with poverty, suicide, problem gambling and commuting times.Voter participation in elections also continued its decline. On the environ-mental side, the Ecological Footprint continued to increase while oil and gasreserves continued to decline along with the area and ecological conditions ofwetlands.32
The Alberta GPI project accounts for well-being in a manner that intu-itively aligns with most people’s values. The GPI accounting approach helpsus better understand the potential relationship between economic growthand social, health and environmental conditions of well-being, thus enlight-ening our debate about progress. GPI accounts can be used to develop annualreports to citizens about the changing conditions that affect their lives. Un-derstanding these conditions is critical to charting a sustainable future andultimately to working towards an economy of well-being. With better infor-mation, people are empowered to participate more fully in the democraticprocess of shaping their future.
What’s Wrong with the Picture of Progress? 49
EconoHappinessPress.qxp 4/19/2007 12:30 PM Page 49


