What's the Situation with Situated Visualization? A Survey ...
12
HAL Id: hal-03319648 https://hal.archives-ouvertes.fr/hal-03319648v2 Submitted on 23 Aug 2021 HAL is a multi-disciplinary open access archive for the deposit and dissemination of sci- entific research documents, whether they are pub- lished or not. The documents may come from teaching and research institutions in France or abroad, or from public or private research centers. L’archive ouverte pluridisciplinaire HAL, est destinée au dépôt et à la diffusion de documents scientifiques de niveau recherche, publiés ou non, émanant des établissements d’enseignement et de recherche français ou étrangers, des laboratoires publics ou privés. What’s the Situation with Situated Visualization? A Survey and Perspectives on Situatedness Nathalie Bressa, Henrik Korsgaard, Aurélien Tabard, Steven Houben, Jo Vermeulen To cite this version: Nathalie Bressa, Henrik Korsgaard, Aurélien Tabard, Steven Houben, Jo Vermeulen. What’s the Situation with Situated Visualization? A Survey and Perspectives on Situatedness. IEEE Transactions on Visualization and Computer Graphics, Institute of Electrical and Electronics Engineers, In press. hal-03319648v2
Transcript of What's the Situation with Situated Visualization? A Survey ...

HAL Id: hal-03319648https://hal.archives-ouvertes.fr/hal-03319648v2
Submitted on 23 Aug 2021
HAL is a multi-disciplinary open accessarchive for the deposit and dissemination of sci-entific research documents, whether they are pub-lished or not. The documents may come fromteaching and research institutions in France orabroad, or from public or private research centers.
L’archive ouverte pluridisciplinaire HAL, estdestinée au dépôt et à la diffusion de documentsscientifiques de niveau recherche, publiés ou non,émanant des établissements d’enseignement et derecherche français ou étrangers, des laboratoirespublics ou privés.
What’s the Situation with Situated Visualization? ASurvey and Perspectives on Situatedness
Nathalie Bressa, Henrik Korsgaard, Aurélien Tabard, Steven Houben, JoVermeulen
To cite this version:Nathalie Bressa, Henrik Korsgaard, Aurélien Tabard, Steven Houben, Jo Vermeulen. What’s theSituation with Situated Visualization? A Survey and Perspectives on Situatedness. IEEE Transactionson Visualization and Computer Graphics, Institute of Electrical and Electronics Engineers, In press.�hal-03319648v2�

What’s the Situation with Situated Visualization?A Survey and Perspectives on Situatedness
Nathalie Bressa, Henrik Korsgaard, Aurélien Tabard, Steven Houben, Jo Vermeulen
Abstract— Situated visualization is an emerging concept within visualization, in which data is visualized in situ, where it is relevant topeople. The concept has gained interest from multiple research communities, including visualization, human-computer interaction (HCI)and augmented reality. This has led to a range of explorations and applications of the concept, however, this early work has focused onthe operational aspect of situatedness leading to inconsistent adoption of the concept and terminology. First, we contribute a literaturesurvey in which we analyze 44 papers that explicitly use the term “situated visualization” to provide an overview of the research area,how it defines situated visualization, common application areas and technology used, as well as type of data and type of visualizations.Our survey shows that research on situated visualization has focused on technology-centric approaches that foreground a spatialunderstanding of situatedness. Secondly, we contribute five perspectives on situatedness (space, time, place, activity, and community)that together expand on the prevalent notion of situatedness in the corpus. We draw from six case studies and prior theoreticaldevelopments in HCI. Each perspective develops a generative way of looking at and working with situatedness in design and research.We outline future directions, including considering technology, material and aesthetics, leveraging the perspectives for design, andmethods for stronger engagement with target audiences. We conclude with opportunities to consolidate situated visualization research.
Index Terms—Situated visualization, literature survey, situatedness.
1 INTRODUCTION
In the last decade, situated visualization [defined in 64, 100, 105] hasemerged as a research area and a concept that continues work initiatedin the area of Ubiquitous Computing (ubicomp) and Human–ComputerInteraction (HCI) [37, 81, 88, 98]. The central idea is to bring datavisualizations into their context of use, to places and people by con-necting data with the physical environment or physical referents thatthe data refers to [100, 105]. The area of situated visualization followsa strand of research agendas in visualization that are concerned withmoving beyond traditional desktop applications [75] such as “Ubiq-uitous Analytics” [26], “Immersive Analytics” [3, 29], or “SituatedAnalytics” [27, 90]. The literature on situated visualization spreadsacross multiple communities and research areas including HCI, visual-ization, Augmented Reality (AR), ubicomp, and urban computing, aswell as subtopics such as public visualization and data physicalization.This wide appropriation of situated visualization as a research concepthas led to a disconnected terminology, implications, and visualizationdesign, creating a highly fragmented and inconsistent research land-scape. As a result, interpretations of what situatedness and situatedvisualization are, and how these concepts are understood in the currentliterature, remain unclear.
To investigate how the research community has adopted and usedthe concept of situated visualization, and to broaden the scope of situat-edness, we present a two-fold literature review and case study analysis.In the first part of the paper, we contribute an analysis of the literaturethat explicitly uses the term “situated visualization”. We discuss andreflect on how these papers define situated visualization, the methods
• Nathalie Bressa is with Aarhus University, Denmark. E-mail:[email protected].
• Henrik Korsgaard is with Aarhus University, Denmark. E-mail:[email protected].
• Aurélien Tabard is with Université Claude Bernard Lyon 1, LIRIS, CNRSUMR5205, F-69621, France. E-mail : [email protected].
• Steven Houben is with Eindhoven University of Technology, Netherlands.E-mail: [email protected].
• Jo Vermeulen is with Autodesk Research, Canada and Aarhus University,Denmark. E-mail: [email protected].
Manuscript received xx xxx. 201x; accepted xx xxx. 201x. Date of Publicationxx xxx. 201x; date of current version xx xxx. 201x. For information onobtaining reprints of this article, please send e-mail to: [email protected] Object Identifier: xx.xxxx/TVCG.201x.xxxxxxx
and technology they use, the application domains of proposed situatedvisualizations, and the type of data and type of visualization. Froman analysis of the corpus, we conclude that work within visualiza-tion and visual analytics using AR technology to place visualizationswithin the physical environment and using that environment as a di-rect visual reference is the most prevalent way of presenting situatedvisualizations in the corpus. A smaller strand of research focuses oncommunity-oriented research within HCI by engaging with and dis-playing information within a community where data is collected. Thisillustrates the breadth of situated visualization research and the dif-ferent ways of approaching and implicitly considering the role andimportance of ‘situatedness’ and ‘visualization’ respectively. Uponcloser analysis, we find that while situated visualization combines con-cepts and approaches from HCI and information visualization, currentwork has adopted and operationalized a mostly spatial understandingof situatedness.
In the second part of the paper, we present five perspectives onsituatedness that include and expand on the dominant spatial under-standing of situated visualization, building on concepts from ubicompand HCI: space, time, place, activity and community. We illustratethese five perspectives with a case study analysis, introducing six casestudies of situated visualizations that stem from the corpus and fromselected examples to encourage the research community to think moresystematically about broader concepts of situatedness. Through thecase studies, we demonstrate how the perspectives can help to explicitlyconsider aspects of the situation in which the visualization is shownbeyond spatiality alone and to recognize opportunities for a widerset of possible technologies beyond AR. We end with future direc-tions, discussing how to leverage the five perspectives and considermethods for stronger engagement with target audiences, design consid-erations around technologies, and material and aesthetics, concludingwith research opportunities to further strengthen the area of situatedvisualization.
2 APPROACH
The goal of this paper is to clarify the concept of situated visualizationby using a two-fold approach. In a first stage, we examine the liter-ature that currently self-identifies as situated visualization through akeyword-based literature survey. In the second stage, we look at thebroader literature and analyze a selected set of case studies on situatedvisualization that, while they may not directly use the term, can be clas-sified as concerning situated visualization and expand on the notions ofsituated visualization as covered in the corpus from the first stage. Weuse these case studies to exemplify five perspectives on situatedness

that are based on concepts from ubicomp and HCI.Given the variety and spread of the literature, we considered two
strategies to analyze the literature on situated visualization: an open-ended interpretive approach and a keyword-based approach [25]. Anopen-ended interpretive approach examines research and examplesbased on the authors’ knowledge of the research area and may includearticles that could be analysed and interpreted as concerning situated vi-sualization without necessarily being published with that focus. Whilethis approach generates a broad and exploratory corpus, it also intro-duces subjective and less obvious inclusion and exclusion criteria andmay introduce selective bias early in the process, as well as imposing acharacterization that is not that particular publication’s intended focus.A keyword-based approach is inclusive towards papers published underthe theme of situated visualization and provides a clear cutoff. However,in topics that are new and emerging or cut across multiple communitieswith different terminology, it can yield a relatively small initial corpusand it is subject to trends and competition in keywords. To combinethe strengths of both approaches, we have applied a keyword-basedapproach in the first stage (the literature survey) and apply an open-ended interpretative approach in the second part (the case studies). Wetested different strategies for our keyword-based approach, includingthe use of seed papers of common definitions of situated visualization(e.g. [100, 105]). However, we found that there was a wide diversity ofpapers that cited those seed papers, including many papers that do notengage with the concept of situated visualization but rather focus onother aspects (such as AR applications). As a result, the papers citingthose seed papers either did not fit our inclusion criteria or would al-ready have been included, so this approach did not yield any additionalvaluable results.
For the second stage, we selected case studies based on our find-ings in the literature survey of the first stage. Our analysis of thecurrent literature on situated visualization resulted in several themes,for example, in terms of applications, technologies, and definitions ofsituated visualization. We then curated and selected case studies thatfurther broadened, expanded upon and provided contrasting perspec-tives on these themes to arrive at a broader categorization of situatedvisualization. The use of a curated set of case studies and notableexamples to characterize and map out an emerging research area isa valuable approach that has been used before for casual informationvisualization [69], anthropographics [65], personal information visual-ization [45], and data physicalization [47]. The perspectives we developare based on our analysis of the corpus as well as theoretical develop-ments in HCI and ubicomp that we have selected to broaden the currentunderstanding of situatedness for situated visualization.
3 A SURVEY OF SITUATED VISUALIZATION RESEARCH
We survey a set of representative papers from a range of differentresearch communities based on a keyword-based literature search togive an overview of current research in situated visualization.
3.1 CorpusTo build our corpus of papers, we collected a list of 44 core papers withthe following inclusion criteria.
Keyword search: we performed a keyword search in the ACM DigitalLibrary, IEEE Xplore, and Google Scholar for papers that containthe term “situated visualization”. We focused our keyword searchon one search term to get an overview of research that self-identifiesas “situated visualization” and to find out how different communitiescurrently use the term without imposing a categorization on papers.While the resulting corpus did not include all possible publications thatcould potentially be classified as situated visualization, we consideredthis a reasonable trade-off in line with our goals. We also considereddifferent regional spellings of the word “visualization”.
Archival publications: we included full or short archival conferencepapers, journal and magazine articles, and book chapters. We excludedposters and workshop papers to focus on mature research contributions.Due to the broad list of communities in which situated visualization
research is published, we did not restrict papers to particular venues.Therefore, our corpus includes a broad range of venues (includingamong others CHI, VIS, AVI, DIS, and ISMAR).
Relevance: We excluded papers that only showed up in the keywordsearch because they cite papers with “situated visualization’ in the title,and do not otherwise mention situated visualization in the paper. Wealso excluded papers that only refer to situated visualization briefly inrelated work and do not further engage with the concept. We includedall types of data representations that came up with the keyword searchin the corpus, including both visualizations and physicalizations.
3.2 AnalysisWe analyzed and coded the corpus in several iterations. First, we startedby determining initial coding categories based on coding a subset ofrepresentative examples of the corpus. After this first iteration, allauthors collectively discussed the coding schema and the corpus ofpapers. We identified additional dimensions, and merged and subdi-vided existing dimensions where relevant. Next, all authors engaged infocused coding on all the papers in our corpus, iteratively refining andrevisiting the coding schema where necessary. After collectively codingall the papers in our corpus, we ended up with five dimensions that weuse to categorize each of the papers (Table 1). Similar to Fonnet etal.’s [33] survey on immersive analytics, we included dimensions suchas technology, data, and evaluation methods. The sub-categories of thedimensions were developed iteratively based on the corpus. The corpuswas divided among all authors, in which the top-level categories wereinitially coded as free-text. Afterwards, each category was assigned toone author who then analyzed the categories holistically to develop thefinal set of sub-categories. Based on the coded papers in the corpus, wedistilled a set of findings where we discuss how the term situated visu-alization is currently used in the literature, the technology and methodsemployed, the range of different domains in situated visualizations, andvisualization and data types.
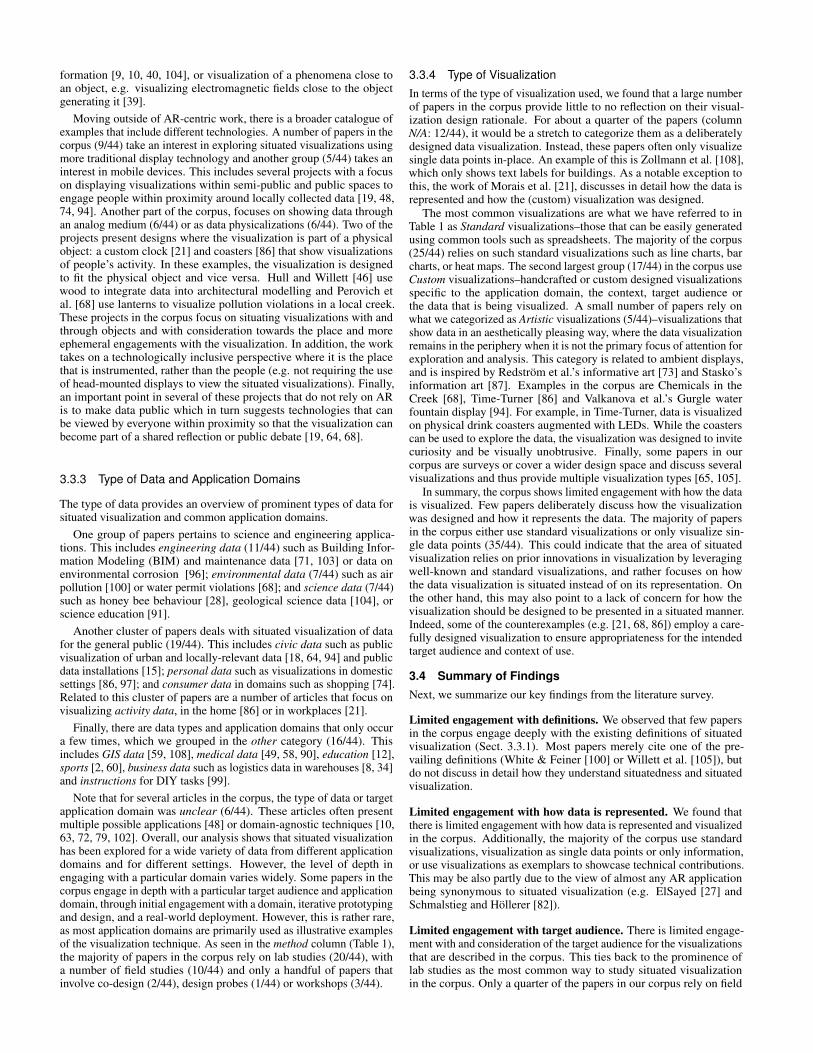
3.3 FindingsThe corpus consists of a total 44 papers that we analyzed based on aset of five primary dimensions (see Table 11). The dimensions includesituated visualization definition, technology, type of data, method, andtype of visualization. We further describe our findings of the codingto map out the space of current research on situated visualization. Re-garding publication venues, the corpus covers 27 different venues. Wecan categorize these and their respective communities in the followingbroad groups: Visualization and Visual Analytics (e.g. IEEE VIS, IEEETVCG, Information Visualization, PacificVis, AVI, Journal of VisualLanguages & Computing), HCI and design (CHI, DIS, Graphics Inter-face, Int. J. Human–Computer Studies), AR and 3D User Interfaces(3DUI, ISMAR, Handbook of Augmented Reality), Pervasive Displays,and Architecture. This illustrates that several academic communitiesengage in research on situated visualization, with the visualization andvisual analytics, HCI and design, and the AR and 3DUI communitiesbeing the most prominent.
3.3.1 Definitions of Situated VisualizationThe papers in the corpus can be split into papers that either define orexpand the notion of situated visualization (column “Own definition”in Table 1) and papers that cite prior papers that defined situated vi-sualization to frame their research. We categorized the papers basedon which papers they cite and what definitions they use for situatedvisualization (see Table 1). While some papers cite multiple papersthat contain definitions of situated visualization, we only consideredthe papers that were used to explicitly refer to situated visualization.For example, papers referring exclusively to the system contribution inSiteLens [100] are not categorized as using the definition.
The two most prevalent definitions of situated visualization cited inthe corpus are White and Feiner’s definition [100] (in some cases alsoWhite et al. [101]) and Willett et al.’s definition [105]. A total of 27/44
1Survey data: http://situatedvisualization.github.io/survey/

METHODDEFINITION DATATECHNOLOGY
YEAR CITATION AUTHORS VENUE No defi
nition
Own defi
nition
Willett e
t al.
White &
Feine
r / Whit
e et a
l.
Vand
e Moe
re an
d Hill
Situa
ted an
alytic
s - Th
omas
et al
.
Tatzg
ernBre
ssa et
al. &
Ducros
et al
.
Schm
alstie
g & Höll
erer
Other
AR Mobile
Device
Analo
gPh
ysica
lizatio
nDisp
layVR Unc
lear
Envir
onmen
talSc
ience
Engin
eerin
gAc
tivity
Perso
nal
Consu
merCivic
data
Other (G
IS, m
edica
l, spo
rts, ..
.)
Lab S
tudy
Field
Study
Artefa
ct/Sy
stem Con
tributi
on
Co-Des
ignCon
ceptu
al Work
/Taxo
nomy
Design
Prob
eWork
shop
sInt
erview
sN/A Sta
ndard
Custom
Artist
ic
TITLE2006 [101] Virtual Vouchers: Prototyping a Mo … White et al. 3DUI2007 [74] Enhancing the Shopping Experienc … Reitberger et al. AmI
[102] Interaction and Presentation Techn … White et al. ISMAR [100] SiteLens: Situated Visualization Tec … White & Feiner CHI [49] Visualization Techniques for Augme … Kalkofen et al. Handbook of AR [96] Visualising Environmental Corrosion … Walsh & Thomas AUIC
2012 [64] Designing for the Situated and Publ … Vande Moere & Hill J. Urban Technol. 2014 [48] Dimensions of Situatedness for Digi … José et al. Adv. in HCI
[15] The Role of Tangible Interaction in E… Claes et al. PerDis [94] Public visualization displays of citize … Valkanova et al. IJHCS [91] Participatory design of STEM educa … Thompson et al. ISMAR [108] VISGIS: Dynamic situated visualizati … Zollmann et al. INCNZ [27] Situated Analytics: Demonstrating i … ElSayed et al. JVLC [28] MelissAR: Towards Augmented Vis … Engelke et al. CHI [86] Time-Turner: Data Engagement Thr … Singhal et al. DIS [59] Duopography: Using Back-of-Devic … Li et al. SA [105] Embedded Data Representations Willett et al. TVCG [46] Building with Data: Architectural M … Hull & Willett CHI [9] Here and Now: Reality-Based Infor … Büschel et al. CHIIR [90] Situated Analytics Thomas et al. LNCS [8] Sketching and Ideation Activities for … Bressa et al. DIS [21] Defamiliarization, Representation G … Morais et al. PacificVis [18] Citizen Dialogue Kit: Public Polling … Coenen et al. DIS [62] Situated visualization in the decisio … Marques et al. IV [10] Situated Visualization in Augmente … Caggianese et al. SITIS [34] A-BI+: A framework for Augmented … Francia et al. Inf. Syst. [104] Designing for Mobile and Immersiv … Whitlock et al. VIS [72] Immersive visualization with bar gra … Quach et al. CaGIS [12] Augmenting Static Visualizations wi … Chen et al. CHI [61] Opportunities and challenges for Au … Lobo & Christophe ISPRS [71] Corsican Twin: Authoring In Situ Au … Prouzeau et al. AVI [63] Toward Agile Situated Visualization: … Merino et al. CHI [68] Chemicals in the Creek: Designing … Perovich et al. VIS [99] Revisited: Comparison of Empirical … Weiß et al. VIS [65] Showing Data about People: A Desi … Morais et al. VIS [40] Augmented Situated Visualization … Guarese et al. AVI [2] Exploring the Need and Design for … Alallah et al. SUI [103] HydrogenAR: Interactive Data-Drive … Whitlock et al. ISMAR [29] Grand Challenges in Immersive An … Ens et al. CHI [39] Augmented situated visualization m … Guarese et al. Comput. Graph. [58] Designing a Multi-Agent Occupant … Lee et al. DIS [60] Towards an Understanding of Situat … Lin et al. CHI [97] I/O Bits: User-Driven, Situated, and … Wannamaker et al. DIS [79] Investigating the Impact of Real-W … Satkowski & Dachselt CHI
TOTAL: 8 4 19 14 1 5 1 1 1 5 29 5 6 6 9 5 6 7 7 11 6 6 7 6 16 20 10 3 2 7 1 3 1 10 25 17 5 6
2021
2015
2020
2019
2018
2017
2016
2011
2009
VISUALIZATION
Physi
cal
Table 1. Corpus of 44 papers coded by the categories: situated visualization definition; technology ; data; method ; and type of visualization.
papers cite either White and Feiner (8/44), Willett et al. (12/44) or bothdefinitions (6/44). White and Feiner offer a broad definition of situatedvisualization as a visualization that “is related to and displayed in its en-vironment” [100]. Willett et al. build on the work of White and Feinerby introducing the concept of a physical data referent, which the datais displayed in proximity to [105]. They make the distinction betweensituated and embedded visualizations and data representations. The keydifference here is that embedded visualizations position presentationsof data as close as possible to the physical referent, whereas situatedvisualizations, in Willet et al.’s definition, “place the entire visual-ization in a relevant location, but do not necessarily physically alignindividual data presentations or visual marks with their correspondingreferents”[p.464 105]. Hence, the distinction between situated andembedded, and the defining difference for both, are details regardingdistance between referent and representation, and accuracy and fidelityin this relation.
In addition to these two prevailing notions of situated visualization,five papers in the corpus refer to situated visualization as part of situatedanalytics [27, 90]. Situated analytics leverages AR together with visualanalytics to support situated understanding and decision-making [27]and builds upon White and Feiner’s work on situated visualization byoffering a technology-centric view on situated visualization. Schmal-stieg and Höllerer (1/44) [82] similarly describe situated visualizationin the context of AR and refer to White and Feiner while pointing outthat situated visualizations have a semantic meaning in the real world.Tatzgern [89] (1/44) provides a more open extension of White andFeiner, where “situated visualization is this connectedness of the infor-mation to the real world” [89, p.8]. Vande Moere and Hill (1/44) [64]offer a definition of situated visualization in the context of public andurban visualization. Just as previous definitions, situated means that thevisualization is embedded in a real-world, physical environment [64,p.41]. However, where White and Feiner and Willett et al. focus on thephysical features of the environment, Vande Moere and Hill focus onthe broader meanings of the location along three dimensions defining
situatedness as contextual, local, and social.Apart from the papers that are cited as definitions of situated visual-
ization, there are a number of papers in the corpus that further engagewith the term situated visualization and the concept of situatednessincluding Büschel et al. [9] who outline the concept of reality-basedinformation retrieval, Lobo and Christophe [61] who extend the conceptof a physical referent with a geographical referent, and José et al. [48]who define six dimensions of situatedness for public displays, focusingon public signs and displays rather than situated visualization.
3.3.2 Type of Technology
We coded the corpus based on the type of technology used to show situ-ated visualizations. Notably, several papers mention or include multipletechnologies, for instance, papers with theoretical contributions likeWillett et al.’s [105] paper on embedded data representations mention arange of technologies. As with the definitions of situated visualization,there is a similar dominance of AR work (29/44), with the remain-ing papers in the corpus looking at and developing more traditionaldisplay-based examples and analog and physical data representations.
The close relationship between AR research and situated visualiza-tion can be attributed to several possible reasons. First, the definingwork by White et al. [100, 101, 102] has had some influence on sub-sequent work, not only in how the definition is used, but also in howSiteLens [100] has become a common example and use-case to referto [62, 96]. Second, within the AR and immersive analytics researchcommunities, situated visualization is often seen as a use case for ARor a motor theme within AR [49, 85, 108] and perhaps not as a researcharea in its own right. Hence, multiple works use situated visualiza-tion as part of making technical contributions to AR research [71] orimmersive analytics [104]. Third, there is work on situated visualiza-tion in which AR satisfies specific requirements for the use case, suchas the ability to superimpose information about structures within thebuilt environment [96], underground utility infrastructure [80, 100],support for mobility [59, 101], search and access to task related in-
formation [9, 10, 40, 104], or visualization of a phenomena close toan object, e.g. visualizing electromagnetic fields close to the objectgenerating it [39].
Moving outside of AR-centric work, there is a broader catalogue ofexamples that include different technologies. A number of papers in thecorpus (9/44) take an interest in exploring situated visualizations usingmore traditional display technology and another group (5/44) takes aninterest in mobile devices. This includes several projects with a focuson displaying visualizations within semi-public and public spaces toengage people within proximity around locally collected data [19, 48,74, 94]. Another part of the corpus, focuses on showing data throughan analog medium (6/44) or as data physicalizations (6/44). Two of theprojects present designs where the visualization is part of a physicalobject: a custom clock [21] and coasters [86] that show visualizationsof people’s activity. In these examples, the visualization is designedto fit the physical object and vice versa. Hull and Willett [46] usewood to integrate data into architectural modelling and Perovich etal. [68] use lanterns to visualize pollution violations in a local creek.These projects in the corpus focus on situating visualizations with andthrough objects and with consideration towards the place and moreephemeral engagements with the visualization. In addition, the worktakes on a technologically inclusive perspective where it is the placethat is instrumented, rather than the people (e.g. not requiring the useof head-mounted displays to view the situated visualizations). Finally,an important point in several of these projects that do not rely on ARis to make data public which in turn suggests technologies that canbe viewed by everyone within proximity so that the visualization canbecome part of a shared reflection or public debate [19, 64, 68].
3.3.3 Type of Data and Application Domains
The type of data provides an overview of prominent types of data forsituated visualization and common application domains.
One group of papers pertains to science and engineering applica-tions. This includes engineering data (11/44) such as Building Infor-mation Modeling (BIM) and maintenance data [71, 103] or data onenvironmental corrosion [96]; environmental data (7/44) such as airpollution [100] or water permit violations [68]; and science data (7/44)such as honey bee behaviour [28], geological science data [104], orscience education [91].
Another cluster of papers deals with situated visualization of datafor the general public (19/44). This includes civic data such as publicvisualization of urban and locally-relevant data [18, 64, 94] and publicdata installations [15]; personal data such as visualizations in domesticsettings [86, 97]; and consumer data in domains such as shopping [74].Related to this cluster of papers are a number of articles that focus onvisualizing activity data, in the home [86] or in workplaces [21].
Finally, there are data types and application domains that only occura few times, which we grouped in the other category (16/44). Thisincludes GIS data [59, 108], medical data [49, 58, 90], education [12],sports [2, 60], business data such as logistics data in warehouses [8, 34]and instructions for DIY tasks [99].
Note that for several articles in the corpus, the type of data or targetapplication domain was unclear (6/44). These articles often presentmultiple possible applications [48] or domain-agnostic techniques [10,63, 72, 79, 102]. Overall, our analysis shows that situated visualizationhas been explored for a wide variety of data from different applicationdomains and for different settings. However, the level of depth inengaging with a particular domain varies widely. Some papers in thecorpus engage in depth with a particular target audience and applicationdomain, through initial engagement with a domain, iterative prototypingand design, and a real-world deployment. However, this is rather rare,as most application domains are primarily used as illustrative examplesof the visualization technique. As seen in the method column (Table 1),the majority of papers in the corpus rely on lab studies (20/44), witha number of field studies (10/44) and only a handful of papers thatinvolve co-design (2/44), design probes (1/44) or workshops (3/44).
3.3.4 Type of VisualizationIn terms of the type of visualization used, we found that a large numberof papers in the corpus provide little to no reflection on their visual-ization design rationale. For about a quarter of the papers (columnN/A: 12/44), it would be a stretch to categorize them as a deliberatelydesigned data visualization. Instead, these papers often only visualizesingle data points in-place. An example of this is Zollmann et al. [108],which only shows text labels for buildings. As a notable exception tothis, the work of Morais et al. [21], discusses in detail how the data isrepresented and how the (custom) visualization was designed.
The most common visualizations are what we have referred to inTable 1 as Standard visualizations–those that can be easily generatedusing common tools such as spreadsheets. The majority of the corpus(25/44) relies on such standard visualizations such as line charts, barcharts, or heat maps. The second largest group (17/44) in the corpus useCustom visualizations–handcrafted or custom designed visualizationsspecific to the application domain, the context, target audience orthe data that is being visualized. A small number of papers rely onwhat we categorized as Artistic visualizations (5/44)–visualizations thatshow data in an aesthetically pleasing way, where the data visualizationremains in the periphery when it is not the primary focus of attention forexploration and analysis. This category is related to ambient displays,and is inspired by Redström et al.’s informative art [73] and Stasko’sinformation art [87]. Examples in the corpus are Chemicals in theCreek [68], Time-Turner [86] and Valkanova et al.’s Gurgle waterfountain display [94]. For example, in Time-Turner, data is visualizedon physical drink coasters augmented with LEDs. While the coasterscan be used to explore the data, the visualization was designed to invitecuriosity and be visually unobtrusive. Finally, some papers in ourcorpus are surveys or cover a wider design space and discuss severalvisualizations and thus provide multiple visualization types [65, 105].
In summary, the corpus shows limited engagement with how the datais visualized. Few papers deliberately discuss how the visualizationwas designed and how it represents the data. The majority of papersin the corpus either use standard visualizations or only visualize sin-gle data points (35/44). This could indicate that the area of situatedvisualization relies on prior innovations in visualization by leveragingwell-known and standard visualizations, and rather focuses on howthe data visualization is situated instead of on its representation. Onthe other hand, this may also point to a lack of concern for how thevisualization should be designed to be presented in a situated manner.Indeed, some of the counterexamples (e.g. [21, 68, 86]) employ a care-fully designed visualization to ensure appropriateness for the intendedtarget audience and context of use.
3.4 Summary of FindingsNext, we summarize our key findings from the literature survey.
Limited engagement with definitions. We observed that few papersin the corpus engage deeply with the existing definitions of situatedvisualization (Sect. 3.3.1). Most papers merely cite one of the pre-vailing definitions (White & Feiner [100] or Willett et al. [105]), butdo not discuss in detail how they understand situatedness and situatedvisualization.
Limited engagement with how data is represented. We found thatthere is limited engagement with how data is represented and visualizedin the corpus. Additionally, the majority of the corpus use standardvisualizations, visualization as single data points or only information,or use visualizations as exemplars to showcase technical contributions.This may be also partly due to the view of almost any AR applicationbeing synonymous to situated visualization (e.g. ElSayed [27] andSchmalstieg and Höllerer [82]).
Limited engagement with target audience. There is limited engage-ment with and consideration of the target audience for the visualizationsthat are described in the corpus. This ties back to the prominence oflab studies as the most common way to study situated visualizationin the corpus. Only a quarter of the papers in our corpus rely on field

studies, and an even smaller set uses multiple methods, such as initialengagements through workshops or deployments and field studies.
AR as the dominant technology. From a technology perspective, thevast majority of papers in our corpus relies on AR, with the rest ofthe corpus utilizing other technologies such as larger displays, mobiledevices, or physicalizations.
A spatial understanding of situatedness. There is a close relation-ship between situated visualization and AR which has influenced thefield and emphasizes technical contributions. This leads to a prevailingspatial notion of situatedness in the corpus which emphasizes spa-tial properties and relationships between visualizations, objects, andlocations.
4 EMERGING PERSPECTIVES OF SITUATEDNESS
Our survey confirms that papers on situated visualization conceptualizesituatedness primarily as a set of properties related to space and proxim-ity between the visualization and objects or features of the environment.
Starting with applying and operationalizing known features – in thiscase location and spatial organization – before exploring additionalperspectives, is a common strategy in research. For instance, early workwithin context-aware and mobile computing started by investigatinglocation tracking to provide novel applications and services. However,the community quickly realized that “there is more to context thanlocation” [83]. Zimmermann et al. [107] make similar observationsand explore five operational features of context. While these focus oncategories of contextual information, their work illustrate the need forexpanding early conceptions of context, and here situatedness, intomore useful analytical and operational categories.
When exploring ‘situatedness’ beyond location and spatial relations,Dourish [22] made an important point: understanding context (and sim-ilarly situatedness) as a matter of spatial organization and cataloguingobjects and relations reduces context and situation to a representationalproblem where information and (material) stability take precedenceover the relational and dynamic aspects. Instead of being a product ofmetrics and spatial features, context arises from activity, in the sensethat what meaningfully counts as context is what matters to the activity.This observation applies to understanding situatedness as well.
Suchman [88] made a related argument earlier when discussing theability to model humans plans and reasoning: people can plan theiractivities but action is contingent on the conditions and environment inwhich it unfolds. Instead of conceptualizing use and action as carryingout intentional plans and following precise scripts, people act based onestablishing a coherent and mutual understanding of action and meaningin unique material and social circumstances (situations). Suchmanemphasizes language and social interaction as a primary mechanismfor organizing activity. From this perspective, what ‘is’ the situation isa continuous achievement of social interaction. This is referred to asthe practical objectivity of situations: when engaged in activities andsocial interactions we pay attention to what is important to the activityand interaction above less important aspects and things. Hence, whatmakes the situation mutually intelligible to the people involved in theactivity is a product of how people make sense of activities and actionthrough social interactions and language.
Based on these discussions on examinations of the additional factorsand aspects of the context, and social and material circumstances thatinfluence how visualizations can be considered situated, we introducefive perspectives of situatedness: space, time, place, activity, and com-munity. We selected these perspectives based on broader theoreticaldiscussions on situatedness in HCI, CSCW, and ubicomp and fromemerging themes from the corpus analysis. The space perspective isderived from the largely spatial understanding of situatedness present inthe corpus and Willett et. al.’s concept of physical referents. Place andactivity are based on theoretical discussions on place in HCI (influencedby Dourish [23]) and activity theory [5]. The time and community per-spectives are to a certain degree underdeveloped and implicit in thecorpus (see Willett et al. [105] temporal indirection for time and workon public visualization for community[19, 68]), which we developfurther in relation to situatedness.
By introducing six cases (C1–C6), we illustrate how these perspec-tivescan be used. We will discuss and elaborate on the individualperspectives with the cases as examples.
4.1 Exemplars of Situated Visualizations: Six Cases
We analyse six cases (C1—C6) from the literature we find to be goodexemplars of situated visualizations and physicalizations to illustratethe different perspectives on situatedness we have identified (Figure 1).While these cases may not all use the term “situated visualization”explicitly, we introduce them to expand on the key concepts developedin the works of our initial corpus.
C1 Corsican Twin [71] is a VR authoring tool for designing situatedand embedded AR visualizations remotely for building management.Based on the concept of digital twins that are digital replicas of real-world objects and spaces, the tool enables authoring of AR visualiza-tions for large or difficult to access environments in a remote setting.People can create visualizations in VR in a 3D model of the interior ofthe target environment and afterwards view the created visualization inAR in the physical space through a head-mounted display.
C2 Situated Glyphs are small context-aware displays that showactivity-specific information [51, 95] to support work activities ofhealthcare professionals. The project explored the use of small wear-able, mobile, or fixed displays that show relevant information to supportinterleaved activities involving multiple individuals and different typesof equipment in the context of healthcare work.
C3 Cairn is “a tangible apparatus that enables situated data collection,visualization and analysis” of FabLab activities [36]. Its creators presentit as an alternative to questionnaires and data collection techniques,while also materializing FabLab activities and fostering reflection onthem. Cairn’s physicalization consists in tokens visitors stack on atabletop to record and display the type of activity they conducted in theFabLab, what resources it involved, what they learned and taught, andhow much time they spent in the lab. The project has been implementedin a FabLab in Paris and has been adapted in the NYU Makerspace [56].
C4 Chemicals in the Creek [68] is a community-based physicaliza-tion in the form of an interactive installation. The project consisted ofdeploying connected lanterns representing water quality violations byindustrial facilities during a public event. The installation itself was theresult of two years of collaboration between researchers, citizens andactivist networks, assembling data, deciding how and when to displayit, and debriefing the event with the public afterwards.
C5 Activity Clock [21] is a wall clock that integrates data on thenumber of people typically present in a cafeteria of a research laboratoryover a day. The visualization is made out of paper inside a plastic wallclock and has been deployed over the course of the week.
C6 Public Polling Displays [14] is a project about public visualiza-tions on small distributed public polling displays that present a civicissue through data driven narratives, which has evolved into an interac-tive citizen participation survey display device [17]. In collaborationwith a neighborhood committee in Antwerp, the researchers distributedmultiple small e-ink displays on house facades of residents that pre-sented perspectives on local issues consisting of a visualization of airpollution levels based on PM25 sensor data, a public polling questionand results from the hosting resident, supporting infographics or textualannotations, and a personal statement of the hosting resident.
4.2 Perspectives
To expand the concept of situatedness, we introduce five key perspec-tives (space, time, place, activity, and community). While these fiveperspectives are complementary and could be considered for each of thecase studies, we highlight selected case studies that are more prominentand relevant for particular perspectives than others.

Fig. 1. Case studies: C1 Corsican Twin [71], © 2021 A. Prouzeau; C2 Situated Glyphs [51, 95], © 2012 IEEE; C3 Cairn [36], © 2021 P. Gourlet; C4Chemicals in the Creek [68], © 2020 W. Campbell/IEEE; C5 Activity Clock [21], © 2020 IEEE; C6 Public Polling Displays [14, 17], © 2021 J. Coenen.
4.2.1 Space
The space perspective is implicit to most works reviewed in Section 3,and focuses on the spatial organization and relationship between thephysical environment and situated visualizations. Framing situatednessas a problem of spatial representation implies that the unit of analysisis the placement of visualizations with regards to spatial properties andfeatures in a three-dimensional environment (e. g., location, proximity,distance, and physical structure). This spatial perspective resemblesmany similar attempts to sense and represent context in context-awarecomputing and recently in proxemic interaction [38].
The space perspective is explicitly represented in the key definitionsby White and Feiner [100] and Willett et al.[105], in particular in Willettet al.’s concept of physical referents. They approach situatedness as arelationship between physical referents and physical representationsof data. They position this relationship within an extension of the datavisualization pipeline that includes both a physical and logical worldwhere physical referents are a “physical object or physical space towhich the data refers”[p.462 105]. The emphasis, thus, lies on theproximity between data representations and physical referents which isused to distinguish between situated and embedded visualizations andto determine the level of “spatial indirection”.
While space, by definition, plays a role in all the cases, there arecases where it is a particularly useful perspective to consider that can behelpful to examine other aspects of situatedness. C1 (Corsican Twin) isa good example in which spatial situatedness is key in understanding theconnection between the physical space, the visualization and the activityit is intended to support. In C1, visualizations about the equipmentand the site are situated by pairing equipment with data streams fromassociated sensors. The visualizations, as overlays, create a directrelationship between data (such as volume in a tank, see Figure 1, C1)and physical referents (the machinery). Here, it is crucial that thespatial relationship is mapped as accurately as possible. However, aswe further discuss in the activity perspective (4.2.4), closeness is notalways desirable from a design point of view. For instance, whenthere is no direct spatial relationship to physical referents, or whenthe visualization blends different data from different referents, directspatial closeness might not be optimal or even appropriate.
The Situated Glyphs project C2 distinguishes between three types ofspatial placement of glyphs in the hospital: entity-centric, activity-centric and space-centric. Inspired by Pederson’s situative spacemodel [67], these three variations consider space beyond physical dis-tance between the visualization and the entity of interest, recognizingthat people’s activities and context of use are important to consider.
Going beyond purely spatial relationships between data and physicalreferents that focus on displaying data where it is produced, Willett etal. [105] touch upon the concept of a semantic relationship between
data and physical referents which introduces the importance of tasksand observational goals of the viewers and the meaning people putinto situated visualizations. In the following sections, we expand onthe spatial perspective on situatedness by introducing the additionalperspectives of time, place, activity, and community to better considerhow people make sense and interact with their environment.
4.2.2 Time
Taking a temporal perspective puts the emphasis on the relationshipbetween when data is recorded and when it is presented. The projectsreviewed in our survey tackle time in various ways, ranging from dis-playing only live data, to historical or cumulative visualizations. Willettet al. [105] note that, as for space, one can consider temporal indirec-tion, defined as the distance “between the moment in time a physicalpresentation is shown and the original time it refers to”. In Newto-nian or naïve physics, this corresponds to the notion of a linear anddirectional flow of time, leading to a global ordering, and to observerssharing the same time reference [78]. Adopting a linear time-flowperspective means that to be situated, visualizations should minimizetemporal indirection [105], i.e. display data as it is captured. This is aparticularly strong design constraint, which is relaxed in most situatedvisualizations. Since one cannot physically go back in time, traces orcumulative data is often displayed instead.
Yet, temporal data can be structured and thought of in a variety ofalternative non linear ways [1]. In C5 (Activity Clock), the situatedvisualization adopts a circular 12-hour clock view to represent the aver-age number of people in a cafeteria at a given time of the day [21]. Withdata spanning three years aggregated in a static clock-like visualization,is it the daily cyclical rhythm of the cafeteria that is conveyed ratherthan a linear evolution. By setting up the display in the cafeteria, the au-thors situate the visualization in space, yet the interviews of observersalso reveal that they interpreted the visualization reflecting on theirtemporal knowledge of local routines, of their individual habits, and ofthe social temporality of the cafeteria.
The question of temporal relevance, changes and synchronicity, hasbeen important to social sciences scholarship. As sociology was defin-ing itself as a discipline, in the early 20th century, “social time” [41]became a central object of inquiry. This involved considering time asneither fully objective, nor subjective but rather socially constructedThis enables to account for multiple temporalities that are constitu-tive of lived experiences. Social time can still be found in metrics,for instance, in agreed upon time zones, or shared 24h time-frames,rather than reliance on solar time. Taking into account social time leadsto another perspective on temporal situatedness. Temporal relevance(rather than proximity) relates to activities, shared cultural referencesand conventions, habits, needs for coordination. Temporal situatedness

is constructed through the interactions between individuals, groupsand their objects of interest. In C5, cafeteria breaks become temporalreferences, in between events and periods, they are activities associatedwith a place and with people, but also something of broader social andtemporal meaning: a break in the workday and a time with associatedexperiences and cultural conventions.
In C3 (Cairn), the physicalization strategy consists of stacking tokensto represent events happening in a FabLab, with the most recent beingon top [36]. The time of data capture and the time of visualization areblended, as the visualization is created by manually capturing events.More importantly, the physicalization creates a shared temporalityinside the FabLab, as the manual assembly can also provoke encountersor discussions about recent events or distant ones, that resurface andbecome “present” through stories told around the table.
This aspect of shared experience is also important in C4 (Chemicalsin the Creek). While the visualization is ephemeral, lasting only oneevening, it exists within multiple time frames: the public event and thelifelong experience of pollution of local inhabitants. With the physi-calization being created for this specific event, temporal situatednesscould be considered high although the data captured is several monthsold. Moreover, as environmental pollution unfolds over very long timescales, the notion of temporal indirection [105] may not be the mostrelevant to assess the situatedness. The pollution sensed months agomay still be present in the environment years in the future.
To sum up, a linear or cyclical perspective on time, in which time isconsidered an objective non-reversible arrow, “flowing equably withoutregard to anything external” [78] can be useful. Yet in many cases,temporal situatedness has more to do with the way data connects to thetemporal experience of the viewers.
4.2.3 PlaceTaking a place perspective means paying attention to a location whilebreaking away from a purely spatial perspective and representationalapproach. A place is shaped by its history, its local identity and themeaning it has for its inhabitants [93]. Hence, visualizations becomesituated if they fit within and represent not only relevant data, but theunique aspects of a particular place, such as data collected by the in-habitants or local cultural heritage. Place as a perspective becomesparticularly relevant in relation to the urban- and place-based visualiza-tions that are contained in the corpus.
Several papers discuss aspects of situatedness in relation to and withreference to places. For instance, Vande Moere & Hill [64], Valkonavaet al. [94], and José et al. [48] all discuss aspects of place, local identityand culture in relation to situated visualizations. The meaning of placeis usually contrasted with the meaning of space. Whereas space isthe spatial structure of the world, a space becomes a place by gainingmeaning through living in it, the people occupying the space, and itshistorical context. Harrison and Dourish describe the difference as “weare located in space, but we act in place” [42, p.69].
Examinations of place are frequent in HCI that build upon varioustraditions but share a common focus on how we experience place [13],place as a unit of analysis [32] and the challenges in designing forplaces [53]. All of these works introduce place as more than a simplebackdrop or ‘context’ for activity, but as a meaningful relation peoplehave to a locale through its socially and culturally embedded meaning.
In C6 (Public Polling Displays), the concept of place plays a role inhow the displays are situated and how data is collected. To engage withthe public polling displays, to vote on the presented local issues, andto understand displayed data, only makes sense if the person viewingthe visualizations has a relation to the place in which they are deployed.People who have a relationship to the place are residents, neighbors,visitors, and daily commuters to that particular neighborhood whointerpret the visualizations in hyper-contextual ways. These polls anddisplays have a dual role: they collect and display local informationabout the place, but they also define what is of local relevance, i. e.what is a place. It is through this interaction that the place takes itsshape and the visualization becomes situated.
There are similar principles at play in C4 (Chemicals in the Creek).Here, the visualized data is important to the place where the installation
is presented. While the data is not directly related to the dock wherethe installation and event took place, the place of the event createdan opportunity to make people aware of how water permit violationsinfluence the creek, the people, businesses, and homes. The project goalwas increasing community ownership over the waterfront and creatinga place for communication within the community. It is through theevent, in a given location, with people sharing a matter of concern bycreating an ephemeral place, that the physicalization becomes situated.
With C5 (Activity Clock), people’s collective presence in the uni-versity cafeteria and general activity patterns in terms of coming andgoing are visualized on a wall clock. This visualization is designed forcollective reflection and to support social engagement, which fits wellwith the character of the place in which it was deployed – which peoplefrequent to get a drink and often socialize in. People’s interest in thedata is tightly coupled with the attachment to the place of deployment,situating the visualization by creating meaning to the locale.
Overall, the place perspective emphasizes situating data in withinplaces that are relevant to people through their embedded socio-culturalmeaning which provides opportunities to create meaningful relationsbetween data and places.
4.2.4 Activity
From an activity perspective, situatedness implies that visualizationsare not used in isolation but are embedded and connected to a widerset of human activities of target audiences. As visualizations moveinto everyday environments, designers need to consider why peopleconduct certain activities, how visualizations can meaningfully mediatethese activities, and how they relate and connect to broader activitiesconducted across spaces, over longer time spans, or via collaborations.
These considerations of socio-cultural aspects of design have beendeveloped in depth in HCI research through Activity Theory [50]. Ac-tivity Theory describes “activity” as a complex relationship between aperson and their goals that is mediated by socio-cultural and historicalcontext and tools – such as an interactive device. Because of this medi-ating function of technology, Bødker [5] notes that people do not actwith but rather through computer interfaces. Interactions with comput-ers are done to support or mediate real-life activities that involve sharedpractices with multiple people and different tools. The importance ofpeople’s activities in the situation at hand means that designing andevaluating situated visualizations requires a deep understanding of peo-ple’s activities in a specific context as the relevant activities determinethe appropriateness of particular designs, representations, placements,or technologies that are considered for the situated visualizations.
As an example, the Corsican Twin project C1 [71] takes into ac-count common work activities of Building Management System (BMS)engineers and maintenance technicians when designing the situated vi-sualizations. Examples of these activities include analyzing the currentstate of the system or the temporal evolution of specific variables. Aninitial study showed several benefits of the situated visualizations suchas the usefulness of only showing localized information and showingdocumentation in-situ. However, later expert feedback highlightedhow the activities of workers impacted spatial aspects of the situatedvisualization. For instance, some participants wanted to place visu-alizations near the sensors rather than near the equipment as that iswhere technicians would focus their attention first. Data about distantsystems was also deemed useful to bring into the site for comparisonand context. Several participants tended not to place visualizationson objects, but rather placed visualizations in 2D on nearby walls andsurfaces to make the data more manageable. This shows how the workactivities of people in different roles within the space guided the waysin which it was useful for them to situate data and visualizations which,in turn, influenced the placement of visualizations.
Similarly, Situated Glyphs (C2) [51, 95] are visualizations that aredesigned for a work context, in this case to assist nurses in a hospi-tal setting. While the entity-centric, activity-centric and space-centricplacements were informed by initial fieldwork in the ward, when con-ducting studies in the hospital with nurses and the prototypes, a numberof additional issues emerged. The nurses were very positive about beingshown overviews and information relevant to the activity at hand, and

appreciated automatic documentation of performed activities. However,it was clear that the specific constraints of the workplace and the activi-ties performed in it influenced many aspects of the design, in particulardisplay placement. Entity-centric glyphs were not deemed to be as use-ful due to concerns about safety and practicality of wearable displaysor displays that were fixed to objects or individuals. While hands-freeoperation was convenient, there were many issues with placement ofdisplays around equipment that would often be moved around. Themost promising and flexible solution seemed to be a hybrid mobile sys-tem that could be carried around and placed in an appropriate locationwhile performing activities, such as a display that could be attachedto a wall. Moreover, it was crucial to remain in control and be able tocope with unexpected situations and frequent interruptions. This caseshows that a variety of aspects surrounding individual and collaborativeactivities as well as shared practices in the workplace determine theappropriateness of certain technology, placements, and visualizations.
Overall, these two cases illustrate that there are several aspects of sit-uatedness related to people’s activities – such as shared work practices,social and safety protocols, unexpected situations and interruptions –that go beyond spatial aspects and can have an important influence onthe suitability of different spatial layouts. These case studies highlightthat a deep understanding of people’s activities is important so thatthe technology and visualizations can be properly appropriated andintegrated with people’s existing activities.
4.2.5 Community
Taking a community perspective puts emphasis on the community ofpeople who are the audience for and/or co-creators of visualizationscentered around local issues and shared concerns [e.g. 20]. This per-spective supplements place and activity by empirically foregroundingthe community and local issues. Existing work on situated visualizationthat considers a specific group or community as the audience of situatedvisualizations focuses on “anchoring” the situated visualization withina specific community. Focusing on how a particular community usesand appropriates technologies in their activities is a common topicin HCI research [6, 11], including work that explores engaging with(urban) communities and local issues[20] as well as research withinpublic visualization [64, 84, 94]. The community perspective is closelyrelated to the place and activity perspectives as a place gets its meaningover time with and through a community and the activities that arehappening within that community. The perspective of community isconcerned with initiatives that focus on supporting a community in itsactivities, and using technology to support coordination around a sharedconcern. In projects that focus on supporting communities throughsituated data visualization such as C4 (Chemicals in the Creek) or C6(Public Polling Displays), community members are involved through-out the design process, starting with early engagements to understandmatters of concern, and then transitioning to activities that activelyinvolve community members in the design of the technology, typicallyusing participatory design or co-design methods. In the context of pub-lic visualization, Schoffelen et al. [84] discuss how visualizations canreveal the backstories behind facts from different perspectives, which –when carefully designed to be readable and transparent – can allow forengaged discussions and reflections within a community.
In C6 (Public Polling Displays) [14], the situated visualizationswere designed to address shared concerns around local issues thatthe community members found important, and were placed on housefacades. In the study of the system with a neighbourhood committeefor a street in the city of Antwerp, the shared concern was air pollution,with the neighbourhood committee aiming to get the street blockedfor non-local traffic. Community members who hosted displays withvisualizations on their facades could add their own backstories to thevisualizations to support community-driven dialogues. The spatiallocation of the visualizations had an impact, but the social aspects ofthat location were just as important. For example, the perception ofand trust in the visualized data was affected by the social relationshipbetween the passerby and the visualization-hosting community member,either in a positive or negative way, depending on the hosting member’ssocial standing with the passerby and in the community at large [14].
For C4 (Chemicals in the Creek) [68], the shared concern was raisingawareness of spills and pollution in the Chelsea creek. The communitythat the researchers engaged with was GreenRoots: an environmentaljustice organization in Chelsea, Massachusetts. The researchers createda one-time performance to foster trust and connection among commu-nity members on the topic of water quality violations. The performanceacted as a ceremonial event for witnessing data that supported sharedreflection and recollection about the spills. Here, the situated visual-ization and the community build on each other: the visualization issituated partly because it relates to a shared community concern, andthe visualization fosters community development.
In C3 (Cairn) [36], the physicalization targets the community arounda FabLab in Paris and their shared concern is reflection on and docu-mentation of the activities that happen in the FabLab over time. Gourletet al. [36] note that Cairn enables “new collective reflections” and al-lows community members to discuss what they “are as a community infront of a landscape that describes our practices [i.e. Cairn] and withan experienced, thus, negotiable code.”. Thus, Cairn acts as a facilitatoraround a shared interest of the members of the FabLab communityinvolving the community members in the data collection process.
Overall, the community perspective emphasizes situating data inrelation to communities of people to support engagement with localissues and concerns, often by involving the community in a participatoryprocess.
5 DISCUSSION
The perspectives we presented in the previous section are complemen-tary ways of approaching situatedness. Space – as the most prominentperspective in the corpus of research we reviewed – is a useful startingpoint when designing situated visualizations as it provides the foun-dations for placing visualizations in the world. However, consideringother perspectives on situatedness is key in addressing common chal-lenges (see e.g. [29]) and enable designers to take into account broaderconsiderations into their design, and improve the experience of situ-atedness for observers or users of the visualizations. Reflecting onour survey and the perspectives, we discuss technology, material andaesthetics, leveraging the perspectives for design as well as methodsfor stronger engagement with target audiences.
5.1 Technological ConsiderationsNorman controversially stated: “technology first, needs last” [66],arguing that technological innovation often leads to new conceptualinventions and the development of potential use cases. Our surveysuggests that we may be witnessing a similar movement in situatedvisualization. A new wave of commercially available AR technology issparking interest in the development of situated visualizations, whichmay lead to novel use cases. It is reminiscent of how the advent ofmobile computing led to the emergence of ubiquitous computing.
While novel technology can enable novel use cases, it should, how-ever, also not foreclose the use of alternative, sometimes more appro-priate technologies. Although AR may be well suited to personal andprivate situated visualizations, collaborative AR technology is still in itsinfancy. Public displays may be better suited for collaborative, sharedor public situated systems as such systems already support spontaneousinteractions, do not require personal equipment, and can be used collab-oratively. Static posters or data physicalizations do not need power, andcan be made sturdy enough to be left alone for long time periods. E-inkdisplays have low power requirements and can be integrated inconspic-uously into a variety of different environments [8, 14], while chalk’stransience facilitates lightweight updates and local adoption [4, 52].
Work on situated visualization would benefit from engaging indeeper discussions on technological choices related to the case or targetdomain, without defaulting to one technology or another. Technologyalone, whether it is AR or chalk on the street, does not make a visual-ization situated, solely on the basis that it displays data in proximity toits source. To situate visualizations into an environment, technologicalchoices should consider the target audience and the context of use.
Moreover, these technological choices are conditioned by the under-lying infrastructure that is available. To work smoothly, AR requires

robust computer vision techniques and indoor location tracking in or-der to determine its location and recognize surrounding objects. Asdemonstrated in C1 (Corsican Twin), having access to richer buildingand object models enables much finer augmentations and situatedness.Likewise, public displays often require a wireless and electric infras-tructure to be in place in order to be installed without problems. In otherprojects such as Mill Road [52], constraints on not touching the cityinfrastructure led to picking chalk rather than a more durable medium.Situated technologies, whether AR, public displays, or lower-tech, can-not be thought of without also considering how they will interface withthe environment and the technical infrastructure they should fit in.
5.2 Material and Aesthetic ConsiderationsIn addition to considering which technology to use, when fitting a visu-alization within a place, material properties also have to be considered.In C3 (Cairn), for instance, the artefact itself is fabricated in the FabLabso its material properties match with the surrounding space. In the areaof public visualization, Street Infographics [16] integrates demographicinformation about a street into in the form of an addition to a streetsign which uses the existing urban infrastructure to present information.Similarly, in projects like Mill Road [52] and Tidy Street [4], visualiza-tions are drawn with chalk on the pavement and street, which integratesthe visualizations with the urban environment. Fitting a visualizationwithin the environment is not only a matter of the choice of technologyor medium, but also of the visual representation itself. Rodgers andBartram’s [76] energy feedback visualizations show the value of anartistic and aesthetically pleasing representation of data that is designedto fit within a home environment to match with people’s personal pref-erences. Similarly, C5 (Activity Clock) highlights the importance ofan aesthetic fit for visualization designs within the space the data isdisplayed in. This is line with work on ambient displays [106], aestheticrequirements for information visualization [57] and projects on publicinformation displays [94] that all show that material and aesthetic as-pects are important considerations when designing visualizations thatare to be situated and fitted within a specific environment. While thereis a balance between choosing a technology and visual representationthat offers the functionality needed and a good material fit within theenvironment, considering materiality is an important lens for choosinghow to display and visually represent situated visualization.
5.3 Leveraging the Perspectives for DesignThese perspectives do not suggest to simply examine new types ofreferents [105] for designing situated visualizations, such as for thecommunity perspective, replacing physical objects as referents withcommunity elements (actors, places, matters of concern). Our goal is toopen up the discussion within the different research communities thatuse situated visualization to explicitly consider and more deeply engagewith broader characteristics of situatedness beyond spatial aspects, asdiscussed in this paper. This contributes to expanding and clarifyingthe scope, definition and applicability of situatedness for visualizations.
Rather, we argue that the different perspectives of situatedness ex-pand research stances on situated visualization and are beneficial todevelop situated visualizations that are driven by their context of use.We position these perspectives as vantage points that supplement eachother from a theoretical, methodological, and design angle. They playa role as starting points in design – who to talk to, where to go, whatto consider – and act as deliberate generative strategies throughout theprocess. They invite participants and researchers to ask – what wouldbe important to consider in terms of situating visualizations if space,time, community, activity or place is the primary unit of focus? Eachperspective foregrounds different aspects of situatedness and focusingon one should be a deliberate choice in the design process. To accountfor the different perspectives when designing for situated visualization,new approaches and research in design methods are necessary [7].
To broaden the view on situatedness beyond spatial aspects alone,it is important to expand on methodological approaches. While labstudies are used to gain an understanding of how people interact withand perceive situated visualizations, in order to design and account forsituatedness in all its richness (across the perspectives), it is essential to
engage with the context and the audience the visualization is intendedfor. This often starts early on in the research process, by engaging infieldwork to understand the target audience and the environment inwhich the visualization would be deployed, as we observe in severalof our case studies (e.g. C4 [68] and C6 [14]). The realism of labstudies can also be improved by conducting them in an environmentthat closely resembles the eventual deployed environment, as with theon-campus research space with sensor data in Corsican Twin (C1) orstudies in the hospital ward in Situated Glyphs (C2).
An ecologically valid methodology that situated visualization re-searchers could consider is “research in the wild” [77], i. e. creatingand evaluating new technologies in-situ, observing how people react tothe new technology and how they change and integrate the technologyinto their lives. Beyond evaluating a visualization design, many designconstraints will also only become apparent by taking into account theenvironment in which the visualization will be deployed. This requiresthe use of and further research into developing in-situ (and participa-tory) design tools and methods, which some researchers have startedexploring [8, 14, 24, 44, 95]. For example, Bressa et al. [8] exploredthe use of several situated design and visualization sketching exercises,including the use of magnetic whiteboard sheets and tiles mimickingthe form factor of small displays. Ducros et al. [24] similarly exploredsituated design exercises and tools, where being in-situ provided tacitknowledge about the place, enabling designers to leverage design oppor-tunities such as spatial features, objects, and social activities that weretaking place. Moreover, in several cases (e.g. C1 and C2), the need forflexibility in use and spatial placement of the visualizations emerged.Without the use of in-situ methods in an ecologically valid context, itis difficult to understand how the target audience will appropriate thesituated visualizations, or how the visualizations may need flexibilityto account for unexpected circumstances.
Situated visualization is grounded in a long history of computing vi-sions and ideas. Kruger’s [55] responsive spaces (1977), Weiser’s [98]ubiquitous computing (1991) and Fitzmaurize’s [31] situated informa-tion spaces (1993) were early influential visions. Projects like Prante’sHello.Wall [70], Tollmar’s virtually living together lamps [92], the MITTangible Media Group’s ambient displays [106], Columbia University’swork on the Touring Machine [30], and Situated Documentaries [43]are situated visualizations done under different themes and concepts.Similarly, the recent grand challenges in immersive analytics [29] andarguments within the visualization community to move “visualizationbeyond the desktop” [75] and focus on opening up the domain for casualinformation visualization [69], public physical data installations [35]and personal visualization [45], suggest an important focus in situatedvisualization moving forward.
6 CONCLUSION
The surveyed corpus, selected cases and historical examples withinthe research communities highlight “motor themes” [see 54] for dis-cussing and identifying research areas that span the broader literatureand research gaps in narrow topical surveys. Expanding on the un-derstanding of situatedness is an important motor theme here, but ourwork identified additional themes that motivate and inform future work.We emphasise exploring technologies for situated visualization thataccount for the presented perspectives, paying attention to the aestheticand material fit when developing situated visualizations and multiple de-sign considerations, ranging from identifying and developing methodsthat fit the perspectives to examples of design processes that can betterinform design and practitioners. These present fruitful avenues forresearch and new applications to drive situated visualization forward.
Situated visualization sits at a sweet spot between technical, concep-tual, and empirical research. With many technologies and theoreticaltraditions to build on, it has the potential to develop as a promising areaat the intersection of multiple research communities with a commoninterest in bringing visualization into people’s everyday environments.
ACKNOWLEDGMENTS
We thank Susanne Bødker for providing feedback, Ida Larsen-Ledetfor title suggestions, and David Ledo for helping with Table 1.

REFERENCES
[1] W. Aigner, S. Miksch, H. Schumann, and C. Tominski. Visualizationof Time-Oriented Data. Springer, 2011.
[2] F. Alallah, Y. Sakamoto, and P. Irani. Exploring the Need and Designfor Situated Video Analytics. In Proc. SUI ’20. ACM, 2020.
[3] B. Bach, R. Dachselt, S. Carpendale, T. Dwyer, C. Collins, andB. Lee. Immersive analytics: Exploring future interaction and vi-sualization technologies for data analytics. In Proc. ISS ’16, pages529–533. ACM, 2016.
[4] J. Bird and Y. Rogers. The Pulse of Tidy Street: Measuring andPublicly Displaying Domestic Electricity Consumption. In Pervasive
’10 Workshop: Energy Awareness & Conservation through PervasiveApplications, 2010. Video: https://www.youtube.com/watch?v=v-L5helmgDo.
[5] S. Bødker. Through the interface-a human activity approach to userinterface design. DAIMI Report Series, 16(224), 1991.
[6] S. Bødker, H. Korsgaard, and J. Saad-Sulonen. A Farmer, a Placeand at Least 20 Members: The Development of Artifact Ecologies inVolunteer-Based Communities. In Proc. CSCW ’16, page 1142–1156.ACM, 2016.
[7] N. Bressa. Data In Situ: A Design Approach for Situated Visualiza-tion. PhD thesis, Aarhus University, May 2021.
[8] N. Bressa, K. Wannamaker, H. Korsgaard, W. Willett, and J. Ver-meulen. Sketching and Ideation Activities for Situated VisualizationDesign. In Proc. DIS ’19, page 173–185. ACM, 2019.
[9] W. Büschel, A. Mitschick, and R. Dachselt. Here and Now: Reality-Based Information Retrieval: Perspective Paper. In Proc. CHIIR ’18,page 171–180. ACM, 2018.
[10] G. Caggianese, V. Colonnese, and L. Gallo. Situated Visualizationin Augmented Reality: Exploring Information Seeking Strategies. InProc. SITIS ’19, pages 390–395, 2019.
[11] J. M. Carroll and M. B. Rosson. Wild at Home: The Neighborhoodas a Living Laboratory for HCI. ACM Trans. Comput.-Hum. Interact.,20(3), July 2013.
[12] Z. Chen, W. Tong, Q. Wang, B. Bach, and H. Qu. Augmenting StaticVisualizations with PapARVis Designer. In Proc. CHI ’20, page 1–12.ACM, 2020.
[13] Ciolfi, Luigina and Bannon, Liam J. Space, place and the design oftechnologically-enhanced physical environments. In Spaces, spatial-ity and technology, pages 217–232. Springer, 2005.
[14] S. Claes, J. Coenen, and A. V. Moere. Conveying a Civic Is-sue through Data via Spatially Distributed Public Visualization andPolling Displays. In Proc. NordiCHI ’18, page 597–608. ACM, 2018.
[15] S. Claes and A. V. Moere. The Role of Tangible Interaction in Explor-ing Information on Public Visualization Displays. In Proc. PerDis
’15, page 201–207. ACM, 2015.[16] S. Claes and A. Vande Moere. Street infographics: Raising awareness
of local issues through a situated urban visualization. In Proc. PerDis’13, pages 133–138. ACM, 2013.
[17] J. Coenen, P. Biedermann, S. Claes, and A. V. Moere. The Stake-holder Perspective on Using Public Polling Displays for Civic En-gagement. In Proc. C&T ’21, C&T ’21, page 61–74, New York, NY,USA, 2021. Association for Computing Machinery.
[18] J. Coenen, M. Houben, and A. Vande Moere. Citizen Dialogue Kit:Public Polling and Data Visualization Displays for Bottom-Up Citi-zen Participation. In Proc. DIS ’19 Companion, page 9–12. ACM,2019.
[19] J. Coenen, E. Nofal, and A. Vande Moere. How the Arrangement ofContent and Location Impact the Use of Multiple Distributed PublicDisplays. In Proc. DIS ’19, page 1415–1426. ACM, 2019.
[20] S. Coulson, M. Woods, M. Scott, D. Hemment, and M. Balestrini.Stop the Noise! Enhancing Meaningfulness in Participatory Sensingwith Community Level Indicators. In Proc. DIS ’18, page 1183–1192.ACM, 2018.
[21] L. A. de Macêdo Morais, N. Andrade, D. M. Costa de Sousa, andL. Ponciano. Defamiliarization, Representation Granularity, and UserExperience: A Qualitative Study with Two Situated Visualizations. InProc. PacificVis ’19, pages 92–101, 2019.
[22] P. Dourish. What We Talk about When We Talk about Context. Per-sonal Ubiquitous Comput., 8(1):19–30, Feb. 2004.
[23] P. Dourish. Re-space-ing place: "place" and "space" ten years on. InProc. CSCW ’06, CSCW ’06, page 299–308, New York, NY, USA,2006. ACM.
[24] A. Ducros, C. N. Klokmose, and A. Tabard. Situated sketching andenactment for pervasive displays. In Proc. ISS ’19, page 217–228.ACM, 2019.
[25] R. Elliott and L. Timulak. Descriptive and Interpretive Approaches toQualitative Research. A Handbook of Research Methods for Clinicaland Health Psychology, 1(7):147–159, 2005.
[26] N. Elmqvist and P. Irani. Ubiquitous analytics: Interacting with bigdata anywhere, anytime. Computer, 46(04):86–89, apr 2013.
[27] N. A. ElSayed, B. H. Thomas, K. Marriott, J. Piantadosi, and R. T.Smith. Situated Analytics: Demonstrating Immersive Analytical
Tools with Augmented Reality. Journal of Visual Languages & Com-puting, 36:13 – 23, 2016.
[28] U. Engelke, H. Hutson, H. Nguyen, and P. de Souza. MelissAR:Towards Augmented Visual Analytics of Honey Bee Behaviour. InProc. CHI EA ’16, page 2057–2063. ACM, 2016.
[29] B. Ens, B. Bach, M. Cordeil, U. Engelke, M. Serrano, W. Willett,A. Prouzeau, C. Anthes, W. Büschel, C. Dunne, T. Dwyer, J. Grubert,J. H. Haga, N. Kirshenbaum, D. Kobayashi, T. Lin, M. Olaosebikan,F. Pointecker, D. Saffo, N. Saquib, D. Schmalstieg, D. A. Szafir,M. Whitlock, and Y. Yang. Grand Challenges in Immersive Ana-lytics. In Proc. CHI ’21, New York, NY, USA, 2021. Association forComputing Machinery.
[30] S. Feiner, B. MacIntyre, T. Höllerer, and A. Webster. A TouringMachine: Prototyping 3D Mobile Augmented Reality Systems forExploring the Urban Environment. Pers. Tech., 1(4):208–217, 1997.
[31] G. W. Fitzmaurice. Situated Information Spaces and Spatially AwarePalmtop Computers. Commun. ACM, 36(7):39–49, 1993.
[32] G. Fitzpatrick. The Locales Framework: Understanding and Design-ing for Wicked Problems, volume 1. Springer, 2003.
[33] A. Fonnet and Y. Prié. Survey of immersive analytics. IEEE TVCG,27(3):2101–2122, 2019.
[34] M. Francia, M. Golfarelli, and S. Rizzi. A-BI+: A Framework forAugmented Business Intelligence. Information Systems, 92:101520,2020.
[35] C. Golsteijn, S. Gallacher, L. Koeman, L. Wall, S. Andberg,Y. Rogers, and L. Capra. VoxBox: A tangible machine that gathersopinions from the public at events. In Proc. TEI ’15, pages 201–208,2015.
[36] P. Gourlet and T. Dassé. Cairn: A Tangible Apparatus for SituatedData Collection, Visualization and Analysis. In Proc. DIS ’17, page247–258. ACM, 2017.
[37] S. Greenberg. Context as a Dynamic Construct. Hum. Comput. Inter-act., 16(2-4):257–268, 2001.
[38] S. Greenberg, N. Marquardt, T. Ballendat, R. Diaz-Marino, andM. Wang. Proxemic Interactions: The New Ubicomp? interactions,18(1):42–50, 2011.
[39] R. Guarese, P. Andreasson, E. Nilsson, and A. Maciel. Augmentedsituated visualization methods towards electromagnetic compatibilitytesting. Computers & Graphics, 94:1–10, 2021.
[40] R. Guarese, J. a. Becker, H. Fensterseifer, M. Walter, C. Freitas,L. Nedel, and A. Maciel. Augmented situated visualization for spa-tial and context-aware decision-making. In Proc. AVI ’20, New York,NY, USA, 2020. ACM.
[41] G. Gurvitch. The Spectrum of Social Time. Springer, 2012.[42] S. Harrison and P. Dourish. Re-place-ing space: The roles of place
and space in collaborative systems. In Proc. CSCW ’96, page 67–76.ACM, 1996.
[43] T. Hollerer, S. Feiner, and J. Pavlik. Situated documentaries: Embed-ding multimedia presentations in the real world. In Proc. ISWC ’99,pages 79–86, 1999.
[44] S. Houben, C. Golsteijn, S. Gallacher, R. Johnson, S. Bakker, N. Mar-quardt, L. Capra, and Y. Rogers. Physikit: Data engagement throughphysical ambient visualizations in the home. In Proc. CHI ’16, page1608–1619. ACM, 2016.
[45] D. Huang, M. Tory, B. Aseniero, L. Bartram, S. Bateman, S. Carpen-dale, A. Tang, and R. Woodbury. Personal Visualization and PersonalVisual Analytics. IEEE TVCG, 21(3):420–433, 2015.
[46] C. Hull and W. Willett. Building with Data: Architectural Mod-els as Inspiration for Data Physicalization. In Proc. CHI ’17, page1217–1264. ACM, 2017.
[47] Y. Jansen, P. Dragicevic, P. Isenberg, J. Alexander, A. Karnik, J. Kil-dal, S. Subramanian, and K. Hornbæk. Opportunities and Challengesfor Data Physicalization. In Proc. CHI ’15, page 3227–3236. ACM,2015.
[48] R. José, N. Otero, and J. Cardoso. Dimensions of Situatedness forDigital Public Displays. Advances in HCI, 2014, 2014.
[49] D. Kalkofen, C. Sandor, S. White, and D. Schmalstieg. Visualiza-tion Techniques for Augmented Reality. In Handbook of AugmentedReality, pages 65–98. Springer, 2011.
[50] V. Kaptelinin. Activity Theory. In The Encyclopedia of Human-Computer Interaction, 2nd Ed., chapter 16. Interaction-design.org,2021.
[51] F. Kawsar, J. Vermeulen, K. Smith, K. Luyten, and G. Kortuem. Ex-ploring the Design Space for Situated Glyphs to Support DynamicWork Environments. In Proc. Pervasive ’11, pages 70–78. Springer,2011.
[52] L. Koeman, V. Kalnikaité, and Y. Rogers. “Everyone Is Talking aboutIt!”: A Distributed Approach to Urban Voting Technology and Visu-alisations. In Proc. CHI ’15, page 3127–3136. ACM, 2015.
[53] H. Korsgaard. Toward Place-Centric Computing: Making Place WithTechnology Together. PhD thesis, Aarhus University, Feb. 2017.
[54] V. Kostakos. The big hole in hci research. Interactions, 22(2):48–51,Feb. 2015.

[55] M. W. Krueger. Responsive environments. In Proc. the NationalComputer Conference, pages 423–433, 1977.
[56] S. Kush, M. Nicolas, A.-L. Fayard, and V. Bill. CAIRN: A Tangi-ble Research Tool To Materially Visualize Practices in a Makerspace.IJAMM, 2020. https://ijamm.pubpub.org/pub/d2559ieu.
[57] A. Lau and A. Vande Moere. Towards a model of information aes-thetics in information visualization. In Proc. IV ’07, pages 87–92,2007.
[58] B. Lee, M. Lee, J. Mogk, R. Goldstein, J. Bibliowicz, and A. Tessier.Designing a Multi-Agent Occupant Simulation System to Support Fa-cility Planning and Analysis for COVID-19. In Proc. DIS ’21, DIS’21, page 15–30, New York, NY, USA, 2021. Association for Com-puting Machinery.
[59] N. Li, E. Sharlin, and M. C. Sousa. Duopography: Using back-of-device multi-touch input to manipulate spatial data on mobile tan-gible interactive topography. In Proc. SIGGRAPH Asia ’17. ACM,2017.
[60] T. Lin, R. Singh, Y. Yang, C. Nobre, J. Beyer, M. A. Smith, andH. Pfister. Towards an Understanding of Situated AR Visualizationfor Basketball Free-Throw Training. In Proc. CHI ’21, New York,NY, USA, 2021. Association for Computing Machinery.
[61] M.-J. Lobo and S. Christophe. Opportunities and Challenges for Aug-mented Reality Situated Geographical Visualization. ISPRS Annals,4:163–170, 2020.
[62] B. Marques, B. S. Santos, T. Araújo, N. C. Martins, J. B. Alves, andP. Dias. Situated Visualization in The Decision Process Through Aug-mented Reality. In Proc. IV ’19, pages 13–18. IEEE, 2019.
[63] L. Merino, B. Sotomayor-Gómez, X. Yu, R. Salgado, A. Bergel,M. Sedlmair, and D. Weiskopf. Toward Agile Situated Visualization:An Exploratory User Study. In CHI EA ’20, page 1–7. ACM, 2020.
[64] A. V. Moere and D. Hill. Designing for the Situated and Public Visu-alization of Urban Data. J. Urban Technol, 19(2):25–46, 2012.
[65] L. Morais, Y. Jansen, N. Andrade, and P. Dragicevic. Showing Dataabout People: A Design Space of Anthropographics. IEEE TVCG,pages 1–1, 2020.
[66] D. A. Norman. Technology first, needs last. Interactions,17(2):38–42, 2010.
[67] T. Pederson. From Conceptual Links to Causal Relations–Physical-Virtual Artefacts in Mixed-Reality Space. PhD thesis, Umeå Univer-sity, 2003.
[68] L. J. Perovich, S. Wylie, and R. Bongiovanni. Chemicals in the Creek:Designing a Situated Data Physicalization of Open Government Datawith the Community. IEEE TVCG, 27(2):913–923, 2021.
[69] Z. Pousman, J. Stasko, and M. Mateas. Casual Information Vi-sualization: Depictions of Data in Everyday Life. IEEE TVCG,13(6):1145–1152, Nov. 2007.
[70] T. Prante, C. Röcker, N. Streitz, R. Stenzel, C. Magerkurth,D. Van Alphen, and D. Plewe. Hello.wall–beyond ambient displays.In Adj. Proc. UbiComp ’03, pages 277–278, 2003.
[71] A. Prouzeau, Y. Wang, B. Ens, W. Willett, and T. Dwyer. CorsicanTwin: Authoring In Situ Augmented Reality Visualisations in VirtualReality. In Proc. AVI ’20. ACM, 2020.
[72] Q. Quach and B. Jenny. Immersive Visualization with Bar Graphics.Cartogr. Geogr. Inf. Sci, 47(6):471–480, 2020.
[73] J. Redström, T. Skog, and L. Hallnäs. Informative Art: Using Am-plified Artworks as Information Displays. In Proc. DARE ’00, page103–114. ACM, 2000.
[74] W. Reitberger, C. Obermair, B. Ploderer, A. Meschtscherjakov, andM. Tscheligi. Enhancing the Shopping Experience with Ambient Dis-plays: A Field Study in a Retail Store. In Ambient Intelligence, pages314–331. Springer, 2007.
[75] J. C. Roberts, P. D. Ritsos, S. K. Badam, D. Brodbeck, J. Kennedy,and N. Elmqvist. Visualization beyond the desktop–the next big thing.IEEE CG&A, 34(6):26–34, Nov 2014.
[76] J. Rodgers and L. Bartram. Exploring Ambient and Artistic Vi-sualization for Residential Energy Use Feedback. IEEE TVCG,17(12):2489–2497, Dec 2011.
[77] Y. Rogers and P. Marshall. Research in the wild. Synth. Lect. Hum.Centered Inf., 10(3):i–97, 2017.
[78] R. Rynasiewicz. Newton’s Views on Space, Time, and Motion. In TheStanford Encyclopedia of Philosophy. Stanford University, summeredition, 2014.
[79] M. Satkowski and R. Dachselt. Investigating the Impact of Real-World Environments on the Perception of 2D Visualizations in Aug-mented Reality. In Proc. CHI ’21, New York, NY, USA, 2021. Asso-ciation for Computing Machinery.
[80] G. Schall, S. Zollmann, and G. Reitmayr. Smart Vidente: Advancesin Mobile Augmented Reality for Interactive Visualization of Under-ground Infrastructure. Pers. Ubiquitous Comput., 17(7):1533–1549,Oct. 2013.
[81] B. Schilit, N. Adams, and R. Want. Context-Aware Computing Ap-plications. In WMCSA ’94, pages 85–90. IEEE, 1994.
[82] D. Schmalstieg and T. Höllerer. Augmented Reality: Principles and
Practice. Addison-Wesley Professional, 2016.[83] A. Schmidt, M. Beigl, and H.-W. Gellersen. There is More to Context
than Location. Computers & Graphics, 23(6):893–901, 1999.[84] J. Schoffelen, S. Claes, L. Huybrechts, S. Martens, A. Chua, and A. V.
Moere. Visualising Things. Perspectives on How to Make ThingsPublic through Visualisation. CoDesign, 11(3-4):179–192, 2015.
[85] R. Sicat, J. Li, J. Choi, M. Cordeil, W. Jeong, B. Bach, and H. Pfister.DXR: A Toolkit for Building Immersive Data Visualizations. IEEETVCG, 25(1):715–725, 2019.
[86] S. Singhal, W. Odom, L. Bartram, and C. Neustaedter. Time-Turner:Data Engagement Through Everyday Objects in the Home. In Proc.DIS ’17 Companion, page 72–78. ACM, 2017.
[87] J. Stasko, T. Miller, Z. Pousman, C. Plaue, and O. Ullah. PersonalizedPeripheral Information Awareness Through Information Art. In Proc.UbiComp ’04, pages 18–35. Springer, 2004.
[88] L. A. Suchman. Plans and Situated Actions: The Problem of Human-Machine Communication. Cambridge University Press, 1987.
[89] M. Tatzgern. Situated visualization in augmented reality. PhD thesis,Graz University of Technology, 2015.
[90] B. H. Thomas, G. F. Welch, P. Dragicevic, N. Elmqvist, P. Irani,Y. Jansen, D. Schmalstieg, A. Tabard, N. A. ElSayed, R. T. Smith,et al. Situated Analytics. Immersive Analytics, 11190:185–220, 2018.
[91] B. Thompson, L. Levy, A. Lambeth, D. Byrd, J. Alcaidinho, I. Radu,and M. Gandy. Participatory design of STEM education AR experi-ences for heterogeneous student groups: exploring dimensions of tan-gibility, simulation, and interaction. In 2016 IEEE International Sym-posium on Mixed and Augmented Reality (ISMAR-Adjunct), pages53–58. IEEE, 2016.
[92] K. Tollmar, S. Junestrand, and O. Torgny. Virtually Living Together.In Proc. DIS ’00, page 83–91. ACM, 2000.
[93] Y.-F. Tuan. Space and place: humanistic perspective. In Philosophyin geography, pages 387–427. Springer, 1979.
[94] N. Valkanova, S. Jorda, and A. Vande Moere. Public VisualizationDisplays of Citizen Data: Design, Impact and Implications. Int. J.Hum. Comput. Stud., 81:4 – 16, 2015.
[95] J. Vermeulen, F. Kawsar, A. L. Simeone, G. Kortuem, K. Luyten,and K. Coninx. Informing the Design of Situated Glyphs for a CareFacility. In Proc. VL/HCC ’12, pages 89–96. IEEE, 2012.
[96] J. A. Walsh and B. H. Thomas. Visualising Environmental Corrosionin Outdoor Augmented Reality. In Proc. AUIC ’11, pages 39–46.Australian Computer Society, 2011.
[97] K. A. Wannamaker, S. Z. G. Kollannur, M. Dörk, and W. Willett.I/O Bits: User-Driven, Situated, and Dedicated Self-Tracking. InProc. DIS ’21, DIS ’21, page 523–537, New York, NY, USA, 2021.Association for Computing Machinery.
[98] M. Weiser. The Computer for the 21st Century. Scientific American,265(3):94–105, 1991.
[99] M. Weiß, K. Angerbauer, A. Voit, M. Schwarzl, M. Sedlmair, andS. Mayer. Revisited: Comparison of Empirical Methods to EvaluateVisualizations Supporting Crafting and Assembly Purposes. IEEETVCG, 27(2):1204–1213, 2021.
[100] S. White and S. Feiner. SiteLens: Situated Visualization Techniquesfor Urban Site Visits. In Proc. CHI ’09, page 1117–1120. ACM,2009.
[101] S. White, S. Feiner, and J. Kopylec. Virtual Vouchers: Prototypinga Mobile Augmented Reality User Interface for Botanical SpeciesIdentification. In Proc. 3DUI ’06, pages 119–126. IEEE, 2006.
[102] S. White, D. Feng, and S. Feiner. Interaction and Presentation Tech-niques for Shake Menus in Tangible Augmented Reality. In Proc.ISMAR ’09, pages 39–48, 2009.
[103] M. Whitlock, D. A. Szafir, and K. Gruchalla. HydrogenAR: Inter-active Data-Driven Presentation of Dispenser Reliability. In Proc.ISMAR ’20, pages 704–712, 2020.
[104] M. Whitlock, K. Wu, and D. A. Szafir. Designing for Mobile andImmersive Visual Analytics in the Field. IEEE TVCG, 26(1):503–513, 2020.
[105] W. Willett, Y. Jansen, and P. Dragicevic. Embedded Data Represen-tations. IEEE TVCG, 23(1):461–470, Jan. 2017.
[106] C. Wisneski, H. Ishii, A. Dahley, M. G. Gorbet, S. Brave, B. Ullmer,and P. Yarin. Ambient Displays: Turning Architectural Space into anInterface between People and Digital Information. In Proc. CoBuild
’98, page 22–32. Springer-Verlag, 1998.[107] A. Zimmermann, A. Lorenz, and R. Oppermann. An Operational Def-
inition of Context. In International and Interdisciplinary Conferenceon Modeling and Using Context, pages 558–571. Springer, 2007.
[108] S. Zollmann, C. Poglitsch, and J. Ventura. VISGIS: Dynamic SituatedVisualization for Geographic Information Systems. In Proc. IVCNZ’16, pages 1–6, 2016.