What's Next digital - May 2015
135
1 Laurence Baeten Business Development Manager Jump Into the Future of Digital Advertising ! May 2015
-
Upload
blue2purple -
Category
Marketing
-
view
81 -
download
6
Transcript of What's Next digital - May 2015

1 Laurence Baeten Business Development Manager
Jump Into the Future of Digital Advertising ! !
May 2015

v Presentation 1: Google’s Next Projects and the future of digital marketing
Presented by Guy Gelaude & Laurence Baeten
v Presentation 2: The Full Power of a Cross-Channel Attribution Model
Presented by Gaëtan Godart
v Presentation 3: Cross Device Tracking - The Future is Now
Presented by Karen Carbonez
v Presentation 4: First Case in Europe: Google Analytics at every level of your Organization
Presented by Kristien Segers & Emilie Huybrechs
Table of Contents

Presentation 1:
Google’s Next Projects and the future of digital marketing
Presented by Guy Gelaude & Laurence Baeten

State of Digital 1 Guy Gelaude - Agency Product Manager

1
Definition of “state”:
...“Is the particular condition that someone or something is in at a specific time”...

1. SETTING THE SCENE
It’s early morning on the Web...

2014 World Population 7 BILLION
2 BILLION 2014 Internet Population
The world is changing...

The next 5 billion of connected consumers
The next 5 billion


Hyper- acceleration of technology
since 2006
Global bandwidth usage increased
12x
by 2020
Will grow by another
12x

“Internet of Things”

internet of things
“When passing by a supermarket, you get an sms from your fridge, to let you know you that you are running low on milk”

“The Internet has changed how we (re)search and buy
products”

Some e-commerce facts.
In 2013 in Belgium the internet economy represents € 12,0 Billion or 3.5% of the GDP
In 2015: this will be 19,6 Billion or 5%. Key driver will be E-commerce.
Source: Interneteconomy.be- BCG study in collaboration with Google
Source: BCG-study (update March 2013): Interneteconomy at the crossroads

The Belgian e-commerce landscape
E-commerce in Belgium represents € 4+ Billion
Source: Interneteconomy.be- BCG study in collaboration with Google
25% of all Belgian online purchases originate from foreign websites. 60% of online advertising spend aimed towards BE consumers originates from abroad as well.
Source: BCG-study (update March 2013): Interneteconomy at the crossroads

Belgians search more than the Spanish or the Germans
Google Search volumes across EU-19

Belgium still has a low online advertising cost & #advertisers
Source: Interneteconomy.be- BCG study in collaboration with Google
Based on the Google Adwords advertising product, size of bubbles equals the population (CPC is proxy for online advertising cost, and Adwords Depth is proxy for # advertisers in the market)

… it challenges all existing models...

_Transformation of the Consumer Journey_
Stimulus First Moment of Truth
Second Moment of Truth

_Transformation of the Consumer Journey_
_The Zero Moment of Truth (ZMOT)_
Stimulus First Moment of Truth
Second Moment of Truth
Pre-shopping | In-store | In-home
At shelf In-store
Experience


Our media consumption habits have changed
any content, any time, any screen

Our media consumption habits have changed
any content, any time, any screen
2010
Digital TV Radio Print
2014
25% 43% 47% 38% 22% 6% 16% 4%
Source: Nielsen DBM & Online survey commissioned by Google - TNS Fieldwork 2014

We’re living in a Multi-screen
world

4.4 hours in front of screens
each day
On average...
150 interactions with mobile devices per day

Source: Interneteconomy.be- BCG study in collaboration with Google
Our smartphone as most common multi-tasking tool
Base: Private smartphone users who use the Internet in general and who were online yesterday with their smartphone, n= 1000 Q22: When you use the Internet on your smartphone, which if any of the following – do you normally do at the same Eme?
78% Use
smartphone while…
Play video games
13%
Read a book
6%
Watch movies
27%
Watch TV
42%
Listen to music
39%
Use Internet
32%
Read magazines/ newspapers
17%

77% don’t leave home without their mobile device
Source: Consumer Barometer - Belgium - 2014


Mobile is Personal

Mobile made digital mainstream..
Mobile Commerce
Cross Device Capabilities
Store Visits Calls Apps for the power user

Millions of people. Billions of moments that matter
Right message - to the right people - at the right time & location

- Actual Challenge -
How can you as a marketer/entrepreneur attribute the correct value to the right
platform/device

34 Belgian Data
State of
Digital
@blue2purple #WNB2P

2009 … Mobile is coming, prepare yourself 2010 … Mobile is here, prepare yourself 2011 … Year of Mobile 2012 … It truly is the Year of Mobile now ! 2013 … You are missing the new Year of Mobile 2014 … MOOOOO-BIIIII-LEEEEEEE 2015 … Let me guess… Mobile ?
Did you hear about the Year of Mobile?
… Mobile is getting boring !
35

Source: marymeeker
The way people search & connect changed drastically
36
Mobile is a reality ! … Is it really?

Where is your traffic growth coming from?
Client Case blue2purple: evolution of mobile
37
+45% overall growth

Source: Google: Our Mobile Planet
Mobile penetration
38

What are we seeing on mobile? Client Case blue2purple: evolution of mobile
39
2013 2014 2015
17% 10% 7%
Travel
2013 2014 2015
20% 12% 6% Finance
2013 2014 2015
24% 18% 10%
Retail

Source: Google: The new multi-screen world
Device choice is driven by context
b2p-logo_2014.pngb2p-logo_2014.png
The amount of time
we have or need
The goal we want to acomplish
Our location
The attitude and state of mind

Sunny or cloudy, what device do you choose?
41
57% 55%
56%

Source: Google: The new multi-screen world
Stay productive & informed through computer Tablets are for entertainment
42
Context: Used at home or office Task oriented Time consuming Serious research
Look for product information 38 %
Use search engines 73 %
Weekly online ac,vi,es
Play games
7 %
Watch videos 2-6x a week 17 %
Weekly online ac,vi,es
Context: • Home • Entertainment & browsing
• Unbound sense of Eme
• Relaxed & leisurely
35% of device ownership in Belgium

Source: Google: The new multi-screen world, Consumer barometer, Our Mobile Planet
Always connected through smartphone
43
Context:
• Connect & communicate
• Short amount of Eme
• Immediate & quick
Communication 86 %
Stay informed 63 %
Weekly online ac,vi,es
54% used a smartphone in past 7 days
96% at
home
86% on the go

Source: Google: The new multi-screen world
Our daily media interactions today
44
90% Of all interacEons Are screenbased

Source: Google: The new multi-screen world
Two types of multi-screening
45
SequenEal Simultaneous
MulE-‐tasking Complementary

46
Major access point for research
42% Of people search on their smartphone daily
Source: Google: Our Mobile Planet

They inform our every day life Google: Our Mobile Planet
47
43% Bars & Restaurants
33% Travel
23% Real Estate
22% Job Offers
58% Product
informaEon research

48 GFK: future buy 2014

Traditional platforms still dominate online purchases
49
41% purchases
5% purch..
14% purchases
40% purchases
GFK: future buy 2014

A STRONG MOBILE
PRESENCE IS CRITICAL
SIGN UP
65% OF DECISIONS
START ON MOBILE & END SOMEWHERE
ELSE
Source: Google: Our Mobile Planet

SMARTPHONE Searches are local
Source: Google: Our Mobile Planet
51
84% have looked for local information
83% will take action as a result
41%
Looks for local informaEon weekly
14%
Research local informaEon daily

Exercise
52

53 Our Mobile Planet BE– Understanding the mobile consumer

54

86%
14%
What should I focus on?
Flurry: http://www.flurry.com/bid/109749/Apps-Solidify-Leadership-Six-Years-into-the-Mobile-Revolution#.VRqB3rOsUgN Ventur http://venturebeat.com/2013/04/03/the-mobile-war-is-over-and-the-app-has-won-80-of-mobile-time-spent-in-apps % of users on sites vs apps stats: Google/Ipsos Multiscreen Industry Study (to be published)
80%
20%
2013 2014
Apps
Mobile web
86%
14%
40% GAMIN
G & ENT.
28% SOCIAL
20%
: 94% Relies on Sites for commercial tasks
User Time spent

56
Barriers to mobile websites are: 1. Too small screen size (37%)
2. No trust in credit card security (33%) 3. Not used to smartphone interface (20%)
4. Hard to compare prices & opEons (20%)
5. Hard to type (19%) 6. Too much Eme to open website (18%)
7. No visible product or service informaEon (12%)

57
61% leaves website if they can’t find what they were looking for immediately
79% will go to compeEEon if they don’t like what they find
50% will put loyality aside if you aren’t mobile friendly!
Whose is this?

Key Takeaways
• It’s not late yet… but stop finding excuses
• Be there at every moment that matters
• Mobile is the new normal 58

Thank You for your undivided
attention
Questions? 59
@blue2purple #WNB2P
Laurence Baeten Business Development Manager

Presentation 2:
The Full Power of a Cross-Channel Attribution Model
Presented by Gaëtan Godart

blue2purple confidential & proprietary
@blue2purple #WNB2P

Vanity metrics versus actionable metrics. Cross-Channel Attribution.
@blue2purple #WNB2P

blue2purple confidential & proprietary #WNB2P 63
Broken in 2010
Almost Broken in 2014

5

blue2purple confidential & proprietary #WNB2P 65
then why are you tracking it? If a metric isn't actionable and you can't do anything to make it better…

blue2purple confidential & proprietary #WNB2P 66
The Mobile Battle
Which Mobile should I show on my homepage?
VANITY METRIC ACTIONABLE METRIC

blue2purple confidential & proprietary #WNB2P
1° Context & Definiton 2° Change your Mindset & challenge your agency ! 3° Framework & Dashboarding
67
Agenda

blue2purple confidential & proprietary #WNB2P 68
The numbers without context mean… NOTHING
What does it mean?

blue2purple confidential & proprietary #WNB2P 69
Houston, we have a problem
AcEonable metrics provide an answer to these quesEons: • How do you gain or lose revenue? • How do you gain or lose customers? • What are the key funcEons and benefits that people are coming to you for?

blue2purple confidential & proprietary #WNB2P
Eric Ries, “The Lean Startup.”
70
The three A-Metrics
AcIonable Metrics What acEons need to be taken to meet your
goals
A/B TesEng
Accessible Metrics
Key data should be available to any
employee, anyEme, in a maqer of minutes
Email opening rate?
Auditable Metrics
Any member of your team should be able to find the source data and reproduce your
report.

blue2purple confidential & proprietary #WNB2P
L’évoluEon des impressions nous permet de voir que nous avons eu besoin de moins d’impressions pour autant de clics. Nous constatons que la courbe des clics a évolué de manière progressive et ascendante pendant la campagne. Nous observons qu’ il y a eu 2 vagues à tendance posi?ve: la courbe du clic était au dessus de la courbe du budget, le 24/01 et le 27/01. Nous avons u?lisé moins de budget et nous avons eu plus de clics. Cela est dû à notre op?misa?on.
Augmenta?on du nombre de clics suite à l’ouverture de nouvelles campagnes
71
The market is guilty
The amount of « likes » increased by 27% thanks to our op?misa?on

blue2purple confidential & proprietary #WNB2P 72

blue2purple confidential & proprietary #WNB2P
BeauEful Insighxul!
73

2. Change your mindset
blue2purple confidential & proprietary 15
@blue2purple #WNB2P

blue2purple confidential & proprietary #WNB2P 75
You know you can track everything right?
Your-‐-‐-‐Website.be/?utm_source=Youtube&utm_medium=Video&utm_term=video-‐-‐-‐2&utm_campaign=-‐-‐-‐5%
Budget: 5 000€
Target: 450 000 Imp. 80 000 Views CPV = 0,06€

blue2purple confidential & proprietary #WNB2P 76
Effect on Global Website Performances For 5K YouTube Investment: Video Impact
•
• 100K Unique Viewers vs. 67K unique new visitors on website
• Boost new visitors: +8%
YT intervention in 2.500 conversion funnels àà 3% of total revenues àà 83K €
• Initiated 271 conversions
àà 12.500€ revenue
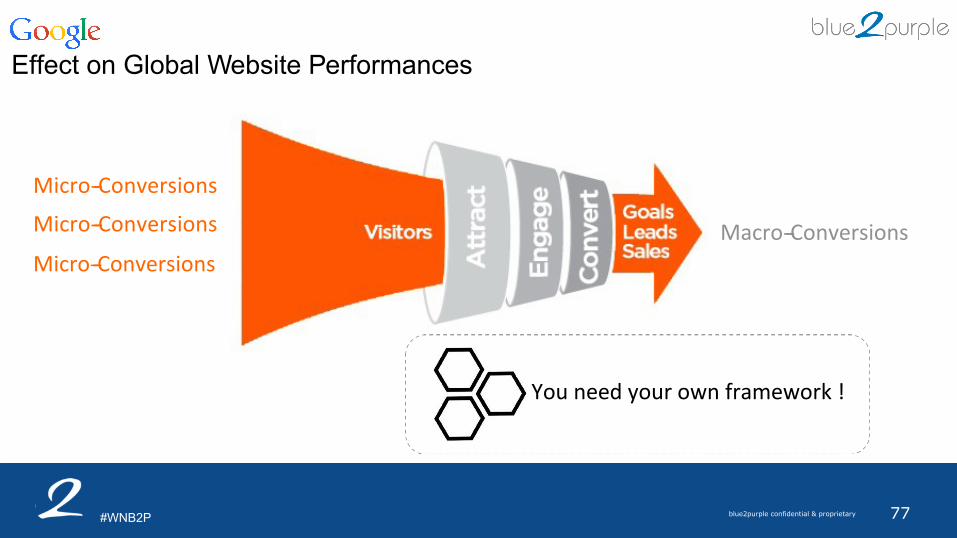
blue2purple confidential & proprietary #WNB2P
Macro-‐-‐-‐Conversions
Micro-‐-‐-‐Conversions
Micro-‐-‐-‐Conversions
Micro-‐-‐-‐Conversions
77
Effect on Global Website Performances
You need your own framework !

78
Framework & Dashboarding @blue2purple #WNB2P

blue2purple confidential & proprietary #WNB2P 79
The Avinash Model
People who wear shoes People who think they might
need new shoes People who want to buy new
shoes now
SEE THINK DO Awareness ConsideraEon & EvaluaEon Purchase
Source = kaushik.net

blue2purple confidential & proprietary #WNB2P 80
The Avinash Model
Source = kaushik.net
SEE THINK DO Awareness ConsideraEon & EvaluaEon Purchase

blue2purple confidential & proprietary #WNB2P 81
The Avinash Model
• %Brand Volume • Brand volume Growth • Growth of social engagement • Growth of video engagement
• Growth of new users • Growth of site visit • Use of shoes creator • Catalogue download • More info request
• # of shoes baught • Total revenue thanks to shoes • # of upsales • Profit (=Rev–Ad Cost–COGS)
Micro-‐-‐-‐Conversions Macro-‐-‐-‐Conversions
Source = kaushik.net
SEE THINK DO Awareness ConsideraEon & EvaluaEon Purchase

blue2purple confidential & proprietary #WNB2P 82
The Avinash Model
• %Brand Volume • Brand volume Growth • Growth of social engagement • Growth of video engagement
• Growth of new users • Growth of site visit • Use of shoes creator • Catalogue download • More info request
• # of shoes baught • Total revenue thanks to shoes • # of upsales • Profit (=Rev–Ad Cost–COGS)
Beqer view on what is going wrong àà acEon oriented !
Micro-‐-‐-‐Conversions Macro-‐-‐-‐Conversions
Source = kaushik.net
SEE THINK DO Awareness ConsideraEon & EvaluaEon Purchase

blue2purple confidential & proprietary #WNB2P 83
The Avinash Model
Micro -‐Conversions Source = kaushik.net
Macro-‐-‐-‐Conversions
People who wears shoes People who are thinking they
might need new shoes People who want to buy new
shoes now Happy Client
#Re-‐-‐-‐buy #TesEmonials …
SEE THINK DO CARE Awareness ConsideraEon & EvaluaEon Purchase

blue2purple confidential & proprietary #WNB2P 84
Key Take-Aways
• Data means nothing without context
• Identify your stages of consideration
• Map them into “see, think, do, care” consideration stages
• Make sure the organization / agency is focussed on all of them all the time
• Insightful is better than beautifulàà Strat with an Excel

blue2purple confidential & proprietary #WNB2P blue2purple confidential & proprietary 26 Thank You & Take AcEon now !
@blue2purple #WNB2P

Presentation 3:
Cross Device Tracking - The Future is Now
Presented by Karen Carbonez

Industry Analyst Karen Carbonez
Cross Device Solutions How to measure in a multiscreen world?
Why Cross Device!Measurement!

Why Cross Device Measurement
"Yeah, we tried it. Doesn’t convert. Seriously, mobile drive no value for us.!Conversion Rates are terrible, especially compared"

Forecast: 30% of searches on Mobile by July 2016
Desktop:
Search queries
in July 2016
Mobile:
in July 2016
Tablet:
in July 2016
Source: Google Internal data - Share of queries on Smartphones for selected industries BE
13% of traffic
30% of traffic
57% of traffic
Forecast
If mobile is not driving value, you have a serious problem

very!low!compared! to!desktop! /!tablet! though...!
Quarter of Year!
Con
vers
ion R
ate!
!Source: Monetate Ecommerce Quarterly - http://www.monetate.com/resources/research/!
Mobile!
Tablet!
!
Desktop Conversion Rate !is almost 3x the Mobile !Conversion Rate. Gap !almost seems to grow over over time!!
Desktop!
!
For most businesses, mobile conversion rates do seem!

!
WHY?!

but the measurement is broken. Cookies ≠ Users!
1. The New Multi-screen World: Understanding Cross-Platform Consumer Behavior; Google and Ipsos MetdiaCT; U.S; August 2012 2. What Users Want Most From Mobile Sites Today; Google/Sterling Research/ SmithGeiger, US, July 2012
between devices to accomplish a goal, e.g. PC, smartphones, tablet or TV
90%1
of people move
Research shows that Mobile drives conversions on Desktop

Prove it!

Desktop session share ha rapidly decreased over 2 year period
Desktop Mobile Tablet
2012/01
Ses
sion
Sha
re (%
)
Year / Month
2014/01 2013/07 2013/01 2012/07
0%
75%
50%
25%
100%
Desktop session share has rapidly decreased over 2 year period Mobile session share has increased significantly - and share continues to grow
Tablet device sessions share flat since end of 2013
Session Share by Device Category
Desktop session share decreases rapidly

Desktop conversion share decreased over a 2 year p
Desktop Mobile Tablet
2012/01
Ses
sion
Sha
re (%
) Year / Month
2014/01 2013/07 2013/01 2012/07
0%
Desktop conversion share has decreased over a 2 year period
Mobile device conversion share is up - and continues to grow
Tablet device conversion share is flat since end of 2013
75%
50%
25%
Conversion Share by Device Category
100%
Desktop conversion share decreases as well

Desktop Conversion Rates have increased
2012/01 2012/07 2013/01 2013/07 2014/01
Transaction Share CvR
Desktop Conversion Rates have Increased. Increase is largely a result of decreasing sessions. Over that same period, desktop conversion share dropped.
Result: desktop performance seems to improve
100
CvR and Transaction Share

Percentage of total transactions and percentage mobile sessions of total sessions per hour of day
0:00
Percentage Percentage of total Transactions (all devices) Mobile Sessions
of total Sessions
% o
f ses
sion
s on
a m
obile
dev
ice
& %
of t
otal
tra
nsac
tion
Hour of Day
20:00 15:00 10:00 5:00 0%
6%
12%
18%
Mobile Devices are used at those times of day when consumers are not converting.
They are looking for inspiration and performing pre-purchase research.
Transactions tend to happen when consumers are either at work or at home, with access to a desktop device.
24%
Mobile for inspiration and research

As users perform pre-purchase research on other devices, they visit your website on a desktop
Average Page views for Desktop converting sessions (indexed)
Average session duration for Desktop converting sessions (indexed)
As users perform pre-purchase research on other devices, they visit your website on a desktop knowing exactly what they want. As a result, they visit less pages on your site before converting. Desktop users that convert need less time on your site.
Desktop users now convert much faster!

With pre-conversion research completed (on other devices), more desktop users convert during their first session on
Percentage of Desktop conversions by new users
1 With pre-conversion research completed (on other devices), more desktop users convert during their first session on your site
More desktop users convert in their 1st session

● Real traffic growth comes from mobile devices
● And, more customers now convert on mobile devices
● But… desktop CvR is increasing
● Because customers use mobile to research / discover
● And, are informed and ready to convert on DESKTOP
Quick recap of what we looked at so far

$
Conversion Rate (CvR) =
Conversions / Visits
Visits
Conversions
Consumers have just one device and only interact with your
website on that device
When they decide to make a purchase, they do it on that
same device
Performance trends are reflected in Conversion Rates
How it used to be..

$
Conversion Rate (CvR) = Conversions /
Sessions
Sessions
Conversions
$
$
Consumers now have many devices and can interact with your website(s) on all of those devices
When they decide to make a purchase, they can now do so on
any of their devices
Performance trends are no longer reflected in Conversion Rates, which is an in-device metric
In a multi-device world it’s complicated

Cross Device Solutions

ce C C
PREFERRED BASIC LONG PROCESS
MULTI DEVICE CVR
ADWORDS CDC
UA User-ID Ad Experiments
Advertiser it’s good for: Comfortable to steer Mobile advertising in a holistic manner
Advertiser it’s good for: Uses Adwords Conversion Tracking, already opted some spend into mobile
Advertiser it’s good for: Uses Universal Analytics, has way to authenticate users (e.g. website login)
UA User-ID tracking
Cross-device onversions
Multi Devi Conv. rate
How to set Mobile Bids in a Multiscreen world?

ce C C
PREFERRED BASIC LONG PROCESS
MULTI DEVICE CVR
ADWORDS CDC
UA User-ID Ad Experiments
CHOOSE THE SOLUTION THAT IS RIGHT FOR YOU
UA User-ID tracking
Cross-device conversions
Multi Devi Conv. rate

ce C C
PREFERRED! BASIC LONG PROCESS
MULTI DEVICE CVR
ADWORDS CDC
UA User-ID Ad Experiments
How to set Mobile Bids in a Multiscreen world?
Multi Devi Conv. rate
Advertiser it’s good for: Comfortable to steer Mobile advertising in a holistic manner
Action: Set Mobile bids based on Top of Page target and monitor Multi Device Conversion Rate of total website traffic
Cross-device UA User-ID onversions tracking
Advertiser it’s good for: Advertiser it’s good for: Uses Adwords Conversion Uses Universal Analytics, Tracking, already opted has way to authenticate some spend into mobile users (e.g. website login)
Action: Action: Set Mobile bids based on Set Mobile bids based on uplift of Ad Groups where insights of web-to-web or we can report CDC and app-to-app device paths extrapolate to rest of of authenticated users account

$
trends are reflected in Multi-
Multi-Device CvR =
Sessions across ALL devices
MULTI DEVICE CVR
Conversions
Conversions on 1 device
Sessions
Performance and consumer
Device CvR
When they decide to make a purchase, they do so on just
one device
Consumers have many devices and can interact with your site(s) on all devices before purchasing
1. Multi-Device Conversion Rate

ce
MULTI DEVICE CVR
Action: Set Mobile bids based on Top of Page rate
Monitor the Multi-Device Conversion Rate
Multi Devi Conv. rate
How to use Multi Device Conversion rate to bid?

ce C C
PREFERRED! BASIC LONG PROCESS
MULTI DEVICE CVR
ADWORDS CDC
UA User-ID Ad Experiments
Advertiser it’s good for: Comfortable to steer Mobile advertising in a holistic manner
Action: Set Mobile bids based on Top of Page target and monitor Multi Device Conversion Rate of total website traffic
Advertiser it’s good for: Uses Adwords Conversion Tracking, already opted some spend into mobile
Action: Set Mobile bids based on uplift of Ad Groups where we can report CDC and extrapolate to rest of account
Advertiser it’s good for: Uses Universal Analytics, has way to authenticate users (e.g. website login)
Action: Set Mobile bids based on insights of web-to-web or app-to-app device paths of authenticated users
UA User-ID tracking
Cross-device onversions
Multi Devi Conv. rate
How to set Mobile Bids in a Multiscreen world?

NO IMPLEMENTATION
INSIGHTS INTO HOW TO INVEST MORE EFFICIENTLY
ADWORDS CDC
FULLER VIEW OF PERFORMANCE, ESP. FOR MOBILE CAMPAIGNS NO IMPLEMENTATION
NEEDED BEYOND ADWORDS CONVERSION TRACKING
2. Adwords Cross Device Conversions

Services on Mobile Services on Laptop
ADWORDS CDC
- This reporting only works when “paid search” is the last channel on the previous device. - We don’t report on every campaign as we only show a number when 95% statistical relevant. - In conclusion, the most conservative estimate of cross device conversions.
User Signed into to Google Services on Laptop
User Signed into to Google
In a nutshell: how it works

ADWORDS CDC
1. Analyse Cross Device Conversions impact
2. Calculate typical uplift on the reported Ad Groups
3. Use this uplift to calculate mBids for all Ad Groups
How to use Adwords Cross Device Conversions to bid?

ce C C
PREFERRED! BASIC LONG PROCESS
MULTI DEVICE CVR
ADWORDS CDC
UA User-ID Ad Experiments
Advertiser it’s good for: Comfortable to steer Mobile advertising in a holistic manner
Action: Set Mobile bids based on Top of Page target and monitor Multi Device Conversion Rate of total website traffic
Advertiser it’s good for: Uses Adwords Conversion Tracking, already opted some spend into mobile
Action: Set Mobile bids based on uplift of Ad Groups where we can report CDC and extrapolate to rest of account
Advertiser it’s good for: Uses Universal Analytics, has way to authenticate users (e.g. website login)
Action: Set Mobile bids based on insights of web-to-web or app-to-app device paths of authenticated users
UA User-ID tracking
Cross-device onversions
Multi Devi Conv. rate
How to set Mobile Bids in a Multiscreen world?

From session based to USER focussed measurement
UA User-ID
The Universal Analytics User-ID feature helps link together sessions by the same user on different devices*
* You need to be able to identify the user (e.g. upon login to your site) and pass a User Identifier to UA (non-pii!)
<UID> <UID> <UID> <UID>
3. Universal Analytics User-ID Tracking

UA User-ID
1. Analyse Cross Device Conversions impact for your logged-in users
2. Calculate typical uplift for these logged-in users
3. Use this uplift to calculate mBids for all Ad Groups
How to use UA User-ID tracking to bid?

○ Based on cross-device conversions uplift in AdWords
○ Based on cross-device conversions uplift for logged-in users in UA
● Consumers are increasingly relying on mobile devices when searching online
● Mobile advertising influences desktop sales
● There are three ways to set mobile bids taking these cross-device effects into account:
○ Based on target top of page rate
Quick recap on how to set mobile bids in a multiscreen world

Presentation 4:
First Case in Europe: Google Analytics at every level of your Organisation
Presented by Kristien Segers & Emilie Huybrechs

Measuring for Success Brussels Airlines
See-Think-Do Dashboard

Integrating Brand & Performance
‘Performance Thinkers’ ‘Brand Thinkers’
Real(time) Marketers &
Brand Builders
(online) Sales Experts Offline Brand Builders

Does your customer experience (Mobile) reflect this reality? Are you ready for the future?
Our media consumption habits have changed any content, any time, any screen
2010
Digital TV Radio Print 2014 25% 43% 47% 38% 22% 6% 16% 4%
Source: Nielsen DBM & Online survey commissioned by Google - TNS Fieldwork 2014
Does your customer experience (Mobile) reflect this reality? Are you ready for the future?

AVINASH KAUSHIK Digital Marketing Evangelist - Google

There is no need for another framework... … just one that summarizes them all by putting the CUSTOMER first instead of the division (Marketing, eCommerce…)
Largest addressable qualified audience!
Current customers, With two commercial transactions.
Largest addressable qualified audience, with some commercial intent.
Largest addressable qualified audience, with loads of commercial intent
See
Think
Do
Care

STDC for Brussels Airlines
People who love/need to travel. (And have money)
People who have purchased from us twice, or more.
People who love/need to travel, and are thinking about going on holiday/a trip.
People who love/need to travel, are thinking about going on holiday/ a trip and are in the later stages of a
purchase.
See
Think
Do
Care
?Engagement /
Content
strategy
?Marketing
strategy
?Measurement
strategy

Re-evaluate all your digital efforts
Are you truly measuring each stage optimally?
Are your initiatives broad enough and optimized for
each stage? Identify gaps
Content/Engagement Marketing Measurement

Engagement/Content: is each stage represented?
Do
Care
Care Care
See
Do
See
Think
Think
Do

Engagement/Content: don’t forget about multi-screen Bring your content strategy to a Multi-Screen level! ● Deliver a flawless experience across devices
● Facilitate switching between devices by through
apps, saved searches, sharing with friends, price alerts...

Marketing: who are we solving for?
1. Is our ad creative, targeting and purpose properly aligned with the consideration stage and audience?
2. Is this all we can accomplish from this type of advertising on the internet?
● See: broad, demographic, psychographic, primarily branding ● Think: narrower creative, present value of brand and drive
direct engagement (email, video, app downloads) ● Do: drive €€€ outcome
Is it for the audience in the See stage, in the Think stage or in the Do stage?

Measurement: Don’t obsess over conversion rate
Current conversion Rate = 3.5%* Will you be judging the success of your entire marketing strategy through a 3.5% lens?
“You are judging a fish by it’s ability to climb a tree” (A. Kaushik)
*dummy data

Measurement: Align your marketing focus areas
Start to kill what doesn’t work and optimize the potential against these metrics...
Live demo
The dashboard

KPI’s
People who love/need to travel. (And have money)
à Main objective : build brand Awareness
People who have purchased from us twice, or more.`
à Main objective : drive sales
People who love/need to travel,
and are thinking about going on holiday/a trip.
à Main objective : Get people to visit your site
People who love/need to travel, are thinking about going on holiday/ a trip
and are in the later stages of a purchase.
à Main objective : drive sales
See
Think
Do
Care

And now the showcase

There is room for improvements

Advantages of the dashboard
● Custom made ● Suits all vertical ● Consolidated data ● Simple to use ● CUSTOMER centric

Setting the scene
This was the result of working hard in a close 3-way collaboration between Brussels Airlines - Blue2Purple - Google
...and a little bit of fun...