What Works ClearinghouseTM - Institute of Education … Works Clearinghouse Procedures and Standards...
91
What Works Clearinghouse TM Procedures and Standards Handbook Version 3.0
Transcript of What Works ClearinghouseTM - Institute of Education … Works Clearinghouse Procedures and Standards...

What Works ClearinghouseTM
Procedures and Standards Handbook Version 3.0

ii
CONTENTS
I INTRODUCTION ..........................................................................................................1
II DEVELOPING THE REVIEW PROTOCOL AND IDENTIFYING RELEVANT LITERATURE ..........................................................................................4
A. Developing the Review Protocol .............................................................................4
B. Identifying Relevant Literature ................................................................................6
III SCREENING AND REVIEWING STUDIES ...............................................................7
A. Initial Screening for Eligibility ................................................................................7
B. Review of Eligible Studies Against WWC Standards .............................................8
1. Study Design: Is Group Assignment Determined by a Random Process? ............................................................................................................9
2. Sample Attrition: In What Range Does the Combination of Overall and Differential Attrition Fall? ..........................................................11
3. Baseline Equivalence: Are the Equivalence Requirements Met? ...................15 4. Outcome Eligibility and Reporting .................................................................16 5. Confounding Factors ......................................................................................19
C. Finishing the Review .............................................................................................20
IV REPORTING ON FINDINGS ......................................................................................22
A. Magnitude of Findings ...........................................................................................22
1. Effect Sizes .....................................................................................................22 2. Improvement Index .........................................................................................23
B. Statistical Significance of Findings .......................................................................24
1. Clustering Correction for “Mismatched” Analyses ........................................25 2. Benjamini-Hochberg Correction for Multiple Comparisons ..........................25
C. Characterizing Study Findings ...............................................................................26
D. Combining Findings...............................................................................................27
1. Combining Findings for WWC Intervention Reports ....................................28 2. Combining Evidence for Practice Guides .......................................................31
REFERENCES.. ............................................................................................................................33

iii
APPENDIX A: STAFFING, REVIEWER CERTIFICATION, AND QUALITY ASSURANCE ................................................................................................... A.1
APPENDIX B: POLICIES FOR SEARCHING AND PRIORITIZING STUDIES FOR REVIEW .................................................................................................. B.1
APPENDIX C: THE WWC STUDY REVIEW PROCESS ....................................................... C.1
APPENDIX D: PILOT REGRESSION DISCONTINUITY DESIGN STANDARDS ............. D.1
APPENDIX E: PILOT SINGLE-CASE DESIGN STANDARDS ............................................ E.1
APPENDIX F: MAGNITUDE OF FINDINGS FOR RANDOMIZED CONTROLLED TRIALS AND QUASI-EXPERIMENTAL DESIGNS .......................................................................................................... F.1
APPENDIX G: STATISTICAL SIGNIFICANCE FOR RANDOMIZED CONTROLLED TRIALS AND QUASI-EXPERIMENTAL DESIGNS .......................................................................................................... G.1

iv
TABLES
I.1 WWC Handbook Chapters and Associated Appendices ................................................2
II.1 Electronic Databases Routinely Included in WWC Comprehensive Searches...........................................................................................................................6
III.1 Highest Differential Attrition for a Sample to Maintain Low Attrition, by Overall Attrition, Under Liberal and Conservative Assumptions .................................13
III.2 Absolute Effect Size (ES) Difference Between Group Means at Baseline ...................15
IV.1 WWC Characterization of Findings of an Effect Based on a Single Outcome Measure .........................................................................................................26
IV.2 WWC Characterization of Findings of an Effect Based on Multiple Outcome Measures ........................................................................................................26
IV.3 Criteria Used to Determine the WWC Rating of Effectiveness for an Intervention ...................................................................................................................29
IV.4 Criteria Used to Determine the WWC Extent of Evidence for an Intervention ...................................................................................................................30
IV.5 Levels of Evidence for Practice Guides ........................................................................31
B.1 Sample Keywords and Related Search Terms for WWC Literature Searches....................................................................................................................... B.3
B.2 General Sources: Electronic Databases ....................................................................... B.4
B.3 General Sources: Websites .......................................................................................... B.5
B.4 Targeted Sources: Electronic Databases or Websites ................................................. B.6
B.5 Media Sources Monitored to Identify Studies Eligible for Quick Review ................. B.6
G.1 Illustration of Applying the Benjamini-Hochberg Correction for Multiple Comparisons ................................................................................................................ G.5

v
FIGURES
III.1 Determinants of a WWC Study Rating ...........................................................................9
III.2 The Relationship Between Overall and Differential Attrition and Potential Bias ................................................................................................................................12
IV.1 Computation of the WWC Improvement Index ............................................................24
E.1 Study Rating Determinants for Single-Case Designs ................................................. E.3
E.2 Depiction of an ABAB Design ................................................................................... E.8
E.3 An Example of Assessing Level with Four Phases of an ABAB Design ................... E.9
E.4 An Example of Assessing Trend in Each Phase of an ABAB Design ........................ E.9
E.5 Assess Variability within Each Phase ......................................................................... E.9
E.6 Consider Overlap between Phases ............................................................................ E.10
E.7 Examine the Immediacy of Effect with Each Phase Transition ................................ E.10
E.8 Examine Consistency across Similar Phases ............................................................ E.10
E.9A Examine Observed and Projected Comparison Baseline 1 to Intervention 1 ........... E.11
E.9B Examine Observed and Projected Comparison Intervention 1 to Baseline 2 ........... E.11
E.9C Examine Observed and Projected Comparison Baseline 2 to Intervention 2 ........... E.11

What Works Clearinghouse Procedures and Standards Handbook, Version 3.0
1
I. INTRODUCTION
The What Works Clearinghouse (WWC) is an initiative of the U.S. Department of Education’s National Center for Education Evaluation and Regional Assistance (NCEE), within the Institute of Education Sciences (IES), which was established under the Education Sciences Reform Act of 2002. The WWC is an important part of IES’s strategy to use rigorous and relevant research, evaluation, and statistics to improve our nation’s education system. It provides critical assessments of scientific evidence on the effectiveness of education programs, policies, and practices (referred to as “interventions”) and a range of products summarizing this evidence.
It is critical that educators have access to the best evidence about the effectiveness of education programs, policies, and practices in order to make sound decisions. However, it can be difficult, time-consuming, and costly for educators to access relevant studies and reach sound conclusions about the effectiveness of interventions. The WWC meets the need for credible, succinct information by reviewing research studies; assessing the quality of the research; summarizing the evidence of the effectiveness of programs, policies, and practices on outcomes related to student achievement; and disseminating its findings broadly.
The mission of the WWC is to be a central and trusted source of scientific evidence for what works in education. To achieve this, the WWC assesses the quality and findings of existing research; it does not conduct original research on education programs, policies, or practices. The systematic review process is the basis of all WWC products, enabling the WWC to use consistent, objective, and transparent standards and procedures in its reviews while also ensuring comprehensive coverage of the relevant literature.
The WWC systematic review process consists of four steps:
1. Developing the review protocol. The WWC develops a formal review protocol for each review to define the parameters for the research to be included within the scope of the review (e.g., population characteristics and types of interventions); the literature search (e.g., search terms and databases); and any topic-specific applications of the standards (e.g., acceptable thresholds for participant attrition and group equivalence).
2. Identifying relevant literature. Studies are gathered through a comprehensive search of published and unpublished publicly available research literature. The search uses electronic databases, outreach efforts, and public submissions.
3. Screening and reviewing studies. Studies initially are screened for eligibility, and every study meeting eligibility screens is reviewed against WWC standards.
4. Reporting on findings. The details of the review and its findings are summarized in a report. For many of its products, the WWC combines findings from individual studies into summary measures of effectiveness, including the magnitude of findings and the extent of evidence.
The details of this systematic review process vary slightly depending on the WWC product under development. Examples of possible variations in the review process include the scope of the literature search, the characteristics of studies that are relevant to the review, the outcomes that will be reported, and the format for reporting the review findings. Senior researchers who

What Works Clearinghouse Procedures and Standards Handbook, Version 3.0
2
have appropriate content and methodological expertise make decisions about these variations, which are documented in published review protocols.
After the WWC assesses the scientific merit of studies of the effectiveness of education interventions against the WWC standards, it summarizes the results in a set of products:
• Intervention reports. These reports summarize all studies published during a specific time period that examine the effectiveness of an intervention. For studies that meet WWC standards, the WWC combines the findings to generate overall estimates of the size of effects for the intervention. The WWC also provides an intervention rating and extent of evidence regarding the intervention’s effectiveness, taking into consideration the number of studies, the sample sizes, and the magnitude and statistical significance of the estimates of effectiveness.
• Practice guides. These guides contain practical recommendations that educators can use to address specific challenges in their classrooms and schools. The recommendations are based on reviews of research as well as the expertise and professional judgments of a panel of nationally recognized experts that includes both researchers and educators.
• Single study reviews. These reports are reviews of individual studies that describe the program, policy, or practice studied; indicate whether the study meets WWC standards; and summarize the study findings on effectiveness. Studies that garner notable mention in the press are the subject of a special kind of single study review. These studies are reviewed quickly, and a three-paragraph quick review summary is published, followed by a full single study review for those meeting standards.
This What Works Clearinghouse Procedures and Standards Handbook (Version 3.0) provides a detailed description of the standards and procedures of the WWC. The remaining chapters of this Handbook are organized to take the reader through the basic steps that the WWC uses to develop a review protocol, identify the relevant literature, assess research quality, and summarize evidence of effectiveness. Organizational procedures used by the WWC to ensure an independent, systematic, and objective review are described in the appendices. Table I.1 provides a summary of the remaining chapters and associated appendices.
Table I.1. WWC Handbook Chapters and Associated Appendices
Chapter Associated Appendices
II. Developing the Review Protocol and Identifying Relevant Literature
A. Staffing, Reviewer Certification, and Quality Assurance B. Policies for Searching and Prioritizing Studies for Review
III. Screening and Reviewing Studies C. The WWC Study Review Process D. Pilot Regression Discontinuity Design Standards E. Pilot Single-Case Design Standards
IV. Reporting on Findings F. Magnitude of Findings for Randomized Controlled Trials and Quasi-Experimental Designs
G. Statistical Significance for Randomized Controlled Trials and Quasi-Experimental Designs

What Works Clearinghouse Procedures and Standards Handbook, Version 3.0
3
The main differences between this version of the procedures and standards and the previous version (Version 2.1) are in clarity, detail, and scope. The organization of the Handbook, as well as all text, was reviewed and modified to support clarity; additionally, examples have been added throughout. There is more detail on the specific procedures and standards used by the WWC, including how to deal with missing data, random assignment probabilities, and cluster-level designs. Finally, whereas the previous version focused almost exclusively on intervention reports, this version provides information on other key WWC products, which include practice guides, single study reviews, and quick reviews.
As the WWC continues to refine processes, develop new standards, and create new products, the What Works Clearinghouse Procedures and Standards Handbook will be revised to reflect these changes. Readers who want to provide feedback on the Handbook or the WWC more generally may contact the WWC Help Desk at http://ies.ed.gov/ncee/wwc/ContactUs.aspx.

What Works Clearinghouse Procedures and Standards Handbook, Version 3.0
4
II. DEVELOPING THE REVIEW PROTOCOL AND IDENTIFYING RELEVANT LITERATURE
This chapter explains how the WWC approaches the first two steps in a systematic review of evidence on the effectiveness of an intervention or practice: (a) developing the review protocol and (b) identifying relevant literature. Because research on education covers a wide range of topics, interventions, and outcomes, a clear review protocol must set the parameters for locating, screening, and reviewing the eligible literature according to standards. A review protocol sets the rules for the characteristics of studies that will be included in a review and the information (such as types of student outcomes) from those studies that will be pertinent to the review.
After a review protocol has been developed, the next step in the systematic review process is to conduct a systematic and comprehensive search for relevant literature. A literature search is systematic when it uses well-specified search terms and processes in order to identify studies that may be relevant, and it is comprehensive when a wide range of available databases, websites, and other sources is searched for studies on the effects of an intervention.
A. Developing the Review Protocol
Prior to conducting a systematic review, the WWC develops a formal review protocol that defines the types of interventions that fall within the scope of the review, the population on which the review focuses, the keyword search terms, the parameters of the literature search, and any review-specific applications of the standards. WWC protocols are slightly different for intervention reports, practice guides, and single study reviews and include specific guidance on the following issues:
• Product and topic focus. All WWC review protocols begin with a description of the general purpose of the product. Protocols for both intervention reports and practice guides also provide background on the topic of focus and describe the goals of the review.
• Key definitions. Protocols for intervention reports and practice guides define key terms and concepts that are specific to the substance and goal of the review. For example, they define the key outcomes on which the review will focus and specify whether and how outcome measures will be organized into outcome domains. The protocol for reviews of single studies are broader and do not have specific definitions.
• General study inclusion criteria. Protocols for all WWC products specify the criteria for determining whether a study is eligible for inclusion in a WWC systematic review. Protocols may indicate the time frame within which a study must have been published (typically, 20 years prior to the initial protocol); the broad characteristics of the study sample (typically, students within a particular age or grade range or with a particular education need); and the study design.
• Review-specific parameters. Protocols indicate parameters that are specific to the topic under review. The review team leadership (lead methodologist and content expert, described further in Appendix A) makes decisions about key parameters, such as eligible population groups, types of interventions, outcomes of interest, and alternatives to the WWC default criteria for issues related to study design and

What Works Clearinghouse Procedures and Standards Handbook, Version 3.0
5
quality. Examples of review-specific parameters commonly defined in the review protocols include the following:
o Characteristics of the populations to be included. Protocols specify the range and limits of the student population of interest in the review. For example, the Adolescent Literacy topic area limits its focus to studies of interventions administered to students in grades 4 through 12 (or 9 to 18 years old). Protocols may also specify subgroups of special interest, such as students from particular socioeconomic backgrounds or students who are not native English speakers.
o Types of interventions to be included. Protocols provide descriptions of the types of interventions that fall within the bounds of the review. These descriptions often include the nature of the intervention (e.g., textbook-based literacy programs); the settings in which the intervention is delivered (e.g., regular classrooms or as a supplement to the regular school day); and whether the intervention is a “branded” product.
o Types of comparisons to be included. The WWC generally considers any contrast related to the intervention of interest when reviewing a study. For example, a study may have three groups (intervention Y, intervention Z, and a comparison group). A product focused on intervention Y may include only the contrast with the comparison group, or it may also include the contrast with intervention Z. Similarly, although a study may examine the effects of intervention Y relative to a comparison group receiving intervention Z, a WWC review focused on intervention Z would include this study by viewing Z as the intervention condition and Y as the comparison.
o Types of outcomes to be included and the properties of the measures. Review-specific protocols specify a set of outcomes that must be measured (e.g., a review of elementary school mathematics interventions must report on one or more measures of mathematics achievement); the range of outcomes that may be included in the review (e.g., mathematics achievement, reading achievement, or science achievement); and the properties of outcome measures that are acceptable for inclusion in the review (e.g., a specific reliability level or timing of measurement).
o Characteristics of studies to be included. Most characteristics related to the evaluation of study quality are common across WWC reviews. However, some specifics of standards vary across topic area reviews, such as the boundary separating acceptable and unacceptable sample attrition and the variables on which studies must demonstrate that the intervention and comparison groups are equivalent prior to the intervention (baseline equivalence). These must be specified in the review protocol and applied consistently when reviewing all studies that fall within the scope of the review.
• Literature search terms and methods. A review-specific protocol includes a list of the keywords and related terms that will be used in searching the literature and a list of the databases to search (see Appendix B for a sample list of keywords and search terms). A review-specific protocol also may provide special instructions regarding searching of the “gray literature,” including public submissions to the WWC through the website or staff, research conducted and disseminated by distributors/developers

What Works Clearinghouse Procedures and Standards Handbook, Version 3.0
6
of interventions, unpublished literature identified through prior WWC and non-WWC reviews and syntheses, unpublished research identified through listservs, and studies posted on organizational websites.
B. Identifying Relevant Literature
After a review protocol is established for developing an intervention report or practice guide, studies are gathered through a comprehensive search of published and unpublished research literature, including submissions from intervention distributors/developers, researchers, and the public to the WWC Help Desk. Only studies that are publicly available are eligible for inclusion in a WWC review. Single study reviews and quick reviews use alternative methods to identify studies for review (see Appendix B for more detail).
Trained WWC staff use the keywords defined in the review protocol to search a large set of electronic databases (Table II.1) and organizational websites (see Appendix B). Full citations and, where available, abstracts and full texts for studies identified through these searches are catalogued for subsequent relevance screening. In addition, the WWC conducts extensive outreach to content experts and relevant organizations to identify studies not contained in the various electronic databases and searches for relevant studies among those that have been submitted to the WWC by the various members of the public, including education product developers.
Table II.1. Electronic Databases Routinely Included in WWC Comprehensive Searches
Academic Search Premier SocINDEX with Full Text
Campbell Collaboration ProQuest Dissertations & Theses
Dissertation Abstracts PsycINFO
EconLit SAGE Journals Online
Education Research Complete Scopus
EJS E-Journals WorldCat
ERIC
Note: Appendix B provides a brief description of each of these databases. The review protocol for any WWC product may specify other databases in addition to these that will be examined during the literature search process.
All citations gathered through the search process undergo a preliminary screening to determine whether the study meets the criteria established in the review protocol. This screening process is described in Chapter III.

What Works Clearinghouse Procedures and Standards Handbook, Version 3.0
7
III. SCREENING AND REVIEWING STUDIES
The core of the systematic review process is the assessment of individual studies. The review of eligible studies against standards is the basis for developing any WWC report, from single study reviews that focus on one study to intervention reports and practice guides that may summarize findings from multiple studies. The process is designed to ensure that the WWC standards are applied correctly and that the study is described accurately. The review process has two steps: (a) an initial screening for eligibility and (b) a review of eligible studies against WWC standards.
The WWC defines a study as the examination of the effect of an intervention on a particular sample (e.g., a set of students, schools, or districts) and set of outcomes. To be a separate study, the sampling errors must be independent. For randomized controlled trials, a study is defined by randomization. This definition excludes subgroups from being their own studies because they were randomized at the same time as the full sample and treats additional cohorts without rerandomization of the unit of assignment as a single study; however, if the same units were rerandomized to condition, then they are separate studies. For quasi-experimental designs, studies are separate only if they use independent samples.
A single manuscript may contain multiple studies, such as an examination of a dropout prevention program analyzed in three separate cities. In this case, the analysis and findings for each city may be treated as a separate study and discussed separately throughout the WWC review. Likewise, multiple manuscripts may report on the findings from a single study. For example, a study of a beginning reading program may examine both immediate and long-term effects of the intervention. In the case of multiple manuscripts that report on one study, the WWC selects one manuscript as the primary citation used throughout the product and lists other manuscripts that describe the study as additional sources. The review team leadership (lead methodologist and content expert, described further in Appendix A) has the discretion to determine what constitutes a single study or multiple studies, and the decision is clearly noted in the WWC product that includes the review.
A. Initial Screening for Eligibility
Studies gathered during the literature search are screened against the parameters specified in the review protocol in order to identify a set of studies eligible for WWC review. The initial screening for eligibility is conducted by a WWC staff member who has been certified as a screener. Studies may be designated as Ineligible for WWC Review for any of the following reasons:
• The study is not a primary analysis of the effect of an intervention. Some research studies identified in the literature search are not primary studies of an intervention’s impacts or effectiveness. For example, studies of how well an intervention was implemented, literature reviews, or meta-analyses are not eligible to be included in a WWC review.
• The study does not have an eligible design. The WWC includes findings from studies of effectiveness that use a comparison group that was created randomly (randomized controlled trials) or through a process that was not random (quasi-experimental designs). Studies that use a regression discontinuity design or single-case design may

What Works Clearinghouse Procedures and Standards Handbook, Version 3.0
8
be reviewed against pilot design standards and described in reports. Studies using other study designs are not eligible for review.
• The study does not use a sample aligned with the protocol. Characteristics of study samples that are eligible for review will be listed in the protocol and may include age, grade range, gender, or geographic location.
• The study does not include an outcome within a domain specified in the protocol. Each protocol identifies an outcome domain or set of domains that is relevant to the review. Studies eligible for review must include at least one outcome that falls within the domains identified in the review protocol.
• The study was not published in the relevant time frame. When the WWC begins the review of studies for a new topic, a cutoff date is established for research to be included. Typically, this cutoff is set at 20 years prior to the start of the WWC review of the topic. This time frame generally encompasses research that adequately represents the current status of the field and avoids inclusion of research conducted with populations and in contexts that may be very different from those existing today.
B. Review of Eligible Studies Against WWC Standards
All studies that meet the initial screening criteria are reviewed against the WWC standards. Most studies reviewed by the WWC are group design studies (i.e., randomized controlled trials and quasi-experimental design studies), and those types of studies are the focus of this section. For more details on the WWC review process, see Appendix C as well as the Study Review Guide used by the WWC in documenting reviews and instructions for its use. Pilot design standards for regression discontinuity design studies and single-case design studies are described in Appendix D and Appendix E, respectively.
The end result of reviewing a study against WWC standards is a study rating, which is an indication of the credibility of evidence from the study. The three possible ratings are Meets WWC Group Design Standards without Reservations, Meets WWC Group Design Standards with Reservations, and Does Not Meet WWC Group Design Standards. The rating can be affected by study design, sample attrition, and the evidence of equivalence or nonequivalence of the intervention and comparison groups prior to the intervention, as illustrated in Figure III.1.

What Works Clearinghouse Procedures and Standards Handbook, Version 3.0
9
Figure III.1. Determinants of a WWC Study Rating
Baseline Equivalence
Is equivalence established at baseline for the groups in the analytic sample?
Meets WWC Group Design
Standards
with Reservations
Does Not Meet WWC
Group Design Standards
Meets WWC Group Design
Standards without
Reservations
Sample Attrition
Is the combination of overall and differential attrition high?
Study Design
Is group membership determinedthrough a random process?
NO
YES
NO
YES
YES
NO
In this section, randomized controlled trials and quasi-experimental design studies are described in more detail, along with the standards used to evaluate them.
1. Study Design: Is group membership determined through a random process?
Randomized controlled trials can receive the highest WWC rating of Meets WWC Group Design Standards without Reservations. The distinguishing characteristic of a randomized controlled trial is that study participants are assigned randomly to form two or more groups that are differentiated by whether or not they receive the intervention under study. Thus, at the time the sample is identified (and before the intervention), the groups should be similar, on average, on both observable and unobservable characteristics. This design allows any subsequent (i.e., postintervention) differences in outcomes between the intervention and comparison groups to be attributed solely to the intervention.
In order to Meet WWC Group Design Standards without Reservations, the unit that is assigned (for example, study participants, schools, etc.) must have been placed into each study condition through random assignment or a process that was functionally random. The determination of whether assignment was random will be made by the reviewers, who may consult with review team leadership and/or send questions to the authors for clarification. An example of a functionally random process is a school-administered lottery to determine who is admitted to selective schools that have more applicants than they can accommodate. Random assignment may also include blocking the sample into groups before random assignment, random subsampling, groups with different probabilities, or groups of different size.

What Works Clearinghouse Procedures and Standards Handbook, Version 3.0
10
To be valid, the units must be assigned entirely by chance and have a nonzero probability of falling into in each group. The probability of assignment to the different groups does not need to be equal; however, if the probabilities differ, then the reported analysis must adjust for the different assignment probabilities. This requirement also applies if the probability of assignment to a group varies across blocks in a stratified random assignment framework. The three WWC-accepted methods of adjustment are (a) estimating a regression model in which the covariate set includes dummy variables that differentiate subsamples with different assignment probabilities, (b) estimating impacts separately for subsamples with different assignment probabilities and averaging the subsample-specific impacts, and (c) using inverse probability weights. If study authors describe a random assignment process that suggests varying probabilities of assignment but do not report on or adjust for differing probabilities of being assigned to the intervention group, the study would not qualify as a well-executed randomized controlled trial and could not receive the highest rating.
Studies may employ random assignment at different levels. Within a multi-level framework, the type of data and level of analysis may differ. An individual is the smallest distinct entity; in education studies, this is most often a student. An individual-level analysis is an analysis conducted using data for each individual. A cluster is a group of individuals; in education studies, this is frequently a classroom or school. A cluster-level analysis is an analysis conducted using data for each cluster that are often an aggregation of data from individuals within the cluster at a point in time. Among individuals within a cluster, stayers are those who are in the sample both before and after the intervention; leavers are those who are in the sample before the intervention, but not after; and joiners are those who are in the sample after the intervention, but not before.
In a cluster randomized controlled trial, in which clusters are the units randomly assigned, it is not necessary for individuals to be randomly assigned to clusters. Furthermore, a study with cluster-level assignment and cluster-level analysis may have changes in subcluster composition that are not subject to the attrition standard. A cluster-level analysis of stayers and joiners used to answer a cluster-level research question may Meet WWC Group Design Standards without Reservations. If the analysis is conducted at the individual level, any nonrandom movement or placement of individuals into the intervention or comparison groups after random assignment jeopardizes the random assignment design of the study. Individual-level studies of stayers or stayers plus joiners may Meet WWC Group Design Standards with Reservations if the study is able to demonstrate baseline equivalence of the analytic sample.
Quasi-experimental design studies that demonstrate baseline equivalence can receive a WWC rating no higher than Meets WWC Group Design Standards with Reservations. A quasi-experimental design compares outcomes for students, classrooms, or schools who had access to the intervention with those who did not but were similar on observable characteristics. Groups of participants and nonparticipants can form for many reasons. For example, a district may choose to pilot a new math curriculum in some schools and not others; teachers of some classrooms might agree to incorporate a reading supplement into their curriculum, whereas others might not; or a group of students may be eligible for an afterschool program, but only some may choose to participate. In each case, the characteristics of intervention and nonintervention (comparison) groups differ. They may differ on characteristics we can observe, such as test scores, or ways we cannot clearly observe, such as motivation. Even with equivalence on observable characteristics,

What Works Clearinghouse Procedures and Standards Handbook, Version 3.0
11
there may be differences in unobservable characteristics that could introduce bias into an estimate of the effect of the intervention.
2. Sample Attrition: Is the combination of overall and differential attrition high?
Well-designed randomized controlled trials may experience rates and patterns of sample attrition that compromise the initial comparability of the intervention and comparison groups and potentially lead to biased estimates of the intervention’s effectiveness. Attrition occurs when an outcome variable is not available for all participants initially assigned to the intervention and comparison groups. Attrition leads to bias when the attrition is not random but rather is related to the outcome of interest. For randomized controlled trials, the WWC is concerned about both overall attrition (i.e., the rate of attrition for the entire sample) and differential attrition (i.e., the difference in the rates of attrition for the intervention and comparison groups) because both types of attrition contribute to the potential bias of the estimated effect.
a. Attrition in Individual-level RCTs
The WWC’s attrition standard is based on a model for attrition bias and empirically based assumptions. The model depicts potential bias as a function of the rates of overall and differential attrition and the relationship between attrition and outcomes. To determine reasonable values to use in assessing the extent of potential attrition bias in a study, the WWC made assumptions about the relationship between attrition and outcomes that are consistent with findings from several randomized trials in education. More information on the model and the development of the attrition standard can be found in the WWC Technical Paper on Assessing Attrition Bias.
Figure III.2 illustrates an approximation of the combination of overall and differential attrition rates that generates acceptable, potentially acceptable, and unacceptable levels of expected bias under “liberal” and “conservative” assumptions about the relationship between attrition and outcomes. In this figure, an acceptable level of bias is defined as an effect size of 0.05 of a standard deviation or less on the outcome. The red region shows combinations of overall and differential attrition that result in high levels of potential bias (that is, greater than 0.05 of a standard deviation) even under the more liberal assumptions. Similarly, the green region shows combinations that result in low levels of potential bias even under the more conservative assumptions. However, within the yellow region of the figure, the potential bias may or may not exceed 0.05 of a standard deviation, depending on which assumptions are used.

What Works Clearinghouse Procedures and Standards Handbook, Version 3.0
12
Figure III.2. The Relationship Between Overall and Differential Attrition and Potential Bias
In developing the review protocol, the review team leadership considers the types of samples and the likely relationship between attrition and outcomes for studies in the area. When it has reason to believe that much of the attrition is exogenous to the interventions reviewed—that is, unrelated to treatment status—more liberal assumptions regarding the relationship between attrition and the outcome may be appropriate. For example, the review team leadership may choose the liberal standard if it believes attrition often arises from the movement of young children in and out of school districts due to family mobility or from random absences on the days that assessments are conducted. Conversely, if team leadership has reason to believe that much of the attrition is endogenous to the interventions reviewed—such as high school students choosing whether to participate in a dropout prevention program—more conservative assumptions may be appropriate.
The choice of liberal or conservative assumptions results in a specific set of combinations of overall and differential rates of attrition that define “high attrition” and “low attrition” to be applied consistently for all studies in an area:
• For a study in the green area, attrition is expected to result in an acceptable level of bias even under the conservative assumptions.
• For a study in the red area, attrition is expected to result in an unacceptable level of bias even under the liberal assumptions. Therefore, the study must establish baseline

What Works Clearinghouse Procedures and Standards Handbook, Version 3.0
13
equivalence of the postattrition analysis sample (see the next section) to receive a rating of Meets Group Design Standards with Reservations.
• For a study in the yellow area, the judgment about the sources of attrition for the area determines whether attrition is high or low. The choice of the boundary establishing acceptable levels of attrition is articulated in the review protocol.
o If the review team leadership believes liberal assumptions are appropriate for the area, a study that falls in this range is treated as if it were in the “low attrition” green area.
o If the review team leadership believes conservative assumptions are appropriate, a study that falls in this range is treated as if it were in the “high attrition” red area.
For each overall attrition rate, Table III.1 shows the highest differential attrition rate allowable to still be considered “low attrition” under the two possible assumptions: conservative and liberal. Table III.1. Highest Differential Attrition for a Sample to Maintain Low Attrition, by Overall Attrition, Under Liberal and Conservative Assumptions
Differential Attrition
Differential Attrition
Differential Attrition
Overall Attrition
Conservative Boundary
Liberal Boundary
Overall Attrition
Conservative Boundary
Liberal Boundary
Overall Attrition
Conservative Boundary
Liberal Boundary
0 5.7 10.0 22 5.2 9.7 44 2.0 5.1 1 5.8 10.1 23 5.1 9.5 45 1.8 4.9 2 5.9 10.2 24 4.9 9.4 46 1.6 4.6 3 5.9 10.3 25 4.8 9.2 47 1.5 4.4 4 6.0 10.4 26 4.7 9.0 48 1.3 4.2 5 6.1 10.5 27 4.5 8.8 49 1.2 3.9 6 6.2 10.7 28 4.4 8.6 50 1.0 3.7 7 6.3 10.8 29 4.3 8.4 51 0.9 3.5 8 6.3 10.9 30 4.1 8.2 52 0.7 3.2 9 6.3 10.9 31 4.0 8.0 53 0.6 3.0 10 6.3 10.9 32 3.8 7.8 54 0.4 2.8 11 6.2 10.9 33 3.6 7.6 55 0.3 2.6 12 6.2 10.9 34 3.5 7.4 56 0.2 2.3 13 6.1 10.8 35 3.3 7.2 57 0.0 2.1 14 6.0 10.8 36 3.2 7.0 58 - 1.9 15 5.9 10.7 37 3.1 6.7 59 - 1.6 16 5.9 10.6 38 2.9 6.5 60 - 1.4 17 5.8 10.5 39 2.8 6.3 61 - 1.1 18 5.7 10.3 40 2.6 6.0 62 - 0.9 19 5.5 10.2 41 2.5 5.8 63 - 0.7 20 5.4 10.0 42 2.3 5.6 64 - 0.5 21 5.3 9.9 43 2.1 5.3 65 - 0.3

What Works Clearinghouse Procedures and Standards Handbook, Version 3.0
14
Note: The specific combinations of overall and differential attrition that separate low and high attrition are currently under review. The attrition model is being refined and parameters estimated with additional data, which may result in revisions to numbers in the table.
Source: WWC Technical Paper on Assessing Attrition Bias.
b. Attrition in Cluster RCTs
Many studies reviewed by the WWC are based on designs with multiple levels, such as students clustered within classrooms or schools. Studies in which the clusters—rather than the individual sample members—are randomly assigned to intervention and comparison groups are referred to as cluster RCTs. Bias in cluster RCTs can be generated not only from the loss of clusters (e.g., schools) but also from the loss of sample members within the clusters (e.g., students) if they leave because of their treatment status. In order to be deemed an RCT with low attrition, a cluster RCT that reports an individual-level analysis (e.g., estimating the effect of the intervention on students) must have low attrition at two levels. First, it must have low attrition at the cluster level, as determined using the attrition boundary set above. Second, the study must have low attrition at the subcluster (i.e., individual within a cluster) level, again using the attrition boundary set above, with attrition based only on the clusters remaining in the sample. That is, the denominator for the subcluster attrition calculation includes only sample members at clusters (schools or classrooms) that remain in the study after cluster attrition.
However, attrition for a cluster RCT that reports a cluster-level analysis (e.g., estimating the effect of the intervention on classrooms or schools) will be assessed only at the cluster level. The cluster-level estimates reflect both the impact on individuals (e.g., students) within the cluster and the changes in composition of the individuals. The study will be deemed a low-attrition RCT if it has low attrition at the cluster level, using the attrition boundary defined in the protocol.
c. Sample Loss That Does Not Count as Attrition
Sample that is lost after initial random assignment because of “acts of nature,” such as hurricanes or earthquakes, may be excluded from the initial sample for attrition calculations. The sample loss generated by acts of nature is most likely unrelated to educational outcomes and, therefore, does not create the potential for bias. Similarly, collecting outcome data for only a subset of the initial sample does not count as attrition if (1) the subsampling is applied consistently across the intervention and comparison groups and (2) the subsample was either randomly selected or selected based on characteristics that were clearly determined prior to random assignment (e.g., race, gender). Under these conditions, the sample loss is unrelated to condition and does not lead to bias.
The WWC presumes that sample loss arising from sources other than acts of nature or the subsampling described above could be related to outcomes, and thus it counts the sample loss in calculating attrition. For a given study, some sample loss may arguably be unrelated to outcomes; for example, a decision to change a school’s curriculum or to reassign teachers could lead to attrition that may or may not be related to the intervention being evaluated. Such considerations are not taken into account on a study-by-study basis; rather, as discussed above, the review team leadership takes into account the extent to which attrition in studies reviewed for the topic area is likely to be exogenous when it chooses the liberal or conservative attrition standard for the area. This approach allows for flexibility across areas in making appropriate

What Works Clearinghouse Procedures and Standards Handbook, Version 3.0
15
assumptions about the relationship between attrition and outcomes while ensuring uniform, replicable assessments of attrition across studies within an area. 3. Baseline Equivalence: Is equivalence established at baseline for the groups in the
analytic sample?
A randomized controlled trial with low attrition is eligible to receive the highest rating of Meets WWC Group Design Standards without Reservations. However, randomized controlled trials with high attrition and all quasi-experimental designs are not eligible to receive the highest rating because of a greater concern about the similarity of the intervention and comparison groups. For these studies, equivalence of the intervention and comparison groups on observable characteristics at baseline (i.e., prior to the period of study) must be established for the analytic sample (i.e., the students, schools, or classrooms that remain at the end of the study when the outcomes are assessed) rather than the initial groups in the study. Review protocols for each topic area identify the observable characteristics for which equivalence must be demonstrated.
If the reported difference of any baseline characteristic is greater than 0.25 standard deviations in absolute value (based on the variation of that characteristic in the pooled sample), the intervention and comparison groups are judged to be not equivalent. The standard limiting preintervention differences between groups to 0.25 standard deviations is based on Ho, Imai, King, & Stuart (2007). For differences in baseline characteristics that are between 0.05 and 0.25 standard deviations, the analysis must include a statistical adjustment for the baseline characteristics to meet the baseline equivalence requirement. Differences of less than or equal to 0.05 require no statistical adjustment (Table III.2).
Table III.2. Absolute Effect Size (ES) Difference Between Group Means at Baseline
0.00 ≤ ES Difference ≤ 0.05 0.05 < ES Difference ≤ 0.25 ES Difference > 0.25
Satisfies baseline equivalence Statistical adjustment required to satisfy baseline equivalence
Does not satisfy baseline equivalence
A randomized controlled trial with high attrition or a quasi-experimental design study can, at best, receive a rating of Meets WWC Group Design Standards with Reservations if it meets the baseline equivalence requirement. If baseline equivalence is not established, the study Does Not Meet WWC Group Design Standards. There are a number of additional considerations regarding establishing baseline equivalence in randomized controlled trials with high attrition and quasi-experimental design studies:
• The characteristics on which equivalence must be established are specified in the review protocol. Baseline equivalence is often established using a preintervention test for academic measures. In reviews without analogous preintervention measures (e.g., did not complete high school), baseline equivalence is often required for demographic characteristics that are related to the outcome of interest.
• If differences in baseline characteristics are shown to be within the range that requires statistical adjustment (between 0.05 and 0.25 standard deviations), a number of different techniques can be used, including regression adjustment and analysis of covariance (ANCOVA). The critical factor is that the baseline characteristics specified in the protocol must be included in the analysis at the individual level.

What Works Clearinghouse Procedures and Standards Handbook, Version 3.0
16
• Equivalence must be demonstrated separately for each outcome domain (that is, each set of related outcomes). Some reviews specify domains on which equivalence must be demonstrated even when there are no outcomes in the domain. For example, studies reviewed under the topic area Children Classified as Having an Emotional Disturbance must demonstrate equivalence on measures of behavior prior to the intervention even if the study reports on only academic outcomes. Unless specified in the protocol, demonstration of equivalence in one domain does not positively or negatively affect the equivalence in other domains.
• In cases of multiple measures within a domain, the WWC requires that analyses of all postintervention measures in that domain include statistical adjustments for all preintervention measures that require adjustment. For example, if A, B, and C are available as pre- and postintervention measures, and the preintervention difference in B requires statistical adjustment, the WWC requires inclusion of the preintervention measure of B for each of the analyses of A, B, and C. However, the review team leadership has discretion to waive this requirement, which must be specified in the review protocol in advance and applied consistently for all studies within the review.
• In cluster design studies (e.g., studies where the unit of intervention is the classroom or the school and the unit of analysis is the student), establishing equivalence between intervention and comparison group clusters (e.g., classrooms or schools) is acceptable using either (a) the same cohort from an earlier point in time or (b) an earlier, adjacent cohort measured at the same grade as the cohort used in the impact analysis. A cohort cluster-level measure cannot be used to establish equivalence for an individual-level analysis.
• If there is evidence that the intervention and comparison group samples were drawn from different settings, the review team leadership for the topic area has discretion to decide that the environments are too dissimilar to provide an adequate comparison condition.
4. Outcome Eligibility and Reporting
To be eligible for review, an outcome must (a) demonstrate face validity and reliability, (b) not be overaligned with the intervention, and (c) be collected in the same manner for both intervention and comparison groups. Standardized tests, in which the same test is given in the same manner to all test takers, are assumed to meet these criteria if they are relevant to the topic.
To show evidence of face validity, a sufficient description of the outcome measure must be provided for the WWC to determine that the measure is clearly defined, has a direct interpretation, and measures the construct it was designed to measure. For example, a count of spoken words during a time period has face validity for measuring reading fluency, and the percentage of students who complete high school would be an outcome with face validity as a graduation rate.
Reliability of an outcome measure may be established by meeting the following minimum standards: (a) internal consistency (such as Cronbach’s alpha) of 0.50 or higher; (b) temporal stability/test-retest reliability of 0.40 or higher; or (c) inter-rater reliability (such as percentage agreement, correlation, or kappa) of 0.50 or higher. The protocol for a review may specify higher

What Works Clearinghouse Procedures and Standards Handbook, Version 3.0
17
standards for assessing reliability and/or may stipulate how to deal with outcomes related to achievement that are unlikely to provide reliability information. Examples of outcomes that may only have face validity include grades, grade point averages, course credits, or simple math problems for young children. The review team leadership specifies whether these outcomes are eligible, need to be confirmed by a content expert, or are ineligible for review. Generally the WWC does not consider grades or grade point average as eligible for review because criteria may differ across teachers, schools, or districts.
A second requirement of outcome measures is that they not be overaligned with the intervention. When outcome measures are closely aligned with or tailored to the intervention, the study findings may not be an accurate indication of the effect of the intervention. For example, an outcome measure based on an assessment that relied on materials used in the intervention condition but not in the comparison condition (e.g., specific reading passages) likely would be judged to be overaligned. The decision about whether a measure is over-aligned is made by the review team leadership for the topic area.
A third requirement of outcome measures is that they be collected in the same manner for the intervention and comparison groups. The WWC assumes data were collected in the same manner if no information is provided. However, reviewers look for comments in studies that (a) different modes, timing, or personnel were used for the groups or (b) measures were constructed differently for the groups. Review teams may send questions to authors to clarify how data were collected. When outcome data are collected differently for the intervention and comparison groups, study-reported impact estimates will confound differences due to the intervention with those due to differences in the data collection methods. For example, measuring dropout rates based on program records for the intervention group and school administrative records for the comparison group will result in unreliable impact estimates because it will not be possible to disentangle the true impact of the intervention from differences in the dropout rates that are due to the particular measure used.
Studies often report findings for multiple outcomes, including the same outcome measured at different points in time, alternative measures of the same construct, or both item-level measures and composite measures. The WWC has established the following guidelines for determining which outcomes to report:
• Outcomes measured at different points in time. When the study reports both immediate and longer-term measures of an outcome, the WWC selects one measure as the primary finding that will contribute to the rating for the intervention; findings for the other outcomes will be included in supplemental tables. The preference is determined by the review team leadership and described in the review protocol.
• Overall and subgroup findings. When a study presents findings separately for several groups of students without presenting an aggregate result, the WWC will query authors to see if they conducted an analysis on the full sample of students. If the WWC is unable to obtain aggregate results from the author, the WWC averages across subgroups within a study to use as the primary finding and presents the subgroup results as supplemental tables (see Chapter IV for more detail).
• Item-level and composite measures. When a study reports both composite test measures and their components, the WWC considers the composite to be the primary

What Works Clearinghouse Procedures and Standards Handbook, Version 3.0
18
finding that contributes to the rating for the intervention. The component subtest or item-level results are included in supplemental tables.
• Categorical ordinal measures. For some categorical ordinal outcomes, the WWC may collapse categories to create comparable effect sizes across studies. For example, a test with five scoring levels may be collapsed into proficient and nonproficient categories to allow comparison with other measures that report only two possible outcomes.
• Actual versus imputed measures. If a randomized controlled trial is determined to have low attrition, the results from analyses with acceptable methods of accounting for missing outcome data can be used in the reporting of study findings (they do not affect the rating). The methods listed below, if implemented as described, are acceptable for generating p-values or standard errors that could be reported by the WWC. A study may also use these methods to impute missing values for covariates or independent variables, but imputed baseline variables cannot be used to demonstrate baseline equivalence.
o Complete case analysis with no regression adjustment. The most straightforward approach to handling missing outcome data is to drop observations with missing outcomes from the analysis. If it is clear that a study used this approach, no additional information is needed in order to use the study’s p-values and standard errors.
o Complete case analysis with regression adjustment for baseline covariates. One approach to account for preintervention differences between the intervention and comparison groups that may arise from attrition is to conduct statistical adjustment for preintervention differences (e.g., through regression or ANCOVA). If it is clear that a study used this approach, no additional information is needed in order to use the study’s p-values and standard errors.
o Maximum likelihood separately by treatment status. Many statistical packages use maximum likelihood methods to account for missing data. This is acceptable as long as it is clear that either a standard statistical package was used (the name of the package and procedure or function should be stated) or a citation is provided to a peer-reviewed methodological journal article or textbook. Otherwise, the WWC asks the author for information to determine if the specific maximum likelihood method used meets the conditions above.
o Multiple imputation. Multiple imputation (Rubin, 1987) involves creating multiple data sets that contain imputed values for missing outcome data that are generated through the repeated application of an imputation algorithm (such as imputation by chained equations). All multiple imputation approaches are acceptable as long as (a) imputation is conducted separately for the intervention and comparison groups (Puma, Olsen, Bell, & Price, 2009) and (b) either a standard statistical package was used or a citation is provided to a peer-reviewed methodological journal article or textbook. Variables used in the imputation model must include at least all of the covariates that were used for statistical adjustment in the impact estimation. In order for the WWC to use the standard errors and p-values, the number of imputations must be greater than one and the

What Works Clearinghouse Procedures and Standards Handbook, Version 3.0
19
number of imputations must be accounted for when generating the overall standard errors and p-values.
o Nonresponse weights. Nonresponse weights are proportional to the inverse of the predicted probability of having nonmissing outcome data, yielding greater weight for individuals with a higher probability of having missing outcome data. The predicted probabilities are typically calculated as the rate of nonmissing outcome data within groups of study subjects with similar preintervention covariate values or as estimates of the probability of having nonmissing outcome data conditional on covariates generated through a logit or probit model. The WWC requires that the probabilities of having nonmissing outcome data must be predicted conditional on treatment status, such as including treatment status as a covariate in the logit or probit model. In order for the WWC to use the standard errors and p-values, the analysis must properly account for the design effect for the weight (Scheaffer, Mendenhall, & Ott, 2005). The WWC may ask the author for information needed to verify the analytic method and the statistical package and command used for calculating standard errors in the presence of nonresponse weights.
5. Confounding Factors
In some studies, a component of the study design or the circumstances under which the intervention was implemented are perfectly aligned, or confounded, with either the intervention or comparison group. That is, some factor is present for members of only one group and absent for all members in the other group. In these cases, it is not possible to tell whether the intervention or the confounding factor is responsible for the difference in outcomes. Confounding factors may be present in randomized controlled trials and quasi-experimental studies.
The most common type of confounding occurs when the intervention or comparison group contains a single study unit—for example, when all of the intervention students are taught by one teacher, all of the comparison classrooms are from one school, or all of the intervention group schools are from a single school district. In these situations, there is no way to distinguish between the effect of the intervention and that unit. For example, if all students who use a mathematics intervention are taught by a single teacher, then any subsequent differences between the outcomes of students who use the mathematics intervention and those who do not may be due to the intervention, the teacher, or both.
Another example of confounding occurs when the characteristics of the units in each group differ systematically in ways that are associated with the outcomes. For example, a small group of teachers in a master’s program implements the intervention, whereas students in the comparison group are taught by teachers with bachelor’s degrees. If the teacher’s education is not a component of the intervention—that is, the intervention does not specify that only master’s level teachers can lead the intervention—then it is a potential confounding factor. In this case, differences in student outcomes between the intervention and comparison groups may be due to the intervention, the higher level of education of the intervention group teachers, or a combination of the two.

What Works Clearinghouse Procedures and Standards Handbook, Version 3.0
20
Confounding also occurs if an intervention is always offered in combination with a second intervention because any subsequent differences in outcomes cannot be attributed solely to either intervention. However, the WWC may view the combination as a single intervention and report on its effects. Additionally, if information on the treatment group comes from one school year, whereas information on the comparison group comes from a different school year, then time can be considered a confounding factor.
In each example above, the confounding factor may have an effect on the outcome separate from the intervention that cannot be eliminated by the study design. Because it is impossible to separate the degree to which an observed effect was due to the intervention and how much was due to the confounding factor, a study with a confounding factor cannot meet WWC standards. In quasi-experimental design studies, confounding is almost always a potential issue due to the selection of a sample because some unobserved factors may have contributed to the outcome. The WWC accounts for this issue by not allowing a quasi-experimental design studies to receive the highest evidence rating.
WWC reviewers must decide whether there is sufficient information to determine that the only difference between the two groups that is not controlled for by design or analysis is the presence of the intervention. If not, there may a confounding factor, and the reviewer must determine if that factor could affect the outcome separately from the intervention.
C. Finishing the Review
After a study is reviewed to determine whether the design is appropriate; whether there is at least one relevant, valid, and reliable outcome measure; and whether there are any confounding factors, the study receives one of three ratings: Meets WWC Group Design Standards without Reservations, Meets WWC Group Design Standards with Reservations, or Does Not Meet WWC Group Design Standards. These ratings relate to the amount of confidence the WWC places in the ability of the study to generate an unbiased estimate of the causal relationship between the intervention and the outcomes of interest. Studies that do not meet standards receive a brief description of at least one reason the study did not meet WWC standards:
• Design quality. The study is a randomized controlled trial with high attrition or a quasi-experimental design study with analysis groups that are not shown to be equivalent.
• Outcomes and reporting. There was not enough information to determine whether the outcome measures were valid or reliable, the outcomes are overaligned with the intervention, or the outcomes were measured differently for the intervention and comparison groups.
• Confounding factor. There was only one unit assigned to at least one of the conditions, or the intervention was always used in combination with another intervention.
For each study that meets WWC standards with or without reservations, the WWC records information about the intervention and comparison conditions to the extent that they are reported in the study. For example, the comparison group may also receive an intervention, such as another curriculum; the business-as-usual offering; or no service. The impact of an intervention
What Works Clearinghouse Procedures and Standards Handbook, Version 3.0
21
is always relative to the specific comparison or counterfactual, and inferences from study findings should take context into account. The WWC also documents information on the study sample (including students, classrooms, teachers, and schools); the setting of the study; the eligible outcomes included in the study and how they were measured; and details such as the training of teachers or staff who implemented the intervention. This is important context for interpreting findings from the study.
Although the WWC documents how the intervention was implemented and the context in which it was implemented for the study sample, it makes no statistical adjustments or corrections for variations in implementation of the intervention (e.g., relative to an ideal or average implementation). Variations in implementation are to be expected in studies of interventions because they take place in real-life settings, such as classrooms and schools, and not necessarily under tightly controlled conditions monitored by researchers. Similarly, the WWC also makes no statistical adjustments for nonparticipation (i.e., intervention group members given the opportunity to participate in a program who chose not to) or possible contamination (i.e., comparison group members who receive the intervention). The review team leadership has discretion to determine whether these issues are substantive enough to affect the rating of a study or to deem it outside the scope of the review protocol.

What Works Clearinghouse Procedures and Standards Handbook, Version 3.0
22
IV. REPORTING ON FINDINGS
To the extent possible, the WWC reports the magnitude and statistical significance of study-reported estimates of the effectiveness of interventions, using common metrics and applying corrections (e.g., clustering and multiple comparisons) that may affect the study-reported results. Next, a heuristic is applied to characterize study findings in a way that incorporates the direction, magnitude, and statistical precision of the impact estimates. Finally, in some of its products (e.g., intervention reports and practice guides), the WWC combines findings from individual studies into summary measures of effectiveness, including aggregate numerical estimates of the size of impacts, overall ratings of effectiveness, and a rating for the extent of evidence.
A. Magnitude of Findings
The WWC reports the magnitude of study findings in two ways: (a) effect sizes (i.e., standardized mean differences) and (b) a WWC-calculated “improvement index.”
1. Effect Sizes
For all studies, the WWC records the study findings in the units reported by the study authors. In addition, the WWC computes and records the effect size associated with study findings on relevant outcome measures. In general, to improve the comparability of effect size estimates across studies, the WWC uses student-level standard deviations when computing effect sizes, regardless of the unit of assignment or the unit of intervention. For effect size measures used in other situations, such as those based on student-level t-tests or cluster-level assignment, see Appendix F.
For continuous outcomes, the WWC has adopted the most commonly used effect size index, the standardized mean difference known as Hedges’ g, with an adjustment for small samples. It is defined as the difference between the mean outcome for the intervention group and the mean outcome for the comparison group, divided by the pooled within-group standard deviation of the outcome measure. Defining yi and yc as the means of the outcome for students in the intervention and comparison groups, ni and nc as the student sample sizes, si and sc as the student-level standard deviations, and ω as the small sample size correction, the effect size is given by
( )( ) ( )
ω −=
− + −+ −
2 21 12
i c
i i c c
i c
y yg
n s n sn n
.
For dichotomous outcomes, the difference in group means is calculated as the difference in the probability of the occurrence of an event. The effect size measure of choice for dichotomous outcomes is the Cox index, which yields effect size values similar to the values of Hedges’ g that one would obtain if group means, standard deviations, and sample sizes were available, assuming the dichotomous outcome measure is based on an underlying normal distribution. Defining pi and pc as the probability of an outcome for students in the intervention and comparison groups, the effect size is given by

What Works Clearinghouse Procedures and Standards Handbook, Version 3.0
23
ω
= − − − /1.65
1 1i c
Coxi c
p pd ln lnp p
The WWC also follows these additional guidelines when calculating effect sizes:
• If a study reports both unadjusted and adjusted postintervention means, the WWC reports the adjusted means and unadjusted standard deviations and uses these in computing effect sizes.
• For pre- and posttests using the same measure, when only unadjusted group means are reported and information about the correlation between the tests is not available, the WWC computes the effect size numerator as the difference between the pre- and posttest mean difference for the intervention group and the pre- and posttest mean difference for the comparison group. However, this aggregate post hoc adjustment is not an adequate statistical adjustment for baseline differences in cases where they fall in the 0.05 to 0.25 standard deviations range for quasi-experimental design studies and high-attrition randomized controlled trials.
• When the pre- and posttest outcomes use different measures or the outcome measure is dichotomous and the study authors report only unadjusted mean values of the outcomes for the intervention and comparison groups, the WWC computes the effect size of the difference between the two groups on the pretest and the effect size of the difference between the two groups on the posttest separately, with the final effect size given by their difference.
• When the WWC makes a difference-in-differences adjustment to findings provided by the study author, the WWC reports statistical significance levels for the adjusted differences that reflect the adjustment in the effect size. For example, consider a preintervention difference of 0.2 on an achievement test. If the postintervention difference were 0.3, the difference-in-differences adjusted effect would be 0.1. Subsequently, the statistical significance reported by the WWC would be based on the adjusted finding of 0.1 rather than the unadjusted finding of 0.3.
For the WWC, effect sizes of 0.25 standard deviations or larger are considered to be substantively important. Effect sizes at least this large are interpreted as a qualified positive (or negative) effect, even though they may not reach statistical significance in a given study.
2. Improvement Index
In order to help readers judge the practical importance of an intervention’s effect, the WWC translates effect sizes into “improvement index” values. The improvement index for an individual study finding represents the difference between the percentile rank corresponding to the mean value of the outcome for the intervention group and the percentile rank corresponding to the mean value of the outcome for the comparison group distribution (details on the computation of the improvement index are presented in Appendix F). The improvement index can be interpreted as the expected change in percentile rank for an average comparison group student if the student had received the intervention.

What Works Clearinghouse Procedures and Standards Handbook, Version 3.0
24
Figure IV.1 illustrates the interpretation of the improvement index. In this example, the estimated average impact of the intervention is an improvement of 0.4 standard deviations in reading test scores. Thus, on average, a student in the comparison group who scores at the 50th percentile for the study sample would be expected to have scored 0.4 standard deviations above the mean if he or she had received the intervention, or at the 66th percentile of students. The resulting improvement index is +16, corresponding to moving performance for the average student from the 50th to the 66th percentile of the comparison group distribution. For more details, see Appendix F.
Figure IV.1. Computation of the WWC Improvement Index
B. Statistical Significance of Findings
To adequately assess the effects of an intervention, it is important to know the statistical significance of the estimates of the effects in addition to the mean difference, effect size, or improvement index, as described above. For the WWC, a statistically significant estimate of an effect is one for which the probability of observing such a result by chance is less than one in 20 (using a two-tailed t-test with p = 0.05), assuming there is a single measure or mean effect within each domain.
The WWC generally accepts the statistical significance levels reported by the author(s) of the study. However, there are three common circumstances in which the WWC will either compute the statistical significance levels or make adjustments to those reported in the study: (a) the study does not include statistical significance estimates; (b) the statistical significance levels reported in the study do not account for clustering when there is a mismatch between the unit of assignment and unit of analysis; and (c) the study reports multiple estimates of impacts within a single domain, but the reported statistical significance levels do not account for the multiple

What Works Clearinghouse Procedures and Standards Handbook, Version 3.0
25
comparisons. These WWC-calculated or recalculated estimates appear in WWC products with a note describing the source of the calculations and noting any difference between WWC and author-reported findings. Specific strategies used by the WWC to correct statistical significance levels for clustering and for multiple comparisons are described below.
1. Clustering Correction for “Mismatched” Analyses
A “mismatch” problem occurs when random assignment is carried out at the cluster level (e.g., classroom or school level) and the analysis is conducted at the individual level (e.g., student level), but the correlation among students within the same clusters is ignored in computing the standard errors of the impact estimates. Although the point estimates of the intervention’s effects based on such mismatched analyses are not affected as a result of ignoring this feature of the study sample, the standard errors of the impact estimates generally will be underestimated, thereby leading to overestimates of statistical significance.
To assess an intervention’s effects in cases where study authors have not corrected for the clustering, the WWC computes clustering-corrected statistical significance estimates based on guidance in Hedges (2005). The basic approach to the clustering correction is first to compute the t-statistic corresponding to the effect size that ignores clustering and then correct both the t-statistic and the associated degrees of freedom for clustering based on sample sizes, number of clusters, and an estimate of the intra-class correlation (ICC). The default ICC value is 0.20 for achievement outcomes and 0.10 for behavioral and attitudinal outcomes. (If a deviation from this default value is warranted, the review protocol describes the ICC value that should be used for specific topic areas or outcome domains.) The statistical significance estimate corrected for clustering is then obtained from the t-distribution using the corrected t-statistic and degrees of freedom. Each step of the process is specified in Appendix G.
2. Benjamini-Hochberg Correction for Multiple Comparisons
The WWC has adopted the Benjamini-Hochberg (BH) correction to account for multiple comparisons or “multiplicity,” which can lead to inflated estimates of the statistical significance of findings (Benjamini & Hochberg, 1995). The BH correction is used in three types of situations: (a) studies that estimated effects of the intervention for multiple outcome measures in the same outcome domain using a single comparison group, (b) studies that estimated effects of the intervention for a given outcome measure using multiple comparison groups, and (c) studies that estimated effects of the intervention for multiple outcome measures in the same outcome domain using multiple comparison groups. Repeated tests of highly correlated outcomes will lead to a greater likelihood of mistakenly concluding that the differences in means for outcomes of interests between the intervention and comparison groups are significantly different from zero (called Type I error in hypothesis testing). Thus, in the three situations described above, the WWC uses the BH correction to reduce the possibility of making this type of error.
The WWC applies the BH correction only to statistically significant findings because nonsignificant findings will remain nonsignificant after correction. If the exact p-values are not available but effect sizes are available, the WWC converts the effect size to t-statistics and then obtains the corresponding p-values. For findings based on analyses in which the unit of analysis was aligned with the unit of assignment or where study authors conducted their analysis in such a way that their p-values were adjusted to account for the mismatch between the level of

What Works Clearinghouse Procedures and Standards Handbook, Version 3.0
26
assignment and analysis, the p-values reported by the study authors are used for the BH correction. For findings based on mismatched analyses that have not generated p-values that account for the sample clustering, the WWC uses the clustering-corrected p-values for the BH correction. For more detail, see Appendix G.
C. Characterizing Study Findings
Using the estimated effect size and statistical significance level (accounting for clustering and multiple comparisons when necessary), the WWC characterizes study findings in one of five categories: (a) statistically significant positive (favorable) effect, (b) substantively important positive effect, (c) indeterminate effect, (d) substantively important negative (unfavorable) effect, and (e) statistically significant negative effect. For findings based on a single outcome measure, the rules in Table IV.1 are used to determine which of the five categories applies.
Table IV.1. WWC Characterization of Findings of an Effect Based on a Single Outcome Measure
Statistically significant positive effect
The estimated effect is positive and statistically significant (correcting for clustering when not properly aligned).
Substantively important positive effect
The estimated effect is positive and not statistically significant but is substantively important.
Indeterminate effect The estimated effect is neither statistically significant nor substantively important.
Substantively important negative effect
The estimated effect is negative and not statistically significant but is substantively important.
Statistically significant negative effect
The estimated effect is negative and statistically significant (correcting for clustering when not properly aligned).
Note: A statistically significant estimate of an effect is one for which the probability of observing such a result by chance is less than one in 20 (using a two-tailed t-test with p = 0.05). A properly aligned analysis is one for which the unit of assignment and unit of analysis are the same. An effect size of 0.25 standard deviations or larger is considered to be substantively important.
If the effect is based on multiple outcome measures within a domain, the rules in Table IV.2 apply.
Table IV.2. WWC Characterization of Findings of an Effect Based on Multiple Outcome Measures
Statistically significant positive effect
When any of the following is true: 1. Univariate statistical tests are reported for each outcome measure and
either • At least half of the effects are positive and statistically significant
and no effects are negative and statistically significant in a properly aligned analysis, or
• At least one measure is positive and statistically significant and no effects are negative and statistically significant, accounting for multiple comparisons (and correcting for clustering when not properly aligned).
2. The mean effect reported for the multiple outcome measures is positive and statistically significant (correcting for clustering when not properly aligned).
3. The omnibus effect for all outcome measures together is reported as positive and statistically significant on the basis of a multivariate

What Works Clearinghouse Procedures and Standards Handbook, Version 3.0
Table IV.2 (continued)
27
statistical test in a properly aligned analysis.
Substantively important positive effect
The mean effect reported is positive and not statistically significant but is substantively important.
Indeterminate effect The mean effect reported is neither statistically significant nor substantively important.
Substantively important negative effect
The mean effect reported is negative and not statistically significant but is substantively important.
Statistically significant negative effect
When any of the following is true: 1. Univariate statistical tests are reported for each outcome measure and
either • At least half of the effects are negative and statistically significant
and no effects are positive and statistically significant in a properly aligned analysis, or
• At least one measure is negative and statistically significant and no effects are positive and statistically significant, accounting for multiple comparisons (and correcting for clustering when not properly aligned).
2. The mean effect reported for the multiple outcome measures is negative and statistically significant (correcting for clustering when not properly aligned).
3. The omnibus effect for all outcome measures together is reported as negative and statistically significant on the basis of a multivariate statistical test in a properly aligned analysis.
Note: A statistically significant estimate of an effect is one for which the probability of observing such a result by chance is less than one in 20 (using a two-tailed t-test with p = 0.05). A properly aligned analysis is one for which the unit of assignment and unit of analysis are the same. An effect size of 0.25 standard deviations or larger is considered to be substantively important.
Because they are not directly comparable to individual-level (e.g., student level) effect sizes,
results based on the analysis of cluster-level data, such as school level outcomes, cannot be considered in determining substantively important effects in intervention ratings. Therefore, in intervention reports, cluster-level effect sizes are excluded from the computation of domain average effect sizes and improvement indices. However, the statistical significance of cluster-level findings is taken into account in determining the characterization of study findings. In single study reviews, the magnitude and significance of findings are presented along with cautions that any changes reported by a cluster-level analysis may be due to (a) a change in outcomes for the stayers, (b) a change in composition of individuals within the cluster (leavers leave and joiners join), or (c) a combination of these effects that cannot be separated by the analysis.
D. Combining Findings
This section describes how the WWC combines findings from individual studies into summary measures of effectiveness for intervention reports and practice guides. It describes the methods of aggregating numerical findings, determining an intervention rating, and assigning the levels of evidence.
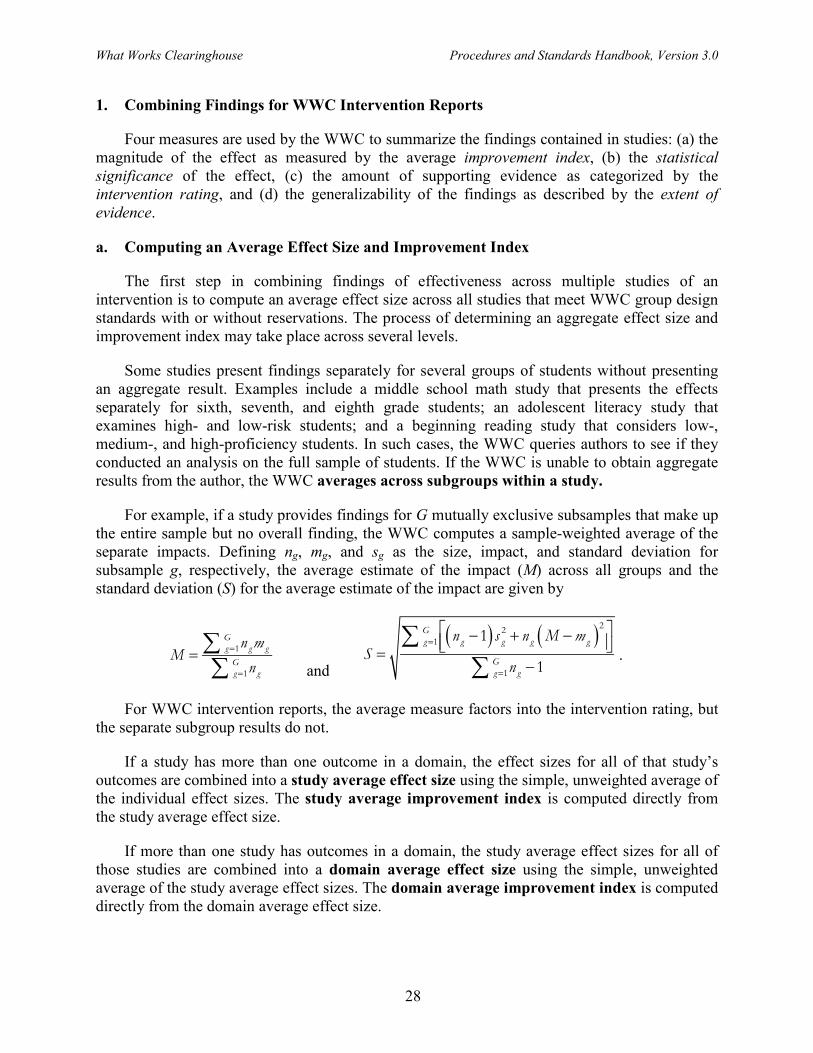
What Works Clearinghouse Procedures and Standards Handbook, Version 3.0
28
1. Combining Findings for WWC Intervention Reports
Four measures are used by the WWC to summarize the findings contained in studies: (a) the magnitude of the effect as measured by the average improvement index, (b) the statistical significance of the effect, (c) the amount of supporting evidence as categorized by the intervention rating, and (d) the generalizability of the findings as described by the extent of evidence.
a. Computing an Average Effect Size and Improvement Index
The first step in combining findings of effectiveness across multiple studies of an intervention is to compute an average effect size across all studies that meet WWC group design standards with or without reservations. The process of determining an aggregate effect size and improvement index may take place across several levels.
Some studies present findings separately for several groups of students without presenting an aggregate result. Examples include a middle school math study that presents the effects separately for sixth, seventh, and eighth grade students; an adolescent literacy study that examines high- and low-risk students; and a beginning reading study that considers low-, medium-, and high-proficiency students. In such cases, the WWC queries authors to see if they conducted an analysis on the full sample of students. If the WWC is unable to obtain aggregate results from the author, the WWC averages across subgroups within a study.
For example, if a study provides findings for G mutually exclusive subsamples that make up the entire sample but no overall finding, the WWC computes a sample-weighted average of the separate impacts. Defining ng, mg, and sg as the size, impact, and standard deviation for subsample g, respectively, the average estimate of the impact (M) across all groups and the standard deviation (S) for the average estimate of the impact are given by
=
=
= ∑∑
1
1
Gg g g
Gg g
n mM
n and
( ) ( )=
=
− + − =−
∑∑
221
1
1
1
Gg g g g g
Gg g
n s n M mS
n.
For WWC intervention reports, the average measure factors into the intervention rating, but the separate subgroup results do not.
If a study has more than one outcome in a domain, the effect sizes for all of that study’s outcomes are combined into a study average effect size using the simple, unweighted average of the individual effect sizes. The study average improvement index is computed directly from the study average effect size.
If more than one study has outcomes in a domain, the study average effect sizes for all of those studies are combined into a domain average effect size using the simple, unweighted average of the study average effect sizes. The domain average improvement index is computed directly from the domain average effect size.

What Works Clearinghouse Procedures and Standards Handbook, Version 3.0
29
b. Computing Statistical Significance
As a second component in summarizing findings, the statistical significance for aggregate measures is determined by computing the t-statistic
i c
i c
n nt gn n
=+ ,
where g is the average effect size across findings, and ni and nc are the average sample sizes for the intervention and comparison groups, respectively, for a set of findings.
c. Intervention Rating Scheme
The third step in combining findings of effectiveness across multiple studies of an intervention is to determine the intervention rating. The WWC uses a set of guidelines to determine the rating for an intervention just as it uses guidelines to determine the rating for an individual study (Table IV.3).
Table IV.3. Criteria Used to Determine the WWC Rating of Effectiveness for an Intervention
Positive effects: Strong evidence of a positive effect with no overriding contrary evidence
• Two or more studies show statistically significant positive effects, at least one of which meets WWC group design standards without reservations, AND
• No studies show statistically significant or substantively important negative effects.
Potentially positive effects: Evidence of a positive effect with no overriding contrary evidence
• At least one study shows statistically significant or substantively important positive effects, AND
• Fewer or the same number of studies show indeterminate effects than show statistically significant or substantively important positive effects, AND
• No studies show statistically significant or substantively important negative effects.
No discernible effects: No affirmative evidence of effects
• None of the studies shows statistically significant or substantively important effects, either positive or negative.
Mixed effects: Evidence of inconsistent effects
EITHER both of the following: • At least one study shows statistically significant or substantively
important positive effects, AND • At least one study shows statistically significant or substantively
important negative effects, BUT no more such studies than the number showing statistically significant or substantively important positive effects.
OR both of the following: • At least one study shows statistically significant or substantively
important effects, AND • More studies show an indeterminate effect than show statistically
significant or substantively important effects.
Potentially negative effects: Evidence of a negative effect
EITHER both of the following: • One study shows statistically significant or substantively important

What Works Clearinghouse Procedures and Standards Handbook, Version 3.0
Table IV.3 (continued)
30
with no overriding contrary evidence
negative effects, AND • No studies show statistically significant or substantively important
positive effects. OR both of the following:
• Two or more studies show statistically significant or substantively important negative effects, at least one study shows statistically significant or substantively important positive effects, AND
• More studies show statistically significant or substantively important negative effects than show statistically significant or substantively important positive effects.
Negative effects: Strong evidence of a negative effect with no overriding contrary evidence
• Two or more studies show statistically significant negative effects, at least one of which meets WWC group design standards without reservations, AND
• No studies show statistically significant or substantively important positive effects.
Note: A statistically significant estimate of an effect is one for which the probability of observing such a result by chance is less than one in 20 (using a two-tailed t-test with p = 0.05). An effect size of 0.25 standard deviations or larger is considered to be substantively important. An indeterminate effect is one for which the single or mean effect is neither statistically significant nor substantively important.
d. Extent of Evidence Categorization
The final step in combining findings of effectiveness across multiple studies of an intervention is to report on the extent of the evidence used to determine the intervention rating. The extent of evidence categorization was developed to inform readers about how much evidence was used to determine the intervention rating, using the number and sizes of studies. This scheme has two categories: (a) medium to large and (b) small (Table IV.4).
Table IV.4. Criteria Used to Determine the WWC Extent of Evidence for an Intervention
Medium to large • The domain includes more than one study, AND • The domain includes more than one setting, AND • The domain findings are based on a total sample of at least 350
students, OR, assuming 25 students in a class, a total of at least 14 classrooms across studies.
Small • The domain includes only one study, OR • The domain includes only one setting, OR • The domain findings are based on a total sample size of fewer
than 350 students, AND, assuming 25 students in a class, a total of fewer than 14 classrooms across studies.
The WWC defined these categories based on the following rationale:
• With only one study, the possibility exists that some characteristics of the study—for example, the outcome instruments or the timing of the intervention—might have affected the findings. Multiple studies reduce potential bias due to sampling error. Therefore, the WWC considers the extent of evidence to be small when the findings are based on only one study.

What Works Clearinghouse Procedures and Standards Handbook, Version 3.0
31
• Similarly, with only one setting (e.g., school), the possibility exists that some characteristics of the setting—for example, the principal or student demographics within a school—might have affected the findings or were intertwined or confounded with the findings. Therefore, the WWC considers the extent of evidence to be small when the findings are based on only a single setting.
• The sample size of 350 was selected because it is generally the smallest sample size needed to have adequate statistical power (e.g., 80% probability of rejecting the null hypothesis when it is false and no more than a 5% probability of mistakenly concluding there is an impact) to detect impacts that are meaningful in size (e.g., 0.3 standard deviations or larger) for a simple randomized controlled trial (e.g., students are randomized to the intervention or comparison conditions in equal proportions) with no covariates used in the analysis.
2. Combining Evidence for Practice Guides
In combining the evidence for each recommendation, the expert panel and WWC review staff consider the following:
• The number of studies
• The quality of the studies
• Whether the studies represent the range of participants, settings, and comparisons on which the recommendation is focused
• Whether findings from the studies can be attributed to the recommended practice
• Whether findings in the studies are consistently positive
Practice guide panels rely on a set of definitions to determine the level of evidence supporting their recommendations (Table IV.5).
Table IV.5. Levels of Evidence for Practice Guides
Criteria Strong Evidence Base Moderate Evidence Base Minimal Evidence Base
Validity The research has high internal validity and high external validity based on studies that meet standards.
The research has high internal validity but moderate external validity or high external validity but moderate internal validity.
The research may include evidence from studies that do not meet the criteria for moderate or strong evidence.
Effects on relevant outcomes
The research shows consistent positive effects without contradictory evidence in studies with high internal validity.
The research shows a preponderance of evidence of positive effects. Contradictory evidence must be discussed and considered with regard to relevance to the scope of the guide and the intensity of the recommendation as a component of the intervention evaluated.
There may be weak or contradictory evidence of effects.
Relevance to scope The research has direct Relevance to scope may The research may be out of

What Works Clearinghouse Procedures and Standards Handbook, Version 3.0
Table IV.5 (continued)
32
relevance to scope—relevant context, sample, comparison, and outcomes evaluated.
vary. At least some research is directly relevant to scope.
the scope of the practice guide.
Relationship between research and recommendations
Direct test of the recommendation in the studies or the recommendation is a major component of the intervention tested in the studies.
Intensity of the recommendation as a component of the interventions evaluated in the studies may vary.
Studies for which the intensity of the recommendation as a component of the interventions evaluated in the studies is low, and/or the recommendation reflects expert opinion based on reasonable extrapolations from research.
Panel confidence Panel has a high degree of confidence that this practice is effective.
The panel determines that the research does not rise to the level of strong but is more compelling than a minimal level of evidence. Panel may not be confident about whether the research has effectively controlled for other explanations or whether the practice would be effective in most or all contexts.
In the panel’s opinion, the recommendation must be addressed as part of the practice guide; however, the panel cannot point to a body of research that rises to the level of moderate or strong.
Role of expert opinion
Not applicable. Not applicable. Expert opinion based on defensible interpretation of theory.
When assessment is the focus of the recommendation
Assessments meet the standards of The Standards for Educational and Psychological Testing.
For assessments, evidence of reliability meets The Standards for Educational and Psychological Testing but with evidence of validity from samples not adequately representative of the population on which the recommendation is focused.
Not applicable.

What Works Clearinghouse Procedures and Standards Handbook, Version 3.0
33
REFERENCES
Benjamini, Y., & Hochberg, Y. (1995). Controlling the false discovery rate: A practical and powerful approach to multiple testing. Journal of the Royal Statistical Society Series B Methodological, 57(1), 289–300.
Hedges, L. V. (2005). Correcting a significance test for clustering. Unpublished manuscript.
Ho, D., Imai, K., King, G., & Stuart, E. A. (2007). Matching as nonparametric preprocessing for reducing model dependence in parametric causal inference. Political Analysis, 15(3), 199–236.
Rubin, D. B. (1987). Multiple imputation for nonresponse in surveys. New York: Wiley.
Puma, M. J., Olsen, R. B., Bell, S. H., & Price, C. (2009). What to do when data are missing in group randomized controlled trials (NCEE 2009-0049). Washington, DC: National Center for Education Evaluation and Regional Assistance, Institute of Education Sciences, U.S. Department of Education.
Scheaffer, R. L., Mendenhall III, W., & Ott, R. L. (2005). Elementary survey sampling (6th ed.). Boston: Duxbury.

What Works Clearinghouse Procedures and Standards Handbook, Version 3.0
A.1
A. STAFFING, REVIEWER CERTIFICATION, AND QUALITY ASSURANCE
The purpose of this appendix is to describe the roles and responsibilities of WWC staff in developing WWC products, the certification of WWC reviewers, and the procedures in place for assuring WWC product quality.
A. Staffing for WWC Products
1. Intervention Reports
After an initial search, if there is enough literature to generate reviews of interventions for a topic area, methodology and content experts are identified as team leaders, and their names are submitted to the IES for approval. Once approved, if they are new to the WWC process, they receive training on substantive WWC content and operational procedures.
Together, the team leaders develop the review protocol for the topic area, provide methodological and content-specific support and guidance to the review teams working on reviews in the topic area, and play a central role in determining the content and quality of the final products. Throughout the process of reviewing studies, the lead methodologist reconciles differences between reviewers of a particular study; writes and reviews reports on interventions; makes technical decisions for the team; and serves as the point of contact for study authors, developers, and IES.
Other members of the review team include WWC-certified reviewers and review coordinators. WWC-certified reviewers are responsible for reviewing and analyzing relevant literature. Reviewers have training in research design and methodology and in conducting critical reviews of effectiveness studies; they have also passed a WWC-reviewer certification exam (see below for more details). As part of the team, these individuals review, analyze, and summarize relevant literature for evidence of effectiveness and assist in drafting intervention reports.
Coordinators support the team leaders, reviewers, and other review team members in managing the various aspects of the reviews. For example, coordinators work with library staff in overseeing the literature search process, screening the literature, organizing and maintaining communication, tracking the review process, overseeing review team staffing, and managing the production process.
2. Practice Guides
Practice guides are developed under the guidance of a panel composed of six members. Each panel is chaired by a nationally recognized researcher with expertise in the topic. The panel consists of four researchers who have diverse expertise in the relevant content area and/or relevant methodological expertise, along with two practitioners who have backgrounds that allow them to offer guidance about implementation of the recommendations.
Working with the panel, WWC research staff develop the research protocol, review studies, and draft the guide. There are four primary roles: (a) an evidence coordinator, who ensures that the research used to support recommendations is rigorous and relevant; (b) a practice coordinator, who ensures that the discussion of how to implement each recommendation is

What Works Clearinghouse Procedures and Standards Handbook, Version 3.0
A.2
concrete, specific, and appropriate; (c) WWC-certified reviewers, who assess whether supporting literature meets WWC standards; and (d) a panel coordinator, who arranges meetings and manages other logistical needs or concerns. Ultimately, the practice guide is a result of the teamwork and consensus of the panel and research staff.
3. Single Study Reviews
Similar to the staffing structure for conducting reviews for intervention reports, single study reviews (including quick reviews) are conducted under the guidance of a lead methodologist as described above. When the subject of a single study falls under a topic area for which the WWC has developed a review protocol, the study is reviewed according to that protocol and with guidance from the content expert for that topic area. In other cases, the WWC identifies a content expert who has relevant expertise.
The lead methodologist for a single study review is responsible for ensuring that the study in question meets the criteria for being reviewed by the WWC. For each single study review, the team leader works with a minimum of two certified WWC reviewers in completing the requisite study review guide and preparing the report. The key responsibility of the lead methodologist in this process is to reconcile any differences in the judgments of the principal reviewers about the quality or findings of the study, resolve any technical issues or refer them to the senior WWC team for resolution, and review and ensure the quality of draft reports.
B. Reviewer Certification
All studies that are included in WWC products are systematically reviewed by WWC-certified reviewers who must successfully complete a training and certification process designed and administered by or under the supervision of the WWC. Potential reviewers are screened for appropriate and relevant expertise and experience in rigorous research design and analysis methods prior to being admitted to reviewer training. There are separate trainings and certification exams for randomized controlled trials and quasi-experimental designs, regression discontinuity designs, and single-case designs. The group design training entails a two-day interactive session that includes an overview of the WWC and its products and in-depth instruction on the WWC review standards, review tools, policies, and practices. Trainings for single-case designs and regression discontinuity designs are each one day. Information about WWC training and certification is posted on the website.
At the conclusion of training, participants pursuing certification are expected to take and pass a multiple-choice precertification examination. Those who pass the precertification exam are then required to complete and earn an acceptable grade on a full study review following the WWC study review guide. The review is graded by the certification team, with feedback provided to the participant. If the participant has not satisfactorily completed the review, he or she will be asked to review a second article. If the participant still has not attained a passing grade, he or she may be asked to complete a third review, as long as the second review showed improvement. If there is no apparent improvement or the participant does not adequately complete the third review, he or she will not receive certification.

What Works Clearinghouse Procedures and Standards Handbook, Version 3.0
A.3
C. Quality Assurance
1. Statistical, Technical, and Analysis Team
The WWC statistical, technical, and analysis team (STAT) is a group of highly experienced researchers who consider issues requiring higher-level technical skills, including revising existing standards and developing new standards. Additionally, issues that arise during the review of studies are brought to the STAT for its consideration.
2. Document Review
At each stage, reviewers examine the accuracy of the study reviews, evaluate the product for consistency and clarity, and ensure that the report conforms to WWC processes. It is only after intense review from several perspectives that a WWC product is released to the public.
After an extensive drafting and revision process with multiple layers of internal review, the completed draft is submitted to IES, which reviews the document internally and sends it out for external peer review by researchers who are knowledgeable about WWC standards and are not staff on a WWC contract. Both sets of comments are returned to the contractor’s drafting team, which responds to each comment and documents all responses in a memo. The report undergoes a final review by IES staff to ensure that any issues have been addressed appropriately. Intervention reports for which no studies meet standards are subject only to IES review, not external peer review. Practice guides also undergo review by the U.S. Department of Education’s Standards and Review Office.
3. Quality Review Team
The WWC Quality Review Team (QRT) addresses concerns about WWC reports raised by external inquiries through a quality review process. Inquiries must (a) be submitted in writing to the WWC Help Desk through the Contact Us page (http://ies.ed.gov/ncee/wwc/ContactUs.aspx), (b) pertain to a specific study or set of studies, and (c) identify and explain the specific issue(s) in the report that the inquirer believes to be incorrect. A QRT review is conducted by WWC staff who did not contribute to the product in question in order to determine the following:
• Whether a study that was not reviewed should have been reviewed
• Whether the rating of a study was correct
• Whether outcomes excluded from the review should have been included
• Whether the study’s findings were interpreted correctly
• Whether computation procedures were implemented correctly
After an inquiry is forwarded to the QRT, a team member verifies that the inquiry meets criteria for a quality review and notifies the inquirer whether a review will be conducted. A member of the QRT is assigned to conduct an independent review of the study, examine the original review and relevant author and distributor/developer communications, notify the topic area team leadership of the inquiry, and interview the original reviewers. When the process is complete, the QRT makes a determination on the inquiry.

What Works Clearinghouse Procedures and Standards Handbook, Version 3.0
A.4
If the original WWC decisions are validated, the QRT reviewer drafts a response to the inquirer explaining the steps taken and the disposition of the review. If the review concludes that the original review was flawed, a revision will be published, and the inquirer will be notified that a change was made as a result of the inquiry. These quality reviews are one of the tools used to ensure that the standards established by IES are upheld on every review conducted by the WWC.
4. Conflicts of Interest
Given the potential influence of the WWC, the Department of Education’s National Center for Education Evaluation and Regional Assistance, within the Institute of Education Sciences, has established guidelines regarding actual or perceived conflicts of interest specific to the WWC. WWC contractors administer this conflict of interest policy on behalf of the Department of Education.
Any financial or personal interests that could conflict with, appear to conflict with, or otherwise compromise the efforts of an individual because they could impair the individual’s objectivity are considered potential conflicts of interest. Impaired objectivity involves situations in which a potential contractor; subcontractor; employee or consultant; or member of his or her immediate family (spouse, parent, or child) has financial or personal interests that may interfere with impartial judgment or objectivity regarding WWC activities. Impaired objectivity can arise from any situation or relationship, impeding a WWC team member from objectively assessing research on behalf of the WWC.
The intention of this process is to protect the WWC and review teams from situations in which reports and products could be reasonably questioned, discredited, or dismissed because of apparent or actual conflicts of interest and to maintain standards for high quality, unbiased policy research and analysis. All WWC product team members, including methodologists, content experts, panel chairs, panelists, coordinators, and reviewers, are required to complete and sign a form identifying whether potential conflicts of interest exist. Conflicts for all tasks must be disclosed before any work is started.
As part of the review process, the WWC occasionally will identify studies for review that have been conducted by organizations or researchers associated with the WWC. In these cases, review and reconciliation of the study are conducted by WWC-certified reviewers from organizations not directly connected to the research, and this is documented in the report.
Studies that have been conducted by the developer of an intervention do not fall under this conflict of interest policy. Therefore, the WWC does not exclude studies conducted or outcomes created by the developer of the product being reviewed. The authors of all studies are indicated in WWC reports, and the WWC indicates the source of all outcome measures that are used, including those created by the developer.
In combination with explicit review guidelines, IES review of all documents, and external peer review of all products, these conflict of interest policies achieve the WWC goal of transparency in the review process while also ensuring that WWC reviews are free from bias.

What Works Clearinghouse Procedures and Standards Handbook, Version 3.0
B.1
B. POLICIES FOR SEARCHING AND PRIORITIZING STUDIES FOR REVIEW
Because of the large amount of research literature in the field of education, the WWC must prioritize topic areas for review and, within topic areas, prioritize the order in which interventions will be reviewed. Similarly, the WWC must determine whether studies are eligible to be reviewed as quick reviews and single study reviews and which topics will be investigated in the practice guide format. The purpose of this appendix is to describe the current policies and practices that govern decisions regarding what education interventions will be reviewed, what single studies will be reviewed and in what order, and what topics should be the focus of WWC practice guides.
A. Prioritizing Reviews for Intervention Reports
The WWC conducts reviews of interventions and generates intervention reports in areas determined by the Institute of Education Sciences (IES) to be of highest priority for informing the national education policy agenda. IES establishes its priorities based on nominations received from the public to the WWC Help Desk; input from meetings and presentations sponsored by the WWC; suggestions presented to IES or the WWC by senior members of education associations; input from state and federal policymakers; and literature scans to determine how much evidence on the effectiveness of interventions exists in various topic areas.
In consultation with the WWC contractors, IES determines the topic areas within which the WWC will conduct intervention reviews. To date, focal topic areas include those that have applicability to a broad range of students or to particularly important subpopulations; broad policy relevance; and at least a moderate volume of studies examining the effectiveness of specific, identifiable interventions.
In order to get new topic area reviews up and running quickly, a review team may conduct a quick start search, which focuses on a limited number of interventions. These interventions are identified by content expert recommendations of interventions with a large body of causal evidence likely to be of interest to educators, supplemented by interventions from key literature reviews and/or other topic areas meeting the same criteria.
After the initial search, a review team conducts a broad topic search to assess the literature related to a review topic. The goal is to identify all interventions that have been used to address the research questions of the review. Broad topic searches utilize a larger list of sources and broader set of search parameters than those used in a quick start search. The review team, in collaboration with the content expert, develops a list of sources to be searched as well as search parameters.
A review team will conduct an intervention-specific search to go “deep” in the literature of a particular intervention. The goal is to identify all publications on a particular intervention. Even if the review team has conducted a broad topic search, it must conduct an intervention-specific search before drafting a report on a given intervention.
The process for prioritizing interventions for review is based on a standard scoring system and is conducted when new topic areas are established and annually for ongoing reviews. Using information in the title and the abstract or introduction, the review coordinator scores the study based on research design and sample size. Only studies that relate to the review protocol of the

What Works Clearinghouse Procedures and Standards Handbook, Version 3.0
B.2
topic area (those that include the correct age range, achievement outcome measured, etc.) are considered eligible and are included in the ranking process. The scores of all the studies are combined for each intervention with a weighting factor based on whether there is an existing intervention report and its release date. Interventions with the highest scores are prioritized for review. The scoring criteria are presented below.
Study Criterion 1: Internal Validity
• Randomized controlled trial—3 points
• Regression discontinuity design or single-case design—2 points
• Quasi-experimental design—1 point
• None of the above—0 points
Study Criterion 2: Size
• The study receives one additional point if the study is large, defined as greater than 250 children or 10 classrooms. If the study size is not clear, the study does not receive any additional points.
After summing the scores across all studies within an intervention, the resulting score is multiplied by an intervention weight. The intervention weight is based on whether there is an existing intervention report and its release date.
• An intervention with no prior report gets a weight of 3.
• An intervention with a prior report gets a weight of [1 + 0.1*(current year – report release date)]2. For example, an intervention being prioritized in 2011 that had a report released in 2009 would get a weight of [1 + 0.1*(2011 – 2009)]2 = 1.44.
Interventions are then prioritized for review based on the final scoring, with higher scores receiving higher prioritization.
The WWC also examines the “Google trend” for the top 10 interventions identified through the scoring process. Determining which interventions are being searched using the Google search engine provides a sense of the interventions of interest to the general public.
B. Prioritizing Topics for Practice Guides
Practice guide topics are selected based on their potential to improve important student outcomes, their applicability to a broad range of students or to particularly important subpopulations, their policy relevance, the perceived demand within the education community, and the availability of rigorous research to support recommendations. In addition, IES may request that the WWC produce a practice guide on a particular issue. Suggestions for practice guide topics are welcomed. To suggest a topic, visit http://ies.ed.gov/ncee/wwc/ContactUs.aspx.
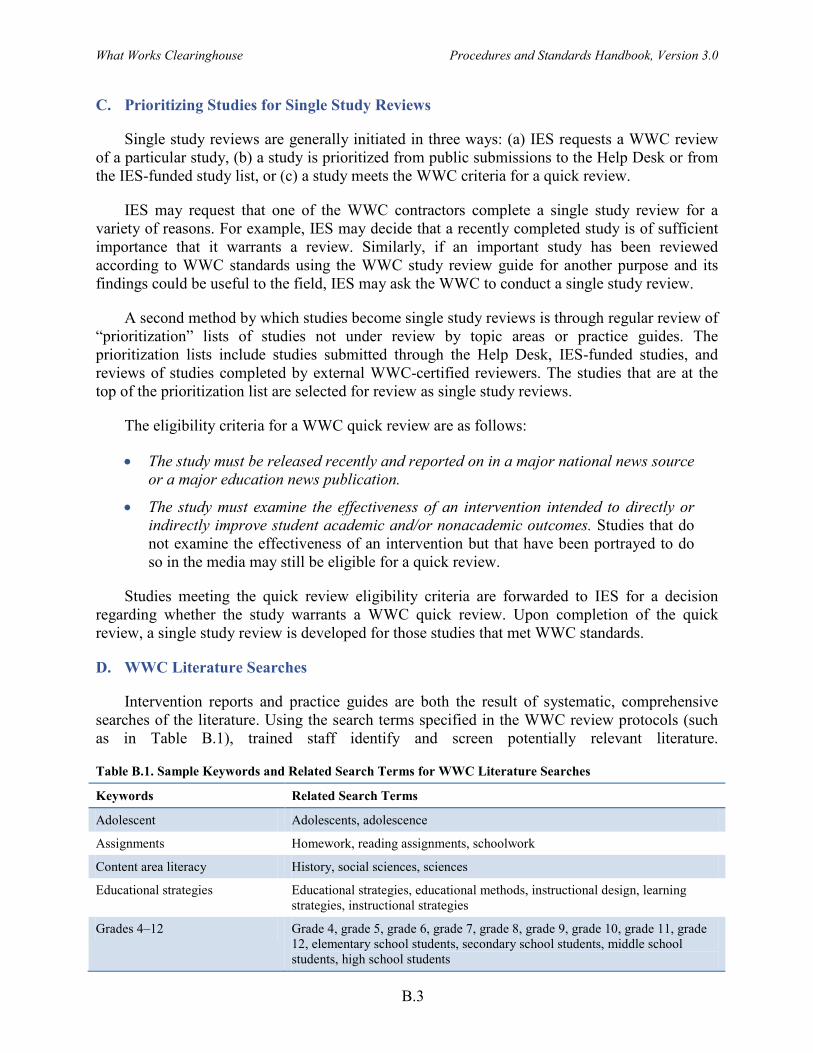
What Works Clearinghouse Procedures and Standards Handbook, Version 3.0
B.3
C. Prioritizing Studies for Single Study Reviews
Single study reviews are generally initiated in three ways: (a) IES requests a WWC review of a particular study, (b) a study is prioritized from public submissions to the Help Desk or from the IES-funded study list, or (c) a study meets the WWC criteria for a quick review.
IES may request that one of the WWC contractors complete a single study review for a variety of reasons. For example, IES may decide that a recently completed study is of sufficient importance that it warrants a review. Similarly, if an important study has been reviewed according to WWC standards using the WWC study review guide for another purpose and its findings could be useful to the field, IES may ask the WWC to conduct a single study review.
A second method by which studies become single study reviews is through regular review of “prioritization” lists of studies not under review by topic areas or practice guides. The prioritization lists include studies submitted through the Help Desk, IES-funded studies, and reviews of studies completed by external WWC-certified reviewers. The studies that are at the top of the prioritization list are selected for review as single study reviews.
The eligibility criteria for a WWC quick review are as follows:
• The study must be released recently and reported on in a major national news source or a major education news publication.
• The study must examine the effectiveness of an intervention intended to directly or indirectly improve student academic and/or nonacademic outcomes. Studies that do not examine the effectiveness of an intervention but that have been portrayed to do so in the media may still be eligible for a quick review.
Studies meeting the quick review eligibility criteria are forwarded to IES for a decision regarding whether the study warrants a WWC quick review. Upon completion of the quick review, a single study review is developed for those studies that met WWC standards.
D. WWC Literature Searches
Intervention reports and practice guides are both the result of systematic, comprehensive searches of the literature. Using the search terms specified in the WWC review protocols (such as in Table B.1), trained staff identify and screen potentially relevant literature.
Table B.1. Sample Keywords and Related Search Terms for WWC Literature Searches
Keywords Related Search Terms
Adolescent Adolescents, adolescence
Assignments Homework, reading assignments, schoolwork
Content area literacy History, social sciences, sciences
Educational strategies Educational strategies, educational methods, instructional design, learning strategies, instructional strategies
Grades 4–12 Grade 4, grade 5, grade 6, grade 7, grade 8, grade 9, grade 10, grade 11, grade 12, elementary school students, secondary school students, middle school students, high school students

Procedures and Standards Handbook, Version 3.0 What Works Clearinghouse
Table B.1 (continued)
B.4
Instructional effectiveness Instructional improvement, program effectiveness, administrator effectiveness, curriculum evaluation, educational quality, outcomes of education, instructional media
Instructional materials Courseware, learning modules, textbooks, workbooks, protocol materials, reading materials, educational games, educational resources, material development, instructional media
Intervention Intervention, educational therapy, practice, curricul*, approach, program, technique, strateg*, train*, instruct*, teach*
Literacy Reading development, literacy programs, reading, literacy
Literacy instruction Basal reading, remedial reading, reading instruction, literacy programs, reading education, literacy education
Phonics Phonics, phonetics, aural learning, word study skills
Reading achievement Reading achievement, reading failure, achievement gains, academic achievement, reading improvement, speech improvement, improvement programs, success
Reading comprehension Reading comprehension, comprehension, reading strategies, reading rate, verbal comprehension
Reading fluency Reading fluency, readability
Reading skills Language skills, reading ability, reading speed, sight vocabulary, word recognition
Study design Control group, random, simultaneous treatment, comparison group, regression discontinuity, matched group, baseline, ABAB design, treatment, experiment, meta analysis/meta-analysis, evaluation, impact, effectiveness, causal, posttest/post-test, pretest/pre-test, quasi-experimental design, single case design, randomized controlled trial, alternating treatment, single subject
Vocabulary development Vocabulary development, lexicography, verbal development, vocabulary building, vocalization, communication, oral communication, verbal communication
Note: This illustrative table is drawn from the Adolescent Literacy Review Protocol, version 2.0, found at http://ies.ed.gov/ncee/wwc/PDF/adlit_protocol_v2.pdf. The asterisk (*) in the related search term list allows the truncation of the term so that the search returns any word that begins with the specified letters.
Table B.2 displays a standard set of databases used during this process. Additional databases are listed in the topic area review protocol.
Table B.2. General Sources: Electronic Databases
Database Description
Academic Search Premier
The multidisciplinary full text database contains peer-reviewed full text journals for more than 4,600 journals, including nearly 3,900 peer-reviewed titles and indexing and abstracts for more than 8,500 journals.
EconLit The American Economic Association’s electronic database is the world’s foremost source of references to economic literature. There are more than 1.1 million records available.
Education Research Complete
The world’s largest and most complete collection of full text education journals, ERC provides indexing and abstracts for more than 2,300 journals and full text for approximately 1,400 journals and 550 books and monographs.

Procedures and Standards Handbook, Version 3.0 What Works Clearinghouse
Table B.2 (continued)
B.5
E-Journals The E-Journals database provides article-level access for thousands of e-journals available through EBSCOhost and EBSCO Subscription Services.
ERIC Funded by the U.S. Department of Education, the Education Resource Information Center provides access to education literature and resources, including information from journals indexed in the Current Index of Journals in Education and Resources in Education Index. ERIC provides ready access to education literature to support the use of educational research and information to improve practice in learning, teaching, educational decision making, and research.
ProQuest Dissertations & Theses
Providing access to the world’s most comprehensive collection of dissertations and theses, this is the database of record for graduate research, with more than 2.4 million dissertations and theses included from around the world.
PsycINFO PsycINFO contains more than 1.8 million citations and summaries of journal articles, book chapters, books, dissertations, and technical reports, all in the field of psychology. Journal coverage includes international material selected from more than 1,700 periodicals in more than 30 languages. More than 60,000 records are added each year.
SAGE Journals Online Provides access to the full text of articles in more than 500 leading journals published by SAGE on topics relating to psychology, early childhood, education, labor, statistics, and survey methodology.
Scopus The world’s largest abstract and citation database of peer-reviewed literature and quality web sources in the scientific, technical, medical, and social sciences, it covers more than 19,000 titles, articles in press, conference proceedings, and e-books.
SocINDEX The world’s most comprehensive and highest quality sociology research database features more than 2 million records and includes extensive indexing for books/monographs, conference papers, and other nonperiodical content sources in addition to informative abstracts for more than 1,300 “core” coverage journals.
WorldCat WorldCat is the world’s largest network of library content and services, allowing users to simultaneously search the catalogues of more than 10,000 libraries for access to 1.5 billion books, articles, CDs, DVDs, and more.
The WWC also routinely searches websites of core and topic-relevant organizations to collect potentially relevant studies. The standard set of websites that is searched to identify studies appears in Table B.3, and a set of targeted sources is listed in Table B.4. Additional websites may be listed in the review protocol.
Table B.3. General Sources: Websites
Abt Associates Hoover Institution
Alliance for Excellent Education Mathematica Policy Research
American Education Research Association MDRC
American Enterprise Institute National Association of State Boards of Education
American Institutes of Research National Governors’ Association
Best Evidence Encyclopedia Policy Archive
Brookings Institution Policy Study Associates
Carnegie Corporation of New York RAND
Center for Research and Reform in Education Regional Education Laboratories
Congressional Research Service SRI

What Works Clearinghouse Procedures and Standards Handbook, Version 3.0
Table B.3 (continued)
B.6
Government Accountability Office Thomas B. Fordham Institute
Grants/contracts awarded by IES Urban Institute
Heritage Foundation
Table B.4. Targeted Sources: Electronic Databases or Websites
After-School Alliance Learning Disabilities Association of America
American Speech-Language-Hearing Association Linguistic Society of America
Campbell Collaboration Natl. Association for Bilingual Education
Carnegie Corporation for the Advancement of Teaching Natl. Association of State Directors of Career Tech. Ed.
Center for Social Organization of Schools Natl. Association of State Directors of Special Education
Chapin Hall Center for Children, University of Chicago Natl. Autism Center - National Standards Project
CINAHL Natl. Center for Learning Disabilities
Cochrane Central Register of Controlled Trials Natl. Center on Response to Intervention
Cochrane Database of Systematic Reviews Natl. Center on Secondary Education and Transition
Council for Exceptional Children Natl. College Access Network
Council for Learning Disabilities Natl. Dissemination Center for Children with Disabilities
Database of Abstracts of Reviews of Effects Natl. Dropout Prevention Center/Network
Florida Center for Reading Research Natl. Institute on Out-of-School Time at Wellesley
Harvard Family Research Project NBER Working Papers
Institute for Higher Education Policy Teachers of English to Speakers of Other Languages
Institute for Public Policy and Social Research TA Ctr. on Social Emotional Interv. for Young Children
To determine whether new research is being mentioned in major news sources, and thus potentially eligible for a quick review, the WWC monitors major news sources, news clippings, news aggregator services, and blogs (Table B.5).
Table B.5. Media Sources Monitored to Identify Studies Eligible for Quick Review
The Arizona Republic (Phoenix) The Milwaukee Journal Sentinel
Arkansas Democrat-Gazette The New York Post
The Atlanta Journal and Constitution The New York Times
The Baltimore Sun Newsday
The Boston Globe The Oklahoman
The Boston Herald The Orange County Register
The Buffalo News The Oregonian
The Charlotte Observer Orlando Sentinel
Chicago Sun-Times The Philadelphia Daily News
Chicago Tribune The Philadelphia Inquirer
The Christian Science Monitor Pittsburgh Post-Gazette
The Cincinnati Enquirer The Plain Dealer (Cleveland)
The Columbus Dispatch Rocky Mountain News (Denver)
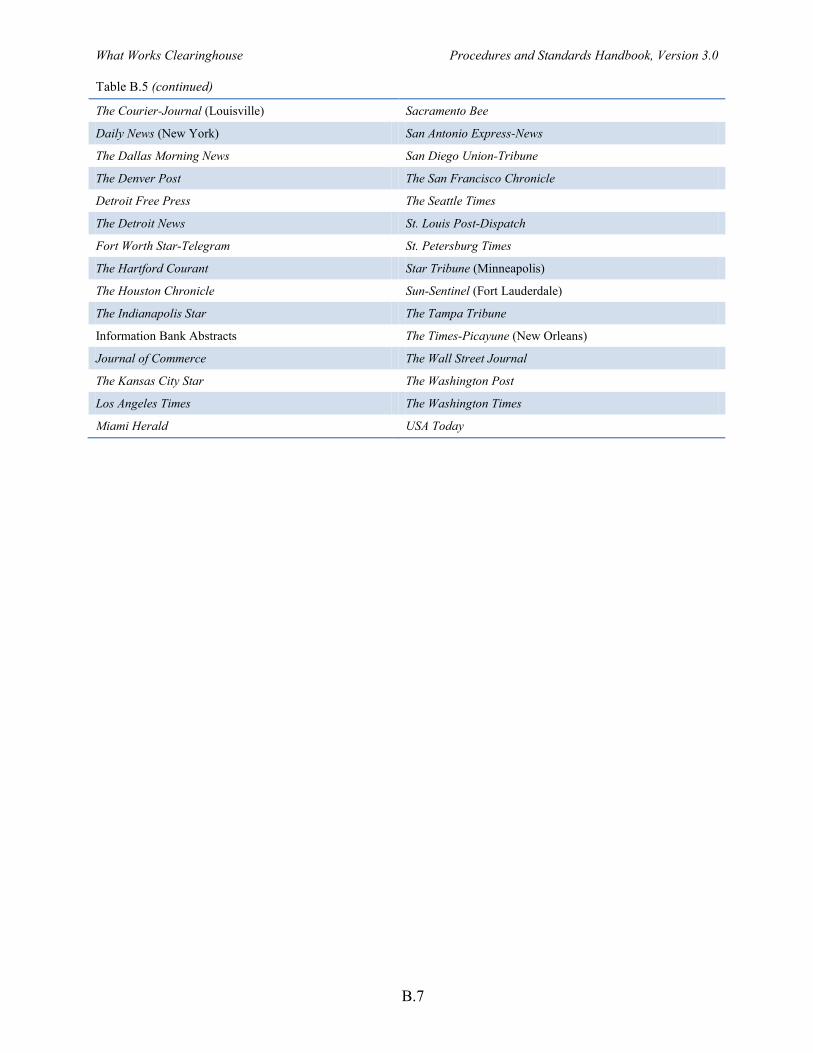
What Works Clearinghouse Procedures and Standards Handbook, Version 3.0
Table B.5 (continued)
B.7
The Courier-Journal (Louisville) Sacramento Bee
Daily News (New York) San Antonio Express-News
The Dallas Morning News San Diego Union-Tribune
The Denver Post The San Francisco Chronicle
Detroit Free Press The Seattle Times
The Detroit News St. Louis Post-Dispatch
Fort Worth Star-Telegram St. Petersburg Times
The Hartford Courant Star Tribune (Minneapolis)
The Houston Chronicle Sun-Sentinel (Fort Lauderdale)
The Indianapolis Star The Tampa Tribune
Information Bank Abstracts The Times-Picayune (New Orleans)
Journal of Commerce The Wall Street Journal
The Kansas City Star The Washington Post
Los Angeles Times The Washington Times
Miami Herald USA Today

What Works Clearinghouse Procedures and Standards Handbook, Version 3.0
C.1
C. THE WWC STUDY REVIEW PROCESS
In 2011, after an evaluation of the process of using two reviewers to review every study (see Handbook Version 2.1, p. 11), the WWC implemented a streamlined review process for randomized controlled trials and quasi-experimental studies. This appendix describes the steps of the study review process. After eligible studies are identified through the comprehensive literature search (described in Appendix B), all studies adhere to the following review process.
Each study receives a first review, documented in a study review guide (SRG). The SRG and instructions can be accessed at http://ies.ed.gov/ncee/wwc/StudyReviewGuide.aspx.
• If the first reviewer determines that the study does not meet WWC standards, a senior reviewer for the topic area team examines the study and determines whether the reason for not meeting standards indicated by the first reviewer is correct.
o If the senior reviewer agrees with the first reviewer’s assessment, the master SRG is created and completed.
o If the senior reviewer disagrees, the study receives a second review.
• If the first reviewer determines that the study meets WWC standards or could meet standards with more data provided by the study author, the study receives a second review.
If a study receives a second review, it is conducted without knowledge of the previous review or rating so that it cannot be influenced by previous findings. After the second review is complete, the coordinator asks the second reviewer to compare his or her assessment with that of the first reviewer (or senior reviewer, in the event that he or she did not verify the first reviewer’s assessment).
• If the second reviewer and first (or senior) reviewer agree on their assessment of the study rating and the key components of the review, then a master SRG is created. Key components include the level of attrition, establishment of equivalence, which measures to include, and effect sizes. Minor discrepancies, such as those involving sample sizes, can be resolved without involvement of the topic area team leadership.
• If the reviewers disagree on the final study rating, the reason for the rating, or other key components of the review, discrepancies or uncertainties are brought to the lead methodologist for the team for resolution before a master SRG is created.
When necessary, the WWC contacts study authors to obtain information to complete the master SRG. This author query may ask for information related to sample characteristics, sample sizes, baseline statistics; outcome statistics; or other information on group formation, confounding factors, and outcome measures. The WWC may also ask for information about analyses referenced in the article but not presented, but the WWC does not ask for new analyses to be conducted. All information received through an author query that is used in a report is made available to the public and is documented in the final report.

What Works Clearinghouse Procedures and Standards Handbook, Version 3.0
D.1
D. PILOT REGRESSION DISCONTINUITY DESIGN STANDARDS
In 2009, the WWC convened a panel of experts to draft a pilot version of review standards for studies using a regression discontinuity design (RDD) approach. This appendix contains the pilot standards developed by this panel that were released in June 2010. As of the publication of this Handbook, the WWC standards for regression discontinuity designs are applied only to judge evidence from individual studies. The WWC has not determined whether or how findings from RDD studies will be incorporated into reports that combine findings across studies.1
Regression discontinuity designs are increasingly used by researchers with the goal of obtaining consistent estimates of the local average impacts of education-related interventions that are made available to individuals or groups on the basis of how they compare to a cutoff value on some known measure. For example, students may be assigned to a summer school program if they score below a cutoff value on a standardized test, or schools may be awarded a grant based on their score on an application. A consistent estimator of a parameter converges in probability to the true value of the parameter and, thus, is an asymptotically unbiased estimator.
Under an RDD, the effect of an intervention is estimated as the difference in mean outcomes between treatment and comparison group units at the cutoff, adjusting statistically for the relationship between the outcomes and the variable used to assign units to the intervention. The variable used to assign units to the intervention is commonly referred to as the “forcing” or “assignment” variable. A regression line (or curve) is estimated for the treatment group and similarly for the comparison group, and the difference in average outcomes between these regression lines at the cutoff value of the forcing variable is the estimate of the effect of the intervention. Stated differently, an effect occurs if there is a “discontinuity” in the two regression lines at the cutoff. This estimate pertains to average treatment effects for units right at the cutoff. RDDs generate consistent estimates of the effect of an intervention if (1) the relationship between the outcome and forcing variable is modeled appropriately (defined in Standard 4 below) and (2) the forcing variable was not manipulated to influence assignment to the intervention group.
This document presents criteria under which estimates of effects from RDD studies Meet WWC Pilot Regression Discontinuity Design Standards without Reservations and the conditions under which they Meet WWC Pilot Regression Discontinuity Design Standards with Reservations.
A. Assessing Whether a Study Qualifies as a Regression Discontinuity Design
A study qualifies as an RDD study if it meets the following criteria:
Treatment assignments are based on a forcing variable; units with scores at or above (or below) a cutoff value are assigned to the treatment group whereas units with scores on the other side of the cutoff are assigned to the comparison group. For example, an evaluation
1 The WWC is working with RDD experts to determine the best way to present regression discontinuity design
findings, both alone and in conjunction with group design findings.

What Works Clearinghouse Procedures and Standards Handbook, Version 3.0
D.2
of a tutoring program could be classified as an RDD if students with a reading test score at or below 30 are admitted to the program and students with a reading test score above 30 are not. As another example, a study examining the impacts of grants to improve teacher training in local areas could be considered an RDD if grants are awarded to only those sites with grant application scores that are at least 70. In some instances, RDDs may use multiple criteria to assign the treatment to study units. For example, a student may be assigned to an afterschool program if the student’s reading score is below 30 or the student’s math score is below 40. For ease of exposition, the remainder of this document will refer to one cutoff. As with randomized controlled trials, noncompliance with treatment assignment is permitted, but the study must still meet the criteria below to meet standards.
The forcing variable is ordinal and includes a minimum of nine unique values total and four or more unique values on either side of the cutoff. This condition is required to model the relationship between the outcomes and the forcing variable. The forcing variable should never be based on nonordinal categorical variables (e.g., gender or race). The analyzed data must also include at least four unique values of the forcing variable below the cutoff and four unique values above the cutoff.
The cutoff value of the forcing variable must not be used to assign study units to other interventions. The cutoff value for the forcing variable must not be used to assign members of the study sample to interventions other than the one being tested if those other interventions are also likely to affect the outcomes of interest. For example, free/reduced-price lunch (FRPL) status cannot be the basis of an RDD because FRPL is used as the eligibility criteria for a wide variety of services that also could affect student achievement. This criterion is necessary to ensure that the study can isolate the causal effects of the tested intervention from the effects of other interventions.
If a study claims to be based on an RDD but does not have these properties, the study does not meet standards as an RDD.
B. Possible Designations for Studies Using Regression Discontinuity Designs
Once a study is determined to be an RDD, the study can receive one of three designations based on the set of criteria described below.
1. Meets WWC Pilot Regression Discontinuity Design Standards without Reservations. To qualify, a study must meet each of the four individual standards listed below without reservations.
2. Meets WWC Pilot Regression Discontinuity Design Standards with Reservations. To qualify, a study must meet standards 1, 4, and either 2 or 3 with or without reservations.
3. Does Not Meet WWC Pilot Regression Discontinuity Design Standards. If a study fails to meet standard 1 or 4 or fails to meet both standards 2 and 3, then it does not meet standards.

What Works Clearinghouse Procedures and Standards Handbook, Version 3.0
D.3
Standard 1: Integrity of the Forcing Variable
A key condition for an RDD to produce consistent estimates of effects of an intervention is that there was no systematic manipulation of the forcing variable. This situation is analogous to the nonrandom manipulation of treatment and comparison group assignments under a randomized controlled trial. In an RDD, manipulation means that scores for some units were systematically changed from their true values to influence treatment assignments. With nonrandom manipulation, the true relationship between the outcome and forcing variable can no longer be identified, which could lead to inconsistent impact estimates.
Manipulation is possible if “scorers” have knowledge of the cutoff value and have incentives to change unit-level scores to ensure that some units are assigned to a specific research condition. Stated differently, manipulation could occur if the scoring and treatment assignment processes are not independent. It is important to note that manipulation of the forcing variable is different from treatment status noncompliance (which occurs if some treatment group members do not receive intervention services or some comparison group members receive embargoed services).
The likelihood of manipulation will depend on the nature of the forcing variable, the intervention, and the study design. For example, manipulation is less likely to occur if the forcing variable is a standardized test score than if it is a student assessment conducted by teachers who also have input into treatment assignment decisions. Manipulation is also unlikely in cases where the researchers determined the cutoff value using an existing forcing variable (e.g., a score from a test that was administered prior to the implementation of the study).
In all RDD studies, the integrity of the forcing variable should be established both institutionally and statistically.
Criterion A. The institutional integrity of the forcing variable should be established by an adequate description of the scoring and treatment assignment process. This description should indicate the forcing variable used; the cutoff value selected; who selected the cutoff (e.g., researchers, school personnel, curriculum developers); who determined values of the forcing variable (e.g., who scored a test);and when the cutoff was selected relative to determining the values of the forcing variable. This description must show that manipulation was unlikely because scorers had little opportunity or little incentive to change “true” scores in order to allow or deny specific individuals access to the intervention. If there is both a clear opportunity to manipulate scores and a clear incentive (e.g., in an evaluation of a math curriculum if a placement test is scored by the curriculum developer after the cutoff is known), then the study does not satisfy this standard.
Criterion B. The statistical integrity of the forcing variable should be demonstrated by using statistical tests found in the literature or a graphical analysis to establish the smoothness of the density of the forcing variable right around the cutoff. This is important to establish because there may be incentives for scorers to manipulate scores to make units just eligible for the treatment group (in which case, there may be an unusual mass of units near the cutoff). If a statistical test is provided, it should fail to reject the null hypothesis of continuity in the density of the forcing variable. If a graphical analysis is provided (such as a histogram or other type of density plot), there

What Works Clearinghouse Procedures and Standards Handbook, Version 3.0
D.4
should not be strong evidence of a discontinuity at the cutoff that is obviously larger than discontinuities in the density at other points (some small discontinuities may arise when the forcing variable is discrete). If both are provided, then the statistical test will take precedence, unless the statistical test indicates no discontinuity but the graphical analysis provides very strong evidence to the contrary.
To meet this standard without reservations, both criteria must be satisfied.
To meet this standard with reservations, one of the two criteria must be satisfied.
A study fails this standard if neither criterion is satisfied.
Standard 2: Attrition
An RDD study must report the number of students (teachers, schools, etc.) who were designated as treatment and comparison group samples and the proportion of the total sample (e.g., students, teachers, or schools in the treatment and comparison samples combined) with outcome data who were included in the impact analysis (i.e., response rates). Both overall attrition and attrition by treatment status must be reported.
To meet this standard without reservations, an RDD study must meet the WWC randomized controlled trial standards for attrition. The study authors can calculate overall and differential attrition either for the entire research sample or for only students near the cutoff value of the forcing variable.
A study fails this standard if attrition information is not available or if the above conditions are not met.
Standard 3: Continuity of the Outcome-Forcing Variable Relationship
To obtain a consistent impact estimate using an RDD, there must be strong evidence that in the absence of the intervention, there would be a smooth relationship between the outcome and the forcing variable at the cutoff score. This condition is needed to ensure that any observed discontinuity in the outcomes of treatment and comparison group units at the cutoff can be attributable to the intervention.
This smoothness condition cannot be checked directly, although there are two indirect approaches that should be used. The first approach is to test whether, conditional on the forcing variable, key baseline covariates that are correlated with the outcome variable (as identified in the review protocol for the purpose of establishing equivalence) are continuous at the cutoff. This means that the intervention should have no impact on baseline covariates at the cutoff. Particularly important baseline covariates for this analysis are preintervention measures of the key outcome variables (e.g., pretests). This requirement is waived for any key covariate that is used as the RDD forcing variable.
The second approach for assessing the smoothness condition is to use statistical tests or graphical analyses to examine whether there are discontinuities in the outcome-forcing variable relationship at values away from the cutoff. This involves testing for impacts at values of the forcing variable where there should be no impacts, such as the medians of points above or below

What Works Clearinghouse Procedures and Standards Handbook, Version 3.0
D.5
the cutoff value (Imbens & Lemieux, 2008). The presence of such discontinuities (impacts) would imply that the relationship between the outcome and the forcing variable at the cutoff may not be truly continuous, suggesting that observed impacts at the cutoff may not be due to the intervention.
Two criteria determine whether a study meets this standard.
Criterion A. Baseline (or prebaseline) equivalence on key covariates (as identified in the review protocol) should be demonstrated at the cutoff value of the forcing variable. This involves calculating an impact at the cutoff on the covariate of interest. If the attrition standard is met, this requirement is waived if the variable on which equivalence must be established is the forcing variable (e.g., a baseline test score). If the attrition standard is not met, and the forcing variable is a variable specified in the protocol as requiring equivalence for quasi-experimental designs or randomized controlled trials with high attrition, then equivalence must be shown on a variable that is highly correlated with the forcing variable (for example, a test score from an earlier year). Also, if the attrition standard is not met, this analysis must be conducted using only sample units with nonmissing values of the key outcome variable used in the study. If criterion A is waived, it can be regarded as satisfied.
Criterion B. There should be no evidence (using statistical tests or graphical analyses) of a discontinuity in the outcome-forcing variable relationship at values of the forcing variable other than the cutoff value, unless a satisfactory explanation of such a discontinuity is provided. An example of a “satisfactory explanation” is that the discontinuity corresponds to some other known intervention that was also administered using the same forcing variable but with a different cutoff value. Another example could be a known structural property of the assignment variable; for example, if the assignment variable is a construct involving the aggregation of both continuous and discrete components.
To meet this standard without reservations, both criteria must be satisfied.
A study fails this standard if either criterion is not satisfied.
Standard 4: Functional Form and Bandwidth
Unlike with randomized controlled trials, statistical modeling plays a central role in estimating impacts in an RDD study. The most critical aspects of the statistical modeling are (1) the functional form specification of the relationship between the outcome variable and the forcing variable and (2) the appropriate range of forcing variable values used to select the analysis sample (i.e., the bandwidth around the cutoff value). Five criteria determine whether a study meets this standard.
Criterion A. The average treatment effect for an outcome must be estimated using a statistical model that controls for the forcing variable. Other baseline covariates may also be included in the statistical models, although doing so is not required. For both bias and variance considerations, it is never acceptable to estimate an impact by comparing the mean outcomes of treatment and comparison group members without

What Works Clearinghouse Procedures and Standards Handbook, Version 3.0
D.6
adjusting for the forcing variable (even if there is a weak relationship between the outcome and forcing variable).
Criterion B. A graphical analysis displaying the relationship between the outcome and forcing variable—including a scatter plot and a fitted curve—must be included in the report. The display must be consistent with the choice of bandwidth and the functional form specification for the analysis. Specifically, (a) if the study uses a particular functional form for the outcome-forcing variable relationship, then the study should show graphically that this functional form fits the scatter plot well, and (b) if the study uses a local linear regression, then the scatter plot should show that the outcome-forcing variable relationship is indeed linear within the chosen bandwidth. Another way to assess whether the bandwidth or functional form was appropriately chosen is to measure the sensitivity of impacts to the inclusion of observations in the tails of the forcing variable distribution. However, such a sensitivity analysis is not a requirement of the standard, nor is conducting such an analysis a substitute for the graphical analyses described in the standard.
Criterion C. The study must provide evidence that an appropriate parametric, semi-parametric, or nonparametric model was fit to the data. For a parametric approach, the adopted functional form (e.g., a polynomial specification) must be shown to be the best fit to the data using statistical significance of higher order terms or a recognized “best fit” criterion (e.g., the polynomial degree could be chosen to minimize the Akaike Information Criteria). Alternatively, a local regression or related nonparametric approach can be used, where the chosen bandwidth is justified using an approach such as cross-validation (or other similar approaches found in the literature). In the event that competing models are plausible, evidence of the robustness of impact findings to alternative model specifications should be provided.
Criterion D. Any constraints on the relationship between the outcome and the forcing variable (e.g., constraining the slope of the relationships to be the same on both sides of the cutoff) need to be supported by either a statistical test or graphical evidence.
Criterion E. If the reported impact is an average of impacts across multiple sites (e.g., a different cutoff or forcing variable is used in each site), each site impact should be estimated separately. The model used in each site should be justified using the criteria discussed above.
To meet this standard without reservations, all five of the criteria must be satisfied.
To meet this standard with reservations, criteria A and D must be satisfied. In addition, either B or C must also be satisfied.
A study fails this standard if criterion A is not satisfied, criterion D is not satisfied, or both criteria B and C are not satisfied.

What Works Clearinghouse Procedures and Standards Handbook, Version 3.0
D.7
C. Reporting Requirement Involving Clustering
In RDD studies, a unique type of clustering can occur when multiple units have the same value of the assignment variable. This type of clustering can happen when an assignment variable is not truly continuous. For example, test scores are not truly continuous—they often have a finite number of unique values because every test has a finite number of questions. Because all units with the same value of the assignment variable will be assigned to the same treatment condition, this situation is analogous to clustered random assignment in a randomized controlled trial. Lee and Card (2008) characterize this type of clustering effect in RDD studies as “random misspecification error.”
As is the case in randomized controlled trials, clustering of students should not cause biased estimates of the impact of the intervention, so if study authors do not appropriately account for the clustering of students, a study can still meet WWC standards if it meets the standards described above. However, because the statistical significance of findings is used for the rating of the effectiveness of an intervention, study authors must account for clustering using an appropriate method (e.g., the methods proposed in Lee & Card, 2008) in order for findings reported by the author to be included in the rating of effectiveness. If the authors do not account for clustering, then the WWC will not rely on the statistical significance of the findings from the study. However, the findings can still be included as “substantively important” if the effect size is 0.25 standard deviations or greater.
Study authors may also demonstrate that clustering of students into unique test score values does not require adjustments in the calculation of standard errors. This can be done by showing that the forcing variable is continuous around the cutoff and there is no clustering of observations around specific scores.
References
Imbens, G., & Lemieux, T. (2008). Regression discontinuity designs: A guide to practice. Journal of Econometrics, 142(2), 615–635.
Lee, D., & Card, D. (2008). Regression discontinuity inference with specification error. Journal of Econometrics, 142(2), 655–674.

What Works Clearinghouse Procedures and Standards Handbook, Version 3.0
E.1
E. PILOT SINGLE-CASE DESIGN STANDARDS
In 2009, the WWC convened a panel of experts to draft a pilot version of review standards for studies using a single-case design (SCD) approach. This appendix contains an updated version of the pilot standards developed by this panel that were released in June 2010. As of the publication of this Handbook, the WWC standards for single-case designs are applied only to judge evidence from individual studies. The WWC has not determined whether or how findings from SCD studies will be incorporated into reports that combine findings across studies.2
These standards are intended to guide WWC reviewers in identifying and evaluating single-case designs. If a study is an eligible SCD, it is reviewed using the study rating criteria to determine whether it receives a rating of Meets WWC Pilot Single-Case Design Standards without Reservations, Meets WWC Pilot Single-Case Design Standards with Reservations, or Does Not Meet WWC Pilot Single-Case Design Standards. A study that meets standards is then reviewed using visual analysis to determine whether it provides Strong Evidence of a Causal Relation, Moderate Evidence of a Causal Relation, or No Evidence of a Causal Relation for each outcome.3 For studies that provide strong or moderate evidence of a causal relation, an effect size is calculated.
SCDs are identified by the following features:
• An individual case is the unit of intervention administration and data analysis. A case may be a single participant or a cluster of participants (e.g., a classroom or community).
• Within the design, the case can provide its own control for purposes of comparison. For example, the case’s series of outcome variables prior to the intervention is compared with the series of outcome variables during (and after) the intervention.
• The outcome variable is measured repeatedly within and across different conditions or levels of the independent variable. These different conditions are referred to as phases (e.g., first baseline phase, first intervention phase, second baseline phase, and second intervention phase).4
2 The WWC is working with SCD experts to determine the best way to present single-case findings, both alone
and in conjunction with group design findings. 3 This process results in a categorization scheme that is similar to that used for evaluating evidence credibility
by inferential statistical techniques (hypothesis testing, effect size estimation, and confidence interval construction) in traditional group designs.
4 In SCDs, the ratio of data points (measures) to the number of cases is usually large so as to distinguish SCDs from other longitudinal designs (e.g., traditional pretest/posttest and general repeated-measures designs). Although specific prescriptive and proscriptive statements would be difficult to provide here, what can be stated is that (1) parametric univariate repeated-measures analysis cannot be performed when there is only one experimental case; (2) parametric multivariate repeated-measures analysis cannot be performed when the number of cases is less than or equal to the number of measures; and (3) for both parametric univariate and multivariate repeated-measures analysis, standard large sample (represented here by large numbers of cases) statistical theory assumptions must be satisfied for the analyses to be credible (also see Kratochwill & Levin [2010]).

What Works Clearinghouse Procedures and Standards Handbook, Version 3.0
E.2
The standards for SCDs apply to a wide range of designs, including ABAB designs, multiple baseline designs, alternating and simultaneous intervention designs, changing criterion designs, and variations of these core designs like multiple probe designs. Even though SCDs can be augmented by including one or more independent comparison cases (i.e., a comparison group), in this document the standards address only the core SCDs and are not applicable to the augmented independent comparison SCDs.
A. Determining a Study Rating
If the study appears to be an SCD, the following rules are used to determine whether the study’s design Meets WWC Pilot Single-Case Design Standards without Reservations, Meets WWC Pilot Single-Case Design Standards with Reservations, or Does Not Meet WWC Pilot Single-Case Design Standards. In order to meet standards, the following design criteria must be present (illustrated in Figure E.1):
• The independent variable (i.e., the intervention) must be systematically manipulated, with the researcher determining when and how the independent variable conditions change.
• For each case, the outcome variable must be measured systematically over time by more than one assessor. The design needs to collect inter-assessor agreement in each phase and at least 20% of the data points in each condition (e.g., baseline, intervention) and the inter-assessor agreement must meet minimal thresholds.5 Inter-assessor agreement (commonly called inter-observer agreement) must be documented on the basis of a statistical measure of assessor consistency. Although there are more than 20 statistical measures to represent inter-assessor agreement (e.g., Berk, 1979; Suen & Ary, 1989), commonly used measures include percentage agreement (or proportional agreement) and Cohen’s kappa coefficient (Hartmann, Barrios, & Wood, 2004). According to Hartmann et al. (2004), minimum acceptable values of inter-assessor agreement range from 0.80 to 0.90 (on average) if measured by percentage agreement and at least 0.60 if measured by Cohen’s kappa.
• The study must include at least three attempts to demonstrate an intervention effect at three different points in time.6 The three demonstrations criterion is based on professional convention (Horner, Swaminathan, Sugai, & Smolkowski, 2012). More demonstrations further increase confidence in experimental control (Kratochwill & Levin, 2010).
5 Study designs where 20% of the total data points include inter-assessor agreement data, but where it is not
clear from the study text that 20% of the data points in each condition include inter-assessor agreement data, are determined to meet this design criterion, although the lack of full information will be documented. If the topic area team leadership determines that there are further exceptions to this standard, they will be specified in the topic or practice guide protocol. These determinations are based on content knowledge of the outcome variable.
6 Although atypical, there might be circumstances in which designs without three replications meet the standards. A case must be made by the topic area team leadership based on content expertise, and at least two WWC reviewers must agree with this decision.

What Works Clearinghouse Procedures and Standards Handbook, Version 3.0
E.3
Figure E.1. Study Rating Determinants for Single-Case Designs
Independent VariableThe independent variable is systematically manipulated, with the researcher
determining when and how the independent variable conditions change.
Inter-Assessor Agreement Each outcome is measured over time by more than one assessor, with inter-assessor agreement
collected in each phase and in 20% of data points in each condition and that meets minimal thresholds.
Reversal / Withdrawal
At tempts to Demonstrate Effect over Time and Data Points per Phase
≥ 4 phases with≥ 5 points
AND
AND
≥ 4 phases with3–4 points
≤ 3 phases or≤ 2 points
Multiple Baseline
≥ 6 phases with≥ 5 points
≥ 6 phases with3–4 points
≤ 5 phases or≤ 2 points
Alternating Treatment
≥ 5 points per condition with ≤ 2 points per phase
≥ 4 points per condition with ≤ 2 points per phase
≤ 3 points per condition with ≤ 2 points per phase
Meets WWC Pilot Single-Case Design
Standards with Reservations
Meets WWC Pilot Single-Case Design Standards without
Reservations
Does Not Meet WWC Pilot Single-CaseDesign Standards
• Phases must meet criteria involving the number of data points to qualify as an attempt to demonstrate an effect.7
7 If the topic area team leadership determines that there are exceptions to this standard, these will be specified
in the topic or practice guide protocol (e.g., extreme self-injurious behavior might warrant a lower threshold of only one or two data points).

What Works Clearinghouse Procedures and Standards Handbook, Version 3.0
E.4
o Reversal/withdrawal (AB). Must have a minimum of four phases per case with at least five data points per phase to Meet WWC Pilot Single-Case Design Standards without Reservations. Must have a minimum of four phases per case with at least three data points per phase to Meet WWC Pilot Single-Case Design Standards with Reservations. Any phases based on fewer than three data points cannot be used to demonstrate the existence or lack of an effect.
o Multiple baseline and multiple probe. Must have a minimum of six phases with at least five data points per phase to Meet WWC Pilot Single-Case Design Standards without Reservations. Must have a minimum of six phases with at least three data points per phase to Meet Pilot Single-Case Design Standards with Reservations. Any phases based on fewer than three data points cannot be used to demonstrate the existence or lack of an effect. Both designs implicitly require some degree of concurrence in the timing of their implementation across cases when the intervention is being introduced. Otherwise, these designs cannot be distinguished from a series of separate AB designs.
o Alternating treatment. Must have a minimum of five data points per condition (e.g., baseline, intervention) and at most two data points per phase to Meet WWC Pilot Single-Case Design Standards without Reservations. Must have four data points per condition and at most two data points per phase to Meet WWC Pilot Single-Case Design Standards with Reservations. Any phases based on more than two data points cannot be used to demonstrate the existence or lack of an effect because the design features rapid alternations between phases. When designs include multiple intervention comparisons (e.g., A versus B, A versus C, C versus B), each intervention comparison is rated separately.
Failure to meet any of these results in a study rating of Does Not Meet WWC Pilot Single-Case Design Standards. Multiple probe designs (a special case of multiple baselines) must meet additional criteria because baseline data points are intentionally missing:8 failure to meet any of these results in a study rating of Does Not Meet WWC Pilot Single-Case Design Standards.
• Initial preintervention sessions must overlap vertically. Within the first three sessions, the design must include three consecutive probe points for each case to Meet Pilot SCD Standards without Reservations and at least one probe point for each case to Meet Pilot SCD Standards with Reservations.
• Probe points must be available just prior to introducing the independent variable. Within the three sessions just prior to introducing the independent variable, the design must include three consecutive probe points for each case to Meet Pilot SCD Standards without Reservations and at least one probe point for each case to Meet Pilot SCD Standards with Reservations.
8 If the topic area team leadership determines that there are exceptions to these standards, they will be specified
in the topic or practice guide protocol (e.g., conditions when stable data patterns necessitate collecting fewer than three consecutive probe points just prior to introducing the intervention or when collecting overlapping initial preintervention points is not possible).

What Works Clearinghouse Procedures and Standards Handbook, Version 3.0
E.5
• Each case not receiving the intervention must have a probe point in a session where another case either (a) first receives the intervention or (b) reaches the prespecified intervention criterion. This point must be consistent in level and trend with the case’s previous baseline points.
B. Additional Consideration: Areas for Discretion
The topic area team leadership will (a) define the independent and outcome variables under investigation,9 (b) establish parameters for considering fidelity of intervention implementation,10 and (c) consider the reasonable application of the standards to the area and specify any deviations from the standards in that area protocol. Methodologists and content experts might need to make decisions about whether the design is appropriate for evaluating an intervention. For example, an intervention associated with a permanent change in participant behavior should be evaluated with a multiple baseline design rather than an ABAB design.
The methodologist will also consider the various threats to validity and how the researcher was able to address these concerns, especially when the standards do not necessarily mitigate the validity threat in question (e.g., testing, instrumentation). Note that the SCD standards apply to both observational measures and standard academic assessments. Similar to the approach with group designs, methodologists are encouraged to define the parameters associated with “acceptable” assessments in their protocols. For example, repeated measures with alternative forms of an assessment may be acceptable, and WWC psychometric criteria would apply. Topic area team leadership also might need to make decisions about particular studies. Several questions will need to be considered, such as (a) will generalization variables be reported; (b) will follow-up phases be assessed; (c) if more than one consecutive baseline phase is present, are these treated as one phase or two distinct phases; and (d) are multiple interventions conceptually distinct or multiple components of the same intervention.
C. Visual Analysis of Single-Case Research Results11
Single-case researchers traditionally have relied on visual analysis of the data to determine (a) whether evidence of a relation between an independent variable and an outcome variable exists and (b) the strength or magnitude of that relation (Hersen & Barlow, 1976; Kazdin, 1982; Kennedy, 2005; Kratochwill, 1978; Kratochwill & Levin, 1992; McReynolds & Kearns, 1983; Richards, Taylor, Ramasamy, & Richards, 1999; Tawney & Gast, 1984; White & Haring, 1980). An inferred causal relation requires that changes in the outcome measure resulted from manipulation of the independent variable. A causal relation is demonstrated if the data across all phases of the study document at least three instances of an effect at a minimum of three different points in time (as specified in the standards). An effect is documented when the data pattern in
9 Because SCDs are reliant on phase repetition and effect replication across participants, settings, and
researchers to establish external validity, specification of the intervention materials, procedures, and context of the research is particularly important within these studies (Horner et al., 2005).
10 Because interventions are applied over time, continuous measurement of implementation is a relevant consideration.
11 This section was prepared by Robert Horner, Thomas Kratochwill, and Samuel Odom.

What Works Clearinghouse Procedures and Standards Handbook, Version 3.0
E.6
one phase (e.g., an intervention phase) differs more than would be expected from the data pattern observed or extrapolated from the previous phase (e.g., a baseline phase; Horner et al., 2005).
1. Features Examined in Visual Analysis
To assess the effects within single-case designs, six features are used to examine within- and between-phase data patterns: (a) level, (b) trend, (c) variability, (d) immediacy of the effect, (e) overlap, and (f) consistency of data in similar phases (Fisher, Kelley, & Lomas, 2003; Hersen & Barlow, 1976; Kazdin, 1982; Kennedy, 2005; Morgan & Morgan, 2009; Parsonson & Baer, 1978). These six features are assessed individually and collectively to determine whether the results from a single-case study demonstrate a causal relation and are represented in the evidence rating.
Examination of the data within a phase is used (a) to describe the observed pattern of a unit’s performance and (b) to extrapolate the expected performance forward in time, assuming that no changes in the independent variable occur (Furlong & Wampold, 1981). The six visual analysis features are used collectively to compare the observed and projected patterns for each phase with the actual pattern observed after manipulation of the independent variable. This comparison of observed and projected patterns is conducted across all phases of the design (e.g., baseline to intervention, intervention to baseline, intervention to intervention).
• Level refers to the mean score for the data within a phase.
• Trend refers to the slope of the best-fitting straight line for the data within a phase.
• Variability refers to the range or standard deviation of data about the best-fitting straight line.
In addition to comparing the level, trend, and variability of data within each phase, the researcher also examines data patterns across phases by considering the immediacy of the effect, overlap, and consistency of data in similar phases.
• Immediacy of the effect refers to the change in level between the last three data points in one phase and the first three data points of the next. The more rapid (or immediate) the effect, the more convincing the inference that change in the outcome measure was due to manipulation of the independent variable. Delayed effects might actually compromise the internal validity of the design. However, predicted delayed effects or gradual effects of the intervention may be built into the design of the experiment that would then influence decisions about phase length in a particular study.
• Overlap refers to the proportion of data from one phase that overlaps with data from the previous phase. The smaller the proportion of overlapping data points (or conversely, the larger the separation), the more compelling the demonstration of an effect.
• Consistency of data in similar phases involves looking at data from all phases within the same condition (e.g., all “baseline” phases, all “peer-tutoring” phases) and examining the extent to which there is consistency in the data patterns from phases

What Works Clearinghouse Procedures and Standards Handbook, Version 3.0
E.7
with the same conditions. The greater the consistency, the more likely the data represent a causal relation.
These six features are assessed both individually and collectively to determine whether the results from a single-case study demonstrate a causal relation. Regardless of the type of SCD used in a study, visual analysis of level, trend, variability, immediacy of the effect, overlap, and consistency of data patterns across similar phases is used to assess whether the data demonstrate at least three indications of an effect at different points in time. If this criterion is met, the data are deemed to document a causal relation, and an inference may be made that change in the outcome variable is causally related to manipulation of the independent variable.
2. Steps of Visual Analysis
Our rules for conducting visual analysis involve four steps and the six features described above (Parsonson & Baer, 1978). The first step is documenting a predictable baseline pattern of data (e.g., student is reading with many errors, student is engaging in high rates of screaming). If a convincing baseline pattern is documented, then the second step consists of examining the data within each phase of the study to assess the within-phase pattern(s). The key question is to assess whether there are sufficient data with sufficient consistency to demonstrate a predictable pattern of responding. The third step in the visual analysis process is comparing the data from each phase with the data in the adjacent (or similar) phase to assess whether manipulation of the independent variable was associated with an “effect.” An effect is demonstrated if manipulation of the independent variable is associated with a predicted change in the pattern of the dependent variable. The fourth step in visual analysis is integrating all the information from all phases of the study to determine whether there are at least three demonstrations of an effect at different points in time (i.e., documentation of a causal or functional relation; Horner et al., in press).
The rationale underlying visual analysis in SCDs is that predicted and replicated changes in a dependent variable are associated with active manipulation of an independent variable. The process of visual analysis is analogous to the efforts in group-design research to document changes that are causally related to the introduction of the independent variable. In group-design inferential statistical analysis, a statistically significant effect is claimed when the observed outcomes are sufficiently different from the expected outcomes that they are deemed unlikely to have occurred by chance. In single-case research, a claimed effect occurs when three demonstrations of an effect are documented at different points in time. The process of making this determination, however, requires that the reader is presented with the individual unit’s raw data (typically in graphic format) and actively participates in the interpretation process.
Figures E.2 through E.9 provide examples of the visual analysis process for one common SCD, the ABAB design, using the proportion of 10-second observation intervals with child tantrums as the dependent variable and a tantrum intervention as the independent variable. The design is appropriate for interpretation because the ABAB design format allows the opportunity to assess a causal relation (e.g., to assess if there are three demonstrations of an effect at three different points in time, namely the B, A, and B phases following the initial A phase).
Step 1: The first step in the analysis is to determine whether the data in the Baseline 1 (first A) phase document that (a) the proposed concern/problem is demonstrated (e.g., tantrums occur too frequently) and (b) the data provide sufficient demonstration of a clearly defined (i.e.,

What Works Clearinghouse Procedures and Standards Handbook, Version 3.0
E.8
predictable) baseline pattern of responding that can be used to assess the effects of an intervention. This step is represented in the standards, because if a proposed concern is not demonstrated or a predictable pattern of the concern is not documented, the effect of the independent variable cannot be assessed. The data in Figure E.2 demonstrate a Baseline 1 phase with 11 sessions, with an average of 66% intervals with tantrums across these 11 sessions. The range of tantrums per session is from 50% to 75% with an increasing trend across the phase and the last three data points averaging 70%. These data provide a clear pattern of responding that would be outside socially acceptable levels and, if left unaddressed, would be expected to continue in the 50% to 80% range.
Figure E.2. Depiction of an ABAB Design
The two purposes of a baseline are to (a) document a pattern of behavior in need of change and (b) document a pattern that has a sufficiently consistent level and variability, with little or no trend, to allow comparison with a new pattern following intervention. Generally, stability of a baseline depends on a number of factors and the options the researcher has selected to deal with instability in the baseline (Hayes, Barlow, & Nelson-Gray, 1999). One question that often arises in single-case design research is how many data points are needed to establish baseline stability. First, the amount of variability in the data series must be considered. Highly variable data may require a longer phase to establish stability. Second, if the effect of the intervention is expected to be large and demonstrates a data pattern that far exceeds the baseline variance, a shorter baseline with some instability may be sufficient to move forward with intervention implementation. Third, the quality of measures selected for the study may impact how willing the researcher/reviewer is to accept the length of the baseline.
In terms of addressing an unstable baseline series, the researcher has the options of (a) analyzing and reporting the source of variability, (b) waiting to see whether the series stabilizes as more data are gathered, (c) considering whether the correct unit of analysis has been selected for measurement and if it represents the reason for instability in the data, and (d) moving forward with the intervention despite the presence of baseline instability. Professional standards for acceptable baselines are emerging, but the decision to end any baseline with fewer than three data points, or to end a baseline with an outlying data point, should be defended. In each case, it would be helpful for reviewers to have this information and/or contact the researcher to determine how baseline instability was addressed, along with a rationale.
Step 2: The second step in the visual analysis process is to assess the level, trend, and variability of the data within each phase and to compare the observed pattern of data in each phase with the pattern of data in adjacent phases. The horizontal lines in Figure E.3 illustrate the comparison of phase levels, and the lines in Figure E.4 illustrate the comparison of phase trends.

What Works Clearinghouse Procedures and Standards Handbook, Version 3.0
E.9
The upper and lower defining range lines in Figure E.5 illustrate the phase comparison for phase variability. In Figures E.3 through E.5, the level and trend of the data differ dramatically from phase to phase; however, changes in variability appear to be less dramatic.
Figure E.3. An Example of Assessing Level with Four Phases of an ABAB Design
Figure E.4. An Example of Assessing Trend in Each Phase of an ABAB Design
Figure E.5. Assess Variability Within Each Phase
Step 3: The information gleaned through examination of level, trend, and variability is supplemented by comparing the overlap, immediacy of the effect, and consistency of patterns in similar phases. Figure E.6 illustrates the concept of overlap. There is no overlap between the data in Baseline 1 (A1) and the data in Intervention 1 (B1). There is one overlapping data point (10%; session 28) between Intervention 1 (B1) and Baseline 2 (A2), and there is no overlap between Baseline 2 (A2) and Intervention 2 (B2).

What Works Clearinghouse Procedures and Standards Handbook, Version 3.0
E.10
Figure E.6. Consider Overlap Between Phases
Immediacy of the effect compares the extent to which the level, trend, and variability of the last three data points in one phase are distinguishably different from the first three data points in the next. The data in the ovals, squares, and triangles of Figure E.7 illustrate the use of immediacy of the effect in visual analysis. The observed effects are immediate in each of the three comparisons (Baseline 1 and Intervention 1, Intervention 1 and Baseline 2, and Baseline 2 and Intervention 2).
Figure E.7. Examine the Immediacy of Effect with Each Phase Transition
Consistency of similar phases examines the extent to which the data patterns in phases with the same (or similar) procedures are similar. The linked ovals in Figure E.8 illustrate the application of this visual analysis feature. Phases with similar procedures (Baseline 1 and Baseline 2, Intervention 1 and Intervention 2) are associated with consistent patterns of responding.
Figure E.8. Examine Consistency Across Similar Phases

What Works Clearinghouse Procedures and Standards Handbook, Version 3.0
E.11
Step 4: The final step of the visual analysis process involves combining the information from each of the phase comparisons to determine whether all the data in the design (data across all phases) meet the standard for documenting three demonstrations of an effect at different points in time. The bracketed segments in Figure E.9 (A, B, C) indicate the observed and projected patterns of responding that would be compared with actual performance. Because the observed data in the Intervention 1 phase are outside the observed and projected data pattern of Baseline 1, the Baseline 1 and Intervention 1 comparison demonstrates an effect (Figure E.9A). Similarly, because the data in Baseline 2 are outside the observed and projected patterns of responding in Intervention 1, the Intervention 1 and Baseline 2 comparison demonstrates an effect (Figure E.9B). The same logic allows for identification of an effect in the Baseline 2 and Intervention 2 comparison (Figure E.9C). Because the three demonstrations of an effect occur at different points in time, the full set of data in this study is considered to document a causal relation as specified in the standards.
Figure E.9A. Examine Observed and Projected Comparison Baseline 1 to Intervention 1
Figure E.9B. Examine Observed and Projected Comparison Intervention 1 to Baseline 2
Figure E.9C. Examine Observed and Projected Comparison Baseline 2 to Intervention 2

What Works Clearinghouse Procedures and Standards Handbook, Version 3.0
E.12
3. Characterizing Study Findings
For studies that meet standards, the following rules are used to determine whether the study provides Strong Evidence, Moderate Evidence, or No Evidence of a causal relationship for each outcome. In order to provide Strong Evidence, at least two WWC reviewers certified in visual (or graphical) analysis must verify that a causal relation was documented. Specifically, this is operationalized as at least three demonstrations of the intervention effect along with no noneffects by12
• Documenting the consistency of level, trend, and variability within each phase
• Documenting the immediacy of the effect, the proportion of overlap, and the consistency of the data across phases in order to demonstrate an intervention effect, and comparing the observed and projected patterns of the outcome variable
• Examining external factors and anomalies (e.g., a sudden change of level within a phase)
If an SCD does not provide three demonstrations of an effect, then there is No Evidence of a causal relationship. If a study provides three demonstrations of an effect and also includes at least one demonstration of a noneffect, there is Moderate Evidence of a causal relationship. The following characteristics must be considered when identifying a noneffect:
• Data within the baseline phase do not provide sufficient demonstration of a clearly defined pattern of responding that can be used to extrapolate the expected performance forward in time assuming no changes to the independent variable.
• Failure to establish a consistent pattern within any phase (e.g., high variability within a phase).
• Either long latency between introduction of the independent variable and change in the outcome variable or overlap between observed and projected patterns of the outcome variable between baseline and intervention phases makes it difficult to determine whether the intervention is responsible for a claimed effect.
• Inconsistent patterns across similar phases (e.g., an ABAB design in which the first time an intervention is introduced, the outcome variable data points are high; the second time an intervention is introduced, the outcome variable data points are low; and so on).
• Comparing the observed and projected patterns of the outcome variable between phases does not demonstrate evidence of a causal relation (i.e., there are not at least three demonstrations of an effect).
12 This section assumes that the demonstration of an effect will be established through visual analysis. As the
field reaches greater consensus about appropriate statistical analyses and quantitative effect size measures, new standards for effect demonstration will need to be developed.

What Works Clearinghouse Procedures and Standards Handbook, Version 3.0
E.13
When examining a multiple baseline design, also consider the extent to which the time in which a basic effect is initially demonstrated with one series (e.g., first five days following introduction of the intervention for Participant #1) is associated with change in the data pattern over the same time frame in the other series of the design (e.g., same five days for Participants #2, #3, and #4). If a basic effect is demonstrated within one series, and there is a change in the data patterns in the other series, the highest possible design rating is Moderate Evidence.
If there is either Strong Evidence or Moderate Evidence, then effect size estimation follows. Appropriate methods for calculating the effect size from a single-case design have not yet been developed. For the time being, the WWC review concludes with the evidence rating from visual analysis.
C. Rating for Single-Case Designs
When implemented with multiple design features (e.g., within- and between-case comparisons), single-case designs can provide a strong basis for causal inference (Horner et al., 2005). Confidence in the validity of intervention effects demonstrated within cases is enhanced by replication of effects across different cases, studies, and research groups (Horner & Spaulding, 2010). The results from single-case design studies will not be combined into a single summary rating unless they meet the following thresholds:13
• A minimum of five SCD studies examining the intervention that Meet WWC Pilot Single-Case Design Standards without Reservations or Meet WWC Pilot Single-Case Design Standards with Reservations.
• The SCD studies must be conducted by at least three different research teams with no overlapping authorship at three different institutions.
• The combined number of cases (i.e., participants, classrooms, etc.) totals at least 20.
References
Berk, R. A. (1979). Generalizability of behavioral observations: A clarification of interobserver agreement and interobserver reliability. American Journal of Mental Deficiency, 83, 460–472.
Fisher, W., Kelley, M., & Lomas, J. (2003). Visual aids and structured criteria for improving visual inspection and interpretation of single-case designs. Journal of Applied Behavior Analysis, 36, 387–406.
Furlong, M., & Wampold, B. (1981). Visual analysis of single-subject studies by school psychologists. Psychology in the Schools, 18, 80–86.
13 These are based on professional conventions. Future work with SCD meta-analysis can offer an empirical
basis for determining appropriate criteria, and these recommendations might be revised.

What Works Clearinghouse Procedures and Standards Handbook, Version 3.0
E.14
Hartmann, D. P., Barrios, B. A., & Wood, D. D. (2004). Principles of behavioral observation. In S. N. Haynes and E. M. Hieby (Eds.), Comprehensive handbook of psychological assessment. Vol. 3: Behavioral assessment (pp. 108–127). New York: John Wiley & Sons.
Hayes, S. C., Barlow, D. H., & Nelson-Gray, R. O. (1999). The scientist practitioner: Research and accountability in the age of managed care (2nd ed.). Needham Heights, MA: Allyn & Bacon.
Hersen, M., & Barlow, D. H. (1976). Single-case experimental designs: Strategies for studying behavior change. New York: Pergamon.
Horner, R. H., Carr, E. G., Halle, J., McGee, G., Odom, S., & Wolery, M. (2005). The use of single subject research to identify evidence-based practice in special education. Exceptional Children, 71(2), 165–179.
Horner, R., & Spaulding, S. (2010). Single-case research designs. In N. J. Salkind (Ed.) Encyclopedia of research design (pp. 1386-1394). Thousand Oaks, CA: Sage.
Horner, R., Swaminathan, H., Sugai, G., & Smolkowski, K. (2012). Expanding analysis and use of single-case research. Education and Treatment of Children, 35, 269-290.
Kazdin, A. E. (1982). Single-case research designs: Methods for clinical and applied settings. New York: Oxford University Press.
Kennedy, C. H. (2005). Single-case designs for educational research. Boston: Allyn and Bacon.
Kratochwill, T. R. (Ed.). (1978). Single subject research: Strategies for evaluating change. New York: Academic Press.
Kratochwill, T. R., & Levin, J. R. (Eds.). (1992). Single-case research design and analysis: New directions for psychology and education. Hillsdale, NJ: Erlbaum.
Kratochwill, T. R., & Levin, J. R. (2010). Enhancing the scientific credibility of single-case intervention research: Randomization to the rescue. Psychological Methods, 15, 124–144.
Morgan, D., & Morgan R., (2009). Single-case research methods for the behavioral and health sciences. Los Angeles: Sage.
McReynolds, L. & Kearns, K. (1983). Single-subject experimental designs in communicative disorders. Baltimore: University Park Press.
Parsonson, B., & Baer, D. (1978). The analysis and presentation of graphic data. In T. Kratochwill (Ed.) Single subject research (pp. 101–166). New York: Academic Press.
Richards, S. B., Taylor, R., Ramasamy, R., & Richards, R. Y. (1999). Single subject research: Applications in educational and clinical settings. Belmont, CA: Wadsworth.

What Works Clearinghouse Procedures and Standards Handbook, Version 3.0
E.15
Suen, H. K., & Ary, D. (1989). Analyzing quantitative behavioral observation data. Hillsdale, NJ: Erlbaum.
Tawney, J. W., & Gast, D. L. (1984). Single subject research in special education. Columbus, OH: C. E. Merrill.
White, O. R., & Haring, N. G. (1980). Exceptional teaching (2nd ed.). Columbus, OH: C. E. Merrill.
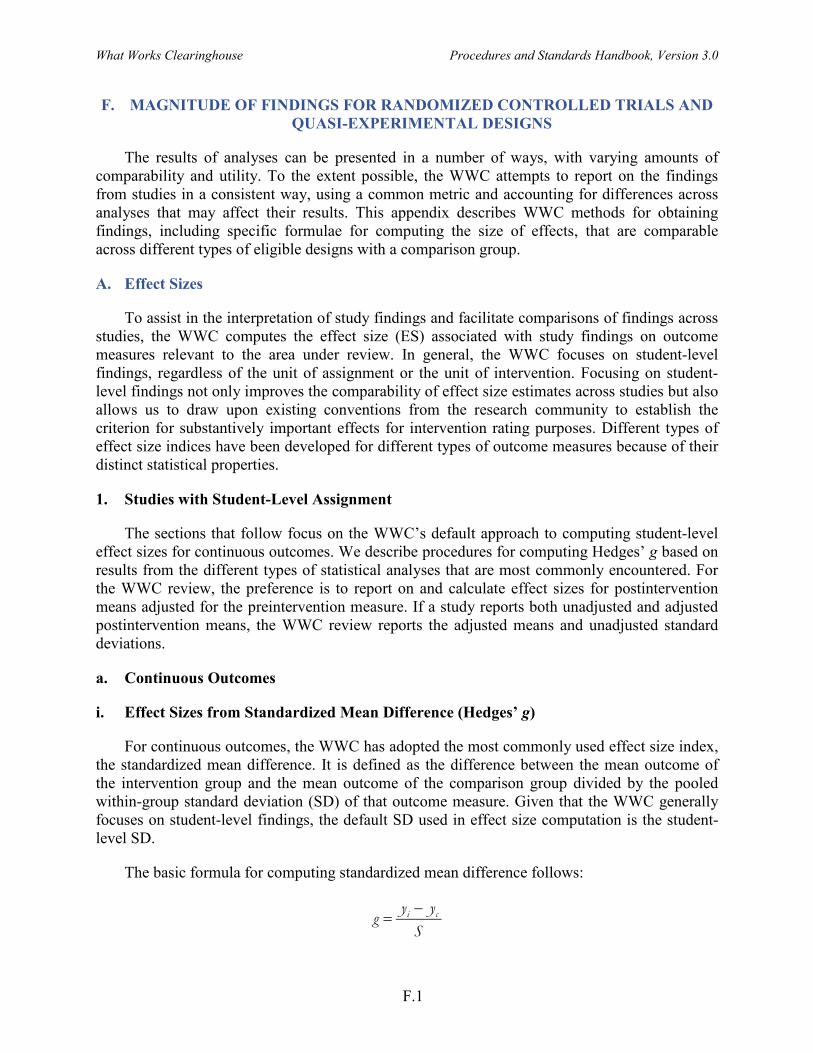
What Works Clearinghouse Procedures and Standards Handbook, Version 3.0
F.1
F. MAGNITUDE OF FINDINGS FOR RANDOMIZED CONTROLLED TRIALS AND QUASI-EXPERIMENTAL DESIGNS
The results of analyses can be presented in a number of ways, with varying amounts of comparability and utility. To the extent possible, the WWC attempts to report on the findings from studies in a consistent way, using a common metric and accounting for differences across analyses that may affect their results. This appendix describes WWC methods for obtaining findings, including specific formulae for computing the size of effects, that are comparable across different types of eligible designs with a comparison group.
A. Effect Sizes
To assist in the interpretation of study findings and facilitate comparisons of findings across studies, the WWC computes the effect size (ES) associated with study findings on outcome measures relevant to the area under review. In general, the WWC focuses on student-level findings, regardless of the unit of assignment or the unit of intervention. Focusing on student-level findings not only improves the comparability of effect size estimates across studies but also allows us to draw upon existing conventions from the research community to establish the criterion for substantively important effects for intervention rating purposes. Different types of effect size indices have been developed for different types of outcome measures because of their distinct statistical properties.
1. Studies with Student-Level Assignment
The sections that follow focus on the WWC’s default approach to computing student-level effect sizes for continuous outcomes. We describe procedures for computing Hedges’ g based on results from the different types of statistical analyses that are most commonly encountered. For the WWC review, the preference is to report on and calculate effect sizes for postintervention means adjusted for the preintervention measure. If a study reports both unadjusted and adjusted postintervention means, the WWC review reports the adjusted means and unadjusted standard deviations.
a. Continuous Outcomes
i. Effect Sizes from Standardized Mean Difference (Hedges’ g)
For continuous outcomes, the WWC has adopted the most commonly used effect size index, the standardized mean difference. It is defined as the difference between the mean outcome of the intervention group and the mean outcome of the comparison group divided by the pooled within-group standard deviation (SD) of that outcome measure. Given that the WWC generally focuses on student-level findings, the default SD used in effect size computation is the student-level SD.
The basic formula for computing standardized mean difference follows:
−= i cy yg
S

What Works Clearinghouse Procedures and Standards Handbook, Version 3.0
F.2
( ) ( )2 21 12
i i c c
i c
n s n sS
n n− + −
=+ −
where yi and yc are the means of the outcome for the intervention and comparison groups, respectively; ni and nc are the student sample sizes; si and sc are the student-level SDs; and S is the pooled within-group SD of the outcome at the student level. Combined, the resultant effect size is given by
( ) ( )−
=− + −
+ −
2 21 12
i c
i i c c
i c
y ygn s n s
n n
The effect size index thus computed is referred to as Hedges’ g. This index differs from the Cohen’s d index in that Hedges’ g uses the square root of degrees of freedom, N–k for k groups, for the denominator of the pooled within-group SD, S, whereas Cohen’s d uses the square root of sample size, N, to compute S (Rosenthal, 1994; Rosnow, Rosenthal, & Rubin, 2000). This index, however, has been shown to be upwardly biased when the sample size is small. Therefore, we have applied a simple correction for this bias developed by Hedges (1981), which produces an unbiased effect size estimate by multiplying the Hedges’ g by a factor of ω = [1 – 3/(4N – 9)], with N being the total sample size. Unless otherwise noted, Hedges’ g corrected for small-sample bias is the default effect size measure for continuous outcomes used in the WWC’s review.
( )( ) ( )
ω −=
− + −+ −
2 21 12
i c
i i c c
i c
y yg
n s n sn n
In certain situations, however, the WWC may present study findings using effect size measures other than Hedges’ g. For example, if the SD of the intervention group differs substantially from that of the comparison group, the lead methodologist may choose to use the SD of the comparison group instead of the pooled within-group SD as the denominator of the standardized mean difference and compute the effect size as Glass’s ∆ instead of Hedges’ g. The justification is that when the intervention and comparison groups have unequal variances, as they do when the variance of the outcome is affected by the intervention, the comparison group variance is likely to be a better estimate of the population variance than the pooled within-group variance (Cooper, 1998; Lipsey & Wilson, 2001). The WWC also may use Glass’s ∆ or other effect size measures used by the study authors to present study findings if there is not enough information available for computing Hedges’ g. These deviations from the default will be clearly documented in the WWC’s review process.
ii. Effect Sizes from Student-Level t-tests or ANOVA
For randomized controlled trials with low attrition, study authors may assess an intervention’s effects based on student-level t-tests or analyses of variance (ANOVA) without statistical adjustment for pretest or other covariates (see Chapter III). If the study authors reported posttest means and SD as well as sample sizes for both the intervention and comparison

What Works Clearinghouse Procedures and Standards Handbook, Version 3.0
F.3
groups, the computation of effect size will be straightforward using the standard formula for Hedges’ g.
When means or SD are not reported, the WWC can compute Hedges’ g based on t-test or ANOVA F-test results, if they were reported along with sample sizes for both the intervention group and the comparison group. For effect sizes based on t-test results,
i c
i c
n ng tn n
ω +=
.
For effect sizes based on ANOVA F-test results,
( )i c
i c
F n ng
n nω
+=
.
iii. Effect Sizes from Student-Level t-tests or ANCOVA
Analysis of covariance is a commonly used analytic method for quasi-experimental designs. It assesses the effects of an intervention while controlling for important covariates, particularly a pretest, that might confound the effects of the intervention. ANCOVA also is used to analyze data from randomized controlled trials so that greater statistical precision of parameter estimates can be achieved through covariate adjustment.
For study findings based on student-level ANCOVA, the WWC computes Hedges’ g as the covariate-adjusted mean difference divided by the unadjusted pooled within-group SD:
( )( ) ( )
ω ′ ′−=
− + −+ −
2 21 12
i c
i i c c
i c
y yg
n s n sn n
,
where yi’ and yc’ are the covariate-adjusted posttest means of the outcome for the intervention and comparison groups, respectively.
The use of covariate-adjusted mean difference as the numerator of g ensures that the effect size estimate is adjusted for any covariate difference between the intervention and the comparison groups that might otherwise bias the result. The use of unadjusted pooled within-group SD as the denominator of g allows comparisons of effect size estimates across studies by using a common metric (the population SD as estimated by the unadjusted pooled within-group SD) to standardize group mean differences.
A final note about ANCOVA-based effect size computation is that Hedges’ g cannot be computed based on the F-statistic from an ANCOVA. Unlike the F-statistic from an ANOVA, which is based on unadjusted within-group variance, the F-statistic from an ANCOVA is based on covariate-adjusted within-group variance. Hedges’ g, however, requires the use of unadjusted within-group SD. Therefore, we cannot compute Hedges’ g with the F-statistic from an

What Works Clearinghouse Procedures and Standards Handbook, Version 3.0
F.4
ANCOVA in the same way that we compute g with the F-statistic from an ANOVA. However, if the correlation between pre- and posttest, r, is known, we can derive Hedges’ g from the ANCOVA F-statistic as follows:
( )( )21i c
i c
F n n rg
n nω
+ −=
iv. Difference-in-Differences Adjustment
Study authors will occasionally report unadjusted group means on both pre- and posttest but not adjusted group means and adjusted group mean differences on the posttest. Absent information on the correlation between the pretest and the posttest, the WWC’s default approach is to compute the effect size numerator as the difference between the pre- and posttest mean difference for the intervention group and the pre- and posttest mean difference for the comparison group. Specifically,
( ) ( )( ) ( )
ω − − − =− + −
+ −
0 0
2 21 12
i i c c
i i c c
i c
y y y yg
n s n sn n
,
where yi0 and yc0 are the unadjusted pretest means for the intervention and comparison groups, respectively. This calculation is not an acceptable way to adjust for baseline differences in cases where they fall in the 0.05 to 0.25 standard deviation range for quasi-experimental designs and high-attrition randomized controlled trials because that must be done at the level of the unit of analysis.
This “difference-in-differences” approach to estimating an intervention’s effects, even though it takes into account the group difference in pretest, is not necessarily optimal because it is likely to either overestimate or underestimate the adjusted group mean difference, depending on which group performed better on the pretest. If the intervention group had a higher average pretest score than the comparison group, the difference-in-differences approach is likely to underestimate the adjusted group mean difference; otherwise, it is likely to overestimate the adjusted group mean difference. Moreover, this approach does not provide a means for adjusting the statistical significance of the adjusted mean difference to reflect the covariance between the pretest and the posttest. Nevertheless, it yields a reasonable estimate of the adjusted group mean difference, which is equivalent to what would have been obtained from an analysis of gain scores, a commonly used alternative to the covariate adjustment-based approach to testing an intervention’s effect.
Another limitation of the difference-in-differences approach is that it assumes the pre- and posttests are the same test. Otherwise, the means on the two types of tests might not be comparable, and it might not be appropriate to compute the difference for each group. When different pre- and posttests were used and only unadjusted means were reported, the effect size of the difference between the two groups on the pretest and posttest will be computed separately using Hedges’ g, with the final effect size given by their difference:

What Works Clearinghouse Procedures and Standards Handbook, Version 3.0
F.5
post preg g g= − .
The difference-in-differences approach presented also assumes that the correlation between the pre- and posttest is unknown. However, in some areas of educational research, empirical data on the relationship between pre- and posttest may be available. If such data are dependable, the lead methodologist may choose to use the empirical relationship to estimate the adjusted group mean difference rather than the difference-in-differences approach. If the empirical relationship is dependable, the covariate-adjusted estimates of the intervention’s effects will be less biased than those based on the difference-in-differences approach. A methodologist who chooses to compute effect size using an empirical relationship between pre- and posttest must provide an explicit justification for the choice as well as evidence of the credibility of the empirical relationship. Computationally, if the pre- and posttests have a correlation of r, then
( ) ( )( ) ( )
ω − − − =− + −
+ −
0 0
2 21 12
i i c c
i i c c
i c
y y r y yg
n s n sn n
.
When the difference-in-differences adjustment is used, the statistical significance will be based on the adjusted effect. For example, consider a preintervention difference of 0.2 on an achievement test. If the postintervention difference also were 0.3, the difference-in-differences adjusted effect would be 0.1. Subsequently, the statistical significance would be based on the adjusted finding of 0.1 rather than the unadjusted finding of 0.3.
b. Dichotomous Outcomes
i. Effect Sizes from Log Odds Ratio
Although not as common as continuous outcomes, dichotomous outcomes are sometimes used in studies of educational interventions. Examples include dropping out versus staying in school, grade promotion versus retention, and passing versus failing a test. In such cases, a group mean difference appears as a difference in the probability of the occurrence of an event. The effect size measure of choice for dichotomous outcomes is the odds ratio, which has many statistical and practical advantages over alternative effect size measures such as the difference between two probabilities, the ratio of two probabilities, and the phi coefficient (Fleiss, 1994; Lipsey & Wilson, 2001).
The odds ratio builds on the notion of odds. For a given study group, the odds for the occurrence of an event is defined as follows:
( )1pOdds
p=
−
where p is the probability of the occurrence of an event within the group. The odds ratio (OR) is simply the ratio between the odds for the two groups compared:
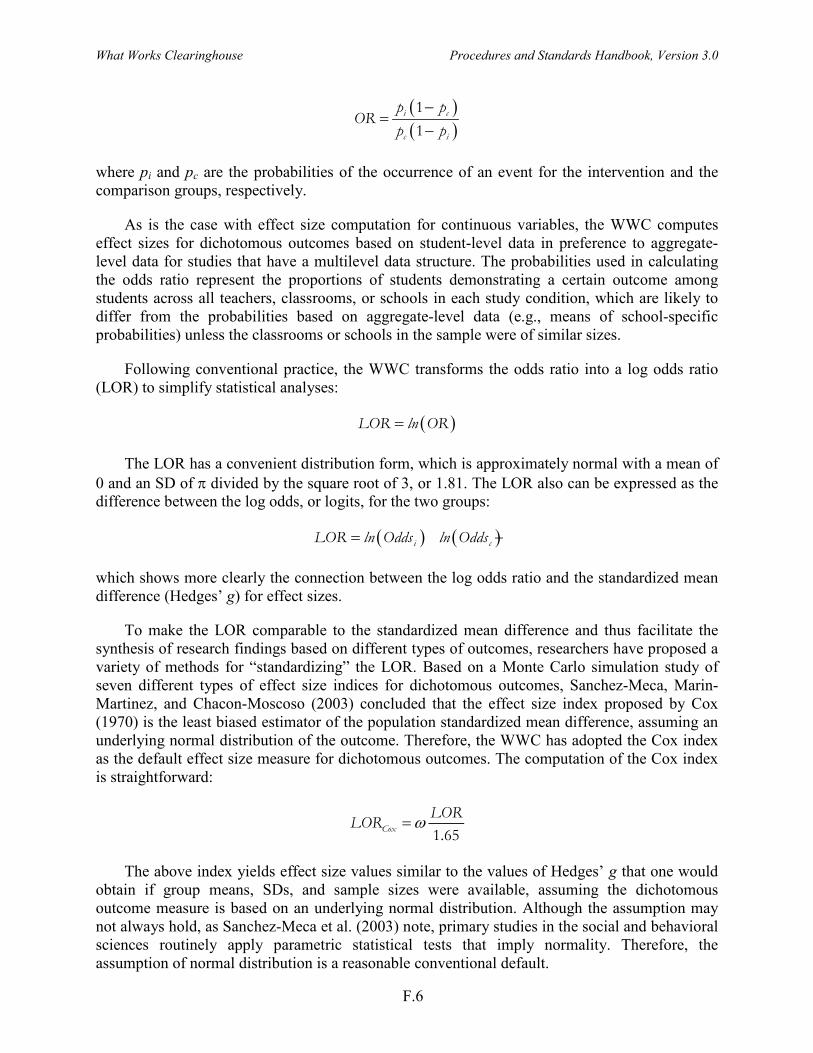
What Works Clearinghouse Procedures and Standards Handbook, Version 3.0
F.6
( )( )11
i c
c i
p pOR
p p−
=−
where pi and pc are the probabilities of the occurrence of an event for the intervention and the comparison groups, respectively.
As is the case with effect size computation for continuous variables, the WWC computes effect sizes for dichotomous outcomes based on student-level data in preference to aggregate-level data for studies that have a multilevel data structure. The probabilities used in calculating the odds ratio represent the proportions of students demonstrating a certain outcome among students across all teachers, classrooms, or schools in each study condition, which are likely to differ from the probabilities based on aggregate-level data (e.g., means of school-specific probabilities) unless the classrooms or schools in the sample were of similar sizes.
Following conventional practice, the WWC transforms the odds ratio into a log odds ratio (LOR) to simplify statistical analyses:
( )=LOR ln OR
The LOR has a convenient distribution form, which is approximately normal with a mean of 0 and an SD of π divided by the square root of 3, or 1.81. The LOR also can be expressed as the difference between the log odds, or logits, for the two groups:
( ) ( )= −i cLOR ln Odds ln Odds
which shows more clearly the connection between the log odds ratio and the standardized mean difference (Hedges’ g) for effect sizes.
To make the LOR comparable to the standardized mean difference and thus facilitate the synthesis of research findings based on different types of outcomes, researchers have proposed a variety of methods for “standardizing” the LOR. Based on a Monte Carlo simulation study of seven different types of effect size indices for dichotomous outcomes, Sanchez-Meca, Marin-Martinez, and Chacon-Moscoso (2003) concluded that the effect size index proposed by Cox (1970) is the least biased estimator of the population standardized mean difference, assuming an underlying normal distribution of the outcome. Therefore, the WWC has adopted the Cox index as the default effect size measure for dichotomous outcomes. The computation of the Cox index is straightforward:
1.65CoxLORLOR ω=
The above index yields effect size values similar to the values of Hedges’ g that one would obtain if group means, SDs, and sample sizes were available, assuming the dichotomous outcome measure is based on an underlying normal distribution. Although the assumption may not always hold, as Sanchez-Meca et al. (2003) note, primary studies in the social and behavioral sciences routinely apply parametric statistical tests that imply normality. Therefore, the assumption of normal distribution is a reasonable conventional default.

What Works Clearinghouse Procedures and Standards Handbook, Version 3.0
F.7
ii. Difference-in-Differences Adjustment
For dichotomous outcomes, the effect size of the difference between the two groups on the pretest and posttest is computed separately using Hedges’ g, with the final effect size given by their difference:
post preg g g= −
c. Gain Scores
Some studies report only the means and standard deviations of a gain score for the two groups, which are inadequate for computing effect sizes. Effect sizes computed using this information would not be comparable with effect sizes computed using the other methods described above because they represent the effect on a different metric. Furthermore, when equivalence must be demonstrated, the use of a gain score does not satisfy the requirement of statistical adjustment in the analysis because it allows for nonequivalence of the analysis groups at baseline.
2. Studies with Cluster-level Assignment
The effect size formulae presented are based on student-level analyses, which are appropriate analytic approaches for studies with student-level assignment. However, the case is more complicated for studies with assignment at the cluster level (e.g., assignment of teachers, classrooms, or schools to conditions), when data may have been analyzed at the student level, the cluster level, or through multilevel analyses. Such analyses pose special challenges to effect size computation during WWC reviews. In the remainder of this section, we discuss these challenges and describe the WWC’s approach to handling them.
a. Effect Sizes from Student-Level Analyses of Cluster-Level Assignment
The main problem with student-level analyses in studies with cluster-level assignment is that they violate the assumption of the independence of observations underlying traditional hypothesis tests and result in underestimated standard errors and inflated statistical significance (see Appendix G). However, the estimate of the group mean difference in such analyses is unbiased and can be appropriately used to compute the student-level effect sizes using methods described in previous sections.
b. Cluster-Level Effect Sizes
Although there has been a consensus in the field that multilevel analysis should be used to analyze clustered data (e.g., Bloom, Bos, & Lee, 1999; Donner & Klar, 2000; Flay & Collins, 2005; Murray, 1998; Snijders & Bosker, 1999), cluster-level analyses of such data still frequently appear in the research literature despite their problems. For studies with cluster-level assignment, aggregated or cluster-level analyses are problematic. Along with the loss of power and increased Type II error, potential problems with aggregated analysis include shift of meaning and ecological fallacy (i.e., relationships between aggregated variables cannot be used to make assertions about the relationship among individual-level variables), among others (Aitkin & Longford, 1986; Snijders & Bosker, 1999).

What Works Clearinghouse Procedures and Standards Handbook, Version 3.0
F.8
For studies that report findings only from cluster-level analyses, it might be tempting to compute effect sizes using cluster-level means and SDs. However, this is inappropriate for WWC reviews for at least two reasons. First, the intra-class correlation (ICC) yields cluster-level SDs that are typically much smaller than student-level SDs,
( )*Cluster StudentSD SD sqrt ICC= ,
which subsequently results in much larger cluster-level effect sizes that are incomparable with the student-level effect sizes that are the focus of WWC reviews. Second, the criterion for “substantively important” effects (see Chapter III) was established specifically for student-level effect sizes and does not apply to cluster-level effect sizes. Moreover, there is not enough knowledge in the field for judging the magnitude of cluster-level effects, so a criterion of “substantively important” effects for cluster-level effect sizes cannot be established.
c. Student-Level Effect Sizes from Cluster-Level Analyses
Computing student-level effect sizes requires two sets of information often unreported in studies with cluster-level analyses: student-level means and standard deviations.
For the mean, the review team may use cluster-level means (i.e., mean of cluster means) to compute the group mean difference for the effect size numerator if any of the following conditions hold: (a) the clusters were of equal or similar sizes, (b) the cluster means were similar across clusters, or (c) it is reasonable to assume that cluster size was unrelated to cluster means. If any of these conditions is met, group means based on cluster-level data would be similar to group means based on student-level data and could be used for computing student-level effect sizes because the estimate of the group mean difference in student-level analyses with cluster-level assignment is unbiased.
It is generally much less feasible to compute the denominator (i.e., pooled SD) for student-level effect sizes based on cluster-level data. As seen from the relationship presented above, we could compute student-level SDs from cluster-level SDs and the intra-class correlation, but these are rarely provided. Note that the cluster-level SD associated with the ICC is not exactly the same as the observed SD of cluster means that was often reported in studies with cluster-level analyses because the latter reflect not only the true cluster-level variance but also part of the random variance within clusters (Raudenbush & Liu, 2000; Snijder & Bosker, 1999). If the outcome is a standardized measure that has been administered to a norming sample (national or state), then the effect size may be calculated using the SD from the norming sample.
d. Student-Level Effect Sizes from Multilevel Modeling
Multilevel analysis is generally considered the preferred method for analyzing data from studies with cluster-level assignment. With recent methodological advances, multilevel analysis has gained increased popularity in education and other social science fields. More and more researchers have begun to employ the hierarchical linear modeling (HLM) method to analyze data of a nested nature (e.g., students nested within classes and classes nested within schools; Raudenbush & Bryk, 2002). Multilevel analysis can also be conducted using other approaches, such as the SAS PROC MIXED procedure. Although different approaches to multilevel analysis may differ in technical details, all are based on similar ideas and underlying assumptions.

What Works Clearinghouse Procedures and Standards Handbook, Version 3.0
F.9
Similar to student-level ANCOVA, HLM also can adjust for important covariates such as a pretest when estimating an intervention’s effect. However, rather than assuming independence of observations such as an ANCOVA, HLM explicitly takes into account the dependence among members within the same higher-level unit (e.g., the dependence among students within the same class). Therefore, the parameter estimates, particularly the standard errors, generated from HLM are less biased than those generated from ANCOVA when the data have a multilevel structure.
Hedges’ g for intervention effects estimated from HLM analyses is defined in a similar way to that based on student-level ANCOVA: adjusted group mean difference divided by unadjusted pooled within-group SD. Specifically,
( ) ( )2 21 12
i i c c
i c
gn s n s
n n
ωγ=
− + −+ − ,
where γ is the HLM coefficient for the intervention’s effect, representing the group mean difference adjusted for both level-1 and level-2 covariates, if any. The level-2 coefficients are adjusted for the level-1 covariates under the condition that the level-1 covariates are either uncentered or grand-mean centered, which are the most common centering options in an HLM analysis (Raudenbush & Bryk, 2002). The level-2 coefficients are not adjusted for the level-1 covariates if the level-1 covariates are group-mean centered. For simplicity purposes, the discussion here is based on a two-level framework (i.e., students nested with teachers or classrooms). The idea could easily be extended to a three-level model (e.g., students nested with teachers who were, in turn, nested within schools).
e. When Student-Level Effect Sizes Cannot Be Computed
It is clear from the previous discussion that in most cases, obtaining student-level data from the study authors is the only way that allows us to compute the student-level effect size for studies using cluster-level assignment. Nevertheless, such studies will not be excluded from WWC reviews and may still potentially contribute to intervention ratings, as explained next.
A study’s contribution to the effectiveness rating of an intervention depends mainly on three factors: the quality of the study design, the statistical significance of the findings, and the size of the effects. For studies that report only cluster-level findings, the quality of design is not affected by whether student-level effect sizes could be computed; therefore, such studies can still meet WWC standards and be included in intervention reports.
Additionally, the statistical significance of cluster-level findings may factor in the rating of an intervention. Cluster-level analyses tend to be underpowered, leading to conservative estimates of the statistical significance of findings from such analyses. Therefore, significant findings from cluster-level analyses would remain significant had the data been analyzed using appropriate multilevel models and should be taken into account in intervention ratings.
However, the size of the effects based on cluster-level analyses cannot be used in the effectiveness ratings for the intervention report for reasons described above. Therefore, cluster-

What Works Clearinghouse Procedures and Standards Handbook, Version 3.0
F.10
level findings will be excluded from the computation of domain average effect sizes and improvement indices as well as from consideration as being substantively important.
B. Improvement Index
In order to help readers judge the practical importance of an intervention’s effect, the WWC translates the effect size into an improvement index. This index represents the difference between the percentile rank corresponding to the intervention group mean and the percentile rank corresponding to the comparison group mean (i.e., the 50th percentile) in the comparison group distribution. Alternatively, the improvement index can be interpreted as the expected change in percentile rank for an average comparison group student if the student had received the intervention.
As an example, if an intervention produced a positive impact on students’ reading achievement with an effect size of 0.25, the effect size could be translated to an improvement index of 10 percentile points. We could then conclude that the intervention would have led to a 10% increase in percentile rank for an average student in the comparison group and that 60% (10% + 50% = 60%) of the students in the intervention group scored above the comparison group mean. Specifically, the improvement index is computed as described next.
Step 1. Convert the Effect Size (Hedges’ g) to Cohen’s U3 Index
The U3 index represents the percentile rank of a comparison group student who performed at the level of an average intervention group student. An effect size of 0.25, for example, would correspond to a U3 of 60%, which means that an average intervention group student would rank at the 60th percentile in the comparison group. Equivalently, an average intervention group student would rank 10 percentile points higher than an average comparison group student, who, by definition, ranks at the 50th percentile.
Mechanically, the conversion of an effect size to a U3 index entails using a table that lists the proportion of the area under the standard normal curve for different values of z-scores, which can be found in the appendices of most statistics textbooks. For a given effect size, U3 has a value equal to the proportion of the area under the normal curve below the value of the effect size—under the assumptions that the outcome is normally distributed and that the variance of the outcome is similar for the intervention group and the comparison group.
Step 2. Compute Improvement Index = U3 – 50%
Given that U3 represents the percentile rank of an average intervention group student in the comparison group distribution and that the percentile rank of an average comparison group student is 50%, the improvement index, defined as U3 – 50%, would represent the difference in percentile rank between an average intervention group member and an average comparison group member in the comparison group distribution.
In addition to the improvement index for each individual finding, the WWC also computes a domain average improvement index for each study as well as a domain average improvement index across studies for each outcome domain. The domain average improvement index for each study is computed based on the domain average effect size for that study rather than as the average of the improvement indices for individual findings within that study. Similarly, the

What Works Clearinghouse Procedures and Standards Handbook, Version 3.0
F.11
domain average improvement index across studies is computed based on the domain average effect size across studies, with the latter computed as the average of the domain average effect sizes for individual studies.
References
Aitkin, M., & Longford, N. (1986). Statistical modeling issues in school effectiveness studies (with discussion). Journal of the Royal Statistical Society Series A, 149(1), 1–43.
Bloom, H. S., Bos, J. M., & Lee, S. W. (1999). Using cluster random assignment to measure program impacts: Statistical implications for the evaluation of education programs. Evaluation Review, 23(4), 445–469.
Cooper, H. (1998). Synthesizing research: A guide for literature review. Thousand Oaks, CA: Sage.
Cox, D. R. (1970). Analysis of binary data. New York: Chapman & Hall/CRC.
Donner, A., & Klar, N. (2000). Design and analysis of cluster randomized trials in health research. London: Arnold Publishing.
Flay, B. R., & Collins, L. M. (2005). Historical review of school-based randomized trials for evaluating problem behavior prevention programs. The Annals of the American Academy of Political and Social Science, 599, 147–175.
Fleiss, J. L. (1994). Measures of effect size for categorical data. In H. Cooper & L. V. Hedges (Eds.), The handbook of research synthesis (pp. 245–260). New York: Russell Sage Foundation.
Hedges, L. V. (1981). Distribution theory for Glass’s estimator of effect size and related estimators. Journal of Educational and Behavioral Statistics, 6(2), 107–128.
Hedges, L. V. (2005). Correcting a significance test for clustering. Unpublished manuscript.
Lipsey, M. W., & Wilson, D. B. (2001). Practical meta-analysis. Thousand Oaks, CA: Sage.
Murray, D. M. (1998). Design and analysis of group-randomized trials (Vol. 27). New York: Oxford University Press.
Raudenbush, S. W., & Bryk, A. S. (2002). Hierarchical linear models: Applications and data analysis methods (2nd ed.). Newbury Park, CA: Sage.
Raudenbush, S. W., & Liu, X. (2000). Statistical power and optimal design for multisite randomized trials. Psychological Methods, 5(2), 199–213.
Rosenthal, R. (1994). Parametric measures of effect size. In H. Cooper & L. V. Hedges (Eds.), The handbook of research synthesis (pp. 231–244). New York: Russell Sage Foundation.
Rosnow, R. L., Rosenthal, R., & Rubin, D. B. (2000). Contrasts and correlations in effect-size estimation. Psychological Science, 11(6), 446–453.

What Works Clearinghouse Procedures and Standards Handbook, Version 3.0
F.12
Sanchez-Meca, J., Marin-Martinez, F., & Chacon-Moscoso, S. (2003). Effect-size indices for dichotomous outcomes in meta-analysis. Psychological Methods, 8(4), 448–467.
Snijders, T., & Bosker, R. (1999). Multilevel analysis: An introduction to basic and advanced multilevel modeling. London: Sage Publications.

What Works Clearinghouse Procedures and Standards Handbook, Version 3.0
G.1
G. STATISTICAL SIGNIFICANCE FOR RANDOMIZED CONTROLLED TRIALS AND QUASI-EXPERIMENTAL DESIGNS
In order to adequately assess the effects of an intervention, it is important to know not only the magnitude of the effects as indicated by the effect size or improvement index but also the statistical significance of the effects.
A. Clustering Correction for Mismatched Analyses
However, the correct statistical significance of findings is not always readily available, particularly in studies in which the unit of assignment does not match the unit of analysis. The most common “mismatch” problem occurs when assignment was carried out at the cluster level (e.g., classroom or school level) and the analysis was conducted at the student level, ignoring the dependence among students within the same clusters. Although the point estimates of the intervention’s effects based on such mismatched analyses are unbiased, the standard errors of the effect estimates are likely to be underestimated, which would lead to inflated Type I error and overestimated statistical significance.
In order to present a fair judgment about an intervention’s effects, the WWC computes clustering-corrected statistical significance for effects estimated from mismatched analyses and the corresponding domain average effects based on Hedges (2005). Because clustering correction will decrease the statistical significance (or increase the p-value) of the findings, nonsignificant findings from a mismatched analysis will remain nonsignificant after the correction. Therefore, the WWC applies the correction only to findings reported to be statistically significant by the study authors.
The basic approach to clustering correction is to first compute the t-statistic corresponding to the effect size that ignores clustering and then correct both the t-statistic and the associated degrees of freedom for clustering based on sample sizes, number of clusters, and the intra-class correlation. The statistical significance corrected for clustering could then be obtained from the t-distribution with the corrected t-statistic and degrees of freedom. In the remainder of this section, we detail each step of the process.
Step 1. Compute the t-Statistic for the Effect Size, Ignoring Clustering
i c
i c
n nt gn n
=+
where g is the effect size that ignores clustering and ni and nc are the sample sizes for the intervention and comparison groups, respectively, for a given outcome. For domain average effect sizes, ni and nc are the average sample sizes for the intervention and comparison groups, respectively, across all outcomes within the domain.

What Works Clearinghouse Procedures and Standards Handbook, Version 3.0
G.2
Step 2. Correct the t-Statistic for Clustering
( )
( )
2 2 1
2 1 1a
NNMt tNNM
ρ
ρ
− − − =
− + −
where N is the total sample size at the student level (N = ni + nc), M is the total number of clusters in the intervention (mi) and comparison (mc) groups, and ρ is the intra-class correlation for a given outcome.
If the ICC is reported by the author, it is used in the calculation above. However, the value of the ICC often is not available from the study reports. Based on empirical literature in the field of education, the WWC has adopted a default ICC value of 0.20 for achievement outcomes and 0.10 for behavioral and attitudinal outcomes (Schochet, 2008). The topic area team leadership may set different defaults with explicit justification in terms of the nature of the research circumstances or the outcome domain.
For domain average effect sizes, the ICC used above is the average ICC across all outcomes within the domain. If the number of clusters in the intervention and comparison groups differs across outcomes within a given domain, the total number of clusters (M) used for computing the corrected t-statistic will be based on the largest number of clusters in both groups across outcomes within the domain. This gives the study the benefit of the doubt by crediting the measure with the most statistical power, so the WWC’s rating of interventions will not be unduly conservative.
Step 3. Compute the Degrees of Freedom Associated with the t-Statistic Corrected for Clustering
( )
( )( ) ( )
2
2 2
2 2 1
2 1 2 2 2 1
NNMdf
N N NN N NM M M
ρ
ρ ρ ρ ρ
− − − = − − + − + − −
Step 4. Obtain the Statistical Significance of the Effect Corrected for Clustering
The clustering-corrected statistical significance (p-value) is determined based on the t-distribution with corrected t-statistic (ta) and the corrected degrees of freedom (df). This p-value can either be looked up in a t-distribution table that can be found in the appendices of most statistical textbooks or computed using the t-distribution function in Excel: p = TDIST(ta,df,2).
B. Benjamini-Hochberg Correction for Multiple Comparisons
Type I error and the statistical significance of findings also may be inflated when study authors perform multiple hypothesis tests simultaneously. The traditional approach to addressing the problem is the Bonferroni method (Bonferroni, 1935), which lowers the critical p-value for individual comparisons by a factor of 1/m, with m equal to the total number of comparisons

What Works Clearinghouse Procedures and Standards Handbook, Version 3.0
G.3
made. However, the Bonferroni method has been shown to be unnecessarily stringent for many practical situations; therefore, the WWC has adopted the Benjamini-Hochberg method (Benjamini & Hochberg, 1995) to correct for multiple comparisons or multiplicity.
The BH method adjusts for multiple comparisons by controlling false discovery rate (FDR) instead of family-wise error rate (FWER). It is less conservative than the traditional Bonferroni method, yet it still provides adequate protection against Type I error in a wide range of applications. Since its conception in the 1990s, growing evidence has shown that the FDR-based BH method may be the best solution to the multiple comparisons problem in many practical situations (Williams, Jones, & Tukey, 1999).
As is the case with clustering correction, the WWC applies the BH correction only to statistically significant findings because nonsignificant findings will remain nonsignificant after correction. For findings based on analyses when the unit of analysis was properly aligned with the unit of assignment, we use the p-values reported in the study for the BH correction. If the exact p-values were not available, but the effect size could be computed, we convert the effect size to t-statistics and then obtain the corresponding p-values. For findings based on mismatched analyses, we correct the author-reported p-values for clustering and then use the clustering-corrected p-values for the BH correction.
Although the BH correction procedure described above was originally developed under the assumption of independent test statistics (Benjamini & Hochberg, 1995), Benjamini & Yekutieli (2001) point out that it also applies to situations in which the test statistics have positive dependency and that the condition for positive dependency is general enough to cover many problems of practical interest. For other forms of dependency, a modification of the original BH procedure could be made, although it is “very often not needed, and yields too conservative a procedure” (Benjamini & Yekutieli, 2001, p. 1183). The modified version of the BH procedure uses a over the sum of the inverse of the p-value ranks across the m comparisons instead of a.
Therefore, the WWC has chosen to use the original BH procedure rather than its more conservative modified version as the default approach to correcting for multiple comparisons when not accounted for in the analysis. In the remainder of this section, we describe the specific procedures for applying the BH correction in three types of situations: studies that tested multiple outcome measures in the same outcome domain with a single comparison group, studies that tested a given outcome measure with multiple comparison groups, and studies that tested multiple outcome measures in the same outcome domain with multiple comparison groups.
1. Multiple Outcome Measures Tested with a Single Comparison Group
The most straightforward situation that may require the BH correction occurs when the study authors assessed the effect of an intervention on multiple outcome measures within the same outcome domain using a single comparison group. For studies that examined measures in multiple outcome domains, the BH correction is applied to the set of findings within the same domain rather than across different domains.

What Works Clearinghouse Procedures and Standards Handbook, Version 3.0
G.4
Step 1. Rank Order the Statistically Significant Findings
Within a domain, order the p-values in ascending order such that
1 2 3 mp p p p< < < <
where m is the number of significant findings within the domain.
Step 2. Compute Critical p-Values for Statistical Significance
For each p-value, px, compute the critical value, px’:
xxpMα′ =
where x is the rank for px, with x = 1, 2, …, m; M is the total number of findings within the domain reported by the WWC; and α is the target level of statistical significance.
Note that the M in the denominator may be less than the number of outcomes the study authors actually examined for two reasons: (a) the authors may not have reported findings from the complete set of comparisons they had made, and (b) certain outcomes assessed by the study authors may not meet the eligibility or standards requirements of the WWC review. The target level of statistical significance, α, in the numerator allows us to identify findings that are significant at this level after correction for multiple comparisons. The WWC’s default value of α is 0.05.
Step 3. Identify the Cutoff Point
Identify the largest x, denoted by y, that satisfies the condition
x xp p′≤
This establishes a cutoff point such that all findings with p-values smaller than or equal to py are statistically significant, and findings with p-values greater than py are not significant at the prespecified level of significance after correction for multiple comparisons.
One thing to note is that unlike clustering correction, which produces a new p-value for each corrected finding, the BH correction does not generate a new p-value for each finding but rather indicates only whether the finding is significant at the prespecified level of statistical significance after the correction.
As an illustration, suppose a researcher compared the performance of the intervention group and the comparison group on eight measures in a given outcome domain, resulting in six statistically significant effects and two nonsignificant effects based on properly aligned analyses. To correct the significance of the findings for multiple comparisons, first rank-order the author-reported (or clustering corrected) p-values in the first column of Table G.1 and list the p-value ranks in the second column.

What Works Clearinghouse Procedures and Standards Handbook, Version 3.0
G.5
Then compute px’ = xα/M with M = 8 (because there are eight outcomes in the domain) and α = 0.05 and record the values in the third column. Next, identify y, the largest x that meets the condition px ≤ px’; in this example, y = 5 and py = 0.030. Note that for the fourth outcome, the p-value is greater than the new critical p-value. This finding is significant after correction because it has a p-value (0.027) lower than the highest p-value (0.030) to satisfy the condition.
Table G.1. Illustration of Applying the Benjamini-Hochberg Correction for Multiple Comparisons
Author-Reported or Clustering Corrected p-value (px)
p-value Rank (x)
New Critical p-value
(px’ = 0.05x/8)
Finding p-value < New Critical
p-value? (px ≤ px’)
Statistical Significance after BH Correction?
0.002 1 0.006 Yes Yes
0.009 2 0.013 Yes Yes
0.014 3 0.019 Yes Yes
0.027 4 0.025 No Yes
0.030 5 0.031 Yes Yes
0.042 6 0.038 No No
0.052 7 0.044 No No
0.076 8 0.050 No No
Thus, we can claim that the five findings associated with a p-value of 0.030 or smaller are statistically significant at the 0.05 level after correction for multiple comparisons. The sixth finding (p-value = 0.042), although reported as being statistically significant, is no longer significant after the correction.
2. Single Outcome Measure Tested with Multiple Groups
Another type of multiple comparison problem occurs when the study authors tested an intervention’s effect on a given outcome by comparing the intervention group with multiple comparison groups or by comparing multiple interventions.
Currently, the WWC does not have specific guidelines for studies that use multiple groups. Teams have approached these studies by (a) including all comparisons they consider relevant, (b) calculating separate effect sizes for each comparison, and (c) averaging these findings together in a manner similar to multiple outcomes in a domain (see previous section). The lead methodologist should use discretion to decide the best approach for the team on a study-by-study basis.
3. Multiple Outcome Measures Tested with Multiple Comparison Groups
A more complicated multiple comparison problem arises when a study tested an intervention’s effect on multiple outcome measures in a given domain with multiple comparison groups. The multiplicity problem may originate from two sources. Assuming that both types of multiplicity need to be corrected, the review team will apply the BH correction in accordance with the following three scenarios.

What Works Clearinghouse Procedures and Standards Handbook, Version 3.0
G.6
Scenario 1. The study author’s findings did not take into account either type of multiplicity.
In this case, the BH correction is based on the total number of comparisons made. For example, if a study compared one intervention group with two comparison groups on three outcomes in the same domain without taking multiplicity into account, the BH correction is applied to the six individual findings based on a total of six comparisons.
Scenario 2. The study authors’ findings took into account the multiplicity resulting from multiple comparisons, but not the multiplicity resulting from multiple outcomes.
In some studies, the authors may have performed a proper multiple comparison test on each individual outcome that took into account the multiplicity resulting from multiple comparison groups. For such studies, the WWC needs to correct only the findings for the multiplicity resulting from multiple outcomes. Specifically, BH corrections are made separately to the findings for each comparison group. For example, with two comparison groups (A and B) and three outcomes, the review team applies the BH correction separately to the three findings for A and the three findings for B.
Scenario 3. The study authors’ findings took into account the multiplicity resulting from multiple outcomes, but not the multiplicity resulting from multiple comparison groups.
Although this scenario may be relatively rare, it is possible that the study authors performed a proper multivariate test (e.g., multivariate ANOVA or multivariate ANCOVA) to compare the intervention group with a given comparison group that took into account the multiplicity resulting from multiple outcomes and performed separate multivariate tests for each comparison group. For such studies, the review team needs to correct only the findings for multiplicity resulting from multiple comparison groups. Specifically, separate BH corrections are made to the findings based on the same outcome. For example, with two comparison groups and three outcomes (A, B, and C), the review team applies the BH correction separately to the pair of findings for A, the pair of findings for B, and the pair of findings for C.
On a final note, although the BH corrections are applied in different ways to the individual study findings in different scenarios, such differences do not affect the way in which the intervention rating is determined. In all three scenarios presented, the six findings are presented in a single outcome domain, and the characterization of the intervention’s effects for this domain in this study are based on the corrected statistical significance of each individual finding as well as the magnitude and statistical significance of the average effect size across the six individual findings within the domain.
References
Benjamini, Y., & Hochberg, Y. (1995). Controlling the false discovery rate: A practical and powerful approach to multiple testing. Journal of the Royal Statistical Society Series B Methodological, 57(1), 289–300.
Benjamini, Y., & Yekutieli, D. (2001). The control of the false discovery rate in multiple testing under dependency. The Annals of Statistics, 29(4), 1165–1188.

What Works Clearinghouse Procedures and Standards Handbook, Version 3.0
G.7
Bonferroni, C. E. (1935). Il calcolo delle assicurazioni su gruppi di teste. In Studi in onore del Professore Salvatore Ortu Carboni (pp. 13–16). Rome.
Hedges, L. V. (2005). Correcting a significance test for clustering. Unpublished manuscript.
Schochet P. Z. (2008). Statistical power for random assignment evaluations of education programs. Journal of Educational and Behavioral Statistics, 33, 62–87.
Williams, V. S. L., Jones, L. V., & Tukey, J. W. (1999). Controlling error in multiple
comparisons, with examples from state-to-state differences in educational achievement. Journal of Educational and Behavioral Statistics, 24(1), 42–69.