
What We Are Reading Vol.82
60
Emerging Markets Research 9 July 2015 Asia Themes: India Assembling the building blocks • Increasing fiscal revenue is supporting the government’s medium term agenda of raising infrastructure investment. The focus is likely to be on urbanisation, clearing supply bottlenecks through better logistics, stronger infrastructure and ending power and coal shortages, which can raise India’s trend growth rate. • Railways, highways, ports and urban infrastructure projects are likely to be prioritised. Along with coal and power, we estimate that the government could spend an additional USD190bn in the next five years on these sectors. • Our input output analysis on value addition indicates that India’s potential growth rate could rise by more than 1.4pp on this investment. This implies that India could be enjoying close to double-digit real GDP growth by FY20, even if only 75% of the planned infrastructure investments are realised. • For urbanisation, the government’s smart cities initiative will complement the planned creation of several greenfield cities across the country. Higher investment in urban projects should also improve productivity in next five years. • The government is targeting ‘24x7’ power availability across the country by 2019. We believe that the first obstacle of fuel availability has been resolved, and the nation’s power deficit is shrinking, a trend that looks set to continue, based on planned capacity additions. • The highways construction programme could see additional spending of INR2trn in the next five years, which should strengthen connectivity and fundamentally lower underlying inflation pressures. Railways and ports may see potential additional investments of INR5trn and INR1trn respectively in capacity building, which should further improve economic connectivity and reduce the cost of doing business in India. • We believe execution risks will persist in India, given lack of clarity on land acquisition rules, issues of NPAs in the banking sector, and generally poor demand conditions, both domestically and globally. Headwinds for growth may also increase if the logistical improvements are not coordinated, which may render some investments to be unproductive. Rahul Bajoria +65 6308 3511 [email protected] Barclays Bank, Singapore Siddhartha Sanyal +91 22 6719 6177 [email protected] Barclays Bank, India www.barclays.com PLEASE SEE ANALYST CERTIFICATIONS AND IMPORTANT DISCLOSURES STARTING AFTER PAGE 23
-
Upload
akhilesh-tripathi -
Category
Documents
-
view
29 -
download
4
Transcript of What We Are Reading Vol.82
Emerging Markets Research 9 July 2015
Asia Themes: India
Assembling the building blocks • Increasing fiscal revenue is supporting the government’s medium term agenda of
raising infrastructure investment. The focus is likely to be on urbanisation, clearing supply bottlenecks through better logistics, stronger infrastructure and ending power and coal shortages, which can raise India’s trend growth rate.
• Railways, highways, ports and urban infrastructure projects are likely to be prioritised. Along with coal and power, we estimate that the government could spend an additional USD190bn in the next five years on these sectors.
• Our input output analysis on value addition indicates that India’s potential growth rate could rise by more than 1.4pp on this investment. This implies that India could be enjoying close to double-digit real GDP growth by FY20, even if only 75% of the planned infrastructure investments are realised.
• For urbanisation, the government’s smart cities initiative will complement the planned creation of several greenfield cities across the country. Higher investment in urban projects should also improve productivity in next five years.
• The government is targeting ‘24x7’ power availability across the country by 2019. We believe that the first obstacle of fuel availability has been resolved, and the nation’s power deficit is shrinking, a trend that looks set to continue, based on planned capacity additions.
• The highways construction programme could see additional spending of INR2trn in the next five years, which should strengthen connectivity and fundamentally lower underlying inflation pressures. Railways and ports may see potential additional investments of INR5trn and INR1trn respectively in capacity building, which should further improve economic connectivity and reduce the cost of doing business in India.
• We believe execution risks will persist in India, given lack of clarity on land acquisition rules, issues of NPAs in the banking sector, and generally poor demand conditions, both domestically and globally. Headwinds for growth may also increase if the logistical improvements are not coordinated, which may render some investments to be unproductive.
Rahul Bajoria +65 6308 3511 [email protected] Barclays Bank, Singapore Siddhartha Sanyal +91 22 6719 6177 [email protected] Barclays Bank, India www.barclays.com
PLEASE SEE ANALYST CERTIFICATIONS AND IMPORTANT DISCLOSURES STARTING AFTER PAGE 23
70093436
Highlight
70093436
Highlight
70093436
Highlight

Barclays | Asia Themes: India
INFRASTRUCTURE AND GROWTH
Infrastructure spending ramp up likely After slightly more than a year in office, the Narendra Modi-led administration is laying out its key policy areas. At the heart of the government’s growth model is a push for greater urbanisation in India. Calling urbanisation an ‘opportunity’ rather than a threat, the government has outlined a structured approach to increase the share of the urban population through greater connectivity, universal access to basic facilities, and boosting manufacturing and services activity. The government, enjoying a fiscal windfall in the wake of lower oil prices, is prioritising infrastructure investment and has outlined five key areas.
• Urbanisation – With the smart cities initiative in place, along with marquee projects like the Delhi-Mumbai Industrial corridor (DMIC), we estimate that the government will spend an additional INR2trn on urban projects above previous trend levels.
• Power and coal – With coal production rising and the government aiming for universal power access, we estimate that an additional INR2trn may be spent in these areas.
• Highways – The government has a 30km/day road construction goal, and is looking to add 10,000km to the highway network, which could involve investment of INR2trn.
• Railways – A key focus area, we think the government could increase spending on the rail network by INR5.0trn on capacity enhancement projects.
• Ports and freight corridors – Along with the highway and railway networks, projects to enhance connectivity are being prioritised for ports and waterways. Port-related investments could rise by INR1trn and improve the ‘last mile’ of transport links, which is expected to boost exports.
In the next five years, we estimate that the government could spend more than INR12trn (~USD190bn, or ~8.5% of GDP) in the above five areas above levels based on past trends. If executed successfully, we think the government will be able to ‘crowd-in’ private investment, and create a long term boost to the economy’s growth potential. Without these extra initiatives, we estimate that the government would only have channelled roughly 1% of GDP per annum towards investments in these sectors. In this report, we examine the government’s infrastructure push and the possible impact on long-term growth.
FIGURE 1 Our estimates show that planned Infra spending may boost growth in the next five years
Projects (INR bn) FY16 FY17 FY18 FY19 FY20
Electricity 8 16 23 31 171
Urban infrastructure projects 30 30 38 53 285
Railways 44 110 132 154 558
Highways 50 67 100 117 571
Ports 10 17 21 21 285
Logistics/efficiency gains 0 322 644 966 1289
Potential increase in value added 143 562 959 1343 3159
Value added (INR bn) FY16 FY17 FY18 FY19 FY20
Potential scenario (100%) 143 562 959 1343 3159
Potential scenario (75% realisation) 110 507 885 1254 2762
Value added (% of nominal GDP) FY16 FY17 FY18 FY19 FY20
Potential scenario (100%) 0.10 0.35 0.53 0.67 1.40
Potential scenario (75% realisation) 0.08 0.32 0.49 0.62 1.22 Source: CEIC, Barclays Research
Narendra Modi’s government is prioritising urbanisation to drive growth
The government may spend an additional INR12trn in next 5 years on infrastructure
9 July 2015 2
70093436
Highlight
70093436
Highlight
70093436
Highlight
70093436
Highlight
70093436
Highlight
70093436
Highlight
70093436
Highlight
70093436
Highlight
Barclays | Asia Themes: India
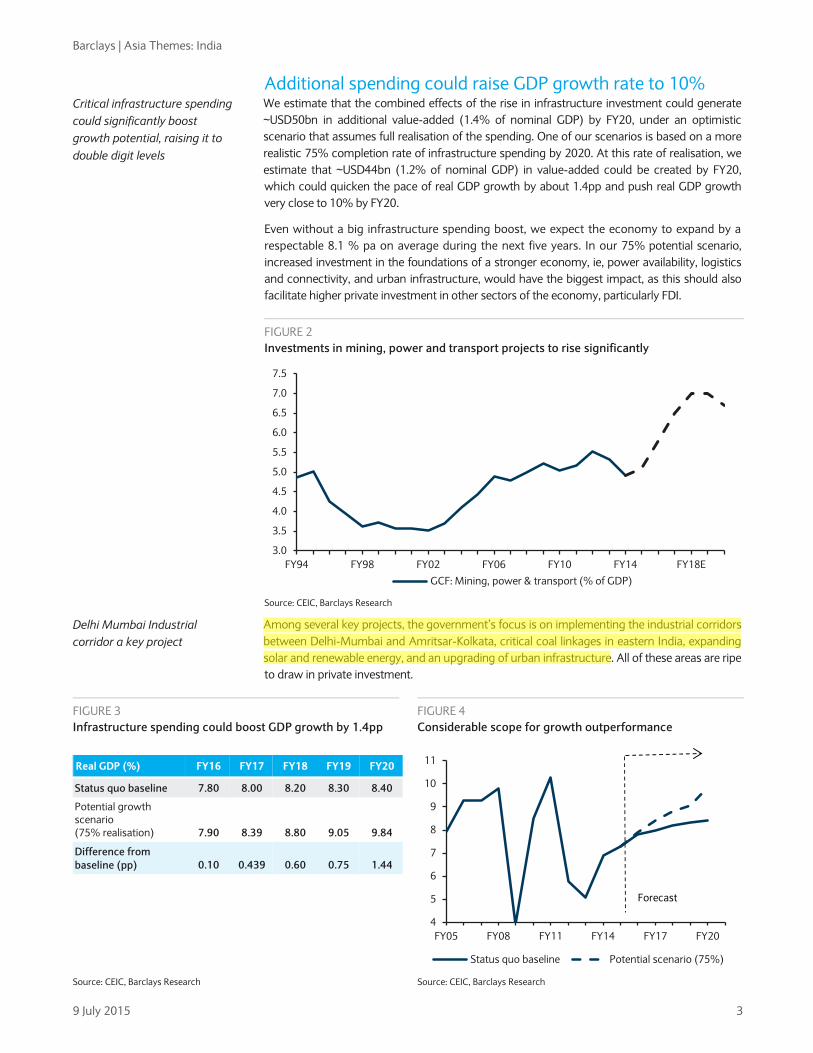
Additional spending could raise GDP growth rate to 10% We estimate that the combined effects of the rise in infrastructure investment could generate ~USD50bn in additional value-added (1.4% of nominal GDP) by FY20, under an optimistic scenario that assumes full realisation of the spending. One of our scenarios is based on a more realistic 75% completion rate of infrastructure spending by 2020. At this rate of realisation, we estimate that ~USD44bn (1.2% of nominal GDP) in value-added could be created by FY20, which could quicken the pace of real GDP growth by about 1.4pp and push real GDP growth very close to 10% by FY20.
Even without a big infrastructure spending boost, we expect the economy to expand by a respectable 8.1 % pa on average during the next five years. In our 75% potential scenario, increased investment in the foundations of a stronger economy, ie, power availability, logistics and connectivity, and urban infrastructure, would have the biggest impact, as this should also facilitate higher private investment in other sectors of the economy, particularly FDI.
Among several key projects, the government’s focus is on implementing the industrial corridors between Delhi-Mumbai and Amritsar-Kolkata, critical coal linkages in eastern India, expanding solar and renewable energy, and an upgrading of urban infrastructure. All of these areas are ripe to draw in private investment.
Critical infrastructure spending could significantly boost growth potential, raising it to double digit levels
FIGURE 2 Investments in mining, power and transport projects to rise significantly
Source: CEIC, Barclays Research
Delhi Mumbai Industrial corridor a key project
FIGURE 3 Infrastructure spending could boost GDP growth by 1.4pp
FIGURE 4 Considerable scope for growth outperformance
Real GDP (%) FY16 FY17 FY18 FY19 FY20
Status quo baseline 7.80 8.00 8.20 8.30 8.40
Potential growth scenario (75% realisation) 7.90 8.39 8.80 9.05 9.84
Difference from baseline (pp) 0.10 0.439 0.60 0.75 1.44
Source: CEIC, Barclays Research Source: CEIC, Barclays Research
3.0
3.5
4.0
4.5
5.0
5.5
6.0
6.5
7.0
7.5
FY94 FY98 FY02 FY06 FY10 FY14 FY18EGCF: Mining, power & transport (% of GDP)
4
5
6
7
8
9
10
11
FY05 FY08 FY11 FY14 FY17 FY20
Status quo baseline Potential scenario (75%)
Forecast
9 July 2015 3
70093436
Highlight

Barclays | Asia Themes: India
URBANISATION AND SMART CITIES
Growing smartly – ‘Smart’ cities to lead the way Urban areas have powered India’s growth over the past two decades and now generate c63% of India’s GDP – up from c45% in 1990. We believe India’s large population and low GDP per capita indicate that urbanisation trends have significant scope to accelerate further. To facilitate this, the quality of urbanisation needs to be paid attention considered as well. One of the cornerstone projects initiated by Narendra Modi in his first year is the ‘Make in India program’. Behind the ambition of becoming a manufacturing champion, lies a structured approach to increasing urbanisation.
Indian cities are growing rapidly, but they are also expanding in an unorganised manner. Decades of internal migration have pressured the existing infrastructure systems. In the absence of structured planning and poor execution of actual projects, the quality of living has been declining in many of India’s cities. Under the moniker of ‘smart cities’, the government wants to create new ‘urban clusters’, which are expected to be both a driver of growth and reduce the burden on existing cities. Even if past trends are maintained, we estimate that 35% of India’s population could live in cities by 2020 and contribute 70-75% of its GDP.
India’s urbanisation has increased, but development has been uneven India’s urbanisation rate, as per the 2011 census, stood at 31.6%, up from 27.8% in 2001, with only seven provinces reporting a higher than national average in this period. While Western and Southern India have been urbanising quickly, progress in Northern and Eastern India has been slower. It is in these two regions that we think PM Modi’s smart cities concept could have the greatest impact through reinvigorating urbanisation and industrialisation trends in these states. In this context, we think the dedicated freight corridor planned for Eastern India has potential to correct the country’s urbanisation imbalance, though the greenfield urban clusters under construction or planned have a strong Western India bias. Little progress is visible in terms of planning more ‘urban clusters’ in Eastern or Northern India.
FIGURE 5 Share of GDP produced from urban regions
FIGURE 6 Urban India powered the last decade’s growth acceleration*
Source: McKinsey Global Institute (2012), Ministry of Urban Development (MoUD), Barclays Research
Note: *Chart shows contribution to total GDP growth. Source: RBI, MoUD, Barclays Research
Urban India contributes roughly 63% of total GDP
Cities in India are growing rapidly, and could generate 70-75% of GDP by 2020
India has been urbanising, but in an uneven manner
84
65
7678
63
50
55
60
65
70
75
80
85
90
United States
Western Europe
Latin America
China India
%
1.8 1.4 2.7 3.4
5.7 2.0 1.6
2.6 2.3
1.8
-
1.0
2.0
3.0
4.0
5.0
6.0
7.0
8.0
1950-51 -1970-71
1970-71 -1980-81
1980-81 -1990-91
1990-91 -2000-01
2000-01 -2009-10
% YoY Urban Rural
9 July 2015 4
70093436
Highlight
70093436
Highlight

Barclays | Asia Themes: India
‘Smart’ cities – From policy to action One of the key themes of Prime Minister Narendra Modi’s election campaign was the use of urbanisation as a catalyst for growth. Apart from resolving infrastructure bottlenecks, the government plans to set up 100 ‘smart’ cities, which involves upgrading the infrastructure in existing tier 1 and tier 2 cities, and setting up new urban clusters to manage the pace and quality of urbanisation. For instance, among the facilities proposed for these cities are such things are the availability of underground parking, adequate digital connectivity, smart power grids, piped gas networks, adequate public transport and environmentally-friendly surroundings to enhance quality of life.
According to a report by the McKinsey Global Institute in 2010 (Urbanisation in India), in the next 20 years India could have 68 cities with a population of more than one million – up from 42 in 2010. Some interesting case studies for the ‘smart cities’ under construction in India are New Raipur (Chhattisgarh), Dholera Investment region (Gujarat) and Lavasa (Maharashtra), which are cities being constructed from scratch with plans to integrate technology in day-to-day management of their infrastructure.
Naya Raipur – A smart city in the making since 2008 Naya Raipur (New Raipur) is an administrative capital being built in Central India, in the state of Chhattisgarh. Construction began in 2008. Administrative capitals are not a new thing in India, and many states have constructed such cities previously (ie, Bhubaneswar, Gandhinagar, and Chandigarh). Built over 80sqkm, the city has already seen INR40bn of investment, and it is expected to have more than half a million resident by 2030. The city is also expected to house the prestigious Indian Institute of Management (IIM) and Indian institute of Technology (IIT), which should help to boost its appeal. The city also possesses one of the best rated cricket stadiums in India.
The proposed Delhi-Mumbai industrial corridor, which could be India’s largest infrastructure project, includes plans for seven new city townships across the states it passes through to promote urbanisation of these areas. Similar projects in Andhra Pradesh (Amravati), Gujarat (Dholera), Rajasthan (Neemrana) and in the North East are expected to get underway in the next few years.
FIGURE 9 Several Greenfield cities/urban clusters already under-way
FIGURE 10 Brownfield city up gradation, a major part of the smart cities initiative
Source: Various media sources, MoUD, Barclays Research Source: Various media sources, MoUD, Barclays Research
Smart cities initiative is largely aimed at planned urbanisation
Several greenfield cities are under construction in India
DMIC itself will have 7 urban clusters, which will be built from scratch
City State Partner Country
Dholera Gujarat Japan
Kochi smart city Kerala -
Lavasa Maharashtra -
Naya Raipur Chhattisgarh -
Amravati Andhra Pradesh Singapore
Shendra Bidkin Maharashtra Japan
GIFT city Gujarat -
Dighi Maharashtra -
Greenfield projects
City State Partner Country
Ajmer Rajasthan US
Allahabad Uttar Pradesh US
Shimla Himachal Pradesh France
Varanasi Uttar Pradesh Japan
Vizag Andhra Pradesh US
Pondicherry Tamil Nadu France
Nagpur Maharashtra France
Delhi Delhi NCR Spain
Brownfield projects
9 July 2015 6
70093436
Highlight
70093436
Highlight

Barclays | Asia Themes: India
Electricity sector – powering up To make the planned smart cities and industrial/manufacturing clusters viable, the government has set an ambitious target of providing 24x7 electricity access to every household by 2019. In order to achieve this target, the government needs to take significant steps not just in generation, but also in the transmission and distribution of power.
FIGURE 11 High growth needs considerable addition in power capacity
Source: CEIC, Barclays Research
Access to reliable electricity supply remains a major issue for India, with only 75% of the population having access to power. An increase in generating capacity and improvement in fuel availability goes a long way in solving the problems of power availability. But transmission and distribution still remain a challenge. India’s power consumption still remains low, as India’s per capita GDP is still very low. While there has been considerable capacity augmentation in the last 10 years, the sector has been plagued by issues of distribution, and fuel shortages, which are being unclogged gradually.
India has been adding ~20GW per year of electricity capacity for last 3-4 years, and this trend may slow down in coming years, especially in conventional generation capacity like coal and gas. India’s per capita power consumption has risen considerably in last two decades, but still remains considerably below its peers, both in the region and globally.
GJ
TNMHHR
MPRJ
CG
KR
JHAP
OD
PN
WB
UP
0
5
10
15
20
25
6.0 7.0 8.0 9.0 10.0
Pow
er c
apac
ity (%
, CA
GR)
GSDP (% growth between FY06-FY15)
Power infrastructure being planned alongside urbanisation
Government is targeting 24x7 power access by 2019
FIGURE 12 Net capacity addition has been rising significantly
FIGURE 13 Bulk of power generation capacity is coal based
Source: CEIC, Barclays Research Source: CEIC, Barclays Research
Power capacity addition is impressive, but utilisation is not
0
5
10
15
20
25
May-05 May-07 May-09 May-11 May-13 May-15
(12m rolling sum, GW)
Thermal HydroOthers Power additional capacity
Thermal70%
Hydro16%
Others14% FY 15
9 July 2015 7
70093436
Highlight
Barclays | Asia Themes: India
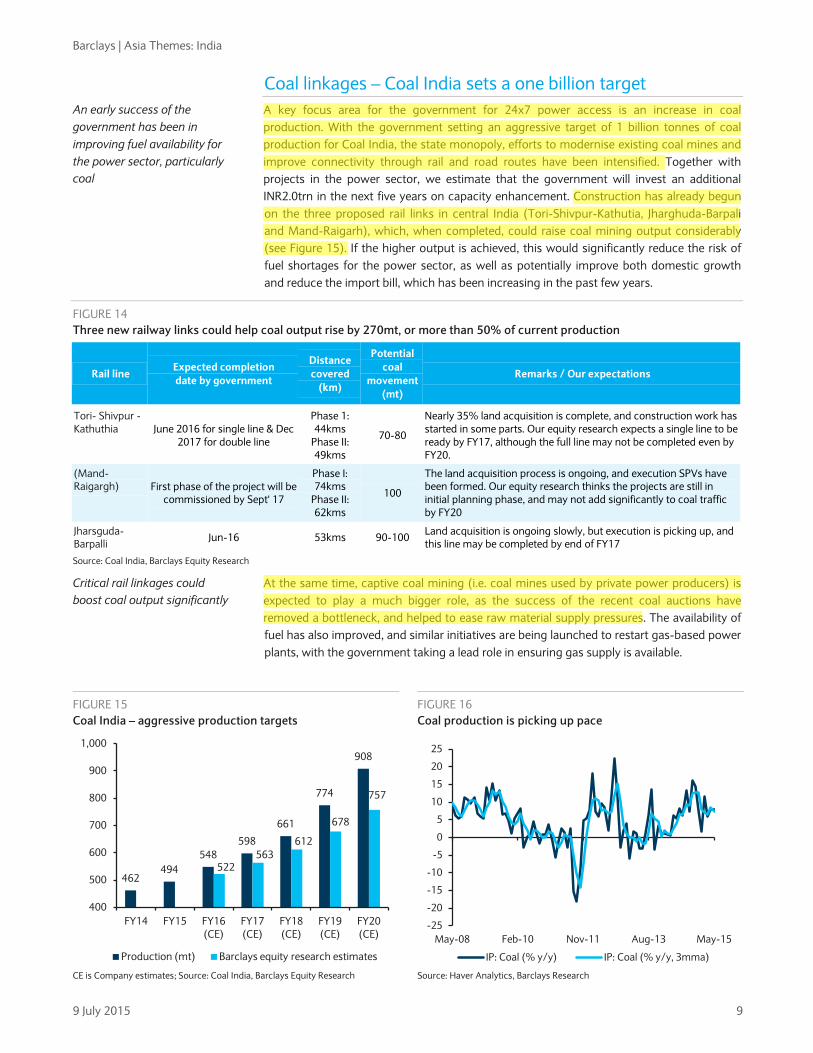
Coal linkages – Coal India sets a one billion target A key focus area for the government for 24x7 power access is an increase in coal production. With the government setting an aggressive target of 1 billion tonnes of coal production for Coal India, the state monopoly, efforts to modernise existing coal mines and improve connectivity through rail and road routes have been intensified. Together with projects in the power sector, we estimate that the government will invest an additional INR2.0trn in the next five years on capacity enhancement. Construction has already begun on the three proposed rail links in central India (Tori-Shivpur-Kathutia, Jharghuda-Barpali and Mand-Raigarh), which, when completed, could raise coal mining output considerably (see Figure 15). If the higher output is achieved, this would significantly reduce the risk of fuel shortages for the power sector, as well as potentially improve both domestic growth and reduce the import bill, which has been increasing in the past few years.
FIGURE 14 Three new railway links could help coal output rise by 270mt, or more than 50% of current production
Rail line Expected completion date by government
Distance covered
(km)
Potential coal
movement (mt)
Remarks / Our expectations
Tori- Shivpur - Kathuthia June 2016 for single line & Dec
2017 for double line
Phase 1: 44kms
Phase II: 49kms
70-80
Nearly 35% land acquisition is complete, and construction work has started in some parts. Our equity research expects a single line to be ready by FY17, although the full line may not be completed even by FY20.
(Mand- Raigargh) First phase of the project will be
commissioned by Sept' 17
Phase I: 74kms
Phase II: 62kms
100
The land acquisition process is ongoing, and execution SPVs have been formed. Our equity research thinks the projects are still in initial planning phase, and may not add significantly to coal traffic by FY20
Jharsguda-Barpalli Jun-16 53kms 90-100 Land acquisition is ongoing slowly, but execution is picking up, and
this line may be completed by end of FY17
Source: Coal India, Barclays Equity Research
At the same time, captive coal mining (i.e. coal mines used by private power producers) is expected to play a much bigger role, as the success of the recent coal auctions have removed a bottleneck, and helped to ease raw material supply pressures. The availability of fuel has also improved, and similar initiatives are being launched to restart gas-based power plants, with the government taking a lead role in ensuring gas supply is available.
An early success of the government has been in improving fuel availability for the power sector, particularly coal
Critical rail linkages could boost coal output significantly
FIGURE 15 Coal India – aggressive production targets
FIGURE 16 Coal production is picking up pace
CE is Company estimates; Source: Coal India, Barclays Equity Research Source: Haver Analytics, Barclays Research
462494
548598
661
774
908
522563
612
678
757
400
500
600
700
800
900
1,000
FY14 FY15 FY16 (CE)
FY17 (CE)
FY18 (CE)
FY19 (CE)
FY20 (CE)
Production (mt) Barclays equity research estimates
-25
-20
-15
-10
-5
0
5
10
15
20
25
May-08 Feb-10 Nov-11 Aug-13 May-15
IP: Coal (% y/y) IP: Coal (% y/y, 3mma)
9 July 2015 9
70093436
Highlight
70093436
Highlight
70093436
Highlight
Barclays | Asia Themes: India
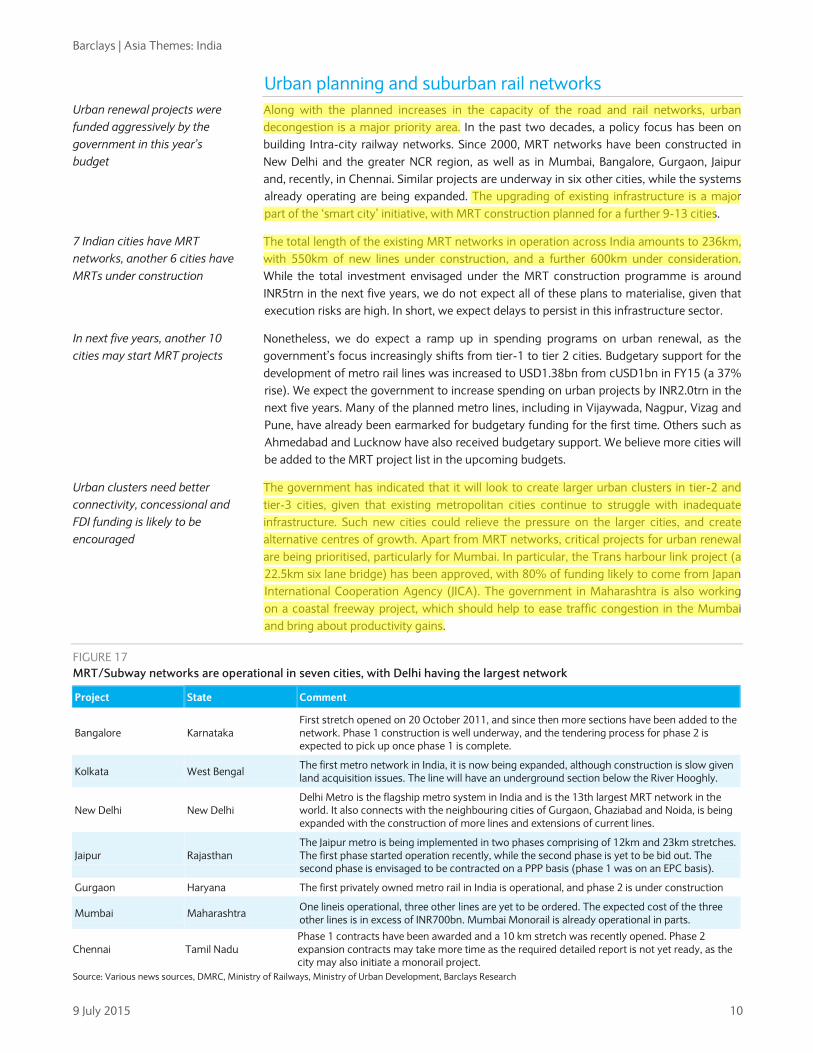
Urban planning and suburban rail networks Along with the planned increases in the capacity of the road and rail networks, urban decongestion is a major priority area. In the past two decades, a policy focus has been on building Intra-city railway networks. Since 2000, MRT networks have been constructed in New Delhi and the greater NCR region, as well as in Mumbai, Bangalore, Gurgaon, Jaipur and, recently, in Chennai. Similar projects are underway in six other cities, while the systems already operating are being expanded. The upgrading of existing infrastructure is a major part of the ‘smart city’ initiative, with MRT construction planned for a further 9-13 cities.
The total length of the existing MRT networks in operation across India amounts to 236km, with 550km of new lines under construction, and a further 600km under consideration. While the total investment envisaged under the MRT construction programme is around INR5trn in the next five years, we do not expect all of these plans to materialise, given that execution risks are high. In short, we expect delays to persist in this infrastructure sector.
Nonetheless, we do expect a ramp up in spending programs on urban renewal, as the government’s focus increasingly shifts from tier-1 to tier 2 cities. Budgetary support for the development of metro rail lines was increased to USD1.38bn from cUSD1bn in FY15 (a 37% rise). We expect the government to increase spending on urban projects by INR2.0trn in the next five years. Many of the planned metro lines, including in Vijaywada, Nagpur, Vizag and Pune, have already been earmarked for budgetary funding for the first time. Others such as Ahmedabad and Lucknow have also received budgetary support. We believe more cities will be added to the MRT project list in the upcoming budgets.
The government has indicated that it will look to create larger urban clusters in tier-2 and tier-3 cities, given that existing metropolitan cities continue to struggle with inadequate infrastructure. Such new cities could relieve the pressure on the larger cities, and create alternative centres of growth. Apart from MRT networks, critical projects for urban renewal are being prioritised, particularly for Mumbai. In particular, the Trans harbour link project (a 22.5km six lane bridge) has been approved, with 80% of funding likely to come from Japan International Cooperation Agency (JICA). The government in Maharashtra is also working on a coastal freeway project, which should help to ease traffic congestion in the Mumbai and bring about productivity gains.
FIGURE 17 MRT/Subway networks are operational in seven cities, with Delhi having the largest network
Project State Comment
Bangalore Karnataka First stretch opened on 20 October 2011, and since then more sections have been added to the network. Phase 1 construction is well underway, and the tendering process for phase 2 is expected to pick up once phase 1 is complete.
Kolkata West Bengal The first metro network in India, it is now being expanded, although construction is slow given land acquisition issues. The line will have an underground section below the River Hooghly.
New Delhi New Delhi Delhi Metro is the flagship metro system in India and is the 13th largest MRT network in the world. It also connects with the neighbouring cities of Gurgaon, Ghaziabad and Noida, is being expanded with the construction of more lines and extensions of current lines.
Jaipur Rajasthan The Jaipur metro is being implemented in two phases comprising of 12km and 23km stretches. The first phase started operation recently, while the second phase is yet to be bid out. The second phase is envisaged to be contracted on a PPP basis (phase 1 was on an EPC basis).
Gurgaon Haryana The first privately owned metro rail in India is operational, and phase 2 is under construction
Mumbai Maharashtra One lineis operational, three other lines are yet to be ordered. The expected cost of the three other lines is in excess of INR700bn. Mumbai Monorail is already operational in parts.
Chennai Tamil Nadu Phase 1 contracts have been awarded and a 10 km stretch was recently opened. Phase 2 expansion contracts may take more time as the required detailed report is not yet ready, as the city may also initiate a monorail project.
Source: Various news sources, DMRC, Ministry of Railways, Ministry of Urban Development, Barclays Research
Urban renewal projects were funded aggressively by the government in this year’s budget
7 Indian cities have MRT networks, another 6 cities have MRTs under construction
In next five years, another 10 cities may start MRT projects
Urban clusters need better connectivity, concessional and FDI funding is likely to be encouraged
9 July 2015 10
70093436
Highlight
70093436
Highlight
70093436
Highlight
70093436
Highlight
Barclays | Asia Themes: India
RAILWAYS, HIGHWAYS AND PORT CONNECTIVITY
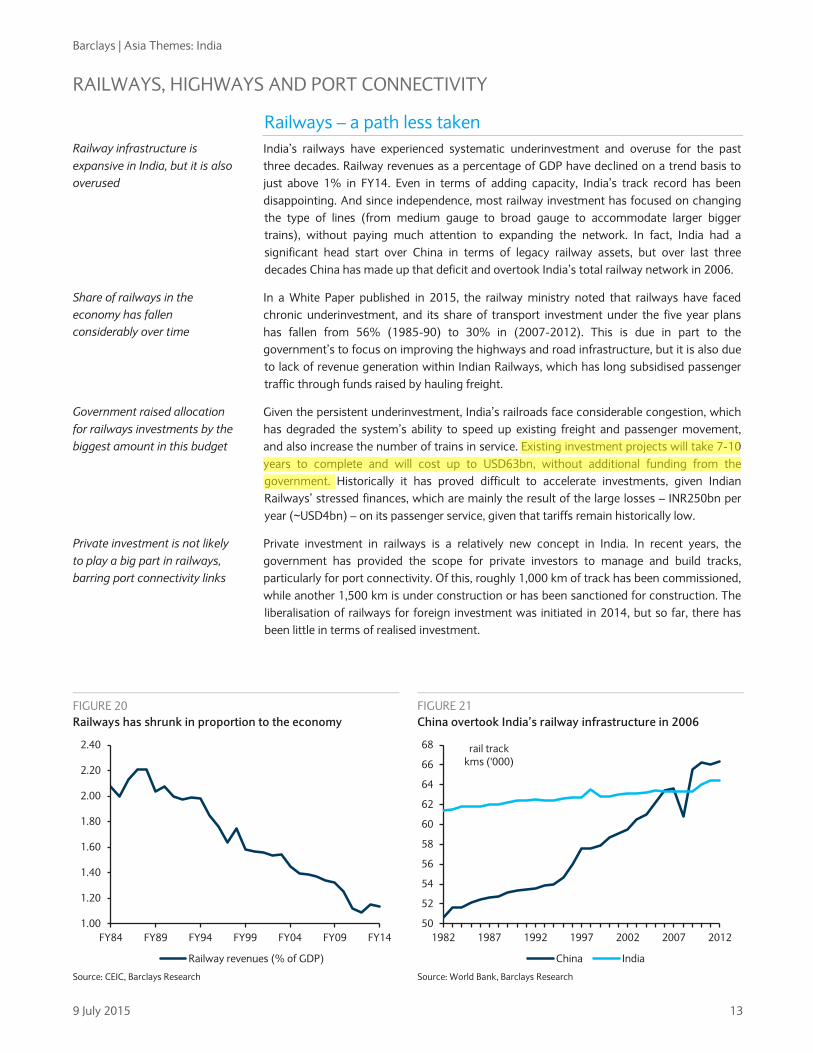
Railways – a path less taken India’s railways have experienced systematic underinvestment and overuse for the past three decades. Railway revenues as a percentage of GDP have declined on a trend basis to just above 1% in FY14. Even in terms of adding capacity, India’s track record has been disappointing. And since independence, most railway investment has focused on changing the type of lines (from medium gauge to broad gauge to accommodate larger bigger trains), without paying much attention to expanding the network. In fact, India had a significant head start over China in terms of legacy railway assets, but over last three decades China has made up that deficit and overtook India’s total railway network in 2006.
In a White Paper published in 2015, the railway ministry noted that railways have faced chronic underinvestment, and its share of transport investment under the five year plans has fallen from 56% (1985-90) to 30% in (2007-2012). This is due in part to the government’s to focus on improving the highways and road infrastructure, but it is also due to lack of revenue generation within Indian Railways, which has long subsidised passenger traffic through funds raised by hauling freight.
Given the persistent underinvestment, India’s railroads face considerable congestion, which has degraded the system’s ability to speed up existing freight and passenger movement, and also increase the number of trains in service. Existing investment projects will take 7-10 years to complete and will cost up to USD63bn, without additional funding from the government. Historically it has proved difficult to accelerate investments, given Indian Railways’ stressed finances, which are mainly the result of the large losses – INR250bn per year (~USD4bn) – on its passenger service, given that tariffs remain historically low.
Private investment in railways is a relatively new concept in India. In recent years, the government has provided the scope for private investors to manage and build tracks, particularly for port connectivity. Of this, roughly 1,000 km of track has been commissioned, while another 1,500 km is under construction or has been sanctioned for construction. The liberalisation of railways for foreign investment was initiated in 2014, but so far, there has been little in terms of realised investment.
FIGURE 20 Railways has shrunk in proportion to the economy
FIGURE 21 China overtook India’s railway infrastructure in 2006
Source: CEIC, Barclays Research Source: World Bank, Barclays Research
Railway infrastructure is expansive in India, but it is also overused
Share of railways in the economy has fallen considerably over time
Government raised allocation for railways investments by the biggest amount in this budget
Private investment is not likely to play a big part in railways, barring port connectivity links
1.00
1.20
1.40
1.60
1.80
2.00
2.20
2.40
FY84 FY89 FY94 FY99 FY04 FY09 FY14
Railway revenues (% of GDP)
50
52
54
56
58
60
62
64
66
68
1982 1987 1992 1997 2002 2007 2012
rail track kms ('000)
China India
9 July 2015 13
70093436
Highlight
Barclays | Asia Themes: India
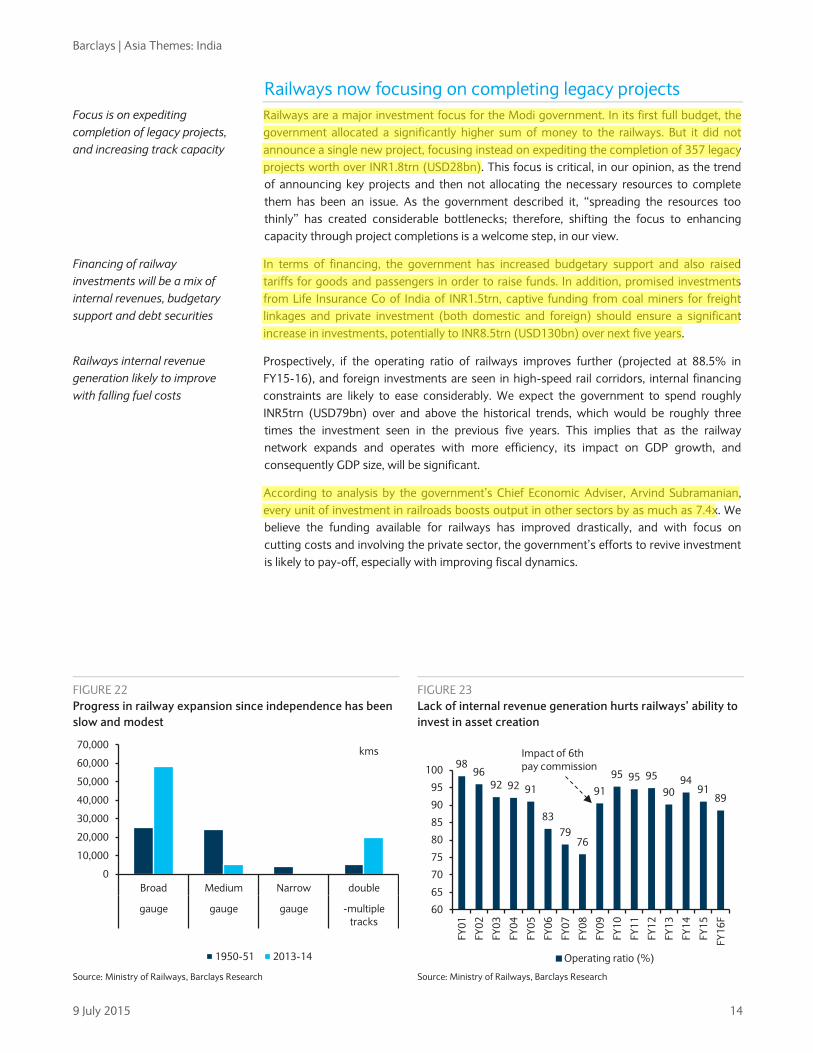
Railways now focusing on completing legacy projects Railways are a major investment focus for the Modi government. In its first full budget, the government allocated a significantly higher sum of money to the railways. But it did not announce a single new project, focusing instead on expediting the completion of 357 legacy projects worth over INR1.8trn (USD28bn). This focus is critical, in our opinion, as the trend of announcing key projects and then not allocating the necessary resources to complete them has been an issue. As the government described it, “spreading the resources too thinly” has created considerable bottlenecks; therefore, shifting the focus to enhancing capacity through project completions is a welcome step, in our view.
In terms of financing, the government has increased budgetary support and also raised tariffs for goods and passengers in order to raise funds. In addition, promised investments from Life Insurance Co of India of INR1.5trn, captive funding from coal miners for freight linkages and private investment (both domestic and foreign) should ensure a significant increase in investments, potentially to INR8.5trn (USD130bn) over next five years.
Prospectively, if the operating ratio of railways improves further (projected at 88.5% in FY15-16), and foreign investments are seen in high-speed rail corridors, internal financing constraints are likely to ease considerably. We expect the government to spend roughly INR5trn (USD79bn) over and above the historical trends, which would be roughly three times the investment seen in the previous five years. This implies that as the railway network expands and operates with more efficiency, its impact on GDP growth, and consequently GDP size, will be significant.
According to analysis by the government’s Chief Economic Adviser, Arvind Subramanian, every unit of investment in railroads boosts output in other sectors by as much as 7.4x. We believe the funding available for railways has improved drastically, and with focus on cutting costs and involving the private sector, the government’s efforts to revive investment is likely to pay-off, especially with improving fiscal dynamics.
Focus is on expediting completion of legacy projects, and increasing track capacity
Financing of railway investments will be a mix of internal revenues, budgetary support and debt securities
Railways internal revenue generation likely to improve with falling fuel costs
FIGURE 22 Progress in railway expansion since independence has been slow and modest
FIGURE 23 Lack of internal revenue generation hurts railways’ ability to invest in asset creation
Source: Ministry of Railways, Barclays Research Source: Ministry of Railways, Barclays Research
0
10,000
20,000
30,000
40,000
50,000
60,000
70,000
Broad Medium Narrow double
gauge gauge gauge -multiple tracks
kms
1950-51 2013-14
9896
92 92 91
8379
76
91
95 95 9590
9491
89
60
65
70
75
80
85
90
95
100
FY01
FY02
FY03
FY04
FY05
FY06
FY07
FY08
FY09
FY10
FY11
FY12
FY13
FY14
FY15
FY16
F
Operating ratio (%)
Impact of 6th pay commission
9 July 2015 14
70093436
Highlight
70093436
Highlight
70093436
Highlight
Barclays | Asia Themes: India
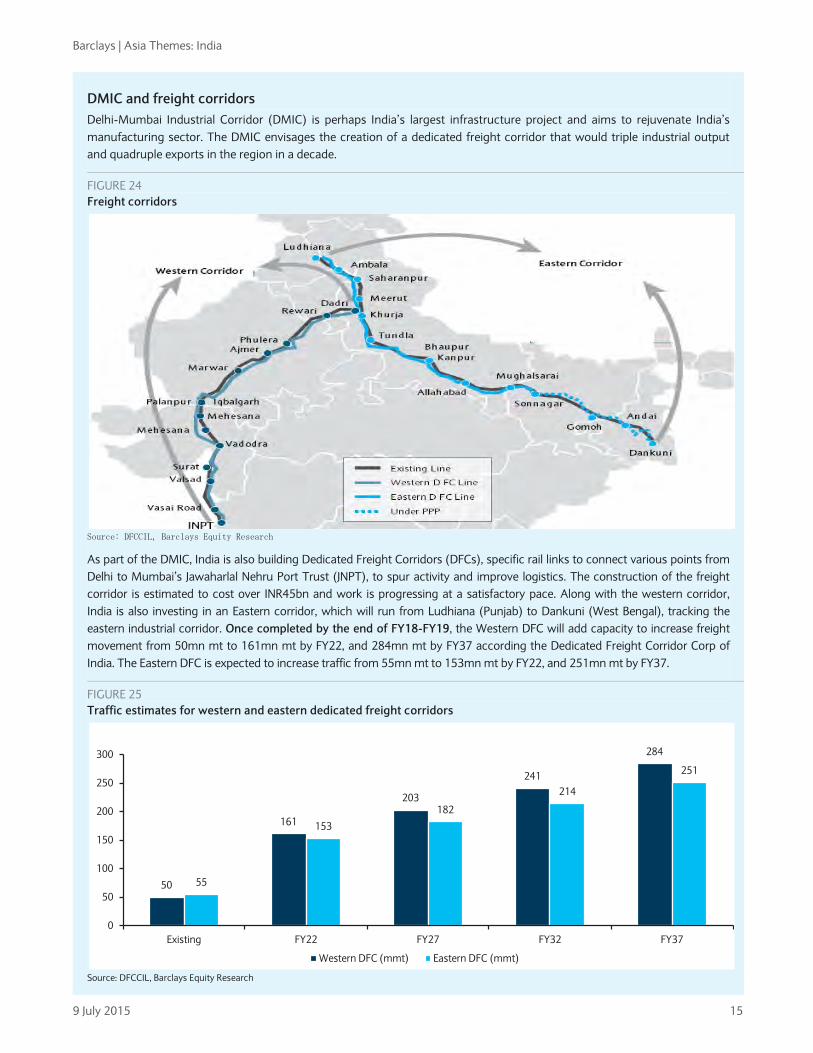
DMIC and freight corridors Delhi-Mumbai Industrial Corridor (DMIC) is perhaps India’s largest infrastructure project and aims to rejuvenate India’s manufacturing sector. The DMIC envisages the creation of a dedicated freight corridor that would triple industrial output and quadruple exports in the region in a decade.
FIGURE 24 Freight corridors
Source: DFCCIL, Barclays Equity Research
As part of the DMIC, India is also building Dedicated Freight Corridors (DFCs), specific rail links to connect various points from Delhi to Mumbai’s Jawaharlal Nehru Port Trust (JNPT), to spur activity and improve logistics. The construction of the freight corridor is estimated to cost over INR45bn and work is progressing at a satisfactory pace. Along with the western corridor, India is also investing in an Eastern corridor, which will run from Ludhiana (Punjab) to Dankuni (West Bengal), tracking the eastern industrial corridor. Once completed by the end of FY18-FY19, the Western DFC will add capacity to increase freight movement from 50mn mt to 161mn mt by FY22, and 284mn mt by FY37 according the Dedicated Freight Corridor Corp of India. The Eastern DFC is expected to increase traffic from 55mn mt to 153mn mt by FY22, and 251mn mt by FY37.
FIGURE 25 Traffic estimates for western and eastern dedicated freight corridors
Source: DFCCIL, Barclays Equity Research
50
161
203
241
284
55
153
182
214
251
0
50
100
150
200
250
300
Existing FY22 FY27 FY32 FY37
Western DFC (mmt) Eastern DFC (mmt)
9 July 2015 15
Barclays | Asia Themes: India
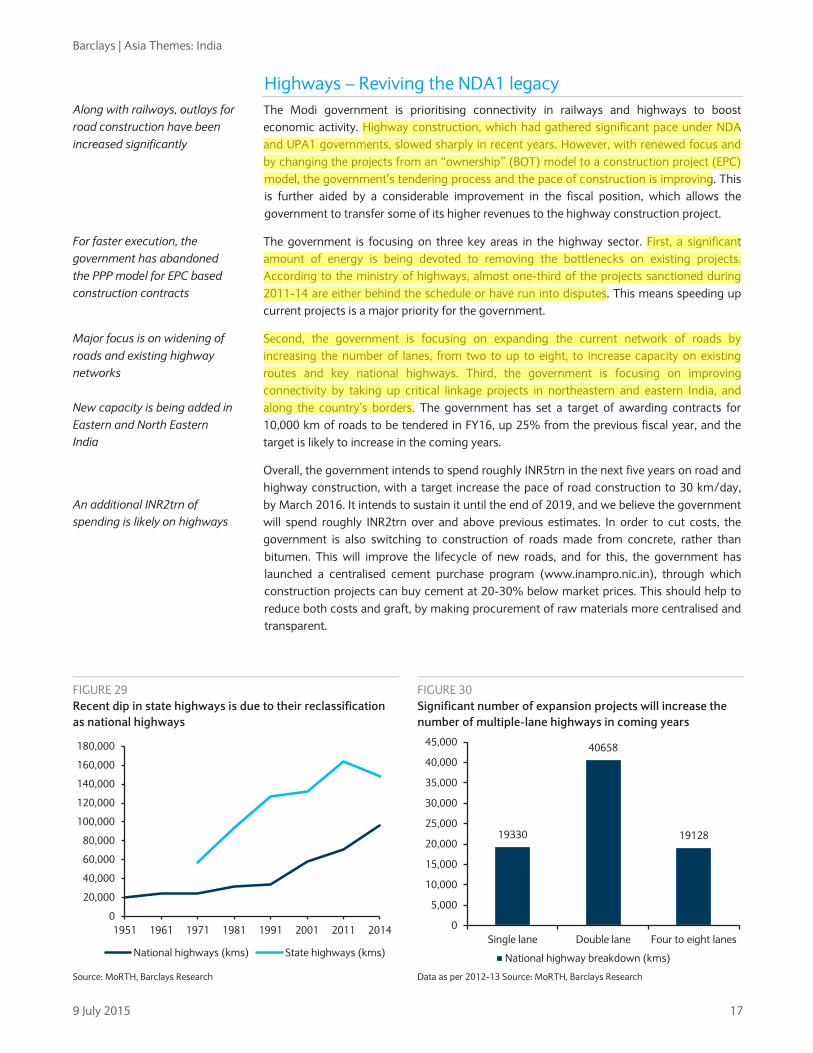
Highways – Reviving the NDA1 legacy The Modi government is prioritising connectivity in railways and highways to boost economic activity. Highway construction, which had gathered significant pace under NDA and UPA1 governments, slowed sharply in recent years. However, with renewed focus and by changing the projects from an “ownership” (BOT) model to a construction project (EPC) model, the government’s tendering process and the pace of construction is improving. This is further aided by a considerable improvement in the fiscal position, which allows the government to transfer some of its higher revenues to the highway construction project.
The government is focusing on three key areas in the highway sector. First, a significant amount of energy is being devoted to removing the bottlenecks on existing projects. According to the ministry of highways, almost one-third of the projects sanctioned during 2011-14 are either behind the schedule or have run into disputes. This means speeding up current projects is a major priority for the government.
Second, the government is focusing on expanding the current network of roads by increasing the number of lanes, from two to up to eight, to increase capacity on existing routes and key national highways. Third, the government is focusing on improving connectivity by taking up critical linkage projects in northeastern and eastern India, and along the country’s borders. The government has set a target of awarding contracts for 10,000 km of roads to be tendered in FY16, up 25% from the previous fiscal year, and the target is likely to increase in the coming years.
Overall, the government intends to spend roughly INR5trn in the next five years on road and highway construction, with a target increase the pace of road construction to 30 km/day, by March 2016. It intends to sustain it until the end of 2019, and we believe the government will spend roughly INR2trn over and above previous estimates. In order to cut costs, the government is also switching to construction of roads made from concrete, rather than bitumen. This will improve the lifecycle of new roads, and for this, the government has launched a centralised cement purchase program (www.inampro.nic.in), through which construction projects can buy cement at 20-30% below market prices. This should help to reduce both costs and graft, by making procurement of raw materials more centralised and transparent.
Along with railways, outlays for road construction have been increased significantly
For faster execution, the government has abandoned the PPP model for EPC based construction contracts
FIGURE 29 Recent dip in state highways is due to their reclassification as national highways
FIGURE 30 Significant number of expansion projects will increase the number of multiple-lane highways in coming years
Source: MoRTH, Barclays Research Data as per 2012-13 Source: MoRTH, Barclays Research
Major focus is on widening of roads and existing highway networks New capacity is being added in Eastern and North Eastern India
An additional INR2trn of spending is likely on highways
0
20,000
40,000
60,000
80,000
100,000
120,000
140,000
160,000
180,000
1951 1961 1971 1981 1991 2001 2011 2014
National highways (kms) State highways (kms)
19330
40658
19128
0
5,000
10,000
15,000
20,000
25,000
30,000
35,000
40,000
45,000
Single lane Double lane Four to eight lanes
National highway breakdown (kms)
9 July 2015 17
70093436
Highlight
70093436
Highlight
70093436
Highlight

Barclays | Asia Themes: India
Ports and waterways – Providing ‘last mile’ connectivity A key priority area for the government is to upgrade India’s port infrastructure, to provide ‘last mile’ connectivity, particularly for exporters. Under its Sagar Mala (Ocean’s garland) project, the government plans to modernise, expand or construct 200 commercial ports, including 12 major sea ports, as well as upgrade 101 inland waterways in order to promote cheaper and alternative transportation for both goods and passengers. This blue revolution project is largely focused on eastern India around the River Ganga belt, which accounts for 40% of India’s economic activity.
Work has begun on modernising of key ports, including Mumbai’s JNPT, and more projects are likely to be taken up in coming months. In addition, large satellite ports are likely to be constructed around existing ports – the JNPT, and the ports in Mundra port and Kochin – to ad capacity and ease constraints in these ports. This will be supplemented by investment in private ports, such as the recent announcement of Vizhinjam port in Kerala, an estimated investment of INR40bn. As part of the overall initiative, the ports ministry plans to create 12 new greenfield cities around these major ports, designating them as special coastal economic zones that will have last-mile connectivity with roadways and railways.
These projects are will be connected to economic corridors, such as the DMIC, and should help with the last-stage shipment of goods, largely expected to be for export purposes. The total cost of the upgrade has not been disclosed, but road and rail construction projects, along with expansion of JNPT, already amounts to a total investment of more than USD1bn, with the final cost likely to be several times that figure. Once finished, the sector is likely to see investments of INR1trn more than previously planned. Project funding is likely to be done through a development cess on cargo handled, and also through concessionaire funding from international and national agencies.
FIGURE 32 India’s port upgrades are integrated with its dedicated freight corridors
Source: DFCCIL, Ministry of Shipping, Barclays Research
Haldia
Paradip
Vizag
Ennore
Chennai
TuticorinCochin
Mangalore
Marmagao
JNPT
Mumbai
Kandla
Delhi
Ludhiana
Major government ports -
Freight and industrial corridor
Industrial corridor
India's eastern states have low urbanisation. EDFC will help increase urbanisation
DMIC 's freight corridor connects key ports with manufacturing clusters
India is planning on upgrading 12 major sea ports, along with internal waterways
Work on expansion has already begun in JNPT, India’s largest port
Major ports are likely to be connected to the freight corridors, thus boosting logistics considerably
9 July 2015 19
70093436
Highlight
70093436
Highlight
El
Goldman Sachs Global Investment Research 7
Top of Mind Issue 36
Kenneth Ho and Kinger Lau address equity margin financing and other credit-related threats to China’s growth and financial stability
The explosion in margin financing behind the recent astonishing run-up in Chinese A shares is a new twist on China credit concerns, a long-standing grey swan for Chinese and global growth. As of the beginning of June, the balance of margin financing outstanding was RMB2.2tn, an estimated 12% of the free float market cap of marginable stocks and 3.5% of GDP—easily the highest in the history of global equity markets. And these estimates do not take into account “hidden” leverage from other types of borrowing (i.e., consumer loans and trust products) where proceeds were used to invest in stocks, which we estimate at RMB 1tn to RMB 1.5tn, assuming effective system-wide leverage of 2.2x.
We estimate that a significant portion of the hidden leverage has now been unwound and the reported official margin balance has dropped to RMB1.5tn. This unwinding has contributed to a dramatic correction in Chinese equity markets, erasing a sizable portion—though not all—of the stock gains this year. While a range of market-supporting policies (banning of selling from large stakeholders for a period of six months, suspending IPOs, relaxing the forced selling requirement of underwater margin positions, among others) finally halted the sell-off on July 9, questions remain about whether the equity market turmoil could threaten other Chinese assets, economic growth and broader financial market stability.
Some damage, but likely contained
We think an aggressive policy response will need to be maintained for the government to keep stability in the A-shares market, which has been dominated by retail investors who tend to be less influenced by fundamentals. Without such a response, a further correction in A-shares is likely, and we could see continued moderate spillovers to other assets. For example, some corporate credit spreads have already begun to widen. Recent commodity price sell-offs may also be related to China equity developments, although there are clearly other fundamental drivers also behind the commodity weakness.
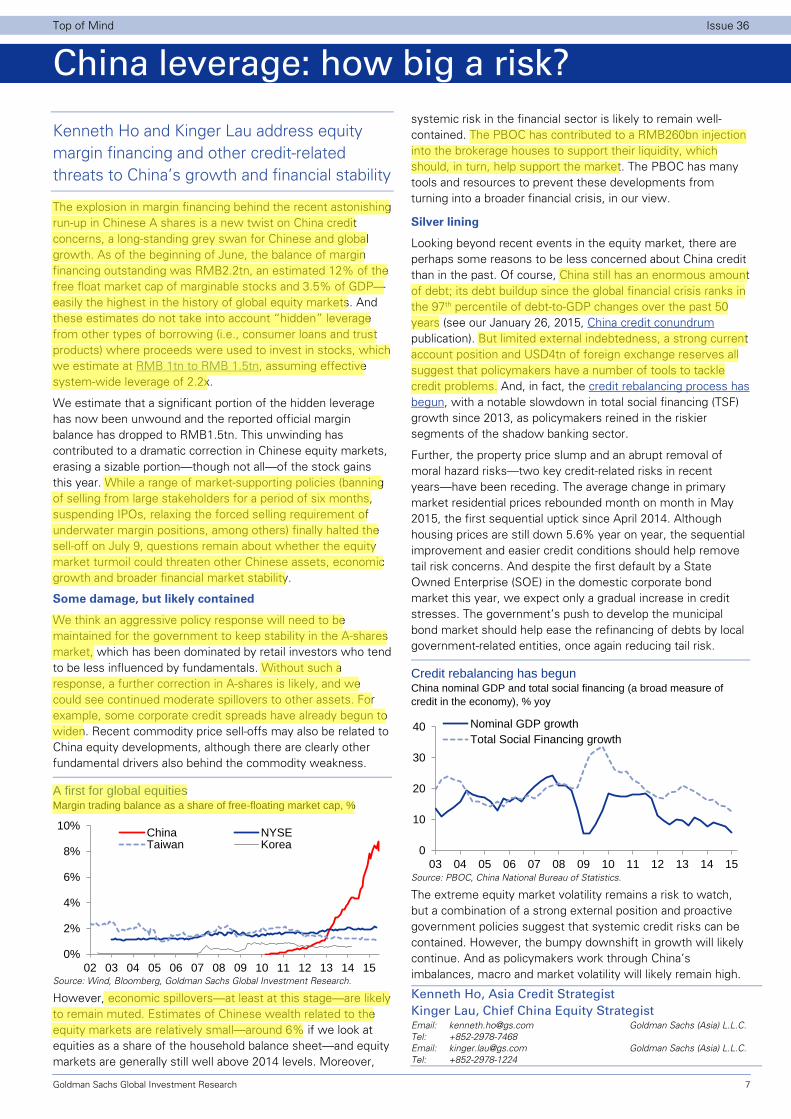
A first for global equities Margin trading balance as a share of free-floating market cap, %
Source: Wind, Bloomberg, Goldman Sachs Global Investment Research.
However, economic spillovers—at least at this stage—are likely to remain muted. Estimates of Chinese wealth related to the equity markets are relatively small—around 6% if we look at equities as a share of the household balance sheet—and equity markets are generally still well above 2014 levels. Moreover,
systemic risk in the financial sector is likely to remain well-contained. The PBOC has contributed to a RMB260bn injection into the brokerage houses to support their liquidity, which should, in turn, help support the market. The PBOC has many tools and resources to prevent these developments from turning into a broader financial crisis, in our view.
Silver lining
Looking beyond recent events in the equity market, there are perhaps some reasons to be less concerned about China credit than in the past. Of course, China still has an enormous amount of debt; its debt buildup since the global financial crisis ranks in the 97th percentile of debt-to-GDP changes over the past 50 years (see our January 26, 2015, China credit conundrum publication). But limited external indebtedness, a strong current account position and USD4tn of foreign exchange reserves all suggest that policymakers have a number of tools to tackle credit problems. And, in fact, the credit rebalancing process has begun, with a notable slowdown in total social financing (TSF) growth since 2013, as policymakers reined in the riskier segments of the shadow banking sector.
Further, the property price slump and an abrupt removal of moral hazard risks—two key credit-related risks in recent years—have been receding. The average change in primary market residential prices rebounded month on month in May 2015, the first sequential uptick since April 2014. Although housing prices are still down 5.6% year on year, the sequential improvement and easier credit conditions should help remove tail risk concerns. And despite the first default by a State Owned Enterprise (SOE) in the domestic corporate bond market this year, we expect only a gradual increase in credit stresses. The government’s push to develop the municipal bond market should help ease the refinancing of debts by local government-related entities, once again reducing tail risk.
Credit rebalancing has begun China nominal GDP and total social financing (a broad measure of credit in the economy), % yoy
Source: PBOC, China National Bureau of Statistics.
The extreme equity market volatility remains a risk to watch, but a combination of a strong external position and proactive government policies suggest that systemic credit risks can be contained. However, the bumpy downshift in growth will likely continue. And as policymakers work through China’s imbalances, macro and market volatility will likely remain high.
Kenneth Ho, Asia Credit Strategist Kinger Lau, Chief China Equity Strategist Email: [email protected] Goldman Sachs (Asia) L.L.C. Tel: +852-2978-7468 Email: [email protected] Goldman Sachs (Asia) L.L.C. Tel: +852-2978-1224
0%
2%
4%
6%
8%
10%
02 03 04 05 06 07 08 09 10 11 12 13 14 15
China NYSETaiwan Korea 0
10
20
30
40
03 04 05 06 07 08 09 10 11 12 13 14 15
Nominal GDP growthTotal Social Financing growth
China leverage: how big a risk?
70093436
Highlight
70093436
Highlight
70093436
Highlight
70093436
Highlight
70093436
Highlight
70093436
Highlight
70093436
Highlight
70093436
Highlight
70093436
Highlight
70093436
Highlight
China's Stock Market Pain Is India’s Financial Gain by Santanu Chakraborty, July 24, 2015
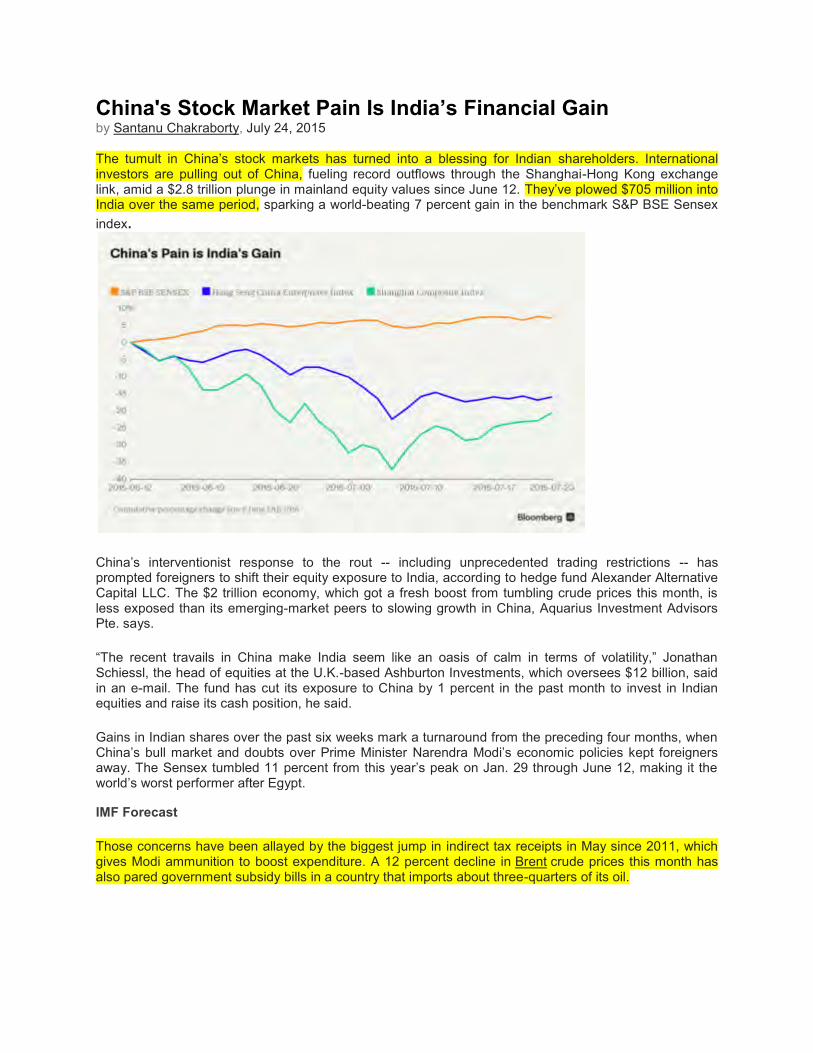
The tumult in China’s stock markets has turned into a blessing for Indian shareholders. International investors are pulling out of China, fueling record outflows through the Shanghai-Hong Kong exchange link, amid a $2.8 trillion plunge in mainland equity values since June 12. They’ve plowed $705 million into India over the same period, sparking a world-beating 7 percent gain in the benchmark S&P BSE Sensex index.
China’s interventionist response to the rout -- including unprecedented trading restrictions -- has prompted foreigners to shift their equity exposure to India, according to hedge fund Alexander Alternative Capital LLC. The $2 trillion economy, which got a fresh boost from tumbling crude prices this month, is less exposed than its emerging-market peers to slowing growth in China, Aquarius Investment Advisors Pte. says.
“The recent travails in China make India seem like an oasis of calm in terms of volatility,” Jonathan Schiessl, the head of equities at the U.K.-based Ashburton Investments, which oversees $12 billion, said in an e-mail. The fund has cut its exposure to China by 1 percent in the past month to invest in Indian equities and raise its cash position, he said.
Gains in Indian shares over the past six weeks mark a turnaround from the preceding four months, when China’s bull market and doubts over Prime Minister Narendra Modi’s economic policies kept foreigners away. The Sensex tumbled 11 percent from this year’s peak on Jan. 29 through June 12, making it the world’s worst performer after Egypt.
IMF Forecast
Those concerns have been allayed by the biggest jump in indirect tax receipts in May since 2011, which gives Modi ammunition to boost expenditure. A 12 percent decline in Brent crude prices this month has also pared government subsidy bills in a country that imports about three-quarters of its oil.

India’s economy expanded 7.5 percent in the March quarter, beating China’s 7 percent growth, while the International Monetary Fund predicts India will outpace its neighbor in the current fiscal year.
The longer-term growth outlook is also stronger in India because of its superior demographics, according to Franklin Templeton Templeton Investments. More than 62 percent of the nation’s 1.2 billion people are between age 15 and 59, government data show. China’s pool of workers in this age group is expected to shrink by 61 million by 2030, according to United Nations. That’s about the equivalent of losing the combined working populations of the U.K. and France.
“India is in a phase in which multiple engines of growth can drive GDP from 7-8 percent to 9-10 percent in the next five years,” said Sukumar Rajah, who manages about $9 billion as chief investment officer of Asian Equity at Franklin Templeton in Singapore. “For China, we expect growth to decelerate over the next few years partly because it doesn’t benefit from demographic trends the way that India does.”
State Intervention
Templeton is overweight India and underweight Chinese shares in Hong Kong relative to benchmark indexes, Rajah said. He’s bullish on Indian industrial companies such Larsen & Toubro Ltd. amid signs of increased spending on infrastructure. The Hang Seng China Enterprises Index declined 0.8 percent at 1:19 p.m. in Hong Kong on Friday after a private gauge of Chinese manufacturing unexpectedly fell to the lowest level in 15 months. India’s Sensex lost 0.3 percent in Mumbai trading, poised for a weekly decline.
For overseas money managers, China’s meddling has raised concern about the government’s promise to enact the free-market reforms needed to make mainland shares eligible for MSCI Inc.’s benchmark indexes. Measures to end the rout include a ban on selling by major shareholders, halting initial public offerings and allowing more than 1,400 companies to suspend trading.

“The intervention puts a wet blanket on China’s indices being included in the MSCI gauges,” said Michael Corcelli, chief investment officer of Alexander Alternative in Miami. The steps “are bad for China and definitely good for India,” he said.
Deficient Rainfall
India’s stocks rally may unravel if the strengthening El Nino weather pattern weakens monsoon rains, said Anil Ahuja, the Singapore-based chief executive officer of hedge fund IPEplus Advisors. The June-September rainfall, which was 16 percent above a 50-year average at the end of last month, is now 7 percent below normal, according to the weather office. The monsoon waters more than half of India’s farmland and a shortfall can stoke food prices.
The Sensex gauge trades at 15.9 times 12-month projected profits, compared with a five-year mean of 14.4, data compiled by Bloomberg show. The Hang Seng China Enterprises is valued at 8 times.
“A weak monsoon has not been priced in,” Ahuja said. “Valuation multiples are high versus long-term averages. If earnings don’t begin to justify valuations soon, investors will start to move away.” Indian earnings are projected to grow about seven times faster than China over the next 12 months. Profits at Sensex companies will climb 30 percent, versus 4.3 percent for the Hang Seng China Enterprises Index, analyst estimates compiled by Bloomberg show.
“India’s recent outperformance could be because it has a steady macro-economic picture and is relatively insulated from any slowdown in China compared with other emerging markets such as South Korea and Brazil,” said A.S. Thiyaga Rajan, a Singapore-based senior managing director at Aquarius. “India could see greater interest, now that it is projected to be the fastest-growing major economy.”
The story behind sudden boom in distressed assets
business
Anand Adhikari and Mahesh Nayak July 16, 2015
On the 10th of every month, State Bank of India's headquarters at Nariman Point in South Mumbai plays host to
some eager guests. Heads of several of India's 15 asset reconstruction companies (ARCs) make a beeline to
review the 'for sale' bad loans that India's largest bank would be willing to hawk for a price. A similar exercise
takes place at some of India's largest banks, though not necessarily with such regularity.
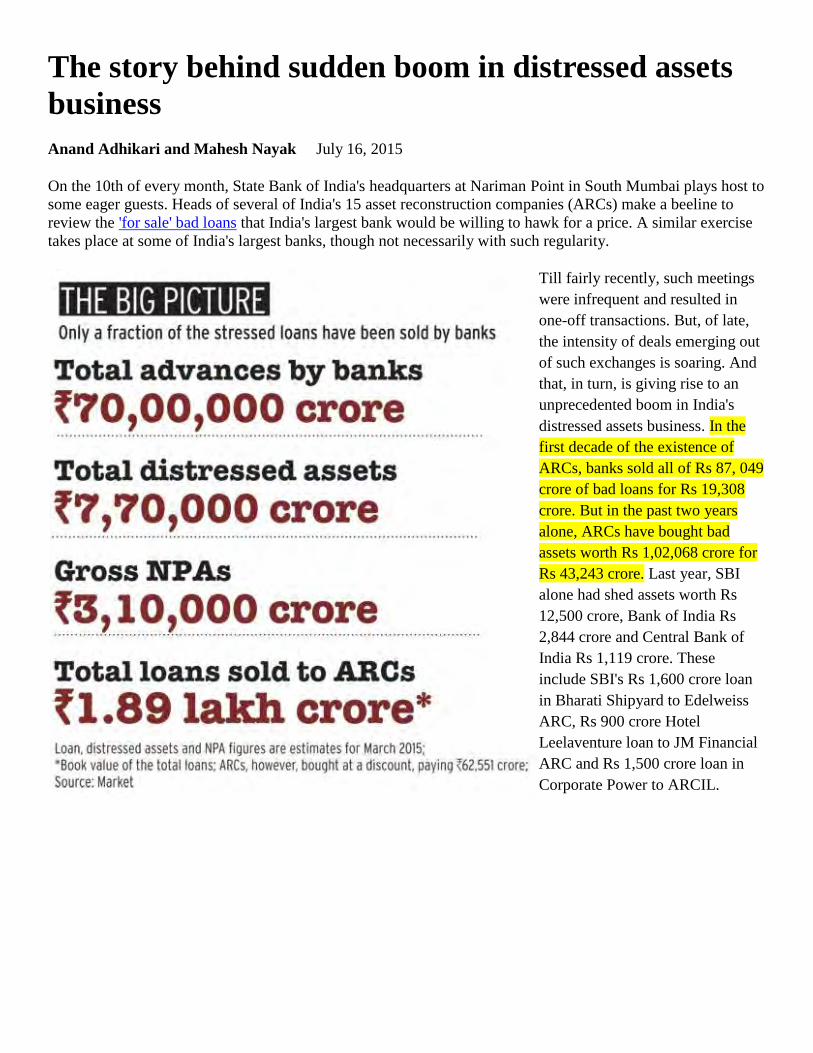
Till fairly recently, such meetings
were infrequent and resulted in
one-off transactions. But, of late,
the intensity of deals emerging out
of such exchanges is soaring. And
that, in turn, is giving rise to an
unprecedented boom in India's
distressed assets business. In the
first decade of the existence of
ARCs, banks sold all of Rs 87, 049
crore of bad loans for Rs 19,308
crore. But in the past two years
alone, ARCs have bought bad
assets worth Rs 1,02,068 crore for
Rs 43,243 crore. Last year, SBI
alone had shed assets worth Rs
12,500 crore, Bank of India Rs
2,844 crore and Central Bank of
India Rs 1,119 crore. These
include SBI's Rs 1,600 crore loan
in Bharati Shipyard to Edelweiss
ARC, Rs 900 crore Hotel
Leelaventure loan to JM Financial
ARC and Rs 1,500 crore loan in
Corporate Power to ARCIL.

Several factors are driving this flourishing trade in bad assets. But the biggest trigger
came in November 2013 when Reserve Bank of India Governor Raghuram Rajan, in
a strongly worded exhortation, asked the banking system to clean up its act. "You
can put lipstick on a pig but it doesn't become a princess. So dressing up a loan and
showing it as restructured and not provisioning for it when it stops paying, is an
issue," he had said. Until then, scared to bell the cat, banks had been ever-greening
their bad loans - and slipping deeper into the abyss. What alarmed Rajan was that the
gross and net non-performing assets (NPAs) in the banking system had hit an
alarming 4 .2 per cent and 2.2 per cent, respectively, by September 2013 when Rajan
came in, against an average of 2.6 per cent and 1.2 per cent, respectively, between
2009 and 2013.
Under Rajan's stewardship, the RBI has announced a host of measures that have
fuelled distressed asset sale business. Early last year, the central bank allowed the
banks to sell even the loans where the principal or interest was overdue by 60 days
rather than 90 days, earlier. In essence, it allowed banks to start selling assets early if
they felt the loan was non-redeemable. Other factors are also responsible. ARCs are
betting heavily on the proposed new bankruptcy law which will give them a greater
leeway (including sale of whole or part of the company and change of management
or promoter) to revive the distressed assets. Four, in general, the industry believes
that the Indian economy has seen through the worst of the slowdown and things can
only look up from here. And, those who have the cash are happy to buy distressed
assets since they come at a significant discount to an identical greenfield project.
For over 10 years, it was only ARCIL, backed by SBI and ICICI, which was active
in buying loans from its sponsor banks. But a majority of new ARCs have been set
up after 2008/09. Among the newest, Edelweiss ARC which was set up in 2009, has
worked up a portfolio of over Rs 20,000 crore. At the second spot is ARCIL with a
portfolio of Rs 11,000 crore. The top five ARCs make for nearly 90 per cent of the
accounts under management. Essentially, that means the ARC takes over the asset, or
company, and tries to revive it by managing it better, instead of trying to recover
money by selling off parts of it. Not everybody is chasing assets under management
(AUMs) though. "We look at it as an investment business. We are not in the AUM
game," grins Eshwar Karra, CEO of Phoenix ARC, Kotak Group, formed in 2004.
Karra deals with only sub-Rs100-crore loans, with a focus on turning around the
companies and sold quickly instead of volumes
The big reason why ARCs remain enthusiastic is because sale of bad loans will only
intensify. Banks, after all, are sitting on a pile of bad debts. Of the Rs 70 lakh crore
that the banking system has given in advances, nearly Rs 7.7 lakh crore is believed to
be classified as 'stressed assets' that have defaulted on their payments. Of this, Rs3.1
lakh crore is already defined as gross NPAs on which there has been a default. A lot
of that is likely to be made available to ARCs for sale. So, while the banks are being
pushed by the regulator to clean up their books, ARCs see an opportunity of making
big bucks like their counterpart asset management companies (AMCs) and hedge
funds in the US

Globally, the distressed assets market began to emerge in the
late 80s and early 90s in the US. In fact, most of the modern
day private equity firms - KKR, WL Ross and JC Flower - owe
their existence to early successes in the distressed assets
business. By now, the US is also a major market for the
ancillary industry around distressed assets, including trade in
bonds of distressed companies and turnaround funds which buy
completely broke companies, take over their managements,
turn them around and then sell them. In Asia, the distress
industry grew post the East Asian currency crisis in the late
90s. Early distress investors, such as Clearwater, Cerberus
Capital, GE and Loan Star Funds, have made significant gains
from such junk assets. Over the years, hedge funds have
become rich and powerful enough to intervene in sovereign
debt as Argentina is beginning to discover in the bitter dispute
between two New York hedge funds Gramercy Funds
Management LLC and Elliott Management Corp. In fact,
Elliott even impounded an Argentine Navy vessel for non-
payment, while the Argentine President Cristina Fernandez de
Kirchner has vowed never to negotiate with the fund calling it "vultures".
A Hard Job
Despite the enthusiasm around distressed assets, it is not a job
for the faint hearted.
ARCs are a breed born out of the Securitisation and
Reconstruction of Financial Assets and Enforcement of
Security Interest (SARFAESI) Act of 2002. The objective, says
former finance minister Yashwant Sinha, "was to enable the
banks to acquire the
securities which had
been pledged and sell
them without the
interference of the
courts". Sinha adds:
"We did away under
this Act with the
jurisdiction of civil
courts and gave a huge
power to the banks to deal with the issue of NPAs."
Not everything has panned out exactly as planned. Several legal and
regulatory hurdles have meant that ARCs were unable to exercise the
kind of freedom to turn around these bad assets. "We have such a
decrepit system for enforcing securities. In theory, it should be easier to
enforce a pledge to sell a company and kick the management out, but
most company managements will not go easily, and buyers don't want
to get into this trouble. He will buy only if you are giving it to him 100
per cent in an uncontentious manner," says Harsh Pais, Partner,
Trilegal, a Delhi-based law firm.

Take the case of Bharati Shipyard. A year after Edelweiss ARC bought Bharati Shipyard's Rs 4,570 crore loan
from 12 of its 23 bankers, there awaited a surprise. As many as nine winding up petitions appeared out of the
blue in the Bombay High Court thwarting the attempts of Edelweiss to turn around the cash-strapped ship
building firm. Surprisingly, insurance giant Life Insurance Corporation (LIC) was also one of the petitioners
despite being a secured creditor.
Yet, Edelweiss group chairman and CEO Rashesh Shah remains bullish. Shah, who began his career with the
ICICI group when it was still a development finance institution and had not turned into a bank, believes he
knows how to deal with stressed assets. "Very often a distressed company is still viable, but it is just that it is
indebted," says Shah.
Last year, SBI and Bank of India jointly sold a
loan of a distressed commercial mall in upmarket
Bangalore. Phoenix ARC and Edelweiss ARC
acquired the loans at different points in time from
three banks and they agreed to work together to
revive the Mall. It was a semi-finished mall with a
loan outstanding of Rs 400 crore. The project also
had ready tenants on papers, but because of lack
of funds, the mall's work was suspended
indefinitely. The banking channel refused to lend
and non-banking financial institutions (NBFCs)
were circumspect. The two ARCs acted swiftly by
bringing in an additional Rs 70 crore to complete
the project. "The stalled mall had no value, but by
infusing additional funds, we will increase the
value of the fully occupied mall to Rs600 crore
based on the annual lease rental income of over
Rs 60 crore," says Shah. If it goes according to
plan, both Edelweiss and Phoenix ARC will make
supernormal profits in this distressed asset. The
lending banks, too, will get their money back.
Phoenix ARC's Karra says resolution works for
him as the company boasts the highest 70 per cent redemption record of security receipts issued to banks in
exchange of bad assets. Shah is, however, looking at the restructuring route by working with promoters
alongside: "We see this as a resolution business, while many of our peers are looking at it as a recovery
business," he says, adding: "Resolution business is more of aggregating debt, fresh infusion of capital,
identification of non-core assets, and bringing in a strategic partner. This requires a good mix of financing
background, investment banking capabilities and also an understanding of the equity market." Edelweiss ARC
is manned by IDBI Bank's former executive director Siby Antony.
Sale of loan to ARCs, however, is the last resort for banks. Unlike retail defaulters where banks are known to
hire musclemen for quick recovery, corporate loan recovery is a different ball game. At times, there are labour
unions demanding their pound of flesh; statutory authorities like income tax to excise jump in to claim their
dues; employees approach the court for bankruptcy proceedings. But in most cases it is the deposed
promoters/management that pose the biggest hurdle in a revival.

Sitting at the Edelweiss House in a Mumbai suburb, Antony is strategising to push the Bharati Shipyard
winding up petition out of his way. Bharati has promised to repay the unsecured creditors in 12-15 months.
Antony has also engaged with Bharati Shipyard's promoters PC Kapoor and Vijay Kumar, and other lending
banks which did not sell their loans.
Not far away from Edelweiss' suburban headquarters is the 17th floor office of
P.K. Malhotra, Deputy Managing Director (Stressed Assets Management) of
State Bank of India. Malhotra, a veteran of banking with over three decades of
experience, cannot seem to hide his smile. SBI had even hired consultant
Alvarez & Marsal to turn around Bharati, but with no success. In fact, a
corporate debt restructuring could not save Bharati. Malhotra, who spends most
of his time identifying the bad loans for auction, is making sure that the bank
has exercised all its options before parting with the loan. Banks' options start
with a CDR package, suggesting one time settlement, exiting non-core assets,
infusing additional funds, bringing in strategic investors and then suggesting
complete takeover by another player.
For Malhotra, keeping bad loans in
SBI's books is like feeding a white
elephant. The ARC route gives the
bank 15 per cent (earlier 5 per
cent) of the negotiated sale amount as upfront cash, while the
remaining stays in the book as investment in security receipts
(SRs), which gets redeemed over a period of five to eight years,
depending on the ARCs' ability to recover. Past records show that
ARCs returned 50 per cent of the SRs issued to banks. Clearly,
Bharati is off Malhotra's back today. It is now the headache for
Antony. The company founded by two technocrat-cum-
entrepreneurs from IIT Kharagpur - Kapoor and Kumar - has been
making huge losses for the last three years.
Any setbacks, such as that of Bharati's, haven't deterred top ARCs
from buying big. ARCIL, the oldest ARC, bought another whopper
of a deal in April this year. It acquired the Rs 3,000 crore bad loans
of Corporate Power, a company belonging to Nagpur-based
Abhijeet Group.
For almost two years, its bankers had been negotiating with
potential buyers, such as SREI, JSW, NTPC, TATA and the
Adanis, to sell the loan, but with little success. SREI Infra was the
first to show interest, but the deal couldn't go through because
bankers were not ready for a major haircut. They believed that the
company could be revived as its 1,080 MW power plant installed by BHEL (no Chinese equipment, stresses a
banker) had a captive coal mine. "The plant was near the pit head. The coal was of good quality. The
transportation cost was minimal," says the representative of a lender. There was an interest for complete buyout,
but negotiations fell through midway. The reasons were the uncertainty over the mines as it came under CBI
investigations for irregular allotment of coal mines (see The Big Asset Sale).
There are success stories too. Edelweiss claims to put Electrotherm (India), a leader in induction furnace, on a
revival path. Edelweiss bought Rs 1,500 crore of the Rs 3,400 crore debt from over half-a-dozen banks. "We
converted a part of the debt into equity," says Antony, whose ARC now holds a 10 per cent stake in the unit.
Today, Electrotherm, which has been a loss-making unit since March 2012, has seen its revenues jump from Rs
659 crore in 2013/14 to Rs1,829 crore in 2014/15. "I have to ensure 18 per cent IRR (internal rate of return)
otherwise there is no business in the bad assets," says Antony.
Bankers' Dilemma
The sale of large NPAs, such as Bharati and Corporate Power, indicate a clear change in the banks' approach
towards selling bad loans.
Earlier, banks sold only the written-off bad loans which were practically dead assets. They also sought a high
price. Now, with the RBI on their case, banks are in a bind, even as there is no respite from bad loans. For
public sector unit (PSU) banks, the government has stopped liberal funding of capital every year. The only
option now is to generate cash by selling bad loans to ARCs.
Take for instance the case of SBI, which sold the biggest chunk of bad loans of around Rs 12,000 crore in its
history in 2014/15. "This has helped us to clean our balance sheet. The transfer to ARC will also generate some
return for us in the future," hopes Malhotra. This is true for the banking sector at large. ARCs, says SBI,
remains the most pro-active. In fact, it has made sale of bad assets like an assembly line activity. The bank's
monthly sale of NPAs (quarterly earlier) say a lot about SBI's seriousness to clean the books. "We have
substantially improved our information inputs to ARCs," says Malhotra. SBI allows three weeks to ARCs to do
their due diligence before accepting the bids. (See SBI's Sale To ARCs).
Undoubtedly, the big shift in SBI's approach is the sale of fresh NPAs, such as the Hotel Leela-venture
exposure of Rs 4,200 crore. It was put up for sale within three months of declaring it as an NPA. The sale to JM
Financial ARC, however, came as a big surprise to the promoters of the luxury hotel chain. The bank reasons
that there was no hope of generating cash in the next four to five years.
Patron RBI
Much of the credit for the
excitement in the distressed
assets business must go to the
RBI. "Most of the changes have
come from the regulator, which
is also in response to the build
up of NPAs in the system," says
Nikhil Shah, Managing Director
at Alvarez & Marsal. ( See The
Push Has Come From The RBI).
In the past 18 months, the RBI
has introduced a slew of
reforms, including hiking the
initial investment by ARCs from
5 per cent of the acquisition
amount to 15 per cent, to
discourage ARCs from relying
heavily on the management fee
model for their survival.
In the 5:95 model, ARCs used to
buy a bad loan at a discount
from banks' book value by
paying just 5 per cent upfront in
cash, while the balance was in
the form of security receipts
issued by them. ARCs also get a
management fee of 1.5 per cent every year on the overall AUM they manage. In the 5:95 scenario, ARCs were
content playing the management fee model because on an investment of Rs 5 (on a Rs 100 loan), they were
earning Rs 1.5, which meant a 30 per cent rate of return on the investment of Rs 5 (see Route To Recovery).
Ever since the RBI mandated the cash composition to 15 per cent (15:85 model) in August last year, ARCs have
a greater stake in moving from the 'management fee' model to the 'investment model' as the 1.5 per cent
management fee only amounts to 10 per cent rate of return on a cash investment of 15 per cent. This gives the
ARCs more of an incentive to actually turn around the company and make it profitable, instead of just passively
earning profits through management fees. It also ensures that they work harder.

Restructure, Resolve and
Deliver
ARCs have no magic wand to
revive a sick unit. They mostly
use the bilateral route by
working alongside the promoter
to de-leverage the business. "We
are financial restructuring
specialists. We are not business
restructuring experts," says
Eshwar Karra, CEO of Phoenix
ARC. Players like ARCIL and
Edelweiss are playing in big
loans where dozens of banks are
involved. Loan aggregation is a
huge challenge and the
resolution strategy centres
around restructuring of loans to revive a unit.
JM Financial, which bought the Leelaventure loan, is in a bind. Loss-making Leela is asset-rich with well-run
hotel properties. JM is still in dialogue with the company's management, which is asking for certain concessions
in interest and repayment terms from JM Financial. Meanwhile, Leela has also approached the government to
provide concessions to the hotel industry, in terms of loan refinancing. "We have represented to the government
for longer term loan for hotel industry by including existing hotels in the refinancing scheme. We are awaiting
response," says Vivek Nair, Chair-man and Managing Director, Hotel Leelaventure.
Three months ago, JM had put out an advertisement for the sale of Hotel Leela's Chennai and Goa properties to
reduce the debt burden. "They are yet to zero in on the sale. In this difficult environment selling a large hotel
property is very difficult," says a banker. In May this year, the company decided to mobilise Rs 1,000 crore
through equity or debt. "Ultimately, Hotel Leela will be a strategic sale to a big hotel chain," says a rival ARC
official. JM Financial refused to participate in the story.
Edelweiss ARC, on its part, is arranging Rs 600 crore from high networth individuals (HNIs) to complete its
order for delivering a couple of ships to Bharati Shipyard. Unlike banks, Edelweiss ARC has the flexibility to
reduce the interest rates drastically, whereas banks cannot lend below their base rates. Similarly, Edelweiss
could convert part of Bharati's debt into equity, whereas such decisions by banks would come under scrutiny.
ARCs actually have no such worries. "Our short-term plan is to revive the company in 24-30 months," says
Antony. There are some who say new investors (generally private equity) demand priority over existing lenders
as they are taking a bigger risk. "This preference is not acceptable to those banks who have not sold their loans,"
says a market observer.
While ARCs try to identify and take only those assets which can be made viable, it does not always play out
that way. The oldest, ARCIL finally got the Corporate Power loan at a hefty discount, but the entire economics
of the project has now turned on its head. The coal mine was re-auctioned recently to another player. Now, the
coal mine advantage does not exist any more. Another big negative is the location of the unfinished plant. The
Corporate Power plant is in Chandwa in Latehar district of Jharkhand, which is a Naxalite-affected region. "We
are working towards a resolution. We have to finish it. We have to get coal linkages. We have to also get the
power purchase agreement (PPA) revised," says an official of ARCIL.
"Banks generally have factory buildings or land as security, but what about the other assets in a business which
are not subject to security, such as business licenses, contracts, customers, employees, etc.? How do you
transfer these assets under SARFAESI? There is a big hurdle in transferring the continuity of the business," says
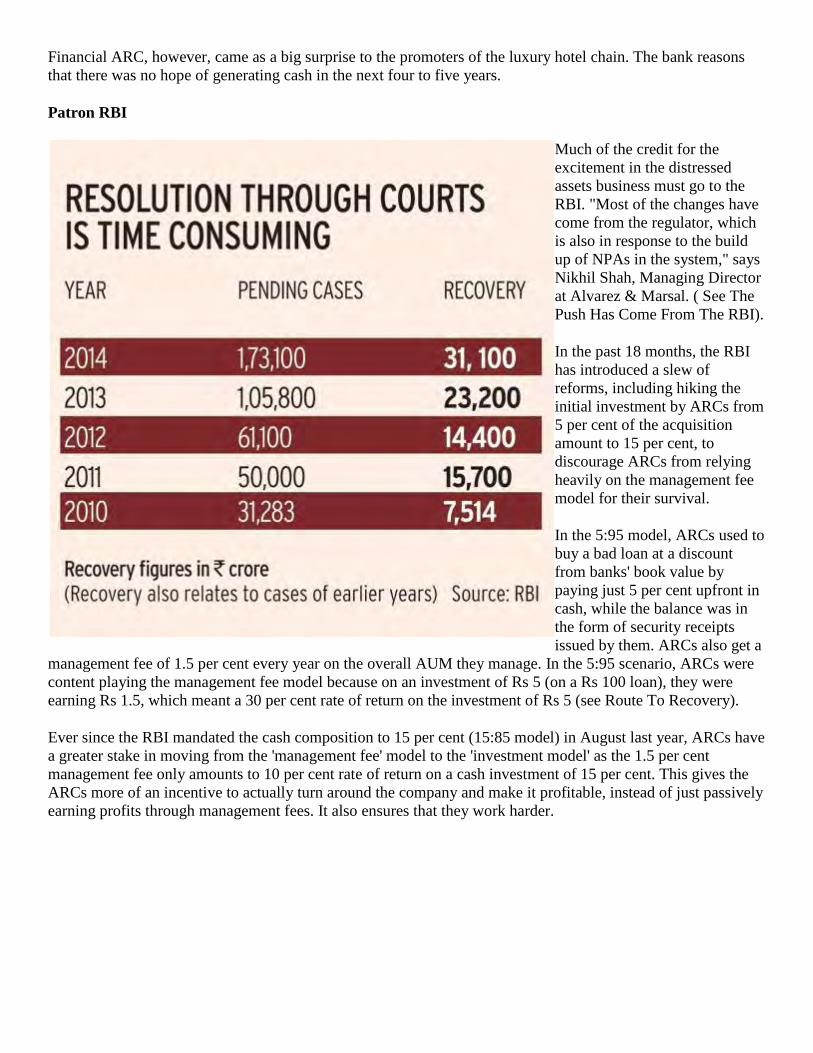
Haigreve Khaitan, Partner at Khaitan & Company.
In cases where an ARC decides to opt for the asset-stripping route without the consent of the promoters, there is
lot of resistance. ARCIL has struggled to sell Tulip Star Hotel (erstwhile Centaur near Mumbai's Juhu beach)
for many years. The company has successfully challenged the SARFAESI notice of ARCIL in the past. Board
for Industrial and Financial Reconstruction (BIFR) is yet another escape route where, after the failure of a
corporate debt restructuring (CDR), promoters can immediately approach the board. "Once you take a
SARFAESI action, BIFR action gets abated. But practically, it doesn't happen," admits an ARC official.
Many ARC heads say that the legal system is the joker in the pack that spoils the recovery process. Globally,
AMCs are set up to resolve NPAs. They have the backing of a judiciary to help in repossession and sale of
assets. The reality in the Indian context is that you cannot throw a promoter out of the company. Shah's biggest
learning in a short period is: "You cannot be adversarial with banks and promoters. You have to find a win-win
deal involving the ARCs, banks and promoters." There are currently 20 lakh recovery cases pending in Lok
Adalats, Debt Recovery Tribunals (DRTs) and SARFAESI. According to the RBI, Rs 1,73,100 crore worth of
money is locked in courts with the recovery record at Rs 31,100 crore as on March 31, 2014. (see Resolution
Through Courts).
The Bankers Guide
Bankers hold a grudge against ARCs that they are unable to turn around the stressed assets despite a lot of
flexibility in restructuring a loan. "ARCs have limited financial muscle, which leaves little scope for revival,"
says the head of a PSU bank. ARCs have spent barely Rs 3,400 crore to acquire total assets of Rs 1.89 lakh
crore of book value till date. If all the NPAs do find themselves in the market, that's another Rs 3.10 lakh crore
which require at least Rs 22,500 crore of capital from ARCs by the 15:85 principle. That's the kind of money
ARCs do not have today because of various reasons: they are not allowed to go public for now and there is no
secondary market for security receipts.
ARCs find it difficult to access funding for basic needs like working capital. The selling banks cannot lend,
while non-bank entities, such as private equity, demand 18-20 per cent interest with priority in repayment over
existing debt. This leaves the responsibility of a haircut on debt on the capital-starved ARCs. CRISIL points out
in its recent study that an ARC had to arrange for working capital for a textile company (name withheld) when
banking channels shut their doors on it. Similarly, another ARC arranged funds for a mid-sized developer to
complete the project.
There are some who suggest that the ARC game play has changed with a higher initial contribution at 15 per
cent for them. "This requires an integrated approach (involving) support from PE firms, distressed funds and
turnaround specialists, among others," says Hari Hara Mishra of a Delhi-based ARC
"There have been a couple of transactions in the recent past where foreign institutions were interested in ARCs.
For example, KKR showed interest in International Asset Reconstruction Company (IARC) and Hong Kong-
based SSG Capital in Delhi-based ACRE. For global players, investing in ARCs enable them to take an
exposure in the growing distressed market and, this may prove to be a win-win for both. "These global investors
provide transfer of technical knowledge, information and capabilities, which is going to equip ARCs to handle
complex cases. This will also provide access to global network in terms of investments and industry
knowledge," says Munesh Khanna, Partner (Corporate Finance) at PWC.
"Foreign capital must come here because ARCs are starved of capital. The track record of ARCs has been
abysmal in terms of return on equity," says Vinayak Bhuguna, CEO and Managing Director of ARCIL. The
return on equity is barely double digit. So the performance has to go up to attract foreign capital. Currently, the

capacity of ARCs to take up more fresh bad loans is also limited because of their low capital base. According to
a report on ARC business in India by turnaround specialist Alvarez & Marsal, the current capitalisation of all
ARCs put together is around Rs 3,000 crore. "With the cash component increased to 15 per cent of acquisition,
the net worth of ARCs would be sufficient to acquire only Rs20,000 crore of stressed assets. Assuming ARCs
acquire the NPAs at a discounted norm of 60 per cent of the book value, all ARCs put together can garner Rs
33,300 crore of NPAs," says the report.
The recent RBI move to allow banks to take 51 per cent equity by converting their debt will be a game changer.
"This will work as a threat for defaulters. It will force promoters to come to the table," says Birendra Kumar,
Managing Director and CEO at IARC. If that happens, a lot of stressed assets will not reach the ARC stage.
Skeptics, however, say banks are not in the business of running a hotel or an airline. "Banks will enjoy a
provision arbitrage for 18 months after converting their debt into equity. But after 18 months, they also have to
sell the company to investors. If they don't sell, the banks will have to mark to market the value of their equity
periodically," says Khanna
More Gaps to Plug
Either way, there's miles to go before ARCs have sound sleep. One of their biggest bugbear is that banks do not
follow a consortium approach of selling and, therefore, ARCs have to resort to a time-consuming process of
dealing with each bank separately. Bharati and Hotel Leela are good examples of the consortium approach
where SBI took a lead, but in most cases, ARCs have to run after individual banks. This process could take as
much as 6-12 months. "Big banks like SBI and ICICI, which are in big loans, can take a lead in bringing
together all lending banks in a defaulting company," says an ARC official
Last week, ARCs raised another issue with Union Finance Secretary Hasmukh Adhia - that of joint bidding by
ARCs. They suggested joint bidding would spread the risk in a large account. In Hotel Leela, Kotak's Phoenix
actually bought a small quantity of loan from a bank, which declined the JM offer because of valuation.
Similarly, private equity players should be encouraged to buy stressed assets. Global private equity player KKR
has already shown interest in acquiring a controlling stake in IARC. If the deal goes through, IARC will have
access to KKR's management bandwidth and its war chest of funds.
Raman Singh of Bank of India, who deals in stressed assets, says ARCs' track record shows a recovery of 10-12
per cent of the book value and 50 per cent of the acquisition cost. This indicates half the SRs are as good as junk
The outstanding SRs currently stand at close to Rs 50,000 crore. And, more will get added along the way. If
ARCs succeed, banks will also get their money, which is the objective of promoting specialised ARCs to
recover bad loans in the economy. But if they fail to recover loans, it's merely a book entry of transfer of a junk
asset from a bank to an ARC. It is in the interest of everybody- the government, the banks, the legal system and
the ARCs - to make the system work so that the NPA monster can be tamed

DISCLOSURE APPENDIX AT THE BACK OF THIS REPORT CONTAINS IMPORTANT DISCLOSURES, ANALYST CERTIFICATIONS, AND THE STATUS OF NON-US ANALYSTS. US Disclosure: Credit Suisse does and seeks to do business with companies covered in its research reports. As a result, investors should be aware that the Firm may have a conflict of interest that could affect the objectivity of this report. Investors should consider this report as only a single factor in making their investment decision.
CREDIT SUISSE SECURITIES RESEARCH & ANALYTICS BEYOND INFORMATION®
Client-Driven Solutions, Insights, and Access
20 July 2015 Asia Pacific/India Equity Research
Investment Strategy
India Market Strategy STRATEGY
The surge of the states Figure 1: State governments enable private investment and were too small
Source: Credit Suisse research
■ Indian “state” too small, but growing. Government services for citizens and businesses are primarily provided by state governments. They employ 12 mn people, supporting more than a fifth of India’s middle class. We disagree with the popular opinion that it is wasteful. States with more govt employees have higher per capita GDP; e.g., Bihar has a third of the police force vs. the national average, and the worst per capita GDP. A “state” must enable/facilitate the private sector to operate: a stunted state fails in that role. This is changing now (e.g. education, police) as states get more funds.
■ States’ fiscal size growing rapidly. Combined (centre + state) spending is budgeted to rise 13.4% YoY, in line with recent years, but the mix of spending has changed sharply: states together are to spend 65% more than the centre in FY16 vs. just 6% more in FY11. Nearly half of the increase in spending comes from their own revenues, as tax collection efficiency is improving across states helped by VAT/computers, and GST should help.
■ Consumption stays supported; fiscal stress may emerge. With government services finally improving, so does India’s medium-term growth outlook, and the market P/E multiple. Near term, over the next two years implementation of 7th Pay Commission could increase the states’ combined salary bill by Rs2 tn. States’ pension bill is also rising (Rs2.2 tn), as is “social welfare” spend (5x NREGA at Rs1.6 tn), up 1.9x since FY12. These could stress state fiscal deficits, as well as inflation. From the market’s perspective, consumption should be boosted.
Research Analysts Neelkanth Mishra
91 22 6777 3716 [email protected]
Prateek Singh 91 22 6777 3894
Ravi Shankar 91 22 6777 3869
Other contributors Anantha Narayan
91 22 6777 3730 [email protected]
Arnab Mitra 91 22 6777 3806
Jatin Chawla 91 22 6777 3719
Lokesh Garg 91 22 6777 3743
Sunil Tirumalai 91 22 6777 3714
Nitin Jain 91 22 6777 3851
Rohit Kadam, CFA 91 22 6777 3824
Vaibhav Jain 91 22 6777 3968
Akshay Saxena 91 22 6777 3825
70093436
Highlight
70093436
Highlight
70093436
Highlight
70093436
Highlight
70093436
Highlight
70093436
Highlight
70093436
Highlight
70093594
Rectangle
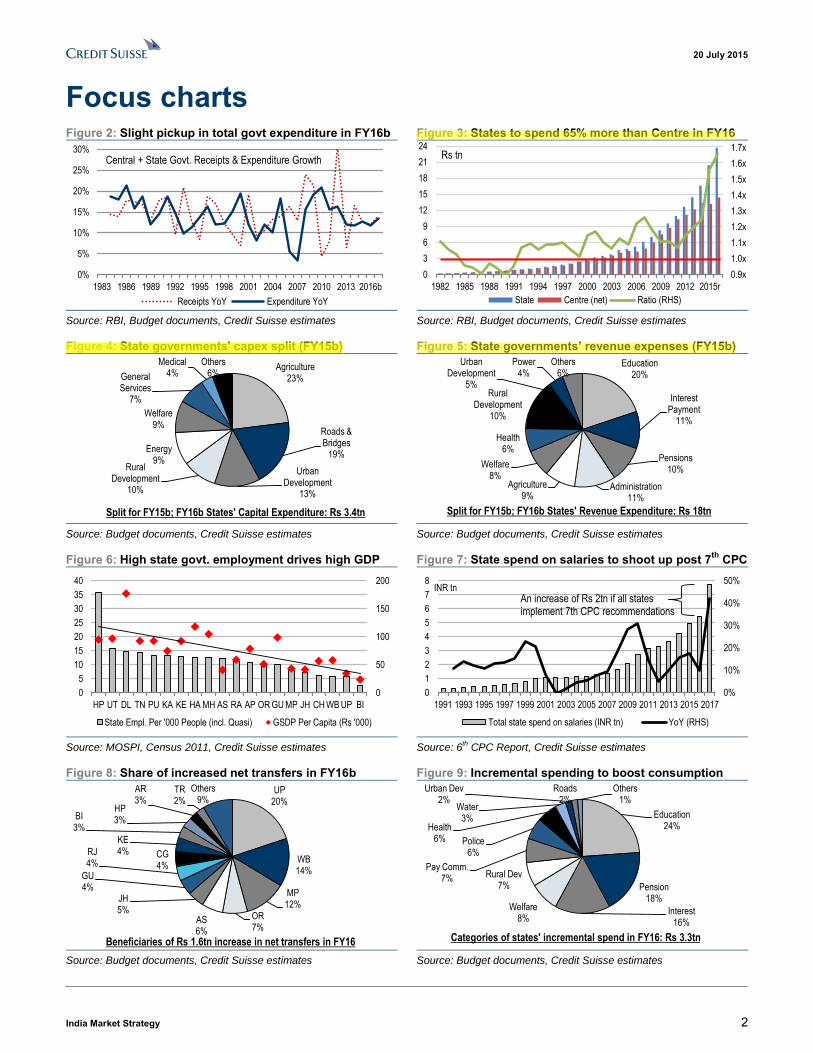
20 July 2015
India Market Strategy 2
Focus charts Figure 2: Slight pickup in total govt expenditure in FY16b Figure 3: States to spend 65% more than Centre in FY16
0%
5%
10%
15%
20%
25%
30%
1983 1986 1989 1992 1995 1998 2001 2004 2007 2010 2013 2016b
Receipts YoY Expenditure YoY
Central + State Govt. Receipts & Expenditure Growth
0.9x
1.0x
1.1x
1.2x
1.3x
1.4x
1.5x
1.6x
1.7x
0
3
6
9
12
15
18
21
24
1982 1985 1988 1991 1994 1997 2000 2003 2006 2009 2012 2015r
State Centre (net) Ratio (RHS)
Rs tn
Source: RBI, Budget documents, Credit Suisse estimates Source: RBI, Budget documents, Credit Suisse estimates
Figure 4: State governments' capex split (FY15b) Figure 5: State governments’ revenue expenses (FY15b) Agriculture
23%
Roads & Bridges
19%
Urban Development
13%
Rural Development
10%
Energy9%
Welfare9%
General Services
7%
Medical4%
Others6%
Split for FY15b; FY16b States' Capital Expenditure: Rs 3.4tn
Education20%
Interest Payment
11%
Pensions10%
Administration11%
Agriculture9%
Welfare8%
Health6%
Rural Development
10%
Urban Development
5%
Power4%
Others6%
Split for FY15b; FY16b States' Revenue Expenditure: Rs 18tn
Source: Budget documents, Credit Suisse estimates Source: Budget documents, Credit Suisse estimates
Figure 6: High state govt. employment drives high GDP Figure 7: State spend on salaries to shoot up post 7th CPC
0
50
100
150
200
0
5
10
15
20
25
30
35
40
HP UT DL TN PU KA KE HA MH AS RA AP OR GU MP JH CH WB UP BI
State Empl. Per '000 People (incl. Quasi) GSDP Per Capita (Rs '000)
0%
10%
20%
30%
40%
50%
0
1
2
3
4
5
6
7
8
1991 1993 1995 1997 1999 2001 2003 2005 2007 2009 2011 2013 2015 2017
Total state spend on salaries (INR tn) YoY (RHS)
INR tnAn increase of Rs 2tn if all states implement 7th CPC recommendations
Source: MOSPI, Census 2011, Credit Suisse estimates Source: 6
th CPC Report, Credit Suisse estimates
Figure 8: Share of increased net transfers in FY16b Figure 9: Incremental spending to boost consumption UP
20%
WB14%
MP12%
OR7%
AS6%
JH5%
GU4%
RJ4%
CG4%
KE4%
BI3%
HP3%
AR3%
TR2%
Others9%
Beneficiaries of Rs 1.6tn increase in net transfers in FY16
Education24%
Pension18%
Interest16%
Welfare8%
Rural Dev7%
Pay Comm.7%
Police6%
Health6%
Water3%
Urban Dev2%
Roads2%
Others1%
Categories of states' incremental spend in FY16: Rs 3.3tn
Source: Budget documents, Credit Suisse estimates Source: Budget documents, Credit Suisse estimates
70093436
Highlight
70093436
Highlight
70093436
Highlight
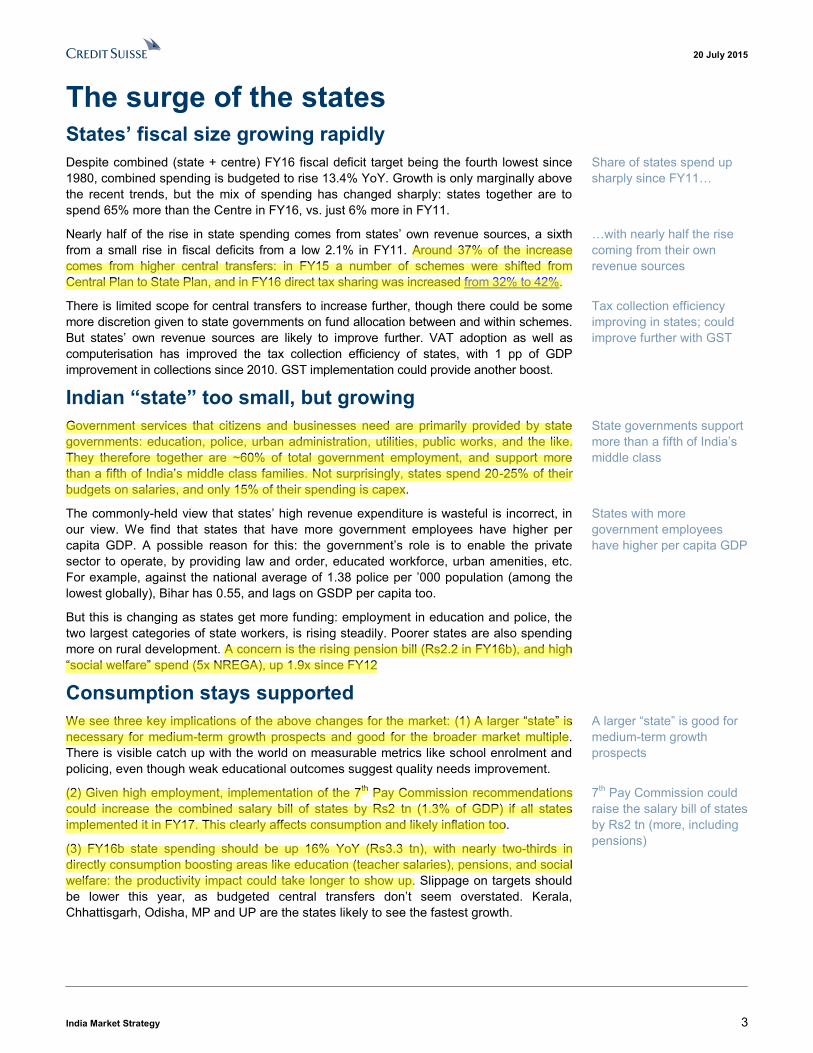
20 July 2015
India Market Strategy 3
The surge of the states States’ fiscal size growing rapidly Despite combined (state + centre) FY16 fiscal deficit target being the fourth lowest since 1980, combined spending is budgeted to rise 13.4% YoY. Growth is only marginally above the recent trends, but the mix of spending has changed sharply: states together are to spend 65% more than the Centre in FY16, vs. just 6% more in FY11.
Nearly half of the rise in state spending comes from states’ own revenue sources, a sixth from a small rise in fiscal deficits from a low 2.1% in FY11. Around 37% of the increase comes from higher central transfers: in FY15 a number of schemes were shifted from Central Plan to State Plan, and in FY16 direct tax sharing was increased from 32% to 42%.
There is limited scope for central transfers to increase further, though there could be some more discretion given to state governments on fund allocation between and within schemes. But states’ own revenue sources are likely to improve further. VAT adoption as well as computerisation has improved the tax collection efficiency of states, with 1 pp of GDP improvement in collections since 2010. GST implementation could provide another boost.
Indian “state” too small, but growing Government services that citizens and businesses need are primarily provided by state governments: education, police, urban administration, utilities, public works, and the like. They therefore together are ~60% of total government employment, and support more than a fifth of India’s middle class families. Not surprisingly, states spend 20-25% of their budgets on salaries, and only 15% of their spending is capex.
The commonly-held view that states’ high revenue expenditure is wasteful is incorrect, in our view. We find that states that have more government employees have higher per capita GDP. A possible reason for this: the government’s role is to enable the private sector to operate, by providing law and order, educated workforce, urban amenities, etc. For example, against the national average of 1.38 police per ’000 population (among the lowest globally), Bihar has 0.55, and lags on GSDP per capita too.
But this is changing as states get more funding: employment in education and police, the two largest categories of state workers, is rising steadily. Poorer states are also spending more on rural development. A concern is the rising pension bill (Rs2.2 in FY16b), and high “social welfare” spend (5x NREGA), up 1.9x since FY12
Consumption stays supported We see three key implications of the above changes for the market: (1) A larger “state” is necessary for medium-term growth prospects and good for the broader market multiple. There is visible catch up with the world on measurable metrics like school enrolment and policing, even though weak educational outcomes suggest quality needs improvement.
(2) Given high employment, implementation of the 7th Pay Commission recommendations could increase the combined salary bill of states by Rs2 tn (1.3% of GDP) if all states implemented it in FY17. This clearly affects consumption and likely inflation too.
(3) FY16b state spending should be up 16% YoY (Rs3.3 tn), with nearly two-thirds in directly consumption boosting areas like education (teacher salaries), pensions, and social welfare: the productivity impact could take longer to show up. Slippage on targets should be lower this year, as budgeted central transfers don’t seem overstated. Kerala, Chhattisgarh, Odisha, MP and UP are the states likely to see the fastest growth.
Share of states spend up sharply since FY11…
…with nearly half the rise coming from their own revenue sources
Tax collection efficiency improving in states; could improve further with GST
State governments support more than a fifth of India’s middle class
States with more government employees have higher per capita GDP
A larger “state” is good for medium-term growth prospects
7th Pay Commission could raise the salary bill of states by Rs2 tn (more, including pensions)
70093436
Highlight
70093436
Highlight
70093436
Highlight
70093436
Highlight
70093436
Highlight
70093436
Highlight
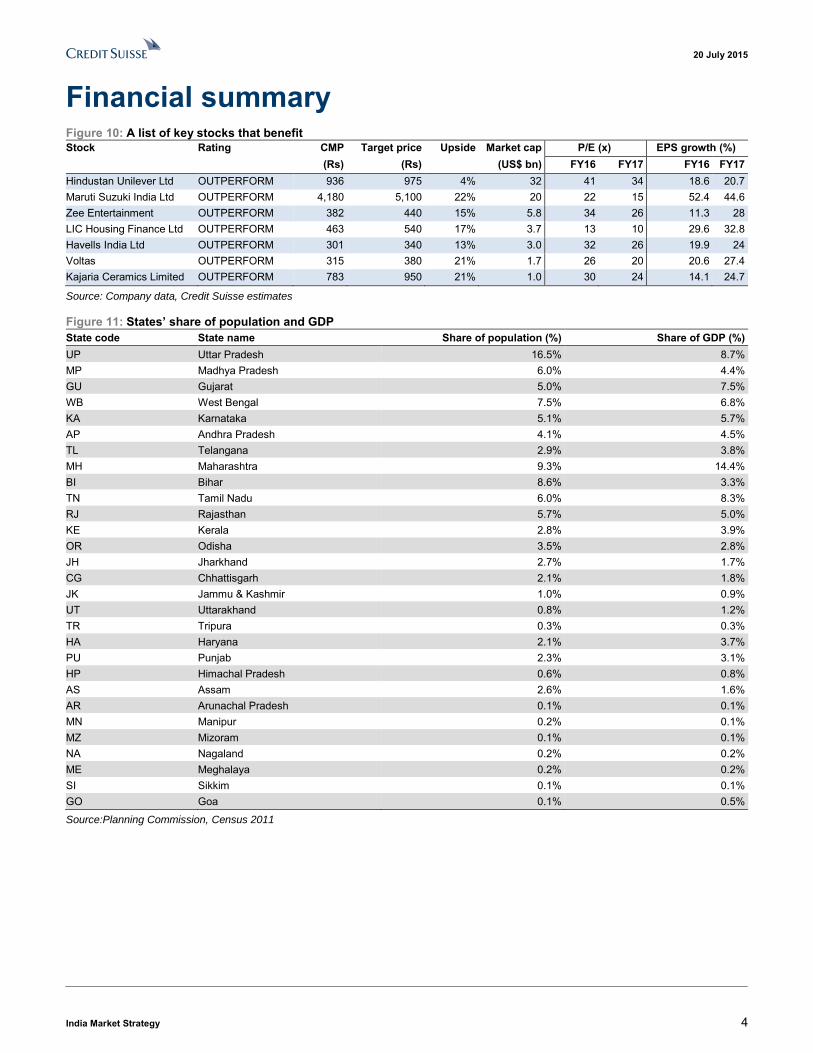
20 July 2015
India Market Strategy 4
Financial summary Figure 10: A list of key stocks that benefit Stock Rating CMP Target price Upside Market cap P/E (x) EPS growth (%) (Rs) (Rs) (US$ bn) FY16 FY17 FY16 FY17 Hindustan Unilever Ltd OUTPERFORM 936 975 4% 32 41 34 18.6 20.7 Maruti Suzuki India Ltd OUTPERFORM 4,180 5,100 22% 20 22 15 52.4 44.6 Zee Entertainment OUTPERFORM 382 440 15% 5.8 34 26 11.3 28 LIC Housing Finance Ltd OUTPERFORM 463 540 17% 3.7 13 10 29.6 32.8 Havells India Ltd OUTPERFORM 301 340 13% 3.0 32 26 19.9 24 Voltas OUTPERFORM 315 380 21% 1.7 26 20 20.6 27.4 Kajaria Ceramics Limited OUTPERFORM 783 950 21% 1.0 30 24 14.1 24.7
Source: Company data, Credit Suisse estimates
Figure 11: States’ share of population and GDP State code State name Share of population (%) Share of GDP (%) UP Uttar Pradesh 16.5% 8.7% MP Madhya Pradesh 6.0% 4.4% GU Gujarat 5.0% 7.5% WB West Bengal 7.5% 6.8% KA Karnataka 5.1% 5.7% AP Andhra Pradesh 4.1% 4.5% TL Telangana 2.9% 3.8% MH Maharashtra 9.3% 14.4% BI Bihar 8.6% 3.3% TN Tamil Nadu 6.0% 8.3% RJ Rajasthan 5.7% 5.0% KE Kerala 2.8% 3.9% OR Odisha 3.5% 2.8% JH Jharkhand 2.7% 1.7% CG Chhattisgarh 2.1% 1.8% JK Jammu & Kashmir 1.0% 0.9% UT Uttarakhand 0.8% 1.2% TR Tripura 0.3% 0.3% HA Haryana 2.1% 3.7% PU Punjab 2.3% 3.1% HP Himachal Pradesh 0.6% 0.8% AS Assam 2.6% 1.6% AR Arunachal Pradesh 0.1% 0.1% MN Manipur 0.2% 0.1% MZ Mizoram 0.1% 0.1% NA Nagaland 0.2% 0.2% ME Meghalaya 0.2% 0.2% SI Sikkim 0.1% 0.1% GO Goa 0.1% 0.5%
Source:Planning Commission, Census 2011
70093594
Rectangle
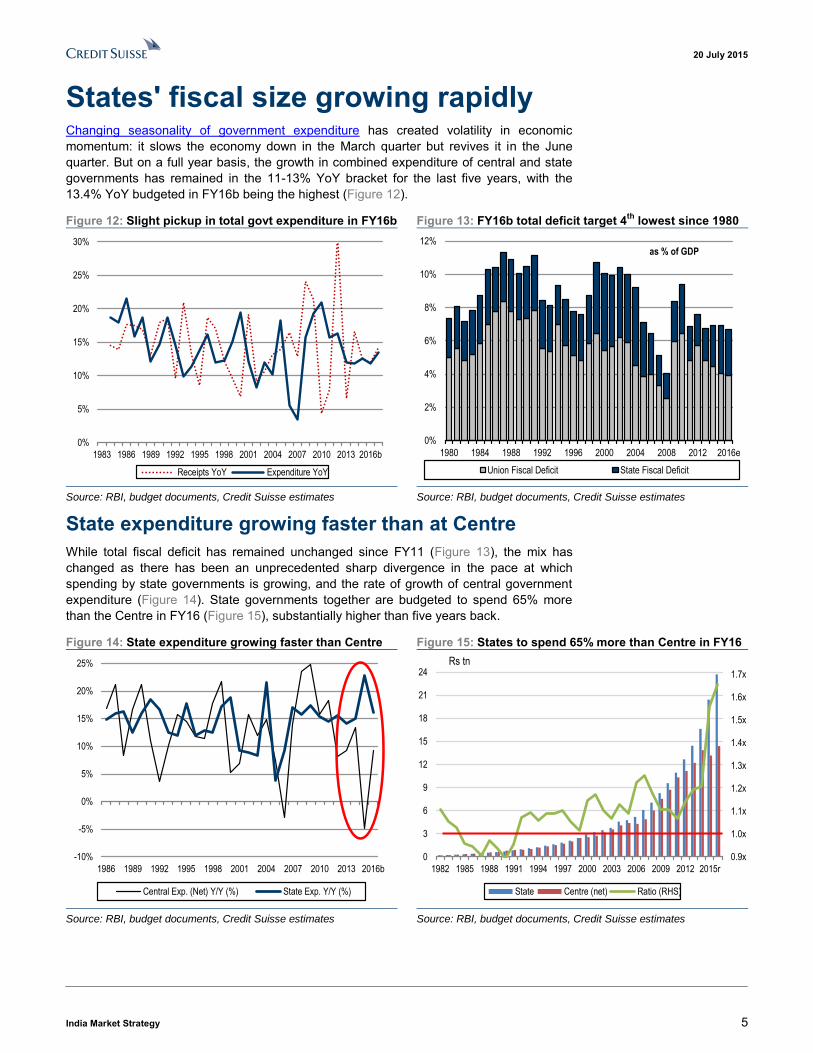
20 July 2015
India Market Strategy 5
States' fiscal size growing rapidly Changing seasonality of government expenditure has created volatility in economic momentum: it slows the economy down in the March quarter but revives it in the June quarter. But on a full year basis, the growth in combined expenditure of central and state governments has remained in the 11-13% YoY bracket for the last five years, with the 13.4% YoY budgeted in FY16b being the highest (Figure 12).
Figure 12: Slight pickup in total govt expenditure in FY16b Figure 13: FY16b total deficit target 4th lowest since 1980
0%
5%
10%
15%
20%
25%
30%
1983 1986 1989 1992 1995 1998 2001 2004 2007 2010 2013 2016b
Receipts YoY Expenditure YoY
0%
2%
4%
6%
8%
10%
12%
1980 1984 1988 1992 1996 2000 2004 2008 2012 2016e
Union Fiscal Deficit State Fiscal Deficit
as % of GDP
Source: RBI, budget documents, Credit Suisse estimates Source: RBI, budget documents, Credit Suisse estimates
State expenditure growing faster than at Centre While total fiscal deficit has remained unchanged since FY11 (Figure 13), the mix has changed as there has been an unprecedented sharp divergence in the pace at which spending by state governments is growing, and the rate of growth of central government expenditure (Figure 14). State governments together are budgeted to spend 65% more than the Centre in FY16 (Figure 15), substantially higher than five years back.
Figure 14: State expenditure growing faster than Centre Figure 15: States to spend 65% more than Centre in FY16
-10%
-5%
0%
5%
10%
15%
20%
25%
1986 1989 1992 1995 1998 2001 2004 2007 2010 2013 2016b
Central Exp. (Net) Y/Y (%) State Exp. Y/Y (%)
0.9x
1.0x
1.1x
1.2x
1.3x
1.4x
1.5x
1.6x
1.7x
0
3
6
9
12
15
18
21
24
1982 1985 1988 1991 1994 1997 2000 2003 2006 2009 2012 2015r
State Centre (net) Ratio (RHS)
Rs tn
Source: RBI, budget documents, Credit Suisse estimates Source: RBI, budget documents, Credit Suisse estimates

20 July 2015
India Market Strategy 6
This increase in expenditure by state governments has not been due to a rise in deficits. Even though deficit ratios have risen from the low levels seen in FY11, they are still below levels seen in most of the last 35 years (Figure 16). FY16 deficit ratio is budgeted to be 2.6% (this is for a sample of 15 states that together constitute 88% of total state expenditure)—a 50 bp drop on the revised deficit of 3.1% in FY15 (2.2% was budgeted). The final deficit in FY15 too is likely to be lower than the revised number, as has generally been seen in prior years. Deficits’ contribution to the rise in spending has been minimal; instead, states' spending has been supported by a rise in their own revenue sources (37% of FY11-16 increase, Figure 17) as well as central transfers.
Figure 16: State deficits up from lows, but under control Figure 17: Source of funds for rise in expenditure FY11-16
1.5%
2.0%
2.5%
3.0%
3.5%
4.0%
4.5%
5.0%
1980 1983 1986 1989 1992 1995 1998 2001 2004 2007 2010 2013 2016
States' fiscal deficit to GDP
(2016 data for 15 states)
Own Tax37%
Own non-Tax8%
Central Transfers
37%
Deficit18%
Increase in spend FY11-16: Rs12.9tn
Source: RBI, budget documents, Credit Suisse estimates Source: RBI, budget documents, Credit Suisse estimates
States' improving tax collections: Better compliance States' own tax collections shot up between 2010 and 2013 (Figure 18) and after a slowdown in FY14, when they grew only 9%, picked up again in FY15, and are expected to grow robustly in FY16b as well. While high inflation does boost states' tax collections, as most state taxes are ad-valorem, state taxes as a % of GDP have risen sharply since FY10 (Figure 19), suggesting that tax collection efficiency has improved.
Figure 18: Tax collection growth shot up in 2010-13 Figure 19: States' own tax collection efficiency improving
0%
5%
10%
15%
20%
25%
1986-89
1989-92
1992-95
1995-98
1998-01
2001-04
2004-07
2007-10
2010-13
2013-16
States' Tax Revenue CAGR
Standout increase in states' own tax growth
5.0%
5.2%
5.4%
5.6%
5.8%
6.0%
6.2%
6.4%
6.6%
6.8%
1986 1989 1992 1995 1998 2001 2004 2007 2010 2013 2016b
Own Tax as % of GDP
Source: RBI, budget documents, Credit Suisse estimates Source: RBI, budget documents, Credit Suisse estimates
70093436
Highlight
70093436
Highlight
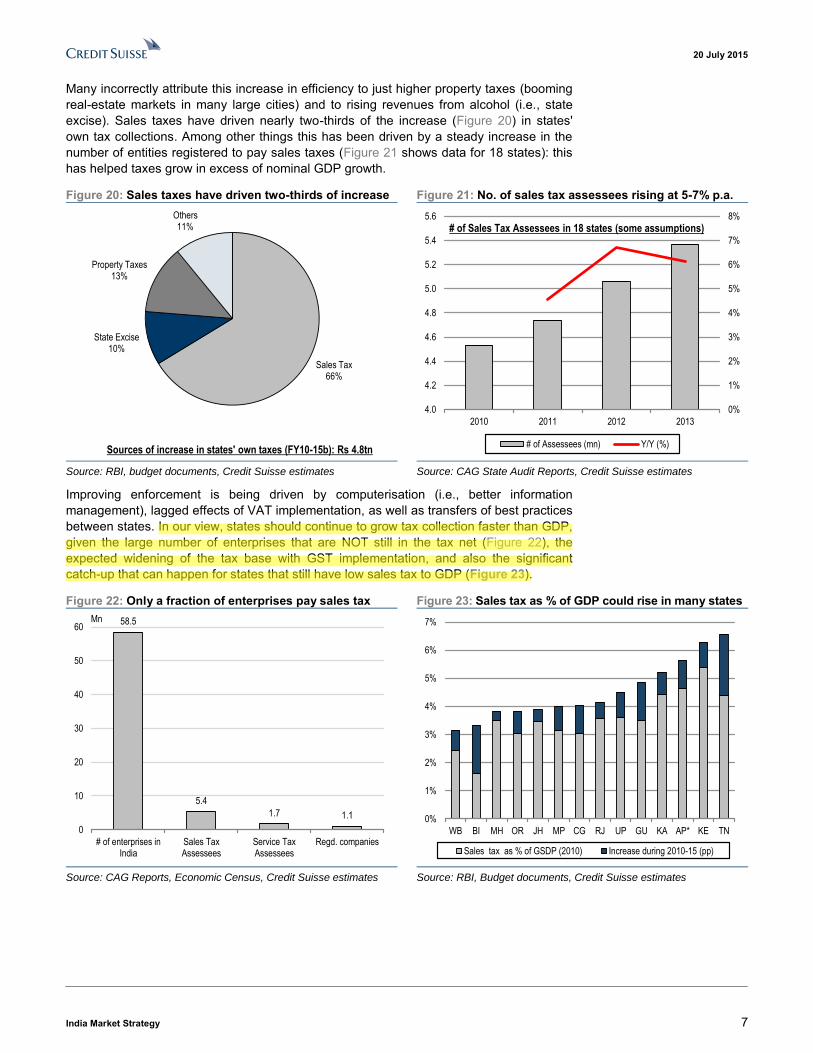
20 July 2015
India Market Strategy 7
Many incorrectly attribute this increase in efficiency to just higher property taxes (booming real-estate markets in many large cities) and to rising revenues from alcohol (i.e., state excise). Sales taxes have driven nearly two-thirds of the increase (Figure 20) in states' own tax collections. Among other things this has been driven by a steady increase in the number of entities registered to pay sales taxes (Figure 21 shows data for 18 states): this has helped taxes grow in excess of nominal GDP growth.
Figure 20: Sales taxes have driven two-thirds of increase Figure 21: No. of sales tax assessees rising at 5-7% p.a.
Sales Tax66%
State Excise10%
Property Taxes13%
Others11%
Sources of increase in states' own taxes (FY10-15b): Rs 4.8tn
0%
1%
2%
3%
4%
5%
6%
7%
8%
4.0
4.2
4.4
4.6
4.8
5.0
5.2
5.4
5.6
2010 2011 2012 2013
# of Assessees (mn) Y/Y (%)
# of Sales Tax Assessees in 18 states (some assumptions)
Source: RBI, budget documents, Credit Suisse estimates Source: CAG State Audit Reports, Credit Suisse estimates
Improving enforcement is being driven by computerisation (i.e., better information management), lagged effects of VAT implementation, as well as transfers of best practices between states. In our view, states should continue to grow tax collection faster than GDP, given the large number of enterprises that are NOT still in the tax net (Figure 22), the expected widening of the tax base with GST implementation, and also the significant catch-up that can happen for states that still have low sales tax to GDP (Figure 23).
Figure 22: Only a fraction of enterprises pay sales tax Figure 23: Sales tax as % of GDP could rise in many states
58.5
5.4
1.7 1.1
0
10
20
30
40
50
60
# of enterprises inIndia
Sales TaxAssessees
Service TaxAssessees
Regd. companies
Mn
0%
1%
2%
3%
4%
5%
6%
7%
WB BI MH OR JH MP CG RJ UP GU KA AP* KE TN
Sales tax as % of GSDP (2010) Increase during 2010-15 (pp)
Source: CAG Reports, Economic Census, Credit Suisse estimates Source: RBI, Budget documents, Credit Suisse estimates
70093436
Highlight

20 July 2015
India Market Strategy 8
The surge in central transfers is likely behind us… As per the constitution most of tax collection responsibilities (income tax, corporation tax, customs duties, service tax, etc.) lie with the central government (as it should from an efficiency perspective), but most tasks of dispensing government services (law and order, healthcare, education, civic amenities, rural roads, electrification, etc.) are with state governments. This necessitates significant transfers of taxes from the centre to the state.
These transfers are of four types: (1) Direct tax sharing/devolution: a fixed share of all taxes collected by the centre automatically go to the states—every five years the Finance Commission, a constitutional body, revises this ratio; (2) Grants: the Finance Commission also recommends some grants to weaker states, though the centre can choose to provide grants to specific states for disaster relief, repair of roads, etc; (3) Contribution to state plan: for schemes like education and health; and (4) Assistance for Centrally Sponsored Schemes (CSS): the centre can choose to spend on areas that are state subjects, and route funds through the state budget.
Transfers to the states have risen at 18% CAGR from FY10-16b, and particularly sharply in the past two years (Figure 24): in FY15 all the central schemes on state subjects where the centre by-passed state governments and provided funds directly to autonomous bodies, were converted to schemes under state plans. This was just an accounting change and total spending in the economy did not rise: just control moved to the states.
Then in FY16, as per the recommendations of the Fourteenth Finance Commission (FFC), there was a sharp increase in states’ direct share of tax revenues: from 32% to 42%, though this was offset by a Rs745 bn drop in Central Assistance for State Plan: untied funds and funds for eight small schemes were discontinued.
Figure 24: Rise in % of Central taxes transferred to states Figure 25: More increase in transfer to states is unlikely
40%
45%
50%
55%
60%
0
1
2
3
4
5
6
7
8
9
2010 2011 2012 2013 2014 2015r 2016b
Tax Sharing Grants State Plan CSS % of Taxes
Rs Tn
18% CAGR FY10-16b
Central schemes transferred to State Plan
Interest32%
Defence17%
Subsidies17%
Salaries16%
Central Plan16%
Others2%
FY16 Central Expenditure ex-state transfers: Rs 14.4tn
Source: Budget documents, Credit Suisse estimates Source: Budget documents, Credit Suisse estimates
Going forward, a further increase in transfers is unlikely, given that the remaining expenditure at the central level is primarily on interest payments, defence, centrally administered subsidies and salaries (Figure 25). Much of Central Plan expenditure is also on central subjects like roads and railways (Figure 26), and areas that are constitutionally state subjects are much smaller.
…though there could be more discretion for states In FY16b, most funds are to be transferred to states via direct tax transfers and contribution to 66 schemes under the state plan (Figure 27). While states have full autonomy to spend on these schemes as they wish, they do not have the freedom to use these funds elsewhere, i.e., the funds are still “tied” to these specific schemes. Recently a panel of chief ministers recommended that the government delink 46 of these schemes, letting the states choose which schemes they want to participate in.
70093436
Highlight
70093436
Highlight
70093436
Highlight
70093436
Highlight
70093436
Highlight

20 July 2015
India Market Strategy 9
Given the significant diversity in infrastructure and social requirements between states (e.g., UP needs roads whereas Karnataka needs irrigation; TN and Kerala need old-age homes given the high average age whereas UP and Bihar need kindergartens and more primary schools given low literacy rates and a high fertility rate), more freedom would improve the productivity of this expenditure.
Figure 26: Most Central Plan spend is on central subjects Figure 27: Most transfers via direct sharing + State plans
Roads23%
Railways20%
Social Services11%
Economic Services
10%
Education8%
Industry7%
North East Welfare
7%
Energy6%
Urban Dev5%
Others3%
FY16 Central Plan Outlay ex-state transfers: Rs 2.4tn
Tax Sharing61%Grants
12%
State Plan24%
CSS3%
Total FY16b Transfer to States: Rs 8.6 Tn
Source: Budget documents, Credit Suisse estimates Source: Budget documents, Credit Suisse estimates
Discretion for states necessary Given the size of India’s population (a sixth of humanity), each of the states is as large as most countries (Figure 28): this necessitates a federal system of governance, as it is near impossible for the centre to manage all changes in every state.
Figure 28: States in India are country-sized Figure 29: Low development level/Wide income disparity
Source: Census 2011, IMF World Economic Outlook Source: Census 2011, IMF World Economic Outlook
70093436
Highlight
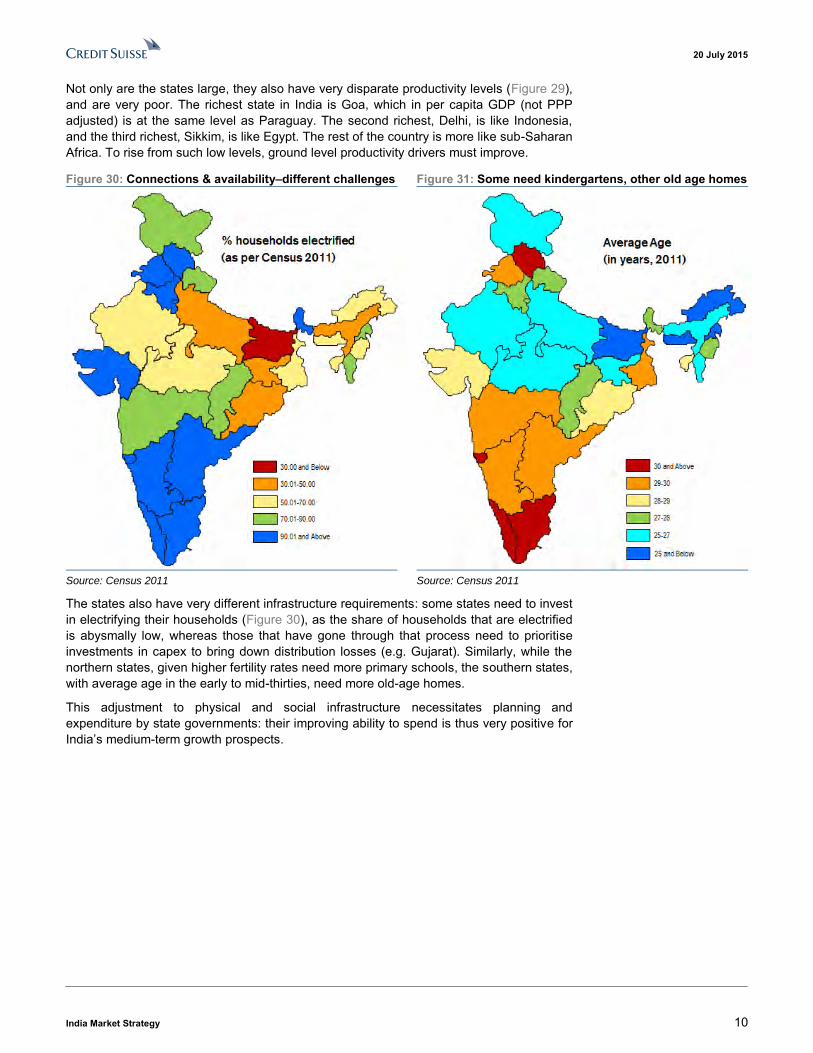
20 July 2015
India Market Strategy 10
Not only are the states large, they also have very disparate productivity levels (Figure 29), and are very poor. The richest state in India is Goa, which in per capita GDP (not PPP adjusted) is at the same level as Paraguay. The second richest, Delhi, is like Indonesia, and the third richest, Sikkim, is like Egypt. The rest of the country is more like sub-Saharan Africa. To rise from such low levels, ground level productivity drivers must improve.
Figure 30: Connections & availability–different challenges Figure 31: Some need kindergartens, other old age homes
Source: Census 2011 Source: Census 2011
The states also have very different infrastructure requirements: some states need to invest in electrifying their households (Figure 30), as the share of households that are electrified is abysmally low, whereas those that have gone through that process need to prioritise investments in capex to bring down distribution losses (e.g. Gujarat). Similarly, while the northern states, given higher fertility rates need more primary schools, the southern states, with average age in the early to mid-thirties, need more old-age homes.
This adjustment to physical and social infrastructure necessitates planning and expenditure by state governments: their improving ability to spend is thus very positive for India’s medium-term growth prospects.

20 July 2015
India Market Strategy 20
Consumption stays supported Some improvement in social indicators For India the most important measures of socio-economic development are at low levels, and, while there is visible improvement, that is so for most under-developed economies. So is this increase in spending by state governments having any impact?
As education and police are the two largest areas of employment for state governments, we compare changes in India to those elsewhere. That on both literacy levels (Figure 63) and on the enrolment ratio in primary schools (Figure 64) India is faring better than even other developing countries suggests that some of these changes are having an impact.
Figure 63: Literacy growth better even if on a low base Figure 64: Enrolment has improved dramatically
0.0%
0.2%
0.4%
0.6%
0.8%
1.0%
1.2%
1.4%
1.6%
50%
60%
70%
80%
90%
100%
2005 2015e 10yr CAGR (RHS)
Adult Literacy
-0.5%
0.0%
0.5%
1.0%
1.5%
2.0%
2.5%
60%
65%
70%
75%
80%
85%
90%
95%
100%
2002 2012 10yr CAGR (RHS)
Net Primary Enrolment Rate
Source: UNESCO, Credit Suisse estimates Source: UNESCO, Credit Suisse estimates
In particular the enrolment ratio is now in a range prevalent in most countries globally, even the developed ones, and the growth is much faster than in other developing markets even though current ratios are higher, suggesting a low base is not the only reason.
Figure 65: Educational outcomes weak across states Figure 66: India’s police-to-people growth among fastest
-30%
-20%
-10%
0%
10%
20%
30%
20%
30%
40%
50%
60%
70%
80%
HP KE PU AP HA UT WBMH OR TN CG KA BI GU IN RJ JH MP UP
Std V Reading Levels in Dec. 2014 Change 2010-14 (% points, RHS)
-4.0%
-2.0%
0.0%
2.0%
4.0%
6.0%
8.0%
10.0%
0.0
1.0
2.0
3.0
4.0
5.0
6.0
7.0
2008 2013 5-yr CAGR (RHS)
Police per '000 people
Source: ASER 2014 (Pratham), Credit Suisse estimates Source: UNODC, Credit Suisse estimates
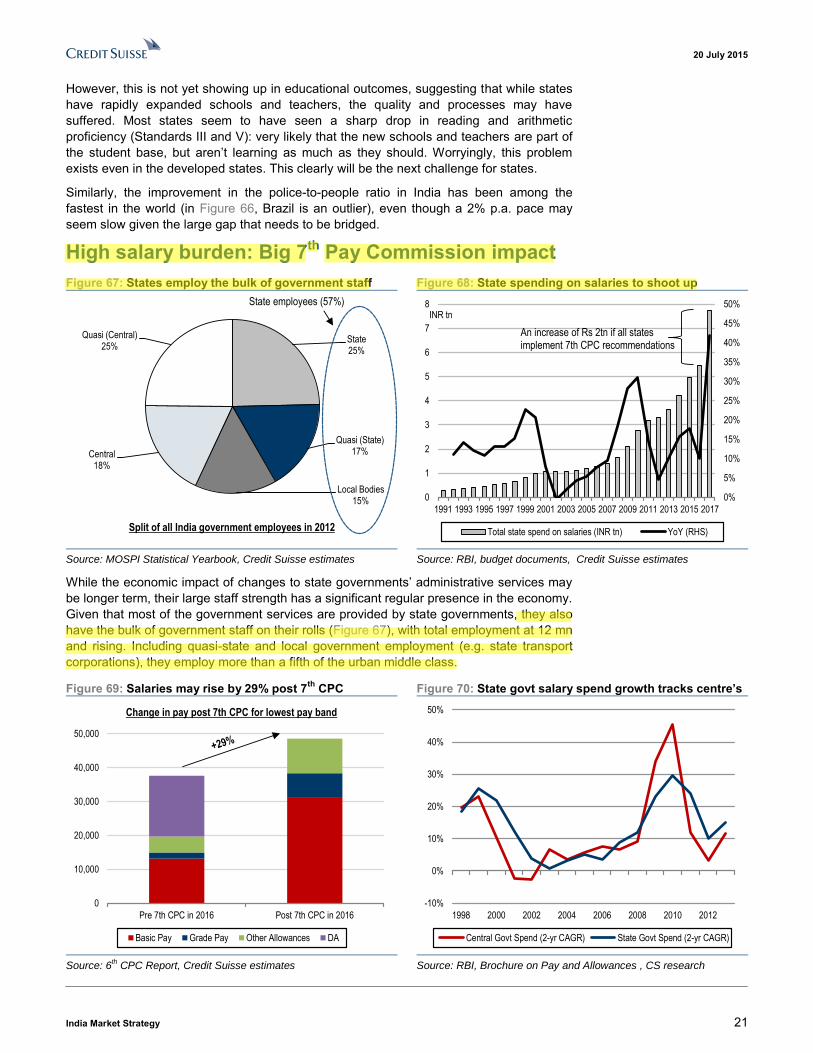
20 July 2015
India Market Strategy 21
However, this is not yet showing up in educational outcomes, suggesting that while states have rapidly expanded schools and teachers, the quality and processes may have suffered. Most states seem to have seen a sharp drop in reading and arithmetic proficiency (Standards III and V): very likely that the new schools and teachers are part of the student base, but aren’t learning as much as they should. Worryingly, this problem exists even in the developed states. This clearly will be the next challenge for states.
Similarly, the improvement in the police-to-people ratio in India has been among the fastest in the world (in Figure 66, Brazil is an outlier), even though a 2% p.a. pace may seem slow given the large gap that needs to be bridged.
High salary burden: Big 7th Pay Commission impact Figure 67: States employ the bulk of government staff Figure 68: State spending on salaries to shoot up
State25%
Quasi (State)17%
Local Bodies15%
Central18%
Quasi (Central)25%
Split of all India government employees in 2012
State employees (57%)
0%
5%
10%
15%
20%
25%
30%
35%
40%
45%
50%
0
1
2
3
4
5
6
7
8
1991 1993 1995 1997 1999 2001 2003 2005 2007 2009 2011 2013 2015 2017
Total state spend on salaries (INR tn) YoY (RHS)
INR tn
An increase of Rs 2tn if all states implement 7th CPC recommendations
Source: MOSPI Statistical Yearbook, Credit Suisse estimates Source: RBI, budget documents, Credit Suisse estimates
While the economic impact of changes to state governments’ administrative services may be longer term, their large staff strength has a significant regular presence in the economy. Given that most of the government services are provided by state governments, they also have the bulk of government staff on their rolls (Figure 67), with total employment at 12 mn and rising. Including quasi-state and local government employment (e.g. state transport corporations), they employ more than a fifth of the urban middle class.
Figure 69: Salaries may rise by 29% post 7th CPC Figure 70: State govt salary spend growth tracks centre’s
0
10,000
20,000
30,000
40,000
50,000
Pre 7th CPC in 2016 Post 7th CPC in 2016
Change in pay post 7th CPC for lowest pay band
Basic Pay Grade Pay Other Allowances DA
-10%
0%
10%
20%
30%
40%
50%
1998 2000 2002 2004 2006 2008 2010 2012
Central Govt Spend (2-yr CAGR) State Govt Spend (2-yr CAGR)
Source: 6
th CPC Report, Credit Suisse estimates Source: RBI, Brochure on Pay and Allowances , CS research
70093436
Highlight
70093436
Highlight

20 July 2015
India Market Strategy 22
Not surprisingly, states spend 20-25% of their budget on salaries, with their FY16b salary bill likely to add up to Rs5.2n (Figure 68), nearly 3.6% of GDP. At the time of implementation of the once-in-a-decade pay revisions for government employees, this proportion shoots up, and then trends down in the intervening years as salary increases lag overall spending growth.
The 7th Pay Commission is effective 01-Jan-2016, and the Central Pay Commission’s (CPC) report is expected by October 2015. Given the near-formulaic nature of increases seen thus far, it seems likely that the recommended increase would be 29% (Figure 69).
States have their own pay commissions, but these generally adopt the central pay commission’s recommendations, as seen in the near-synchronous changes in the salary burden of the centre and the states (Figure 70): we use a two-year CAGR to smoothen out the impact of arrears. This pay commission is likely to submit its recommendations well in advance (unlike the 6th CPC that was accepted nearly 2.7 years after it became effective on 01-Jan-2006), and some of the states like MP have already started provisioning for the increases, as arrears create significant pressures on state budgets.
It is clear from Figure 67 that generally all states do not implement the pay commission recommendations at the same time, else the increase in the overall salary bill would have been ~40% in any one year. It is very likely that this time as well not all of the Rs2 tn increase would be seen in the same year.
Fiscal stresses and election calendar affect timing While the salary increase is to be effective 01-Jan-2016, only two states (Madhya Pradesh and Gujarat) have provisioned for an increase in FY16b. All others, like the centre, have not. The state-wise timing would be driven by two main factors: the state’s fiscal ability to absorb the cost, and when state elections are due. A sharp jump in compensation helps gather votes, and given the large number of employees, this voter base becomes important (some believe that the 2009 victor for the UPA in the general elections was affected by the 6th CPC).
Some states are less well prepared fiscally to absorb the pay commission impact
Given stringent fiscal targets, states with stretched finances (Figure 71) or those where these increases are a meaningful part of spending (Figure 72) are likely to delay the increase until they can: employee agitations would then be necessary to trigger the implementation of the pay commission.
Figure 71: States with high impact on deficits Figure 72: Impact of salary increases varies across states
0.0%
0.5%
1.0%
1.5%
2.0%
2.5%
3.0%
3.5%
4.0%
4.5%
5.0%
TL AP PU OR CG KE MP BI RJ UP HA TN KA JH GU WB MH
FY17 Fiscal Deficit/GSDP FY17 Salary Spend increase as % of FY17 GSDP
4%
5%
6%
7%
8%
9%
10%
11%
12%
PU MH AP WB KE HA OR TN RJ MP JH TL KA BI CG GU UP
FY17-16 Salary spend increase as % of FY16 Spending
Source: Budget documents, Credit Suisse estimates Source: Budget documents, Credit Suisse estimates
70093436
Highlight
70093436
Highlight
70093436
Highlight

20 July 2015
India Market Strategy 23
Impact of state elections calendar: TN, KE, WB, AS, GU, PB & UP may see it early
We use probable dates for next state elections to assess potential implementation dates. For Bihar (elections later this year), the elections pre-date the 7th PC findings. On the other hand, among major states, for Tamil Nadu, Kerala, West Bengal and Assam, where elections are due in the middle of 2016, and in Gujarat, Punjab and UP (mid/end-2017) an early implementation is likely. Other states may want to time it better depending on fiscal preparedness or impact on elections.
Broad impact on the economy: Impact on inflation and possibly growth
A sudden 30-40% increase in compensation for more than a fifth of the urban middle class is likely to show up in macroeconomic statistics. Particularly as the total quantum, once all states have implemented it, would be more than 1% of GDP. While it is difficult to isolate the impact of the pay commission, surges in inflation in 1998 and 2009 are noticeable (Figure 73): the episode after the 5th PC was shorter, while that after the 6th PC was much longer, though likely other factors played a role as well. There is likely to be some growth impact, even if the fiscal multiplier of such spending is generally low; the final impact would depend on the changes in fiscal deficits, i.e., how states go about funding this increase. Looking back at external balances, a noticeable change is not discernible.
Figure 73: Inflation impact of pay commissions Figure 74: State governments’ liabilities
-10%
0%
10%
20%
30%
40%
Jan-61 Feb-67 Mar-73 Apr-79 May-85 Jun-91 Jul-97 Aug-03 Sep-09
CPI (% YoY)
6th PC likely played a role in this surge
5th PC: Inflation impact hard to isolate
10% 15% 20% 25% 30% 35%
CGASHAORTNMHMPJHKAGUBI
UTRJAPGOKEUPPUWB
Outstanding Liabilities as % of FY15 GSDP (as of FY15 end)
Source: Budget documents, Credit Suisse estimates Source: Budget documents, Credit Suisse estimates
Fiscal health of states Given that high inflation supports high nominal GDP growth, solvency stresses are uncommon among Indian states (Figure 74): only Punjab and WB were considered stressed 1-2 years back. Yet, a large increase in the salary burden can potentially create stresses on state government balance sheets. In particular as they also extend guarantees (effectively off-balance sheet funding) in various sectors like power and irrigation, and sometimes to State Finance Corporations as well.
FY16b impact: Spending up 16% In this financial year, the impact of larger or improved administration, or even the 7th PC recommendations would not matter. Instead, for investors the important factor is a 16% increase in total state spending (Figure 14 on Page 5). It is widely believed that state governments lack the institutional capacity to spend quickly, and generally miss their spending targets meaningfully. This fear is higher for some states than for others.
70093436
Highlight
70093436
Highlight
70093436
Highlight
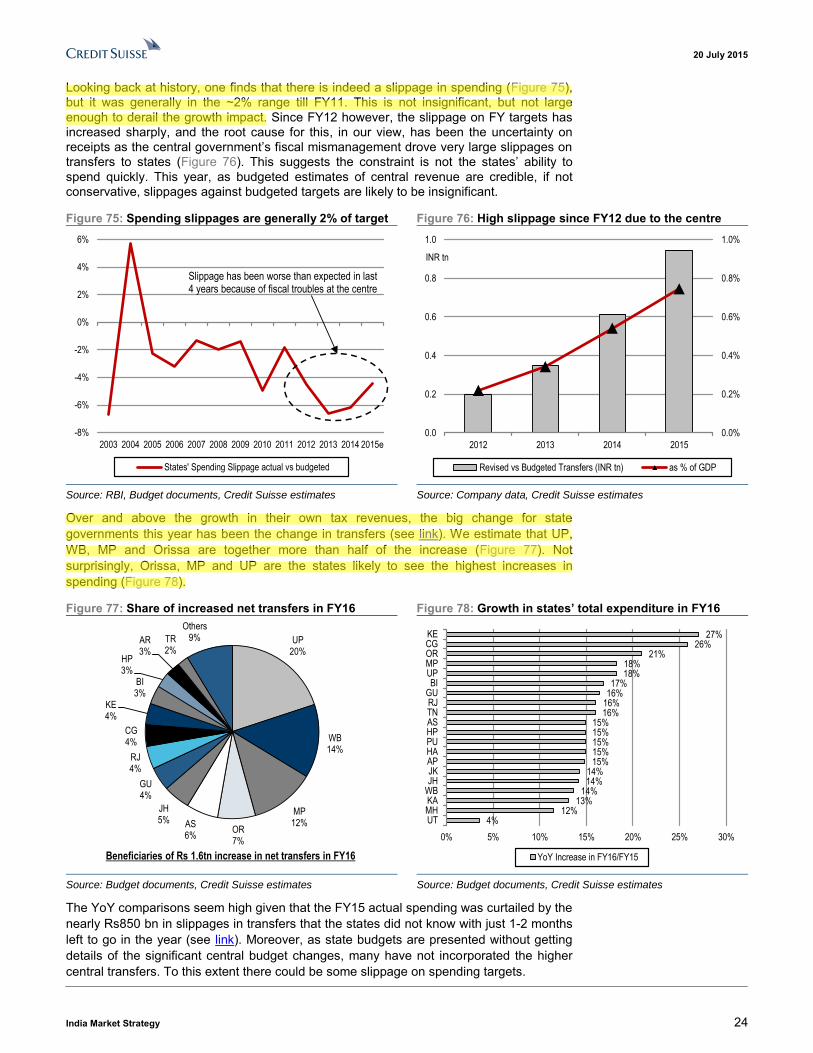
20 July 2015
India Market Strategy 24
Looking back at history, one finds that there is indeed a slippage in spending (Figure 75), but it was generally in the ~2% range till FY11. This is not insignificant, but not large enough to derail the growth impact. Since FY12 however, the slippage on FY targets has increased sharply, and the root cause for this, in our view, has been the uncertainty on receipts as the central government’s fiscal mismanagement drove very large slippages on transfers to states (Figure 76). This suggests the constraint is not the states’ ability to spend quickly. This year, as budgeted estimates of central revenue are credible, if not conservative, slippages against budgeted targets are likely to be insignificant.
Figure 75: Spending slippages are generally 2% of target Figure 76: High slippage since FY12 due to the centre
-8%
-6%
-4%
-2%
0%
2%
4%
6%
2003 2004 2005 2006 2007 2008 2009 2010 2011 2012 2013 2014 2015e
States' Spending Slippage actual vs budgeted
Slippage has been worse than expected in last 4 years because of fiscal troubles at the centre
0.0%
0.2%
0.4%
0.6%
0.8%
1.0%
0.0
0.2
0.4
0.6
0.8
1.0
2012 2013 2014 2015
Revised vs Budgeted Transfers (INR tn) as % of GDP
INR tn
Source: RBI, Budget documents, Credit Suisse estimates Source: Company data, Credit Suisse estimates
Over and above the growth in their own tax revenues, the big change for state governments this year has been the change in transfers (see link). We estimate that UP, WB, MP and Orissa are together more than half of the increase (Figure 77). Not surprisingly, Orissa, MP and UP are the states likely to see the highest increases in spending (Figure 78).
Figure 77: Share of increased net transfers in FY16 Figure 78: Growth in states’ total expenditure in FY16
UP20%
WB14%
MP12%
OR7%
AS6%
JH5%
GU4%
RJ4%
CG4%
KE4%
BI3%
HP3%
AR3%
TR2%
Others9%
Beneficiaries of Rs 1.6tn increase in net transfers in FY16
4%12%
13%14%
14%14%
15%15%15%15%15%
16%16%16%17%
18%18%
21%26%
27%
0% 5% 10% 15% 20% 25% 30%
UTMHKAWBJHJKAPHAPUHPASTNRJ
GUBI
UPMPORCGKE
YoY Increase in FY16/FY15
Source: Budget documents, Credit Suisse estimates Source: Budget documents, Credit Suisse estimates
The YoY comparisons seem high given that the FY15 actual spending was curtailed by the nearly Rs850 bn in slippages in transfers that the states did not know with just 1-2 months left to go in the year (see link). Moreover, as state budgets are presented without getting details of the significant central budget changes, many have not incorporated the higher central transfers. To this extent there could be some slippage on spending targets.
70093436
Highlight
70093436
Highlight
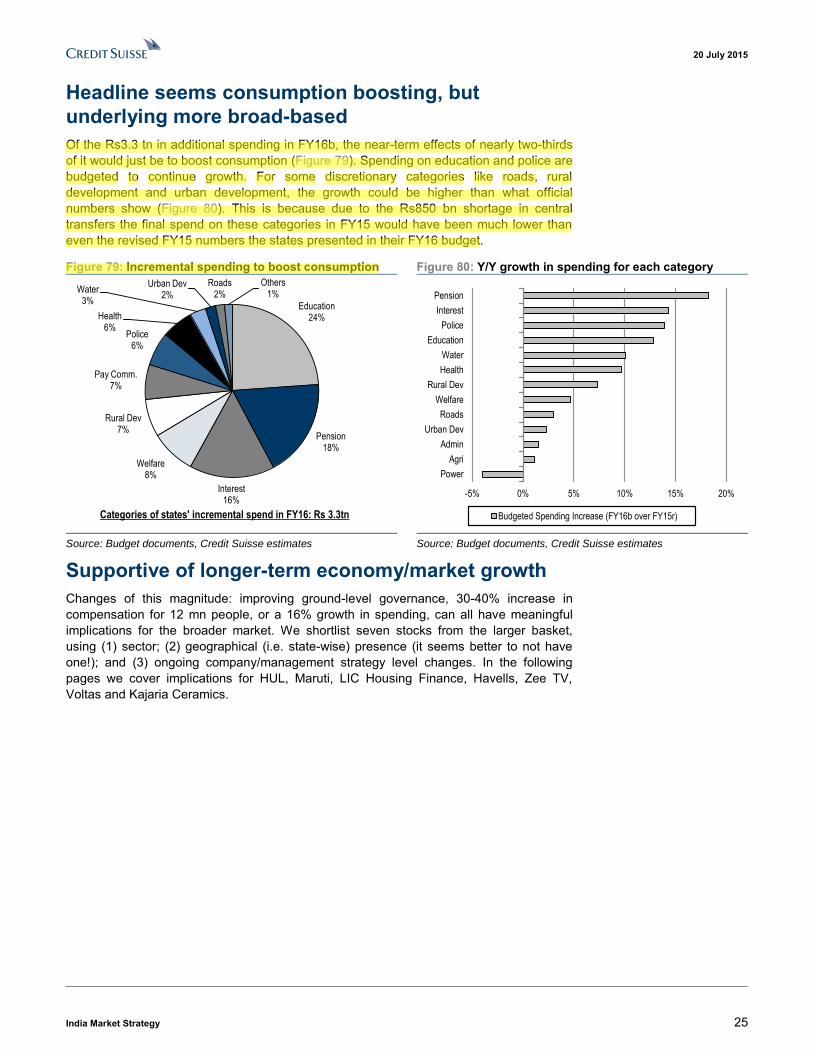
20 July 2015
India Market Strategy 25
Headline seems consumption boosting, but underlying more broad-based Of the Rs3.3 tn in additional spending in FY16b, the near-term effects of nearly two-thirds of it would just be to boost consumption (Figure 79). Spending on education and police are budgeted to continue growth. For some discretionary categories like roads, rural development and urban development, the growth could be higher than what official numbers show (Figure 80). This is because due to the Rs850 bn shortage in central transfers the final spend on these categories in FY15 would have been much lower than even the revised FY15 numbers the states presented in their FY16 budget.
Figure 79: Incremental spending to boost consumption Figure 80: Y/Y growth in spending for each category
Education24%
Pension18%
Interest16%
Welfare8%
Rural Dev7%
Pay Comm.7%
Police6%
Health6%
Water3%
Urban Dev2%
Roads2%
Others1%
Categories of states' incremental spend in FY16: Rs 3.3tn
-5% 0% 5% 10% 15% 20%
Power
Agri
Admin
Urban Dev
Roads
Welfare
Rural Dev
Health
Water
Education
Police
Interest
Pension
Budgeted Spending Increase (FY16b over FY15r)
Source: Budget documents, Credit Suisse estimates Source: Budget documents, Credit Suisse estimates
Supportive of longer-term economy/market growth Changes of this magnitude: improving ground-level governance, 30-40% increase in compensation for 12 mn people, or a 16% growth in spending, can all have meaningful implications for the broader market. We shortlist seven stocks from the larger basket, using (1) sector; (2) geographical (i.e. state-wise) presence (it seems better to not have one!); and (3) ongoing company/management strategy level changes. In the following pages we cover implications for HUL, Maruti, LIC Housing Finance, Havells, Zee TV, Voltas and Kajaria Ceramics.
70093436
Highlight
70093436
Highlight

Please see important disclaimer and disclosures at the end of the document
ECONOMICS
15 July 2015
Important Notice: The circumstances in which this publication has been produced are such that it is not appropriate to characterise it as independent
investment research as referred to in MiFID and that it should be treated as a marketing communication even if it contains a research recommendation.
This publication is also not subject to any prohibition on dealing ahead of the dissemination of investment research. However, SG is required to have
policies to manage the conflicts which may arise in the production of its research, including preventing dealing ahead of investment research.
Extract from a report
Latam Themes
No second line of defence against a commodity-led slowdown
The sustained fall in Latam growth since 2010 shows that the region was unprepared to
face the onslaught of a commodity-led slowdown (see the Commodities Review report
"Cycles within supercycles"). In the absence of the required structural reforms, domestic
sources alone will be insufficient to lift growth and improve other macro indicators. As a
result, Latam ex-Mexico faces a prolonged period of weaker growth, lower current account
and fiscal balances and pressure on currencies and other asset classes over the longer
term, notwithstanding the near-term impact of the impending start of US monetary
tightening.
(Also see our latest Commodities Review report "One swallow does not a summer make.")
The commodity price deceleration is affecting the macro economy severely. Except
for Mexico, most Latam countries are predominantly commodity exporters and are
facing deteriorating macro conditions due to lower commodity prices.
Domestic sources of growth have diminished. The falling share of manufacturing in
GDP and the erosion of domestic investment-funding sources (savings) have exposed
Latam’s overreliance on commodity demand and prices. (See also the Anchor Theme
#1 “Growth – Labour income and consumption to drive recovery” from our latest
quarterly Global Economic Outlook report.)
Reforms matter, but can’t entirely negate the impact of commodity. Notwithstanding
the recent sell-off in currency market, countries having proximity with the US or those
implementing credible reforms will eventually have better macro prospects. However,
Latam countries are still worse off on average with or without reforms.
Latam assets face long term challenges. Low commodity price environment and
resulting deterioration of macro indicators will keep Latam currencies weaker than
otherwise over the medium to longer term, notwithstanding the near-term impact of the
impending start of US monetary tightening.
Rising upside risk of tighter monetary policy. The impending start of a Fed tightening
cycle could lead to an upward bias to monetary policy rates compared with the last Fed
tightening cycle in 2004-06. (See also the Anchor theme #3 “Monetary Policy – Uneven
“real” policy impact” from the Global Economic Outlook report for more discussion.)
Global growth recovery may not improve commodity prices Latam macro indicators continue to worsen
Source: IMF WEO, Datastream, National sources, SG Cross Asset Research/Economics
-40
-30
-20
-10
0
10
20
30
40
-1
0
1
2
3
4
5
6
1993 1997 2001 2005 2009 2013 2017
%% World growth, LHSCommodity prices + IMF f orecastsCommodity prices + model f orecasts
IMF and model forecasts
-5
-4
-3
-2
-1
0
1
2
-2
0
2
4
6
8
2005 2007 2009 2011 2013
% of GDP% Growth, LHS Inf lation, LHS
Fiscal balance Current account balance
Note: Weighted average for Argentina, Brazil, Chile, Colombia, Mexico and Peru. Inflation average excludes Argentina.
Latin America
Dev Ashish
(91) 80 2802 4381 [email protected]
This document is being provided for the exclusive use of ABHINAV BHANDARI (Reliance Capital Asset Management Limited )
70093436
Highlight
70093436
Highlight
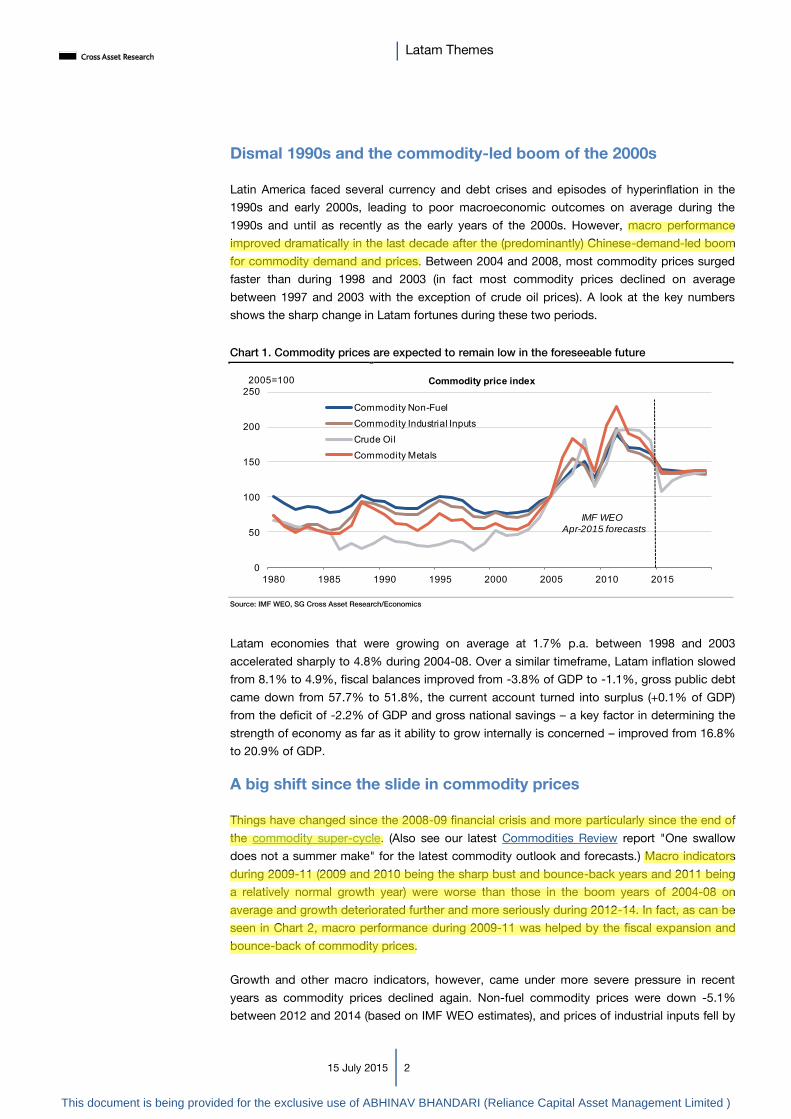
Latam Themes
15 July 2015 2
Dismal 1990s and the commodity-led boom of the 2000s
Latin America faced several currency and debt crises and episodes of hyperinflation in the
1990s and early 2000s, leading to poor macroeconomic outcomes on average during the
1990s and until as recently as the early years of the 2000s. However, macro performance
improved dramatically in the last decade after the (predominantly) Chinese-demand-led boom
for commodity demand and prices. Between 2004 and 2008, most commodity prices surged
faster than during 1998 and 2003 (in fact most commodity prices declined on average
between 1997 and 2003 with the exception of crude oil prices). A look at the key numbers
shows the sharp change in Latam fortunes during these two periods.
Chart 1. Commodity prices are expected to remain low in the foreseeable future
Source: IMF WEO, SG Cross Asset Research/Economics
Latam economies that were growing on average at 1.7% p.a. between 1998 and 2003
accelerated sharply to 4.8% during 2004-08. Over a similar timeframe, Latam inflation slowed
from 8.1% to 4.9%, fiscal balances improved from -3.8% of GDP to -1.1%, gross public debt
came down from 57.7% to 51.8%, the current account turned into surplus (+0.1% of GDP)
from the deficit of -2.2% of GDP and gross national savings – a key factor in determining the
strength of economy as far as it ability to grow internally is concerned – improved from 16.8%
to 20.9% of GDP.
A big shift since the slide in commodity prices
Things have changed since the 2008-09 financial crisis and more particularly since the end of
the commodity super-cycle. (Also see our latest Commodities Review report "One swallow
does not a summer make" for the latest commodity outlook and forecasts.) Macro indicators
during 2009-11 (2009 and 2010 being the sharp bust and bounce-back years and 2011 being
a relatively normal growth year) were worse than those in the boom years of 2004-08 on
average and growth deteriorated further and more seriously during 2012-14. In fact, as can be
seen in Chart 2, macro performance during 2009-11 was helped by the fiscal expansion and
bounce-back of commodity prices.
Growth and other macro indicators, however, came under more severe pressure in recent
years as commodity prices declined again. Non-fuel commodity prices were down -5.1%
between 2012 and 2014 (based on IMF WEO estimates), and prices of industrial inputs fell by
0
50
100
150
200
250
1980 1985 1990 1995 2000 2005 2010 2015
2005=100 Commodity price index
Commodity Non-Fuel
Commodity Industrial Inputs
Crude Oil
Commodity Metals
IMF WEO
Apr-2015 forecasts
This document is being provided for the exclusive use of ABHINAV BHANDARI (Reliance Capital Asset Management Limited )
70093436
Highlight
70093436
Highlight
70093436
Highlight
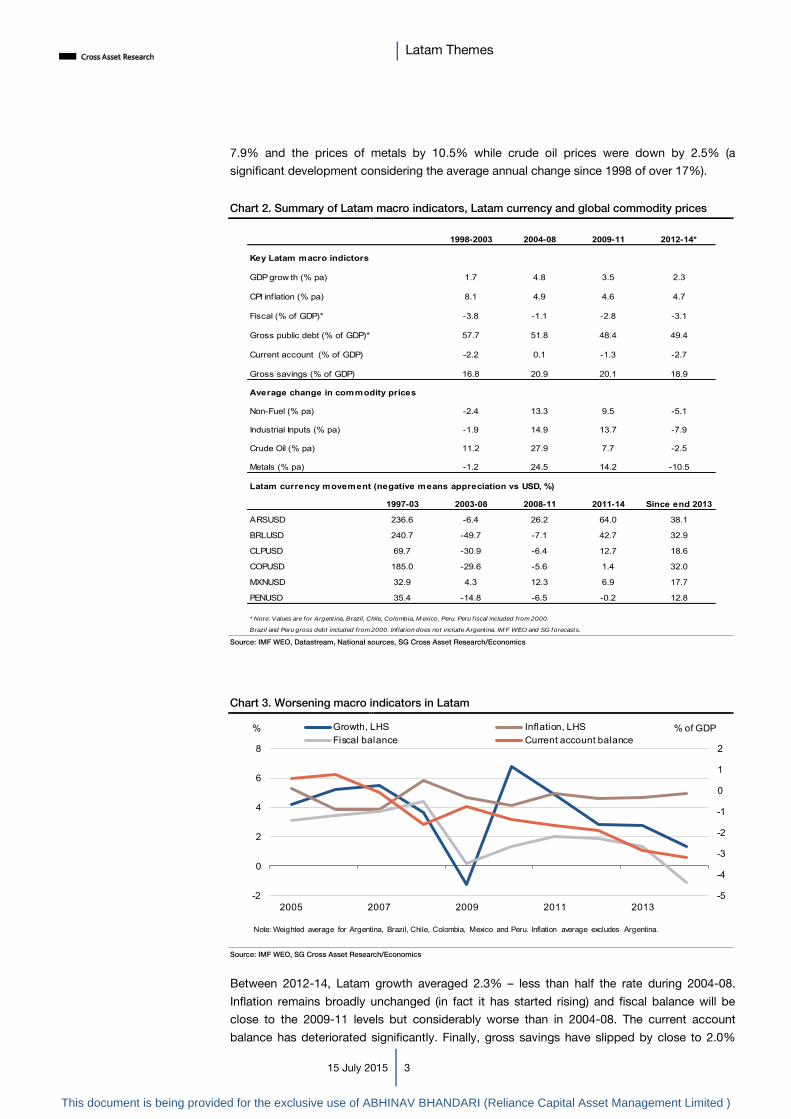
Latam Themes
15 July 2015 3
7.9% and the prices of metals by 10.5% while crude oil prices were down by 2.5% (a
significant development considering the average annual change since 1998 of over 17%).
Chart 2. Summary of Latam macro indicators, Latam currency and global commodity prices
Source: IMF WEO, Datastream, National sources, SG Cross Asset Research/Economics
Chart 3. Worsening macro indicators in Latam
Source: IMF WEO, SG Cross Asset Research/Economics
Between 2012-14, Latam growth averaged 2.3% – less than half the rate during 2004-08.
Inflation remains broadly unchanged (in fact it has started rising) and fiscal balance will be
close to the 2009-11 levels but considerably worse than in 2004-08. The current account
balance has deteriorated significantly. Finally, gross savings have slipped by close to 2.0%
1998-2003 2004-08 2009-11 2012-14*
Key Latam macro indictors
GDP grow th (% pa) 1.7 4.8 3.5 2.3
CPI inflation (% pa) 8.1 4.9 4.6 4.7
Fiscal (% of GDP)* -3.8 -1.1 -2.8 -3.1
Gross public debt (% of GDP)* 57.7 51.8 48.4 49.4
Current account (% of GDP) -2.2 0.1 -1.3 -2.7
Gross savings (% of GDP) 16.8 20.9 20.1 18.9
Average change in commodity prices
Non-Fuel (% pa) -2.4 13.3 9.5 -5.1
Industrial Inputs (% pa) -1.9 14.9 13.7 -7.9
Crude Oil (% pa) 11.2 27.9 7.7 -2.5
Metals (% pa) -1.2 24.5 14.2 -10.5
Latam currency movement (negative means appreciation vs USD, %)
1997-03 2003-08 2008-11 2011-14 Since end 2013
ARSUSD 236.6 -6.4 26.2 64.0 38.1
BRLUSD 240.7 -49.7 -7.1 42.7 32.9
CLPUSD 69.7 -30.9 -6.4 12.7 18.6
COPUSD 185.0 -29.6 -5.6 1.4 32.0
MXNUSD 32.9 4.3 12.3 6.9 17.7
PENUSD 35.4 -14.8 -6.5 -0.2 12.8
* Note: Values are for Argent ina, Brazil, Chile, Colombia, M exico, Peru. Peru f iscal included from 2000.
Brazil and Peru gross debt included from 2000. Inf lat ion does not include Argent ina. IM F WEO and SG forecasts.
-5
-4
-3
-2
-1
0
1
2
-2
0
2
4
6
8
2005 2007 2009 2011 2013
% of GDP% Growth, LHS Inflation, LHSFiscal balance Current account balance
Note: Weighted average for Argentina, Brazil, Chile, Colombia, Mexico and Peru. Inflation average excludes Argentina.
This document is being provided for the exclusive use of ABHINAV BHANDARI (Reliance Capital Asset Management Limited )
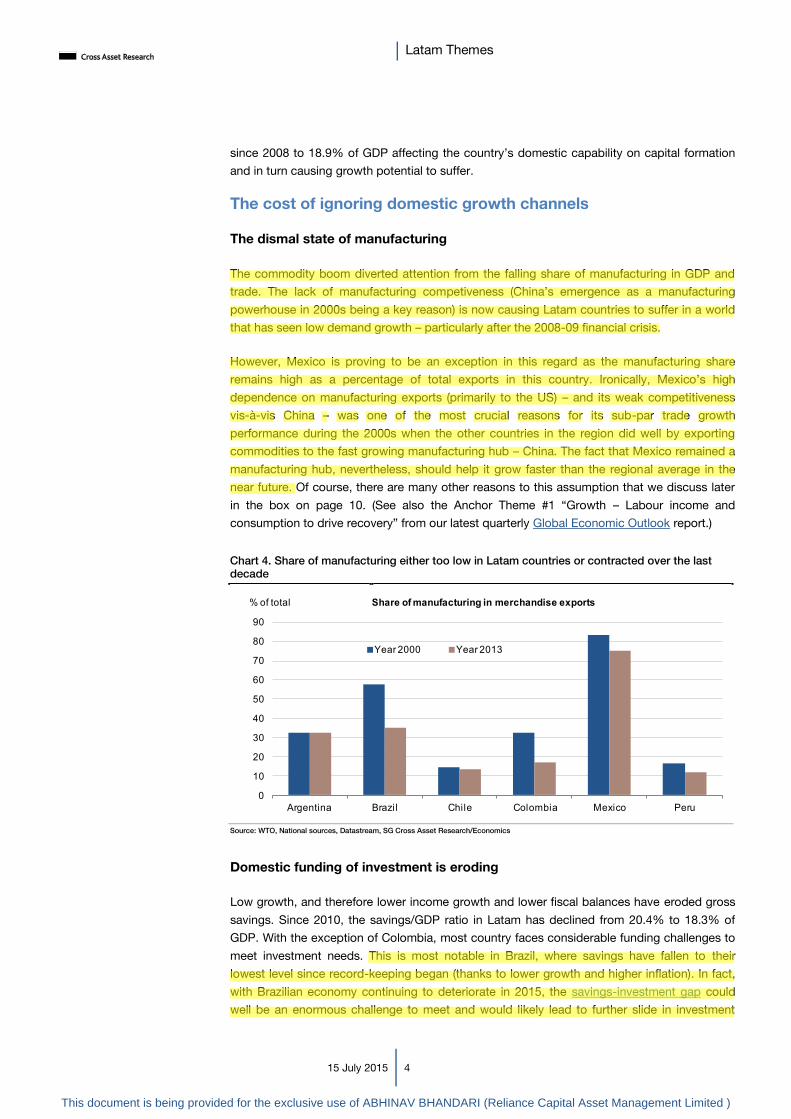
Latam Themes
15 July 2015 4
since 2008 to 18.9% of GDP affecting the country’s domestic capability on capital formation
and in turn causing growth potential to suffer.
The cost of ignoring domestic growth channels
The dismal state of manufacturing
The commodity boom diverted attention from the falling share of manufacturing in GDP and
trade. The lack of manufacturing competiveness (China’s emergence as a manufacturing
powerhouse in 2000s being a key reason) is now causing Latam countries to suffer in a world
that has seen low demand growth – particularly after the 2008-09 financial crisis.
However, Mexico is proving to be an exception in this regard as the manufacturing share
remains high as a percentage of total exports in this country. Ironically, Mexico’s high
dependence on manufacturing exports (primarily to the US) – and its weak competitiveness
vis-à-vis China – was one of the most crucial reasons for its sub-par trade growth
performance during the 2000s when the other countries in the region did well by exporting
commodities to the fast growing manufacturing hub – China. The fact that Mexico remained a
manufacturing hub, nevertheless, should help it grow faster than the regional average in the
near future. Of course, there are many other reasons to this assumption that we discuss later
in the box on page 10. (See also the Anchor Theme #1 “Growth – Labour income and
consumption to drive recovery” from our latest quarterly Global Economic Outlook report.)
Chart 4. Share of manufacturing either too low in Latam countries or contracted over the last
decade
Source: WTO, National sources, Datastream, SG Cross Asset Research/Economics
Domestic funding of investment is eroding
Low growth, and therefore lower income growth and lower fiscal balances have eroded gross
savings. Since 2010, the savings/GDP ratio in Latam has declined from 20.4% to 18.3% of
GDP. With the exception of Colombia, most country faces considerable funding challenges to
meet investment needs. This is most notable in Brazil, where savings have fallen to their
lowest level since record-keeping began (thanks to lower growth and higher inflation). In fact,
with Brazilian economy continuing to deteriorate in 2015, the savings-investment gap could
well be an enormous challenge to meet and would likely lead to further slide in investment
0
10
20
30
40
50
60
70
80
90
Argentina Brazil Chile Colombia Mexico Peru
% of total Share of manufacturing in merchandise exports
Year 2000 Year 2013
This document is being provided for the exclusive use of ABHINAV BHANDARI (Reliance Capital Asset Management Limited )
70093436
Highlight
70093436
Highlight
70093436
Highlight
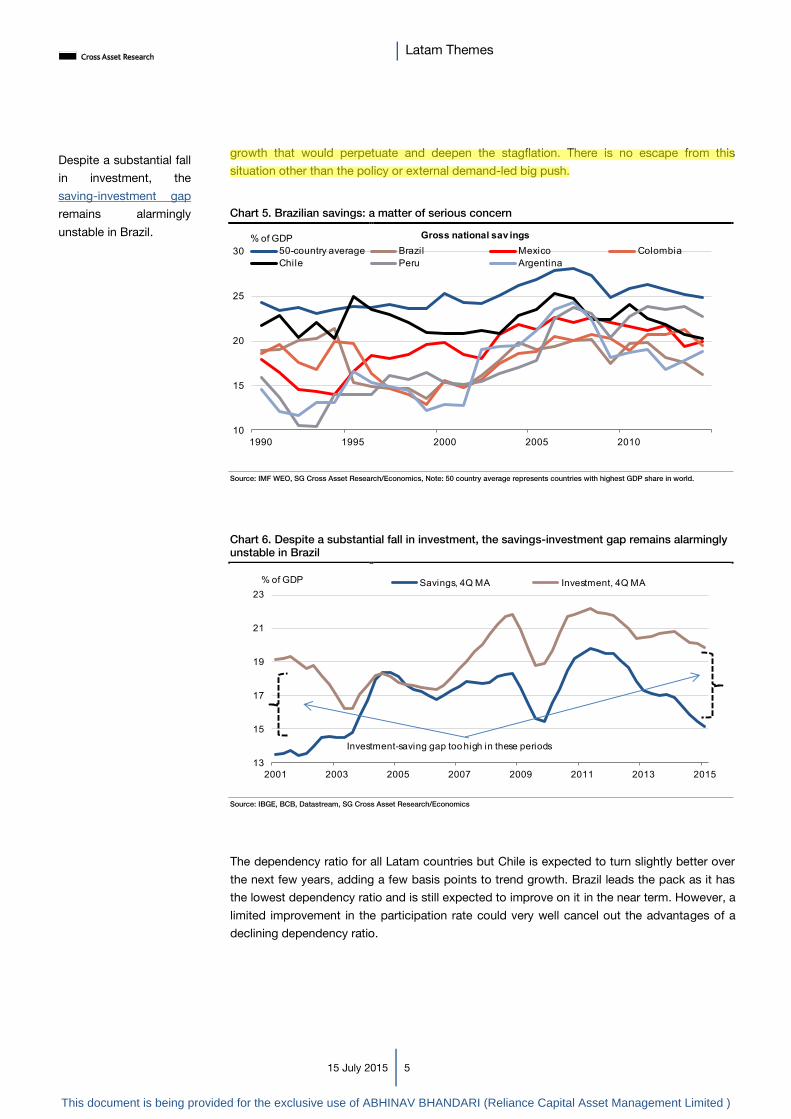
Latam Themes
15 July 2015 5
growth that would perpetuate and deepen the stagflation. There is no escape from this
situation other than the policy or external demand-led big push.
Chart 5. Brazilian savings: a matter of serious concern
Source: IMF WEO, SG Cross Asset Research/Economics, Note: 50 country average represents countries with highest GDP share in world.
Chart 6. Despite a substantial fall in investment, the savings-investment gap remains alarmingly
unstable in Brazil
Source: IBGE, BCB, Datastream, SG Cross Asset Research/Economics
The dependency ratio for all Latam countries but Chile is expected to turn slightly better over
the next few years, adding a few basis points to trend growth. Brazil leads the pack as it has
the lowest dependency ratio and is still expected to improve on it in the near term. However, a
limited improvement in the participation rate could very well cancel out the advantages of a
declining dependency ratio.
10
15
20
25
30
1990 1995 2000 2005 2010
% of GDP Gross national sav ings50-country average Brazil Mexico ColombiaChile Peru Argentina
13
15
17
19
21
23
2001 2003 2005 2007 2009 2011 2013 2015
% of GDP Savings, 4Q MA Investment, 4Q MA
Investment-saving gap too high in these periods
Despite a substantial fall
in investment, the
saving-investment gap
remains alarmingly
unstable in Brazil.
This document is being provided for the exclusive use of ABHINAV BHANDARI (Reliance Capital Asset Management Limited )
70093436
Highlight
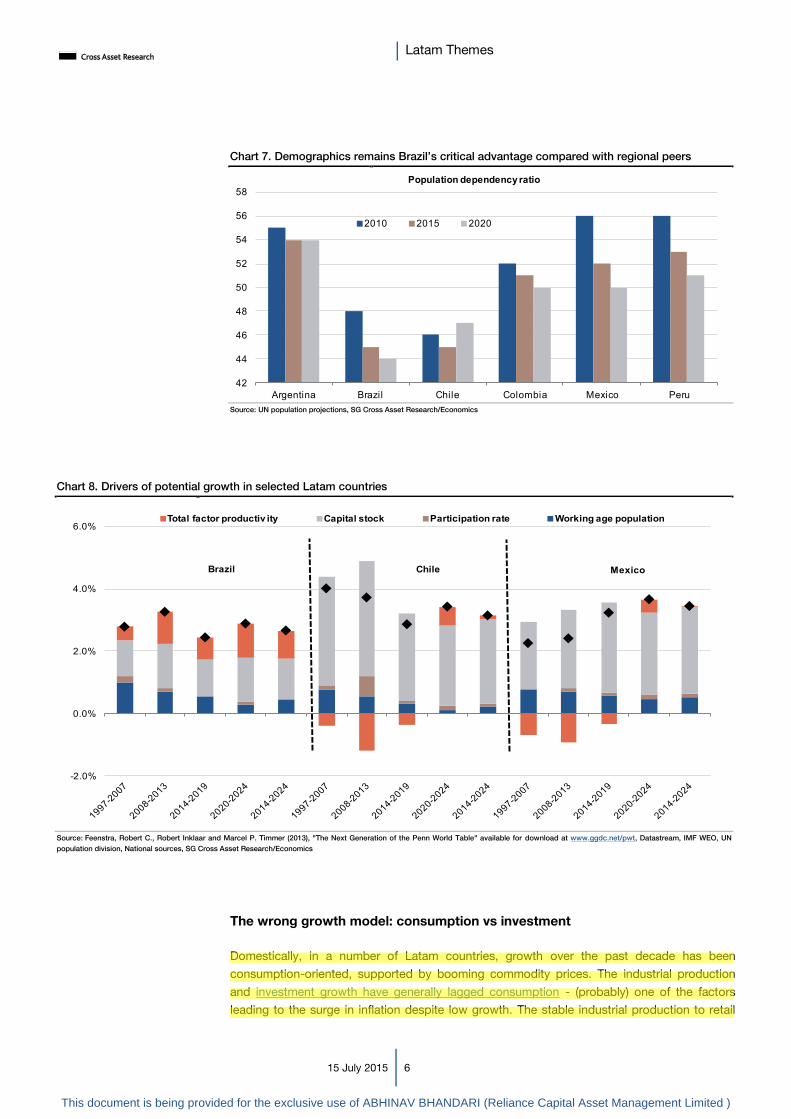
Latam Themes
15 July 2015 6
Chart 7. Demographics remains Brazil’s critical advantage compared with regional peers
Source: UN population projections, SG Cross Asset Research/Economics
Chart 8. Drivers of potential growth in selected Latam countries
Source: Feenstra, Robert C., Robert Inklaar and Marcel P. Timmer (2013), "The Next Generation of the Penn World Table" available for download at www.ggdc.net/pwt, Datastream, IMF WEO, UN
population division, National sources, SG Cross Asset Research/Economics
The wrong growth model: consumption vs investment
Domestically, in a number of Latam countries, growth over the past decade has been
consumption-oriented, supported by booming commodity prices. The industrial production
and investment growth have generally lagged consumption - (probably) one of the factors
leading to the surge in inflation despite low growth. The stable industrial production to retail
42
44
46
48
50
52
54
56
58
Argentina Brazil Chile Colombia Mexico Peru
Population dependency ratio
2010 2015 2020
-2.0%
0.0%
2.0%
4.0%
6.0%Total factor productiv ity Capital stock Participation rate Working age population
Brazil Chile Mexico
This document is being provided for the exclusive use of ABHINAV BHANDARI (Reliance Capital Asset Management Limited )
70093436
Highlight
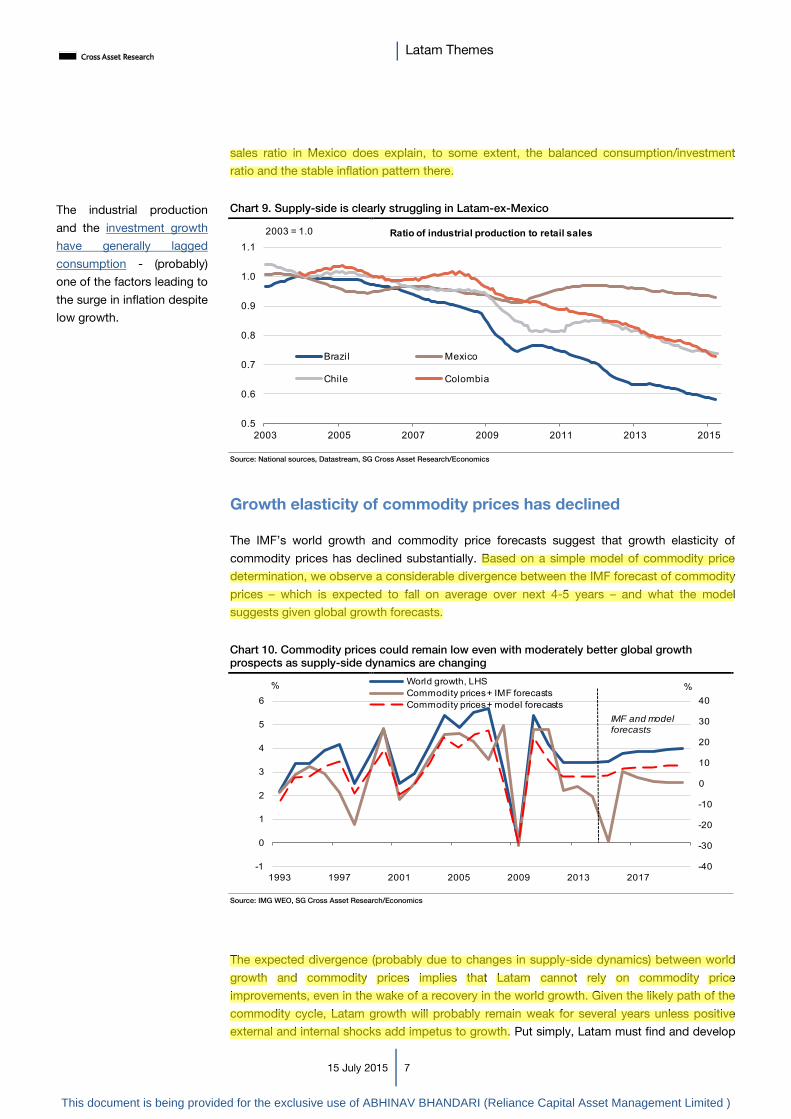
Latam Themes
15 July 2015 7
sales ratio in Mexico does explain, to some extent, the balanced consumption/investment
ratio and the stable inflation pattern there.
Chart 9. Supply-side is clearly struggling in Latam-ex-Mexico
Source: National sources, Datastream, SG Cross Asset Research/Economics
Growth elasticity of commodity prices has declined
The IMF’s world growth and commodity price forecasts suggest that growth elasticity of
commodity prices has declined substantially. Based on a simple model of commodity price
determination, we observe a considerable divergence between the IMF forecast of commodity
prices – which is expected to fall on average over next 4-5 years – and what the model
suggests given global growth forecasts.
Chart 10. Commodity prices could remain low even with moderately better global growth
prospects as supply-side dynamics are changing
Source: IMG WEO, SG Cross Asset Research/Economics
The expected divergence (probably due to changes in supply-side dynamics) between world
growth and commodity prices implies that Latam cannot rely on commodity price
improvements, even in the wake of a recovery in the world growth. Given the likely path of the
commodity cycle, Latam growth will probably remain weak for several years unless positive
external and internal shocks add impetus to growth. Put simply, Latam must find and develop
0.5
0.6
0.7
0.8
0.9
1.0
1.1
2003 2005 2007 2009 2011 2013 2015
2003 = 1.0 Ratio of industrial production to retail sales
Brazil Mexico
Chile Colombia
-40
-30
-20
-10
0
10
20
30
40
-1
0
1
2
3
4
5
6
1993 1997 2001 2005 2009 2013 2017
%% World growth, LHSCommodity prices + IMF forecastsCommodity prices + model forecasts
IMF and model
forecasts
The industrial production
and the investment growth
have generally lagged
consumption - (probably)
one of the factors leading to
the surge in inflation despite
low growth.
This document is being provided for the exclusive use of ABHINAV BHANDARI (Reliance Capital Asset Management Limited )
70093436
Highlight
70093436
Highlight
70093436
Highlight

Latam Themes
15 July 2015 8
domestic channels through structural reforms to raise its growth potential. Our estimate
shows that the decline in commodity prices has actually shaved off about one-third of Latam’s
growth potential. This, of course, does not take into account the indirect effects and other
structural and institutional factors that have also contributed to low growth in several countries
(for example in Argentina).
Chart 11. Commodity prices would shave-off one-third of Latam growth potential (= actual
average growth between 2003 and 2012)
Source: National sources, IMF WEO, SG Cross Asset Research/Economics
Low growth and BoP risk are pro-cyclical in Latam
Unlike most other countries, Latam’s external balances do not have a counter-cyclical
relationship with growth. In fact, growth depends a lot on the trade surplus and its impact on
the investment cycle (see discussion below). As a result, any deterioration in growth goes
hand-in-hand with balance-of-payment risk.
Chart 12. Pro-cyclical external balances: growth and current account balance falling together
Source: IMF WEO, Datastream, National sources, SG Cross Asset Research/Economics
Impact of 10% pt fall in non- fuel commodity price inflation vs 2003- 12
average of 9% (t- statistics)Actual average growth
between 2003- 12
Argentina 2.50 2.4 7.2
Brazil 1.52 6.0 3.6
Chile 1.12 2.3 4.7
Colombia 1.46 3.8 4.8
Mexico 0.75 1.1 2.7
Peru 1.90 4.1 6.5
Latam 1.23 4.4 3.6
-4
-3
-2
-1
0
1
-2
0
2
4
6
8
2000 2002 2004 2006 2008 2010 2012 2014
% of GDP% Current account balance
Growth, LHS
Note: Weighted average for Argentina, Brazil, Chile, Colombia, Mexico and Peru.
This document is being provided for the exclusive use of ABHINAV BHANDARI (Reliance Capital Asset Management Limited )

Latam Themes
15 July 2015 9
Export dependent investment cycle
Apart from the direct impact on growth and the current account, the commodity-led export
slowdown has also affected the investment cycle (likely not limited to the mining sector) and
this is potentially aggravating growth trends through employment and consumption channels
as well (as we find out in case of Brazil). Here again, the link between real export growth and
the investment cycle appears weaker at present for Mexico while it seems to have a direct and
proportional relationship in Brazil and Argentina. For the two mining-dependent countries –
Chile and Peru – the relationship is direct and more than proportional, implying a greater
investment decline in the event of a contraction in exports. While Colombian investment
growth has remained strong until now, we suspect that it has peaked and might follow a
weaker trajectory now, as suggested by export growth (Q3 14 being an exceptional quarter).
Chart 13a. Weaker investment growth in Brazil, Argentina, Chile and Peru in response to falling exports
Source: National sources, Datastream, SG Cross Asset Research/Economics
Chart 13b. Gross fixed capital formation appears stronger in Mexico, while it may have peaked in Colombia
Source: National sources, Datastream, SG Cross Asset Research/Economics
Mexico remains best placed among regional peers
Mexico’s limited reliance on commodity exports and the high share of manufacturing in its
GDP and exports make it less vulnerable to low commodity prices over longer run
(notwithstanding the recent re-pricing of MXN post the sharp fall in oil prices amid concerns
about beginning of the Fed tightening cycle). Moreover, unlike other Latam countries,
Mexico’s overdependence on the US (which is the market for approximately 80% of total
Mexican exports) may in fact be a blessing in disguise this time around. Finally, recent reforms
(see the box below) could improve the country’s growth potential substantially over the next
few years. Trade and growth will help improve other macro indicators too, making Mexico the
most attractive investment destination in the region.
-30
-20
-10
0
10
20
30
40
2001 2003 2005 2007 2009 2011 2013 2015
% yoy Argentina: real GFCFArgentina: real exports
-20
-10
0
10
20
30
40
2001 2003 2005 2007 2009 2011 2013 2015
% yoy Brazil: real GFCFBrazil: real exports
-20
-10
0
10
20
30
40
2001 2003 2005 2007 2009 2011 2013
% yoy Chile: real GFCFChile: real exports
-20
-10
0
10
20
30
40
2001 2003 2005 2007 2009 2011 2013
% yoy Colombia: real GFCFColombia: real exports
-20
-10
0
10
20
30
2001 2003 2005 2007 2009 2011 2013
% yoy Mexico: real GFCFMexico: real exports
-20
-10
0
10
20
30
40
2001 2003 2005 2007 2009 2011 2013 2015
% yoy Peru: real GFCFPeru: real exports
This document is being provided for the exclusive use of ABHINAV BHANDARI (Reliance Capital Asset Management Limited )
70093436
Highlight
70093436
Highlight
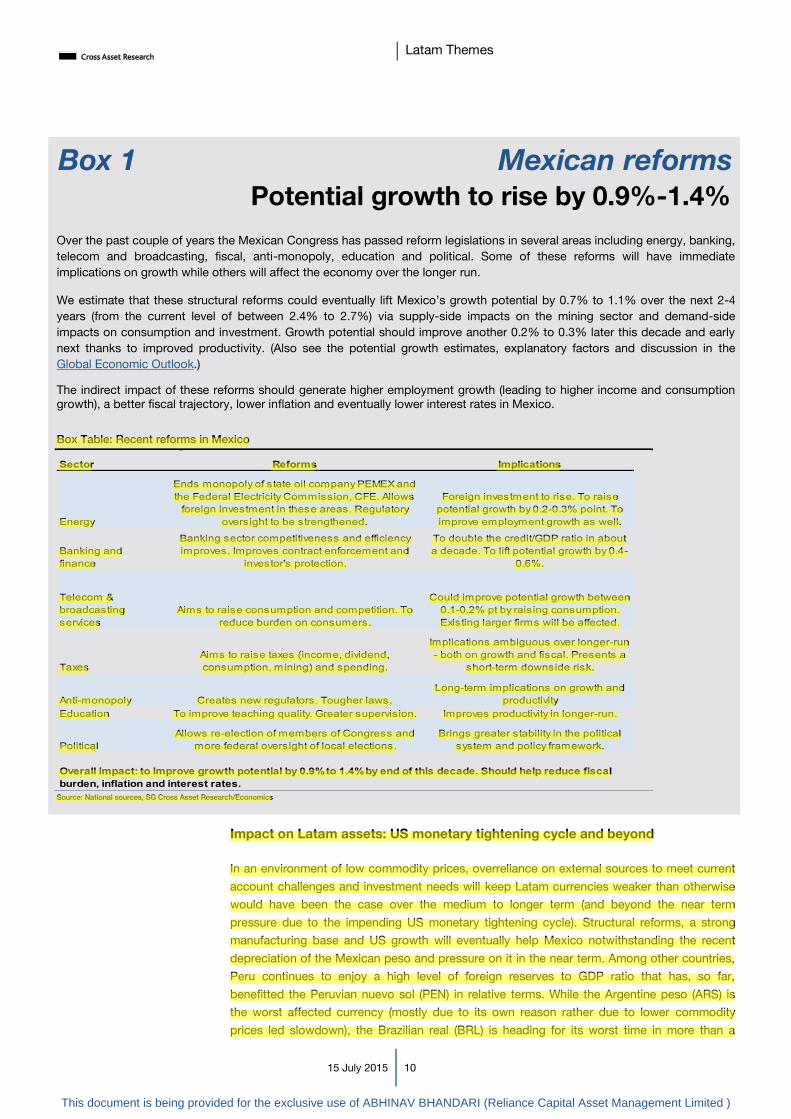
Latam Themes
15 July 2015 10
Over the past couple of years the Mexican Congress has passed reform legislations in several areas including energy, banking,
telecom and broadcasting, fiscal, anti-monopoly, education and political. Some of these reforms will have immediate
implications on growth while others will affect the economy over the longer run.
We estimate that these structural reforms could eventually lift Mexico’s growth potential by 0.7% to 1.1% over the next 2-4
years (from the current level of between 2.4% to 2.7%) via supply-side impacts on the mining sector and demand-side
impacts on consumption and investment. Growth potential should improve another 0.2% to 0.3% later this decade and early
next thanks to improved productivity. (Also see the potential growth estimates, explanatory factors and discussion in the
Global Economic Outlook.)
The indirect impact of these reforms should generate higher employment growth (leading to higher income and consumption
growth), a better fiscal trajectory, lower inflation and eventually lower interest rates in Mexico.
Box Table: Recent reforms in Mexico
Source: National sources, SG Cross Asset Research/Economics
Impact on Latam assets: US monetary tightening cycle and beyond
In an environment of low commodity prices, overreliance on external sources to meet current
account challenges and investment needs will keep Latam currencies weaker than otherwise
would have been the case over the medium to longer term (and beyond the near term
pressure due to the impending US monetary tightening cycle). Structural reforms, a strong
manufacturing base and US growth will eventually help Mexico notwithstanding the recent
depreciation of the Mexican peso and pressure on it in the near term. Among other countries,
Peru continues to enjoy a high level of foreign reserves to GDP ratio that has, so far,
benefitted the Peruvian nuevo sol (PEN) in relative terms. While the Argentine peso (ARS) is
the worst affected currency (mostly due to its own reason rather due to lower commodity
prices led slowdown), the Brazilian real (BRL) is heading for its worst time in more than a
Sector Reforms Implications
Energy
Ends monopoly of state oil company PEMEX and the Federal Electricity Commission, CFE. Allows
foreign investment in these areas. Regulatory oversight to be strengthened.
Foreign investment to rise. To raise potential growth by 0.2-0.3% point. To improve employment growth as well.
Banking and finance
Banking sector competitiveness and efficiency improves. Improves contract enforcement and
investor's protection.
To double the credit/GDP ratio in about a decade. To lift potential growth by 0.4-
0.6%.
Telecom & broadcasting services
Aims to raise consumption and competition. To reduce burden on consumers.
Could improve potential growth between 0.1-0.2% pt by raising consumption. Existing larger firms will be affected.
TaxesAims to raise taxes (income, dividend, consumption, mining) and spending.
Implications ambiguous over longer-run - both on growth and fiscal. Presents a
short-term downside risk.
Anti-monopoly Creates new regulators. Tougher laws. Long-term implications on growth and
productivityEducation To improve teaching quality. Greater supervision. Improves productivity in longer-run.
PoliticalAllows re-election of members of Congress and
more federal oversight of local elections. Brings greater stability in the political
system and policy framework.
Overall impact: to improve growth potential by 0.9% to 1.4% by end of this decade. Should help reduce fiscal burden, inflation and interest rates.
Box 1 Mexican reforms
Potential growth to rise by 0.9%-1.4%
This document is being provided for the exclusive use of ABHINAV BHANDARI (Reliance Capital Asset Management Limited )
70093436
Highlight

Latam Themes
15 July 2015 11
decade. The Chilean peso (CLP) has depreciated more than 30% since 2012 amid dwindling
growth and a wide current account deficit. Finally, there remains significant pressure on the
currencies of even better managed economies like Colombia in the medium term (as seen in
the recent pressure on the Colombian peso). (Also see our Cross Asset Strategy report "The
global implications of lower oil prices.")
Chart 14. Peru has the highest official foreign exchange reserves to GDP ratio in Latam
Source: IMF WEO, Datastream, National sources, SG Cross Asset Research/Economics
Chart 15. MXN remains top performing Latam currency since 2012 despite recent sell-off, BRL
in red mark
Source: Datastream, National sources, SG Cross Asset Research/Economics
Monetary policy in an era of lower commodity prices
The world has changed dramatically for Latam
The Fed’s monetary tightening in 2004-06 had little effect on Latam policy rates as the bulk of
Latam policy changes then can be explained by domestic inflation and growth concerns.
Moreover, there is little evidence to show that Latam currencies suffered during the last Fed
tightening cycle and hence it can be argued that Latam inflation at that time was
predominantly domestic.
Part of the above still holds true for 2015 when the Fed begins monetary tightening as
expected by our US economists. However, this time is different. Lower commodity prices
have dented Latam macro fundamentals – severely in some cases – and are exerting extreme
0
5
10
15
20
25
30
35
2000 2002 2004 2006 2008 2010 2012 2014
% of GDP Argentina Brazil Chile Colombia Mexico Peru
0.5
0.6
0.7
0.8
0.9
1.0
1.1
1.2
Jan-12 Jul-12 Jan-13 Jul-13 Jan-14 Jul-14 Jan-15 Jul-15
Jan-12 = 1.0 Latam currency movement vs USDBRL CLP COP MXN PEN
This document is being provided for the exclusive use of ABHINAV BHANDARI (Reliance Capital Asset Management Limited )
70093436
Highlight

Latam Themes
15 July 2015 12
pressure on Latam assets. Under this scenario, there appears to be some upside risk to
Latam policy rates from the impending start of a Fed tightening cycle. This may or may not
result in excessive tightening in Brazil and Colombia, early tightening in Mexico, and no further
easing in Chile and Peru. However, as pressure on currency is being felt in these countries,
there could be a significantly stronger upward bias on monetary policy rates compared with
last Fed tightening cycle. (See also the Anchor theme #3 “Monetary Policy – Uneven “real”
policy impact” from the Global Economic Outlook report for more discussion.)
Chart 16. Inflation not a problem in Latam-ex-Brazil, but has
risen in most of them ex-Mexico over past couple of years
Chart 17. Significantly stronger upward bias on monetary
policy rates given the low growth environment
Source: Datastream, National sources, SG Cross Asset Research/Economics
Conclusion: No defense against a commodity-led slowdown
The commodity price deceleration is affecting the macro economy severely. Except
for Mexico, most Latam countries are predominantly commodity exporters and are
facing deteriorating macro conditions due to lower commodity prices.
Domestic sources of growth have diminished. The falling share of manufacturing in
GDP and the erosion of domestic investment-funding sources (savings) have exposed
Latam’s overreliance on commodity demand and prices. (See also the Anchor Theme
#1 “Growth – Labour income and consumption to drive recovery” from our latest
quarterly Global Economic Outlook report.)
Reforms matter, but can’t entirely negate the impact of commodity. Notwithstanding
the recent sell-off in currency market, countries having proximity with the US or those
implementing credible reforms will eventually have better macro prospects. However,
Latam countries are still worse off on average with or without reforms.
Latam assets face long term challenges. Low commodity price environment and
resulting deterioration of macro indicators will keep Latam currencies weaker than
otherwise over the medium to longer term, notwithstanding the near-term impact of the
impending start of US monetary tightening.
Rising upside risk of tighter monetary policy. The impending start of a Fed tightening
cycle could lead to an upward bias to monetary policy rates compared with the last Fed
tightening cycle in 2004-06. (See also the Anchor theme #3 “Monetary Policy – Uneven
“real” policy impact” from the Global Economic Outlook report for more discussion.)
-4
-2
0
2
4
6
8
10
2004 2006 2008 2010 2012 2014
% y oy Brazil Mexico ChileColombia Peru
0
2
4
6
8
10
12
14
16
2006 2008 2010 2012 2014
% Brazil Mexico ChileColombia Peru
This document is being provided for the exclusive use of ABHINAV BHANDARI (Reliance Capital Asset Management Limited )
70093436
Highlight
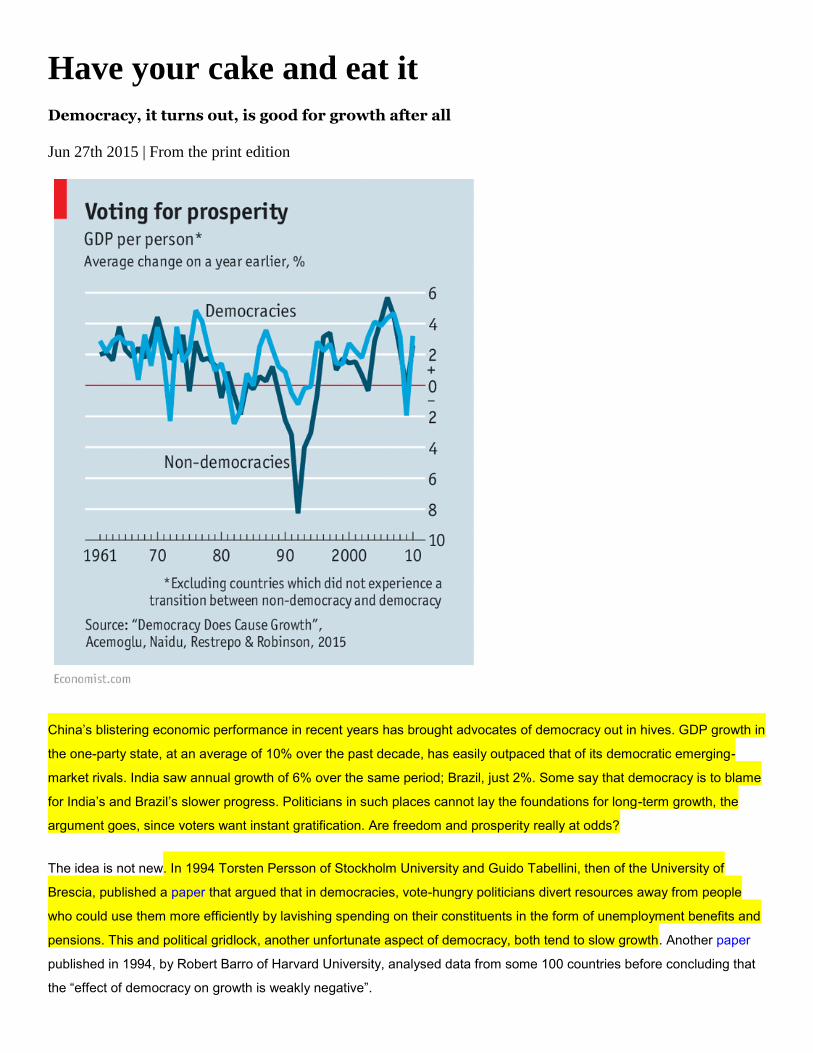
Have your cake and eat it
Democracy, it turns out, is good for growth after all
Jun 27th 2015 | From the print edition
China’s blistering economic performance in recent years has brought advocates of democracy out in hives. GDP growth in
the one-party state, at an average of 10% over the past decade, has easily outpaced that of its democratic emerging-
market rivals. India saw annual growth of 6% over the same period; Brazil, just 2%. Some say that democracy is to blame
for India’s and Brazil’s slower progress. Politicians in such places cannot lay the foundations for long-term growth, the
argument goes, since voters want instant gratification. Are freedom and prosperity really at odds?
The idea is not new. In 1994 Torsten Persson of Stockholm University and Guido Tabellini, then of the University of
Brescia, published a paper that argued that in democracies, vote-hungry politicians divert resources away from people
who could use them more efficiently by lavishing spending on their constituents in the form of unemployment benefits and
pensions. This and political gridlock, another unfortunate aspect of democracy, both tend to slow growth. Another paper
published in 1994, by Robert Barro of Harvard University, analysed data from some 100 countries before concluding that
the “effect of democracy on growth is weakly negative”.

Democracy’s economic denigrators have not had it all their own way, however. In a paper published in 2008 Daron
Acemoglu of the Massachusetts Institute of Technology argued that in non-democracies, well-connected firms use
political power to shut out competition. Ukraine, an oligarchy, has a backward economy partly because investors have
typically been barred from large parts of the economy, such as the gas sector. That is not the only problem with
repressive regimes. When people have no political power, the risk of conflict rises: think, for example, of the protests in
Hong Kong last year. That may scare away investors. Autocracies also tend to skimp on schools and health care, which
pushes down on the productive potential of the economy.
Mr Acemoglu, along with three colleagues, has now come back to the question in a new paper. It notes that comparing
the economic impact of different political systems is tricky. The average “free” country, according to a classification by
Freedom House, an advocacy group, has a GDP per person of $17,000, four times that of the average “unfree” or “partly
free” country. That could be seen as an indicator in itself, but it also presents a problem. Economists have long reasoned
that poor countries should grow faster than rich ones, since they can boost growth dramatically with simple investments in
schools and roads, whereas rich nations have exhausted such easy gains. Given that authoritarian countries are poorer
than democracies, they should also grow faster. Add in all manner of economic and cultural differences, and disentangling
the effect of democracy itself is tough.
The paper also identifies another methodological problem. In the years leading up to a change in the political regime—ie,
when a country goes from being an autocracy to a democracy (or vice versa)—GDP growth stumbles. Small wonder: such
transitions often involve mass protests or violent coups. Alternatively, a flailing economy may itself make a change of
regime more likely. Researchers, though, have typically failed to account for the volatile behaviour of GDP in response to
such events.
Autocracies 1, democracies 1.2
The authors look at data for 175 countries from 1960 to 2010 and assess their degree of democracy based on an index
that measures things like free elections and checks on executive power. They then compare growth rates and political
freedom, having made adjustments for the odd behaviour of GDP during transitions and for the relative poverty of unfree
countries, among other distortions. They find that a “permanent” democratisation—where there is no slide back into
autocracy—leads to an increase in GDP per person of about 20% in the subsequent 25 years. When a given country is in
such a democratic state, it grows faster than when it is not (see chart). The authors reckon that higher investment in
schooling and health care and lower social unrest are the reason. There is also no clear evidence to suggest that poor
countries benefit less from democratisation, as many had assumed.
By now, sceptics will have spotted a problem. Some factors may help a country both to become more democratic and to
grow faster. Take South Korea’s transition to democracy in 1988. In the subsequent five years its income per person grew
at an average annual rate of 6%. That makes political freedom look like an economic boon, but it is not so simple. In the
years leading up to the transition, university attendance grew rapidly. As the number of educated Koreans rose, calls for
democracy got louder. Yet better education may also have led to stronger economic growth in itself. That makes it hard to
tell whether democratisation causes growth, or growth causes democratisation.

To help solve this problem, the authors need a clean variable, one that runs from political system to economic outcome,
not the other way round. Their answer lies in the fact that democratisation in one country tends to make it likelier in a
nearby country, too. Tunisia’s revolution in 2010 was partly responsible for Egypt’s, for example, which soon followed.
Crucially, however, Tunisian politics had little effect on Egypt’s growth rate. That, the authors say, means the
democratisation of nearby countries can be used as a proxy for the democratisation of the country itself. This approach
yields similar results: democracies fuel growth.
Not everyone will be convinced. Historians will protest that trying to compress the infinite variety of global politics into a
few variables is a hopeless task. Each democracy and autocracy operates in a different way, after all. Democracy
advocates may not even get that excited: few fling themselves into the cause of self-determination in order to boost GDP.
But freedom and growth make for a pretty unbeatable combination.
How to preserve a startup culture as a company grows by Adrienne Sanders | Jul 22, 2015 The intense atmosphere at startups can make conflicts difficult to resolve Buzzing about which new startups will prosper and which will flop is a favorite pastime in Silicon Valley. But a new company’s prospects aren’t based on just what the company creates, says Stanford professor Lindred Greer. They’re also based on the people creating it and, more important, how they treat one another. “Startup success is as much about managing the people as it is about creating the product,” says Greer, an organizational behavior professor at Stanford Graduate School of Business. Be Aware of Culture in Early Stage Startups The culture of early stage startups forms the backbone of the culture the company will have in later years. Therefore, paying attention early on to the type of culture you want to create is critical. One aspect of startup culture, Greer notes, is the emphasis the founders put on equality. While egalitarian cultures can motivate workers and encourage a free flow of ideas, they are often hard to maintain when companies scale and managers have to make hard decisions that go against the grain of the egalitarian ethos. “The first time someone has to be fired, the culture of equality may be shattered,” Greer says. In order to preserve this culture as they grow, startups must find ways early on to balance the need to motivate workers and give them a voice with competing organizational needs for structure and hierarchy, she says. To illustrate this point, Greer offers an analogy about the fateful day a child discovers that Santa Claus is not real. There is no changing that reality. But, says Greer, a parent has a choice between saying “Tough luck — Santa doesn’t exist” and “I’m sorry the man in the red suit doesn’t exist, but the holiday spirit does.” Likewise, a founder can say, “Tough luck. I can fire whomever I want.” Or, she can find a more respectful way to communicate this to the remaining employees and preserve the spirit of equality while maintaining her position at the top of the organizational hierarchy. Keep It Professional Resolving conflicts at startups can be more difficult than at other types of companies, Greer says, because founding members are often friends. Conflicts may be more personal and intense. Likewise, it may be difficult to keep communication and interpersonal dynamics focused solely on work-related matters. Greer recommends that startup teams designate a time and place in the office where people can talk through work issues in a professional frame of mind, “consciously choosing to set aside personal bonds.” Stay Humble Founders who maintain a humble management style and share credit for successes will empower others. “If you ask for voice and opinions, show that you actually do something with it,” Greer says. A founder who blindly pursues his vision without feedback from others can lead the company into disaster. Ice Cream Helps Leaders who actively value team contributions tend to make themselves easily accessible to their subordinates. For example, Greer interviewed one CEO who created a self-serve ice cream area at his company to promote more frequent and spontaneous communication between management and employees. Avoid Overlapping Skill Sets Entrepreneurs often form companies with friends or classmates with whom they share interests, skills and personality traits. But ignoring the need for true complementarity “is the number one mistake startups make, at least in the early

phases,” Greer says. Maintaining a high-performing startup is possible only when teams have complementary skill sets without much overlap. If everyone is, say, a finance expert, who will run operations? Provide Clarity Ideally, each member of the team brings his or her own unique and needed contribution to the success of the enterprise, but managers also need to provide guidance to teams. To avoid unnecessary confusion and competition, leaders should clearly delineate who is responsible for which tasks. Greer is testing this concept at the Atlanta Tech Village, a startup incubator in Georgia’s capital. Working with a group of several founding startup teams, she advised half to clearly identify each member’s unique specific role in a forthcoming task. Then she asked all the groups to build towers using marshmallows and sticks of spaghetti. The teams that received an intervention about establishing clear roles, she discovered, built more stable towers. She is now tracking the groups’ actual business performance over the next two months to see if it reflects the same results. Ask Outsiders for Help Company founders who surround themselves with a team of experts will help ensure there is a culture of respect for employees. Doing so sheds light on how companies such as Apple and Google have succeeded despite more autocratic-leaning founders. “Those people were counterbalanced by very strong peers at the management team level that complemented their personalities and helped them lead more effectively.”