What to Expect When the Unexpected Happens: Social Media Communications ... · What to Expect When...
16
What to Expect When the Unexpected Happens: Social Media Communications Across Crises Alexandra Olteanu Ecole Polytechnique Federale de Lausanne alexandra.olteanu@epfl.ch Sarah Vieweg Qatar Computing Research Institute [email protected] Carlos Castillo Qatar Computing Research Institute [email protected] ABSTRACT The use of social media to communicate timely information during crisis situations has become a common practice in re- cent years. In particular, the one-to-many nature of Twitter has created an opportunity for stakeholders to disseminate crisis-relevant messages, and to access vast amounts of in- formation they may not otherwise have. Our goal is to under- stand what affected populations, response agencies and other stakeholders can expect—and not expect—from these data in various types of disaster situations. Anecdotal evidence suggests that different types of crises elicit different reactions from Twitter users, but we have yet to see whether this is in fact the case. In this paper, we investigate several crises— including natural hazards and human-induced disasters—in a systematic manner and with a consistent methodology. This leads to insights about the prevalence of different information types and sources across a variety of crisis situations. Author Keywords Social Media; Emergency Management ACM Classification Keywords H.3.5 Online Information Systems; K.4.2 Social Issues General Terms Human Factors; Measurement INTRODUCTION When a disaster occurs, time is limited and safety is in ques- tion, so people need to act quickly with as much knowledge of the situation as possible. It is becoming more common for affected populations and other stakeholders to turn to Twitter to gather information about a crisis when decisions need to be made, and action taken. However, the millions of Twitter messages (“tweets”) broadcast at any given time can be over- whelming and confusing, and knowing what information to look for is often difficult. Permission to make digital or hard copies of all or part of this work for personal or classroom use is granted without fee provided that copies are not made or distributed for profit or commercial advantage and that copies bear this notice and the full citation on the first page. Copyrights for components of this work owned by others than ACM must be honored. Abstracting with credit is permitted. To copy otherwise, or republish, to post on servers or to redistribute to lists, requires prior specific permission and/or a fee. Request permissions from [email protected]. CSCW ’15, March 14 - 18 2015, Vancouver, BC, Canada Copyright is held by the owner/author(s). Publication rights licensed to ACM. ACM 978-1-4503-2922-4/15/03$15.00 http://dx.doi.org/10.1145/2675133.2675242 One way to help those affected by a disaster to benefit from information on Twitter, is to provide an indication of what in- formation they can expect to find. The capacity for affected populations to know what types of information they are likely to see on Twitter when particular kinds of mass emergencies occur, can potentially help them be more efficient in their information-seeking and decision-making processes. To explore this idea, we collected tweets that were broadcast during 26 different crisis situations that took place in 2012 and 2013. For each crisis, we examine the types of informa- tion that were posted, and look at the sources of the informa- tion in each tweet. Our specific aim is to measure the preva- lence of different types of messages under different types of crisis situations. Our results suggest that some intrinsic characteristics of the crisis situations (e.g. being instantaneous or progressive) pro- duce consistent effects on the types of information broadcast on Twitter. The results are of interest to members of the pub- lic, emergency managers, and formal response agencies, who are increasingly trying to understand how to effectively use social media as part of their information gathering processes. Related Work We know that tweets sent during crisis situations may contain information that contributes to situational awareness [49], and though disaster situations exhibit common features across various events [47], previous research has found that infor- mation shared on Twitter varies substantially from one cri- sis to another [26, 33, 34]. Indeed, some variability across disasters is expected. For instance, data from the United Nations Office for the Coordination of Humanitarian Affairs (UN OCHA) shows that disasters in high-income countries cause significantly more economic damage, but affect fewer people and have fewer fatal casualties, compared to disasters in countries with low or middle incomes [1]. Comparative research is an established discipline in commu- nication studies [15], but to date, this method has not been extensively applied to the study of social media communica- tions during crises. There is little overlap in the crises exam- ined across research groups, and no attempt to date to apply the same methodology consistently to a large and diverse set of crises. The literature review by Fraustino et al. [17] indi- cates that research on social media during disasters “tends to examine one catastrophic event (...) and then imply that the findings are generalizable to other disasters.”
Transcript of What to Expect When the Unexpected Happens: Social Media Communications ... · What to Expect When...

What to Expect When the Unexpected Happens:Social Media Communications Across Crises
Alexandra OlteanuEcole Polytechnique Federale
Sarah ViewegQatar ComputingResearch Institute
Carlos CastilloQatar ComputingResearch [email protected]
ABSTRACTThe use of social media to communicate timely informationduring crisis situations has become a common practice in re-cent years. In particular, the one-to-many nature of Twitterhas created an opportunity for stakeholders to disseminatecrisis-relevant messages, and to access vast amounts of in-formation they may not otherwise have. Our goal is to under-stand what affected populations, response agencies and otherstakeholders can expect—and not expect—from these datain various types of disaster situations. Anecdotal evidencesuggests that different types of crises elicit different reactionsfrom Twitter users, but we have yet to see whether this is infact the case. In this paper, we investigate several crises—including natural hazards and human-induced disasters—in asystematic manner and with a consistent methodology. Thisleads to insights about the prevalence of different informationtypes and sources across a variety of crisis situations.
Author KeywordsSocial Media; Emergency Management
ACM Classification KeywordsH.3.5 Online Information Systems; K.4.2 Social Issues
General TermsHuman Factors; Measurement
INTRODUCTIONWhen a disaster occurs, time is limited and safety is in ques-tion, so people need to act quickly with as much knowledgeof the situation as possible. It is becoming more common foraffected populations and other stakeholders to turn to Twitterto gather information about a crisis when decisions need tobe made, and action taken. However, the millions of Twittermessages (“tweets”) broadcast at any given time can be over-whelming and confusing, and knowing what information tolook for is often difficult.
Permission to make digital or hard copies of all or part of this work forpersonal or classroom use is granted without fee provided that copiesare not made or distributed for profit or commercial advantage and thatcopies bear this notice and the full citation on the first page. Copyrightsfor components of this work owned by others than ACM must be honored.Abstracting with credit is permitted. To copy otherwise, or republish, topost on servers or to redistribute to lists, requires prior specific permissionand/or a fee. Request permissions from [email protected].
CSCW ’15, March 14 - 18 2015, Vancouver, BC, CanadaCopyright is held by the owner/author(s). Publication rights licensed to ACM.ACM 978-1-4503-2922-4/15/03$15.00http://dx.doi.org/10.1145/2675133.2675242
One way to help those affected by a disaster to benefit frominformation on Twitter, is to provide an indication of what in-formation they can expect to find. The capacity for affectedpopulations to know what types of information they are likelyto see on Twitter when particular kinds of mass emergenciesoccur, can potentially help them be more efficient in theirinformation-seeking and decision-making processes.
To explore this idea, we collected tweets that were broadcastduring 26 different crisis situations that took place in 2012and 2013. For each crisis, we examine the types of informa-tion that were posted, and look at the sources of the informa-tion in each tweet. Our specific aim is to measure the preva-lence of different types of messages under different types ofcrisis situations.
Our results suggest that some intrinsic characteristics of thecrisis situations (e.g. being instantaneous or progressive) pro-duce consistent effects on the types of information broadcaston Twitter. The results are of interest to members of the pub-lic, emergency managers, and formal response agencies, whoare increasingly trying to understand how to effectively usesocial media as part of their information gathering processes.
Related WorkWe know that tweets sent during crisis situations may containinformation that contributes to situational awareness [49], andthough disaster situations exhibit common features acrossvarious events [47], previous research has found that infor-mation shared on Twitter varies substantially from one cri-sis to another [26, 33, 34]. Indeed, some variability acrossdisasters is expected. For instance, data from the UnitedNations Office for the Coordination of Humanitarian Affairs(UN OCHA) shows that disasters in high-income countriescause significantly more economic damage, but affect fewerpeople and have fewer fatal casualties, compared to disastersin countries with low or middle incomes [1].
Comparative research is an established discipline in commu-nication studies [15], but to date, this method has not beenextensively applied to the study of social media communica-tions during crises. There is little overlap in the crises exam-ined across research groups, and no attempt to date to applythe same methodology consistently to a large and diverse setof crises. The literature review by Fraustino et al. [17] indi-cates that research on social media during disasters “tends toexamine one catastrophic event (...) and then imply that thefindings are generalizable to other disasters.”

In our attempt to fill this gap, we examine tweets that werebroadcast during a broad range of different crisis situations,and systematically apply the same methodology to the anal-ysis of each event. This methodology is based on previouswork that categorizes tweets by type (including [2, 7, 24, 34,50]) or by source (including [12, 14, 27, 29, 30, 44]).
ContributionsFor decision-makers and other stakeholders to be as preparedas possible, knowing what information they are likely to gainfrom social media can save time and help them decide whereto direct their often limited resources. When stakeholdersknow what types of content to expect (e.g., advice, sup-port, damage reports), and which information sources willbe prevalent (e.g. news organizations, eyewitnesses, NGOs),they do not have to sift through masses of social media posts;instead, they have a reasonable expectation of what they willfind, and can then make more informed decisions regardingtheir situational assessment process.
Based on our goal to ease the information overload wroughtby social media during crisis situations, the question we ad-dress here is: what are the similarities and differences inTwitter communications that take place during different crisisevents, according to specific characteristics of such events?To answer this question, we study the prevalence of differentinformation types and sources found on Twitter during dif-ferent types of crises, and correlate this with some of theirintrinsic characteristics.
Methodology OverviewTo perform this study, we employ the following methodology:
Step 1: We determine a set of dimensions that allow us tocharacterize different crises: hazard type, temporal devel-opment, and geographic spread.
Step 2: We determine a set of dimensions to characterize so-cial media messages during a crisis: informativeness, in-formation type, and source.
Step 3: We collect Twitter data corresponding to 26 crisesthat took place in 2012 and 2013, using retrospective sam-pling on the 1% public data stream which is publicly avail-able in the Internet Archive.1
Step 4: We create, run, and evaluate a series of crowdsourc-ing tasks to perform content annotation on approximately1,000 messages from each of the crises.
Step 5: We perform a statistical analysis of the dependenciesbetween types of crises and types of messages.
STEP 1: DETERMINING CRISIS DIMENSIONSGiven that our research question connects two domains: dis-aster studies, and social media content analysis, the frame-work we use is composed of two parts. We categorize thecrises according to a series of dimensions that characterizethem. Next, we annotate tweets from each crisis according todimensions that characterize different types of content.
When considering how to organize our data and approach ourannotation process, we turned to dimensions used in the soci-ology of disaster research (p. 50 in [36]). For each crisis, we1https://archive.org/details/twitterstream
consider hazard type (natural vs. human-induced), sub-type(e.g. meteorological, hydrological, etc.), temporal develop-ment (instantaneous vs. progressive), and geographic spread(focalized vs. diffused).
C1. Hazard typeHazard type is the first dimension we examine that may im-pact the types of contents disseminated through social media.The specific hazard types we consider are based on two tax-onomies used in Europe2 and the US,3 as well as the tradi-tional hazard categories listed by Fischer [16].
The first distinction is between those that are natural andthose that are human-induced. Sub-categories and examplesof each one are listed in Table 1. All sub-categories are cov-ered by crises analyzed in this study, with the exception of the“biological” category, which we were unable to sufficientlyaccount for regarding Twitter communications.
Table 1. Hazard categories and sub-categories.Category Sub-category Examples
Natural
• Meteorological• Hydrological• Geophysical• Climatological• Biological (N/A)
• tornado, hurricane• flood, landslide• earthquake, volcano• wildfire, heat/cold wave• epidemic, infestation
Human-Induced
• Intentional• Accidental
• shooting, bombing• derailment, building collapse
C2. Temporal DevelopmentWhen considering the temporal development of crises, weclassify them as instantaneous (e.g. an earthquake or a shoot-ing), or progressive (e.g. a hurricane or a heat wave) [3, 8, 35].As we qualitatively coded the temporal aspects of the crises,we labeled a disaster instantaneous if it “does not allow pre-disaster mobilization of workers or pre-impact evacuation ofthose in danger,” and progressive if it is “preceded by a warn-ing period” [3].
C3. Geographic SpreadWe look at the geographic spread of a crisis, and specify ifit is focalized (such as a train accident) or diffused (such asa large earthquake) [3, 38]. A focalized crisis affects andmobilizes response in a small area, while a diffused disas-ter impacts a large geographic area and/or mobilizes nationalor international response.
We recognize that this list of crisis dimensions is not exhaus-tive. In particular, linguistic and cultural differences havebeen shown to influence message content, and the adoption ofcertain conventions in Twitter, e.g. [20, 37]. We also recog-nize that these dimensions are not independent from one an-other. For instance, with the exception of war and large-scalenuclear disasters, most human-induced crises tend to be fo-calized, while meteorological hazards are often diffused. Ad-ditionally, the interplay between these dimensions may yieldcomplex results in terms of the types of information included2http://www.emdat.be/classification3http://www.ready.gov/be-informed

in Twitter messages, and the source of that information. Forexample, hazard type combined with geographic spread canaffect public access to firsthand information about a crisis.
STEP 2: DETERMINING CONTENT DIMENSIONSWhen assessing the tweets that were broadcast during eachdisaster event, we turned to previous research on informa-tion broadcast via social media in disaster. We constructeda coarse-grained categorization that covers the categories ofinformation that are highly represented in previous work (in-cluding [7, 24, 29, 49, 50] among others). Due to the largenumber of events and messages we consider, and the limi-tations of using crowdsourcing workers to perform the an-notation (as opposed to experts, who would be prohibitivelyexpensive at this scale), we formulated basic information cat-egories broad enough to be applicable to different crisis sit-uations. The resulting categories and the previous researchrepresented by them, are shown in Table 2: informativeness,information type, and source.
M1. InformativenessWe recognize that informativeness is a subjective concept, asit depends on the person who is asking for or receiving infor-mation. In addition, as with any communication, the contextin which the information exchange is taking place is criticalto understanding its implications. We capture this dimensionfollowing [50], by checking whether the tweet contributes tobetter understanding the situation on the ground. Accord-ingly, we use the following annotation options:
A. Related to the crisis and informative: if it contains usefulinformation that helps understand the crisis situation.
B. Related to the crisis, but not informative: if it refers to thecrisis, but does not contain useful information that helpsunderstand the situation.
C. Not related to the crisis.
M2. Information TypeAs we closely analyzed a set of samples of messages commu-nicated via Twitter during disasters, we found that the typeof content often varies substantially across hazards; a findingcorroborated by many other studies [2, 7, 24, 34, 50].
To identify a set of broad categories whose incidence (thoughwith different degrees of occurrence) is to a large extent in-dependent of event specificities, and to obtain a manageablecoding scheme, we first identified the list of information cat-egories used in related work studying various types of events(e.g., wildfires [50], drug wars [29], floods [6, 45], earth-quake [39], nuclear power plant [46], to name a few). Then,we proceeded with merging in a bottom-up fashion those cat-egories that overlap and/or are related. Finally, we gatheredthe remaining categories, typically accounting for informa-tion specific to each crisis or type of crisis (e.g., flood level,weather, wind, visibility [50]), into a “catchall” category—other useful information. The exact matching of informationtypes present in the related work to each of the categoriesused in this paper is depicted in Table 2. The informationtypes that we use are:
Table 2. Typologies of content used in this paper, and their relationshipto some aspects mentioned in previous work
This work Related categories from previous work
Informativeness:Informative informative (direct or indirect) [24]; curating or producing
content [29]; contribute to situational awareness [50]; sit-uational information [40]; contextual information to betterunderstand the situation [42]
Not inform. trolling [29]; humor [28]; off-topic [34, 39, 45]; ru-mor [22]; humor or irrelevant/spam [42]
Information type:Affectedindividuals
medical emergency, people trapped, person news [7]; ca-sualties (and damage), people missing, found or seen [24];reports about self [2]; fatality, injury, missing [49]; look-ing for missing people [39];
Infrastruc.& utilities
(casualties and) damage [24]; reports about environ-ment [2]; built environment [49]; damaged, closuresand services [22]; collapsed structure, water short-age/sanitation, hospital/clinic services [7]; road closuresand traffic conditions [48];
Donations& volunteer.
donations of money, goods or services [24]; donations orvolunteering [34]; requesting help, proposing relief, re-lief coordination [39]; donations, relief, resources [22];help and fundraising [6, 40]; shelter needed, food short-age/distribution [7]; volunteer information [50]; help re-quests [2]
Caution& advice
caution, advice [24]; warnings [2]; advice, warnings,preparation [34]; warning, advice, caution, prepara-tion [50]; tips [28]; safety, preparation, status, proto-col [22]; preparedness [51]; advice [6]; advice and instruc-tions [40]; predicting or forecasting, instructions to handlecertain situations [42];
Sympathy& emo. sup.
concerns and condolences [2]; gratitude, prayers [34];emotion-related [39]; support [22]; thanks and gratitude,support [6, 40];
Otheruseful info.
fire line/emergency location, flood level, weather, wind,visibility [50]; smoke, ash [48]; adjunctive and meta-discussions [40]; other informative messages [34]; in-formation verification, explanation of particular prob-lems [42];
Source:Eyewitness citizen reporters, members of the community [29]; eyewit-
nesses [6, 14, 27, 34]; local, peripheral, personally con-nected [45]; local individuals [43, 50]; local perspective,on the ground reports [46]; direct experience (personalnarrative and eyewitness reports) [40]; direct observation,direct impact, relayed observation [48];
Government (news organizations and) authorities [29]; govern-ment/administration [34]; police and fire services [22]; po-lice [13]; government [6]; public institutions [46]; publicservice agencies, flood specific agencies [45];
NGOs non-profit organizations [12, 46]; non-governmental orga-nization [34]; faith-based organizations [45];
Business commercial organizations [12]; enterprises [46]; for-profitcorporation [34];
Media news organizations (and authorities), blogs [29]; journal-ists, media, and bloggers [12, 14]; news organization [34];professional news reports [28]; media [6]; traditional me-dia (print, television, radio), alternative media, freelancejournalist [46]; blogs, news-crawler bots, local, nationaland alternative media [45]; media sharing (news mediaupdates, multimedia) [40];
Outsiders sympathizers [27]; distant witness [9]; remote crowd [43];non-locals [45, 46].

A. Affected individuals: deaths, injuries, missing, found, ordisplaced people, and/or personal updates.
B. Infrastructure and utilities: buildings, roads, utili-ties/services that are damaged, interrupted, restored or op-erational.
C. Donations and volunteering: needs, requests, or offers ofmoney, blood, shelter, supplies, and/or services by volun-teers or professionals.
D. Caution and advice: warnings issued or lifted, guidanceand tips.
E. Sympathy and emotional support: thoughts, prayers, grat-itude, sadness, etc.
F. Other useful information not covered by any of the abovecategories.
M3. SourceWhen people turn to Twitter to learn about a disaster, theyare often concerned with the source of information. Hence,we focused on content source, which may be different fromtweet author; e.g. if the Twitter account of a large media orga-nization quotes a government official, the “source” is the gov-ernment official. Sources are categorized as: primary sources(eyewitness accounts) or secondary or tertiary sources (typ-ically mainstream media or others engaged in journalisticacts) [12, 14, 27, 29, 30, 44].
For the former, we chose to broaden the definition of an eye-witness account as originating from “a person who has seensomething happen and can give a first-hand description ofit”4 to also accommodate those cases when the account doesnot include a direct observation, yet the user is personallyimpacted by the event, or it “is about a direct observationor impact of a person who is not the micro-blogger” [48]—typically relaying the observations of friends or family.
In the latter case, we can find several organizations who of-ten aggregate information about a crisis, including business,governmental, and non-governmental sources:
A. Eyewitness: information originating from eyewitnesses ofthe event or of response/recovery operations, or from theirfamily, friends, neighbors, etc.
B. Government: information originating from the local ornational administration.
C. Non-governmental organization: information originatingfrom NGOs.
D. Business: information originating from for-profit business(except news organizations).
E. Traditional and/or Internet media: information comingfrom sources such as TV, radio, news organizations, webblogs, or journalists.
F. Outsiders: information originating from individuals thatare not personally involved/affected by the event.
STEP 3: DATA COLLECTION
List of EventsTable 3 shows our datasets, which are available for researchpurposes at http://crisislex.org/. They correspond to a set of
4http://www.oxforddictionaries.com/definition/english/eyewitness
26 events during 2012 and 2013, and which spawned signif-icant activity on Twitter. Table 3 also includes crisis dimen-sions of hazard type, development, and spread (we considerthe Singapore haze to be partially human-induced due to in-tentional fires to clear land). We note that in our dataset, allhuman-induced crises are focalized and instantaneous, whileall natural hazards are diffused, but may be instantaneous orprogressive.
To obtain our list of events, we started with a set of disas-ters compiled mainly from Wikipedia.5 We then filtered it bychoosing events that had at least 100,000 tweets associatedwith them—which is reflected by at least 1,000 tweets in the1% public data stream we used.
Floods are the most frequent type of natural hazard in ourdata, and also the natural hazard that affects the most peoplein the world. According to data from the United Nations forthe 2002–2011 period, an average of 116 million people wereaffected by a flood every year, followed by 72 million peoplea year affected by drought, 40 million by storms, 9 million byextreme temperatures, and 8 million by earthquakes [1].
Data SamplingOur data collection method is shaped by limitations to dataaccess through Twitter, and is based on first collecting abase data sample and then retrospectively sub-sampling it.The base data sample was obtained by constantly monitoringTwitter’s public stream via Twitter’s Sample API, which con-sists of a sample of approximately 1% of all tweets6 and it isaccessible via Internet Archive7, allowing full reproducibilityof this work. In the 2012-2013 period, this collection containson average about 132 million tweets (amounting to 38 GB ofcompressed data) per month. The quality of Twitter data sam-ples acquired via the publicly available APIs that offer lim-ited access to the full Twitter stream has been studied exten-sively, to understand the nature of the biases of such data sam-ples [18, 19, 25, 31, 32]. Yet, while [32] have shown biaseswith respect to hashtag and topic prevalence in the StreamingAPI (which we do not use in this study), [31] shows that thedata obtained via the Sample API closely resemble the ran-dom samples over the full Twitter stream, which corroboratesthe specifications of this API. Additionally, given the dailyvolume of tweets “the 1% endpoint would provide a represen-tative and high resolution sample with a maximum margin oferror of 0.06 at a confidence level of 99%, making the studyof even relatively small subpopulations within that sample arealistic option” [18].
The sub-samples are obtained by running keyword searchesover the base data—keyword searches that mimic the wayin which Twitter does keyword tracking to obtain a sampleof the data that one can obtain in real time.8 An advantageof this retrospective sampling method is that one can capturethe entire period of the event, which is not the case for other
5From the list of significant events per month, e.g. for January 2013we consulted http://en.wikipedia.org/wiki/January_20136https://dev.twitter.com/docs/api/1.1/get/statuses/sample7https://archive.org/details/twitterstream8https://dev.twitter.com/docs/streaming-apis/parameters#track

Table 3. List of crises studied, sorted by date, including the duration of the collection period for each dataset, the number of tweets collected, and severaldimensions of the crises
Hazard Hazard HazardYear Country Crisis Name Days Tweets category subcategory type Development Spread
2012 Italy Italy earthquakes 32 7.4K Natural Geophysical Earthquake Instantaneous Diffused2012 US Colorado wildfires 31 4.2K Natural Climatological Wildfire Progressive Diffused2012 Philipinnes Philipinnes floods 13 3.0K Natural Hydrological Floods Progressive Diffused2012 Venezuela Venezuela refinery explosion 12 2.7K Human-induced Accidental Explosion Instantaneous Focalized2012 Costa Rica Costa Rica earthquake 13 2.2K Natural Geophysical Earthquake Instantaneous Diffused2012 Guatemala Guatemala earthquake 20 3.3K Natural Geophysical Earthquake Instantaneous Diffused2012 Phillipines Typhoon Pablo 21 1.9K Natural Meteorological Typhoon Progressive Diffused2013 Brazil Brazil nightclub fire 16 4.8K Human-induced Accidental Fire Instantaneous Focalized2013 Australia Queensland floods 19 1.2K Natural Hydrological Floods Progressive Diffused2013 Russia Russian meteor 19 8.4K Natural Others Meteorite Instantaneous Focalized2013 US Boston bombings 60 157.5K Human-induced Intentional Bombings Instantaneous Focalized2013 Bangladesh Savar building collapse 36 4.1K Human-induced Accidental Collapse Instantaneous Focalized2013 US West Texas explosion 29 14.5K Human-induced Accidental Explosion Instantaneous Focalized2013 Canada Alberta floods 25 5.9K Natural Hydrological Floods Progressive Diffused2013 Singapore Singapore haze 19 3.6K Mixed Others Haze Progressive Diffused2013 Canada Lac-Megantic train crash 14 2.3K Human-induced Accidental Derailment Instantaneous Focalized2013 Spain Spain train crash 15 3.7K Human-induced Accidental Derailment Instantaneous Focalized2013 Phillipines Manila floods 11 2.0K Natural Hydrological Floods Progressive Diffused2013 US Colorado floods 21 1.8K Natural Hydrological Floods Progressive Diffused2013 Australia Australia wildfires 21 2.0K Natural Climatological Wildfire Progressive Diffused2013 Phillipines Bohol earthquake 12 2.2K Natural Geophysical Earthquake Instantaneous Diffused2013 UK Glasgow helicopter crash 30 2.6K Human-induced Accidental Crash Instantaneous Focalized2013 US LA Airport shootings 12 2.7K Human-induced Intentional Shootings Instantaneous Focalized2013 US NYC train crash 8 1.1K Human-induced Accidental Derailment Instantaneous Focalized2013 Italy Sardinia floods 13 1.1K Natural Hydrological Floods Progressive Diffused2013 Phillipines Typhoon Yolanda 58 39.0K Natural Meteorological Typhoon Progressive Diffused
collections built during the disasters, which generally lack thefirst minutes or hours of the event.
Keywords were selected following standard practices com-monly used for this type of data collection [6, 23, 34, 46],and typically include hashtags or terms that pair the canon-ical name of the disaster with proper names of the affectedlocations (e.g., Manila floods, #newyork derailment), theproper names of the meteorological phenomena (e.g., Hurri-cane Sandy), or, at times, hashtags promoted by governments,response agencies, or news media. Previous work has shownthat this method produces a sample of messages whose distri-bution of information categories closely resembles the sam-pling by other methods e.g. geofencing, which samples alltweets from users in the affected area [34].
To identify the keywords/hashtags used during each event,one of the authors used a search engine to lookup for “Hash-tags 〈Event Name〉.” The search results often included newsarticles discussing the social media use during the searchedevent,9 resources from NGOs using social media for cri-sis management,10 Internet media platforms,11 governmen-tal resources on social media use12 or research papers [6,34]. Using these resources, we built an initial list of hash-tags/keywords, which we further validated and iteratively im-
9http://mashable.com/2012/06/29/colorado-wildfire-social-media/,http://www.techinasia.com/singapore-haze-infographic/ and others.
10http://wiki.crisiscommons.eu/wiki/Crises, http://crisiswiki.org/11http://twitchy.com/2014/07/07/earthquake-hits-southern-mexico-and-guatemala-fatalities-damage-reported-pics/,https://storify.com/ABC13Houston/plant-explosion-in-west-texas
12http://www.gov.ph/2013/11/09/online-efforts-for-typhoon-yolanda/
proved by manually searching for them on Twitter. In thosecases in which the hashtag/keyword had been used for otherpurposes, we also looked for the combination of the hash-tag/keyword, and the event name. When other keywordsfrequently appear with those already on our list, we alsosearched for them in Twitter. If there were at least few in-stances in which they appeared in relevant tweets without theother keywords, we added them to the list. The size of theresulting keywords lists vary, yet [34] suggests that keywordslists of various sizes retrieve collections which exhibit com-parable representativeness with respect to a reference sample.
For the instantaneous hazards we start the collection fromthe moment when the event happen, while for the progressivehazards we start from the moment the hazard was detected(e.g., when a storm formed for a hurricane). The volume oftweets in each collection decreases after onset, but we con-tinue collecting data until that volume stabilizes to a low value(specifically, when the standard deviation of the daily numberof tweets becomes less than 5).
As a post-processing step, we remove very short tweets (i.e.those made up of 3 tokens or less), as they are in general hardto classify and rarely contain any useful information. We donot remove near-duplicates or re-tweets (RTs) because we areinterested in the extent to which people repeat and pass alongexisting messages.
STEP 4: CROWDSOURCED DATA ANNOTATIONWe employed crowdsource workers to perform manual anno-tation of our datasets in April and May 2014.13 The workers
13We employed workers through the crowdsourcing platform Crowd-Flower: http://crowdflower.com/

were provided with detailed instructions and examples of cor-rectly labeled tweets, so they could successfully complete theannotation task.
Task DescriptionBelow are the instructions given during the annotation phaseto crowdsource workers. “You,” in the task description refersto the crowdsourcing worker. The underlined parts, and theexamples, changed for each crisis.
M1. Informativeness. The instructions used for this anno-tation task are shown below, and include examples for eachclass.
Categorize tweets posted during the 2013 Colorado floods. Please readthem carefully, following links as necessary, and categorize them as:A. Related to the floods and informative: if it contains useful informa-tion that helps you understand the situation:– “RT @NWSBoulder Significant flooding at the Justice Center in#boulderflood”– “Flash floods wash away homes, kill at least one near Boulder via@NBCnews”B. Related to the floods, but not informative: if it refers to the crisis,but does not contain useful information that helps you understand thesituation:– “Pray for Boulder, Colorado #boulderflood”C. Not related to the floods:– “#COstorm you are a funny guy lol”D. Not applicable; too short; not readable; or other issues.
M2. Information Type. Instructions and examples:Categorize tweets posted during the 2012 Colorado wildfires. Pleaseread them carefully, following links as necessary, and categorize as:A. Affected individuals: information about deaths, injuries, missing,trapped, found or displaced people, including personal updates aboutoneself, family, or others.– “Up to 100,000 people face evacuation in Colorado”B. Infrastructure and utilities: information about buildings, roads, util-ities/services that are damaged, interrupted, restored or operational.– “Officials working the #HighParkFire confirmed that several roadsare closed”C. Donations and volunteering: information about needs, requests,queries or offers of money, blood, shelter, supplies (e.g., food, water,clothing, medical supplies) and/or services by volunteers or profes-sionals.– “#Offer Storage Space http://t.co/... #COwildfire”D. Caution and advice: information about warnings issued or lifted,guidance and tips.– Wildfire warnings issued for six counties Sunday - http://t.co/...”E. Sympathy and emotional support: thoughts, prayers, gratitude, sad-ness, etc.– “Pray for Boulder #COwildfire”F. Other useful information NOT covered by any of the above cate-gories.– “To track fire activity in CO, check this site @inciweb Colorado In-cidents http://t.co/...”G. Not applicable; not readable;not related to the crisis.
M3. Source. Instructions and examples:Categorize tweets posted during the 2013 Queensland floods(Australia). Please read them carefully, following links as necessary,and indicate the most likely source of information for them as:A. Eyewitness: if the information originates from eyewitnesses to theevent or to response/recovery operations, or from their family, friends,neighbors, etc. :– “Just found out my mum is trapped at home, no water, no power,tree’s down across roads out of her property near glasshouse mtns”– “Outside sounds like it is going to shatter my bedroom windows anysec now #bigwet #qld”
B. Government: if the information originates from national, regionalor local government agencies, police, hospitals, and/or military.– “PRT @theqldpremier: UPDATE SCHOOL CLOSURES: Anupdated school closures list is available now at http://t.co/...”C. Non-government: if the information originates from non-governmental and not for profit organizations such as RedCross, UN,UNICEF, etc.– “RT @RedCrossAU: Everyone affected by #qldfloods, let peopleknow you’re safe: http://t.co/...”D. Businesses: if the information originates from for-profit businessor corporations such as Starbucks, Walmart, etc.– “RT @starbucks: With many partners impacted by OLD floods,consider making (or increasing) donations”E. Traditional and/or Internet news or blogs: if the informationoriginates from television channels, radio channels, newspapers,websites or blogs such as CNN, KODA, New York Times, etc.– “RT @ABCNews24: #QLDfloods watch: Authorities are preparingfor tornadoes in southeast Queensland.”F. Outsiders: if the information originates from individuals that haveNO acquaintances affected by the event, nor are they associate withany organization.– “RT @TheBushVerandah: Just heard a farmer had to shoot approx100 sows at mundubbera ... In preference to them drowning”G. Not applicable; not readable; not related to the crisis.
Task CharacteristicsFor all annotation tasks, we provide examples both in Englishand the language most commonly used to communicate aboutthe event (if there was a common language used other thanEnglish.) Regarding worker selection, the platform we usedfor crowdsourcing allows us to select workers by country (butnot at a sub-country level), so we specified that workers mustbe from the country where the event took place. In few caseswhen there were not enough workers to perform the task, wealso included workers from neighboring countries having thesame official language. We selected workers in this way to en-sure that they understand the tweets posted by individuals lo-cal to the event, and that they would be more likely able to un-derstand dialects, references to regional and/or local places,and overall be versed in the culture of the area in which theevent took place. Additionally, following standard guidelinesfrom this crowdsourcing platform, 20 to 30 tweets per crisisand task were classified by the authors of this paper. We con-sider all workers whose assessments differ significantly fromours (less than 70% of agreement) as untrusted.
Workers were presented with the tweet text, including anylinks (which they were invited to follow), and then asked tochoose a single category that best matched the content of thetweet. To avoid potential ethical concerns on behalf of Twit-ter users who are likely unaware that their tweets are beingcollected and analyzed, workers did not have access to theauthor username, nor the time at which the tweet was sent.In addition, we avoid possible privacy violations by not dis-playing the username nor the profile picture of persons af-fected by a given disaster. This practice follows customaryprocedures used for using crowdsourced annotation of textmessages for both information type [4, 10, 24, 34] and infor-mation source [14, 34].
Trusted workers took from 10 to 12 seconds to label eachtweet (in terms of interquartile mean, which is the figure re-ported by the crowdsourcing platform). We collect labels
from at least 3 different trusted workers per tweet and task,and determine the final label of the tweet by simple majority.
About 15-20 trusted workers participated in each classifica-tion step (i.e. a set of 1,000 tweets from a single event andwith a single question M1, M2, or M3), with the bulk of thework being done by about 10 of them in each case—with noworker labeling more than 300 items in a classification task,a limit set by us following recommendations from the crowd-sourcing provider. The total amount paid to the crowdsourc-ing platform for the 3 classification tasks was approximately$35 (USD) per event. Payments to specific individual work-ers depend on how many tasks they performed and on theiragreement with the test questions, following an internal pro-cedure of the crowdsourcing provider.
Our first classification task is to identify tweets which are re-lated to a crisis. A tweet may contain a crisis’ keywords butbe unrelated to it, as some keywords may be quite general,and refer to any number of topics other than the disaster sit-uation. In addition, unscrupulous spammers sometimes ex-ploit the popularity of a crisis hashtag to post promotionalcontent [5]. As a result, the first labeling phase (M1) also hasa data cleaning role. For each event we label a set of 1,000tweets selected uniformly at random. We imposed a mini-mum threshold of 900 crisis-related tweets per crisis, and inthe cases where it was necessary (9 out of 26 crises), we con-tinued labeling tweets until passing the threshold. Next, wekept only the tweets that were related to the crisis (indepen-dently of whether they were deemed informative or not), andclassified them with respect to information types (M2) andsources (M3).
Task EvaluationTweet classification is a subjective process, especially whenperformed at a large scale, and with a focus on tweet content.To evaluate to what extent subjectivity affects our results, weperformed the following experiment: Two authors indepen-dently labeled 200 tweets sampled uniformly at random fromall the crises. They classified tweets according to informa-tion types and sources, by looking at the content of the tweetsas displayed in the Twitter platform, including conversations(if any), and looking at links in the tweets, and user profileinformation from its authors. We also note that authors hadbackground information about each of the events.
We measure inter-assessor agreement with Cohen’s Kappa,resulting in κ = 0.80 for information type (95% confidenceinterval CI: [0.73, 0.87]) and κ = 0.73 for source (95% CI:[0.64, 0.81]). Customarily, values in this range indicate sub-stantial agreement.
Next, we take all tweets in which both authors agree andcompare their joint label with those provided by crowdsourceworkers. The results are κ = 0.81 (95% CI: [0.73, 0.88])for information type and κ = 0.72 for source (95% CI:[0.62, 0.83]). Again, these values reflect substantial agree-ment. The individual agreement of authors with workers(which includes cases in which the labels given by authorsdo not agree) is lower but still substantial (κ = 0.69 and
κ = 0.74 for information type, κ = 0.57 and κ = 0.63for source).
The conclusion is similar to that of previous work usingcrowdsourcing labeling (e.g. [14, 41]), crowdsource workerscollectively provide reliable labels for social media annota-tion tasks, at a volume that would be very costly to achieveby other means (in our case, 26×1, 000×3 = 78, 000 labels).
This experiment also allows us to evaluate the biases ofcrowdsourcing labeling. For information type, in 15% of thecases the crowdsourced label does not correspond to the onegiven by the authors (among the authors this discrepancy is16%). The most common error of crowdsourcing workersis labeling “Caution and Advice” messages as either “Dona-tions and Volunteering” or “Other Useful Information.” Forinformation source, in 17% of the cases the crowdsourced la-bel did not agree with the one of the authors (among authorsthis discrepancy is 18%). The most common error was label-ing “Eyewitness” as “Outsiders” or “Media.” This means thatin the analysis, we have to consider that “Caution and Ad-vice” and “Eyewitness” may be underrepresented categories,while the other categories we mentioned may be overrep-resented. The extent of the total underrepresentation/over-representation across all categories, however, is about 15%-17%, and more importantly, is not larger than the discrepancyamong the two authors who performed this evaluation.
STEP 5: DATA ANALYSISThe final step is to perform an analysis of the data annotatedby the crowdsourcing workers. We begin by presenting re-sults about the overall distribution of content types acrosscrises, which we connect to the crisis dimensions by miningassociation rules. Then we consider temporal aspects, as wellas the interplay between content dimensions.
Finally, we show that while substantial variability exists, sim-ilar crises tend to have a similar distribution of message types.Though we make no claims that these 26 crises are represen-tative of every event of every type we consider, we do notepatterns and consistencies in the proportion of different mes-sages, and present potential explanations about them, to serveas foundations for future explorations.
Content Types vs. Crisis DimensionsWe first present our results regarding relationships betweencrisis dimensions and the prevalence of categories of infor-mation found in tweets.
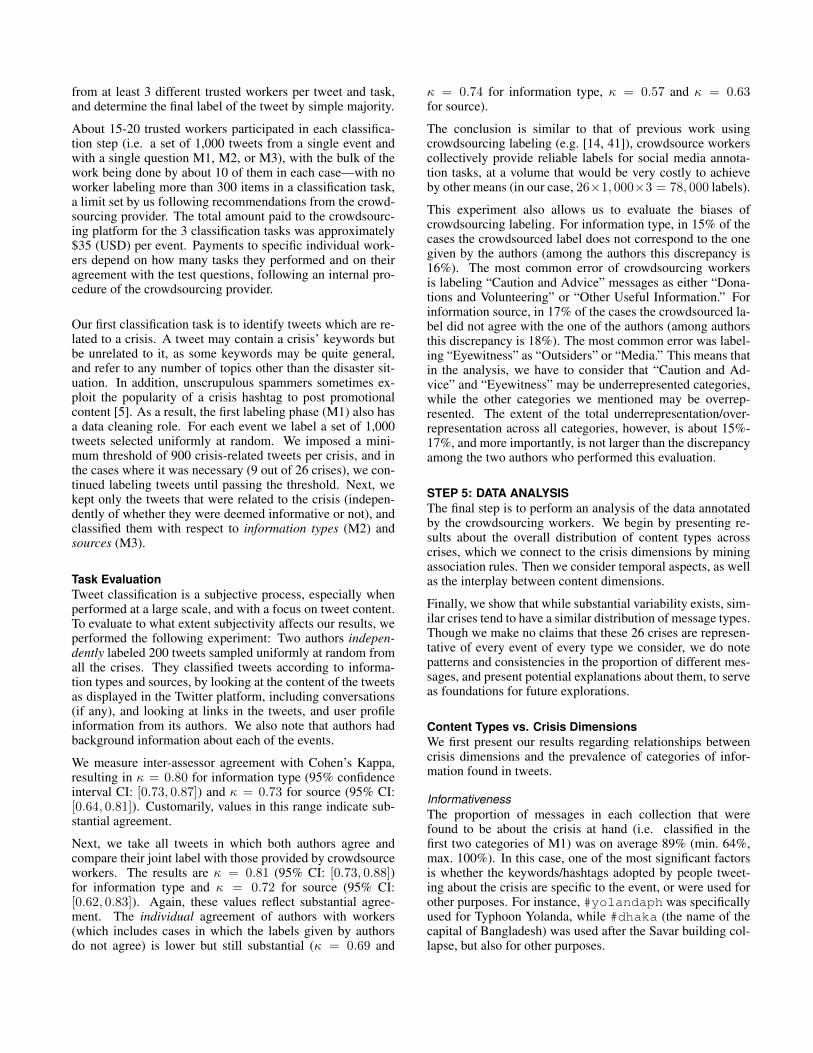
InformativenessThe proportion of messages in each collection that werefound to be about the crisis at hand (i.e. classified in thefirst two categories of M1) was on average 89% (min. 64%,max. 100%). In this case, one of the most significant factorsis whether the keywords/hashtags adopted by people tweet-ing about the crisis are specific to the event, or were used forother purposes. For instance, #yolandaph was specificallyused for Typhoon Yolanda, while #dhaka (the name of thecapital of Bangladesh) was used after the Savar building col-lapse, but also for other purposes.
Costa Rica earthquake’12
Manila floods’13
Singapore haze’13
Queensland floods’13
Typhoon Pablo’12
Australia bushfire’13
Italy earthquakes’12
Sardinia floods’13
Philipinnes floods’12
Alberta floods’13
Typhoon Yolanda’13
Colorado floods’13
Guatemala earthquake’12
Colorado wildfires’12
Bohol earthquake’13
NY train crash’13
Boston bombings’13
LA airport shootings’13
West Texas explosion’13
Russia meteor’13
Savar building collapse’13
Lac Megantic train crash’13
Venezuela refinery’12
Glasgow helicopter crash’13
Spain train crash’13
Brazil nightclub fire’13
0
10
20
30
40
50
60
70
80
90
100Caution & AdviceAffected Ind.Infrast. & UtilitiesDonat. & Volun.SympathyOther Useful Info.
(a) Distribution of information types, sorted by descending proportion of caution and advice tweets.
Singapore haze’13
Philipinnes floods’12
Alberta floods’13
Manila floods’13
Queensland floods’13
Typhoon Pablo’12
Italy earthquakes’12
Australia bushfire’13
Colorado floods’13
Colorado wildfires’12
Bohol earthquake’13
Costa Rica earthquake’12
LA airport shootings’13
Venezuela refinery’12
West Texas explosion’13
Sardinia floods’13
Spain train crash’13
Guatemala earthquake’12
Brazil nightclub fire’13
Boston bombings’13
Glasgow helicopter crash’13
Russia meteor’13
Lac Megantic train crash’13
Typhoon Yolanda’13
Savar building collapse’13
NY train crash’13
0
10
20
30
40
50
60
70
80
90
100EyewitnessGovernmentNGOsBusinessMediaOutsiders
(b) Distribution of information sources, sorted by descending proportion of eyewitness tweets.
Figure 1. Distributions of information types and sources (best seen in color)
Among these messages, the proportion of informative mes-sages (i.e. those in the first category of M1) was on aver-age 69% (min. 44%, max. 92%). Most of the messages con-sidered “not informative” contained expressions of sympathyand emotional support (e.g. “thoughts and prayers”).
Information typesFigure 1(a) shows the distribution of information types foundin the tweets related to each crisis. Below, we sort the cate-gories in decreasing order of average prevalence, noting the(wide) range on the proportion of each type.
• Other useful information: 32% on average (min. 7%,max. 59%). This “catchall” category is the largest amongthe information types. An analyst interested exclusively inthe remaining categories can skip these messages on theinitial pass of analysis. We note that the events in whichthis category was the least prevalent (i.e., the other cate-gories accounted for more than 80% of the messages) wereall diffused. While we do not claim that all, or even most,diffused events will have fewer-than-average amounts of“other useful information" tweets, it is potentially useful toknow that this type of tweet is not prevalent in the diffusedevents we studied.
The information captured by the “other useful information”category varies significantly across events. For instance, inthe Boston bombings and LA Airport shootings in 2013,there are updates about the investigation and suspects; inthe West Texas explosion and the Spain train crash, we find
details about the accidents and the follow-up inquiry; inearthquakes, we find seismological details.
• Sympathy and emotional support: 20% on average(min. 3%, max. 52%). Tweets that express sympathy arepresent in all the events we examined. The 4 crises inwhich the messages in this category were more prevalent(above 40%) were all instantaneous disasters. Again, wemake no hard-and-fast claims about all instantaneous dis-asters, but this finding leads us to conjecture that peopleare more likely to offer sympathy when events are not pre-dicted, take people by surprise, and may cause additionaldistress due to their unforeseen occurrence.
• Affected individuals: 20% on average (min. 5%,max. 57%). The 5 crises with the largest proportion ofthis type of information (28%–57%) were human-induced,focalized, and instantaneous. These 5 events can also beviewed as particularly emotionally shocking. They resultedin casualties, but a small enough number of casualties togenerate many reports regarding specific individuals wholost their lives or suffered injuries.
• Donations and volunteering: 10% on average (min. 0%,max. 44%). The number of tweets describing needs oroffers of goods and services in each event varies greatly;some events have no mention of them, while for others,this is one of the largest information categories. In our data,tweets about donations and volunteering were more preva-lent in Typhoon Yolanda in 2013 (44%) and in the floodsin Sardinia, Colorado, Alberta, and Manila in 2013, and in

the Philippines in 2012 (16%–38%). In contrast, they were10% or less for all the human-induced crises we analyzed.
• Caution and advice: 10% on average (min. 0%,max. 34%). In instantaneous crises, there is unsurpris-ingly little information on this type (0%–8%), as theseevents are often not predicted and only post-impact ad-vice can be present. The only exceptions in our data arethe Italy earthquakes in 2012 (17%) — in which the col-lection covers two earthquakes plus a number of signif-icant aftershocks which happen over an interval of lessthan 10 days, and Costa Rica earthquake in 2012 (34%) —when tsunami alerts were issued across Central Americaand parts of South America including even distant coun-tries like Chile. Apart from these two events, the eventswith the most tweets that include information about cau-tion and advice are caused by diffused natural hazards, andthe 5 with the highest fraction from this set are all pro-gressive (22%–31%). Further, baring the meteor that fellin Russia in 2013, we can see a clear separation betweenhuman-induced hazards and natural: all human inducedevents have less caution and advice tweets (0%–3%) thanall the events due to natural hazards (4%–31%). The me-teor was a rare event that felt like a bomb whose shockwave shattered windows and damaged thousands of build-ings, remaining undetected before its atmospheric entry.14
• Infrastructure and utilities: 7% on average (min. 0%,max. 22%). The crises where this type of information wasmore than 10% were the Queensland, Alberta, and Col-orado floods of 2013, and the Venezuela refinery explosionin 2012. In flood situations, it is common for electricityand water supplies to be cut, and in the case of the refineryexplosion, many living in the area were suddenly withoutelectricity due to the massive impact of the discharge.
SourcesIn Figure 1(b), we see the distribution of tweet sources, andwe observe the following:
• Traditional and/or Internet media: 42% on average(min. 18%, max. 77%). Regardless of the event, tradi-tional and Internet media have a large presence on Twitter,in many cases more than 30% of the tweets. The 6 criseswith the highest fraction of tweets coming from a mediasource (54%–76%) are instantaneous, which make “break-ing news” in the media.
• Outsiders: 38% on average (min. 3%, max. 65%). Depend-ing on the event, the number of “outsiders” can vary. Thiswas in general about 18% or more, with the exception ofthe Singapore haze in 2013 that had only 3% of tweets fromoutsiders. The Singapore haze was an event that stronglydisrupted the city, but did not result in life-threatening in-juries or deaths.
• Eyewitness accounts: 9% on average (min. 0%,max. 54%). In general, we find a larger proportion of eye-witness accounts during diffused disasters caused by natu-ral hazards. The 12 events with the highest percentage of
14http://en.wikipedia.org/wiki/Chelyabinsk_meteor
eyewitness accounts are all diffused (6%–54%) and the top6 are also progressive (13%–54%).
• Government: 5% on average (min. 1%, max. 13%). A rela-tively small fraction of tweets include information sourcedby government officials and agencies—only for two of thecrises we analyze this exceeds 10%. We surmise that this isbecause governments must verify information before theybroadcast it, which takes considerable time [21]. There-fore, government accounts may not have the most up-to-date information in crisis situations. The 7 events with thehighest percentage of tweets from governmental agenciesare due to natural-hazards, progressive and diffused (7%-13%), which are the cases when the governments interveneto issue or lift warnings or alerts.
• NGOs: 4% on average (min. 0%, max. 17%). Like gov-ernments, NGOs are also careful to broadcast only verifiedinformation. In the human-induced crises we studied thereis little NGO activity in Twitter (≈ 4% or less). The high-est levels of NGO tweets are seen in natural disasters andall those in which the fraction of such tweets was 6% ormore are typhoons and floods.
• Business: 2% on average (min. 0%, max. 9%). For themost part, we do not see a large amount of tweet activityfrom businesses in the disaster situations we studied. Theproportion is below 5% for all crises except the Albertafloods in 2013 with 9% of tweets. Furthermore, with onlyone exception—the Glasgow helicopter crash—the criseswith 3% or more tweets from business were diffused.
Association RulesTo systematically search for relationships between the char-acteristics of crises and the messages in Twitter, we appliedan association-rules mining method [11]. To err in the side ofcaution, we report only the automatically-discovered associ-ation rules that are valid for more than 20 out of the 26 crises.To apply this method to numerical data, each category in theinformation types and sources was divided into two classes:above the median, and below the median.
For information types, we found one rule that is valid for 24out of 26 of the crises: when the geographical spread is dif-fused, the proportion of caution and advice tweets is abovethe median, and when it is focalized, the proportion of cau-tion and advice tweets is below the median. For sources, wefound one rule that is valid for 21 out of 26 of the crises:human-induced accidental events tend to have a number ofeyewitness tweets below the median, in comparison with in-tentional and natural hazards.
Both rules are possibly related to different levels of access tothe area affected by the event and to its surroundings.
Content RedundancyWe next look at content redundancy. Heuristically, we con-sider two tweets to be near-duplicates if their longest commonsubsequence was 75% or more of the length of the shortesttweet. Among the sources of information, messages origi-nating from non-governmental organizations and government

Med
ia
Out
side
rs
Eye
witn
ess
Gov
ernm
ent
NG
Os
Bus
ines
s
Other Useful Info.
Sympathy
Affected Ind.
Donat. & Volun.
Caution & Advice
Infrast. & Utilities
0
5%
10%
>15%
Figure 2. Average distribution of tweets across crises into combinationsof information types (rows) and sources (columns). Rows and columnsare sorted by total frequency, starting on the bottom-left corner. Thecells in this figure add up to 100%.
sources tended to show more redundancy, with the top 3 mes-sages (and their near-duplicates) accounting for ≈20%-22%of the tweets. Among information types, messages of cautionand advice, and those containing information about infras-tructure and utilities, were the most repeated ones, with thetop 3 messages (and their near-duplicates) comprising ≈12-14% of the tweets.
Types and SourcesSome information types are more frequently associated withparticular sources, as shown in Figure 2, in which each〈type, source〉 cell depicts the probability that a tweet has thatspecific combination of information type and source. NGOsand business are more frequently the source of tweets relatedto donations and volunteering, mostly to ask for resourcesand request volunteer work (NGOs), or to announce free ordiscounted goods or services for those affected by a disaster(business).
Tweets from governments are often messages of caution andadvice, such as tornado alerts; this agrees with observationsin [51] where “preparedness” is the larger category used bygovernment communications. Instead, eyewitness tweets fo-cus on affected individuals. Both government and eyewit-ness tweets also frequently include a variety of messages thatbelong to the “other useful information” category. Outsidermessages are predominantly about sympathy and support.
Finally, tweets from traditional and Internet media offer avariety of information types including information about af-fected individuals, and messages of caution and advice. Me-dia are also the most prominent source of information regard-ing infrastructure and utilities.
Temporal AspectsWe study how the volume of different categories of messagesevolves over time, as shown in Tables 5 and 6 (at the end ofthe paper). We separated crises according to their temporaldevelopment (instantaneous vs. progressive), depicting us-ing “spark lines” the total volume of messages over time, andthe total volume of messages in each information type and
source.15 This analysis focuses on the differences betweenthe average timestamps of messages in different informationcategories.16
In terms of information types, the messages that arrive firstare those of caution and advice, and sympathy and support,roughly in the first 12–24 hours after the peak of the crisis.This is particularly evident in instantaneous crises. Then,messages about affected individuals and infrastructure aremost frequent. The last messages to appear are those relatedto donations and volunteering. Interestingly, this follows theprogression in the stages of a crisis from emergency responseto early recovery actions [47].
In terms of sources, there are differences depending on thetype of temporal development. In instantaneous crises, out-siders, media and NGO messages appear early, with othersources following (the temporal position of eyewitness mes-sages varies substantially depending on crisis type). On theother hand, during progressive crises, eyewitness and govern-ment messages appear early, mostly to warn and advice thosein the affected areas, while NGO messages appear relativelylate. In addition, there is an interesting temporal complemen-tarity between messages from governments and NGOs thatmerits to be studied in depth in future work.
Crisis SimilarityIn further seeking links between disaster characteristics andtweet content and source, we apply an unsupervised method;specifically, hierarchical agglomerative clustering. Perform-ing this clustering uncovered groups of crises that have sim-ilar content distribution. Given that we compare probabil-ity distributions, to measure the similarity between two crisisevents we use Bhattacharyya distance (for two discrete dis-tributions p and q this is − ln(
∑c∈C
√p(c)q(c)) where C is
the set of all classes) which quantifies the overlap betweentwo statistical samples. To combine clusters of crises, weused complete-linkage clustering, which merges those clus-ters for which the distance between their furthest elements isthe smallest.
Figure 3(a) shows the resulting dendrogram when the clus-tering is done according to the distribution of informationtypes. We see two large clusters: first, the cluster on thebottom is dominated by human-induced crises, while in theone on the top there are only natural hazards. This indi-cates that, despite the significant variations we have shown,human-induced crises are more similar to each other in termsof the types of information disseminated through Twitter thanto natural hazards.
Second, events also cluster depending on how they devel-oped. The cluster at the bottom includes instantaneous events,with one exception: the Colorado wildfires in 2012. Thisexception may be due to the nature of this particular fire.The combination of heat, drought conditions, and high winds
15Each point in the spark line corresponds to a calendar day, whichexplains why in some instantaneous crises the overall curve goes upat the beginning (when the crisis occurs at night).
16Peak, average, and median timestamps for each time series in Ta-bles 5 and 6 are available in our data release.

Savar building collapse’13LA airport shootings’13
NY train crash’13Russia meteor’13
Colorado wildfires’12Guatemala earthquake’12
Glasgow helicopter crash’13West Texas explosion’13
Lac Megantic train crash’13Venezuela refinery’12Bohol earthquake’13Boston bombings’13
Brazil nightclub fire’13Spain train crash’13
Manila floods’13Alberta floods’13
Philipinnes floods’12Typhoon Yolanda’13
Costa Rica earthquake’12Singapore haze’13
Italy earthquakes’12Australia bushfire’13
Queensland floods’13Colorado floods’13Sardinia floods’13Typhoon Pablo’12
(a) Clusters by information type.
Singapore haze’13Philipinnes floods’12
Alberta floods’13Manila floods’13
Italy earthquakes’12Australia bushfire’13Colorado wildfires’12
Colorado floods’13Queensland floods’13
Typhoon Pablo’12Typhoon Yolanda’13
Brazil nightclub fire’13Russia meteor’13
Boston bombings’13Glasgow helicopter crash’13
Bohol earthquake’13Venezuela refinery’12
Sardinia floods’13West Texas explosion’13
NY train crash’13Costa Rica earthquake’12
LA airport shootings’13Savar building collapse’13
Lac Megantic train crash’13Guatemala earthquake’12
Spain train crash’13
(b) Clusters by source.
Figure 3. Dendrograms obtained by hierarchical agglomerative clustering of crises. The length of the branch points reflect the similarity among crises.We remark that the clusters do not reflect similar messages, but instead similarities in terms of the proportion of different information types and sourcesin each crisis.
caused the fire to quickly develop, and it claimed 350 housesin just over 12 hours. The cluster on the top includes progres-sive disasters, with two outliers: Italy earthquakes in 2012—asequence of earthquakes and aftershocks—and the Costa Ricaearthquake in 2012—during which a Caribbean-wide tsunamiwatch was issued, resulting in a large volume of caution andadvice messages that are typically more prominent in pro-gressive crises.
A similar picture emerges in the case of clusters by distribu-tion of sources, shown in Figure 3(b). In this case, there isa large cluster dominated by human-induced crises (on thetop), followed by two small clusters encompassing only nat-ural hazards, and the Singapore haze 2013 as an outlier (thishaze was caused by a mix of natural and human causes). Fur-ther, the large cluster on the top is dominated by instantaneousevents (with two exceptions, Typhoon Yolanda and SardiniaFloods in 2013), while in the other clusters the events are pro-gressive, excepting Italy earthquakes in 2012.
Furthermore, while the events development and type arise asthe main factors impacting the clusters composition, in bothFigures 3(a) and 3(b) we also notice that the clusters are be-ing dominated by either diffused (top cluster by informationtype and bottom clusters by information source) or focalizedevents (the remaining clusters). The clusters tendency to en-compass events that are similar along all these dimensions islikely explained by the dependency among the crisis dimen-sions (e.g., typically, the progressive events are also diffusedand human-induced crises tend to be focalized).
DISCUSSIONDisasters are common events that occur regularly; the UnitedNations Office for Coordination of Humanitarian Affairsrecorded 394 disasters caused by natural hazards in the 2002–2011 period [1]. While disasters take place often, and may becaused by similar hazards and/or human actions, each event isunique [36] (pag. 5). Regardless of their distinct nature, andof variations in individual reactions and responses, common-alities across crises exist. Sociologists of disaster point outthat despite the differences among disaster agents (e.g. flood,
earthquake, bomb, fire), there are actions that planning andemergency response teams must take that are independent ofthese differences [47].
This brings us to an interesting juxtaposition; the types andamounts of information broadcast on Twitter differ acrosseach of the 26 specific crises we studied. This can be viewedas a display of the uniqueness of each event. In some cases themost common tweet in one crisis (e.g. eyewitness accounts inthe Singapore haze crisis in 2013) was absent in another (e.g.eyewitness accounts in the Savar building collapse in 2013).Furthermore, even two events of the same type in the samecountry (e.g. Typhoon Yolanda in 2013 and Typhoon Pabloin 2012, both in the Philippines), may look quite differentvis-à-vis the information on which people tend to focus.
Yet, when we look at the Twitter data at a meta-level, ouranalysis reveals commonalities among the types of informa-tion people tend to be concerned with, given the particular di-mensions of the situations such as hazard category (e.g. nat-ural, human-induced, geophysical, accidental), hazard type(e.g. earthquake, explosion), whether it is instantaneous orprogressive, and whether it is focalized or diffused. For in-stance, caution and advice tweets from government sourcesare more common in progressive disasters than in instanta-neous ones. The similarities do not end there. When groupingcrises automatically based on similarities in the distributionsof different classes of tweets, we also realize that despite thevariability, human-induced crises tend to be more similar toeach other than to natural hazards.
This leads us to believe that we can view Twitter as a mediumthrough which the nuance of disaster events is highlighted oramplified; it is a tool that becomes incorporated into the socialconstruction of the disaster event, and through which we canunderstand the detailed differences on a large scale when welook closely at Twitter data. At the same time, when we lookat those same data at a higher level, we see commonalitiesand patterns.
Practitioners, including emergency managers, public infor-mation officers, and those who develop the tools used by
them, should consider that the proportion of tweets thatare relevant for a specific purpose will almost invariably besmaller than the proportion of the tweets that are not. For in-stance, if an analyst or an application focuses on content thatis not present in mainstream or other Internet media sources,and wants to exclude content provided by outsiders who arenot affected by the crisis, then it will have to skip through80% of the tweets on average. The same holds for informa-tion types. If we group together the four main types we used(affected individuals, donations and volunteering, caution andadvice, and infrastructure and utilities), they cover on average47% of the tweets related to a crisis. This implies that if anapplication wants to focus on these information types, at least53% of the messages will have to be discarded. These arelower bounds, as often not all of the tweets of a given typewill be relevant for a particular application. Noise is a naturalconsequence of the diversity of information in this medium.
Developers should consider that emergency response includesa set of actions that have to be taken in preparation of any cri-sis event, plus a broad space for adaptability in response tospecific events [47]. Hence, tools to process social media indisaster should consider that there are broad classes of infor-mation that are likely to be prevalent, and can be anticipatedto occur. At the same time, a substantial volume of messageswill depend on specificities of every event, and tools mustincorporate methods to adaptively detect and process them.
CONCLUSIONSOur systematic examination of a diverse set of crisis situa-tions uncovered substantial variability across crises, as wellas patterns and consistencies. To the best of our knowledge,this is the largest transversal study on tweets broadcast in re-sponse to various international disaster and crisis situations.
Future WorkThe high-level patterns we have found lay the foundations forfuture studies that go into the detail of each specific crisis oreach specific information category analyzed.
However, we note that we did not cover all possible crisissituations. For instance, we did not include human-inducedprogressive or diffused situations, which are less commonthan the classes we did study. The former (human-inducedprogressive) mostly refers to politically-driven crises, such asinstability leading to demonstrations, riots, and/or civil wars.The latter (human-induced diffused) in recent years have beenmostly wars affecting an entire country or region, or less-common, large-scale industrial accidents such as the oil spillin the Gulf of Mexico in 2010. Additionally, the manage-ment of a crisis is typically divided into phases: mitigation,preparedness, response and recovery [35, 47]. The work wepresent here is concerned mostly with the response phase andpartially with the recovery phase, as these attract the bulk ofsocial media activities [23]. Language and cultural differ-ences could also be included as explicit crisis dimensions [20,37], together with temporal factors. Microblogging practicesare likely to evolve over the years, and our collections covera period of just about 20 months. The study of other crisis
dimensions, other types of crises and other phases, will cer-tainly deepen our findings.
Methodologically, we asked crowdsource workers to matcheach tweet to one specific class. This simplifies the label-ing process and makes the presentation of the results clearer.When workers associate a tweet to multiple classes, it maybe possible that the distributions change. Employing profes-sional emergency managers as annotators instead of crowd-source workers may lead to further results. Finally, assessingthe quality, credibility, or veracity of the information in eachtweet is relevant for most of the potential consumers of thisdata. However, we note that in these cases the cost of the an-notation would certainly increase—or the amount of labeleddata would decrease.
Data ReleaseThe tweets used in this research, and the labels collectedthrough the crowdsourced annotation, are available for re-search purposes at http://crisislex.org/
AcknowledgmentsWe thank Patrick Meier for his valuable advice while definingthis project. We are indebted to Karl Aberer for his support.We thank the reviewers for their detailed feedback. Alexan-dra Olteanu was partially supported by the grant Reconcile:Robust Online Credibility Evaluation of Web Content fromSwitzerland through the Swiss Contribution to the enlargedEuropean Union.
REFERENCES1. World humanitarian data and trends. Tech. rep., UN
OCHA, Dec. 2013.
2. Acar, A., and Muraki, Y. Twitter for crisiscommunication: lessons learned from Japan’s tsunamidisaster. Int. J. of Web Based Communities (2011).
3. Adams, D. S. Policies, programs, and problems of thelocal Red Cross disaster relief in the 1960s. Tech. rep.,University of Delaware, Disaster Research Center, 1970.
4. Aramaki, E., Maskawa, S., and Morita, M. Twittercatches the flu: Detecting influenza epidemics usingTwitter. In Proc. of EMNLP (2011).
5. Benevenuto, F., Magno, G., Rodrigues, T., and Almeida,V. Detecting spammers on Twitter. In In Proc. of CEAS(2010).
6. Bruns, A., Burgess, J. E., Crawford, K., and Shaw, F.#qldfloods and @qpsmedia: Crisis communication onTwitter in the 2011 South East Queensland floods. Tech.rep., ARC Centre, Queensland University ofTechnology, 2012.
7. Caragea, C., McNeese, N., Jaiswal, A., Traylor, G.,Kim, H., Mitra, P., Wu, D., Tapia, A., Giles, L., Jansen,B. J., et al. Classifying text messages for the Haitiearthquake. In Proc. of ISCRAM (2011).
8. Carr, L. J. Disaster and the sequence-pattern concept ofsocial change. American Journal of Sociology (1932).

9. Carvin, A. Distant Witness. CUNY Journalism Press,2013.
10. Castillo, C., Mendoza, M., and Poblete, B. Informationcredibility on Twitter. In Proc. of WWW (2011).
11. Cohen, W. W. Fast effective rule induction. In Proc. ofICML (1995), 115–123.
12. De Choudhury, M., Diakopoulos, N., and Naaman, M.Unfolding the event landscape on Twitter: Classificationand exploration of user categories. In Proc. of CSCW(2012).
13. Denef, S., Bayerl, P. S., and Kaptein, N. A. Social mediaand the police: tweeting practices of British policeforces during the August 2011 riots. In Proc. of CHI(2013).
14. Diakopoulos, N., De Choudhury, M., and Naaman, M.Finding and assessing social media information sourcesin the context of journalism. In Proc. of CHI (2012).
15. Esser, F., and Hanitzsch, T., Eds. The Handbook ofComparative Communication Research. ICAHandbooks. Routledge, Apr. 2012.
16. Fischer, H. W. Response to disaster: fact versus fiction& its perpetuation—the sociology of disaster. UniversityPress of America, 1998.
17. Fraustino, J. D., Liu, B., and Jin, Y. Social media useduring disasters: A review of the knowledge base andgaps. Tech. rep., Science and Technology Directorate,U.S. Department of Homeland Security, 2012.
18. Gerlitz, C., and Rieder, B. Mining one percent ofTwitter: collections, baselines, sampling. M/C Journal(2013).
19. González-Bailón, S., Wang, N., Rivero, A.,Borge-Holthoefer, J., and Moreno, Y. Assessing the biasin communication networks sampled from Twitter.Social Networks 38 (July 2014), 16–27.
20. Hong, L., Convertino, G., and Chi, E. H. Languagematters in Twitter: A large scale study. In Proc. ofICWSM (2011).
21. Hughes, A. L. Participatory design for the social medianeeds of emergency public information officers. In Proc.of ISCRAM (2014).
22. Hughes, A. L., St. Denis, L. A., Palen, L., and Anderson,K. Online public communications by police and fireservices during the 2012 hurricane Sandy. In Proc. ofCHI (2014).
23. Imran, M., Castillo, C., Lucas, J., Patrick, M., andRogstadius, J. Coordinating human and machineintelligence to classify microblog communications incrises. In Proc. of ISCRAM (2014).
24. Imran, M., Elbassuoni, S. M., Castillo, C., Diaz, F., andMeier, P. Extracting information nuggets fromdisaster-related messages in social media. In Proc. ofISCRAM (2013).
25. Joseph, K., Landwehr, P. M., and Carley, K. M. Two 1%s don’t make a whole: Comparing simultaneous samplesfrom Twitter’s streaming API. In Social Computing,Behavioral-Cultural Modeling and Prediction. 2014.
26. Kanhabua, N., and Nejdl, W. Understanding thediversity of tweets in the time of outbreaks. In Proc. ofWOW workshop (2013).
27. Kumar, S., Morstatter, F., Zafarani, R., and Liu, H.Whom should I follow?: Identifying relevant usersduring crises. In Proc. of Hypertext (2013).
28. Leavitt, A., and Clark, J. A. Upvoting hurricane Sandy:event-based news production processes on a social newssite. In Proc. of CHI (2014).
29. Metaxas, P., and Mustafaraj, E. The rise and the fall of acitizen reporter. In Proc. of WebSci (2013).
30. Monroy-Hernández, A., boyd, d., Kiciman, E.,De Choudhury, M., and Counts, S. The new warcorrespondents: The rise of civic media curation inurban warfare. In Proc. of CSCW (2013).
31. Morstatter, F., Pfeffer, J., and Liu, H. When is it biased?:assessing the representativeness of Twitter’s streamingAPI. In Proc. of Web Science Track at WWW (2014).
32. Morstatter, F., Pfeffer, J., Liu, H., and Carley, K. M. Isthe sample good enough? comparing data from Twitter’sstreaming API with Twitter’s Firehose. In Proc. ofICWSM (2013).
33. Munro, R., and Manning, C. D. Short messagecommunications: users, topics, and in-languageprocessing. In Proc. of DEV (2012).
34. Olteanu, A., Castillo, C., Diaz, F., and Vieweg, S.CrisisLex: A lexicon for collecting and filteringmicroblogged communications in crises. In Proc. ofICWSM (2014).
35. Palen, L., and Liu, S. B. Citizen communications incrisis: anticipating a future of ICT-supported publicparticipation. In Proc. of CHI (2007).
36. Perry, R. W., and Quarantelli, E. L. What is a disaster?:New answers to old questions. Xlibris Corporation,2005.
37. Poblete, B., Garcia, R., Mendoza, M., and Jaimes, A. Doall birds tweet the same?: characterizing Twitter aroundthe world. In Proc. of CIKM (2011).
38. Prelog, A. J. Social Change and Disaster AnnotatedBibliography. PhD thesis, Department of Economics,Colorado State University, 2010.
39. Qu, Y., Huang, C., Zhang, P., and Zhang, J.Microblogging after a major disaster in China: a casestudy of the 2010 Yushu earthquake. In Proc. of CSCW(2011).
40. Shaw, F., Burgess, J., Crawford, K., and Bruns, A.Sharing news, making sense, saying thanks: Patterns oftalk on Twitter during the Queensland floods. AustralianJournal of Communication (2013).

41. Snow, R., O’Connor, B., Jurafsky, D., and Ng, A. Y.Cheap and fast—but is it good?: Evaluating non-expertannotations for natural language tasks. In Proc. ofEMNLP (2008).
42. Sreenivasan, N. D., Lee, C. S., and Goh, D. H.-L. Tweetme home: exploring information use on Twitter in crisissituations. In Online Communities and SocialComputing. 2011.
43. Starbird, K., Muzny, G., and Palen, L. Learning from thecrowd: Collaborative filtering techniques for identifyingon-the-ground twitterers during mass disruptions. InProc. of ISCRAM (2012).
44. Starbird, K., and Palen, L. “Voluntweeters”:Self-organizing by digital volunteers in times of crisis.In Proc. of CHI (2011).
45. Starbird, K., Palen, L., Hughes, A. L., and Vieweg, S.Chatter on the red: what hazards threat reveals about thesocial life of microblogged information. In Proc. ofCSCW (2010).
46. Thomson, R., Ito, N., Suda, H., Lin, F., Liu, Y.,Hayasaka, R., Isochi, R., and Wang, Z. Trusting tweets:The Fukushima disaster and information sourcecredibility on Twitter. In Proc. of ISCRAM (2012).
47. Tierney, K. J. Disaster preparedness and response:Research findings and guidance from the social science
literature. Tech. rep., University of Delaware, DisasterResearch Center, 1993.
48. Truelove, M., Vasardani, M., and Winter, S. Towardscredibility of micro-blogs: characterising witnessaccounts. GeoJournal (2014), 1–21.
49. Vieweg, S. Situational Awareness in Mass Emergency:A Behavioral and Linguistic Analysis of MicrobloggedCommunications. PhD thesis, University of Colorado atBoulder, 2012.
50. Vieweg, S., Hughes, A. L., Starbird, K., and Palen, L.Microblogging during two natural hazards events: WhatTwitter may contribute to situational awareness. In Proc.of CHI (2010).
51. Wukich, C., and Mergel, I. A. Closing theCitizen-Government communication gap: Content,audience, and network analysis of government tweets.Social Science Research Network Working Paper Series(Aug. 2014).
APPENDIX• Table 4 containing the list of keywords used to collect
data from each crisis.• Tables 5 and 6 depicting temporal distributions of tweets
on each crisis for each type, and for each source.

Table 4. List of keywords used to collect data for each of the crises in this study.Year Crisis Name Keywords #Kw
2012 Italy earthquakes earthquake italy; quake italy; #modena; #sanfelice; san felice; modena terremoto; modena earthquake;modena quake; #norditalia; terremoto italia; #terremoto;
11
2012 Colorado wildfires #cofire; #boulderfire; #colorado; #wildfire; #waldocanyonfire; #waldofire; #waldocanyon; col-orado springs; #highparkfire; #flagstafffire; #littlesandfire; #treasurefire; #statelinefire; #springerfire;#lastchancefire; #fourmilefire; #4milefire; #fourmilecanyonfire; #boulderfire; #bisonfire; coloradowildfire; colorado wildfires; colorado fire; colorado fires; boulder fire; boulder fires; boulder wildfires;boulder wildfires;
28
2012 Philipinnes Floods #rescueph; #reliefph; #floodsph; #prayforthephilippine; manila flood; manila floods; philippine floods;philippine flood; #floodph; #phalert; #habagat;
11
2012 Venezuela refinery explosion paraguana refinery; venezuela refinery; paraguaná refinery; #paraguana; #paraguaná; amuay refinery;venezuelan refinery; #amuay; paraguaná refinería; paraguana refineria; amuay refineria; amuay refin-ería; #falcon; #falcón; refinería venezuela; refineria venezuela; refinería paraguana;
17
2012 Costa Rica earthquake #temblorcr; #terremotocr; #costarica; #terremoto; costa rica quake; costa rica earthquake; costa ricatemblor; costa rica terremoto; #creq; costa rican quake; costa rican earthquake; #quake; #earthquake;
13
2012 Guatemala earthquake #sismo; #guatemala; tiemblaenguate; temblorgt; terremotogt; temblor guatemala; terremoto guatemala;sismo guatemala; earthquake guatemala; quake guatemala; #sanmarcos; #terremotoguatemala;#tremorguatemala;
13
2012 Typhoon Pablo #pabloph; #reliefph; #bopha; #typhoonpablo; #typhoonbopha; typhoon bopha; typhoon pablo; #bopha;#pablo; #typhoon; #walangpasok; #mindanao; #visayas; #hinatuan; #rescueph; #pablosafetytips; #cdo;#strongerph;
18
2013 Brazil nightclub fire #forçasantamaria; boate kiss; #boatekiss; #santamaria; #tragédiaemsm; #tragediaemsm; #todosdese-jamforçasasantamaria; #brazilfire; #brazil fire; brazil nightclub; #brasildesejaforçasasvitimasdesanta-maria; #prayforsantamaria; #prayforbrazil;
13
2013 Queensland Floods #qldflood; #bigwet; queensland flood; australia flood; #qldfloods; queensland floods; australia floods;queensland flooding; qld flood; qld floods; qld flooding; australia flooding;
12
2013 Russian Meteor #метеорит; #meteor; #meteorite; russia meteor; russian meteor; #russianmeteor; #chelyabinsk; #че-лябинск;
8
2013 Boston Bombings boston explosion; boston explosions; boston blast; boston blasts; boston tragedies; boston tragedy;prayforboston; boston attack; boston attacks; boston terrorist; boston terrorists; boston tragic; boston-marathon; boston marathon; boston explosive; boston bomb; boston bombing; dzhokhar; tsarnaev;marathon attack; marathon explosion; marathon explosions; marathon tragedies; marathon tragedy;marathon blasts; marathon blast; marathon attacks; marathon bomb; marathon bombing; marathonexplosive;
30
2013 Savar building collapse #savar; #bangladesh; bangladesh collapse; #ranaplaza; savar bangladesh; savar collapse; rana plaza; 72013 West Texas Explosion #westexplosion; west explosion; waco explosion; texas explosion; texas fertilizer; prayfortexas; pray-
forwest; waco tx; west tx; west texas; waco texas; #west; #waco; westexplosion; west explosion; wacoexplosion; tx explosion; fertilizer explosion; prayfortexas; prayforwest; westtx; wacotx; west texas;waco texas; west tx; waco tx; texas fertilizer; west fertilizer; waco fertilizer;
29
2013 Alberta Floods alberta flood; #abflood; canada flood; alberta flooding; alberta floods; canada flooding; canada floods;#yycflood; #yycfloods; #yycflooding; calgary flood; calgary flooding; calgary floods;
13
2013 Singapore Haze #sghaze; singapore haze; #hazyday; blamethehaze; mustbehaze; #sg #haze; singapore #hazy; 72013 Lac-Megantic train crash #lacmegantic; #lacmégantic; #lacmég; #lacmeg; #tragedielacmegantic; #tragédielacmégantic; #mé-
gantic; lac mégantic; lac megantic; quebec train explosion; quebec train derailment; quebec train crash;quebec oil train; canada train oil; canada train oil; canadian train oil;
16
2013 Spain train crash compostela train; spain train; tren compostela; españa tren; #santiagocompostela; #accidentesantiago; 62013 Manila Floods baha manila; #maringph; #rescueph; #reliefph; #floodsph; #prayforthephilippine; manila flood; manila
floods; philippine floods; philippine flood; #floodph; #phalert; #safenow; #trafficph; #habagat; #mar-ing; #maringupdates;
17
2013 Colorado Floods #cofloodrelief; colorado floods; colorado flooding; #coloradoflood; #coflood; #opcoflood; #boulder-flood; #longmont;
8
2013 Australia wildfires #nswfires; #nswbushfire; #nswbushfires; #nswrfs; #sydneybushfire; #sydneyfire; #sydneyfires; #syd-neybushfires; nsw #bushfire; #redoctober; australia #bushfire; #faulconbridge; #nswrfs; #bushfire syd-ney; nsw fire; #prayforaustralia; #prayfornsw; australia fire; sydney fire; nsw fires; australia fires;sydney fires; prayfornsw;
23
2013 Bohol earthquake #phquake; #pheq; #phtrenchquake; philippines earthquake; philippines quake; ph earthquake; phquake; #phtrenchquake; #prayforthephilippines; #rescueph; #reliefph; #tabangbohol; #tabangcebu;#bohol; #cebu; prayforvisayas; prayforbohol; #lindol;
18
2013 Glasgow helicopter crash #prayerforglasgow; #helicopter; glasgow helicopter; #clutha; helicopter crash; 52013 LA Airport Shootings lax shooting; lax shootings; lax shooter; lax suspect; #laxshooting; lax airport; #lax; airport shooting;
airport shootings; #losangeles airport; lax victims;11
2013 NYC train crash #newyork derailment; ny derailment; nyc derailment; #metronorth derailment; #spuyten duyvil; #nyc-train; new york derailment; metro north derailment; #metronorth derailment; ny train crash; nyc traincrash; newyork train crash; york train crash; #metronorth train crash; metro north crash; ny train de-railed; york train derailed; nyc train derailed;
18
2013 Sardinia Floods sardinia floods; sardinia flooding; cyclone cleopatra; #cyclonecleopatra; #sardinia; sardegna alluvione;#cleopatra alluvione; #sardegna;
8
2013 Typhoon Yolanda #typhoonyolanda; #yolandaph; #yolanda; #haiyan; #tracingph; #floodph; #safenow; #rescueph; #re-liefph; typhoon yolanda; typhoon haiyan; typhoon philippines; #typhoonhaiyan; #typhoonaid; #philip-pines; #typhoon; #supertyphoon; #redcrossphilippines; #yolandaactionweekend; rescue ph; typhoonph; super typhoon;
22

Table5.Tem
poraldistributionoftw
eetsacrossinformation
sources(top)andtypes(bottom
)forthe
progressiveeventsw
eanalyzed.T
he3
mostfrequentsources,respectively,inform
ationtypes,
percrisisare
highlightedin
green.The
redverticalbar
indicatesthepeak
volume
foralltw
eetsrelatedto
eachevent.(B
estseenin
color.)
Nam
eA
lbertafloods’13
Australia
wildfires’13
Colorado
floods’13C
oloradow
ildfires’12M
anilafloods’13
Philipinnesfloods’12
Queensland
floods’13Sardiniafloods’13
Singaporehaze’13
TyphoonPablo’12
TyphoonY
olanda’13
Overall
Eyew
itness
Governm
entN
GO
s
Business
Media
Outsiders
Affected
Ind.
Infrast.&U
tilities
Donat.&
Volun.C
aution&
Advice
Sympathy
OtherU
sefulInfo.
Table6.
Temporaldistribution
oftweets
acrossinform
ationsources
(top)andtypes
(bottom)for
theinstantaneous
eventsw
eanalyzed.
The
3m
ostfrequentsources,respectively,information
types,percrisisare
highlightedin
green.The
redverticalbar
indicatesthepeak
volume
foralltw
eetsrelatedto
eachevent.(B
estseenin
color.)
Nam
eB
oholearthq.’13
Boston
bombings’13
Brazil
nightclubfire’13
Costa
Rica
earthq.’12
Glasgow
helicoptercrash’13
Guatem
alaearthq.’12
Italyearthq.’12
LA
airportshootings’13
Lac-M
egantictraincrash’13
NY
Ctraincrash’13
Russian
meteor’13
Savarbuildingcollapse’13
Spaintraincrash’13
Venezuela
refineryexplosion’12
West
Texasexplosion’13
Overall
Eyew
itness
Governm
ent
NG
Os
Business
Media
Outsiders
Affected
Ind.
Infrast.&U
tilities
Donat.&
Volun.C
aution&
Advice
Sympathy
OtherU
sefulInfo.