WHAT THE DATA HAS TO SHOW - Becker's ASC Review June 10th... · 14th Annual Spine, Orthopedic and...
29
1 By René Azeez 14 th Annual Spine, Orthopedic and Pain Management-Driven ASC Conference + The Future of Spine Friday, June 10, 2016 4:25 – 5:00 p.m. WHAT THE DATA HAS TO SHOW: How Shifting Procedural Site of Service Affects Competitive Strategy in the Orthopedic Device Industry By René Azeez
Transcript of WHAT THE DATA HAS TO SHOW - Becker's ASC Review June 10th... · 14th Annual Spine, Orthopedic and...

1
By René Azeez
14th Annual Spine, Orthopedic and Pain Management-Driven ASC Conference + The Future of Spine
Friday, June 10, 2016
4:25 – 5:00 p.m.
WHAT THE DATA HAS TO SHOW: How Shifting Procedural Site of Service Affects
Competitive Strategy in the Orthopedic Device Industry
By René Azeez

About the Presenter
René Azeez is the manager of the orthopedics and dental Medtech Insights team at the Decision Resources Group.
My research experience extends to a number of therapeutic areas related to orthopedics, including spinal implants, orthopedic biomaterials, soft tissue solutions, hemostats, internal tissue sealants, adhesion barriers, veterinary orthopedic devices, trauma implants, and large joint reconstructive implants. I graduated from the University of Toronto with an honors degree in developmental biology.
PAGE 2 BECKER’S

GLOBAL
ORTHOPEDIC
MARKETS
~$40 BILLION
NORTH AMERICA
5-6 MAIN SEGMENTS
EUROPE
5 MAIN COMPETITORS
LATIN AMERICA
There is no shortage of high level orthopedic industry market research
and estimates
1
2
4
DRG MARKETING TEMPLATES PAGE 3
3
Asia Pacific
ORTHOPEDIC INDICATIONS
AP
O
BC
O&O
Bone Deformities
Osteoporosis & Osteopenia
Aging
Population
Osteoarthritis
Diabetes & Obesity
BD
D&O
Road
Injuries
Bone
Cancer
RI
BECKER’S
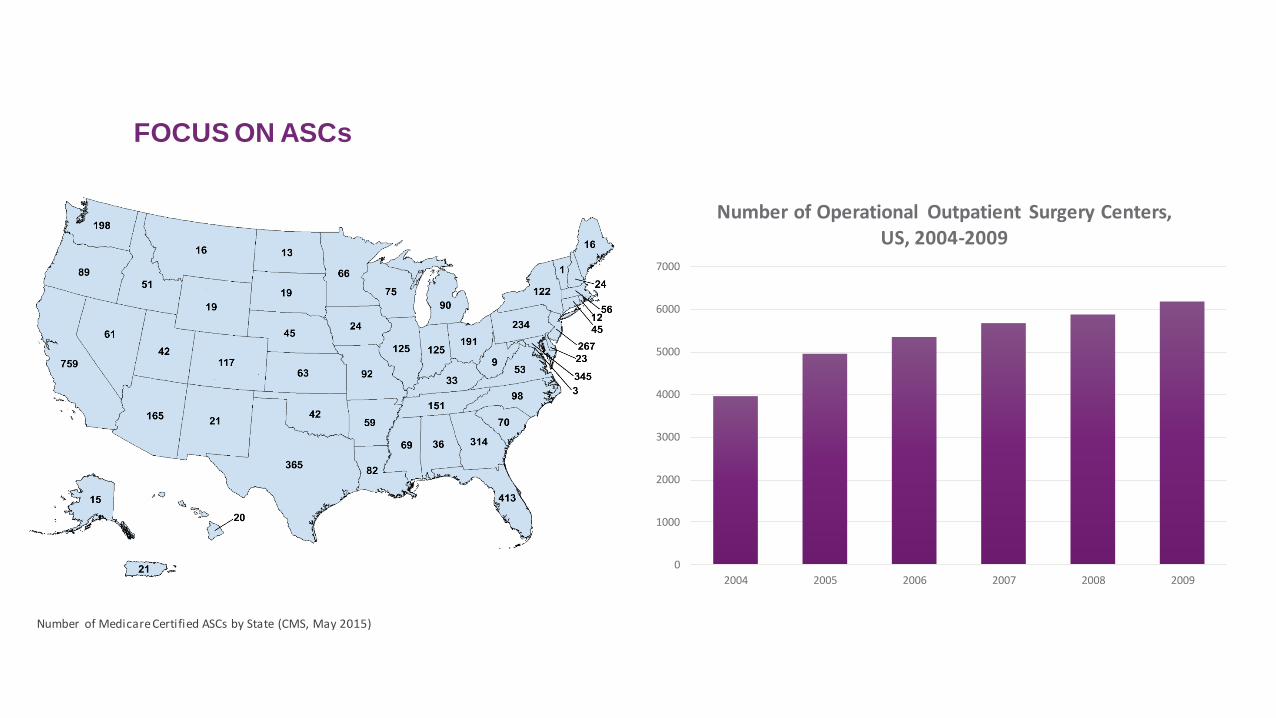
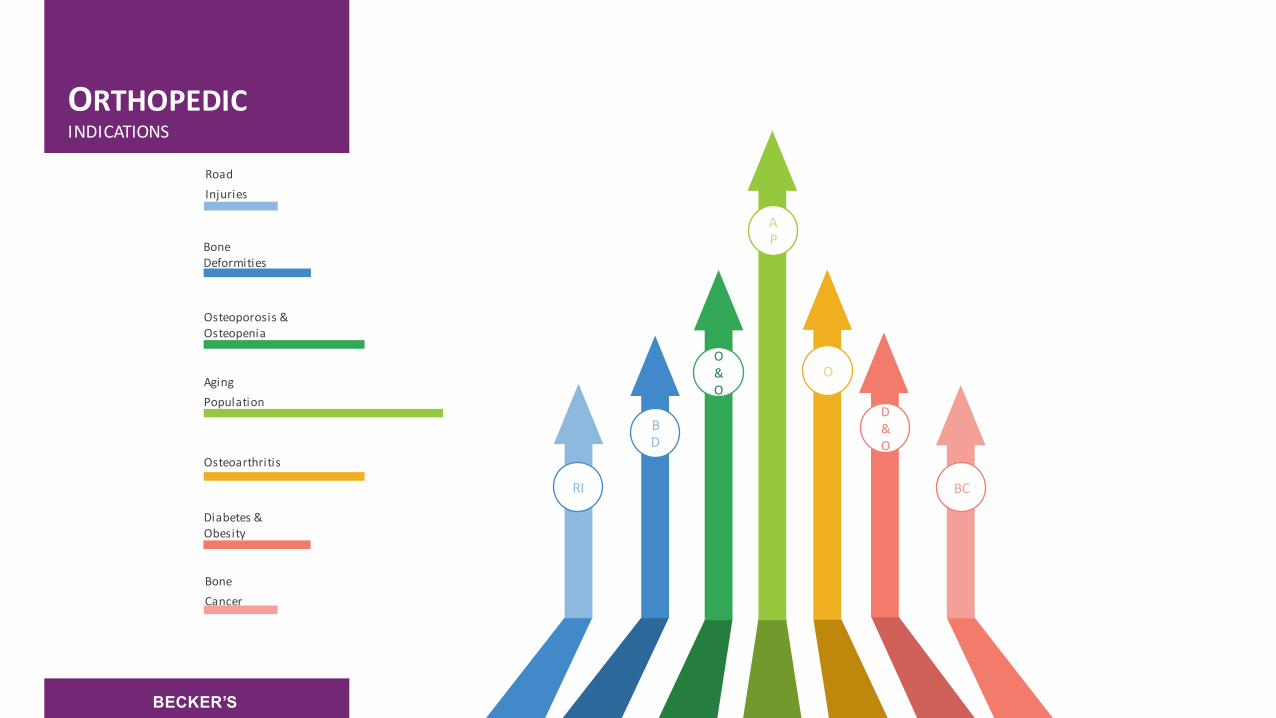
FOCUS ON ASCs
0
1000
2000
3000
4000
5000
6000
7000
2004 2005 2006 2007 2008 2009
Number of Operational Outpatient Surgery Centers, US, 2004-2009
Number of Medicare Certified ASCs by State (CMS, May 2015)

ASC LANDSCAPE
5K+
There are presently 5K+ Medicare-certified ASCs
700+
Of the 766 ASCs owned by the largest chains
about half are HQd by
Nashville firms
23 Million
Each year, physicians perform more than 23 mil lion procedures in
ASCs
20-25%
Approximately 20-25% of ASCs in the US have
some ownership by a
hospital partner
$2.3 Billion
Medicare and i ts beneficiaries share in
more than $2.3 B savings
each year for care as ASCs
$57.6 Billion
ASCs have the potential to save Medicare an
additional $57.6 billion
over the next decade
100K+
ASCs employ the equivalent of around
117,700 ful l-time
workers
$90 Billion
The national total economic impact of ASCs
in 2009 was $90 B including more than
%5.8 B in tax payments
PAGE 6 BECKER’S
8 KEY FACTS ABOUT ASCs (Becker’s Healthcare, August 2015)

Evolving sites of service in patients with
orthopedic indications represent an
important opportunity that should be taken
into consideration in portfolio development
and marketing initiatives.
KEY EVENTS
JANUARY 2015
CMS approved new spine codes for ASCs
JUNE 2015
Critical legislature ensuring that ethical consideration for ASCs as an option for
site of service for healthcare was tabled
OCTOBER 2015
CMS-mandated change from ICD-9 to ICD-10
JANUARY 2016
11 new procedures became part of the ASC payable list as of January 2016.
PAGE 7 BECKER’S

Regarding ASCs versus hospitals, do orthopedic surgeons tend to favor one
setting over the other?
“I don’t know that the government is
creating an environment for that to
happen.”
-Orthopedic Surgeon
“Yes, absolutely. You’re saving a lot on
hospital costs without a doubt.”
-Orthopedic Surgeon
PAGE 8 BECKER’S
KEY INFLUENCER
INSIGHT

In your opinion, is having more orthopedic procedures in ASCs versus
hospitals a good thing as far as overall healthcare costs goes?
Absolutely, hands down most surgeons I know prefer working in the ASC.
- Orthopedic Surgeon
It’s not that simple, it is important to remember, there are good ASCs, and bad ASCs, good hospitals, and bad hospitals.
- Orthopedic Surgeon
PAGE 9
KEY INFLUENCER
INSIGHT
BECKER’S

Given all the challenges like reimbursement and other factors, why should
device companies pay attention to ASCs?
From what I understand, ASCs pay less money for devices compared to hospitals; that much is a given. However, device companies need to be flexible, and understand that partnering with ASCs is still profitable; there is lucrative potential. -Orthopedic Surgeon
I think it’s important to understand first that a device company cannot target ASCs as such. They cannot create and target a device to ASCs in order to make money.
-Orthopedic Surgeon
PAGE 10
KEY INFLUENCER
INSIGHT
BECKER’S

ORTHOPEDIC
PROCEDURES IN
ASCs
KNOWN
HIGH LEVEL MARKET DATA GENERAL KNOWLEDGE OF PROCEDURE TRENDS GENERAL UNDERSTANDING OF THE HEALTH CARE IMPACT OF ASCS
UNKNOWN
A DEEP UNDERSTANDING OF ASC TRENDS THE POTENTIAL IMPACT ON ORTHOPEDIC IMPLANT MANUFACTURER STRATEGY
PAGE 11 BECKER’S
WHAT THE DATA
HAS TO SHOW: How Shifting Procedural Site of
Service Affects Competitive
Strategy in the Orthopedic Device
Industry

The DRG RWD Repository provides broad and deep coverage of the US Healthcare System
Assembled from multiple claims and EHR sources our data can be leveraged to profile patients,
geographic regions, hospital systems, HCPs, disease areas, therapeutics, devices, and health
plans. Analytics DRG applies expertise to this data to produce, HEOR, Epidemiologic,
Forecasting, Market sizing, Network influence Adherence/Compliance, Economic, and Pricing
Dynamic analyses.
Deep Longitudinal Coverage of Care
Our Cla ims database aggregates data
from multiple sources and represents
over 2/3rds of US claims.
Large and Diverse Patient Coverage
Our data covers nearly 70% of US
patients, including EHR Detail. Multi
year outcome data available.
Full Coverage of HCP Behavior
Phys ician's, PA’s, NP’s, and RN’s
activi ties, behavior, and decision
making are covered in intricate detail,
including roll up to IDN’s and ACO’s .
Complete Coverage of US Payer
Dynamics
Complete coverage of RW payer
behavior, including Rejection, Prior
Auth, Co pay, Rebates, and Full
Payment amounts.
240M
Unique US Patients
3.2B
Medical and Rx Pharmacy Claims
100%
Of US Health Plans
1.6M
US Healthcare Providers Represented
DRG RWD
REPOSITORY
Real World Health Data
for more effective US
Healthcare.
PAGE 13 BECKER’S

14
WHAT THE DATA HAS TO SHOW: VERTEBROPLASTY
BECKER’S
0
1000
2000
3000
4000
5000
2013 2014 2015
Vertebroplasty Procedure Volumes,
RWD ASCs, 2015-2015
Stable and (relatively) substantial procedure volumes

KEY INSIGHT:
Some procedures are particular well suited to ASCs

16
WHAT THE DATA HAS TO SHOW: CERVICAL ARTIFICIAL DISCS
0.0%
10.0%
20.0%
30.0%
40.0%
50.0%
60.0%
0
500
1000
1500
2000
2500
3000
3500
2013 2014 2015
Cervical Artifical Disc Procedures,
All RWD Facilities, 2013-2015
Year Growth
BECKER’S
Overwhelmingly positive procedure growth in the last two years
-40%-20%0%20%40%60%80%100%120%140%160%180%
0
20
40
60
80
100
120
2013 2014 2015
Cervical Artificial Disc Procedures,
RWD ASCs, 2013-2015
Year Growth
Adoption was significant in 2014 but has seemingly reached a plateau

KEY INSIGHT:
Overall procedure adoption does not necessarily equate
to adoption in the ASC to the same extent even if the
procedure is performed in hospitals and ASCs

18
WHAT THE DATA HAS TO SHOW: TENDON MUSCLE RECONSTRUCTION
BECKER’S
Hospital Tendon Muscle
Reconstruction Procedures, by Age Group, by % of Total, 2012 to 2015
Under 30 Between 30 and 50 Over 50
ASC Tendon Muscle Reconstruction
Procedures, by Age Group, 2012 to 2015
Under 30 Between 30 and 50 Over 50
The Over 50 demographic makes up the vast majority of tendon muscle reconstructions in hospitals
Contrarily Under 30s dominate procedure totals in ASCs for this
procedure

KEY INSIGHT:
Patient demographics can vary significantly in different
settings

20
WHAT THE DATA HAS TO SHOW: ALIF
BECKER’S
The ASC setting has a higher proportion of orthopedic surgeons
compared to hospitals
0%
10%
20%
30%
40%
50%
60%
2013 2014 2015
Hospital ALIF Procedures, by
Surgeon Specialty, by % of Total, 2013-2015
Orthopedic Surgeon Neurosurgeon Other
The split of surgeon specialties is close to equal between orthopedic surgeons and neurosurgeons in hospitals with a significant proportion to other surgeons
0%
10%
20%
30%
40%
50%
60%
70%
80%
2013 2014 2015
ASC ALIF Procedures, by Surgeon
Specialty, by % of Total, 2013-2015
Orthopedic Surgeon Neurosurgeon

21
WHAT THE DATA HAS TO SHOW: UNICONDULAR KNEES
BECKER’S
This is true in both settings
0.0%
20.0%
40.0%
60.0%
80.0%
100.0%
2013 2014 2015
Hospital Unicondylar Knee
Procedures, by Surgeon Specialty, by % of Total, 2013-2015
Orthopedic Surgeon Other
0.0%
20.0%
40.0%
60.0%
80.0%
100.0%
2013 2014 2015
ASC Unicondylar Knee Procedures,
by Surgeon Specialty, by % of Total, 2013-2015
Orthopedic Sugeon Other
Orthopedic surgeons perform the vast majority of total unicondylar knee procedures

KEY INSIGHT:
The surgical specialty mix may vary between settings
depending on a number of variables including the
procedure itself

DRG PRICETRACK
600+ US Hospitals
2.2mil Unique SKUs
>90% of facilities report quarter over quarter
SKU-level
product detail
available
3,000+ manufacturers
2010
present
Trendable
Data
BECKER’S

24
WHAT THE DATA HAS TO SHOW: SPINAL CORD STIMULATORS
BECKER’S
Spinal Cord Stimulators Hospital ASPs are relatively stable ASC pricing is much
less stable over the same period
0500
10001500200025003000350040004500
Spinal Cord Stimulators Hospital
ASP, by Month, Q1 2013 to Q4 2015
$0
$500
$1,000
$1,500
$2,000
$2,500
$3,000
$3,500
$4,000
$4,500
Spinal Cord Stimulators ASC ASP,
by Month, Q1 2013 to Q4 2015

25
WHAT THE DATA HAS TO SHOW: CERVICAL ARTIFICIAL DISCS AND INTERBODY DEVICES
BECKER’S
Both CAD and IBD ASPs are more heavily fluctuating in ASCs compared to other settings
$0
$1,000
$2,000
$3,000
$4,000
$5,000
$6,000
$7,000
2013 2014 2015 2016
Cervical Artificial Disc ASPs, by
Facility Type, 2013-2016
Health System Hospital ASC
$0
$500
$1,000
$1,500
$2,000
$2,500
$3,000
2013 2014 2015 2016
Interbody Device ASPs, by Facility
Type, 2013-2016
Health System Hospital ASC

KEY INSIGHT:
Pricing strategies in ASCs are often not as established as
in the hospital space

Hospital care and ASC care are undeniably
intertwined, and the coevolution of these
two sites of service will address orthopedic
patient needs in both unique and
overlapping ways for years to come.
KEY TAKE AWAYS
INNOVATE
INFORM PRICING AND
MARKETING
STRATEGY
UNDERSTAND
VARIABILITY
CAPITALIZE ON
INGENUITY
PAGE 27 BECKER’S

Please Don’t Hesitate.
QUESTIONS?

For Your Precious Time and Attention.
THANK YOU