What savvy investors are buying - presentation
33
HOT STOCKS: WHAT SAVVY INVESTORS ARE BUYING ASX INVESTOR DAY Date Month 2018 | Gemma Dale, nabtrade
Transcript of What savvy investors are buying - presentation
HOT STOCKS:WHAT SAVVY INVESTORS ARE BUYINGASX INVESTOR DAY
Date Month 2018 | Gemma Dale, nabtrade
DISCLAIMER
2
This presentation in general in nature. You should seek specialist financial advice if you would like advice relating to your circumstances.
NAB is not a registered tax agent.
AGENDA
WHAT DO RETAIL INVESTORS REALLY HOLD?
ATO SMSF data (relative performance)
ASX investor survey
Investment trends
nabtrade portfolio data
Major trends and themes- Current performance- Growth potential
Where do you want your money invested?
How to access these investments without leaving the ASX
WHERE IS THE SMART MONEY GOING?
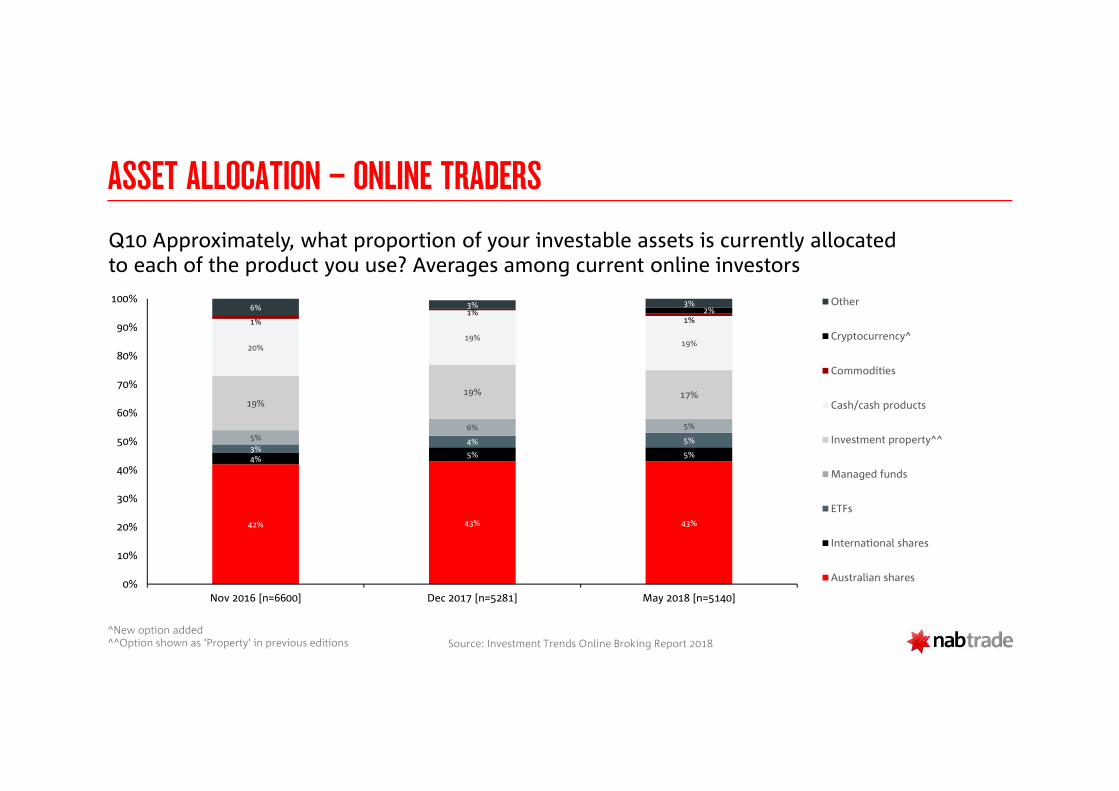
ASSET ALLOCATION – ONLINE TRADERS
Q10 Approximately, what proportion of your investable assets is currently allocated to each of the product you use? Averages among current online investors
42% 43% 43%
4%5% 5%
3%4% 5%5%6% 5%
19%19% 17%
20%19%
19%
1%1%
1%2%6% 3% 3%
0%
10%
20%
30%
40%
50%
60%
70%
80%
90%
100%
Nov 2016 [n=6600] Dec 2017 [n=5281] May 2018 [n=5140]
Other
Cryptocurrency^
Commodities
Cash/cash products
Investment property^^
Managed funds
ETFs
International shares
Australian shares
Source: Investment Trends Online Broking Report 2018
^New option added^^Option shown as ‘Property’ in previous editions
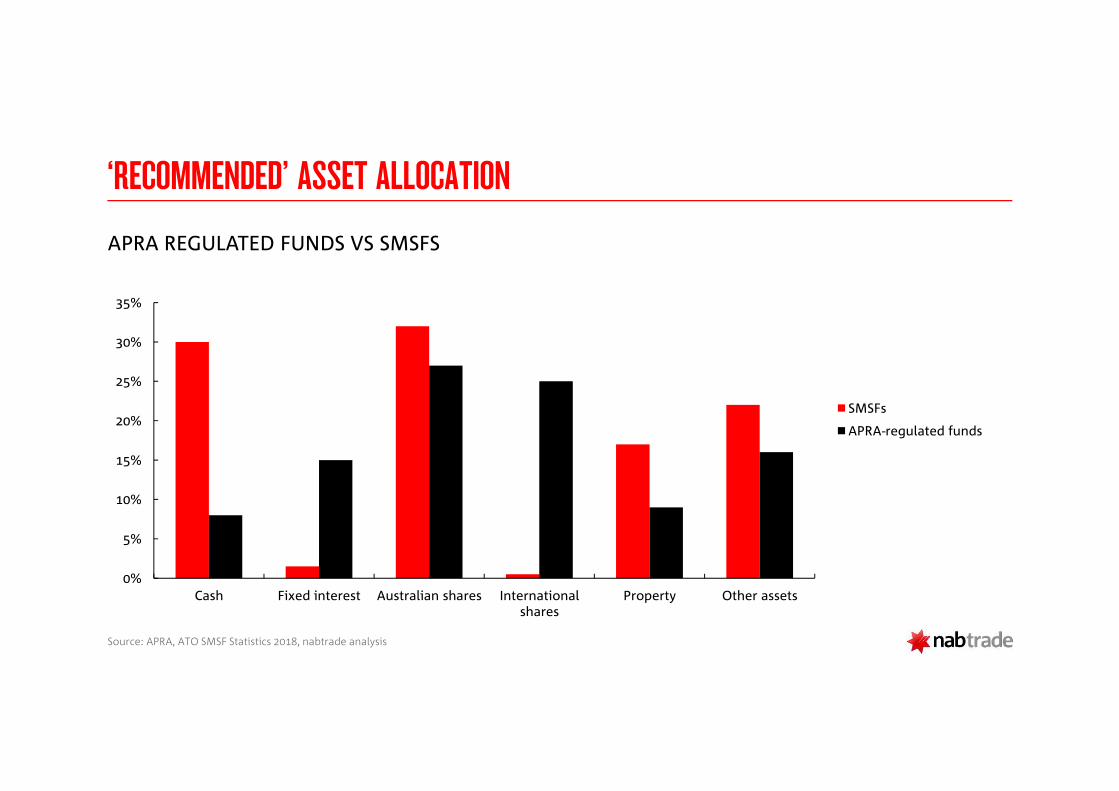
‘RECOMMENDED’ ASSET ALLOCATION
0%
5%
10%
15%
20%
25%
30%
35%
Cash Fixed interest Australian shares Internationalshares
Property Other assets
SMSFs
APRA-regulated funds
Source: APRA, ATO SMSF Statistics 2018, nabtrade analysis
APRA REGULATED FUNDS VS SMSFS
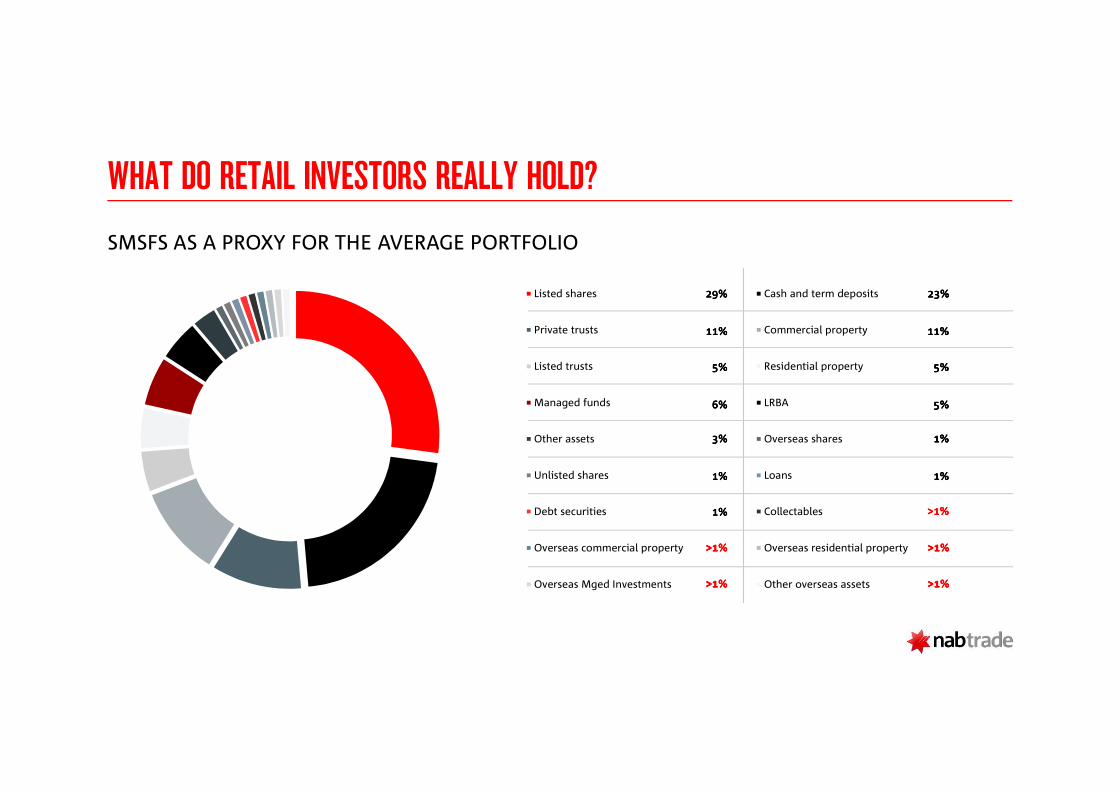
WHAT DO RETAIL INVESTORS REALLY HOLD?
Listed shares Cash and term deposits
Private trusts Commercial property
Listed trusts Residential property
Managed funds LRBA
Other assets Overseas shares
Unlisted shares Loans
Debt securities Collectables
Overseas commercial property Overseas residential property
Overseas Mged Investments Other overseas assets
SMSFS AS A PROXY FOR THE AVERAGE PORTFOLIO
29%29%29%29%
>1>1>1>1%%%%
23%23%23%23%
>1>1>1>1%%%%
11%11%11%11%
5%5%5%5%
6%6%6%6%
3%3%3%3%
1%1%1%1%
1%1%1%1%
>1>1>1>1%%%%
11%11%11%11%
5%5%5%5%
5%5%5%5%
1%1%1%1%
1%1%1%1%
>1%>1%>1%>1%
>1>1>1>1%%%%
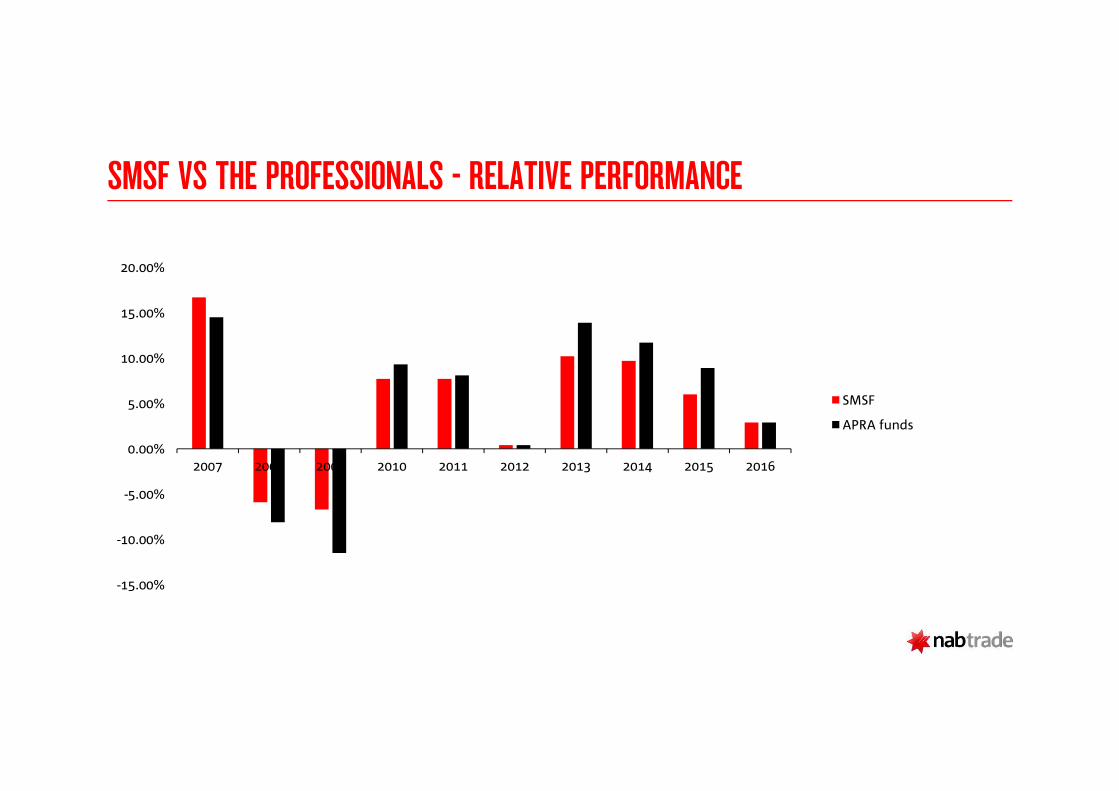
SMSF VS THE PROFESSIONALS - RELATIVE PERFORMANCE
-15.00%
-10.00%
-5.00%
0.00%
5.00%
10.00%
15.00%
20.00%
2007 2008 2009 2010 2011 2012 2013 2014 2015 2016
SMSF
APRA funds
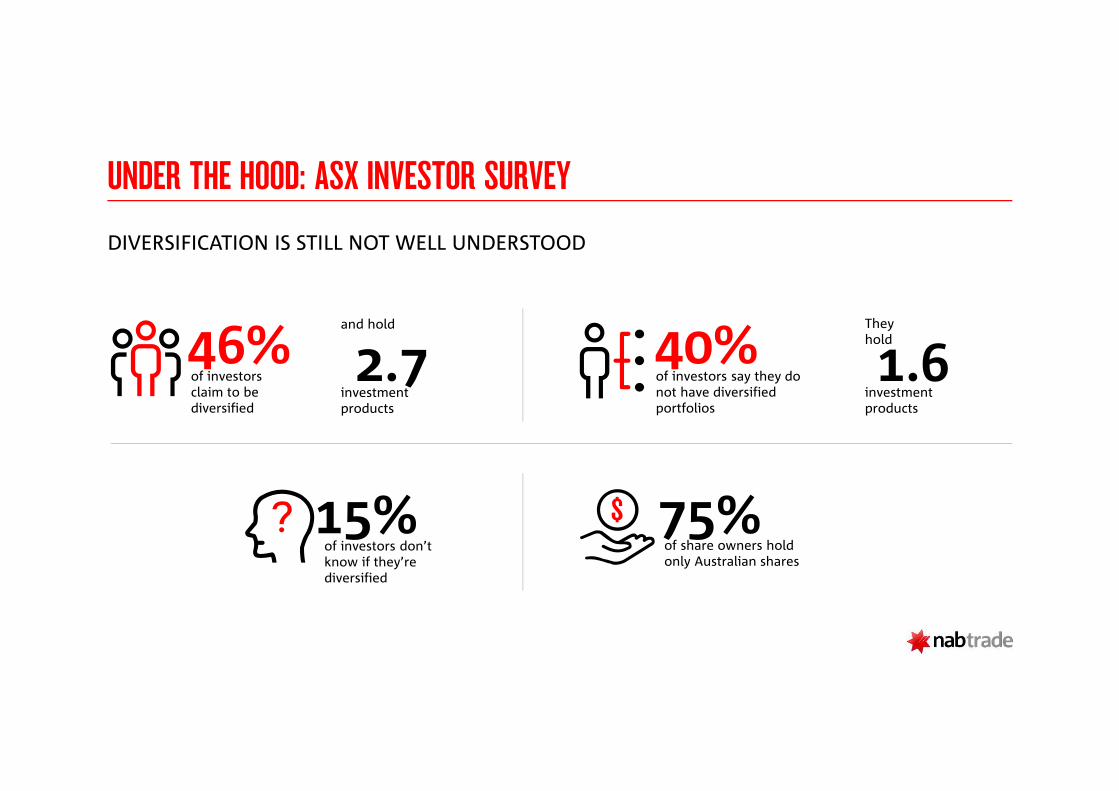
UNDER THE HOOD: ASX INVESTOR SURVEY
DIVERSIFICATION IS STILL NOT WELL UNDERSTOOD
46%of investors claim to be diversified
2.7investment products
and hold
40%of investors say they do not have diversified portfolios
1.6investment products
They hold
15%of investors don’t know if they’re diversified
75%of share owners hold only Australian shares
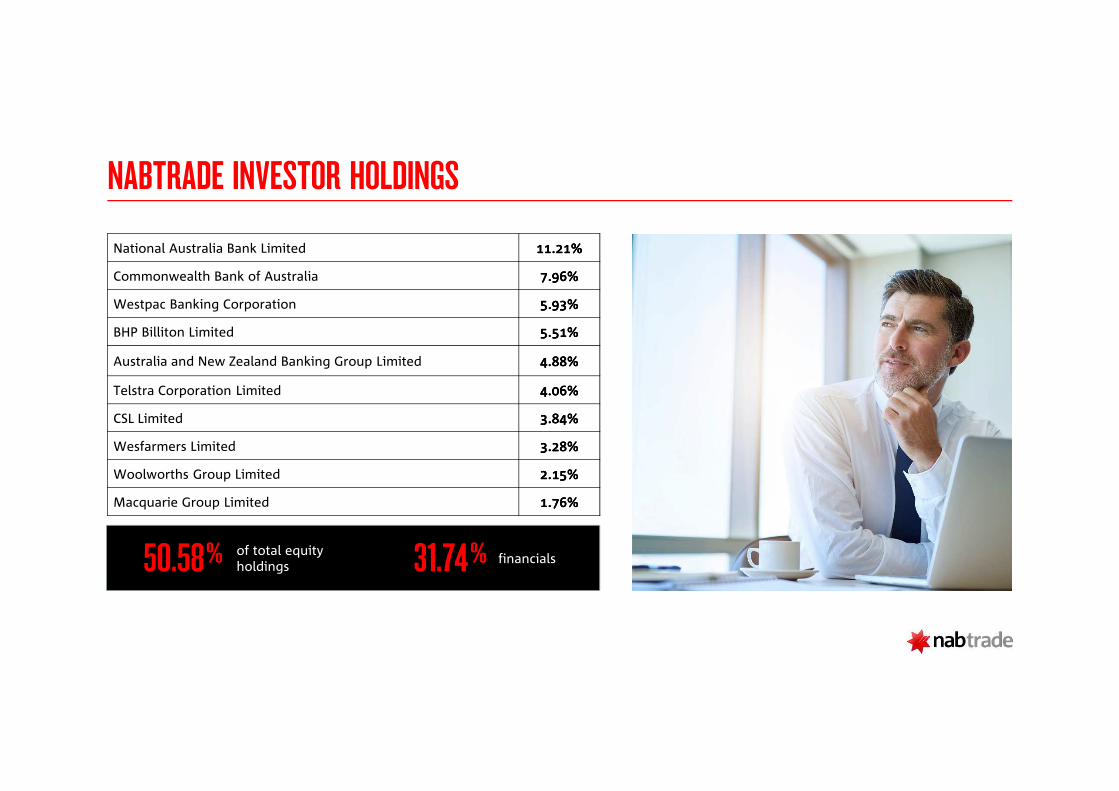
NABTRADE INVESTOR HOLDINGS
National Australia Bank Limited 11.21%11.21%11.21%11.21%
Commonwealth Bank of Australia 7.96%7.96%7.96%7.96%
Westpac Banking Corporation 5.93%5.93%5.93%5.93%
BHP Billiton Limited 5.51%5.51%5.51%5.51%
Australia and New Zealand Banking Group Limited 4.88%4.88%4.88%4.88%
Telstra Corporation Limited 4.06%4.06%4.06%4.06%
CSL Limited 3.84%3.84%3.84%3.84%
Wesfarmers Limited 3.28%3.28%3.28%3.28%
Woolworths Group Limited 2.15%2.15%2.15%2.15%
Macquarie Group Limited 1.76%1.76%1.76%1.76%
50.58 of total equity holdings 31.74 financials% %
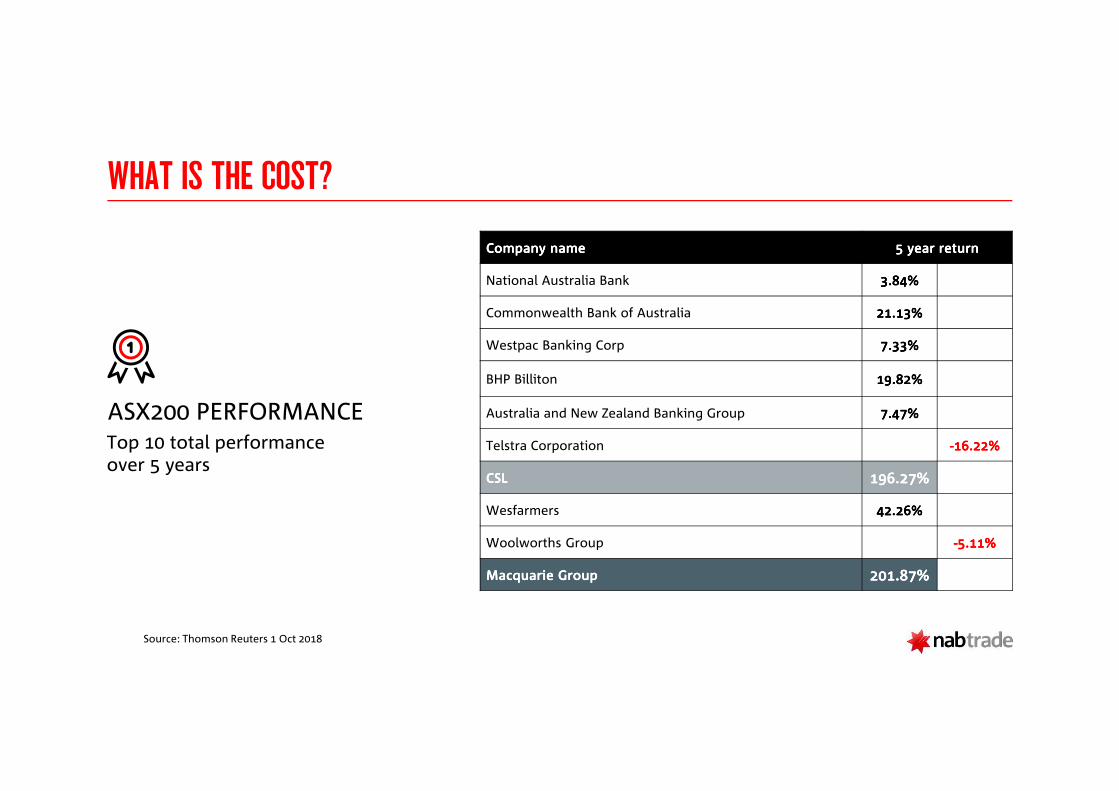
WHAT IS THE COST?
Top 10 total performance over 5 years
Company nameCompany nameCompany nameCompany name 5 year return5 year return5 year return5 year return
National Australia Bank 3.84%3.84%3.84%3.84%
Commonwealth Bank of Australia 21.13%21.13%21.13%21.13%
Westpac Banking Corp 7.33%7.33%7.33%7.33%
BHP Billiton 19.82%19.82%19.82%19.82%
Australia and New Zealand Banking Group 7.47%7.47%7.47%7.47%
Telstra Corporation ----16.22%16.22%16.22%16.22%
CSL CSL CSL CSL 196.27%196.27%196.27%196.27%
Wesfarmers 42.26%42.26%42.26%42.26%
Woolworths Group ----5.11%5.11%5.11%5.11%
Macquarie Group Macquarie Group Macquarie Group Macquarie Group 201.87%201.87%201.87%201.87%
ASX200 PERFORMANCE
Source: Thomson Reuters 1 Oct 2018
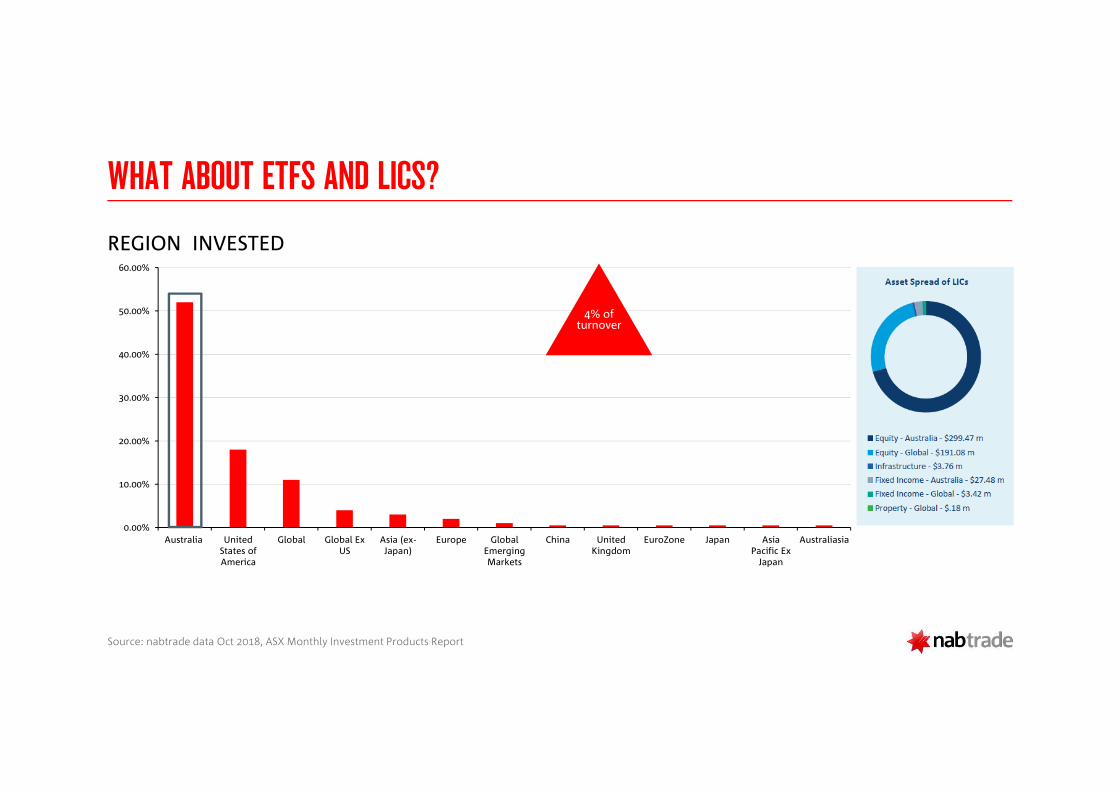
WHAT ABOUT ETFS AND LICS?
0.00%
10.00%
20.00%
30.00%
40.00%
50.00%
60.00%
Australia UnitedStates ofAmerica
Global Global ExUS
Asia (ex-Japan)
Europe GlobalEmergingMarkets
China UnitedKingdom
EuroZone Japan AsiaPacific ExJapan
Australiasia
4% of turnover
Source: nabtrade data Oct 2018, ASX Monthly Investment Products Report
REGION INVESTED
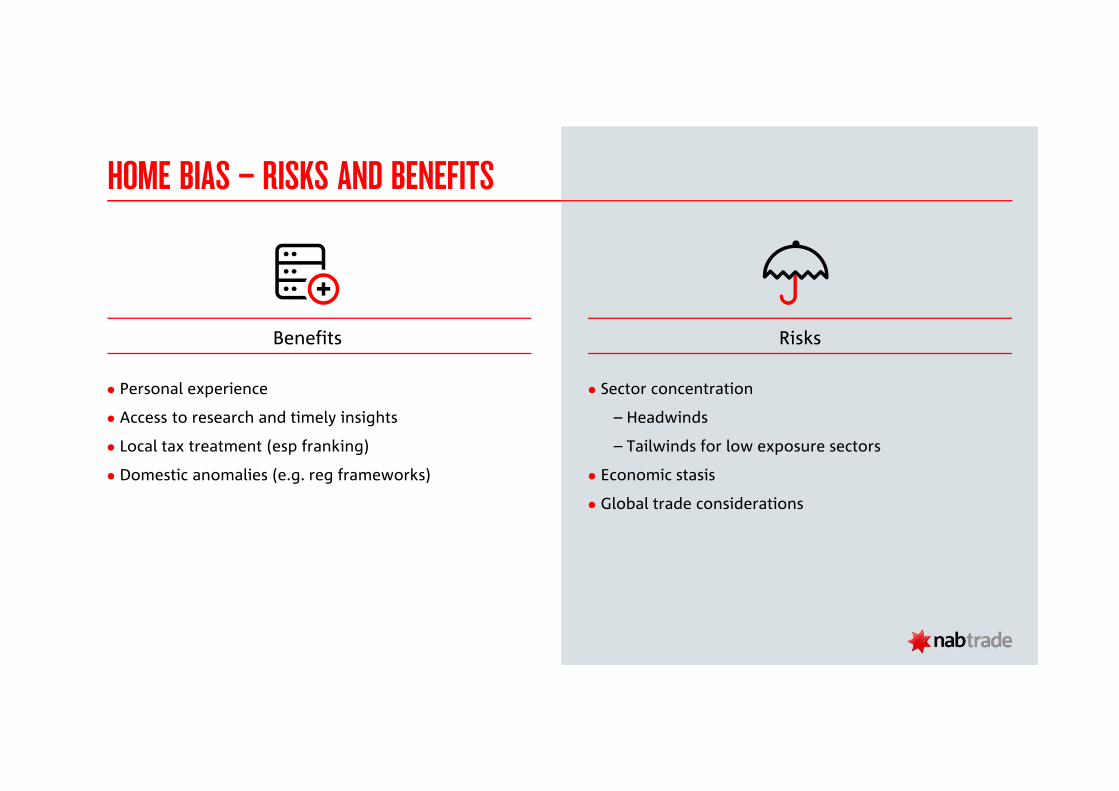
Benefits Risks
HOME BIAS – RISKS AND BENEFITS
� Personal experience
� Access to research and timely insights
� Local tax treatment (esp franking)
� Domestic anomalies (e.g. reg frameworks)
� Sector concentration
– Headwinds
– Tailwinds for low exposure sectors
� Economic stasis
� Global trade considerations
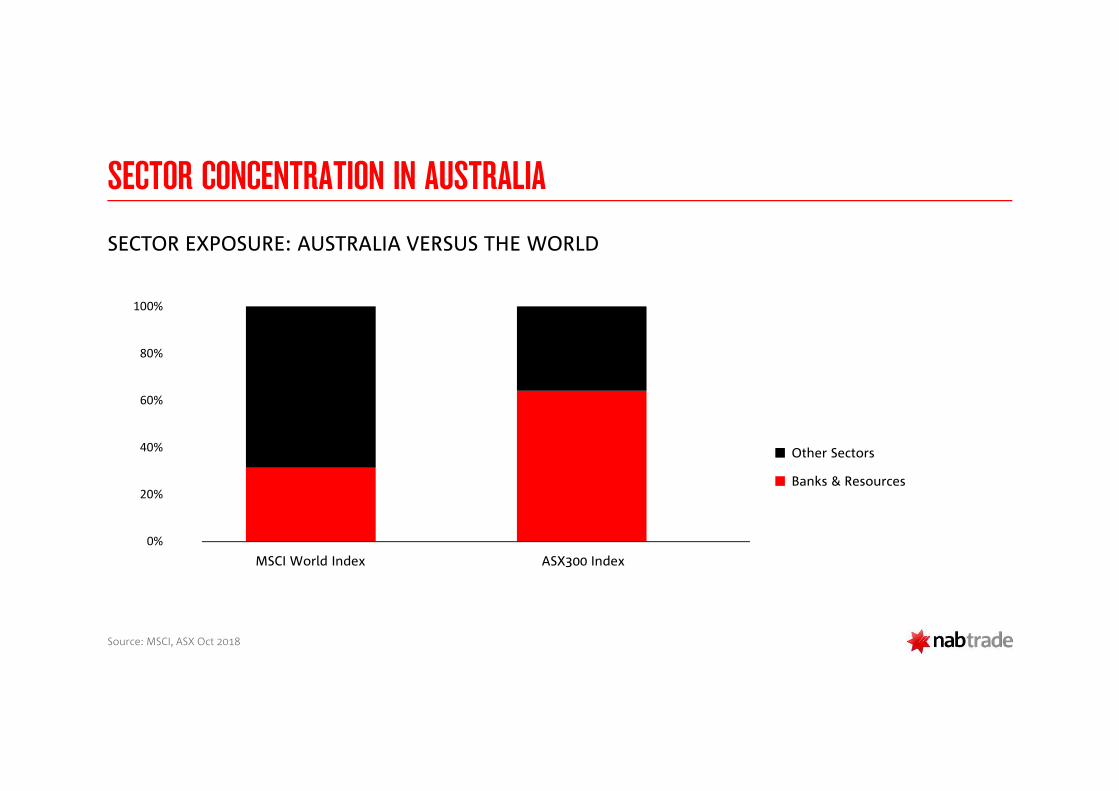
SECTOR CONCENTRATION IN AUSTRALIA
Source: MSCI, ASX Oct 2018
SECTOR EXPOSURE: AUSTRALIA VERSUS THE WORLD
0%
20%
40%
60%
80%
100%
MSCI World Index ASX300 Index
Other Sectors
Banks & Resources
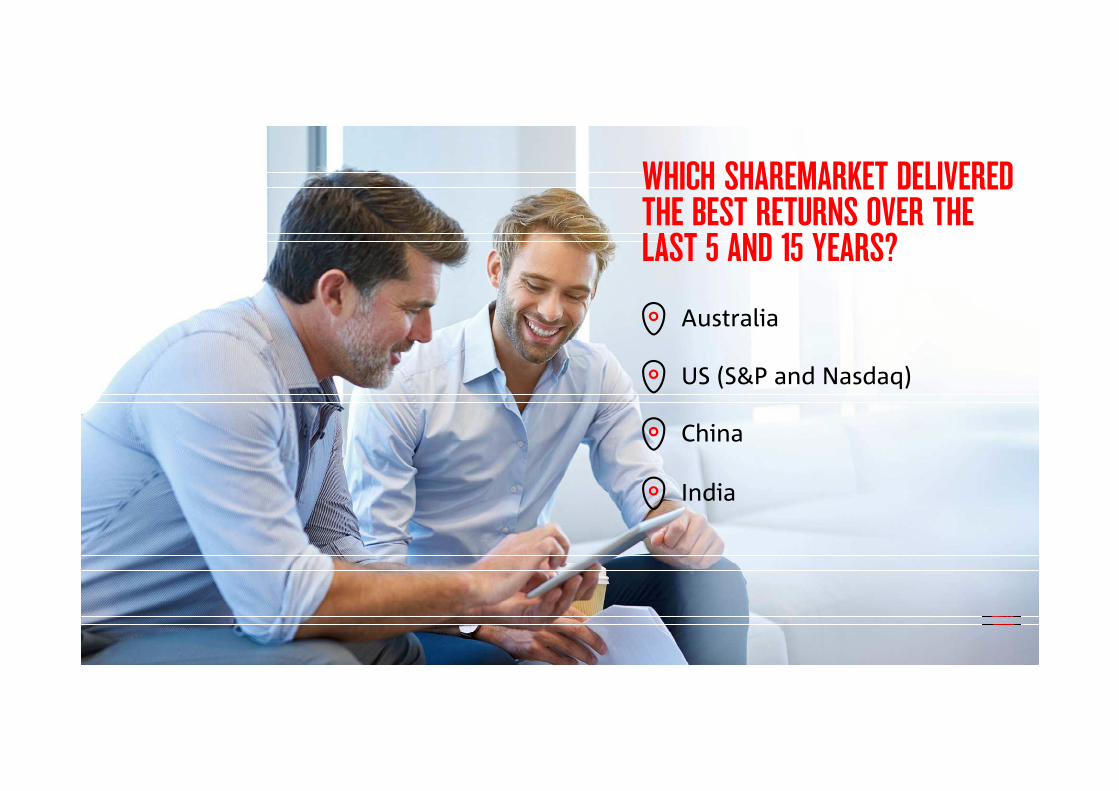
WHICH SHAREMARKET DELIVERED THE BEST RETURNS OVER THE LAST 5 AND 15 YEARS?
Australia
US (S&P and Nasdaq)
China
India
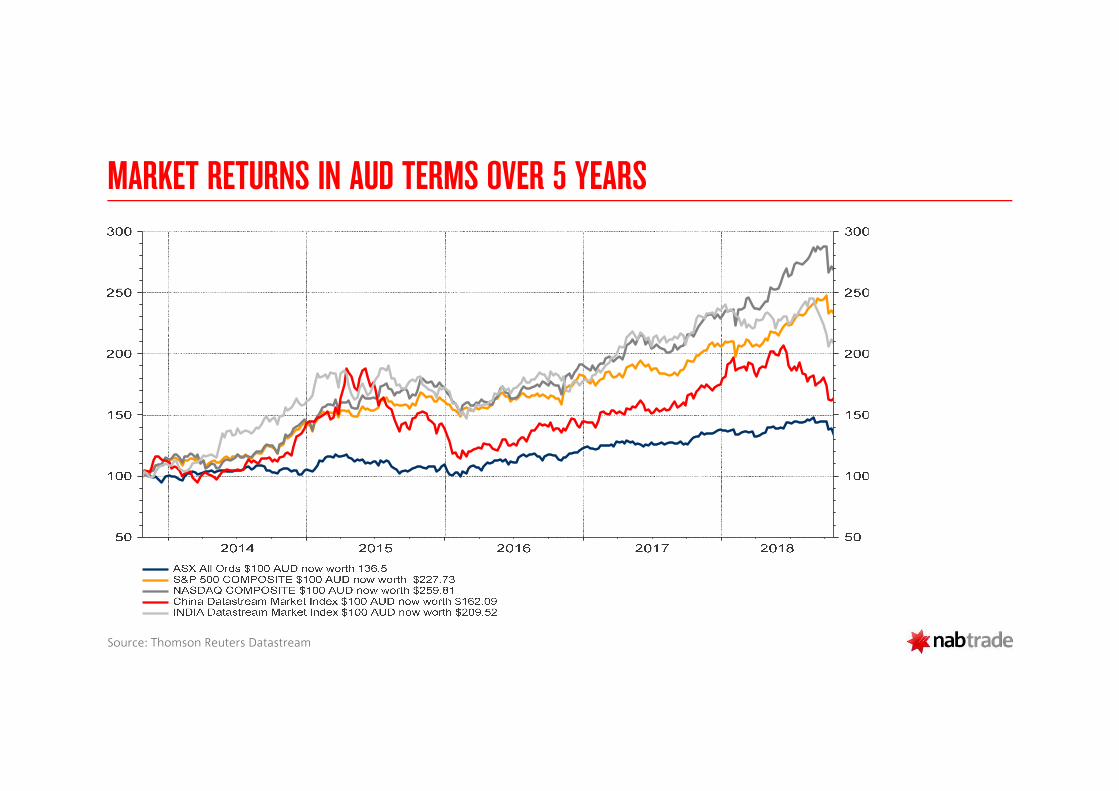
MARKET RETURNS IN AUD TERMS OVER 5 YEARS
Source: Thomson Reuters Datastream
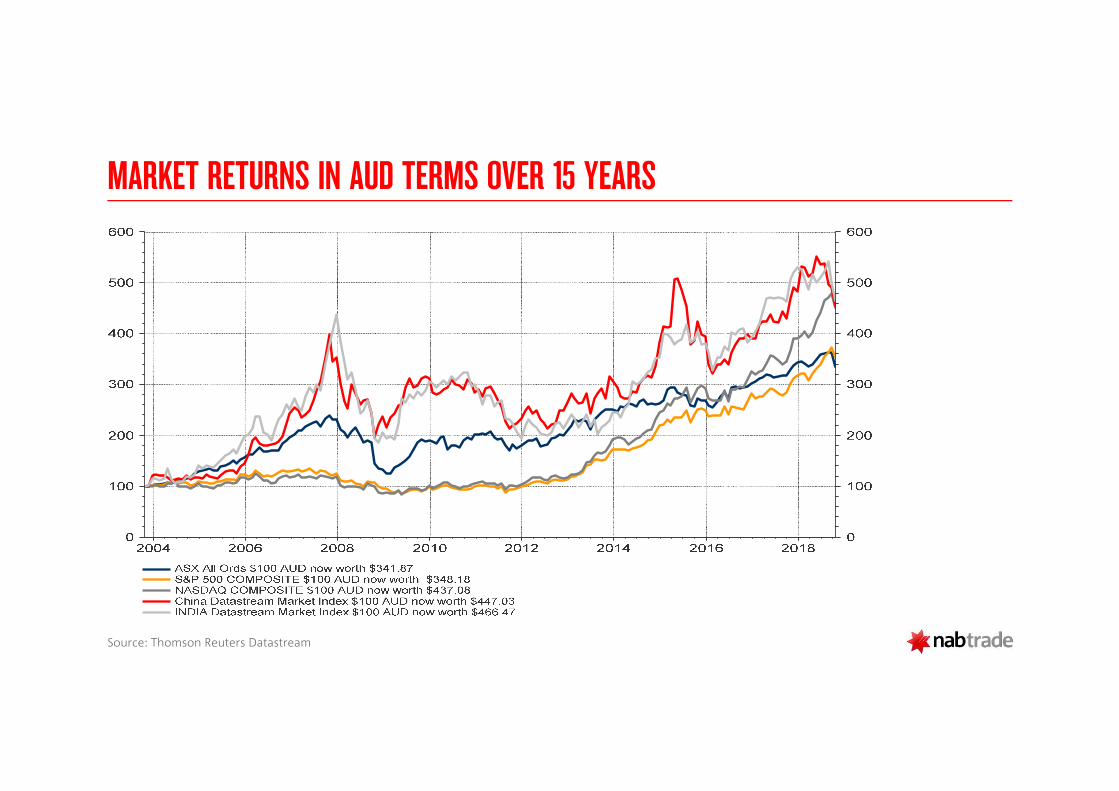
MARKET RETURNS IN AUD TERMS OVER 15 YEARS
Source: Thomson Reuters Datastream
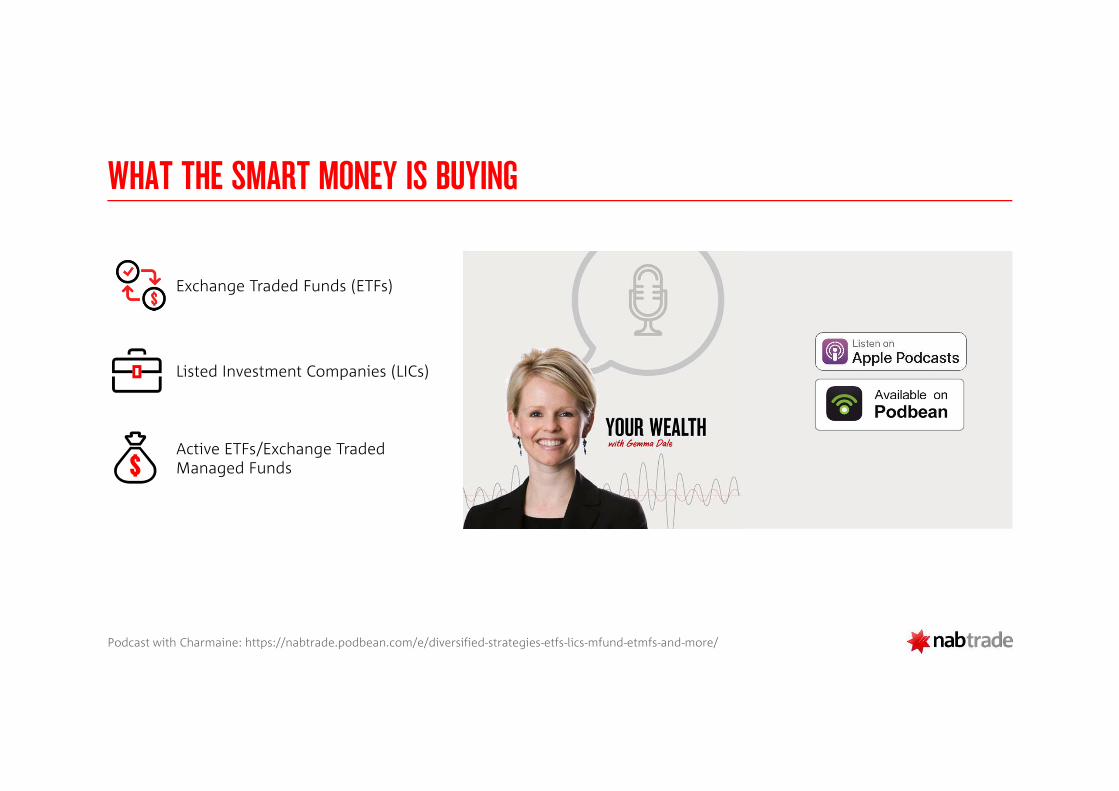
WHAT THE SMART MONEY IS BUYING
Exchange Traded Funds (ETFs)
Listed Investment Companies (LICs)
Active ETFs/Exchange Traded Managed Funds
Podcast with Charmaine: https://nabtrade.podbean.com/e/diversified-strategies-etfs-lics-mfund-etmfs-and-more/
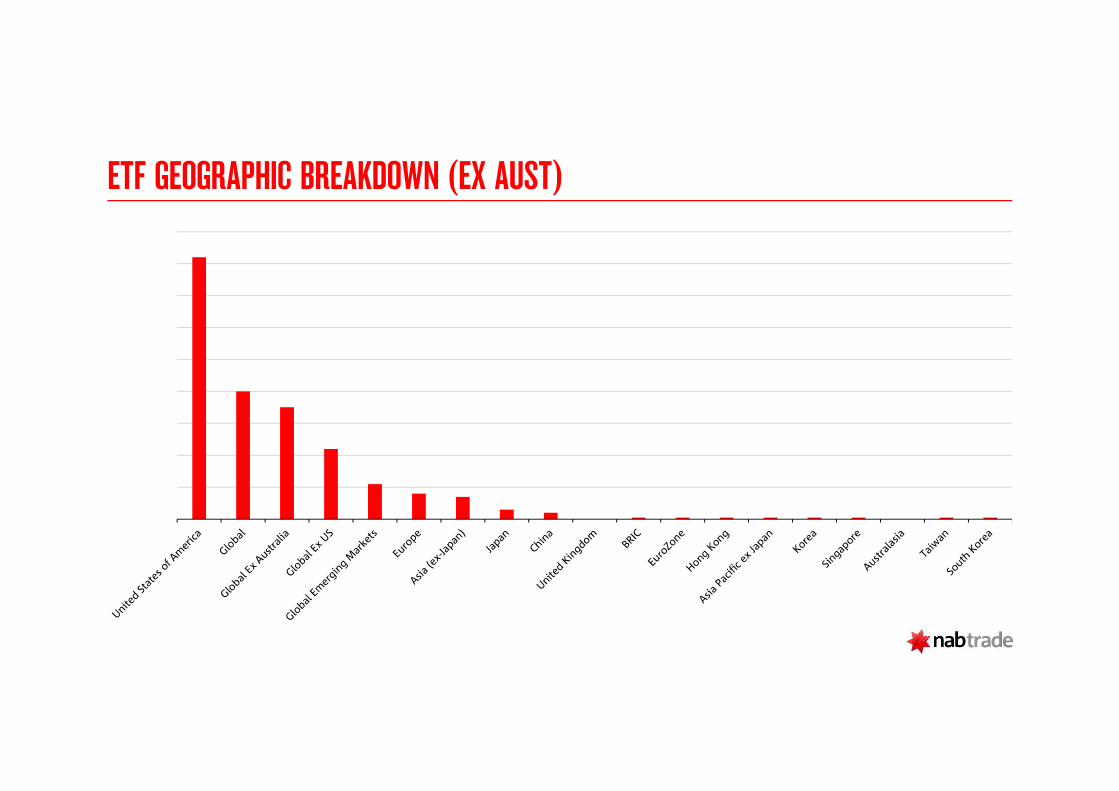
ETF GEOGRAPHIC BREAKDOWN (EX AUST)
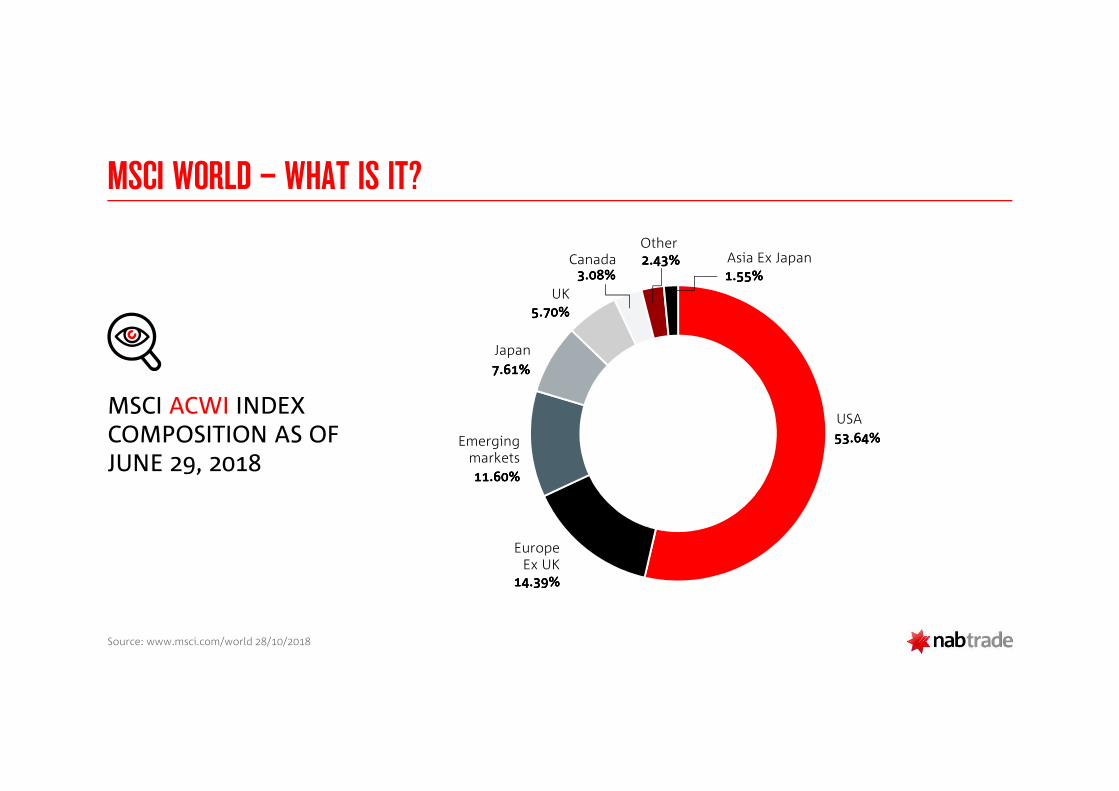
MSCI WORLD – WHAT IS IT?
Source: www.msci.com/world 28/10/2018
53.64%53.64%53.64%53.64%
14.39%14.39%14.39%14.39%
11.60%11.60%11.60%11.60%
7.61%7.61%7.61%7.61%
5.70%5.70%5.70%5.70%
3.08%3.08%3.08%3.08%2.43%2.43%2.43%2.43%
1.55%1.55%1.55%1.55%
USA
Europe Ex UK
Emerging markets
Japan
UK
CanadaOther
Asia Ex Japan
MSCI ACWI INDEX COMPOSITION AS OF JUNE 29, 2018
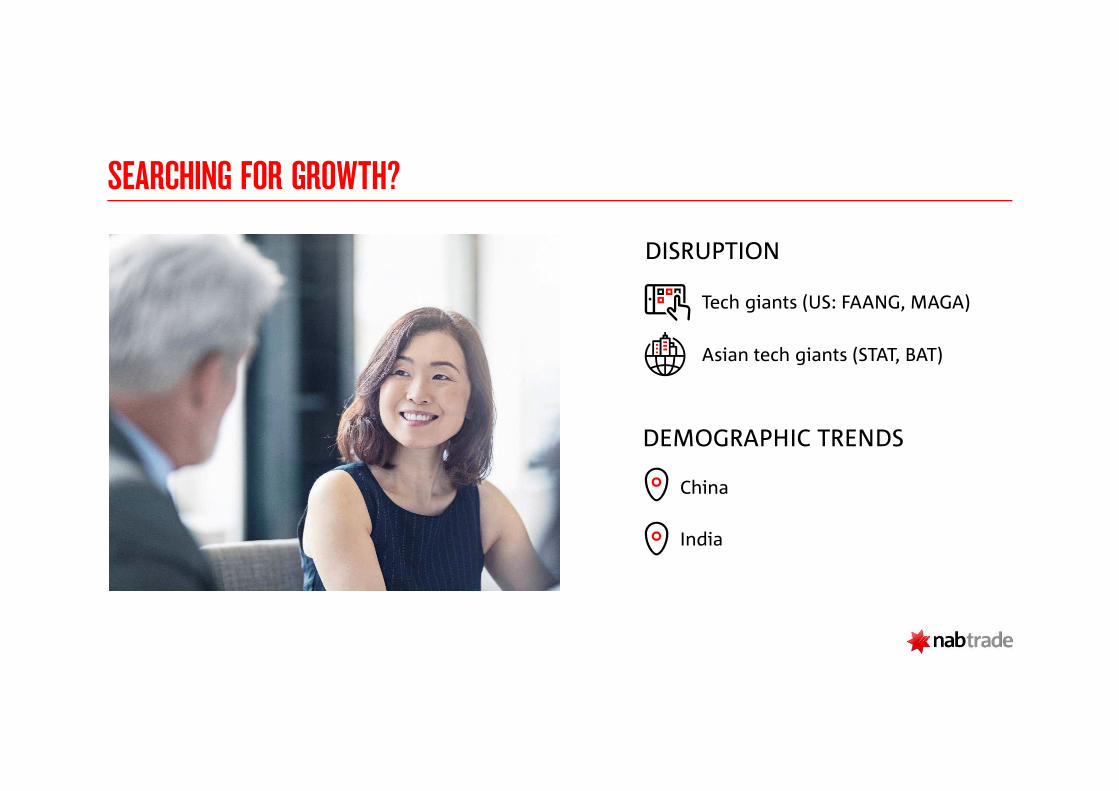
SEARCHING FOR GROWTH?
DEMOGRAPHIC TRENDS
DISRUPTION
Asian tech giants (STAT, BAT)
India
China
Tech giants (US: FAANG, MAGA)
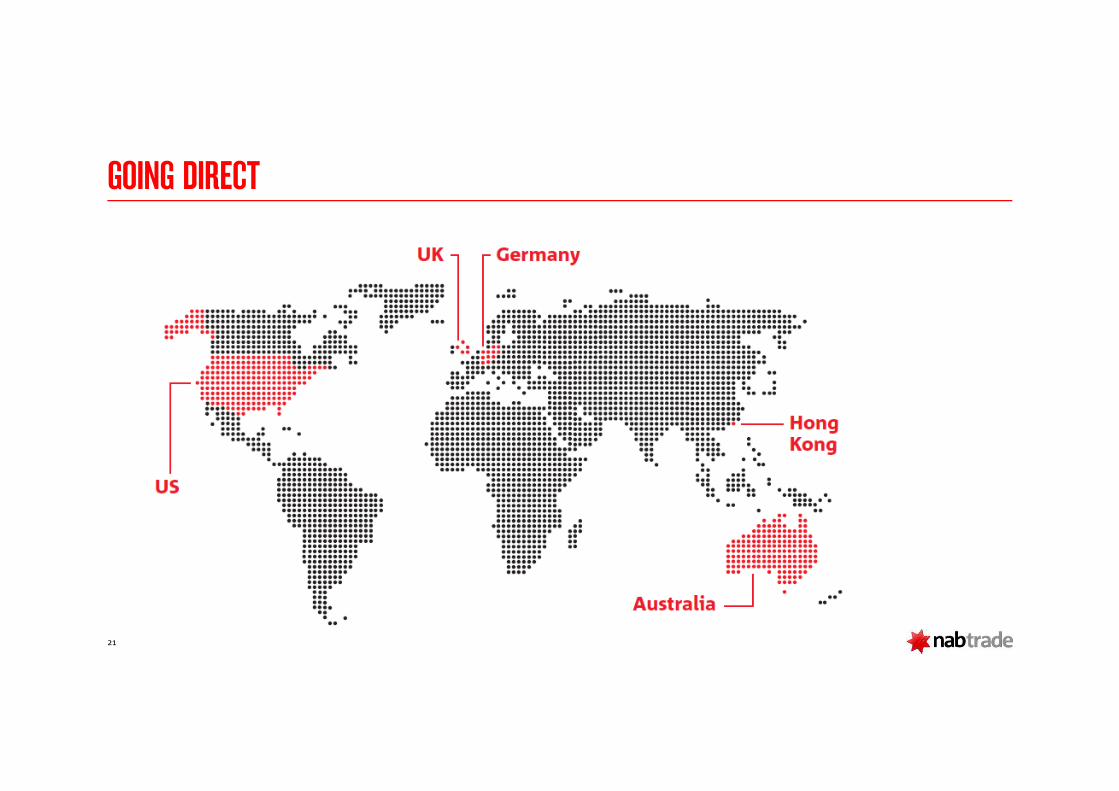
GOING DIRECT
21
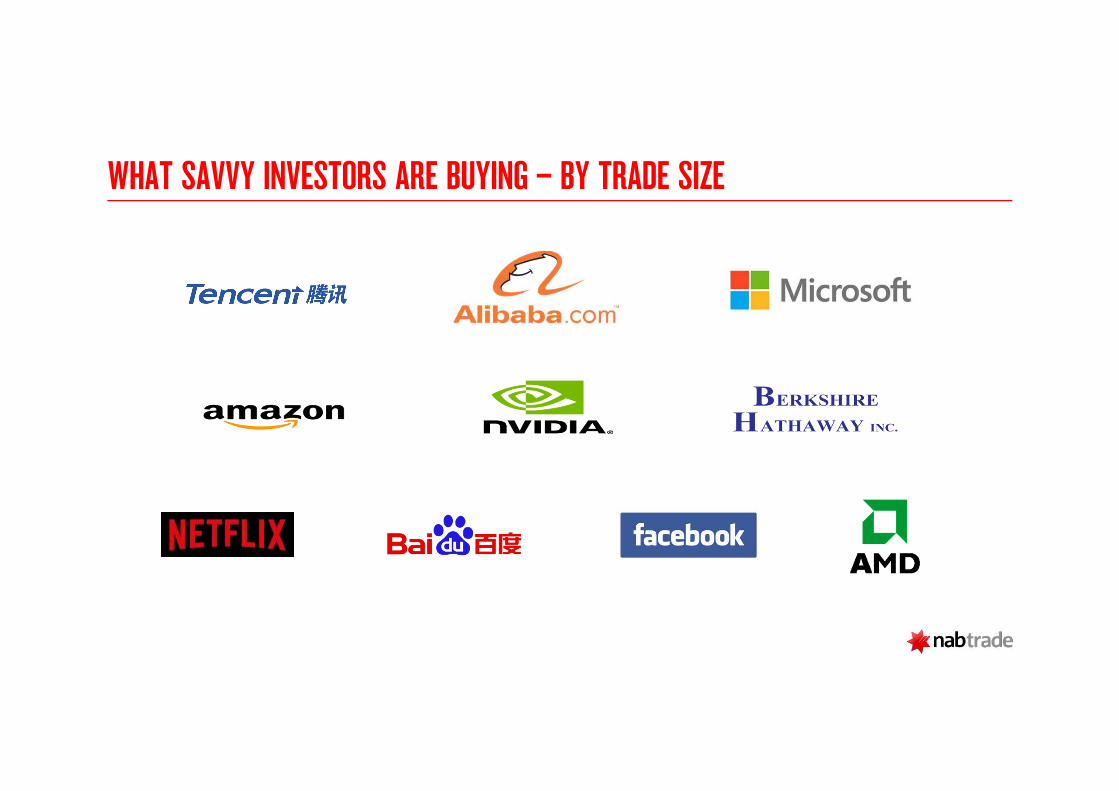
WHAT SAVVY INVESTORS ARE BUYING – BY TRADE SIZE
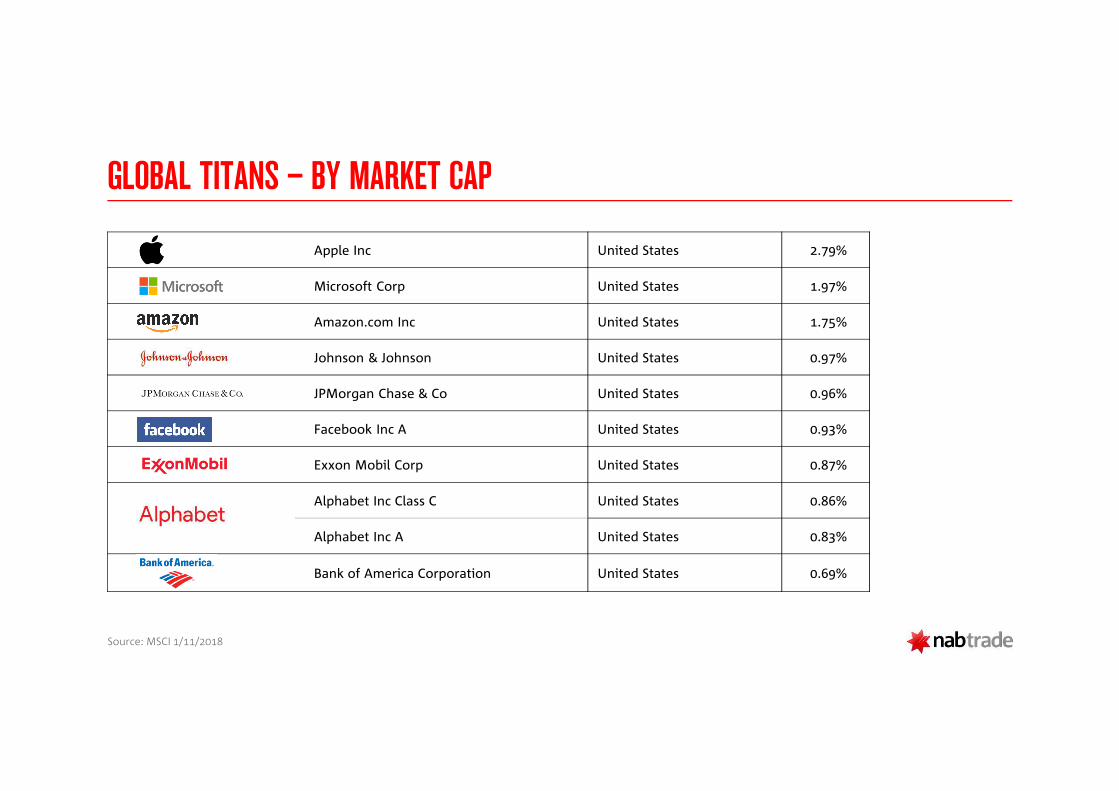
GLOBAL TITANS – BY MARKET CAP
Apple Inc United States 2.79%
Microsoft Corp United States 1.97%
Amazon.com Inc United States 1.75%
Johnson & Johnson United States 0.97%
JPMorgan Chase & Co United States 0.96%
Facebook Inc A United States 0.93%
Exxon Mobil Corp United States 0.87%
Alphabet Inc Class C United States 0.86%
Alphabet Inc A United States 0.83%
Bank of America Corporation United States 0.69%
Source: MSCI 1/11/2018
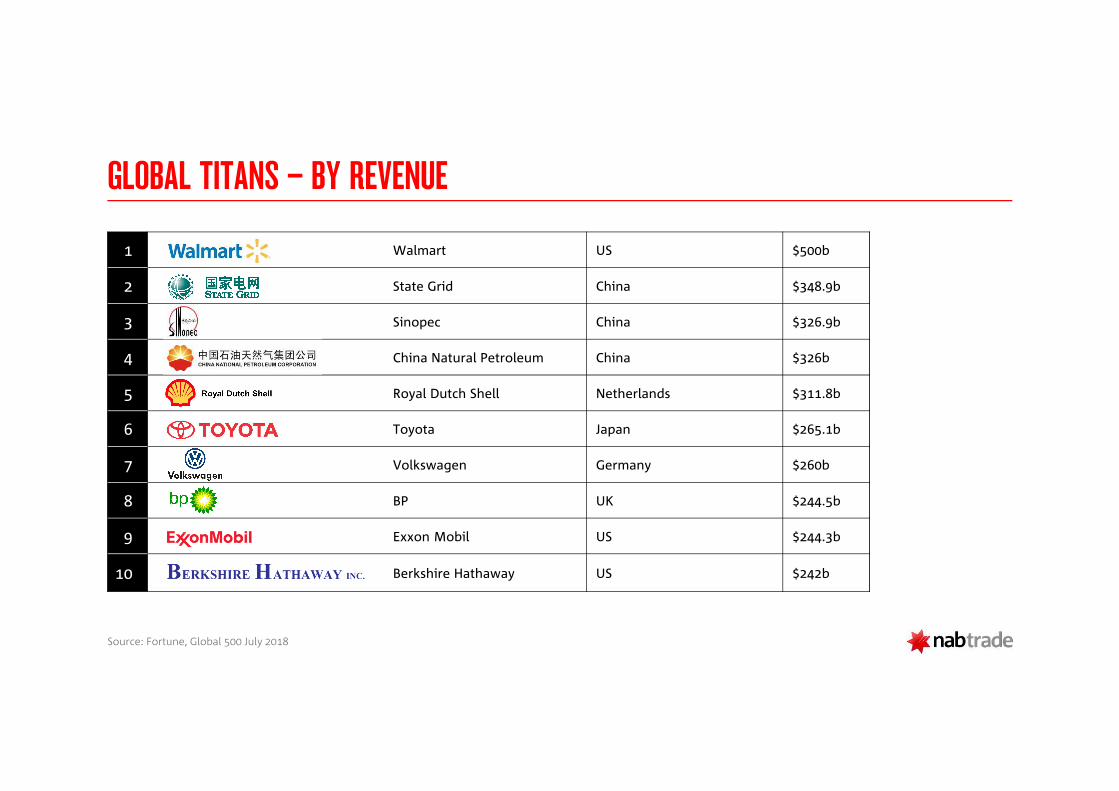
GLOBAL TITANS – BY REVENUE
1 Walmart US $500b
2 State Grid China $348.9b
3 Sinopec China $326.9b
4 China Natural Petroleum China $326b
5 Royal Dutch Shell Netherlands $311.8b
6 Toyota Japan $265.1b
7 Volkswagen Germany $260b
8 BP UK $244.5b
9 Exxon Mobil US $244.3b
10 Berkshire Hathaway US $242b
Source: Fortune, Global 500 July 2018
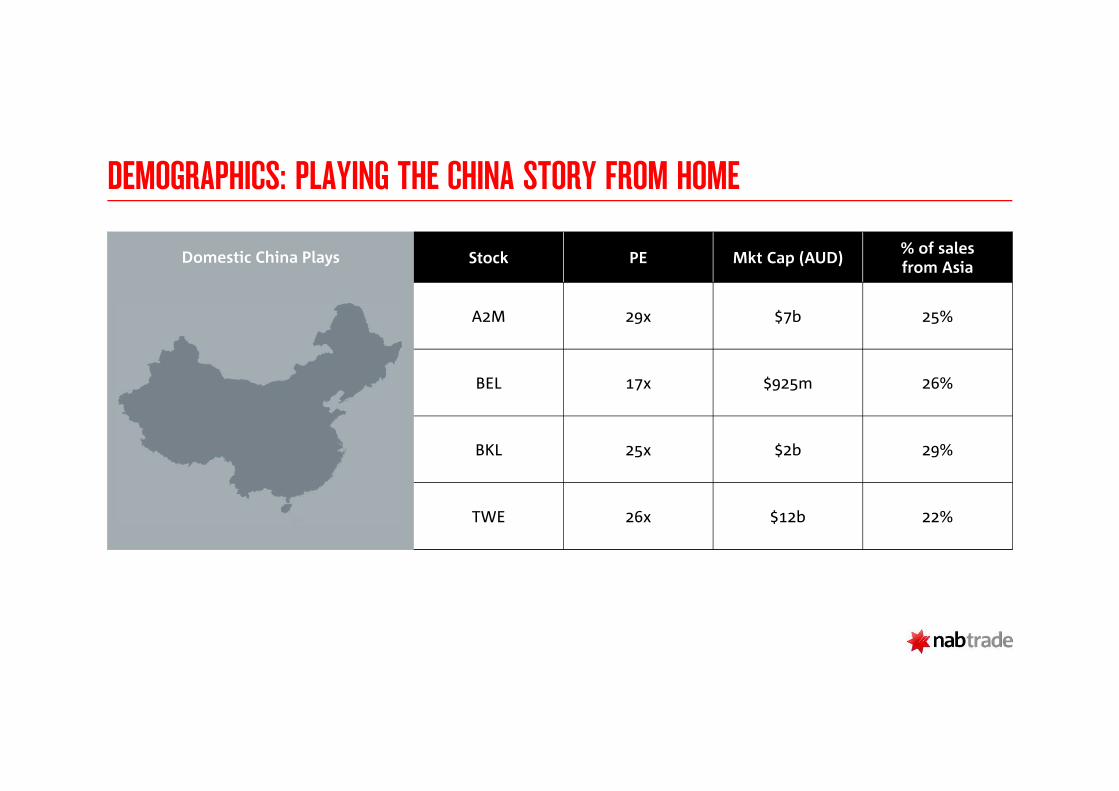
DEMOGRAPHICS: PLAYING THE CHINA STORY FROM HOME
Domestic China Plays Stock PE Mkt Cap (AUD)% of salesfrom Asia
A2M 29x $7b 25%
BEL 17x $925m 26%
BKL 25x $2b 29%
TWE 26x $12b 22%
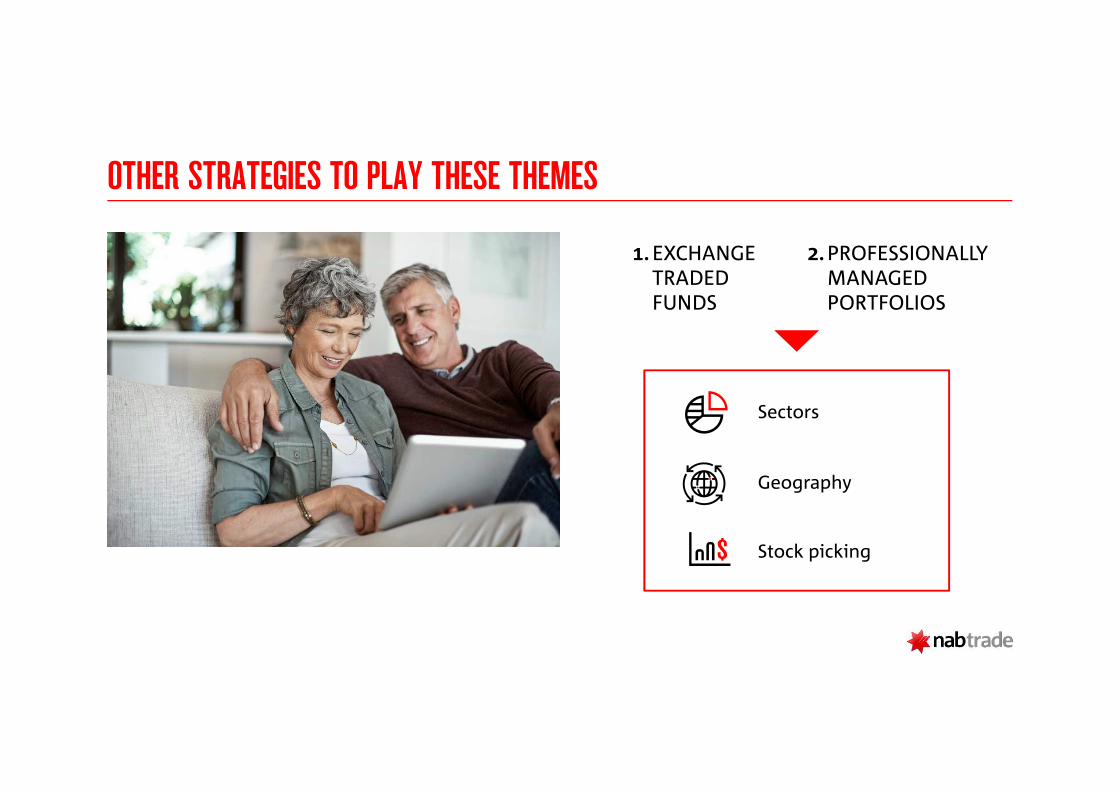
OTHER STRATEGIES TO PLAY THESE THEMES
EXCHANGE TRADED FUNDS
1. PROFESSIONALLY MANAGED PORTFOLIOS
2.
Sectors
Geography
Stock picking
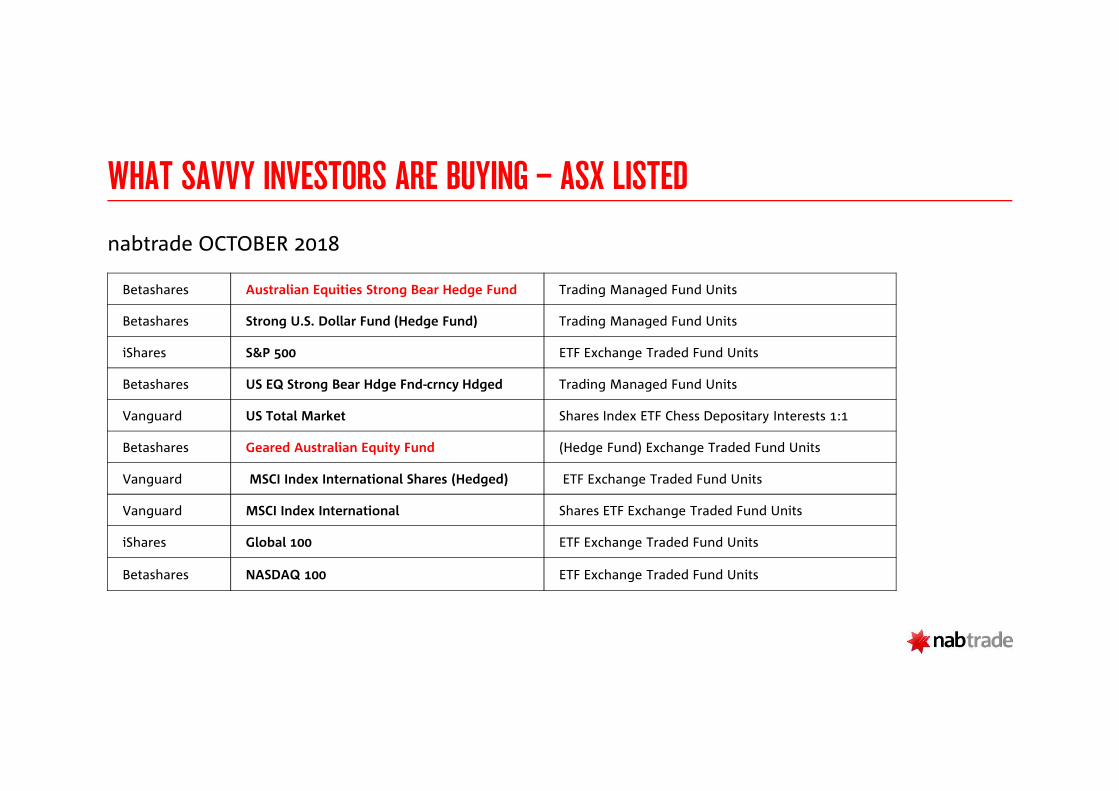
WHAT SAVVY INVESTORS ARE BUYING – ASX LISTED
nabtrade OCTOBER 2018
Betashares Australian Equities Strong Bear Hedge Fund Trading Managed Fund Units
Betashares Strong U.S. Dollar Fund (Hedge Fund) Trading Managed Fund Units
iShares S&P 500 ETF Exchange Traded Fund Units
Betashares US EQ Strong Bear Hdge Fnd-crncy Hdged Trading Managed Fund Units
Vanguard US Total Market Shares Index ETF Chess Depositary Interests 1:1
Betashares Geared Australian Equity Fund (Hedge Fund) Exchange Traded Fund Units
Vanguard MSCI Index International Shares (Hedged) ETF Exchange Traded Fund Units
Vanguard MSCI Index International Shares ETF Exchange Traded Fund Units
iShares Global 100 ETF Exchange Traded Fund Units
Betashares NASDAQ 100 ETF Exchange Traded Fund Units
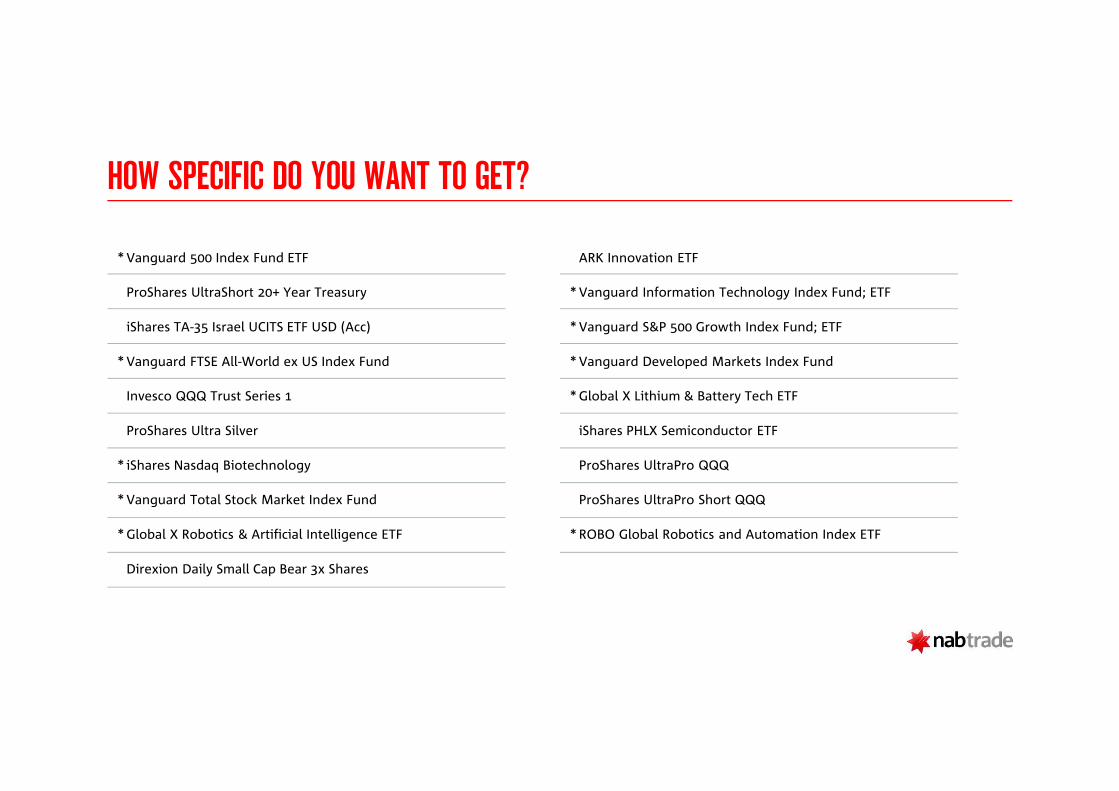
HOW SPECIFIC DO YOU WANT TO GET?
*Vanguard 500 Index Fund ETF
ProShares UltraShort 20+ Year Treasury
iShares TA-35 Israel UCITS ETF USD (Acc)
*Vanguard FTSE All-World ex US Index Fund
Invesco QQQ Trust Series 1
ProShares Ultra Silver
* iShares Nasdaq Biotechnology
*Vanguard Total Stock Market Index Fund
*Global X Robotics & Artificial Intelligence ETF
Direxion Daily Small Cap Bear 3x Shares
ARK Innovation ETF
*Vanguard Information Technology Index Fund; ETF
*Vanguard S&P 500 Growth Index Fund; ETF
*Vanguard Developed Markets Index Fund
*Global X Lithium & Battery Tech ETF
iShares PHLX Semiconductor ETF
ProShares UltraPro QQQ
ProShares UltraPro Short QQQ
*ROBO Global Robotics and Automation Index ETF
PROFESSIONALLY MANAGED PRODUCTS
…and many more
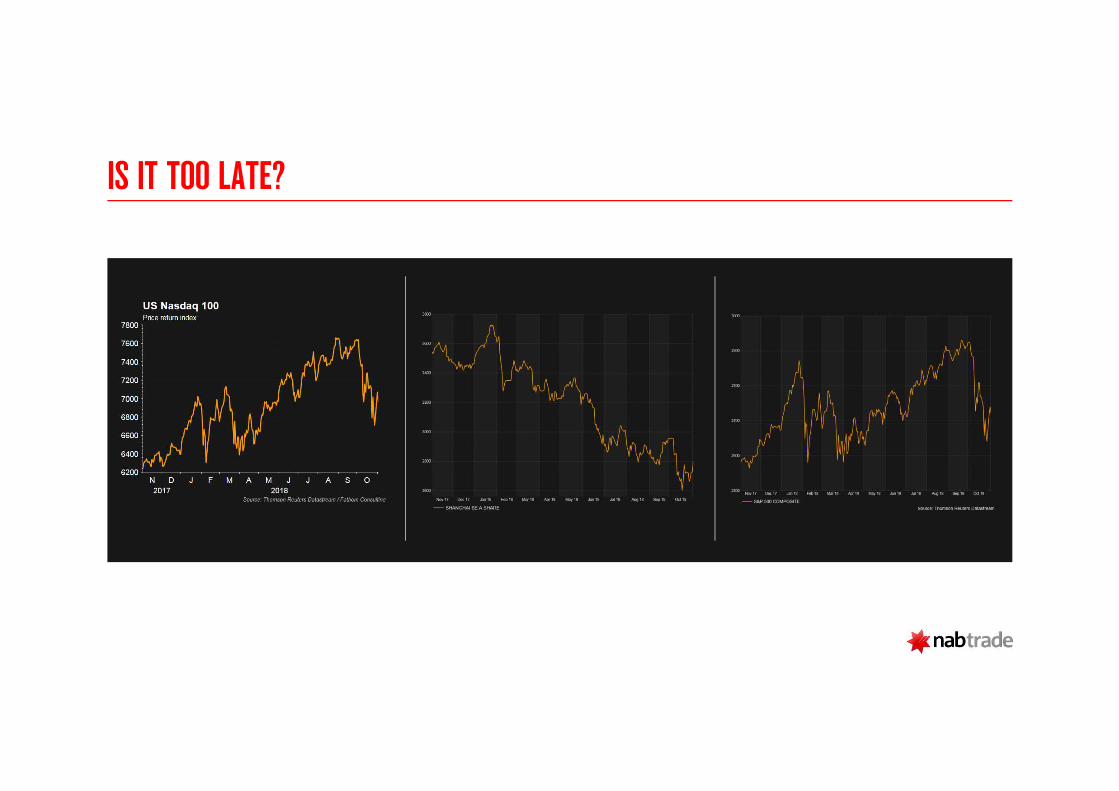
IS IT TOO LATE?
BETS AND HEDGES
Currency
Shorts and bears
Commodities
CONSIDERATIONS
� Sector concentration and biases
Fees and costs
Understand your indices!
Instrument structure
33
The nabtrade service (nabtrade) is provided by WealthHub Securities Limited ABN 83 089 718 249 AFSL No. 230704
("WealthHub Securities, us, we, our"). WealthHub Securities is a Market Participant of the Australian Securities Exchange
Limited (ASX) and Chi-X Australia Pty Ltd (Chi-X), as defined in the ASIC Market Integrity Rules, and a wholly owned
subsidiary of National Australia Bank Limited ABN 12 004 044 937 AFSL 230686 (NAB). NAB doesn't guarantee the obligations
or performance of its subsidiaries or the products or services its subsidiaries offer. Any advice contained in this presentation
has been prepared without taking into account your objectives, financial situation or needs. Before acting on any advice in
this presentation we recommend that you consider seeking professional advice or guidance when deciding on the best
superannuation solution for you. It is recommended that you also seek advice from a registered tax agent to determine the
tax implications for you. NAB is not a registered tax agent and the tax information contained on this website should not be
relied upon to determine your personal tax obligations.