What Russians think (evidence from various opinion surveys)
26
What Russians think (evidence from various opinion surveys) Ekaterina Zhuravskaya Nov 2008, New Delhi
-
Upload
beau-dixon -
Category
Documents
-
view
33 -
download
0
description
What Russians think (evidence from various opinion surveys). Ekaterina Zhuravskaya Nov 2008, New Delhi. Data. Large-scale surveys of representative samples of Russian residents RLMS (Russian Longitudinal Monitoring Survey), 10,000 respondents, Fall 2006 - PowerPoint PPT Presentation
Transcript of What Russians think (evidence from various opinion surveys)

What Russians think(evidence from various opinion surveys)
Ekaterina Zhuravskaya
Nov 2008, New Delhi

Data
• Large-scale surveys of representative samples of Russian residents• RLMS (Russian Longitudinal Monitoring Survey),
10,000 respondents, Fall 2006• EBRD Life in Transition Survey (1,000 in each
transition country, 28 transition countries) Fall 2006
• GeoRating, Public Opinion Foundation (FOM), 35,000 respondents quarterly since 2003

Overall assessment of transition

4728
4253
61
1932
22 16 12
0%
20%
40%
60%
80%
100%
1 (13-24) 2 (25-35) 3 (36-47) 4 (48-60) 5 (61-100)
worsened did not change improved
How the economic and social changes of the last 15 years affected lives of people
% of population by age quintiles
Age group:
Total population:48.7%: “worsened”, 32.3%: “did not change”, 19%: “improved”
Source: RLMS, fall 2006

25%
34%39%
42%50%51%
56%61%59%
65%
0%
10%
20%
30%
40%
50%
60%
70%
1 2 3 4 5 6 7 8 9 10
How the economic and social changes of the last 15 years affected lives of people
(Effect of income)% of population, who claim that transition worsened their lives
by income decile
The poorest 10%
The richest 10%
Source: RLMS, fall 2006

Question framed without a link to reforms gives the same picture
57%
55%
52%
19%
23%
20%
0% 10% 20% 30% 40% 50% 60%
I have done better in life than myformer colleagues in 1991
I life better now than before 1991
Most people live better now thanbefore 1991
do not agree agree
The rest of people are indifferentSource: RLMS, fall 2006
Wish for kids to grow up in the modern Russia rather than the USSR by age decile
19%24%
32%
74%80%
86%
0%10%20%30%40%50%60%70%80%90%
100%
1 2 3 4 5 6 7 8 9 10
% of population who wish for kids to grow up in the modern Russia rather than the USSR by age decile:
(13-19) (71-100)
Total population: split 50%-50%
Source: RLMS, fall 2006

Attitudes towards market economy, private property, democracy, and the West

Uniquely low support of democracy and market among transition countries
Albania
Armenia Azerbaijan
Belarus
Bosnia
Bulgaria
Croatia
Czech Rep
Estonia
FYROM
Georgia
Hungary
Kazakhstan
Kyrgystan
LatviaLithuania
Moldova
Mongolia
Montenegro
Poland
Romania
Russia
Serbia
Slovak RepSlovenia
Tajikistan
Ukraine
Uzbekistan
.4.5
.6.7
.8d
emo
crac
y_su
ppo
rt
.3 .4 .5 .6 .7market_support
Source: EBRD Life in Transition survey, fall 2006
“market economy is preferable”
“de
moc
racy
is p
refe
rabl
e”Fraction of population who agree that:

What is the best form of governance for Russia?
51
39
10
21
70
9
28
66
6
0
10
20
30
40
50
60
70
80
Democraticgovernment
Strong leader Don't know
per
cen
t 199120022005
Source: “Pew Global Attitudes” project

Price controls are immensely popular
80%
90%92%95%
50%
55%
60%
65%
70%
75%
80%
85%
90%
95%
100%
COMMUNALSERVICES
REAL ESTATE GAZ AND FUEL FOOD
% of population who think that the state rather than the market should set prices for the following goods and services:
Source: RLMS, fall 2006

State or market should provide medical care, roads, trash
collection… and employment?
5059
5045
0
10
20
30
40
50
60
70
MAINLY STATE
SUPPLYING EMPLOYMENT MEDICAL CARE
BUILDING ROADS COLLECTING TRASH
Source: RLMS, fall 2006
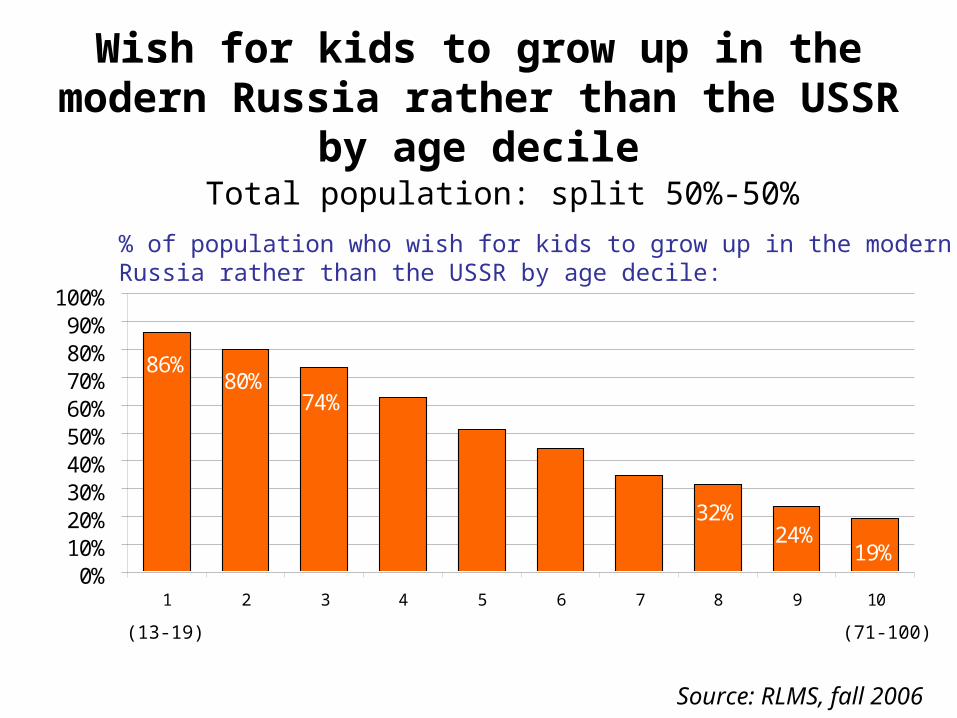
Younger people in large cities do not rely on the state to provide employment
0%
10%
20%
30%
40%
50%
60%
70%
80%
90%
100%
1 2 3 4 5
both state and private
private
state
age quintiles (13-24) (61-100)
% of population in large cities
State or private firms should provide employment for people?
Source: RLMS, fall 2006

What (if anything) should be done with the majority of private
assets?
52
1315
20
0
10
20
30
40
50
60
leave withcurrentowners
leave withcurrent
owners, butmake them
pay
renationalizeand then
reprivatize
renationalize
% of population
Source: RLMS, fall 2006

In your opinion, what should be done with most privatized companies? They should be…
0% 20% 40% 60% 80% 100%
Uzbekistan
Tajikistan
Kazakhstan
Kyrgyzstan
Ukraine
Azerbaijan
Armenia
Russia
FYR_Macedonia
Moldova
Slovakia
Georgia
Bulgaria
Bosnia
Hungary
Croatia
Estonia
Poland
Belarus
Serbia
Mongolia
Romania
Montenegro
Latvia
Lithuania
Albania
Czech_Republic
Slovenia
Renationalized and kept in statehands
Renationalized and then re-privatized again using a moretransparent process
Left in the hands of current ownersprovided that they pay privatizedassets’ worth
Left in the hands of current ownerswith no change
Source: EBRD Life in Transition survey, fall 2006

There is lower support of renationalization among the young
% of population by age quintiles
13 833 29 19
7161534137
0%
20%
40%
60%
80%
100%
1 2 3 4 5renationalize
renationalize and then reprivatize
leave with current owners, but make them pay
leave with current owners
Source: RLMS, fall 2006

Could there be understanding and cooperation reached
between…
0
10
20
30
40
surely possiblerather possiblein somecircumstances only
rather impossiblesurely impossible
the rich and the poor the simple people and the people with political power
People demand increased state involvement despite the fact that they think that cooperation with people in power is less feasible than even cooperation with the rich
Source: RLMS, fall 2006

What should be done in order to reduce income inequality in Russia?
4
4
25
25
28
29
41
45
45
2
4
0 10 20 30 40 50
INCREASE THE POWER OF UNIONS
ANOTHER REVOLUTION
SUBSIDIZE THE POOR
RENATIONALISE FIRMS
TAX THE RICH
ECONOMIC GROWTH
IMPROVE ACCESS TO EDUCATION
BETTER ENFORCE THE CURRENT LAWS
STATE PRICE REGULATION
NO NEED TO REDUCE INCOME DIFFERENCES
NOTHING CAN BE DONE
% of population, multiple answersPrice controls are the most popular policy measure to reduce wealth inequality
Source: RLMS, fall 2006

Importance of different institutions
1 is “not at all important”, 2 is “rather unimportant”, 3 is “yes and no”, 4 is “rather important”, and 5 is very important”
4.6
4.5
4.2
4.1
3.8
3.8
3.6
1.0 1.5 2.0 2.5 3.0 3.5 4.0 4.5 5.0
POLITICAL OPPOSITION
PROTECTION OF MINORITY RIGHTS
INDEPENDENT PRESS
FREEDOM OF SPEECH
FREE AND FAIR ELECTIONS
JUST COURTS
LAW AND ORDER
On the scale from 1 to 5
Source: RLMS, fall 2006

“Is the Western society a good model for Russia?”
Source: FOM “GeoRating”
22%
30%
15%
7%
30%
27%
18%
0%
5%
10%
15%
20%
25%
30%
35%
Certainlynot
Rather not Rather yes Certainlyyes
Difficult tosay
2004
2008

“Is the U.S. a friendly country?”
Source: FOM “GeoRating” 2003
18%
31%28%
4%
19%
0%
5%
10%
15%
20%
25%
30%
35%
Certainlynot
Rather not Rather yes Certainlyyes
Difficult tosay

Is US a friendly country?by age
.3.3
3.3
6.3
9.4
2.4
5U
S is
frie
ndly
, re
sid
ual a
fter
con
tro
llin
g fo
r in
com
e, e
duc
atio
n, g
en
der,
loca
ti
20 25 30 35 40 45 50 55 60 65 70 75 80 85 90 95 100age
Source: RLMS, fall 2006

Do you think that...
27
57
15
39
23
38
0102030
40506070
Most people can betrusted
You cannot be toocareful in dealing with
people
Depends on who youare delaing with
2006
1991
General trust toward people
Source: RLMS, fall 2006

Trust towards organizations and certain groups of people
2.12.5
2.5
2.52.62.7
2.8
2.93.03.1
1.0 1.5 2.0 2.5 3.0 3.5
POLITICAL PARTIESFOREIGN BANKS
INSURANCE COMPANIESPOLICE
THE PARLIAMENTSMEs
COURTSRUSSIAN BANKS
THE CABINET OF MINISTERSARMED FORCES
1 is “completely distrust”, 2 is “rather distrust”, 3 is “neither trust nor distrust”, 4 is “rather trust”, and 5 is “completely trust”
On the scale from 1 to 5
Source: RLMS, fall 2006

Where do people get information (which may shape their views)?... TV
0 20 40 60 80 100
Foreign TV
Foreign Radio
Foreign Press
Internet
Russian Radio
Friends, colleagues, family
Russian Press
Russian TV
all sources of information used the main source of information

Summary • Approximately one half of Russians even
before the crisis (in 2006) were strongly– pro-state intervention into the economy and
anti-market– anti-US and anti-Western– anti-democracy and pro-strong leader
• Age and income help, but some of the effects are non-linear with very young looking more like older generation