
What recommender systems can learn from decision psychology about preference elicitation and...
59
What recommender systems can learn from decision psychology about preference elicitation and behavioral change Martijn Willemsen Human-Technology Interaction www.martijnwillemsen.nl
-
Upload
martijn-willemsen -
Category
Presentations & Public Speaking
-
view
195 -
download
0
Transcript of What recommender systems can learn from decision psychology about preference elicitation and...

What recommender
systems can learn from
decision psychology about preference elicitation
and behavioral changeMartijn Willemsen
Human-Technology Interaction
www.martijnwillemsen.nl

What are recommender systems about
Algorithms
Accuracy:
compare prediction
with actual values
Recommendation:
best predicted items
dataset
user-item rating pairs
user
Choose (prefer?)
ratingsRating?
Experience!
preferences
Goals &
desires!

User-Centric Framework
Computers Scientists (and marketing researchers) would study
behavior…. (they hate asking the user or just cannot (AB tests))
User-Centric Framework
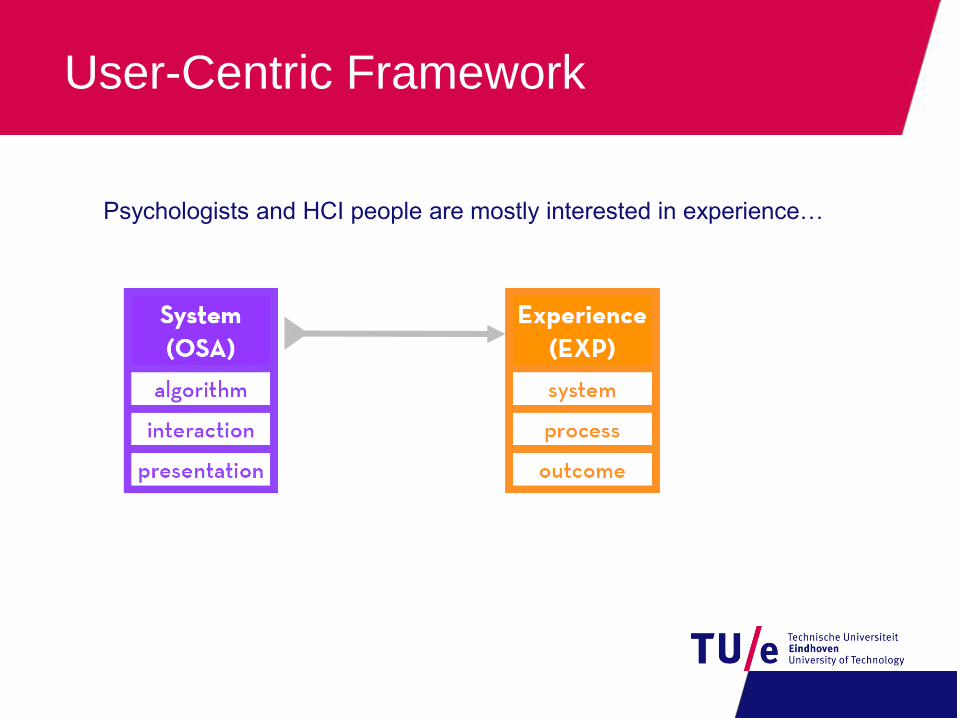
Psychologists and HCI people are mostly interested in experience…

User-Centric Framework
Though it helps to triangulate experience and behavior…

User-Centric Framework
Our framework adds the intermediate construct of perception that explains
why behavior and experiences changes due to our manipulations
User-Centric Framework
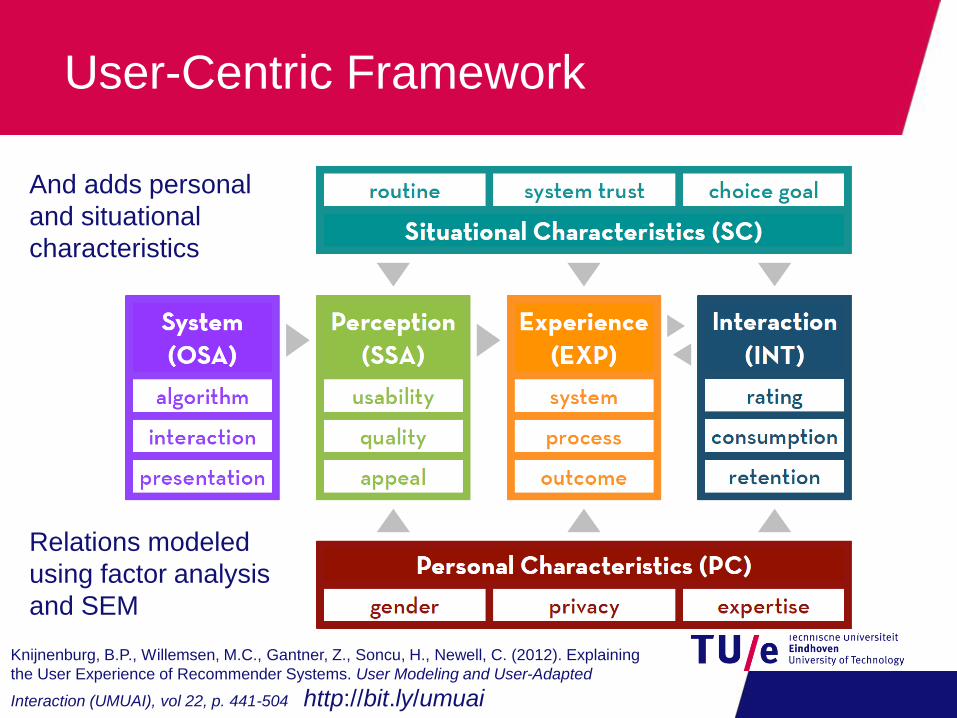
And adds personal
and situational
characteristics
Relations modeled
using factor analysis
and SEM
Knijnenburg, B.P., Willemsen, M.C., Gantner, Z., Soncu, H., Newell, C. (2012). Explaining
the User Experience of Recommender Systems. User Modeling and User-Adapted
Interaction (UMUAI), vol 22, p. 441-504 http://bit.ly/umuai

Providing input to the
recommender:
Preference Elicitation
memory, ratings & choices

Providing input to a recommender
system
how do algorithms get their data?
Preference Elicitation (PE)
PE is a major topic in research on
Decision Making
I even did my PhD thesis on it… ;-)
What can Psychology learn us on
improving this aspect?
Role of memory in ratings
Rating support
Rating versus choice-based elicitation

What does rating entail?
Typical recommender scenario:
First usage: Show a set of (typical) items and ask
people to rate the ones they know (cold start)
Later usage: people go to the recommender when they
have consumed an item to rate it and typically also rate
other aspects
Does it matter if the preference you provide (by
rating) is based on recent experiences or mostly
on your memory?

Psychologist: user knows best, ask her!
In two user experiments, users rated a number of
movies that were aired on Dutch TV in the
previous month (~150 movies)
Rate 15-20 movies from that set that you know
and indicate how long ago you have seen these
movies (last week, last month, last 6 months, last
year, last 3 years, longer ago)
Motivate ratings for two movies (one seen recently
and one seen more than a year ago)

Results
247 users, 4212 ratings
Rating distributions:
Most movies are seen
long ago…
Only 28% seen in the
last year
# Positive ratings
decrease with time
1st timeslot: 60% 4/5
star
Last timeslot: only 36%
*****
****
***
**
*

Modeling the ratings
Coefficient Std. Err. t-value
intercept 2.95 0.15 19.05
time 0.29 0.13 2.31
highrated 1.62 0.22 7.43
time2 -0.09 0.02 -3.55
Time x highrated -0.73 0.18 -4.10
Tine2 x highrated 0.11 0.03 3.26
Multilevel model:Random intercepts for movies
and users
high-rated versus low-rated
shows a different pattern
Regression towards the mean?
High-rated
Low rated
This is a problem…
How can we train a recommender system..
If ratings depend on our memory this much…
This is new to psychology as well!
Memory effects like this have not been studied…
Problem lies partly in the type of judgment asked:
Rating is separate evaluation on an absolute scale…
Lacks a good reference/comparison
Two solutions we explored:
Rating support
Different elicitation methods: choice!

Joint versus Separate Evaluation
Evaluations of two job candidates for a computer
programmer position expecting the use of a special
language called KY.
Mean WTP (in thousands):
Separate $ 32.7 k $ 26.8 k
Joint $ 31.2 k $ 33.2 k
Candidate A Candidate B
Education B.Sc. computer Sc. B.Sc. computer Sc.
GPA (0-5) 4.8 3.1
KY Experience 10 KY programs 70 KY programs
17

Rating support interfaces
Using movielens!
Can we help users during rating to make
their ratings more stable/accurate?
We can support their memory for the movie using tags
We can help ratings on the scale with previous ratings
Movielens has a tag genome and a history of
ratings so we can give real-time user-specific
feedback!
Nguyen, T. T., Kluver, D., Wang, T.-Y., Hui, P.-M., Ekstrand, M. D., Willemsen, M.
C., & Riedl, J. (2013). Rating Support Interfaces to Improve User Experience
and Recommender Accuracy. RecSys 2013 (pp. 149–156)

Tag Interface
Provide 10 tags
that are relevant
for that user
and that describe
the movie well
Didn’t really help…

Exemplar Interface
Support rating on the
scale by providing
exemplars:
Exemplar: Similar movies
rated before by that user
for that level on the scale
This helps to anchor the
values on the scale better:
more consistent ratings
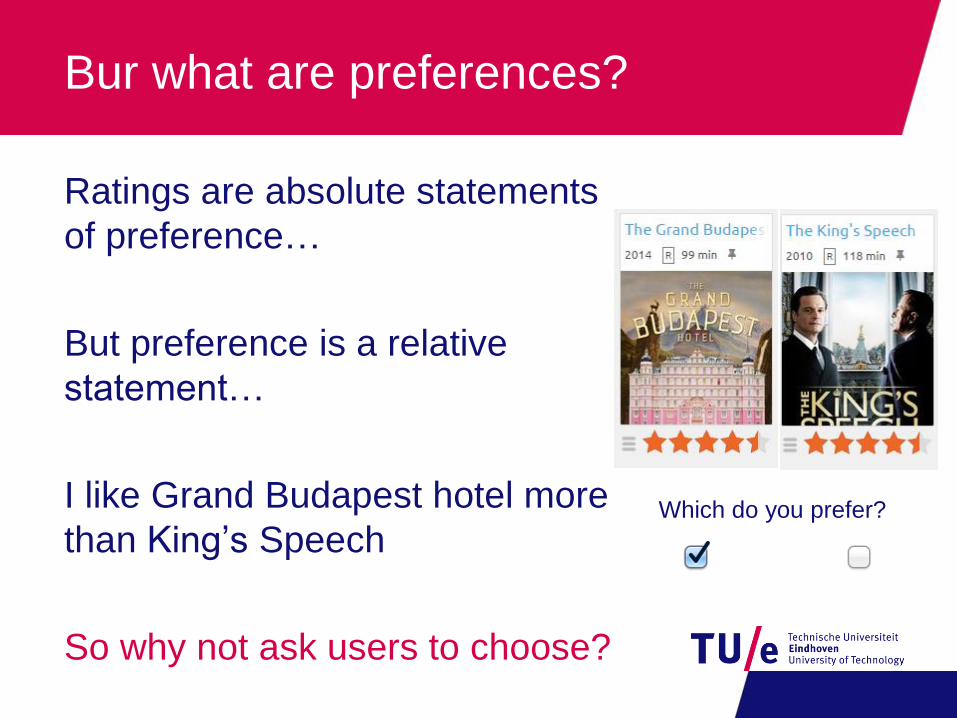
Bur what are preferences?
Ratings are absolute statements
of preference…
But preference is a relative
statement…
I like Grand Budapest hotel more
than King’s Speech
So why not ask users to choose?
Which do you prefer?
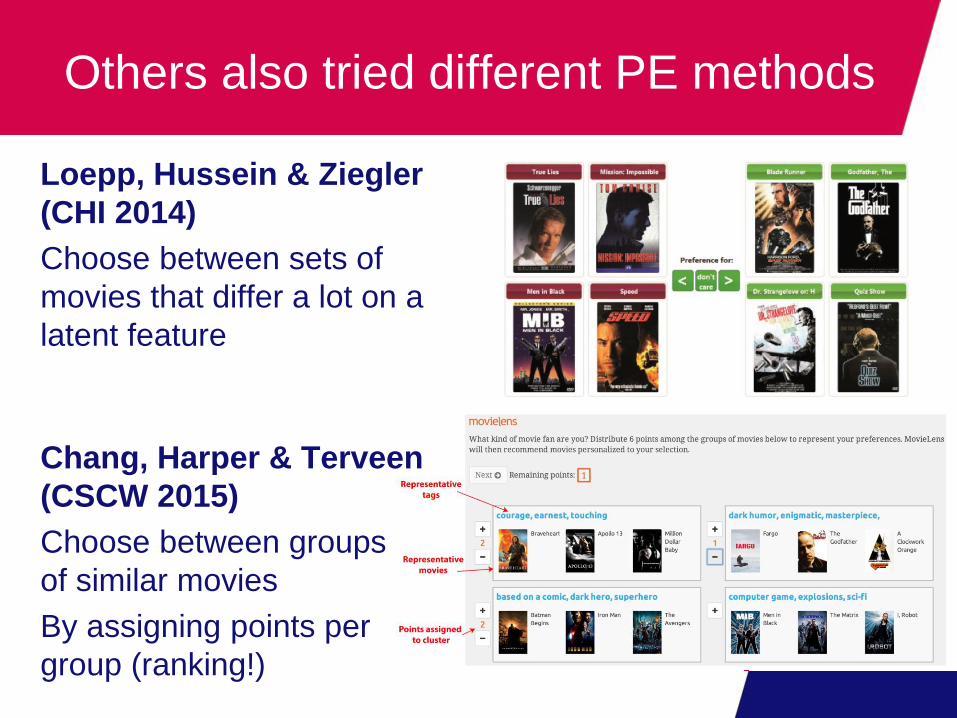
Others also tried different PE methods
Loepp, Hussein & Ziegler
(CHI 2014)
Choose between sets of
movies that differ a lot on a
latent feature
Chang, Harper & Terveen
(CSCW 2015)
Choose between groups
of similar movies
By assigning points per
group (ranking!)
Choice-based preference elicitation
Choices are relative statements that are easier to make
Better fit with final goal: finding a good item rather than making a
good prediction
In Marketing, conjoint-based analysis uses the same idea
to determine attribute weights and utilities based on a
series of (adaptive) choices
Can we use a set of choices in the matrix factorization
space to determine a user vector in a stepwise fashion?
Graus, M.P. & Willemsen, M.C. (2015). Improving the user
experience during cold start through choice-based preference
elicitation. In Proceedings of the 9th ACM conference on
Recommender systems (pp. 273-276)

Dimensions in Matrix Factorization
Dimensionality reduction
Users and items are
represented as vectors on a set
of latent features
item vector: utility of attributes
user vector: weights of attributes
Rating is the dot product of
these vectors (overall utility!)
Gus will like Dumb and
Dumber but hate Color Purple
Koren, Y., Bell, R., and Volinsky, C. 2009. Matrix Factorization
Techniques for Recommender Systems. IEEE Computer 42, 8, 30–37.

How does this work? Step 1
Latent Feature 1Late
nt
Feat
ure
2
Iteration 1a: Diversified choice set is
calculated from a matrix factorization
model (red items)
Iteration 1b: User vector (blue arrow) is
moved towards chosen item (green item),
items with lowest predicted rating are
discarded (greyed out items)
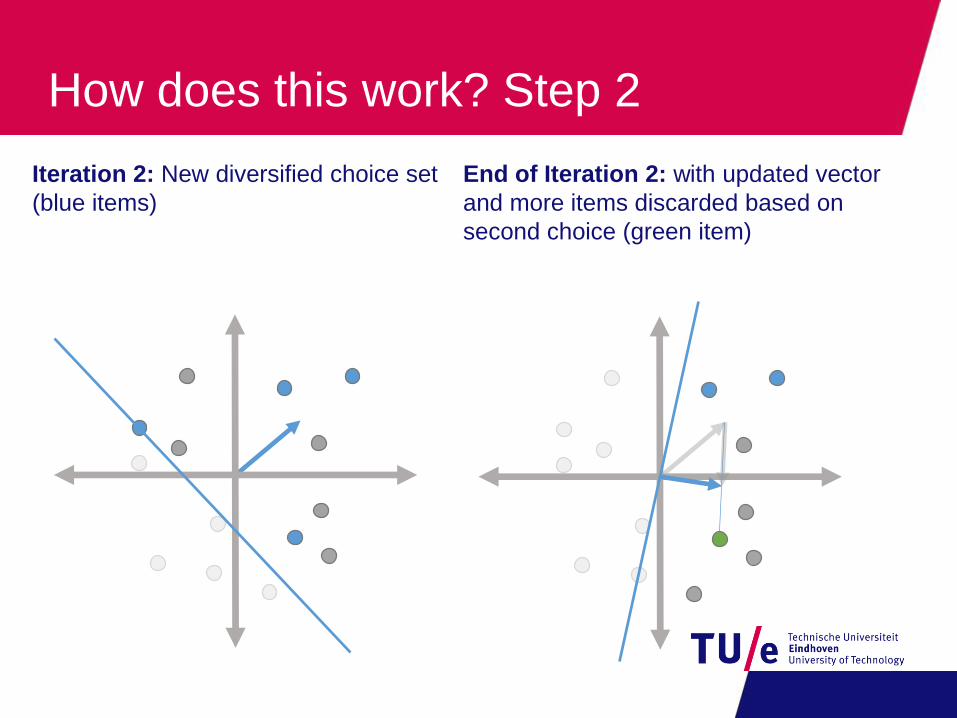
How does this work? Step 2
Iteration 2: New diversified choice set
(blue items)
End of Iteration 2: with updated vector
and more items discarded based on
second choice (green item)

Evaluation of Preference Elicitation
Choice-based PE: choosing 10 times from 10 items
Rating-based PE: rating 15 items
After each PE method they evaluated the interface on
interaction usability in terms of ease of use
e.g., “It was easy to let the system know my preferences”
Effort: e.g., “Using the interface was effortful.”
effort and usability are highly related (r=0.62)
Results: less perceived effort for choice-based PE
perceived effort goes down with completion time

Behavioral data of PE-tasks
Choice-based PE: most users find their perfect item
around the 8th / 9th item and they inspect quite some
unique items along the way
Rating-based: user inspect many
lists (Median = 13), suggesting
high effort in rating task.

Perception of Recommendation List
Participants evaluated each recommendation list
separately on Choice Difficulty and Satisfaction
Satisfaction with Chosen
ItemObscurity
Difficulty
Intra List Similarity
-2.407(.381)
p<.001
-.240 (.145)
p<.1
-.479 (.111)
p<.001
-.257 (.045)
p<.001
14.00 (4.51)
p<.01
Choice-Based List
+
-
- -
-
Conclusion
Participants experienced reduced effort and increased
satisfaction for choice-based PE over rating-based PE
relative (choice) rather than absolute (rating) PE could alleviate the
cold-start problem for new users
Further research needed:
the parameterization of the choice task
strong effect of choice on the popularity of the resulting list
Using trailers helps to decrease popularity (-> IntRS 2016)
novelty effects might have played a role: fun way of interacting?

Recommending for
Behavioral Change
Energy saving and
Hypertension management

Behavioral change
Behavioral change is hard…
Exercising more, eat healthy, reduce alchohol
consumption (reducing Binge watching on Netflix )
Needs awareness, motivation and commitment
Combi model:
Klein, Mogles, Wissen
Journal of Biomedical Informatics, 2014

What can recommenders do?
Persuasive Technology: focused on how to help
people change their behavior:
personalize the message…
Recommenders systems can help with what to
change and when to act
personalize what to do next…
This requires different models/algorithms
our past behavior/liking is not what we want to do now!
Two illustrations of new approach:
energy saving
hypertension management
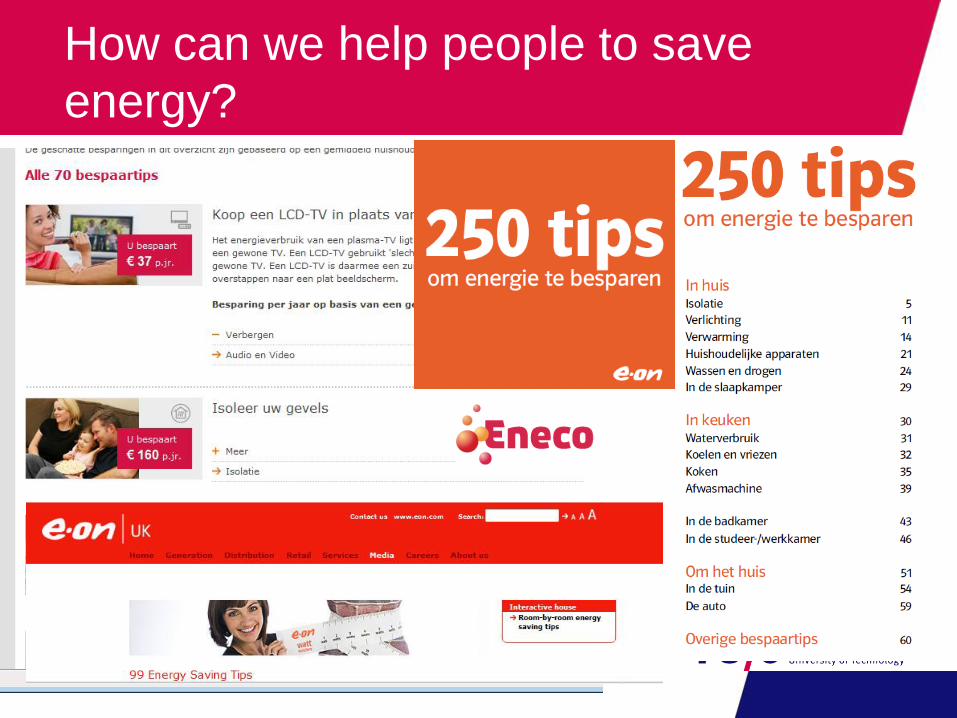
How can we help people to save
energy?

Our first (old) recommender system
Recommendations
Selected
measures
Things you
already do or
don’t want to
Attributes
Set
attribute
weights
Show items with highest Uitem,user, where
Uitem,user = ∑ Vitem,attribute • Wattribute,user

Study 3 (AMCIS 2014)
Online lab study
—147 paid pps (79M, 68F, mean age: 40.0)
—Selected pps interacted for at least 2.5 minutes
3 PE-methods, 2 baselines
—Attribute-based PE
— Implicit PE
—Hybrid PE (attribute + implicit)
—Sort (baseline, not personalized)
—Top-N (baseline, not personalized)
http://bit.ly/amcis14
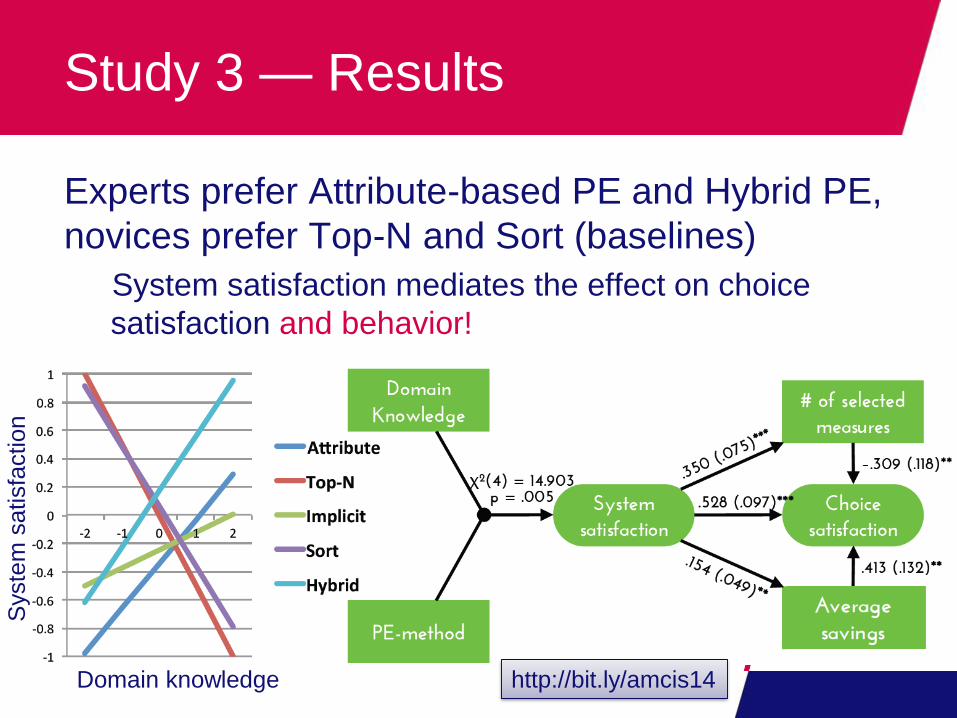
Study 3 — Results
Experts prefer Attribute-based PE and Hybrid PE,
novices prefer Top-N and Sort (baselines)
System satisfaction mediates the effect on choice
satisfaction and behavior!
Syste
m s
atisfa
ction
Domain knowledge http://bit.ly/amcis14

Tailoring energy-saving
advice using a unidimensional
Rasch scale of conservation
measures
Work with Alain Starke (Ph. D. student)

Towards a better (psychometric) user model
consumers differ in energy-saving capabilities, attitudes,
goals, …
Our prior work did not take that into account…
Energy-saving interventions are more effective when
personalized. But how?
≠
(Cf. Abrahamse et al., 2005)

Single energy saving
dimension/attitude?
Campbell’s Paradigm (Kaiser et al., 2010)
“One’s attitude or ability becomes apparent
through its behavior…”
“Attitude and Behavior are two sides of the
same coin…”
Different from standard psychological
approaches to measure attitudes & intentions
with likert scales…
41

Psychological assumptions
Three assumptions for our user model(Based on Kaiser et al., 2010)
1. All Energy-saving behaviors form a class serving a
single goal: Saving Energy
2. Less performed behaviors yield higher Behavioral
Costs (i.e. are more difficult)
3. Individuals that execute more energy-saving behaviors
have a higher Energy-saving Ability (i.e. more skilled)

The Rasch model
The Rasch model equates behavioral difficulties and individual propensities in a probabilistic model
Log-odds of engagement levels (yes/no):
𝜽 = an individual’s propensity/attitude
𝜹 = behavioral difficulty
P = probability of individual n engaging in behavior i
Rasch also determines individual propensities and item difficulties & fits them onto a single scale
One scale may have lots of different difficulty levels
43
𝐥𝐧𝑷𝒏𝒊
𝟏 − 𝑷𝒏𝒊= 𝜽𝒏 − 𝜹𝒊
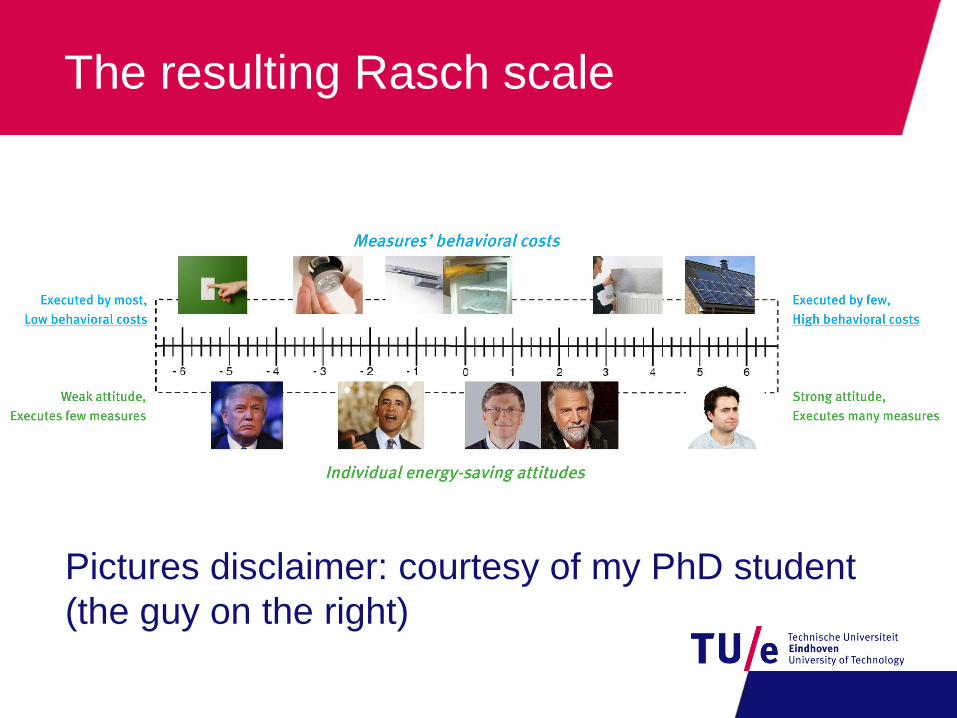
The resulting Rasch scale
Pictures disclaimer: courtesy of my PhD student
(the guy on the right)

Item difficulty vs. person ability
Probability of a person executing behavior
depends on the Ability - Costs
LED lightingUnplug chargersInstall PV panels

Using Rasch for tailored advice
Earlier research (Kaiser, Urban) found evidence
for a unidimensional scale, but with few items &
no advice
We set out a Rasch-based, energy
recommender system that:
Shows the measures in order of difficulty (either
ascending or descending)
Provide tailored conservation advice to users (or not)
Include a more extensive set of measures
46

Energy saving ‘Webshop’
Ordered set of measures with rich information and
(in some conditions) recommendations
Order: Ascending or
descending in
Rasch difficulty
Rasch
recommendation:start at their ability
(3 items highlighted)
or just at the bottom
(no highlights)

Procedure
1. Determining Ability: Each
user indicated for 13
measures whether
he/she executed them
2. Show webshop in one of 4 conditions (total N=224)
and ask to select a set of measures (to execute in
next 4 weeks)
3. Survey to measure user experience
4. After 4 weeks: report back on which measures they
implemented (to some extent) N=86
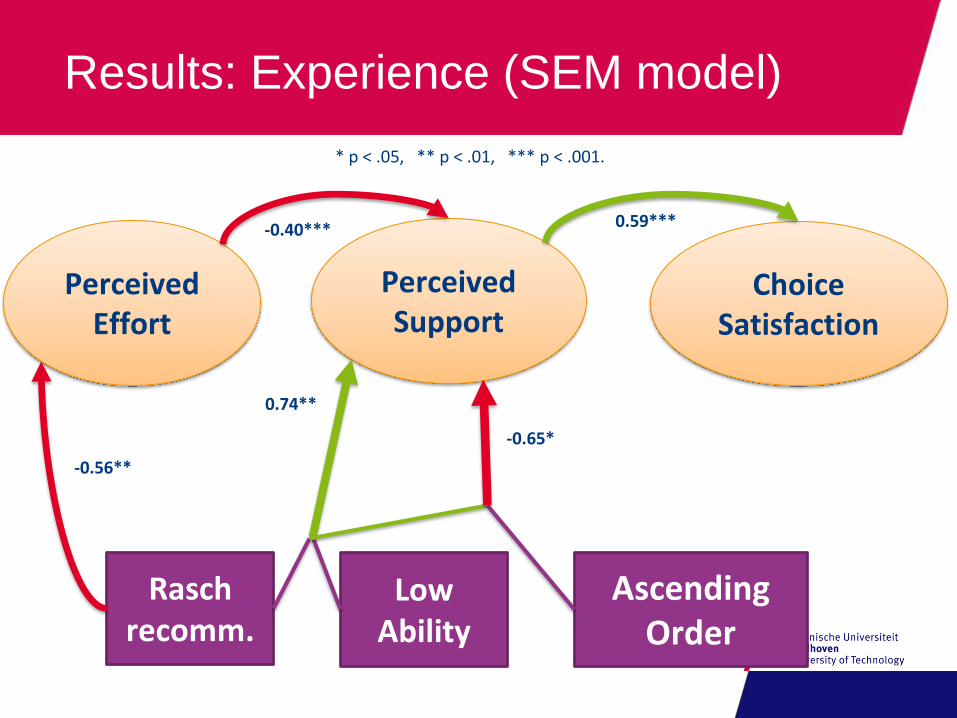
Results: Experience (SEM model)
Perceived Effort
Perceived Support
Choice Satisfaction
-0.40*** 0.59***
-0.56**
* p < .05, ** p < .01, *** p < .001.
0.74**
-0.65*
Raschrecomm.
Low Ability
Ascending Order
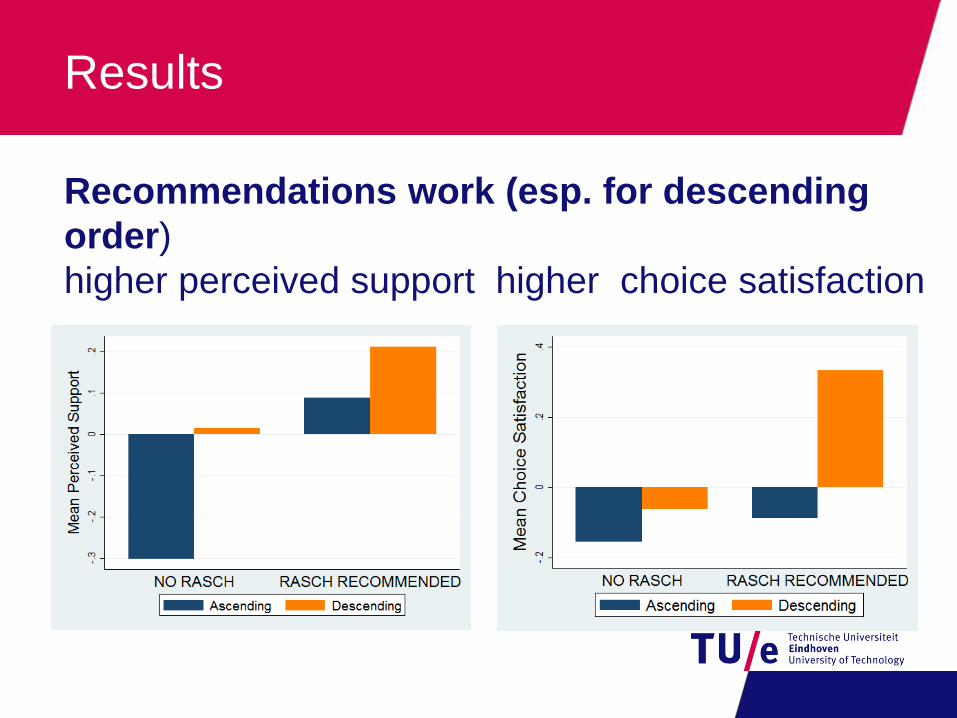
Results
Recommendations work (esp. for descending
order)
higher perceived support higher choice satisfaction
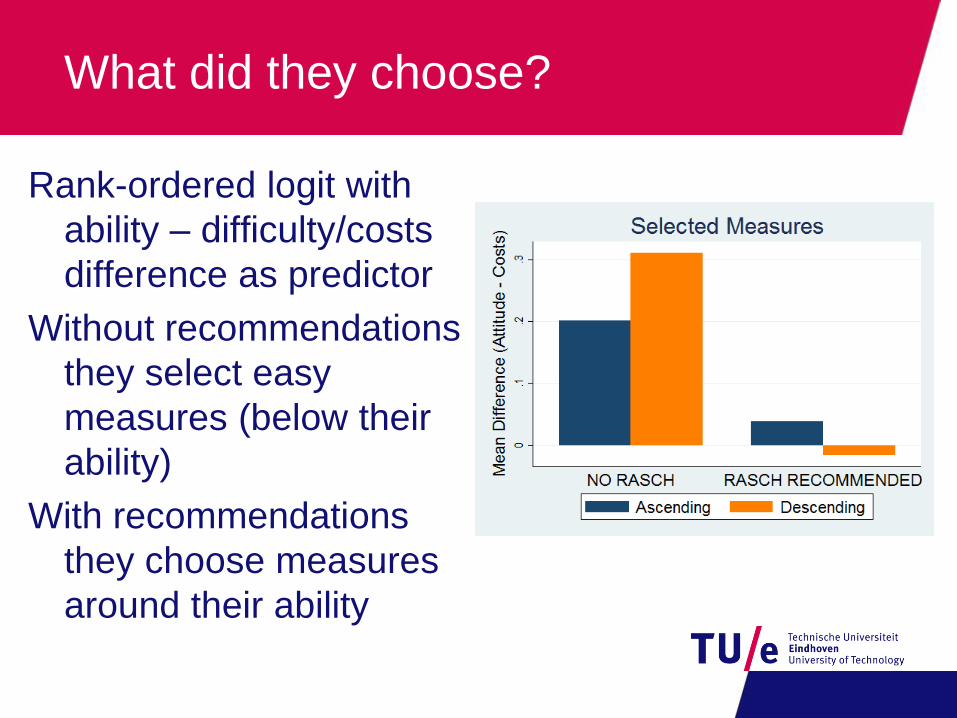
What did they choose?
Rank-ordered logit with
ability – difficulty/costs
difference as predictor
Without recommendations
they select easy
measures (below their
ability)
With recommendations
they choose measures
around their ability
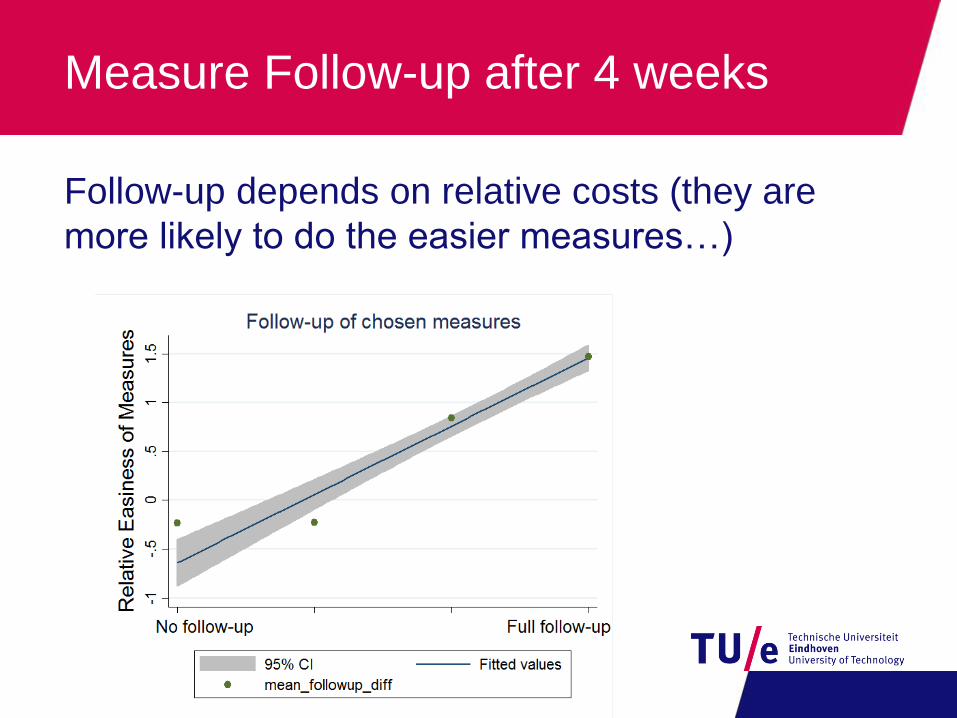
Measure Follow-up after 4 weeks
Follow-up depends on relative costs (they are
more likely to do the easier measures…)

Lifestyle recommendations
for Hypertension
Management
Joint work with Mustafa Radha (Ph.D. student)
Radha, Willemsen, Boerhof & IJsselsteijn
UMAP 2016
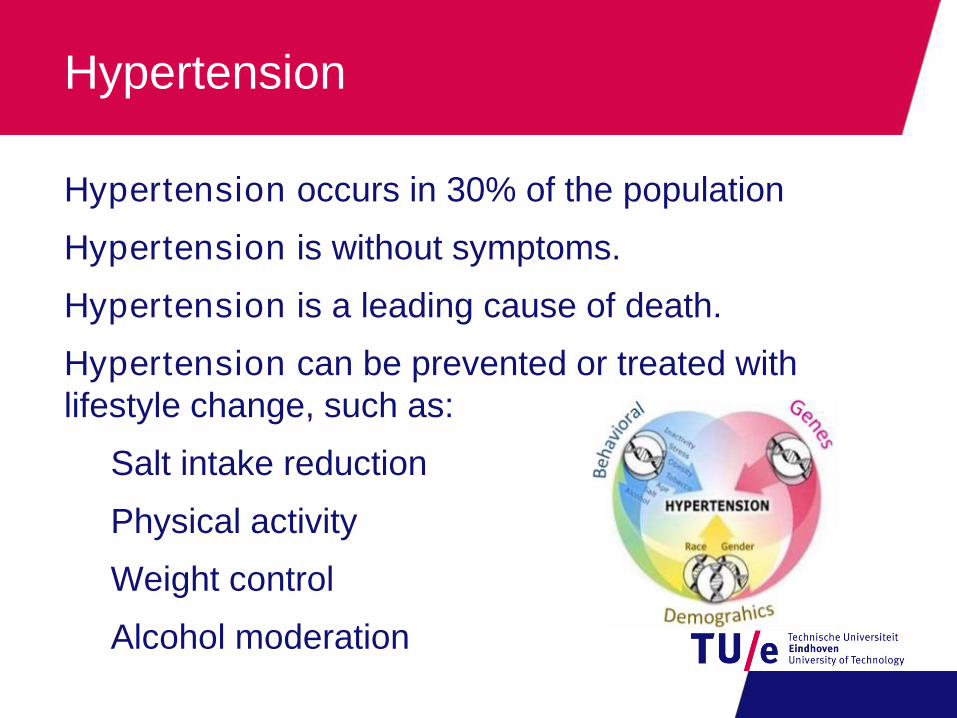
Hypertension
Hypertension occurs in 30% of the population
Hypertension is without symptoms.
Hypertension is a leading cause of death.
Hypertension can be prevented or treated with
lifestyle change, such as:
Salt intake reduction
Physical activity
Weight control
Alcohol moderation
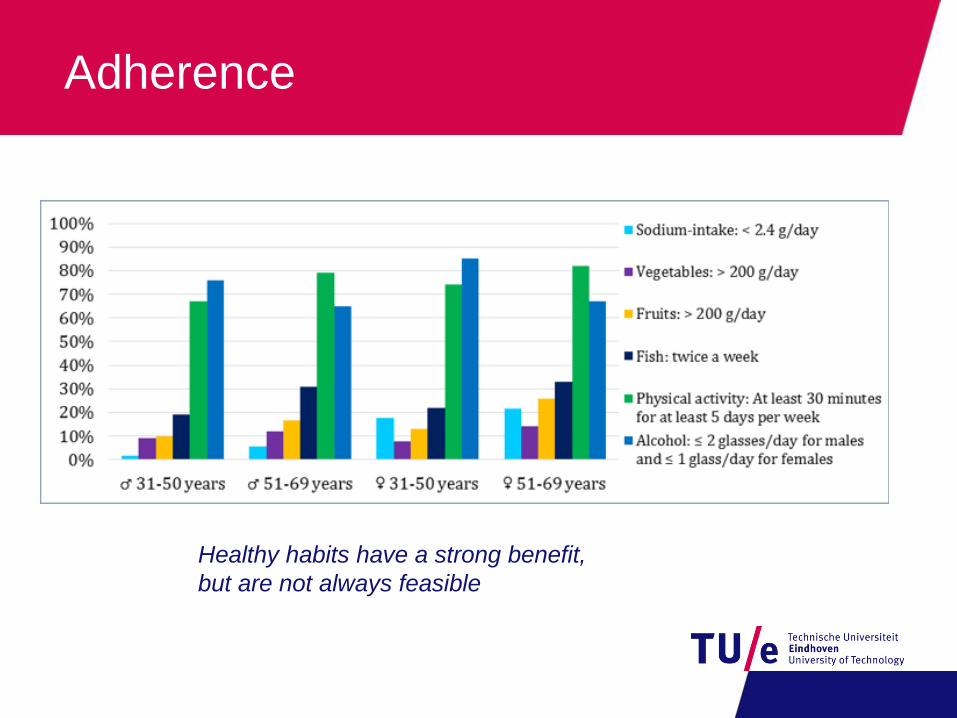
Adherence
Healthy habits have a strong benefit,
but are not always feasible

Study 1: Model construction
Online survey
300 participants between 40 and 60 years old
50% hypertensive
Self-reported engagement in 63 health behaviors
about diet, sodium intake and physical activity
Results:
reliable Rasch scale (for both persons and items)
No strong differences between subgroups
Unidimensional: different categories
mix nicely across the scale

The Rasch scale

Study 2: Coaching strategies
The engagement maximization strategy selects
the easiest behaviors (that she does not do yet)
The motivation maximization strategy selects
behaviors with difficulties that match the
individual’s ability (that she does no do yet)
The random control strategy selects behaviors
(not done yet) at random without regard for
difficulty
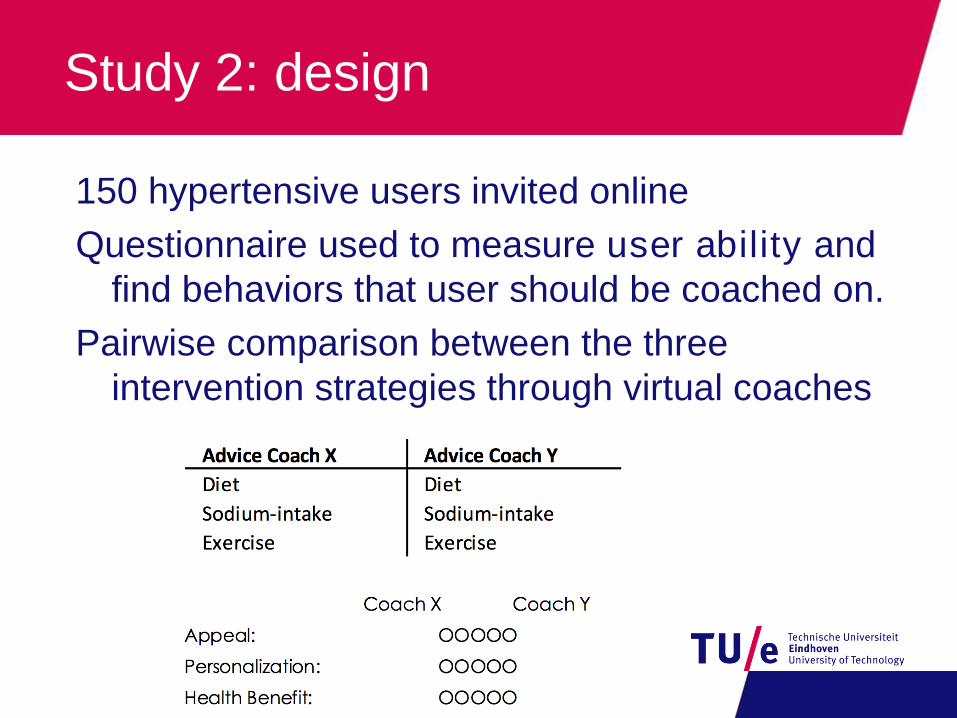
Study 2: design
150 hypertensive users invited online
Questionnaire used to measure user ability and
find behaviors that user should be coached on.
Pairwise comparison between the three
intervention strategies through virtual coaches

Medium abilityEntire population
Results
EM
EM
Health Benefit
Personalization
RC
RC
MM RC
Health Benefit
MM
MM
Health Benefit
Appeal
RC
RC

Conclusions
Engagement maximization (easy behaviors not
done yet) outperforms random most of the time
The rasch order helps!
Knowing the ability helps to elicit better
recommendations by tailoring: for medium ability
individuals
But for other groups it does not matter much…

Questions?
Contact:
Martijn Willemsen
@MCWillemsen
www.martijnwillemsen.nl
Thanks to my co-authors:
Mark Graus, Alain Starke
Mustafa Radha
Bart Knijnenburg, Ron Broeders


![Preference Elicitation as an Optimization Problem...Preference Elicitation as an Optimization Problem RecSys ’18, October 2–7, 2018, Vancouver, BC, Canada et al. [2], we define](https://static.fdocuments.us/doc/165x107/5f0ceeb67e708231d437d85d/preference-elicitation-as-an-optimization-problem-preference-elicitation-as.jpg)