
What norms trigger punishment? - Middlebury College
17
Exp Econ (2009) 12: 272–288 DOI 10.1007/s10683-009-9214-z What norms trigger punishment? Jeffrey Carpenter · Peter Hans Matthews Received: 5 December 2007 / Revised: 20 January 2009 / Accepted: 26 January 2009 / Published online: 14 February 2009 © Economic Science Association 2009 Abstract Many experiments have demonstrated the power of norm enforcement— peer monitoring and punishment—to maintain, or even increase, contributions in so- cial dilemma settings, but little is known about the underlying norms that monitors use to make punishment decisions, either within or across groups. Using a large sam- ple of experimental data, we empirically recover the set of norms used most often by monitors and show first that the decision to punish should be modeled separately from the decision of how much to punish. Second, we show that absolute norms often fit the data better than the group average norm often assumed in related work. Third, we find that different norms seem to influence the decisions about punishing violators inside and outside one’s own group. Keywords Public good · Experiment · Punishment · Social norm · Norm enforcement JEL Classification C72 · C92 · H41 We thank Marco Castillo, Jeremy Clark, Carolyn Craven, Herb Gintis, Corinna Noelke, Louis Putterman, David Sloan Wilson and two referees for comments on earlier versions of this work, as well as seminar participants at the European University Institute, Canadian Economics Association and Economic Science Association. The first author also thanks the NSF (CAREER 0092953) for financial support. Electronic supplementary material The online version of this article (http://dx.doi.org/10.1007/s10683-009-9214-z) contains supplementary material, which is available to authorized users. J. Carpenter ( ) · P.H. Matthews Department of Economics, Middlebury College, Middlebury, VT 05753, USA e-mail: [email protected] P.H. Matthews e-mail: [email protected] J. Carpenter Research Fellow, Bonn, Germany
Transcript of What norms trigger punishment? - Middlebury College
Exp Econ (2009) 12: 272–288DOI 10.1007/s10683-009-9214-z
What norms trigger punishment?
Jeffrey Carpenter · Peter Hans Matthews
Received: 5 December 2007 / Revised: 20 January 2009 / Accepted: 26 January 2009 /Published online: 14 February 2009© Economic Science Association 2009
Abstract Many experiments have demonstrated the power of norm enforcement—peer monitoring and punishment—to maintain, or even increase, contributions in so-cial dilemma settings, but little is known about the underlying norms that monitorsuse to make punishment decisions, either within or across groups. Using a large sam-ple of experimental data, we empirically recover the set of norms used most oftenby monitors and show first that the decision to punish should be modeled separatelyfrom the decision of how much to punish. Second, we show that absolute norms oftenfit the data better than the group average norm often assumed in related work. Third,we find that different norms seem to influence the decisions about punishing violatorsinside and outside one’s own group.
Keywords Public good · Experiment · Punishment · Social norm · Normenforcement
JEL Classification C72 · C92 · H41
We thank Marco Castillo, Jeremy Clark, Carolyn Craven, Herb Gintis, Corinna Noelke, LouisPutterman, David Sloan Wilson and two referees for comments on earlier versions of this work,as well as seminar participants at the European University Institute, Canadian EconomicsAssociation and Economic Science Association. The first author also thanks the NSF(CAREER 0092953) for financial support.
Electronic supplementary material The online version of this article(http://dx.doi.org/10.1007/s10683-009-9214-z) contains supplementary material, which is availableto authorized users.
J. Carpenter (�) · P.H. MatthewsDepartment of Economics, Middlebury College, Middlebury, VT 05753, USAe-mail: [email protected]
P.H. Matthewse-mail: [email protected]
J. CarpenterResearch Fellow, Bonn, Germany
What norms trigger punishment? 273
1 Introduction
There has recently been a lot of interest in the ability of punishment to regulate behav-ior in social dilemma settings, but the bulk of this work tends to focus on testing insti-tutional boundaries and few papers examine the causes of punishment.1 The notableexceptions are the neural studies of de Quervain et al. (2004) and Singer et al. (2006),which indicate that people receive pleasure from punishing norm violators but eventhese studies do not tell us what sorts of “misbehavior” trigger punishment. What rulemust be violated before someone punishes? And does the same rule determine boththe likelihood of intervention and the level of punishment? We work towards answersto these questions by employing more traditional methods. Using a large sample ofcontribution and punishment decisions from public goods experiments and a noveleconometric specification, we recover both the norms used to motivate the decisionto punish and those that determine the level of chosen punishment.
The problem with the literature is not that the link between enforcement and somenormative trigger has been ignored, but rather that the trigger has been assumed, notinferred. Many researchers assume that the salient triggering norm is the group av-erage contribution to the public good: the more one contributes below (and possiblyabove) the group average, the more likely one is to be punished and the more punish-ment one receives. In the theoretical literature, Falkinger (1996, 2006) models tax andtransfer policies around the group average that are to be implemented both decentrallyand by a central authority.2 Ever since its original invocation in Fehr and Gächter(2000), lab studies have routinely used the group average as the reference norm whenanalyzing experimental data from the voluntary contribution mechanism.3
Another contribution of this paper is the recovery of distinct second-party andthird-party norms from our data. Second-party punishment occurs when one memberof a group free rides and other “ingroup” members punish this person. Third-partypunishment (Fehr and Fischbacher 2004; Carpenter and Matthews 2005) occurs whenmembers of one group punish free riders in neighboring but otherwise disjoint groups.While second party punishers benefit in the long run if they can get free riders in theirgroups to contribute, third-party punishers can typically expect no material benefit tocome from their sanctions and given the potential costs of such acts, it is not clearwhy anyone would intervene.4 Although the logic of third-party punishment is notobvious, researchers have determined that it is crucial for the enforcement of socialnorms in large populations—second party punishment is often not enough (Bendorand Swistak 2001; Carpenter and Matthews 2008; Fehr and Fischbacher 2004).
1Examples include Masclet et al. (2003), Anderson and Putterman (2005), Falk et al. (2005), Cinyabugumaet al. (2006), Carpenter (2007a) and Nikiforakis (2008).2The model in Falkinger (1996) is later tested in the lab by Falkinger et al. (2000).3This work includes Decker et al. (2003), Anderson and Putterman (2005), Ertan et al. (2005), Seftonet al. (2005), Carpenter (2007b), Ones and Putterman (2007). Exceptions include Kosfeld et al. (2006)who model a “contribute everything” norm and Nikiforakis (2008) and Gächter and Herrmann (2006) whoexamine the norm of contribute as much as the monitor.4The study of third party punishment has roots in the psychological literature on the “bystander effect”(Latane and Darley 1970) which was sparked by the murder, witnessed by many neighbors who did noth-ing, of Kitty Genovese in 1964.
274 J. Carpenter, P.H. Matthews
We are aware of no other studies that infer norms as we have done here, andcertainly none that do so within a framework that allows for both second- and third-party punishment. One of our most important results is that we find surprisingly littleevidence that (own) group average, the norm assumed in much of the experimentalliterature, drives either the decision to punish or, conditional on this, the level ofpunishment. Instead, we find that these decisions are separable and based on distinctnorms, and that within group norms tend to be simple and absolute, while outgroupnorms tend to be relative, with a possible role for intergroup rivalry. We describe ourexperiment in the next section and present an overview of the data in Sect. 3 beforereporting on our analysis of the normative triggers for punishment in Sect. 4. Weconclude by briefly organizing our results into three main themes in Sect. 5.
2 A norm enforcement experiment
While our design is based on the standard voluntary contribution mechanism orig-inally used in Isaac et al. (1984), we allow players to freely monitor the decisionsmade by other players and to punish them at a cost. We recruited a large sample of276 participants at Middlebury College in 34 experimental sessions. The participantswere randomly assigned to 69 four-person groups, with two groups, or eight partici-pants, per session. The experiment lasted for ten periods, participants remained in thesame group for all ten periods (i.e., the partners treatment), and both of these featureswere common knowledge. Participants earned an average of $16.84 including a $5show-up fee and a typical session lasted slightly less than an hour.
There were four treatments: a replication of the standard voluntary contributiongame (VCM) which we use as a control on our procedures (14 groups), a replicationof previous mutual monitoring experiments (MM) in which players could monitorall other players but punish just the other members of their group (11 groups), andtwo outgroup treatments in which players could monitor and punish all the otherplayers, regardless of their group. In the Two Way outgroup treatment (26 groups)players contributed to a public good that only benefited the four people in the groupbut could monitor and punish any of the other people in the session including the fourpeople in the other group. The One Way treatment (18 groups) was identical to theTwo Way treatment except that only one of the two groups in a session could monitorand punish participants in the other group.
The purpose of having two outgroup treatments was to control for any possibil-ity of reciprocity between the groups as a motivation for punishment. In the TwoWay treatment, members of one group might engage in more outgroup punishmentif they expect the other group to reciprocate the third-party monitoring (Carpenterand Matthews 2005). If this occurs and has some impact on the underlying norm thattriggers punishment, we want to identify the change and can do so with the One Waytreatment. In the One Way treatment, reciprocity is precluded because only one groupcan punish outgroup and therefore the treatment provides the cleanest demonstrationof third-party intervention.
The payoff function for the experiment was similar to the mutual monitoring in-centive structure (see Carpenter et al. 2008), but we augmented it to account for out-
What norms trigger punishment? 275
group punishment. Punishment was costly; players paid one experimental monetaryunit (EMU) to reduce the gross earnings of another player by two EMUs.5
Imagine n players divided equally into g groups, each of whom can contribute anyfraction of their w EMU endowment to a public good, keeping the rest. Say player i
in group g contributes cgi to the public good the benefits of which are shared only by
members of group g, and keeps w − cgi . Each player’s contribution is revealed to all
the other players in the session, who then can punish other players at a cost of 1 EMUper sanction. Let sij be the expenditure on sanctions assigned by player i to player j
(we force sii = 0). Then the stage payoff to player i in group g is:
πgi = (w − c
gi ) + m
∑
iεg
cgi −
∑
j �=i,i∈g
sij −∑
k �=i,k /∈g
sik − 2∑
j �=i
sj i
where∑
iεg cgi is the total contribution in group g,
∑j �=i,i∈g sij is player i’s expen-
diture on ingroup sanctions,∑
j �=i,i /∈g sij is player i’s expenditure on outgroup sanc-tions and 2
∑j �=i sj i is the reduction in i’s payoff due to the total sanctions received
from the rest of the players in both groups. The variable m is the marginal per capitareturn on a contribution to the public good (see Ledyard 1995). In all sessions m wasset to 0.5 and w was set to 25 EMUs.
With m = 0.5, the dominant strategy is to free ride on the contributions of therest of one’s group (i.e. c
gi = 0 for all i) because each contributed EMU returns only
0.5 to the contributor. Also notice that if everyone in a four-person group contributesone EMU, they all receive a return of 2 EMUs from the public good. If individualpreferences are purely self-regarding, these incentives constitute a social dilemma,with group incentives at odds with individual incentives. The situation becomes morecomplicated, of course, if individuals are assumed to have social preferences of onesort or another: under some conditions, positive contributions and sanctions can berationalized as strategic equilibria, as in Fehr and Gächter (2000).
Because sanctions are costly to impose and their benefit cannot be fully internal-ized (ingroup) or cannot be internalized at all (outgroup) by the punisher, the threatto punish is an incredible one and cannot be part of any subgame perfect equilibrium.Indeed, the only subgame perfect equilibrium of this game is one in which everyonefree rides and nobody punishes.
Each session lasted ten periods and each period had three stages which proceededas follows.6 In stage one players contributed any fraction of their 25 EMU endow-ment in whole EMUs to the public good. The group total contribution was calculatedand reported to each player along with his or her gross payoff. Participants werethen shown the contribution decisions of all the other players in their group (mutualmonitoring) or in the session (outgroup). Players anonymously imposed sanctionsby typing the number of EMUs they wished to spend to punish an individual in thetextbox below that player’s decision. After all players were done distributing sanc-tions, the experiment moved to stage three where everyone was shown an itemizedsummary of their net payoff (gross payoff minus punishment dealt minus punishmentreceived) for the period.
5The instructions referred to “reductions” with no interpretation supplied.6Participant instructions are provided in the electronic supplementary material.
276 J. Carpenter, P.H. Matthews
Table 1 Summary statistics from the experiment
VCM MM One way Two way
Contribution 10.65, (9.73) 16.14, (8.75) 12.45, (7.81) 15.67, (8.13)
Pr (Punish) – 0.38 0.36 0.35
Total punishment expenditure – 1.44, (3.41) 1.17, (2.75) 1.91, (8.93)
Ingroup expenditure – 1.44, (3.41) 0.50, (1.18) 0.79, (2.92)
Outgroup expenditure – – 0.67, (1.57) 1.11, (5.10)
Note: mean, (standard deviation)
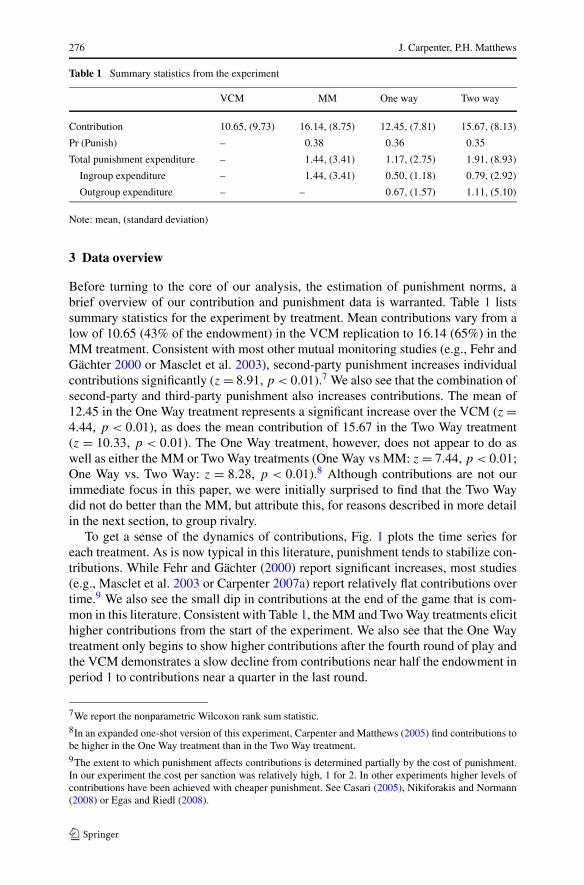
3 Data overview
Before turning to the core of our analysis, the estimation of punishment norms, abrief overview of our contribution and punishment data is warranted. Table 1 listssummary statistics for the experiment by treatment. Mean contributions vary from alow of 10.65 (43% of the endowment) in the VCM replication to 16.14 (65%) in theMM treatment. Consistent with most other mutual monitoring studies (e.g., Fehr andGächter 2000 or Masclet et al. 2003), second-party punishment increases individualcontributions significantly (z = 8.91, p < 0.01).7 We also see that the combination ofsecond-party and third-party punishment also increases contributions. The mean of12.45 in the One Way treatment represents a significant increase over the VCM (z =4.44, p < 0.01), as does the mean contribution of 15.67 in the Two Way treatment(z = 10.33, p < 0.01). The One Way treatment, however, does not appear to do aswell as either the MM or Two Way treatments (One Way vs MM: z = 7.44, p < 0.01;One Way vs. Two Way: z = 8.28, p < 0.01).8 Although contributions are not ourimmediate focus in this paper, we were initially surprised to find that the Two Waydid not do better than the MM, but attribute this, for reasons described in more detailin the next section, to group rivalry.
To get a sense of the dynamics of contributions, Fig. 1 plots the time series foreach treatment. As is now typical in this literature, punishment tends to stabilize con-tributions. While Fehr and Gächter (2000) report significant increases, most studies(e.g., Masclet et al. 2003 or Carpenter 2007a) report relatively flat contributions overtime.9 We also see the small dip in contributions at the end of the game that is com-mon in this literature. Consistent with Table 1, the MM and Two Way treatments elicithigher contributions from the start of the experiment. We also see that the One Waytreatment only begins to show higher contributions after the fourth round of play andthe VCM demonstrates a slow decline from contributions near half the endowment inperiod 1 to contributions near a quarter in the last round.
7We report the nonparametric Wilcoxon rank sum statistic.8In an expanded one-shot version of this experiment, Carpenter and Matthews (2005) find contributions tobe higher in the One Way treatment than in the Two Way treatment.9The extent to which punishment affects contributions is determined partially by the cost of punishment.In our experiment the cost per sanction was relatively high, 1 for 2. In other experiments higher levels ofcontributions have been achieved with cheaper punishment. See Casari (2005), Nikiforakis and Normann(2008) or Egas and Riedl (2008).

What norms trigger punishment? 277
Fig. 1 Contribution time series
Concerning punishment, it appears, based on the data in Table 1, that the likelihoodwith which a participant will sanction one of her teammates is similar across the threetreatments that allow punishment: slightly more than a third of the participants pun-ish. Indeed, none of the three proportions tests yielded significant results. Likewise,the overall punishment expenditures do not appear to be significantly different acrosstreatments. Participants tend to spend an average of about 1.5 EMUs on punishmentper round. Of course this average is low because most of the observations are zeros.Conditional on punishment, the average rises to 4.37 EMUs. We find it interestingthat players tend to spend the same amount on punishment in each of the treatmentsand that they devote about half of their resources to punishing outside their groups inthe outgroup treatments.10 At first blush, the fact that people tend to spend about thesame amount on punishment might make one think that the contribution norms areindependent of the treatments, but as we show in the next section, this is not the case.
4 What triggers norm enforcement?
Four principles informed our recovery of the norms used by participants to guidetheir punishment decisions. First, because we suspected that for most individuals, thedecisions whether or not to punish and how much to punish were not just two sides ofthe same coin, we concluded that the tobit model and its variants, a common frame-work in the literature, would be too restrictive. Indeed, one of the novel possibilitieswe wished to consider was whether these decisions were based on different norms.
Second, we did not assume, as much, if not all, of the empirical literature does,that the relevant norm for either decision is the “own group average.” Our motivation,however, was not to marshal evidence in favor of some preferred alternative, but
10These punishment results also differ from those in Carpenter and Matthews (2005), a one shot design.

278 J. Carpenter, P.H. Matthews
rather to confront the data with a broad, if not exhaustive, set of alternatives, anddiscover which fits the observed behavior of our subjects best.
Third, because we were also interested in the persistence of norm enforcement,both decisions were also allowed to depend on the extent of norm violation in theprevious round.
Last but not least, there is one sense in which our framework is more restrictivethan much of the literature: we assume that the likelihood of sanctions and the amountspent on punishment are continuous at their respective norms. In other words, wewant to rule out cases in which, for example, the sanctions imposed on someone whocontributed a little less than the norm are predicted to be much different than those onsomeone who contributed a little more. To this end, we used bilinear splines (Poirier1975) to model both decisions.11 In this case, the “bi” prefix refers to the fact that wespline on one’s deviation from the tested norm and the lag of one’s deviation fromthe group average contribution.
In retrospect, the four principles seem sensible ones. As we shall soon show, forexample, punishment is perhaps best treated as the result of two distinct decisionsmade under the influence of two distinct norms, neither of which is the own groupaverage.
Our basic econometric framework is:
p∗ij t = β0 + β1cjt + β2c̄gj t−1 + β3(cjt − γ
pt )+ + β4(c̄gj t−1 − γ
p
t−1)+
+ β5cjt c̄gj t−1 + β6cjt (c̄gj t−1 − γp
t−1)+ + β7(cjt − γ
pt )+c̄gj t−1
+ β8(cjt − γpt )+(c̄gj t−1 − γ
p
t−1)+ + μi + eij t
v∗ij t = α0 + α1cjt + α2c̄gj t−1 + α3(cjt − γ v
t )+ + α4(c̄gj t−1 − γ vt−1)
+
+ α5cjt c̄gj t−1 + α6cjt (c̄gj t−1 − γ vt−1)
+ + α7(cjt − γ vt )+c̄gj t−1
+ α8(cjt − γ vt )+(c̄gj t−1 − γ v
t−1)+ + ηi + uijt
vij t = 1 if v∗ij t > 0
pijt = p∗ij t vij t
where (a)+ = max[a,0], vij t is an indicator that subject i punished subject j in roundt , pijt is how much i spent to punish j in t , cjt is how much j contributed in t , c̄gj t−1
is the mean contribution of j ’s group in t − 1, γpt and γ v
t are the (to be determined)contribution norms in t , and μi and ηi are unobserved individual effects. It assumesthat without the information required to follow individual behavior from one roundto the next, it is the representative, or mean, contribution of the target group thatinfluences punishment in the current round.
Because it is reasonable to suppose that the unobserved sources of variation innorm enforcement will be uncorrelated with the contribution choices of others, μi and
11While the use of simple splines is common in economics, bilinear splines are unusual—for a recentexception, see Anderson and Meyer (1997)—and we are aware of no other papers in which the specificationis used to model an index function.

What norms trigger punishment? 279
ηi can be treated as uncorrelated (that is, random) effects. It would be unreasonable toassume a priori, however, that the decision to punish is unrelated to the idiosyncraticshock eij t , that is, to rule out selection effects. We therefore implement a version ofthe test described in Nijman and Verbeek (1992), one that exploits the panel structureof our data or, to be more precise, the correlation of the punishment indicator acrossrounds. In particular, if the indicator for the previous round, vij t−1, is incorporatedinto the expenditure or level equation, then under the null of no selection effect, itsestimated coefficient will be insignificant under a standard t-test.
There are two unusual, and context-specific, complications to consider, however.First, because subjects could not track one another from one round to the next, it madelittle (behavioral) sense to match the multiple punishment choices of each subject inthe current round pijt with the indicators for the previous round vij t−1. The problemis not as serious as first seems, however: since vij t−1 and vikt−1 must themselves becorrelated, such matches are not essential. On the other hand, if the modified test isto be persuasive, the results should not be sensitive to the choices of j and k.
Second, because the contribution norm γpt is unknown, the test statistics are also
conditional on its definition. With more than a dozen norms under consideration, itis at least possible, then, that the test results will differ across norms, with uncertainimplications.
As it turns out, however, our results are quite robust. In particular, there is littleevidence of a selection effect, across treatments or norms. In other results availableupon request, for example, we report test regressions and the coefficient on the lastround indicator is never significant at the 10% level. Furthermore, a comparison withthe reported results indicates that its inclusion has little effect on the other coefficientestimates. In other words we find that norm enforcement comprises two separatedecisions, first, whether or not to punish, and second, if so, how much to punish. Theimmediate practical benefit of this result is that it allows the parameters [α0, . . . , α7]and [β0, . . . , β7] to be estimated separately.
We allow fourteen different norms to go “head-to-head.” The first of these was thefixed or absolute norm γ v
t = γ vt−1 = k, where k is some integer between 0 and 25 cho-
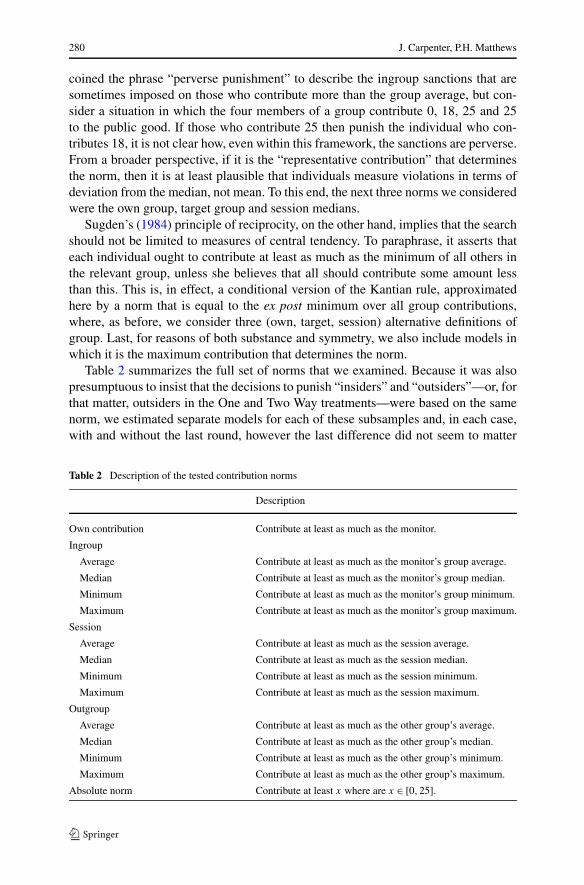
sen on the basis of a grid search.12 The second, the punisher’s own contribution, wasthe most relative of the norms we considered and, a priori, we did not expect eitherto fit the data all that well. Between these two extremes were twelve norms defined interms of group behavior, including, of course, the average contribution of group mem-bers. But which group? Do ingroup members judge outgroup contributions relative totheir own (in)group or to the outgroup or both? Because few experimental studies ofnorm enforcement concern third party punishment, these questions are seldom asked.But to the extent that social norms require the involvement of third parties, it matters,for example, whether the norms are not just relative, but local (Bendor and Swistak2001). It is for this reason that we consider not one but three average norms: owngroup, target group and session.
Even if norms are defined in terms of central tendency, it is not obvious thatthe mean is the appropriate measure. Cinyabuguma et al. (2006), for example, have
12With the possible exception of 12.5—that is, half the endowment—it seemed implausible to us that afixed and universal (in the sense that its value is known to all) norm would not be a whole number.
280 J. Carpenter, P.H. Matthews
coined the phrase “perverse punishment” to describe the ingroup sanctions that aresometimes imposed on those who contribute more than the group average, but con-sider a situation in which the four members of a group contribute 0, 18, 25 and 25to the public good. If those who contribute 25 then punish the individual who con-tributes 18, it is not clear how, even within this framework, the sanctions are perverse.From a broader perspective, if it is the “representative contribution” that determinesthe norm, then it is at least plausible that individuals measure violations in terms ofdeviation from the median, not mean. To this end, the next three norms we consideredwere the own group, target group and session medians.
Sugden’s (1984) principle of reciprocity, on the other hand, implies that the searchshould not be limited to measures of central tendency. To paraphrase, it asserts thateach individual ought to contribute at least as much as the minimum of all others inthe relevant group, unless she believes that all should contribute some amount lessthan this. This is, in effect, a conditional version of the Kantian rule, approximatedhere by a norm that is equal to the ex post minimum over all group contributions,where, as before, we consider three (own, target, session) alternative definitions ofgroup. Last, for reasons of both substance and symmetry, we also include models inwhich it is the maximum contribution that determines the norm.
Table 2 summarizes the full set of norms that we examined. Because it was alsopresumptuous to insist that the decisions to punish “insiders” and “outsiders”—or, forthat matter, outsiders in the One and Two Way treatments—were based on the samenorm, we estimated separate models for each of these subsamples and, in each case,with and without the last round, however the last difference did not seem to matter
Table 2 Description of the tested contribution norms
Description
Own contribution Contribute at least as much as the monitor.
Ingroup
Average Contribute at least as much as the monitor’s group average.
Median Contribute at least as much as the monitor’s group median.
Minimum Contribute at least as much as the monitor’s group minimum.
Maximum Contribute at least as much as the monitor’s group maximum.
Session
Average Contribute at least as much as the session average.
Median Contribute at least as much as the session median.
Minimum Contribute at least as much as the session minimum.
Maximum Contribute at least as much as the session maximum.
Outgroup
Average Contribute at least as much as the other group’s average.
Median Contribute at least as much as the other group’s median.
Minimum Contribute at least as much as the other group’s minimum.
Maximum Contribute at least as much as the other group’s maximum.
Absolute norm Contribute at least x where are x ∈ [0,25].
What norms trigger punishment? 281
Table 3 Log likelihoods for participant decisions under different norms
Ingroup punishment Outgroup punishment Outgroup punishment
(One way) (Two way)
Punish? Punishment Punish? Punishment Punish? Punishment
Own contribution −1409 −1416 −119 −83 −551 −553
Ingroup
Average −1442 −1415 −117 −86 −546 * −544
Median −1420 −1413 −118 −81 −547 −538
Minimum −1419 −1421 −117 −83 −556 −543
Maximum −1412 −1418 −111 −78 −555 −552
Session
Average −1409 −1415 −114 −74* −547 −540
Median −1413 −1416 −110 * −76 −549 −532 *
Minimum −1392 −1418 −116 −88 −552 −555
Maximum −1426 −1423 −124 −88 −556 −560
Outgroup
Average −121 −86 −559 −553
Median −120 −86 −554 −540
Minimum −122 −87 −557 −560
Maximum −122 −88 −552 −559
Absolute norm −1373 (24)∗ −1409 (9)∗ −111 (17) −84 (24) −547 (12) −537 (17)
Notes: All models estimated with random effects; (The best performing absolute norm); Best performingnorm indicated by ∗
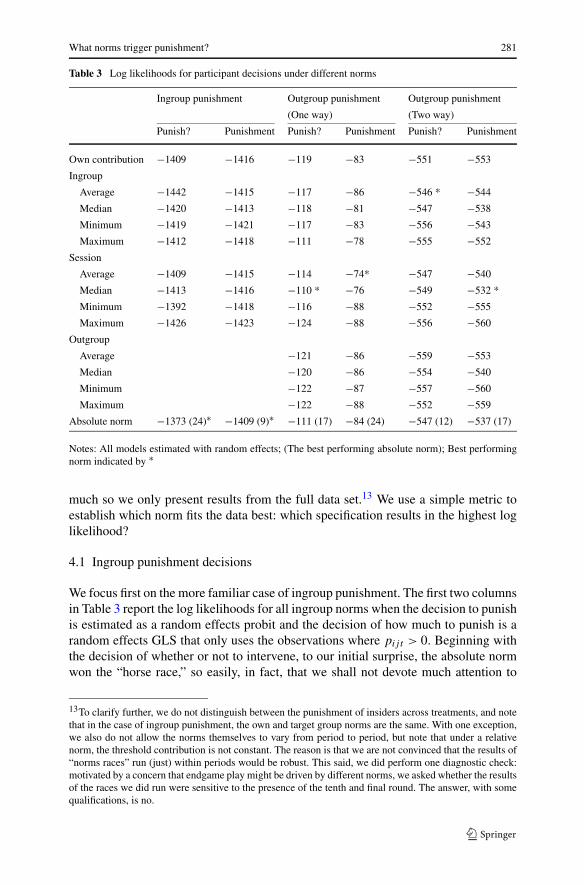
much so we only present results from the full data set.13 We use a simple metric toestablish which norm fits the data best: which specification results in the highest loglikelihood?
4.1 Ingroup punishment decisions
We focus first on the more familiar case of ingroup punishment. The first two columnsin Table 3 report the log likelihoods for all ingroup norms when the decision to punishis estimated as a random effects probit and the decision of how much to punish is arandom effects GLS that only uses the observations where pijt > 0. Beginning withthe decision of whether or not to intervene, to our initial surprise, the absolute normwon the “horse race,” so easily, in fact, that we shall not devote much attention to
13To clarify further, we do not distinguish between the punishment of insiders across treatments, and notethat in the case of ingroup punishment, the own and target group norms are the same. With one exception,we also do not allow the norms themselves to vary from period to period, but note that under a relativenorm, the threshold contribution is not constant. The reason is that we are not convinced that the results of“norms races” run (just) within periods would be robust. This said, we did perform one diagnostic check:motivated by a concern that endgame play might be driven by different norms, we asked whether the resultsof the races we did run were sensitive to the presence of the tenth and final round. The answer, with somequalifications, is no.
282 J. Carpenter, P.H. Matthews
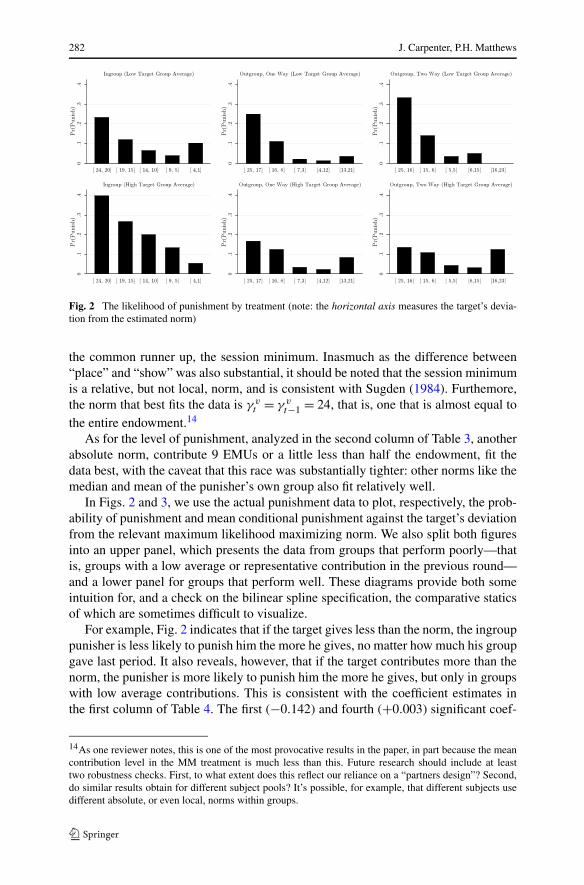
Fig. 2 The likelihood of punishment by treatment (note: the horizontal axis measures the target’s devia-tion from the estimated norm)
the common runner up, the session minimum. Inasmuch as the difference between“place” and “show” was also substantial, it should be noted that the session minimumis a relative, but not local, norm, and is consistent with Sugden (1984). Furthemore,the norm that best fits the data is γ v
t = γ vt−1 = 24, that is, one that is almost equal to
the entire endowment.14
As for the level of punishment, analyzed in the second column of Table 3, anotherabsolute norm, contribute 9 EMUs or a little less than half the endowment, fit thedata best, with the caveat that this race was substantially tighter: other norms like themedian and mean of the punisher’s own group also fit relatively well.
In Figs. 2 and 3, we use the actual punishment data to plot, respectively, the prob-ability of punishment and mean conditional punishment against the target’s deviationfrom the relevant maximum likelihood maximizing norm. We also split both figuresinto an upper panel, which presents the data from groups that perform poorly—thatis, groups with a low average or representative contribution in the previous round—and a lower panel for groups that perform well. These diagrams provide both someintuition for, and a check on the bilinear spline specification, the comparative staticsof which are sometimes difficult to visualize.
For example, Fig. 2 indicates that if the target gives less than the norm, the ingrouppunisher is less likely to punish him the more he gives, no matter how much his groupgave last period. It also reveals, however, that if the target contributes more than thenorm, the punisher is more likely to punish him the more he gives, but only in groupswith low average contributions. This is consistent with the coefficient estimates inthe first column of Table 4. The first (−0.142) and fourth (+0.003) significant coef-
14As one reviewer notes, this is one of the most provocative results in the paper, in part because the meancontribution level in the MM treatment is much less than this. Future research should include at leasttwo robustness checks. First, to what extent does this reflect our reliance on a “partners design”? Second,do similar results obtain for different subject pools? It’s possible, for example, that different subjects usedifferent absolute, or even local, norms within groups.

What norms trigger punishment? 283
Tabl
e4
Ran
dom
effe
cts
estim
ates
ofpa
rtic
ipan
tpun
ishm
entd
ecis
ions
Sam
ple:
Ingr
oup
Out
grou
p(O
new
ay)
Out
grou
p(T
wo
way
)
Dec
isio
n:Pu
nish
?Pu
nish
men
tPu
nish
?Pu
nish
men
tPu
nish
?Pu
nish
men
t
Nor
m:
Abs
olut
e(2
4)A
bsol
ute
(9)
Sess
ion
Med
ian
Sess
ion
Ave
rage
Ow
nA
vera
geSe
ssio
nM
edia
n
c jt
−0.1
420.
259
−0.1
67−0
.048
−0.1
12−0
.151
[0.01
7]∗∗∗
[0.33
6][0.
077]
∗∗[0.
315]
[0.02
4]∗∗∗
[0.12
4]cgjt−
10.
051
0.45
60.
130
1.33
10.
028
0.05
[0.01
3]∗∗∗
[0.13
3]∗∗∗
[0.05
0]∗∗∗
[0.14
8]∗∗∗
[0.02
2][0.
101]
(cjt−
γt)
+4.
047
1.43
9−0
.210
0.93
80.
208
3.65
3
[0.50
9]∗∗∗
[1.91
0][0.
224]
[1.77
8][0.
057]∗
∗∗[0.
477]∗
∗∗(c
gjt−
1−
γt−
1)+
0.41
4−0
.420
−0.1
65−1
.872
−0.1
600.
117
[0.41
5][0.
157]∗
∗∗[0.
084]∗
∗[0.
322]∗
∗∗[0.
064]∗
∗[0.
292]
c jtc
gjt−
10.
003
−0.0
670.
001
−0.0
440.
002
0.00
5
[0.00
1]∗∗∗
[0.04
0]∗[0.
005]
[0.02
2]∗∗
[0.00
1]∗[0.
007]
c jt(
cgjt−
1−
γt−
1)+
−0.0
110.
076
−0.0
010.
032
0.00
8−0
.029
[0.02
5][0.
043]∗
[0.01
2][0.
054]
[0.00
3]∗∗
[0.03
2](c
jt−
γt)
+ cgjt−
1−0
.246
−0.1
140.
038
−0.0
150.
100
−0.2
11
[0.03
0]∗∗∗
[0.21
4][0.
017]∗
∗[0.
150]
[0.00
3]∗∗∗
[0.03
1]∗∗∗
(cjt−
γt)
+ (cgjt−
1−
γt−
1)+
−0.0
210.
091
−0.0
260.
092
−0.0
010.
142
[0.49
4][0.
216]
[0.03
2][0.
260]
[0.00
5][0.
063]∗
∗C
onst
ant
−0.8
990.
156
−3.1
78−7
.916
−1.8
242.
891
[0.17
7]∗∗∗
[1.03
7][0.
962]∗
∗∗[1.
482]∗
∗∗[0.
319]∗
∗∗[1.
492]∗
Obs
erva
tions
4751
603
1296
3437
4419
9
Gro
ups
176
134
3612
104
42
Not
es:S
tand
ard
erro
rsin
squa
rebr
acke
ts.O
ne,t
wo
and
thre
est
ars
deno
tesi
gnifi
canc
eat
the
10%
,5%
and
1%le
vels
284 J. Carpenter, P.H. Matthews
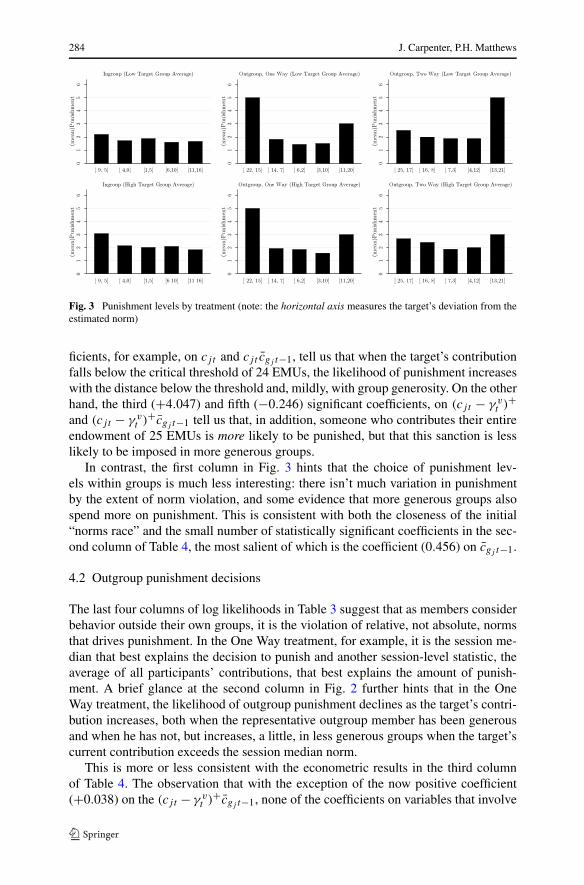
Fig. 3 Punishment levels by treatment (note: the horizontal axis measures the target’s deviation from theestimated norm)
ficients, for example, on cjt and cjt c̄gj t−1, tell us that when the target’s contributionfalls below the critical threshold of 24 EMUs, the likelihood of punishment increaseswith the distance below the threshold and, mildly, with group generosity. On the otherhand, the third (+4.047) and fifth (−0.246) significant coefficients, on (cjt − γ v
t )+and (cjt − γ v
t )+c̄gj t−1 tell us that, in addition, someone who contributes their entireendowment of 25 EMUs is more likely to be punished, but that this sanction is lesslikely to be imposed in more generous groups.
In contrast, the first column in Fig. 3 hints that the choice of punishment lev-els within groups is much less interesting: there isn’t much variation in punishmentby the extent of norm violation, and some evidence that more generous groups alsospend more on punishment. This is consistent with both the closeness of the initial“norms race” and the small number of statistically significant coefficients in the sec-ond column of Table 4, the most salient of which is the coefficient (0.456) on c̄gj t−1.
4.2 Outgroup punishment decisions
The last four columns of log likelihoods in Table 3 suggest that as members considerbehavior outside their own groups, it is the violation of relative, not absolute, normsthat drives punishment. In the One Way treatment, for example, it is the session me-dian that best explains the decision to punish and another session-level statistic, theaverage of all participants’ contributions, that best explains the amount of punish-ment. A brief glance at the second column in Fig. 2 further hints that in the OneWay treatment, the likelihood of outgroup punishment declines as the target’s contri-bution increases, both when the representative outgroup member has been generousand when he has not, but increases, a little, in less generous groups when the target’scurrent contribution exceeds the session median norm.
This is more or less consistent with the econometric results in the third columnof Table 4. The observation that with the exception of the now positive coefficient(+0.038) on the (cjt − γ v
t )+c̄gj t−1, none of the coefficients on variables that involve

What norms trigger punishment? 285
(cjt − γ vt )+ are significant tells us, for example, the v-shape that characterizes pun-
ishment probabilities within groups is absent in the One Way treatment. In fact, itfurther implies that instead of a “flattened v” as group average contribution rises, oneway outgroup punishment exhibits the opposite comparative static, namely, an almostmonotonically decreasing likelihood of punishment function that becomes more, notless, v-shaped as mean contribution rises.
In contrast to the data on incidence, the second column of Fig. 3 seems consis-tent with the existence of a pronounced v-shape in One Way punishment levels. Wesuspect this is an artifact of the relatively coarse classification of norm violations,however. Neither the coefficient on cjt nor that on (cjt − γ v
t )+ reported in Table 4is statistically significant. Our econometric results—in particular, the significant neg-ative coefficient on (c̄gj t−1 − γ v
t−1)+—also imply that outgroup punishment in the
One Way treatment tends to decrease as the target’s group becomes more generous,another feature not easily discerned in Fig. 3.
Outgroup punishment in the Two Way treatment reflects the application of differ-ent norms than the One Way but, as Figs. 2 and 3 suggest, otherwise exhibits many ofthe same patterns. We first note that decision to punish outgroup members in the TwoWay treatment is the only case in which the inferred norm is own group average, thedefault specification in most of the literature. This said, the session median “wins therace” for the norm that explains the amount of punishment inflicted.
The second and third columns in Fig. 2 show that although the norms themselvesare different, the shapes of the likelihood of punishment functions are similar in theOne and Two Way treatments: if anything, the Two Way pattern appears to be a morepronounced version of the One Way. The probit results reported in the fifth column ofTable 4 support this view. In particular, the likelihood of punishment decreases as thetarget contributes more, conditional on the generosity of the entire group. If the targetcontributes less than the norm, the punisher is less likely to intervene as contributionsrise in less generous groups, and no more or less likely to intervene in more generousgroups. If, on the other hand, the target contributes more than the norm, the punisheris more likely to punish him, but only if the group was generous.
Strikingly, the last column of Fig. 3 is almost a mirror image of the second column,suggesting that, conditional on the different norms at work and the decision to punish,the level of punishment associated with particular norm violations are quite similar.This is consistent with the econometric results in the last column of Table 4. Osten-tatious contributors in poorly performing groups are punished severely by outsiders,but this effect is dramatically attenuated in generous groups.
5 Concluding remarks
Overall, we find considerable diversity in the inferred norms driving punishmentbehavior in social dilemma experiments. That said, some themes have emerged. Itappears, for example, that while punishment decisions in- and outside groups aredriven by different norms, the norms in our two outgroup treatments are similar. In-side groups, punishers tend to use simple absolute rules to determine violations whilethey are more circumspect when considering violations in other groups. Here, relativenorms seem to be more important.

286 J. Carpenter, P.H. Matthews
Our econometric specification highlights two dimensions on which punishmentdecisions are made: contribution deviations of the target and the generosity of thetarget’s group. It is interesting to conjecture about what the shapes of the punishmentfunctions might be telling us. Consistent with what we found in a one-shot environ-ment (Carpenter and Matthews 2005), the v-shaped pattern of ingroup punishmentmight be consistent with conformity. Here both free riders and ostentatious contribu-tors are disciplined. However, as we have seen this pattern changes when the groupsbecome more generous. In this case, downward sloping functions are more consistentwith promoting efficiency. These patterns are more interesting in the outgroup databecause they tend to be the opposite of what we find in the ingroup data. Here groupsthat are not doing well benefit from downward sloping, efficiency enhancing punish-ment choices, but, curiously, the punishment tends to shift more towards higher thannormal contributors when the target groups are doing better. Could this be evidenceof inter-group competition? When punishers look at targets in the other group theymight want to help the group if it is doing relatively poorly, but they might also wantto try to sabotage it when it is doing really well.
Three other themes emerge from our work. First, we find that the decision to sanc-tion someone else is separable from the (conditional) decision about the level of sanc-tions. In this context, we would conjecture that neurological evidence (de Quervainet al. 2004; Singer et al. 2006) that norm enforcement is “pleasurable” concerns thefirst decision more than the second, but this is a matter for future research. In broaderterms, if norm enforcement embodies the “action tendencies” of several differentemotions, there is much to learn about their respective roles.
Second, there is, at best, limited evidence that the norm often assumed to driveboth decisions—that is, the local or own group average—is responsible for either, aresult that, if robust, has serious implications for the interpretation of experimentaldata on sanctions and rewards. This seems even more important given recent cross-cultural research that shows that these norms may vary by location (Henrich et al.2006; Herrmann et al. 2008). While the method described herein is useful, especiallygiven these differences by subject pool, we do not pretend, of course, that our identifi-cation of alternative norms is definitive, and perceive at least two directions for futureresearch. The first, parametric, approach would post some “universal norm” as theconvex combination of a small number of the norms considered here—one absoluteand one relative, for example—and then calculate maximum likelihood weights foreither or both decisions, within and across groups. A second, more ambitious, ap-proach would attempt to achieve identification through experimental design, and welook forward to learning how other researchers do so.
Third, if, as expected, fewer and smaller sanctions are imposed on the members ofother groups, there is also some evidence that the reasons for their imposition differ,too. That is, the punishment inflicted on outsiders is not just a muted version of thatsometimes imposed on insiders. To the extent that the adoption of social norms ispredicated on third party punishment, the emphasis on second party punishment inthe literature seems misplaced.

What norms trigger punishment? 287
References
Anderson, P. M., & Meyer, B. D. (1997). Unemployment insurance takeup rates and the after-tax value ofbenefits. Quarterly Journal of Economics, 112, 913–937.
Anderson, C., & Putterman, L. (2005). Do non-strategic sanctions obey the law of demand? The demandfor punishment in the voluntary contribution mechanism. Games and Economic Behavior, 54(1),1–24.
Bendor, J., & Swistak, P. (2001). The evolution of norms. American Journal of Sociology, 106(6), 1493–1545.
Carpenter, J. (2007a). Punishing free-riders: How group size affects mutual monitoring and the provisionof public goods. Games and Economic Behavior, 60(1), 31–51.
Carpenter, J. (2007b). The demand for punishment. Journal of Economic Behavior & Organization, 62(4),522–542.
Carpenter, J., & Matthews, P. (2005). Norm enforcement: Anger, indignation, or reciprocity. Departmentof Economics, Middlebury College, Working Paper 0503.
Carpenter, J., & Matthews, P. (2008). Norm enforcement: The role of third parties. Middlebury CollegeDepartment of Economics Working Paper.
Carpenter, J., Bowles, S., Gintis, H., & Hwang, S.-H. (2008, forthcoming). Strong reciprocity and teamproduction, Journal of Economic Behavior & Organization.
Casari, M. (2005). On the design of peer punishment experiments. Experimental Economics, 8(2), 107–115.
Cinyabuguma, M., Page, T., & Putterman, L. (2006). Can second-order punishment deter perverse punish-ment? Experimental Economics, 9, 265–279.
de Quervain, D., Fischbacher, U., Treyer, V., Schellhammer, M., Schnyder, A. et al. (2004). The neuralbasis for altruistic punishment. Science, 305(27), 1254–1258.
Decker, T., Stiehler, A., & Strobel, M. (2003). A comparison of punishment rules in repeated public goodsgames: An experimental study. Journal of Conflict Resolution, 47(6), 751–772.
Egas, M., & Riedl, A. (2008). The economics of altruistic punishment and the maintenance of cooperation.Proceedings of the Royal Society B, 275(1637), 871–878.
Ertan, A., Page, T., & Putterman, L. (2005). Can endogenously chosen institutions mitigate the free-riderproblem and reduce perverse punishment? Department of Economics, Brown University WorkingPaper.
Falk, A., Fehr, E., & Fischbacher, U. (2005). Driving forces of informal sanctions. Econometrica, 7(6),2017–2030.
Falkinger, J. (1996). Efficient private provision of public goods by rewarding deviations from average.Journal of Public Economics, 62(3), 413–422.
Falkinger, J. (2006). Non-governmental public norm enforcement in large societies. Socioeconomic Insti-tute, University of Zurich Working Paper.
Falkinger, J., Fehr, E., Gächter, S., & Winter-Ebmer, R. (2000). A simple mechanism for the efficientprovision of public goods—experimental evidence. American Economic Review, 90(1), 247–264.
Fehr, E., & Fischbacher, U. (2004). Third party punishment and social norms. Evolution and HumanBehavior, 25, 63–87.
Fehr, E., & Gächter, S. (2000). Cooperation and punishment in public goods experiments. American Eco-nomic Review, 90(4), 980–994.
Gächter, S., & Herrmann, B. (2006). The limits of self-governance in the presence of spite: Experimentalevidence from urban and rural Russia. IZA Discussion Paper 2236.
Henrich, J., McElreath, R., Barr, A., Ensminger, J., Barrett, C. et al. (2006). Costly punishment acrosshuman societies. Science, 312(23), 1767–1770.
Herrmann, B., Thöni, C., & Gächter, S. (2008). Antisocial punishment across societies. Science,319(5868), 1362–1367.
Isaac, R. M., Walker, J., & Thomas, S. (1984). Divergent evidence on free-riding: An experimental exam-ination of possible explanations. Public Choice, 43(1), 113–149.
Kosfeld, M., Okada, A., & Riedl, A. (2006). Institution formation in public goods games. University ofZurich Working Paper.
Latane, B., & Darley, J. (1970). The unresponsive bystander: Why doesn’t he help? New York: Appleton.Ledyard, J. (1995). Public goods: A survey of experimental research. In J. Kagel & A. Roth (Eds.), The
handbook of experimental economics (pp. 111–194). Princeton: Princeton University Press.Masclet, D., Noussair, C., Tucker, S., & Villeval, M.-C. (2003). Monetary and nonmonetary punishment
in the voluntary contributions mechanism. American Economic Review, 93(1), 366–380.
288 J. Carpenter, P.H. Matthews
Nijman, T., & Verbeek, M. (1992). Nonresponse in panel data: The impact of estimates of the life cycleconsumption function. Journal of Applied Econometrics, 7, 243–257.
Nikiforakis, N. (2008). Punishment and counter-punishment in public goods games: Can we still governourselves? Journal of Public Economics, 92, 91–112.
Nikiforakis, N., & Normann, H.-T. (2008). A comparative statics analysis of punishment in public-goodexperiments. Experimental Economics, 11, 358–369.
Ones, U., & Putterman, L. (2007). The ecology of collective action: A public goods and sanctions experi-ment with controlled group formation. Journal of Economic Behavior & Organization, 62, 495–521.
Poirier, D. J. (1975). On the use of bilinear splines in economics. Journal of Econometrics, 3, 23–34.Sefton, M., Shupp, R., & Walker, J. (2005). The effect of rewards and sanctions in provision of public
goods. Department of Economics Indiana University Working Paper.Singer, T., Seymour, B., O’Doherty, J., Stephan, K., Dolan, R. et al. (2006). Empathic neural responses
are modulated by the perceived fairness of others. Nature, 439, 466–469.Sugden, R. (1984). Reciprocity: The supply of public goods through voluntary contributions. Economic
Journal, 94(376), 772–787.