What Makes Nations Intelligent?
24
http://pps.sagepub.com/ Science Perspectives on Psychological http://pps.sagepub.com/content/7/3/284 The online version of this article can be found at: DOI: 10.1177/1745691612442905 2012 7: 284 Perspectives on Psychological Science Earl Hunt What Makes Nations Intelligent? Published by: http://www.sagepublications.com On behalf of: Association For Psychological Science can be found at: Perspectives on Psychological Science Additional services and information for http://pps.sagepub.com/cgi/alerts Email Alerts: http://pps.sagepub.com/subscriptions Subscriptions: http://www.sagepub.com/journalsReprints.nav Reprints: http://www.sagepub.com/journalsPermissions.nav Permissions: at NORTH CAROLINA STATE UNIV on November 8, 2012 pps.sagepub.com Downloaded from
Transcript of What Makes Nations Intelligent?
http://pps.sagepub.com/Science
Perspectives on Psychological
http://pps.sagepub.com/content/7/3/284The online version of this article can be found at:
DOI: 10.1177/1745691612442905
2012 7: 284Perspectives on Psychological ScienceEarl Hunt
What Makes Nations Intelligent?
Published by:
http://www.sagepublications.com
On behalf of:
Association For Psychological Science
can be found at:Perspectives on Psychological ScienceAdditional services and information for
http://pps.sagepub.com/cgi/alertsEmail Alerts:
http://pps.sagepub.com/subscriptionsSubscriptions:
http://www.sagepub.com/journalsReprints.navReprints:
http://www.sagepub.com/journalsPermissions.navPermissions:
at NORTH CAROLINA STATE UNIV on November 8, 2012pps.sagepub.comDownloaded from
Perspectives on Psychological Science7(3) 284 –306© The Author(s) 2012Reprints and permission: sagepub.com/journalsPermissions.navDOI: 10.1177/1745691612442905http://pps.sagepub.com
Are some nations smarter than others? If they are, does it make any difference? The gist of this article is that the answer to both questions is “yes.” The argument is presented in five sec-tions. First, some data will be presented showing how heavily modern society depends on cognitive skills. Second, there will be a presentation of a model of the development of individual cognitive skills, emphasizing the importance of these skills in the industrial and postindustrial societies. The third section discusses the measurement of national intelligence and corre-lates of those measurements. The fourth discusses genetic and environmental influences on national supplies of cognitive skills. The fifth and final section discusses conceptual issues associated with the idea of national cognitive skills.
Before beginning the substantive discussion, a brief word about terminology is in order. From a rhetorical perspective, the simplest way to present this article would be to discuss national intelligence. However, the word “intelligence” has acquired a great deal of rhetorical baggage. To some, the word brings up images of genetically determined cognitive power. Such an interpretation would raise issues that are not germane to the discussion here. Therefore, in order to avoid unneces-sary controversy, I will follow the example of Schmidt and Hunter (1998) and use the term general cognitive ability (GCA). This is meant to refer to the general factor associated with, and revealed in performance on, a variety of assessments of cognitive skills. These assessments include many avowedly educational exams, where educational achievement is associ-ated with GCA.
A discussion of national differences obviously has to have terms to refer to groups of nations. A variety of terms are in common use, including “developed,” “developing,” “first [second, third] world,” and “modern versus traditional” societ-ies. All these terms have problems. Probably the most accept-able is the “developed”–“developing” distinction, largely because these are the terms used by many international agen-cies to classify nations. Thus, Switzerland is a developed country, while Senegal is a developing country. This contrast is not suitable for the present purposes, for it implies that there is an arc of development that nations should, or perhaps must, follow in order to become “developed.” (At some future time, will Senegal be just like Switzerland? If there is no such time, does this mean that Senegal will forever have a gap in its development?) To avoid this issue, I will use terms that, inso-far as possible, describe the dominant features of a country’s socioeconomic structure. In particular, countries such as the United States, Canada, Europe, and Japan will be referred to as industrial and postindustrial countries (I&PI). In most cases, all that will be needed is a distinction between I&PI and non-I&PI countries (again, like Senegal). It is important to remem-ber that the I&PI versus non-I&PI distinction is a fuzzy one. Many countries (e.g., Chile) are moving toward I&PI society
Corresponding Author:Earl Hunt, Department of Psychology, Box 1525, University of Washington, Seattle, WA 98195 E-mail: [email protected]
What Makes Nations Intelligent?
Earl HuntDepartment of Psychology, University of Washington, Seattle
Abstract
Modern society is driven by the use of cognitive artifacts: physical instruments or styles of reasoning that amplify our ability to think. The artifacts range from writing systems to computers. In everyday life, a person demonstrates intelligence by showing skill in using these artifacts. Intelligence tests and their surrogates force examinees to exhibit some of these skills but not others. This is why test scores correlate substantially but not perfectly with a variety of measures of socioeconomic success. The same thing is true at the international level. Nations can be evaluated by the extent to which their citizens score well on cognitive tests, including both avowed intelligence tests and a variety of tests of academic achievement. The resulting scores are substantially correlated with various indices of national wealth, health, environmental quality, and schooling and with a vaguer variable, social commitment to innovation. These environmental variables are suggested as causes of the differences in general cognitive skills between national populations. It is conceivable that differences in gene pools also contribute to international and, within nations, group differences in cognitive skills, but at present it is impossible to evaluate the extent of genetic influences.
Keywords
behavioral economics, education, cognition, individual differences
at NORTH CAROLINA STATE UNIV on November 8, 2012pps.sagepub.comDownloaded from
What Makes Nations Intelligent 285
but still have substantial portions of their populations outside of the I&PI system.
On occasion, it will be appropriate to refer to countries by region, such as the sub-Saharan African or Latin American countries, or by some dominant feature of their society, for example, Islamic countries.
Our Cognitive SocietyArchaeologists identify periods of hominid development by the tools that the hominids used. Australopithecines made the crude Olduwan stone tools 2.5 million years ago. The Paleo-Indians of North America fashioned the elegant stone Clovis spear points just 12,000 to 14,000 years ago. For most of hom-inid history, tools were developed in order to extend human physical capacities, making it possible to break open oyster shells with a hand axe and then, millennia later, hunt bison with a bow and arrow. Tools to develop physical capacities are still being developed. Today we can fly.
About 10,000 years ago, a radically new type of tool appeared, the cognitive artifact. Rudimentary number sys-tems, and then techniques of writing, were developed (Wolf, 2008). Number systems led to logical reasoning. Writing made it possible to communicate ideas across space and (one way) through time. The King James Bible, written in the 17th cen-tury, contains information collected from original writings in the first century of the current era, strained through the social and political thinking of England’s Jacobian era. The King James Bible is still being read in the 21st century (Nicolson, 2005).
Cognitive artifacts were being shaped by society, and were shaping society, long before the King James Bible. A Sume-rian clay scroll dating from roughly 3000 BCE said:
The day the import of your tablet was made known to me, I provided your agent with three minas of silver for the purchase of lead. Now, if you are still my brother, let me have my money by courier. (James & Thorp, 1994, p. 521)
The scroll was an invoice. On its face, the scroll revealed a society that had three extremely important cognitive artifacts: literacy, arithmetic, and a monetary system. Indirectly it implied three other things: a society that communicated at a distance, that could develop social contracts, and in which people had a sense of honor and obligation, at least between those who saw themselves as spiritual brothers.
Cognitive artifacts fall into two broad classes. Physical artifacts, such as the scroll itself and its inscribed writing sys-tem, are physical devices that can be used to extend cognitive and perceptual functions. Mental artifacts, such as logic and the scientific method of reasoning, are ways of thinking that are used to reason effectively about the phenomena we observe. Table 1 lists just a few of our modern cognitive arti-facts. The list includes physical artifacts, like computers, and
mental artifacts, such as logic, that bring order to our thinking. In order to be successful in our society, a person has to have the abilities required to use these artifacts.
In theory, a society that contains specialized cognitive tools might offer ecological niches to people with a variety of cog-nitive skills. Instead, however, modern society appears to demand a GCA that can then be shaped into specialized skills by training. This can be shown by an analysis of the cognitive requirements of different occupations.
The Department of Labor maintains a database, O*NET, that contains ratings of the cognitive skills required in over 850 occupations, ranging from physicist to clothing model. Jobholders within these occupations constitute over 90% of the American workforce. Occupations are rated for 20 differ-ent cognitive skills, ranging from hand–eye coordination to the ability to understand both spoken and written language. Hunt and Madhyastha (2012) found that variation in the need for these skills, across occupations, could be represented in a space defined by three orthogonal factors. The largest factor, which accounted for 45% of the generalized variance in the ratings, was a GCA factor. It had substantial loadings on almost every one of the skill ratings, with the highest loadings being on tasks involving logical reasoning and/or language comprehension. The American workplace evidently demands a high level of general ability, but with a strong verbal flavor. The second factor, perceptual and attentional skills, accounted for 19% of the variance, and the third factor, numerical skills, accounted for only 10%.
If GCA is in such high demand, one would expect the workplace to pay for it. This is so. Median incomes, across occupations, are exponentially related to the level of GCA required by the occupation (R2 = .60).1
With a very few exceptions, people who want a rewarding place in a developed society have to bring intelligence both to the workplace and to their daily lives. Gottfredson (1997) made this point elegantly, by arguing that so much of our everyday activities require cognitive guidance that daily life is, in a way, an intelligence test. The difficulty of this test has increased as society has become more complex, interdepen-dent, and technologically oriented. A century ago, consumer
Table 1. An Incomplete List of the Cognitive Artifacts Central to Modern Society
Physical cognitive artifacts Mental cognitive artifacts
Written documents LiteracyMaps MathematicsPrinting LawTelecommunication LogicComputers and electronics Scientific reasoningGlobal positioning via satellites Formal systems of finance and
banking
Note. Cognitive artifacts are listed in their historical order of origin.
at NORTH CAROLINA STATE UNIV on November 8, 2012pps.sagepub.comDownloaded from

286 Hunt
credit management was an easily solved problem. Unless you were wealthy, you paid cash. Today there are a bewildering number of choices, and paradoxically, the tools for managing personal wealth are more likely to be available to the well-to-do than to the poor (Bertrand, Mullainathan, & Shafir, 2006). Similarly, within developed societies, health management is increasingly dependent on a person’s understanding of medi-cal advice, both to avoid problems and to manage illnesses. Such understanding is directly related to literacy skills, which are in turn an indicator of general intelligence (Gottfredson, 2004). In order to be healthy and wealthy, it helps to be wise.
And how do we become wise? GCA is used directly, to solve problems faced in the workplace and in daily life, and indirectly, to benefit from training required to develop special-ized skills. Today we see specialization in the extreme. To illustrate, in Hunt and Madhyastha’s (2012) data set, two of the occupations with the highest GCA factor scores were phys-icists and surgeons. Obviously physicists and surgeons know different things and have different skills. In both cases, the acquisition of the necessary knowledge and skill depends on possession of a high level of GCA. Interactions between per-sonal interests, personality, and opportunity will determine how GCA is shaped into usable cognitive skills.
The relation between GCA and training is particularly impor-tant, for education pays. In 2010, during a substantial recession, adults over 25 who were employed full time and held doctorates and professional degrees earned approximately 2.5 times more than fully employed high school graduates. Even more impor-tant, the degree holders were five times more likely to be employed than were the high school graduates.2
The Conceptualization of General Cognitive AbilityThe conceptualization used here
The position taken here is that an individual displays GCA by solving the problems presented by his or her society. In I&PI societies, such problem solving typically involves use of both physical and mental cognitive artifacts. This conceptualization of cognitive ability was initially presented as part of collabora-tive work with Jerry Carlson (Hunt & Carlson, 2007) and is further elaborated upon in Hunt (2011). It differs from the view that the primary role of a theory of GCA is to explain individual differences in test scores. However, the evidence gathered by studying test scores is regarded as relevant to the understanding of both individual and national GCA. My posi-tion is close to some of the views expressed in Robert Stern-berg’s many writings on the importance of “practical intelligence” (e.g., Sternberg et al., 2000) and to Philip Acker-man’s emphasis on knowledge as being the “dark matter” of adult intelligence that is unevaluated by conventional tests (Ackerman, 2000). The two features that I believe are unique are the emphasis on the use of cognitive artifacts as being a central feature of GCA and the argument that the concept of
cognitive ability can usefully be generalized to apply to large social groups, rather than being confined to individuals.
History provides us with an example of both the use of cog-nitive artifacts and the idea that societies can differ in their level of GCA. When the “Black Death” (bubonic plague) out-break occurred in the 14th century, the disease was variously blamed on the sinful acts of the population and foul air ema-nating from the corpses of the victims. Among the actions taken were prayer, the granting of indulgences, and vigorous programs of corpse burning. Today we treat bubonic plague as a bacterial infection and have identified the flea as a vector of the disease. Our methods of prevention rely on cognitive arti-facts, ranging from the germ theory of disease (a mental cogni-tive artifact) to the use of the media (physical cognitive artifacts) to spread information about disease control. In addi-tion to specialized knowledge, the modern approach relies on GCAs, including ways of thinking about disease, which were not available to medieval society.3
It follows that an individual’s level of GCA is the result of a developmental process in which a person acquires expertise in the use of the cognitive artifacts available in his or her soci-ety (Hunt, 2011). This view has precedents, especially in the work of Stephen Ceci (1990). Once again, though, the model proposed here differs from earlier ones in its emphasis on the role of cognitive artifacts. This point is clear when we consider how intelligence is developed over time.
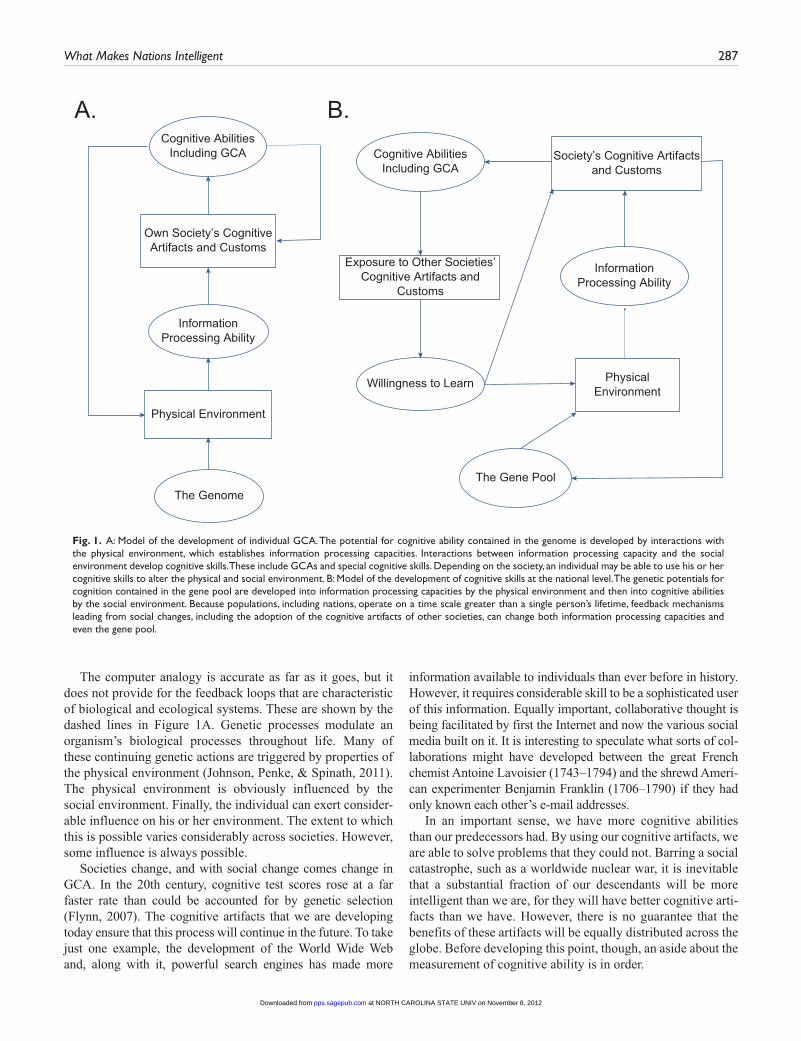
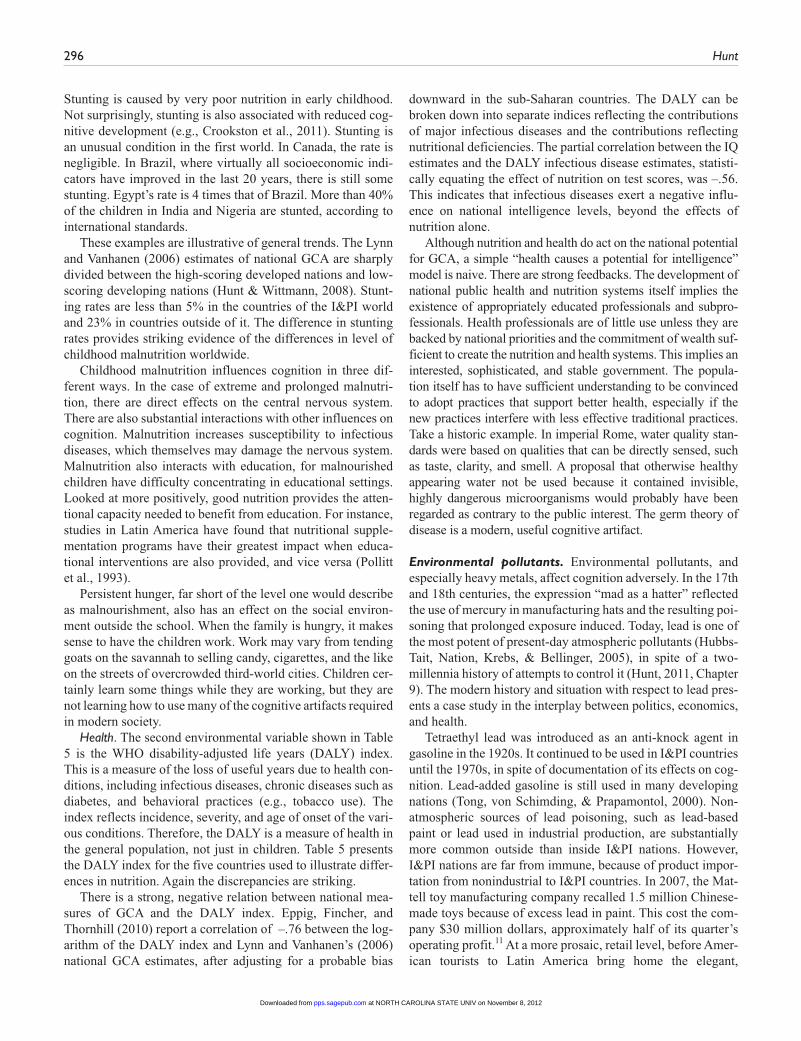
The developmental process is outlined in Figure 1A. The panel shows three classes of influences on cognitive ability: genetics, the physical environment, and the social environment. A naive view of intelligence is that it is a con-structed process, rather like building a computer. The com-puter builder begins with a plan, uses that plan to assemble devices available in the physical environment (once a com-plex of circuits and vacuum tubes, now an array of silicon chips and information storage devices), and when the physi-cal computer is developed, it is exposed to the social envi-ronment (software), to create a device that, at least by some definitions, can think. The process of giving cognitive abili-ties to a computer can serve as a first approximation to the development of GCA in people. It is captured in the solid arrows in the panel.
Cognitive ability is not inherited directly. The genetic potential for acquiring cognitive ability is. There is ample evi-dence that individuals differ in their genetic potentials. That potential is then developed, in two ways. The first develop-ment depends on the physical environment, which includes such things as nutrition and the extent of exposure to infec-tious disease. The physical environment influences the brain processes and functions that provide the individual with infor-mation processing capacities, such as the working memory–attention complex. These are not cognitive abilities in themselves, any more than a carpenter’s tools are equivalent to a carpenter’s skills. Cognitive abilities are acquired when the brain is filled with the knowledge and techniques of reasoning that are known to the person’s society.
at NORTH CAROLINA STATE UNIV on November 8, 2012pps.sagepub.comDownloaded from
What Makes Nations Intelligent 287
The computer analogy is accurate as far as it goes, but it does not provide for the feedback loops that are characteristic of biological and ecological systems. These are shown by the dashed lines in Figure 1A. Genetic processes modulate an organism’s biological processes throughout life. Many of these continuing genetic actions are triggered by properties of the physical environment (Johnson, Penke, & Spinath, 2011). The physical environment is obviously influenced by the social environment. Finally, the individual can exert consider-able influence on his or her environment. The extent to which this is possible varies considerably across societies. However, some influence is always possible.
Societies change, and with social change comes change in GCA. In the 20th century, cognitive test scores rose at a far faster rate than could be accounted for by genetic selection (Flynn, 2007). The cognitive artifacts that we are developing today ensure that this process will continue in the future. To take just one example, the development of the World Wide Web and, along with it, powerful search engines has made more
information available to individuals than ever before in history. However, it requires considerable skill to be a sophisticated user of this information. Equally important, collaborative thought is being facilitated by first the Internet and now the various social media built on it. It is interesting to speculate what sorts of col-laborations might have developed between the great French chemist Antoine Lavoisier (1743–1794) and the shrewd Ameri-can experimenter Benjamin Franklin (1706–1790) if they had only known each other’s e-mail addresses.
In an important sense, we have more cognitive abilities than our predecessors had. By using our cognitive artifacts, we are able to solve problems that they could not. Barring a social catastrophe, such as a worldwide nuclear war, it is inevitable that a substantial fraction of our descendants will be more intelligent than we are, for they will have better cognitive arti-facts than we have. However, there is no guarantee that the benefits of these artifacts will be equally distributed across the globe. Before developing this point, though, an aside about the measurement of cognitive ability is in order.
Own Society’s CognitiveArtifacts and Customs
Cognitive AbilitiesIncluding GCA
Physical Environment
InformationProcessing Ability
The Genome
Cognitive AbilitiesIncluding GCA
Society’s Cognitive Artifactsand Customs
Exposure to Other Societies’Cognitive Artifacts and
Customs
InformationProcessing Ability
PhysicalEnvironment
Willingness to Learn
The Gene Pool
A. B.
Fig. 1. A: Model of the development of individual GCA. The potential for cognitive ability contained in the genome is developed by interactions with the physical environment, which establishes information processing capacities. Interactions between information processing capacity and the social environment develop cognitive skills. These include GCAs and special cognitive skills. Depending on the society, an individual may be able to use his or her cognitive skills to alter the physical and social environment. B: Model of the development of cognitive skills at the national level. The genetic potentials for cognition contained in the gene pool are developed into information processing capacities by the physical environment and then into cognitive abilities by the social environment. Because populations, including nations, operate on a time scale greater than a single person’s lifetime, feedback mechanisms leading from social changes, including the adoption of the cognitive artifacts of other societies, can change both information processing capacities and even the gene pool.
at NORTH CAROLINA STATE UNIV on November 8, 2012pps.sagepub.comDownloaded from

288 Hunt
Conventional cognitive testing
The conceptualization of GCA presented here does not imply a rejection of all previous approaches to intelligence. The vari-ous analyses of intelligence offered since testing was devel-oped have resulted in valuable information. It would be foolish to disregard these results. It is more constructive to consider the strengths and weaknesses of the approach that has domi-nated the study of individual differences in cognition since the introduction of intelligence testing by Alfred Binet early in the 20th century.
What Binet showed, and what has been shown over and over again in the hundred years following his work, is that some important general cognitive abilities can be evaluated in a testing situation in which an examiner, usually a stranger, evaluates a person’s cognitive capacities within a period of approximately 1 to 3 hr, in a setting divorced from the exam-inee’s normal life. We may think of this, only somewhat face-tiously, as the “drop in from the sky” testing paradigm.4
“Drop in from the sky” examinations can be used to evalu-ate an examinee’s ability to think rapidly about problems, to develop a rough picture of the examinee’s working memory capacities, and to obtain a valid sample of the examinee’s knowledge about society. Such examinations include rudi-mentary testing of the examinee’s ability to comprehend lan-guage and to use simple mathematics. What the testing paradigm cannot encompass are evaluations of those cognitive skills that allow people to deal with issues over time. A par-ticularly important set of traits that are vital to cognition but outside the testing paradigm are the traits related to self-organization, scheduling activities, establishing priorities, and, what may be more important, keeping those priorities in mind during future activity (Duckworth, Peterson, Matthews, & Kelly, 2007).
This deficiency of “drop in from the sky” testing is dramati-cally illustrated by the case of Henry Moulson (H. M.), which has been described in many introductory texts. H. M. suffered damage to his hippocampus, which made it impossible for him to store new episodic memories. As a result, he had to reside in a highly assisted living situation from the time of his injury, when he was in his 20s, until he died, in his 70s. Following the injury, his Wechsler Adult Intelligence Test scores were well within in the normal range. As a result, H. M. is often described as having suffered profound retrograde amnesia with unchanged intelligence. In my view, it staggers the mind to say that a man who has to live in an assisted living situation because of a cogni-tive deficit has “normal intelligence.” One of the things that H. M. and similar hippocampal cases show is that tests within the conventional framework provide a limited evaluation of the GCA skills required in human society.
In summary, conventional tests of intelligence, aptitude, and educational achievement provide a partial evaluation of a person’s GCA, but they certainly do not provide a complete picture of it. However, saying that an evaluation is incomplete is not the same as saying that it is useless.
How useful are the tests?
The tests that have been developed to fit the “drop in from the sky” paradigm vary considerably in format and are often care-fully not labeled “intelligence tests” (Hunt, 2011, Chapter 2). Nevertheless, the correlations between tests are so high that, at the level of generality of the present discussion, they can all be treated together.
Many reviews have been written describing the efficacy of the tests as personnel selection devices in academic, industrial, or military settings. Three findings stand out. One is that the tests are not perfect predictors of performance. Although examples of failure of prediction are often put forward as arguments against testing itself, such attacks are directed at a straw person. The most enthusiastic advocate of testing has never claimed a validity coefficient of .9. The second finding is that the tests do a better job of predicting performance in both academic and school settings than any other screening device of comparable cost and that they certainly do much bet-ter than personality tests.5 The third is that the important statis-tic is not the correlation between test scores and the performance of students or jobholders who have been selected; it is the predictive correlation, the estimated correlation between test score and job performance in the applicant popu-lation.6 Many of the attacks on testing have failed to consider this point.
There are three sources of evidence for the efficacy of tests within a developed society. The first is an analysis of the results from the many studies that have been conducted of the use of test scores to predict performance within the normal range of test scores. Examples include studies of the relation between entry test performance and performance in colleges and universities, which cover roughly the top half to two-thirds of the presumed range of intelligence in the population, and the smaller, but still substantial, studies that have been done of the performance of people with unusually high scores or scores that are in the low to normal range.
Studies of individuals in the normal range of test scores. Kuncel and Hezlett (2010) conducted a meta-analysis in which they estimated predictive correlations between test scores and performance in academic (college/university) and workplace settings. Their results are summarized in Table 2. These cor-relations show that in typical industrial and educational set-tings, increasing the test performance of successful applicants by one standard deviation unit should result in improvement in selected applicants’ work or academic performance by slightly more than half a standard deviation unit. The plural “appli-cants” is important. As a general rule, people with high test scores will perform better than people with low test scores, but exceptions are to be expected.
Kuncel and Hezlett’s (2010) estimates apply to populations in the “average” range of cognitive ability, across both the workplace and academia. The following results deal with peo-ple with “low average” and “very high” test scores.
at NORTH CAROLINA STATE UNIV on November 8, 2012pps.sagepub.comDownloaded from

What Makes Nations Intelligent 289
Low average test scores. In the United States, prospective military recruits are given a cognitive test battery called the Armed Forces Qualifying Test (AFQT). AFQT scores are used to screen potential enlistees into five categories, with I being the highest and V the lowest. People who score in Category V are not recruited. Category IV scores are those from the 10th to 30th percentile of the norming population. Recruitment from this category is limited by law.
The performance of Category IV soldiers was studied in detail during the 1960s and 1970s. Although the majority of the Category IV enlistees completed their first enlistment, first-year discharge rates were from two to three times higher than the discharge rates of others in the same service. Those who remained in the military were not promoted as rapidly as servicemen (there were no women) in a control group. In both groups, the modal rank achieved after 13 years was staff ser-geant in the army or its equivalent in the other services. How-ever, less than 20% of the Category IV soldiers held ranks above staff sergeant, while just under 40% of the control group were either first sergeants or master sergeants (or equivalent ranks). First and master sergeants are considered senior non-commissioned officers and usually have positions of substan-tial responsibility.
The authors of the study concluded that “the lower aptitude groups are 80–90 percent as effective as average-aptitude per-sonnel” (Sticht, Armstrong, Hickey, & Caylor, 1987, p. 191). Many of the Category IV men served their country honorably and well. Nonetheless, as a group, their performance was reli-ably lower than that of servicemen with higher test scores.
Very high test scores. Louis Terman’s lifelong study of “genius” (his term for people with very high intelligence test scores) is one of the best-known studies in psychology. As a group, the people Terman studied had quite successful lives (Terman & Oden, 1959). Terman pointed out that the particu-lar types of success enjoyed by his participants had been very much influenced by the historic events of their times: primar-ily the Great Depression and World War II. High test scorers also fare well in contemporary American society.
The Study of Mathematically Precocious Youth (SMPY) is a very large longitudinal study of people who were selected on the basis of test scores earned in their early teens. It has been estimated that the participants in this study are in anywhere from the top 1% to the top 0.01 % of the U.S. population, the top one in 10,000, in terms of SAT test scores. One way to compare success between groups within the SMPY is to use the odds ratio, which is defined as
Percent of people achieving criterion in the target group
Percent of people achieving criterion in the reference group.
Table 3 shows odds ratios when the target group is SMPY participants estimated to be in the 99.75th percentile in terms of all 13-year-olds, and the reference group is those “only” in the 99th to 99.25th percentile. Odds ratios are shown for a variety of social accomplishments, calculated just before the participants reached age 40. This was slightly more than 25 years after they had taken the test. Recall that these odds ratios were calculated within the top 1% of test scorers. The contrast would be even greater if we considered less selective reference groups. For example, by age 40, about 12% of the SMPY tar-get group held patents. The base rate for patent holding in the U.S. population is 1%, which includes all age ranges. Using the population as a whole, the odds ratio for the top scorers would be 12:1. Even this is an underestimate, for slightly more than half the patents awarded annually are to people over 40 years of age (Feyrer, 2008), older than the people in the SMPY at the time Lubinski calculated the ratios.
Lubinski (2009, p. 358) concluded that
The likelihood of exceptional achievement is markedly enhanced as a function of general ability. There does not appear to be an “ability threshold” (i.e., a point at which, say beyond an IQ of 115 or 120, more ability does not matter).
Table 2. Correlations Between Test Scores and Performance
Setting Predictive correlation
Job performance High-complexity jobs .58 Medium-complexity jobs .52 Low-complexity jobs .40Training success Military programs .62 Civilian programs .55Academic programs Cumulative GPA .54 1st-year GPA .52
Note. Data come from Kuncel and Hezlett (2010, Figures 1 and 2). GPA = grade-point average.
Odds Ratio =
Table 3. Odds Ratios Comparing Accomplishments of SMPY Participants With SAT Scores in the Fourth and First Quartiles of the Top 1%
Achievement Odds ratio
Achieving the doctorate (including MD, LLD) 3.56Publication in science, technology engineering,
or mathematics4.97
Holding one or more patents 3.01Income in the top 95th percentile nationally 2.31Literary publications 4.55
Note. Data are from Lubinski (2009). SAT scores were recorded when par-ticipants were 13 years old. Their achievements were tallied when they were 40 years old. SMPY = Study of Mathematically Precocious Youth.
at NORTH CAROLINA STATE UNIV on November 8, 2012pps.sagepub.comDownloaded from

290 Hunt
This is essentially the same conclusion that was reached by Terman 50 years earlier (Terman & Oden, 1959). The finding has generalized over time and massive social changes.
Highly placed academics (Muller et al., 2005) and impor-tant media figures (Brooks, 2011; Gladwell, 2008) have main-tained that very high scores do not count. They do.7
Conclusions concerning the intelligence of individualsThe argument to this point leads to four conclusions:
1. The industrial–postindustrial workplace (the I&PI society) requires a workforce with general cognitive abilities that can be trained for a variety of special-ized occupations.
2. Intelligence should be conceptualized as skill in using the cognitive artifacts provided by society in order to solve important problems that the individual encounters.
3. The conventional “drop in from the sky” method of testing captures some, and evaluates some, but not all of the important GCAs required by I&PI societies.
4. In spite of their limitations, conventional intelligence tests and their analogs, such as the SAT and AFQT, capture enough individual variation in intelligence that the test scores are nontrivial predictors of cogni-tive achievements within our society.
The next step is to move from a focus on the intelligence of individuals to a focus on the intelligence of groups.
Are Nations Intelligent?Is it meaningful to say that nations are intelligent? A case study is instructive.
Modern Japan, a country with very few natural resources, is one of the economic powerhouses of the world. Although Japan’s growth rate slowed somewhat during the 2000–2010 period, its economy was still the third largest in the world. In 2010 Japan’s gross domestic product per capita, corrected for local purchasing power (GDP-PPP/c), was $32,000. This value is comparable to that of France, Germany, and the United Kingdom. As of 2010, the life expectancy at birth of a Japa-nese citizen was 82.2 years. The infant mortality rate was 2.8 per thousand births. One hundred percent of the Japanese pop-ulation had access to reliable water supplies and sanitary facil-ities. By any standard, Japan is an I&PI nation.
By contrast, modern Nigeria is one of the poorer nations of the world. Nigeria used to be an exporter of food; today it is an importer. In spite of being a supplier of oil, which is arguably the world’s most sought-after resource, Nigeria’s 2010 GDP-PPP/c was $2,500, less than a tenth of Japan’s. In 2010, a Nigerian citizen’s life expectancy at birth was 47.5 years, and the infant mortality rate was a staggering 97.4 per thousand
births. Only 58% of the Nigerian population had access to reli-able water, and only 38% had access to adequate sanitary facilities. In spite of its substantial physical resources, Nigeria is not an I&PI nation.8
The cognitive artifacts of Japan—well-organized schools, a commitment to the use of the most modern technologies, and a legendary work ethic—act to multiply the nation’s physical resources. In Nigeria, these cognitive artifacts are in short sup-ply. There are many reasons why this might be true. Delving into them would not be germane to this article. The point is that, for whatever reason, Japanese society contains a greater supply of GCA than does Nigerian society.
There are two sorts of data used to measure GCAs of national populations. One is a compilation of scores on avowed intelligence tests, such as the Wechsler tests or the Raven Matrix tests, taken by residents of various countries. Richard Lynn and Tutu Vanhanen (2002, 2006) deserve credit for initiating a line of research based on this source of data. The line has since been pursued vigorously. In their various reports, they used data from somewhat different selections of countries. Regardless of exactly which data set was used, the correlation between national test scores and measures of GDP-PPP/c, possibly the best single index of economic strength, was about .65.
Within I&PI nations, the scores Lynn and Vanhanen used are likely to be accurate representations of a population’s cog-nitive skills. Considerable care was taken to make the Spanish, British, and American versions of the Wechsler Adult Intelli-gence Test comparable and to obtain validation samples that were representative of the country for which the test was being validated. The use of test scores outside of I&PI nations has been criticized on three grounds. One is that although the tests evaluate skills required by the I&PI society, they may not reflect the skills required by various societies outside that group. The second is that testing itself is so foreign to societies outside the I&PI world that the resulting scores are not valid. The third is that the test scores are often based on small and unrepresentative samples, rather than samples reflecting the population of the nation under study.
For the present purposes, the first objection is not crucial. If our purpose is to determine whether a nation has the cognitive resources appropriate for participation in the international economy, then the appropriate tests are those that evaluate the skills required to utilize the cognitive artifacts vital to that economy. The skills associated with orienting oneself in a jun-gle or desert may be vital in a traditional society, but in a mod-ern industrial society, the skills needed to read a street map or use a global positioning system are more useful. When com-paring two countries, then, the test scores (and statistics devel-oped from them) are valid as measures of the extent to which the countries are prepared for the I&PI world. Whether the test scores are valid measures of the cognitive abilities required to participate in other societies, such as an agricultural, nomadic, or hunter-gatherer society, is an open question and can be answered only on a case-by-case basis.
at NORTH CAROLINA STATE UNIV on November 8, 2012pps.sagepub.comDownloaded from
What Makes Nations Intelligent 291
The second objection, that the “drop in from the sky” para-digm is foreign to societies other than I&PI countries, also can be answered only on a case-by-case basis. Nations are not “in” or “out” of the I&PI world; different nations are in or out to some degree. To clarify, although there are certainly regions in the countries outside of the I&PI world where the use of tests would be a foreign practice, some form of testing is associated with formal education systems and these are widespread throughout the world. (China has been using formal examina-tions for educational screening for over a millennium.) Indeed, if the testing paradigm were foreign to a large proportion of the population, this alone would be evidence that a particular nation had a weak formal education system and, along with that, lacked many of the GCAs required in the I&PI world.
The third objection, that in some nations the test scores are drawn from atypical samples, is relevant here. In fact, it is especially relevant if the scores offered for a nation as a whole include data from an unrepresentative group for whom the test paradigm is not appropriate. Lynn and Vanhanen have been sharply criticized for including such data in their calculations, especially those reported for sub-Saharan Africa (Hunt, 2011, Chapter 11; Wicherts, Dolan, Carlson, & Van der Maas, 2010a, 2010b; Wicherts, Dolan, & Van der Maas, 2009, 2010). It is likely that the selection methods used by Lynn and Vanhanen resulted in spuriously low estimates of GCA in the nations out-side the I&PI world. However, there is evidence that the biases are not sufficient to make a major alteration in the correlations between test scores and measures of national well-being, such as GDP-PPP/c (Whetzel & McDaniel, 2006).
An alternative way to measure national levels of cognitive competence is to use internationally accepted evaluations of educational progress, such as the Program of International Student Assessment (PISA). The educational data are typi-cally comparable and the sampling somewhat representative across countries. However, the results apply to the contempo-rary student population, not to the general population. Educa-tional data are available for virtually all I&PI nations and for many outside of the I&PI world. However, educational data are usually not available for those nations furthest from the I&PI world. For instance, no sub-Saharan country participated in the 2009 PISA studies, nor did any of the poorer nations of Latin America. In addition, the international assessment pro-grams focus heavily on only a few topics. Educational fields relative to science, technology, engineering, and mathematics (STEM) are given special emphasis because the STEM fields are believed to drive the economic success of I&PI countries.
Perhaps the best estimates of national levels of cognitive abilities that are currently available were developed by the Ger-man psychologist Heiner Rindermann (2007, 2008; Rinder-mann & Thompson, 2011). Rindermann combined GCA test scores and educational achievement measures into a single national estimate of cognitive abilities. The global distribution of Rindermann’s scores was similar to the distributions reported by Lynn and Vanhanen. In general, high scores were obtained in Europe and in countries whose culture is largely derivative from
Europe, such as the United States and Australia, and in the industrial Asian countries. The lowest scores were obtained in sub-Saharan Africa. Nations in Latin America, nonindustrial-ized Asian countries, and nations in the Middle East and North Africa had intermediate scores.
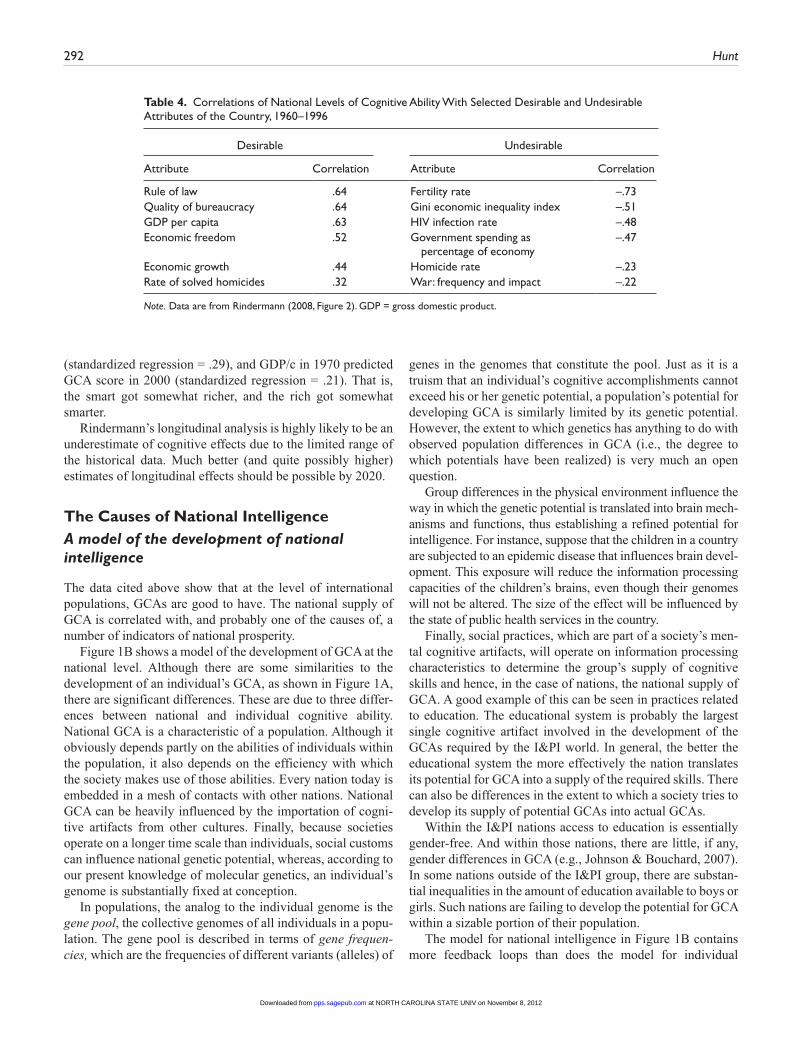
Rindermann correlated his scores with a number of other indices of national well-being, ranging from GDP/c to the rate of homicides. Some of the findings are shown in Table 4. In general, properties of society that are considered desirable in I&PI societies, such as a high GDP/c, efficient government bureaucracy, and effective policing, were associated with high cognitive ability scores. For instance, indices of the rule of law and of GDP/c had a correlation of slightly above .6 with the cognitive index. Properties that are considered undesirable in the I&PI society, such as a high incidence of HIV/AIDS or a high rate of homicides, were associated with low cognitive scores.
The negative correlation between cognitive scores and fer-tility, –.7, was the highest absolute association in Rindermann’s (2006) data set. This is a particularly interesting statistic, for it illustrates a marked difference in attitude between developed and developing countries. Among countries that are members of the Organisation for Economic Co-operation and Develop-ment (OECD; which contains most I&PI countries and a few that are close to I&PI status, such as Chile, Mexico, and Tur-key), the mean desired number of children at the start of the 21st century was 2.25, only slightly above the replacement rate for the population.9 In Nigeria, the mean desired family size was 6.7 children (Westoff, 2010). The difference is important, because high levels of fertility, and the resulting high levels of family size, present a society with economic and social pres-sures that work against the development of effective modern education systems. In addition, large families place limits on women’s socioeconomic roles. Both good schooling and sub-stantial gender equity are required if a society is to participate fully in the economies of the I&PI world.
Rindermann’s (2006) analyses were based on data collected from the 1970s until 2000. I updated his results by calculating the correlation between 2009 GDP/c and the 2009 PISA results. Over all data, the correlation was only .32. However, three small countries, the oil-rich emirate of Qatar and the duchies of Lichtenstein and Luxembourg, both of which are major financial centers, had unusually high GDP/c relative to their PISA scores. Removing these three atypical states from the analysis raised the correlation to .65, which was surpris-ingly consistent with the results of earlier studies.
Correlation does not mean causation is a mantra of statisti-cal analysis. Rindermann (2006, Figure 5) was able to con-struct a longitudinal analysis based on 17 countries for which he had data in both the 1970s and the early 2000s. The relative standing of countries was fairly stable, on both the cognitive variables and GDP/c. The standardized regression measures were in the middle .7 range. In general, the rich stayed rich, and the smart stayed smart. Conversely, there were interactive effects: GCA scores in the 1970s predicted GDP/c in 2000
at NORTH CAROLINA STATE UNIV on November 8, 2012pps.sagepub.comDownloaded from
292 Hunt
(standardized regression = .29), and GDP/c in 1970 predicted GCA score in 2000 (standardized regression = .21). That is, the smart got somewhat richer, and the rich got somewhat smarter.
Rindermann’s longitudinal analysis is highly likely to be an underestimate of cognitive effects due to the limited range of the historical data. Much better (and quite possibly higher) estimates of longitudinal effects should be possible by 2020.
The Causes of National IntelligenceA model of the development of national intelligence
The data cited above show that at the level of international populations, GCAs are good to have. The national supply of GCA is correlated with, and probably one of the causes of, a number of indicators of national prosperity.
Figure 1B shows a model of the development of GCA at the national level. Although there are some similarities to the development of an individual’s GCA, as shown in Figure 1A, there are significant differences. These are due to three differ-ences between national and individual cognitive ability. National GCA is a characteristic of a population. Although it obviously depends partly on the abilities of individuals within the population, it also depends on the efficiency with which the society makes use of those abilities. Every nation today is embedded in a mesh of contacts with other nations. National GCA can be heavily influenced by the importation of cogni-tive artifacts from other cultures. Finally, because societies operate on a longer time scale than individuals, social customs can influence national genetic potential, whereas, according to our present knowledge of molecular genetics, an individual’s genome is substantially fixed at conception.
In populations, the analog to the individual genome is the gene pool, the collective genomes of all individuals in a popu-lation. The gene pool is described in terms of gene frequen-cies, which are the frequencies of different variants (alleles) of
genes in the genomes that constitute the pool. Just as it is a truism that an individual’s cognitive accomplishments cannot exceed his or her genetic potential, a population’s potential for developing GCA is similarly limited by its genetic potential. However, the extent to which genetics has anything to do with observed population differences in GCA (i.e., the degree to which potentials have been realized) is very much an open question.
Group differences in the physical environment influence the way in which the genetic potential is translated into brain mech-anisms and functions, thus establishing a refined potential for intelligence. For instance, suppose that the children in a country are subjected to an epidemic disease that influences brain devel-opment. This exposure will reduce the information processing capacities of the children’s brains, even though their genomes will not be altered. The size of the effect will be influenced by the state of public health services in the country.
Finally, social practices, which are part of a society’s men-tal cognitive artifacts, will operate on information processing characteristics to determine the group’s supply of cognitive skills and hence, in the case of nations, the national supply of GCA. A good example of this can be seen in practices related to education. The educational system is probably the largest single cognitive artifact involved in the development of the GCAs required by the I&PI world. In general, the better the educational system the more effectively the nation translates its potential for GCA into a supply of the required skills. There can also be differences in the extent to which a society tries to develop its supply of potential GCAs into actual GCAs.
Within the I&PI nations access to education is essentially gender-free. And within those nations, there are little, if any, gender differences in GCA (e.g., Johnson & Bouchard, 2007). In some nations outside of the I&PI group, there are substan-tial inequalities in the amount of education available to boys or girls. Such nations are failing to develop the potential for GCA within a sizable portion of their population.
The model for national intelligence in Figure 1B contains more feedback loops than does the model for individual
Table 4. Correlations of National Levels of Cognitive Ability With Selected Desirable and Undesirable Attributes of the Country, 1960–1996
Desirable Undesirable
Attribute Correlation Attribute Correlation
Rule of law .64 Fertility rate –.73Quality of bureaucracy .64 Gini economic inequality index –.51GDP per capita .63 HIV infection rate –.48Economic freedom .52 Government spending as
percentage of economy–.47
Economic growth .44 Homicide rate –.23Rate of solved homicides .32 War: frequency and impact –.22
Note. Data are from Rindermann (2008, Figure 2). GDP = gross domestic product.
at NORTH CAROLINA STATE UNIV on November 8, 2012pps.sagepub.comDownloaded from
What Makes Nations Intelligent 293
intelligence in Figure 1A. A nation, or any other population that acts as a unit, can exert control over its physical and social environment in more powerful ways than an individ-ual, working alone, can. The following examples illustrate feedback processes in which social policies have influenced the physical and social environments and even the gene pool itself:
1. Fetal alcohol syndrome and related effects: Fetal alcohol syndrome is a serious cognitive disorder exhibited by children of women who abused alcohol during their pregnancy. Milder forms of the disease are believed to be associated with alcohol use below the level normally considered as abuse. Many nations now conduct extensive public health campaigns to discourage pregnant women from consuming alco-hol. As a physical variable is involved, the effect of this campaign is to modify information processing capacities.
2. The Flynn effect: During the 20th century, cognitive test scores increased sharply in industrially devel-oped nations (Flynn, 2007). Although the causes for this are not clear, surely one contributing factor was the increased availability of, and requirement for, education through the high school level. As in the case of gender differences, increased availability of education throughout the population will have had an influence upon the development of the population potential for GCA.
(c) Assortative mating: Assortative mating is a nonran-dom tendency toward mating between people with similar phenotypes—for instance, tall men marrying tall women. In the industrially developed countries, there is a correlation of approximately .3 between the cognitive test scores of spouses, which indicates a modest amount of assortative mating for GCA (van Leeuwen, van den Berg, & Boomsma, 2008). It is important to note that although the concept of assor-tative mating arose in genetics, the phenomenon can be produced by either biological or purely social processes. For instance, in the United States, adult social contacts are strongly related to education; people with similar educational levels socialize together and hence are likely to have children together. Because the educational system in the United States acts as an imperfect “sorting machine” for general cognitive abilities, assortative mating is, to some degree, virtually guaranteed by the organiza-tion of society (Murray, 2012). As children receive both their genetic inheritance and, in the vast major-ity of cases, their social inheritance from their par-ents, assortative mating will operate to increase the variance in GCA, across generations, through both social and genetic mechanisms.
The development of national GCA relies both on the incor-poration of cognitive artifacts from the nation’s own history and from the societies with which it is in contact. The “Arab Spring” revolutions in 2011 provided a striking example. The rebels who brought down the reactionary Egyptian, Libyan, and Tunisian regimes relied heavily on cell phones to coordi-nate their activities.
And where did the cell phone come from? Cell phones were developed in Europe and North America. One of the basic concepts behind the technology, high-speed frequency switch-ing, was first proposed in a U.S. patent filed in the 1940s by two Austrian refugees from the Nazi expansion. One of the Austrians was the motion picture actress Hedy Lamarr (Rhodes, 2011). It pays for a society to be alert to new cogni-tive artifacts, wherever they may be found.
Genetic differences between national populationsDirect tests of the hypothesis that there are genetic dif-ferences between nations. Gene frequencies vary across populations. Sub-Saharan Africans do not look like Scandina-vians, and many of their differences in appearance, such as eye color, are dictated by genetics. Other differences, such as lan-guage spoken, have nothing to do with genetics. Still other differences, such as weight, are partially influenced by genet-ics. Determining the extent to which the genetic potential for GCA differs across national contrasts is a challenging task, for all we can measure is expressed GCA, and the features of a society that convert genetic potential into expressed GCA vary widely across nations.
It is well established that across individuals, variations on cognitive test scores are correlated with variation in geno-types. This point was originally made in the 1960s, through studies of correlations between individuals of different degrees of relation. This finding has since been replicated many times, using a variety of statistical models (Hunt, 2011, Chapter 8). Many genes are involved, with no one gene accounting for a large amount of the variance (Davies et al., 2011; Johnson, Penke, & Spinath, 2011). As of 2012, the genes involved are unknown. Given the genomes of two individuals, it would be possible to make an estimate of how far apart their intelligence test scores were likely to be, but it would not be possible to predict which of the two had the higher scores or for that mat-ter the mean score of the pair.
By comparing gene frequencies across populations, it is possible to estimate the degree to which two population groups are genetically related. A number of the genes that vary across racial–ethnic groups have been identified. However, because the genes involved in establishing the potential for cognitive ability are not known, there is no way of predicting which of two populations has the higher genetic potential. This is not necessarily a permanent situation. Future developments in molecular and behavior genetics may identify these genes, and
at NORTH CAROLINA STATE UNIV on November 8, 2012pps.sagepub.comDownloaded from

294 Hunt
at that time it will be possible to make a scientifically justifi-able statement about international differences in the potential for intelligence. As of 2012, no such statement can be made. This does not mean that no such differences exist. It means that the extent of a genetic contribution to international differ-ences in GCA is unknown at present.
The analogical argument for genetic causes of national differences. Arguments for large genetic influences on inter-national differences in intelligence are often based on an anal-ogy to intragroup evidence for the heritability of intelligence test scores observed in U.S. and European studies, most of which have contained only White participants. Within these populations, the heritability coefficient for intelligence is somewhere in the .5–.8 range. (See Hunt, 2011, Chapter 8, for a discussion of the many studies of related individuals that lead to this conclusion and Davies et al., 2011, for a study that reaches the same conclusion on the basis of correlations of genetic makeup and intelligence test profiles in unrelated indi-viduals.) The analogical argument is that because intelligence has a genetic basis within White U.S. and European popula-tions, and because international populations differ genetically and in general cognitive ability, is it not reasonable to believe that international differences in cognitive ability are due to dif-ferences in genetic potential? The same argument has been used to explain racial differences in test scores across racial and ethnic lines within the United States (Lynn & Vanhanen, 2002, 2006; Rushton & Jensen, 2005).
The argument has both a logical and an empirical weak-ness. Consider several groups and two measured variables, A and B, on individuals within each group. A correlation between A and B within groups does not imply that the correlation will be found between groups. It may be or it may not be. There-fore the analogy is logically weak. The analogy’s empirical weakness is a consequence of the definition of the heritability coefficient. Heritability coefficients are measures of the rela-tive influence of genetic and environmental differences on a trait. The value of a heritability coefficient is determined by three things: the proportion of individuals who express a phe-notypical trait given a constant genetic makeup (technically, penetrance), the extent of relevant genetic variation within the population under investigation, and the extent of relevant environmental variation. Eye color has a penetrance close to 1. Heritability coefficients for such traits are close to 1, every-where. Other traits, certainly including cognitive ability, have much lower penetrances, and therefore heritability coefficients can vary across populations. Height is an excellent example. In Finland, Australia, and the European-derived populations within the United States, the heritability coefficient for height is .80. Almost everyone in these populations has access to adequate infant and early childhood nutrition programs, which are a major environmental influence on adult height. In Asia and Africa, where the genetic variation is different and, most important, the adequacy of nutrition varies widely, heritability coefficients fall to .65 (Lai, 2006). In an extreme case, North
and South Koreans are genetically close populations, having intermingled freely for centuries prior to their separation into two states in 1945. Today South Korea is a prosperous mem-ber of the OECD, while North Korea has suffered major fam-ines. By their late teenage years, South Korean men are 16 cm taller and South Korean women are 13 cm taller than their North Korean counterparts (Pak, 2010; Schwekendiek, 2009).
Cognitive ability is certainly more like height than eye color. The vast majority of the studies establishing the .50–.80 estimate for the heritability of intelligence were conducted in middle-class populations in I&PI nations, with widespread health and nutrition programs, relatively stable home environ-ments, and extensive educational programs. Studies of low socioeconomic status (SES) groups in the United States find much lower heritability coefficients (Turkheimer, Haley, Waldron, D’Onofrio, & Gottesman, 2003). This may be due to greater relevant environmental variability in these groups than in the middle-class participants in the earlier studies.
The environmental differences between nations appear to be much larger than within-nation differences, especially when the contrast is between exceptionally low-scoring nations such as those in sub-Saharan Africa, and high scoring nations, such as those in Scandinavia. Simply generalizing the high heritability coefficients observed within the I&PI nations to estimate the role of genetics in variation in GCA across nations is not war-ranted. The conclusion is not logically implied, and there are reasons to suspect the empirical basis. However, the analogy cannot be denied either.
The argument from evolutionary necessity. A second indi-rect argument for international differences in the genetic potential for intelligence is based on evolutionary psychology. The argument is that following the “out of Africa” exodus, dif-ferent groups ancestral to modern populations faced different environmental challenges as they moved through Eurasia, Oceania, and eventually the Americas. According to these hypotheses, within those populations that moved through cog-nitively challenging environments, there was a reproductive advantage to being intelligent. This could have arisen either from selection pressures that increased the frequency of alleles favorable to the development of intelligence in an existing gene pool or by a mutation that increased the survivability of a group migrating through a hostile environment. Analogies are sometimes drawn to the fact that mutations producing light skin color did occur, separately, in prehistoric North Asian and European populations. The mutations produced more effective utilization of sunlight to produce Vitamin D at the expense of greater sensitivity to sunburn. If such a favorable mutation could occur for the skin, why not assume that a similar muta-tion occurred for cognition?
Lynn (2006) has proposed that the European and North Asian ancestors of present-day populations faced harsh, cold climatological differences that exerted selection pressures for cognitive abilities. Such challenges, and the resulting selection pressures, were, according to Lynn, not as severe in the warmer
at NORTH CAROLINA STATE UNIV on November 8, 2012pps.sagepub.comDownloaded from
What Makes Nations Intelligent 295
savannahs of East Africa. Kanazawa (2004) has contended that selection pressures for GCA occurred as the ancestral populations moved through different environments. For exam-ple, the populations ancestral to modern North Asians had to move from the savannahs of Ethiopia, as they may have been 80,000 years ago, through the arid, hot deserts of Arabia and the Middle East, and then across mountain ranges to reach the colder, better watered areas of present-day northern China.
Both these arguments are plausible, when considered alone. A more critical examination, though, reveals several weak-nesses. To me, the strongest is that the evolutionary argument is an argument for the presence of differences in the frequency of genes related to intelligence, and these differences have yet to be shown to exist. Lacking such direct evidence, both Kanazawa (2004) and Lynn (2006) draw inferences based on present-day distributions of test scores. Wicherts, Borsboom, and Dolan (2010) pointed out two problems in using these data to draw conclusions about evolutionary processes. The analy-ses presented by Kanazawa and Lynn are heavily influenced by the disparity between the very low sub-Saharan African scores reported by Lynn and Vanhanen (2002, 2006). These are spuriously low. Even if they were not, the two hypotheses implicitly assume that the distribution of the genes for cogni-tive potential was approximately the same in the ancestral populations, some 6,000 to 10,000 years ago, as it is today. There is no evidence that this is so.
The support for an evolutionary explanation of present-day differences in national measures of GCA is weak at best. Defini-tive evidence for or against this hypothesis would require com-parative data on group cognitive behavior in prehistoric times. It is unlikely that such evidence will ever be obtained.
A summary evaluation of the genetic hypothesis. The genetic hypothesis states that international differences in the genetic potential for intelligence exist and that they are driven by differences in the relative frequencies of the genes for intel-ligence in various international populations. Because the genes that establish a potential for intelligence are not known, there is no way to test the hypothesis directly. Indirect arguments for
the hypothesis have been made, by analogy to the results of studies of the genetics of intelligence within national popula-tions and by proposing evolutionary theories of intelligence. Both these arguments contain substantial weaknesses.
If, at some time in the future, the genetic basis for intelli-gence is determined, it will be possible to test the genetic hypothesis for group differences directly. Such tests could be made both internationally and across population groups within a nation. Until then, the question “Is there a genetic basis for international differences in intelligence?” has a simple answer: We do not know.
The physical environmentDifferences in the physical environment fall into three broad categories: nutrition, health, and environmental pollutants. The effects of problems in these areas on the development of individual intelligence are well known (Hunt, 2011). What are the international effects?
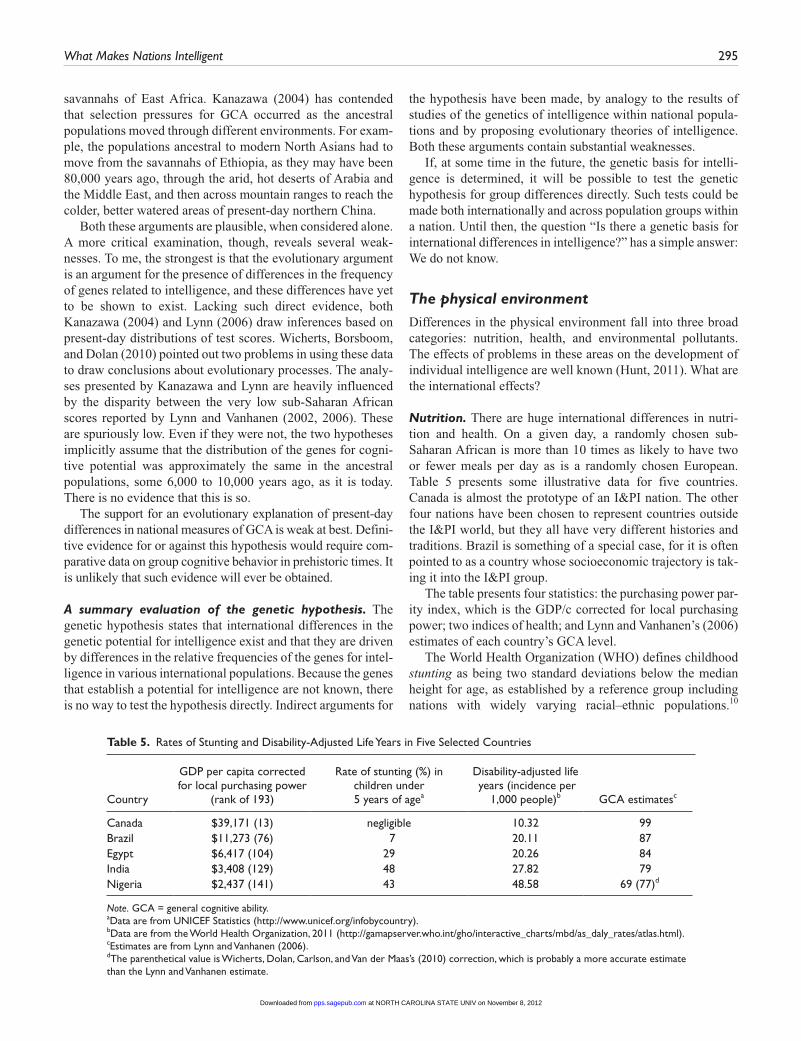
Nutrition. There are huge international differences in nutri-tion and health. On a given day, a randomly chosen sub- Saharan African is more than 10 times as likely to have two or fewer meals per day as is a randomly chosen European. Table 5 presents some illustrative data for five countries. Canada is almost the prototype of an I&PI nation. The other four nations have been chosen to represent countries outside the I&PI world, but they all have very different histories and traditions. Brazil is something of a special case, for it is often pointed to as a country whose socioeconomic trajectory is tak-ing it into the I&PI group.
The table presents four statistics: the purchasing power par-ity index, which is the GDP/c corrected for local purchasing power; two indices of health; and Lynn and Vanhanen’s (2006) estimates of each country’s GCA level.
The World Health Organization (WHO) defines childhood stunting as being two standard deviations below the median height for age, as established by a reference group including nations with widely varying racial–ethnic populations.10
Table 5. Rates of Stunting and Disability-Adjusted Life Years in Five Selected Countries
Country
GDP per capita corrected for local purchasing power
(rank of 193)
Rate of stunting (%) in children under 5 years of agea
Disability-adjusted life years (incidence per
1,000 people)b GCA estimatesc
Canada $39,171 (13) negligible 10.32 99Brazil $11,273 (76) 7 20.11 87Egypt $6,417 (104) 29 20.26 84India $3,408 (129) 48 27.82 79Nigeria $2,437 (141) 43 48.58 69 (77)d
Note. GCA = general cognitive ability.aData are from UNICEF Statistics (http://www.unicef.org/infobycountry).bData are from the World Health Organization, 2011 (http://gamapserver.who.int/gho/interactive_charts/mbd/as_daly_rates/atlas.html).cEstimates are from Lynn and Vanhanen (2006).dThe parenthetical value is Wicherts, Dolan, Carlson, and Van der Maas’s (2010) correction, which is probably a more accurate estimate than the Lynn and Vanhanen estimate.
at NORTH CAROLINA STATE UNIV on November 8, 2012pps.sagepub.comDownloaded from
296 Hunt
Stunting is caused by very poor nutrition in early childhood. Not surprisingly, stunting is also associated with reduced cog-nitive development (e.g., Crookston et al., 2011). Stunting is an unusual condition in the first world. In Canada, the rate is negligible. In Brazil, where virtually all socioeconomic indi-cators have improved in the last 20 years, there is still some stunting. Egypt’s rate is 4 times that of Brazil. More than 40% of the children in India and Nigeria are stunted, according to international standards.
These examples are illustrative of general trends. The Lynn and Vanhanen (2006) estimates of national GCA are sharply divided between the high-scoring developed nations and low-scoring developing nations (Hunt & Wittmann, 2008). Stunt-ing rates are less than 5% in the countries of the I&PI world and 23% in countries outside of it. The difference in stunting rates provides striking evidence of the differences in level of childhood malnutrition worldwide.
Childhood malnutrition influences cognition in three dif-ferent ways. In the case of extreme and prolonged malnutri-tion, there are direct effects on the central nervous system. There are also substantial interactions with other influences on cognition. Malnutrition increases susceptibility to infectious diseases, which themselves may damage the nervous system. Malnutrition also interacts with education, for malnourished children have difficulty concentrating in educational settings. Looked at more positively, good nutrition provides the atten-tional capacity needed to benefit from education. For instance, studies in Latin America have found that nutritional supple-mentation programs have their greatest impact when educa-tional interventions are also provided, and vice versa (Pollitt et al., 1993).
Persistent hunger, far short of the level one would describe as malnourishment, also has an effect on the social environ-ment outside the school. When the family is hungry, it makes sense to have the children work. Work may vary from tending goats on the savannah to selling candy, cigarettes, and the like on the streets of overcrowded third-world cities. Children cer-tainly learn some things while they are working, but they are not learning how to use many of the cognitive artifacts required in modern society.
Health. The second environmental variable shown in Table 5 is the WHO disability-adjusted life years (DALY) index. This is a measure of the loss of useful years due to health con-ditions, including infectious diseases, chronic diseases such as diabetes, and behavioral practices (e.g., tobacco use). The index reflects incidence, severity, and age of onset of the vari-ous conditions. Therefore, the DALY is a measure of health in the general population, not just in children. Table 5 presents the DALY index for the five countries used to illustrate differ-ences in nutrition. Again the discrepancies are striking.
There is a strong, negative relation between national mea-sures of GCA and the DALY index. Eppig, Fincher, and Thornhill (2010) report a correlation of –.76 between the log-arithm of the DALY index and Lynn and Vanhanen’s (2006) national GCA estimates, after adjusting for a probable bias
downward in the sub-Saharan countries. The DALY can be broken down into separate indices reflecting the contributions of major infectious diseases and the contributions reflecting nutritional deficiencies. The partial correlation between the IQ estimates and the DALY infectious disease estimates, statisti-cally equating the effect of nutrition on test scores, was –.56. This indicates that infectious diseases exert a negative influ-ence on national intelligence levels, beyond the effects of nutrition alone.
Although nutrition and health do act on the national potential for GCA, a simple “health causes a potential for intelligence” model is naive. There are strong feedbacks. The development of national public health and nutrition systems itself implies the existence of appropriately educated professionals and subpro-fessionals. Health professionals are of little use unless they are backed by national priorities and the commitment of wealth suf-ficient to create the nutrition and health systems. This implies an interested, sophisticated, and stable government. The popula-tion itself has to have sufficient understanding to be convinced to adopt practices that support better health, especially if the new practices interfere with less effective traditional practices. Take a historic example. In imperial Rome, water quality stan-dards were based on qualities that can be directly sensed, such as taste, clarity, and smell. A proposal that otherwise healthy appearing water not be used because it contained invisible, highly dangerous microorganisms would probably have been regarded as contrary to the public interest. The germ theory of disease is a modern, useful cognitive artifact.
Environmental pollutants. Environmental pollutants, and especially heavy metals, affect cognition adversely. In the 17th and 18th centuries, the expression “mad as a hatter” reflected the use of mercury in manufacturing hats and the resulting poi-soning that prolonged exposure induced. Today, lead is one of the most potent of present-day atmospheric pollutants (Hubbs-Tait, Nation, Krebs, & Bellinger, 2005), in spite of a two- millennia history of attempts to control it (Hunt, 2011, Chapter 9). The modern history and situation with respect to lead pres-ents a case study in the interplay between politics, economics, and health.
Tetraethyl lead was introduced as an anti-knock agent in gasoline in the 1920s. It continued to be used in I&PI countries until the 1970s, in spite of documentation of its effects on cog-nition. Lead-added gasoline is still used in many developing nations (Tong, von Schimding, & Prapamontol, 2000). Non- atmospheric sources of lead poisoning, such as lead-based paint or lead used in industrial production, are substantially more common outside than inside I&PI nations. However, I&PI nations are far from immune, because of product impor-tation from nonindustrial to I&PI countries. In 2007, the Mat-tell toy manufacturing company recalled 1.5 million Chinese- made toys because of excess lead in paint. This cost the com-pany $30 million dollars, approximately half of its quarter’s operating profit.11 At a more prosaic, retail level, before Amer-ican tourists to Latin America bring home the elegant,
at NORTH CAROLINA STATE UNIV on November 8, 2012pps.sagepub.comDownloaded from
What Makes Nations Intelligent 297
inexpensive pottery they can find in the market, they would be well advised to enquire about the method of glazing used.
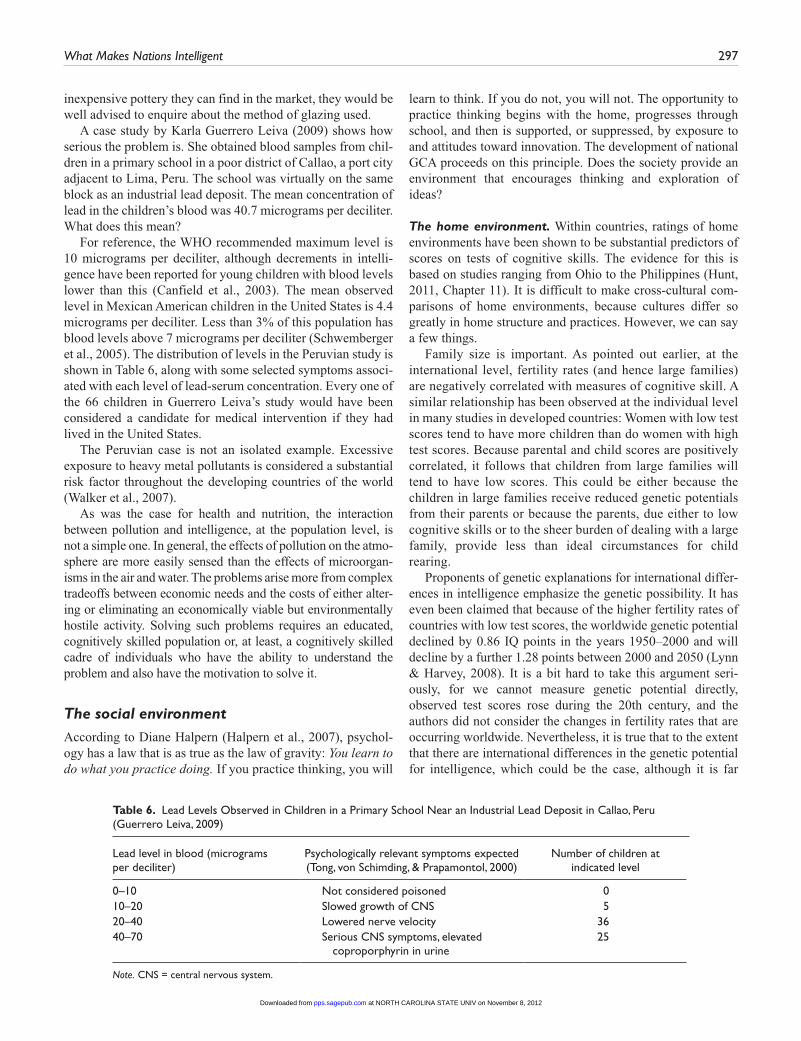
A case study by Karla Guerrero Leiva (2009) shows how serious the problem is. She obtained blood samples from chil-dren in a primary school in a poor district of Callao, a port city adjacent to Lima, Peru. The school was virtually on the same block as an industrial lead deposit. The mean concentration of lead in the children’s blood was 40.7 micrograms per deciliter. What does this mean?
For reference, the WHO recommended maximum level is 10 micrograms per deciliter, although decrements in intelli-gence have been reported for young children with blood levels lower than this (Canfield et al., 2003). The mean observed level in Mexican American children in the United States is 4.4 micrograms per deciliter. Less than 3% of this population has blood levels above 7 micrograms per deciliter (Schwemberger et al., 2005). The distribution of levels in the Peruvian study is shown in Table 6, along with some selected symptoms associ-ated with each level of lead-serum concentration. Every one of the 66 children in Guerrero Leiva’s study would have been considered a candidate for medical intervention if they had lived in the United States.
The Peruvian case is not an isolated example. Excessive exposure to heavy metal pollutants is considered a substantial risk factor throughout the developing countries of the world (Walker et al., 2007).
As was the case for health and nutrition, the interaction between pollution and intelligence, at the population level, is not a simple one. In general, the effects of pollution on the atmo-sphere are more easily sensed than the effects of microorgan-isms in the air and water. The problems arise more from complex tradeoffs between economic needs and the costs of either alter-ing or eliminating an economically viable but environmentally hostile activity. Solving such problems requires an educated, cognitively skilled population or, at least, a cognitively skilled cadre of individuals who have the ability to understand the problem and also have the motivation to solve it.
The social environmentAccording to Diane Halpern (Halpern et al., 2007), psychol-ogy has a law that is as true as the law of gravity: You learn to do what you practice doing. If you practice thinking, you will
learn to think. If you do not, you will not. The opportunity to practice thinking begins with the home, progresses through school, and then is supported, or suppressed, by exposure to and attitudes toward innovation. The development of national GCA proceeds on this principle. Does the society provide an environment that encourages thinking and exploration of ideas?
The home environment. Within countries, ratings of home environments have been shown to be substantial predictors of scores on tests of cognitive skills. The evidence for this is based on studies ranging from Ohio to the Philippines (Hunt, 2011, Chapter 11). It is difficult to make cross-cultural com-parisons of home environments, because cultures differ so greatly in home structure and practices. However, we can say a few things.
Family size is important. As pointed out earlier, at the international level, fertility rates (and hence large families) are negatively correlated with measures of cognitive skill. A similar relationship has been observed at the individual level in many studies in developed countries: Women with low test scores tend to have more children than do women with high test scores. Because parental and child scores are positively correlated, it follows that children from large families will tend to have low scores. This could be either because the children in large families receive reduced genetic potentials from their parents or because the parents, due either to low cognitive skills or to the sheer burden of dealing with a large family, provide less than ideal circumstances for child rearing.
Proponents of genetic explanations for international differ-ences in intelligence emphasize the genetic possibility. It has even been claimed that because of the higher fertility rates of countries with low test scores, the worldwide genetic potential declined by 0.86 IQ points in the years 1950–2000 and will decline by a further 1.28 points between 2000 and 2050 (Lynn & Harvey, 2008). It is a bit hard to take this argument seri-ously, for we cannot measure genetic potential directly, observed test scores rose during the 20th century, and the authors did not consider the changes in fertility rates that are occurring worldwide. Nevertheless, it is true that to the extent that there are international differences in the genetic potential for intelligence, which could be the case, although it is far
Table 6. Lead Levels Observed in Children in a Primary School Near an Industrial Lead Deposit in Callao, Peru (Guerrero Leiva, 2009)
Lead level in blood (micrograms per deciliter)
Psychologically relevant symptoms expected (Tong, von Schimding, & Prapamontol, 2000)
Number of children at indicated level
0–10 Not considered poisoned 010–20 Slowed growth of CNS 520–40 Lowered nerve velocity 3640–70 Serious CNS symptoms, elevated
coproporphyrin in urine25
Note. CNS = central nervous system.
at NORTH CAROLINA STATE UNIV on November 8, 2012pps.sagepub.comDownloaded from
298 Hunt
from proven, differential fertility rates would accentuate the differences between nations over time.
Family size alone matters, apart from genetics. Strong evi-dence for this proposition has been obtained in Norwegian studies of birth order effects (Bjerkedal, Kristensen, Skjeret, & Brevik, 2007; Kristensen & Bjerkedal, 2007). In Norway, all men are required to register for military service at age 18. They are given a cognitive test at that time. The resulting large database, stretching over a number of years, makes it possible to test several hypotheses concerning both birth order and family effects. One result is particularly compelling. In the overall database, the mean IQ equivalent score of first-born men was 103, and the mean for second-born men was 100. However, the mean score of second-born men from families where the first-born died in childhood was 103. Similar increases in scores were observed in third-born children: an IQ of 99 in a family with no deaths of older siblings, 100 with one death, and 103 with two deaths.
Why should family size be so important? In the poorer nations in the world, and in low SES groups in the richer nations, the need to support many children forces adults to focus on the family’s economic well-being. This requirement competes with time for adult–child interactions that facilitate the development of the child’s mind. The effect is exacerbated when children are raised in understaffed orphanages or in fam-ilies that are headed by an older child. Both these conditions are much more frequent in the developing world than the industrial world. The absence of adult heads of family is an acute problem for counties that have high incidences of HIV/AIDS in the adult heterosexual population, for this disease strikes adults at the time in their lives at which they would normally be caregivers for their children.
Families are also important as motivators for educational achievement. As children mature, the family has to convince the student that educational effort is worthwhile. This is espe-cially true for abstract but crucial cognitive artifacts. How often does an eighth grader see someone using trigonometry? Nevertheless, trigonometry homework is important, and the family environment must encourage it. For, as Halpern et al. (2007) have explained, if you don’t practice, you won’t learn. If the family structure is not oriented toward encouraging stu-dents to work at learning throughout their career as students, the amount learned will be reduced.
Formal education. A great many things can be learned out-side of school in every society. Nevertheless, formal education is the way that students acquire skills in using the cognitive artifacts of the I&PI society.
Education is a cumulative process. The amount a child learns in the first grade determines the extent that he or she is ready to participate in the second grade, the amount learned in the second grade influences the amount learned in the third grade, and on and on. U.S. studies have shown that the extent to which a child has specific skills, such as prereading skills, and general habits facilitating the control of attention prior to
entering primary school will influence the rate at which he or she acquires information in later grades, extending through high school (Phillips, Crouse, & Ralph, 1998). Longitudinal studies such as this are fully consistent with PISA reports of correlations between ratings of the home educational environ-ment and the academic achievement of 15-year-olds. Once again on the basis of U.S. data, it is now clear that handicaps due to a lack of family support for the acquisition of school-relevant cognitive skills can be partially ameliorated by pre-school education programs. In spite of early pessimism (e.g., Jensen, 1969), these programs do work and are cost-effective, although recovering the cost of the investment takes decades (Barnett, 2011; Reynolds, Temple, Ou, Artega, & White, 2011). Similar early intervention programs are available within other I&PI nations. They are few and far between in the developing countries of Africa, Asia, and Latin America.
The sheer amount of formal education matters. Analyses within the developed world suggest that each year of educa-tion is associated with a rise in intelligence test scores equiva-lent to 2.7 points on the IQ scale (Winship & Korenman, 1997). If this is so, we should expect differences in educa-tional requirements to be reflected in differences in a country’s socioeconomic success. They are. Rindermann (2008) devel-oped a structural equation model in which, among other things, he determined the standardized regression coefficient for the number of years of education in a country in the 1970s and the country’s GDP/c in 2000. The coefficient was .40, which is of considerable economic importance.
Expanding on Rindermann’s (2008) idea, the key statistic is the expected number of school years that a child can anticipate upon entering first grade. This is the educational analogue of the familiar life expectancy measure, which is the (estimated) num-ber of years between birth and death. In the sub-Saharan nations of Africa, the expected number of school years is 9.5 years, with a range from 5 (Eritrea) to 13.5 (the island nation of the Sey-chelles). By contrast, the five developed nations of Canada, France, Germany, the United Kingdom, and the United States average 16.5 years with essentially no variation.12
A thought experiment shows how important these discrep-ancies might be. Jelte Wicherts and his colleagues (Wicherts, Dolan, Carlson, & Van Der Maas, 2010a; Wicherts, Dolan, & Van Der Maas, 2009) have estimated that sub-Saharan African nations have a mean intelligence test score in the 80–82 range.13 Suppose we set the five developed nations’ scores at 100. There is, on the average, a difference of 7 years in the expected number of school years between the African and the developed nations. Applying Winship and Korenmann’s (1997) 2.7 IQ points gain per year estimate, the difference in school years between the sub-Saharan and developed nations would account for an 18.9 IQ point difference—enough to wipe out the difference in reported national intelligence scores.
One should not take this exercise literally, for it assumes that the quality of the added schooling and the social support for students are equivalent in the developing nations of Africa and in postindustrial Northern Europe and North America.
at NORTH CAROLINA STATE UNIV on November 8, 2012pps.sagepub.comDownloaded from

What Makes Nations Intelligent 299
Rindermann and Ceci (2009) addressed this issue, at the inter-national level, by computing causal models relating the char-acteristics of national school systems to performance on international assessment programs, such as PISA. They found that the following characteristics lead to good performance, at the national level:
1. By far the most important predictor of the success of current students was the general educational level of the country, as indexed by such things as adult literacy and various other indices of adult academic achievement. This is consistent with Rindermann’s (2006) earlier finding that “the smart get smarter” over time. However, it presents a policy maker with something of a contretemps. The way to have a good educational system is to embed it in a country that already values and achieves educational success. Such values imply a high rate of participation among the current school-age population, something that Rindermann and Ceci (2009) found to be a predictor of high national achievement.
2. The second most important predictor is early entrance into school, particularly kindergarten. This appears to be at least partly because early entry facilitates the development of school-relevant habits, such as focusing attention.
3. Countries that make liberal use of formal assessment procedures and that track students into ability groups fairly early in the students’ careers perform better on international assessments of progress than countries that do not.
Rindermann and Ceci (2009) argued that national educa-tional policies could exert a major influence on all of these variables. Let us look at some of the problems that policymak-ers face.
In the I&PI countries, access is seldom not an issue; virtu-ally all students can attend school up until they are 15 or 16. In general, the majority of school fees are paid by the state, not the family. Dropout problems exist, but these are largely due to pressures on the individual student and mainly, though not exclusively, affect lower SES groups. The default alternative is that a child will go to school.
Outside the I&PI world, there are structural disincentives to schooling. Poorer countries shift the cost of primary and sec-ondary education to students and their families much more than the postindustrial countries do. For instance, on the Tan-zanian mainland, the gross national income per capita in 2011 was $1500, while high school fees, including fees and uni-forms, cost about $300.14 In other cases, children may be taken out of school because the family needs their financial contri-bution, which may vary from working as a herder on the Afri-can veldt to selling trinkets on the streets of increasingly crowded third-world cities. These are learning experiences, but they are not equivalent to formal schooling.
Rindermann and Ceci’s (2009) point about the importance of kindergarten assumes that the kindergarten experience actu-ally does prepare the child for school. The quality of kinder-garten and primary school education is more sensitive to student–teacher ratios than is secondary education, and the ability to maintain an appropriate student–teacher ratio is dependent on the availability of trained teachers. The problem is exacerbated if teachers’ working conditions are poorest in those sections of a country most in need of primary education. This is often the case, even in I&PI nations. Some countries attempt to solve the problem by requiring newly credentialed teachers to spend a certain number of years in an affected area, such as a poor area of a city or in impoverished rural areas. To the extent that these teachers leave their assigned positions as soon as they can, the most vulnerable children are being edu-cated by the least experienced teachers.
The use of frequent examinations and tracking raises some interesting cultural issues. Examinations do three things: eval-uate individual students’ learning, provide feedback to teach-ers and administrators about how the system is doing (rather like quality control studies in industry), and serve as manage-ment tools, to indicate to teachers what students are expected to learn and, by inference, what teachers are expected to teach.
Public education systems that practice tracking typically use examinations to group students by their current educa-tional level and then offer relatively uniform programs to a relatively uniform group of students. The most common form of tracking in I&PI nations is to group students into “aca-demic” and “vocational” tracks. The provision of “special education” programs for students having major academic dif-ficulties and (usually much smaller) advanced programs for high-achieving students are also forms of tracking. The hope is that if teachers in each track have to deal with relatively uniform students with similar educational goals, overall aca-demic achievement will be higher than if there is a high degree of variation in student goals and achievements within each class. Rindermann and Ceci’s (2009) analysis suggests that this hope can be realized.
Outside I&PI countries, early tracking based on academic performance is less prevalent. However, socioeconomic track-ing occurs to the extent that parents are required to pay for the education or, in some areas, by the simple availability of schools. Tracking at the high school level is widespread, because poorer countries do not have enough secondary school facilities for the entire population. As a result, assessment pro-grams that focus only on students enrolled in the schools, such as PISA, overestimate the level of I&PI relevant cognitive skills in the country. This does not mean that the people not assessed are stupid or that they do not have cognitive skills. It does mean that they have not been trained to exercise the cog-nitive skills and use the cognitive artifacts that are important in industrial societies.
The role of examinations in providing feedback and guid-ance to educators is too often overlooked. The content of a formal examination can be thought of as a message telling
at NORTH CAROLINA STATE UNIV on November 8, 2012pps.sagepub.comDownloaded from

300 Hunt
teachers and principals what they should be teaching. For instance, the U.S. No Child Left Behind (NCLB) program focuses on language usage, mathematics, and science. The international PISA program has a similar structure. In order to prepare students for such programs, teachers should ensure students’ knowledge of language arts and mathematics, and because of the breadth of the science category, students need to have a broad familiarity with topics in most of the sciences but need not have a deep understanding in any one of them. Student knowledge of humanities and arts is irrelevant to per-formance on the NCLB examinations. By contrast, the far more extensive (and more demanding of student time) British General Certificate of Secondary Education examination pro-gram tests the same topics as the NCLB and in addition offers students choices of examinations in the individual sciences (thus evaluating deeper knowledge in a narrower area of sci-ence) and various topics in the humanities and arts field. Therefore, the U.S. examination system encourages teachers to focus their instruction narrowly. The British system encour-ages broader instruction.
Other I&PI countries generally fall in between the British and American systems. Most of the developing countries sim-ply do not have the luxury of a choice, with the exception of offering courses that focus on their own history and culture. Therefore, education to impart the cognitive skills required by Western society may be limited to mathematics and fairly rudimentary science.
Education at the top. At the national level, the development of human resources is not just a matter of ensuring minimal education to all, as evidenced by high literacy rates and low dropout rates. Performance at the top counts a great deal. National measures of high-level academic achievement, such as the frequency of college graduates or the test scores of the top 5% of the student population, better predict economic suc-cess than do more general indicators, such as literacy rate (Rindermann & Thompson, 2011). Performance in mathemat-ics is particularly important because of mathematics’ central-ity in the science, technology, education, and mathematics (STEM) fields. In order to meet national needs, the best stu-dents have to be encouraged to do more than get by—they need to be encouraged to become experts. Achieving high lev-els of performance requires a lot of hard work. Cultural prac-tices influence both the opportunity students have to put in the time needed to acquire high-level skills and the encourage-ment students are given to do so.
Figure 2 shows the 2009 PISA mathematics scores for 15-year-old boys and girls in the 10 (out of 65) highest scoring countries. (The United States, which is not shown, ranked 31st overall with scores of 477 for girls and 497 for boys.) There was considerable variation between countries, even within the top 10. Boys outperformed girls in every one of the top 10 countries (and in the 65 countries generally). However, the gender differences were far smaller than the international dif-ferences. The 15-year old girls in Singapore outscored 15-year old boys in the other 64 countries.
The top 10 countries included four industrialized Asian countries: South Korea, Singapore, Taiwan (China–Taipei), and three industrialized autonomous regions of the People’s Republic of China.15 Explanations offered for Asian promi-nence in mathematics have run the gamut from presumed genetic differences to Confucian respect for scholarship. The PISA data, and the observations of many who have visited Asian communities, are consistent with a simple behavioral explanation: Asians and students in other high-scoring nations simply spend more time practicing mathematics than do stu-dents in other countries. In the United States, the school year is from 34 to 36 weeks long, depending on the state. European school years are generally 2 weeks longer. In the Asian coun-tries shown in Figure 2, school years are 40 to 43 weeks long. In addition, students in the industrial Asian countries are con-siderably more likely to receive additional mathematical instruction than are students in predominantly non-Asian countries. This is shown in Figure 3A.
Halpern et al.’s (2007) principle applies: You learn to do what you practice doing.
The importance of attitude. In recent years, a great deal of research has documented the importance of attitude and moti-vation as determinants of cognitive accomplishment (Duck-worth, Quinn, Lynam, Loeber, & Stouthamer-Loeber, 2011). This is not inconsistent with an emphasis on practice, for by and large a person will practice those activities that he or she regards as culturally appropriate and potentially rewarding. Two further aspects of international differences in students’ accomplishments in mathematics are relevant.
The gender difference in mathematics shown in Figure 2 has been found in previous PISA examinations. The 2003 results are of special interest, for these assessments concen-trated on mathematics. Various measures of gender inequality had correlations in the .5 region with the size of the gender gap. The more opportunity women had to use their education, the better their educational achievement (Else-Quest, Hyde, & Linn, 2010; Guiso, Monte, Sapienza, & Zingales, 2008). This
450 500 550 600 650
FemaleMale
PISA MATH SCORE
Macao-ChinaCanada
SwitzerlandNetherlands
KoreaHong Kong-China
FinlandChinese Taipei
SingaporeShanghai-China
Fig. 2. Mathematics scores for 15-year-old male and female students on the Program for International Student Assessment 2009 examinations. Scores are shown for the top 10 of 65 nations.
at NORTH CAROLINA STATE UNIV on November 8, 2012pps.sagepub.comDownloaded from
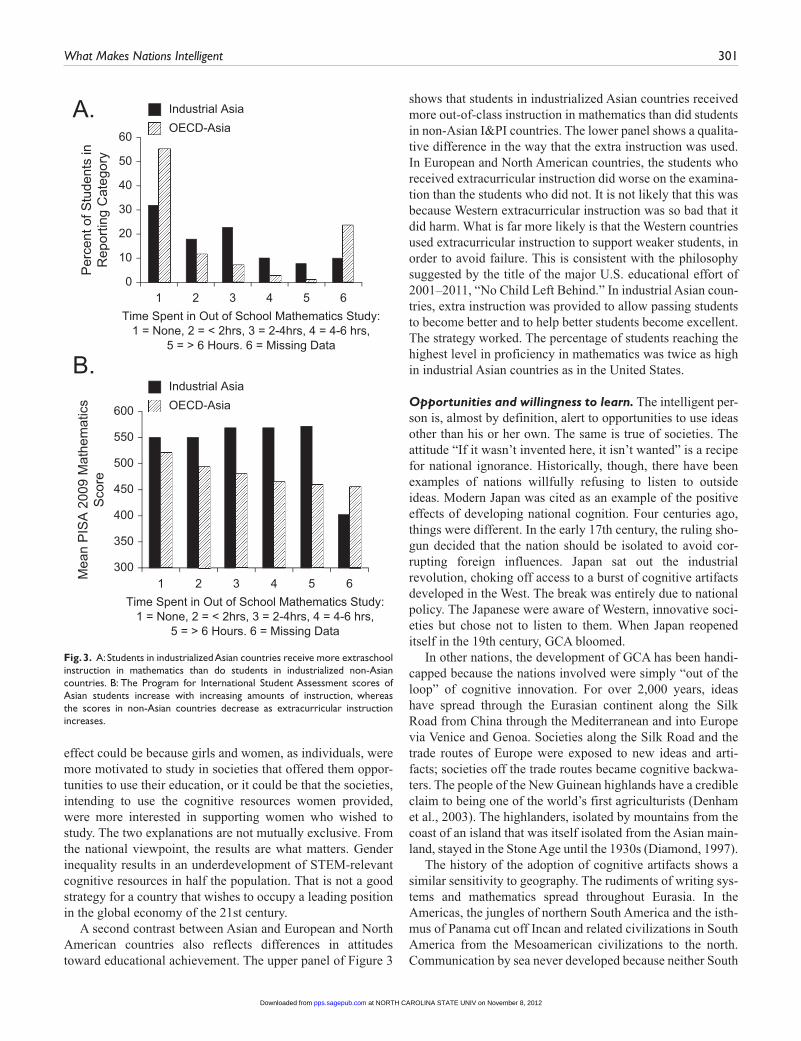
What Makes Nations Intelligent 301
effect could be because girls and women, as individuals, were more motivated to study in societies that offered them oppor-tunities to use their education, or it could be that the societies, intending to use the cognitive resources women provided, were more interested in supporting women who wished to study. The two explanations are not mutually exclusive. From the national viewpoint, the results are what matters. Gender inequality results in an underdevelopment of STEM-relevant cognitive resources in half the population. That is not a good strategy for a country that wishes to occupy a leading position in the global economy of the 21st century.
A second contrast between Asian and European and North American countries also reflects differences in attitudes toward educational achievement. The upper panel of Figure 3
shows that students in industrialized Asian countries received more out-of-class instruction in mathematics than did students in non-Asian I&PI countries. The lower panel shows a qualita-tive difference in the way that the extra instruction was used. In European and North American countries, the students who received extracurricular instruction did worse on the examina-tion than the students who did not. It is not likely that this was because Western extracurricular instruction was so bad that it did harm. What is far more likely is that the Western countries used extracurricular instruction to support weaker students, in order to avoid failure. This is consistent with the philosophy suggested by the title of the major U.S. educational effort of 2001–2011, “No Child Left Behind.” In industrial Asian coun-tries, extra instruction was provided to allow passing students to become better and to help better students become excellent. The strategy worked. The percentage of students reaching the highest level in proficiency in mathematics was twice as high in industrial Asian countries as in the United States.
Opportunities and willingness to learn. The intelligent per-son is, almost by definition, alert to opportunities to use ideas other than his or her own. The same is true of societies. The attitude “If it wasn’t invented here, it isn’t wanted” is a recipe for national ignorance. Historically, though, there have been examples of nations willfully refusing to listen to outside ideas. Modern Japan was cited as an example of the positive effects of developing national cognition. Four centuries ago, things were different. In the early 17th century, the ruling sho-gun decided that the nation should be isolated to avoid cor-rupting foreign influences. Japan sat out the industrial revolution, choking off access to a burst of cognitive artifacts developed in the West. The break was entirely due to national policy. The Japanese were aware of Western, innovative soci-eties but chose not to listen to them. When Japan reopened itself in the 19th century, GCA bloomed.
In other nations, the development of GCA has been handi-capped because the nations involved were simply “out of the loop” of cognitive innovation. For over 2,000 years, ideas have spread through the Eurasian continent along the Silk Road from China through the Mediterranean and into Europe via Venice and Genoa. Societies along the Silk Road and the trade routes of Europe were exposed to new ideas and arti-facts; societies off the trade routes became cognitive backwa-ters. The people of the New Guinean highlands have a credible claim to being one of the world’s first agriculturists (Denham et al., 2003). The highlanders, isolated by mountains from the coast of an island that was itself isolated from the Asian main-land, stayed in the Stone Age until the 1930s (Diamond, 1997).
The history of the adoption of cognitive artifacts shows a similar sensitivity to geography. The rudiments of writing sys-tems and mathematics spread throughout Eurasia. In the Americas, the jungles of northern South America and the isth-mus of Panama cut off Incan and related civilizations in South America from the Mesoamerican civilizations to the north. Communication by sea never developed because neither South
1 2 3 4 5 60
10
20
30
40
50
60
Per
cent
of S
tude
nts
inR
epor
ting
Cat
egor
y
Time Spent in Out of School Mathematics Study:1 = None, 2 = < 2hrs, 3 = 2-4hrs, 4 = 4-6 hrs,
5 = > 6 Hours. 6 = Missing Data
Time Spent in Out of School Mathematics Study:1 = None, 2 = < 2hrs, 3 = 2-4hrs, 4 = 4-6 hrs,
5 = > 6 Hours. 6 = Missing Data
A.
B.
1 2 3 4 5 6
600
550
500
450
400
350
300Mea
n P
ISA
200
9 M
athe
mat
ics
Sco
re
OECD-AsiaIndustrial Asia
OECD-AsiaIndustrial Asia
Fig. 3. A: Students in industrialized Asian countries receive more extraschool instruction in mathematics than do students in industrialized non-Asian countries. B: The Program for International Student Assessment scores of Asian students increase with increasing amounts of instruction, whereas the scores in non-Asian countries decrease as extracurricular instruction increases.
at NORTH CAROLINA STATE UNIV on November 8, 2012pps.sagepub.comDownloaded from
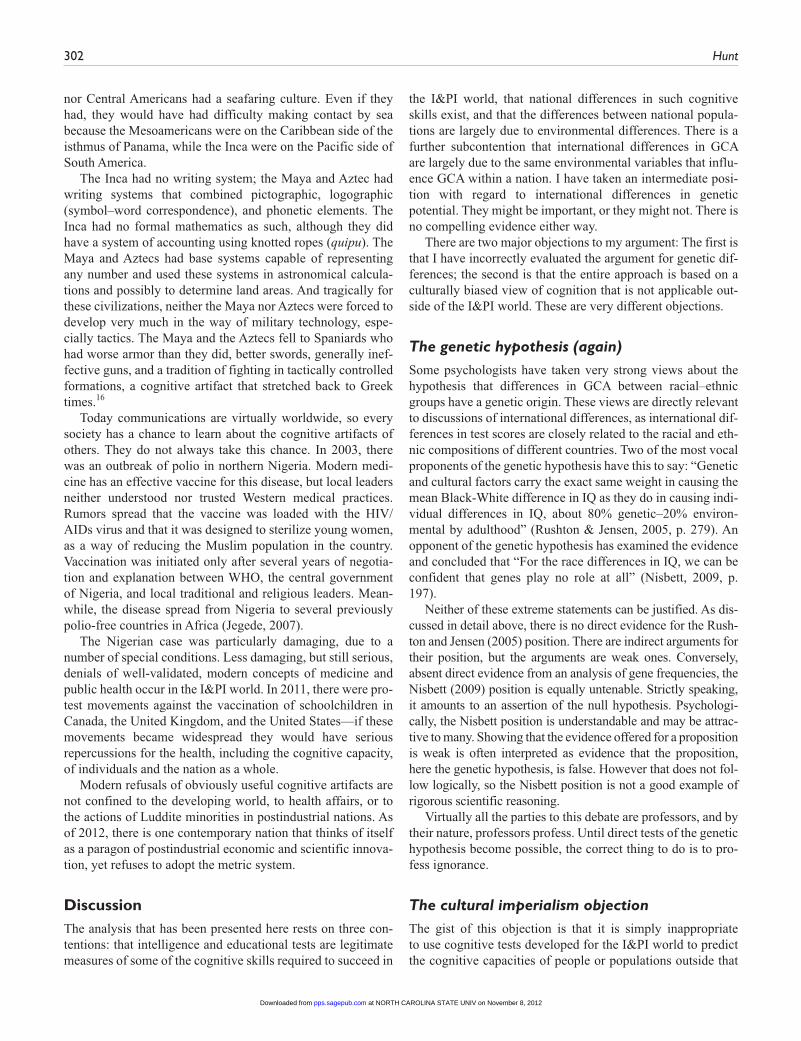
302 Hunt
nor Central Americans had a seafaring culture. Even if they had, they would have had difficulty making contact by sea because the Mesoamericans were on the Caribbean side of the isthmus of Panama, while the Inca were on the Pacific side of South America.
The Inca had no writing system; the Maya and Aztec had writing systems that combined pictographic, logographic (symbol–word correspondence), and phonetic elements. The Inca had no formal mathematics as such, although they did have a system of accounting using knotted ropes (quipu). The Maya and Aztecs had base systems capable of representing any number and used these systems in astronomical calcula-tions and possibly to determine land areas. And tragically for these civilizations, neither the Maya nor Aztecs were forced to develop very much in the way of military technology, espe-cially tactics. The Maya and the Aztecs fell to Spaniards who had worse armor than they did, better swords, generally inef-fective guns, and a tradition of fighting in tactically controlled formations, a cognitive artifact that stretched back to Greek times.16
Today communications are virtually worldwide, so every society has a chance to learn about the cognitive artifacts of others. They do not always take this chance. In 2003, there was an outbreak of polio in northern Nigeria. Modern medi-cine has an effective vaccine for this disease, but local leaders neither understood nor trusted Western medical practices. Rumors spread that the vaccine was loaded with the HIV/AIDs virus and that it was designed to sterilize young women, as a way of reducing the Muslim population in the country. Vaccination was initiated only after several years of negotia-tion and explanation between WHO, the central government of Nigeria, and local traditional and religious leaders. Mean-while, the disease spread from Nigeria to several previously polio-free countries in Africa (Jegede, 2007).
The Nigerian case was particularly damaging, due to a number of special conditions. Less damaging, but still serious, denials of well-validated, modern concepts of medicine and public health occur in the I&PI world. In 2011, there were pro-test movements against the vaccination of schoolchildren in Canada, the United Kingdom, and the United States—if these movements became widespread they would have serious repercussions for the health, including the cognitive capacity, of individuals and the nation as a whole.
Modern refusals of obviously useful cognitive artifacts are not confined to the developing world, to health affairs, or to the actions of Luddite minorities in postindustrial nations. As of 2012, there is one contemporary nation that thinks of itself as a paragon of postindustrial economic and scientific innova-tion, yet refuses to adopt the metric system.
DiscussionThe analysis that has been presented here rests on three con-tentions: that intelligence and educational tests are legitimate measures of some of the cognitive skills required to succeed in
the I&PI world, that national differences in such cognitive skills exist, and that the differences between national popula-tions are largely due to environmental differences. There is a further subcontention that international differences in GCA are largely due to the same environmental variables that influ-ence GCA within a nation. I have taken an intermediate posi-tion with regard to international differences in genetic potential. They might be important, or they might not. There is no compelling evidence either way.
There are two major objections to my argument: The first is that I have incorrectly evaluated the argument for genetic dif-ferences; the second is that the entire approach is based on a culturally biased view of cognition that is not applicable out-side of the I&PI world. These are very different objections.
The genetic hypothesis (again)Some psychologists have taken very strong views about the hypothesis that differences in GCA between racial–ethnic groups have a genetic origin. These views are directly relevant to discussions of international differences, as international dif-ferences in test scores are closely related to the racial and eth-nic compositions of different countries. Two of the most vocal proponents of the genetic hypothesis have this to say: “Genetic and cultural factors carry the exact same weight in causing the mean Black-White difference in IQ as they do in causing indi-vidual differences in IQ, about 80% genetic–20% environ-mental by adulthood” (Rushton & Jensen, 2005, p. 279). An opponent of the genetic hypothesis has examined the evidence and concluded that “For the race differences in IQ, we can be confident that genes play no role at all” (Nisbett, 2009, p. 197).
Neither of these extreme statements can be justified. As dis-cussed in detail above, there is no direct evidence for the Rush-ton and Jensen (2005) position. There are indirect arguments for their position, but the arguments are weak ones. Conversely, absent direct evidence from an analysis of gene frequencies, the Nisbett (2009) position is equally untenable. Strictly speaking, it amounts to an assertion of the null hypothesis. Psychologi-cally, the Nisbett position is understandable and may be attrac-tive to many. Showing that the evidence offered for a proposition is weak is often interpreted as evidence that the proposition, here the genetic hypothesis, is false. However that does not fol-low logically, so the Nisbett position is not a good example of rigorous scientific reasoning.
Virtually all the parties to this debate are professors, and by their nature, professors profess. Until direct tests of the genetic hypothesis become possible, the correct thing to do is to pro-fess ignorance.
The cultural imperialism objectionThe gist of this objection is that it is simply inappropriate to use cognitive tests developed for the I&PI world to predict the cognitive capacities of people or populations outside that
at NORTH CAROLINA STATE UNIV on November 8, 2012pps.sagepub.comDownloaded from

What Makes Nations Intelligent 303
world. A related argument is that even within the I&PI world, these tests have primarily been developed to predict secularly defined material success, such as socioeconomic status or income. There are other aspects of life, such as commitment to family or living a life in harmony with some philosophic prin-ciple (including religions) that may be highly valued but are not predicted by cognitive test scores.
The first argument is directed at the tests themselves. The extent to which the cognitive tests developed within the frame-work of the I&PI world can predict success in endeavors out-side that world is an open question. To the extent that the tests evaluate properties of reasoning that are required by all cul-tures, such as the ability to control attention, orient in space, and understand language, one would expect some prediction. To the extent that the tests evaluate aspects of reasoning spe-cific to the I&PI culture, such as the use of syllogistic reason-ing, they may not predict success in other cultures. There is also the issue that the testing paradigm itself, the “drop in from the sky” method of evaluation, may be foreign to many cul-tures. Any investigator operating outside the I&PI world has to be concerned about this, but how well the investigator has met the challenge can be answered only on a case-by-case basis.
The second argument is directed not at the tests but at the criterion measures used to validate tests. Within the I&PI world, the use of cognitive tests is validated by their ability to predict certain measures of secularly defined material success. These typically include income, measured socioeconomic status, and overt academic achievement, as evidenced by grades achieved and degrees earned. Other societies may not define success in this way. Therefore, it is arrogant to define the intelligence of a nation outside the industrial world by the extent to which its population possesses the skills needed to succeed in that world.
It is true that over the years various people, ranging from Galton in the 19th century to the advocates of genetic hypoth-eses in the 21st, have used differences in test scores to infer differences in genetic potential. It is also true that in some sense even the use of terms like “developed” and “developing” or “traditional” compared with “modern” nations carries with it the implication that there is a natural course of development of human societies, and that individual nations can be placed at their position in the developmental path. Why should the skills and beliefs of a Masai goatherder in Kenya be regarded as more or less valuable than those of a computer programmer in Seattle?
This argument has much to recommend it as an abstract statement of the equality of human endeavors. (It also has weaknesses, but a discussion of these would take us too far afield.) For the limited purpose of this article, though, the objection misses the central point of the argument. There is no claim that the I&PI definition of intelligence is in some sense morally superior to the definitions that might be offered by other societies. The claim is a pragmatic one. I&PI societies dominate the world today. Barring a cataclysm such as ther-monuclear war, they will continue to do so for the foreseeable future.
Virtually all the developing nations of the world are striv-ing to obtain the benefits of the postindustrial world. The extent to which they will succeed will depend very much on their ability to develop and use those cognitive abilities that are essential in I&PI societies.
ConclusionNations do indeed differ in their cognitive resources. So do states within the United States (Pesta, McDaniel, & Bertsch, 2010), although the differences are not nearly as extreme as the international differences. These differences influence the economic, social, and physical well-being of the relevant society.
The thesis of this article is that national indicators of intel-ligence are indicators of national differences in the ability to use the cognitive artifacts that are required to participate in modern industrial and postindustrial societies. Differences in national capabilities to use cognitive artifacts are due to differ-ences in the extent to which different nations provide tech-niques and institutions for the development of individual cognition. Many of the efforts to improve cognition interact, as in the case of nutrition and education. In other cases, efforts to improve cognition may conflict with short-term economic goals, such as the development of natural resources. I conjec-ture that, possibly outside of schooling, it may be harder to make social changes than to make changes in the physical environment.
Acknowledgments
This article is based on an invited address to the Association of Psychological Science (APS) in Washington, DC, in May 2001, on the occasion of the author’s receiving the James McKeen Cattell award for lifetime accomplishment. I thank APS for awarding me this unexpected honor. A lifetime award is almost always a team award, presented to the coach. I have been fortunate to work with a fine group of colleagues: undergraduates, graduates, postdoctoral and faculty associates, research technicians, and administrative asso-ciates. I am happy to accept this honor on behalf of the team.
Declaration of Conflicting Interests
The author declared that he had no conflicts of interest with respect to his authorship or the publication of this article.
Notes
1. The correlation is between the occupation’s GCA loading and the logarithm of median wages for an occupation, as listed by the Bureau of Labor Statistics, Income Census, 2011.2. Bureau of Labor Statistics, Income Census, 2011.3. Information on the bubonic plague downloaded from www.bbc.co.uk/history/british/middle_ages/blackdisease_01.shtml in January 2012.4. I wish I could claim credit for this phrase describing testing, but I cannot. I first heard it used by the psychometrician Robert Mislevy, then working at the Educational Testing Service.
at NORTH CAROLINA STATE UNIV on November 8, 2012pps.sagepub.comDownloaded from
304 Hunt
5. The qualification “of comparable cost” is important. In academic settings, prior grades are often as good or slightly better indicators of success than are tests. In industrial settings, work samples are approximately as good indicators as test scores. Carefully structured interviews are also approximately as accurate predictors of future performance as are test scores. (Unstructured interviews are not even close to as accurate.) In academic settings, personnel screening occurs primarily at the college/university entry level. The use of grades presents a problem if applicants come from secondary schools that have varying standards. It is more expensive to obtain a work sample or conduct a structured interview than to give a test.6. The predictive correlation is estimated by correcting the observed correlation between test scores and the performance of successful applicants in order to allow for restriction of range and unreliability of the test. A case can be made for correcting only for restriction of range. However, because conventional tests are highly reliable, the correction for unreliability is usually small.7. Studies such as Terman and Oden’s (1959) and the SMPY have been criticized on the grounds that the “gifted” groups studied did not include any extremely distinguished contributors to society, such as a Nobel laureate. This criticism sets an impossibly high criterion for the success of the study. Consider the following rough calcula-tion: The SMPY and Terman and Oden studies, combined, contained slightly less than 4,000 people. As of the end of 2011, 549 Nobel Prizes had been awarded (number downloaded from http://www.nobelprize.org/nobel_prizes/nobelprize_facts.html, January 2012). Suppose that an equal number of people made contributions as great as the laureates but, for some reason, did not receive the prize. Combining these numbers, we estimate that there were approxi-mately 1,100 extremely distinguished contributors to society over the last 150 years. Now assume further that due to a variety of restric-tions, such as cultural background, only the most favored 5% of the people alive during the period in which the studies were conducted came from a population that could include a distinguished contribu-tor. (For instance, we disregard the rural populations of India and China, which alone constituted about 40% of the world’s population over this time period.) Call this 5% the eligible group. Assuming that roughly 10 billion people had adult lives during the past 150 years, the eligible group would contain approximately 500 million indi-viduals, including 1,100 distinguished contributors. The probability of randomly choosing a distinguished contributor from the eligible group would be .0000022, just over two chances in a million. The probability that a randomly chosen group of 4,000 members of the eligible population did not contain any distinguished contributors would be (1 − .0000022)4000— that is, .99.8. Economic data for Japan and Nigeria obtained from the CIA World Factbook, January 2012.9. Information on OECD desired family sizes downloaded from the OECD database, www.oecd.org/dataoecd/30/35/45582462.pdf (January 2012).10. The reference nations were Brazil, Ghana, India, Norway, Oman, and the United States.11. Bloomberg News, August 2, 2007. Information downloaded from http://www.bloomberg.com/apps/news?pid=newsarchive&sid=ah7cuhojMidI&;refer=home.
12. Based on the CIA World Factbook country profiles as of 2011. The African nations of the Sudan, South Sudan, and Somalia have been omitted because at the time of writing, a substantial portion of their populations were refugees from civil wars.13. Lynn and Vanhanen (2002, 2006) have made much lower esti-mates, but as Wicherts and his colleagues have pointed out (Wicherts, Dolan, Carlson, & Van der Maas, 2010b; Wicherts, Dolan, & Van Der Maas, 2010), Lynn and Vanhanen used unsystematic selection methods that biased their estimates downward.14. The data on GDP were provided by the CIA World Factbook (2011). The data for secondary education fees were provided by Keratu School Foundation, Keratu, Tanzania. This figure includes tuition (which is low) and numerous fees, which collectively add up to quite a bit.15. The People’s Republic of China, currently the most populous country on earth, is a unique case. Regions of China, such as Shanghai, are industrialized and, as shown here, tend to have high test scores. China has not reported test scores for its large, less indus-trialized regions.16. The Spanish conquistadores did not prevail solely because of their cognitive skills. The Amerindians were greatly weakened by the inadvertent introduction of smallpox, for which they had no immu-nity. However, the conquistadores won almost every battle that they fought, even though they were often heavily outnumbered. A major factor was their use of infantry tactics similar to modern close-order drill, which ensured that although they were outnumbered on the field, they outnumbered the enemy at the point of contact. Police today control large crowds in a similar way. The conquistadores also made use of superior writing and communication systems to report to and call for reinforcements from Spain. Our modern, secular society often underrates the influence of the Catholic Church as a motivating force that helped maintain morale during the arduous campaigns of colonial conquest. Tactics, writing, and religion are cognitive artifacts.
References
Ackerman, P. L. (2000). Domain-specific knowledge as the “dark matter” of adult intelligence: Gf/Gc, personality, and interest correlates. Journal of Gerontology: Psychological Sciences, 55, 69–84.
Barnett, W. S. (2011). Effectiveness of early educational intervention. Science, 333, 975–978.
Bertrand, M., Mullainathan, S., & Shafir, E. (2006). Behavioral eco-nomics and marketing in aid of decision making among the poor. Journal of Public Policy & Marketing, 25(1), 8–23.
Bjerkedal, T., Kristensen, P., Skjeret, G. A., & Brevik, J. L. (2007). Intelligence test scores and birth order among young Norwegian men (conscripts) analyzed within and between families. Intelli-gence, 35, 503–514.
Brooks, D. (2011). The social animal: The hidden sources of love, character, and achievement. New York, NY: Random House.
Canfield, R. L., Henderson, C. R. Jr., Cory-Slechta, D. A., Cox, C., Jusko, T. A., & Lanphear, B. P. (2003). Intellectual impairment in children with blood lead concentrations below 10 μg per deciliter. New England Journal of Medicine, 348, 1517–1526.
at NORTH CAROLINA STATE UNIV on November 8, 2012pps.sagepub.comDownloaded from
What Makes Nations Intelligent 305
Ceci, S. J. (1990). On intelligence . . . more or less: A bio-ecological treatment on intellectual development. Englewood Cliffs, NJ: Prentice Hall.
Crookston, B. T., Dearden, K. A., Alder, S. C., Porucznik, C. A., Stafford, J. B., Merrill, R. M., . . . Penny, M. A. (2011). Impact of early and concurrent stunting on cognition. Maternal & Child Nutrition, 7, 397–409.
Davies, G., Tenesa, A., Payton, A., Yang, J., Harris, S. E., Liewald, D., . . . Deary, I. J. (2011). Genome-wide association studies establish that human intelligence is highly heritable and polygen-etic. Molecular Psychiatry, 16, 1–10.
Denham, T. P., Haberle, S. G., Lentfer, C., Fullagar, R., Field, J., Therin, M., . . . Winsborough, B. (2003). Origins of agriculture at Kuk swamp in the highlands of New Guinea. Science, 301, 189–193.
Diamond, J. (1997). Guns, germs, and steel: The fates of human soci-eties. San Francisco, CA: W. W. Norton.
Duckworth, A. L., Peterson, C. Matthews, M. D., & Kelly, D. R. (2007). Grit: Perseverance and passion for long term goals. Jour-nal of Personality and Social Psychology, 92, 1087–1101.
Duckworth, A. L., Quinn, P. D., Lynam, D. R., Loeber, R., & Stouthamer-Loeber, M. (2011). Role of test motivation in intelli-gence testing. Proceedings of the National Academy of Sciences, 108, 7716–7720.
Else-Quest, N. M., Hyde, J. S., & Linn, M. C. (2010). Cross-national patterns of gender differences in mathematics: A meta-analysis. Psychological Bulletin, 136, 103–127.
Eppig, C., Fincher, C. L., & Thornhill, R. (2010). Parasite prevalence and the worldwide distribution of cognitive ability. Proceedings of the Royal Society B: Biological Sciences, 277, 3801–3808.
Feyrer, J. (2008). Aggregate evidence on the link between age struc-ture and productivity. Population and Development Review, 34, 78–99.
Flynn, J. R. (2007). What is intelligence? Cambridge, UK: Cam-bridge University Press.
Gladwell, M. (2008). Outliers: The story of success. New York, NY: Little Brown.
Gottfredson, L. S. (1997). Why g matters: The complexity of every-day life. Intelligence, 24, 79–132.
Gottfredson, L. S. (2004). Intelligence: Is it the epidemiologists’ elusive “fundamental cause” of social class inequalities in health? Journal of Personality and Social Psychology, 86, 174–199.
Guerrero Leiva, M. K. (2009). Impacto de la exposición a plomo en los niños del Callao-Perú [Impact of lead exposure in the chil-dren of Callao, Peru]. Lima, Peru: Fundación Cayetano Heredia.
Guiso, L., Monte, F., Sapienza, P., & Zingales, L. (2008). Culture, gender, and math. Science, 320, 1164–1165.
Halpern, D. F., Benbow, C. P., Geary, D. C., Gur, R. C., Hyde, J. S., & Gernsbacher, M. A. (2007). The science of sex differences in science and mathematics. Psychological Science in the Public Interest, 6(1), 1–51.
Hubbs-Tait, L., Nation, J. R., Krebs, N. F., & Bellinger, D. C. (2005). Neurotoxicants, micronutrients, and social environments:
Individual and combined effects on children’s development. Psy-chological Science in the Public Interest, 6(3), 57–121.
Hunt, E. (2011). Human intelligence. New York, NY: Cambridge University Press.
Hunt, E., & Carlson, J. (2007). Considerations relating to the study of group differences in intelligence. Perspectives in Psychological Science, 2(2), 194–213.
Hunt, E., & Madhyastha, T. M. (2012). Cognitive demands of the workplace. Journal of Neuroscience, Psychology, and Economics, 5, 18–37.
Hunt, E., & Wittmann, W. (2008). National intelligence and national prosperity. Intelligence, 36, 1–9.
James, P., & Thorp, N. (1994). Ancient inventions. New York, NY: Ballantine Books.
Jegede, A. S. (2007). What led to the Nigerian boycott of the polio vaccination campaign? PLoS Medicine, 4(3), e73. doi:10.1371/journal.pmed.0040073
Jensen, A. R. (1969). How much can we boost IQ and scholastic achievement? Harvard Educational Review, 39(1), 1–123.
Johnson, W., & Bouchard, T. J., Jr. (2007). Sex differences in mental abilities: g masks the dimensions on which they lie. Intelligence, 35, 23–39.
Johnson, W., Penke, S., & Spinath, F. M. (2011). Heritability in the era of molecular genetics: Some thoughts for understanding genetic influences on behavioral traits. European Journal of Per-sonality, 25, 254–266.
Kanazawa, S. (2004). General intelligence as a domain-specific adaptation. Psychological Review, 111, 512–523.
Kristensen, P., & Bjerkedal, T. (2007). Explaining the relation between birth order and intelligence. Science, 316, 1717.
Kuncel, N. R., & Hezlett. S. A. (2010). Fact and fiction in cognitive ability testing for admissions and hiring decisions. Current Direc-tions in Psychological Science, 19, 339–345.
Lai, C.-Q. (2006). How much of human height is genetic and how much is due to nutrition? Scientific American. Retrieved from www.scientificamerican.com/article.cfm?id=how-much-of-human-height
Lubinski, D. (2009). Exceptional cognitive ability: The phenotype. Behavior Genetics, 39, 350–358.
Lynn, R. (2006). Race differences in intelligence: An evolutionary analysis. Augusta, GA: Washington Summit Publishers.
Lynn, R., & Harvey, J. (2008). The decline of the world’s IQ. Intel-ligence, 38, 112–120.
Lynn, R., & Vanhanen, T. (2002). IQ and the wealth of nations. West-port, CT: Praeger.
Lynn, R., & Vanhanen, T. (2006). IQ and global inequality. Augusta, GA: Washington Summit Publishers.
Muller, C, Ride, S. M., Fouke, J., Whitney, T., Denton, D. D., Cantor, N., . . . Robinson, S. (2005). Gender differences and performance in science. Science, 307, 1043.
Murray, C. (2012). Coming apart: The state of White America 1960–2010. New York: Crown Forum.
Nicolson, A. (2005). God’s secretaries: The making of the King James Bible. New York, NY: HarperCollins.
at NORTH CAROLINA STATE UNIV on November 8, 2012pps.sagepub.comDownloaded from
306 Hunt
Nisbett, R. E. (2009). Intelligence and how to get it. New York, NY: Norton.
Pak., S. (2010). The growth status of North Korean refugee children and adolescents from 6 to 19 years of age. Economics & Human Biology, 8, 385–395.
Pesta, B. J., McDaniel, M. A., & Bertsch, S. (2010). Toward an index of well-being for the fifty U.S. States. Intelligence, 38, 160–168.
Phillips, M., Crouse, J., & Ralph, J. (1998). Does the Black-White test score gap widen after children enter school? In C. Jenks & M. Phillips (Eds.), The Black-White test score gap (pp. 229–272). Washington, DC: Brookings Institute.
Pollitt, E., Gorman, K. S., Patrice, L., Martorell, R., Rivera, J., Wachs, T. D., & Scrimshaw, N. S. (1993). Early supplemental feeding and cognition. Effects over two decades. Monographs of the Society for Research in Child Development, 58(7), v-99.
Reynolds, A. J., Temple, J. A., Ou, S.-R., Artega, I. A., & White, B. A. B. (2011). School-based early childhood education and age-28 well-being: Effects by timing, dosage, and subgroups. Science, 333, 360–336.
Rhodes, R. (2011). Hedy’s folly. New York, NY: Doubleday.Rindermann, H. (2007). The g factor of international cognitive abil-
ity comparisons. The homogeneity of results in PISA, TIMSS, PIRLS, and IQ tests across nations. European Journal of Person-ality, 21, 667–706.
Rindermann, H. (2008). Relevance of education and intelligence at the national level for the economic welfare of people. Intelli-gence, 36, 127–142.
Rindermann, H., & Ceci, S. J. (2009). Educational policy and coun-try outcomes in international cognitive competence studies. Per-spectives on Psychological Science, 4, 551–577.
Rindermann, H., & Thompson, J. P. (2011). Cognitive capitalism: The effect of cognitive ability on wealth, as mediated through scientific achievement and economic freedom. Psychological Science, 22, 754–763.
Roberts, L. (2007). Vaccine-related polio outbreak in Nigeria raises concerns. Science, 317, 1842.
Robinson, N. M. (1996). Acceleration as an option for the highly gifted adolescent. In C. P. Benbow & D. J. Lubinski (Eds.), Intel-lectual talent: Psychometric and social issues (pp. 169–178). Baltimore, MD: Johns Hopkins University Press.
Rushton, J. P., & Jensen, A. R. (2005). Thirty years of research on race differences in cognitive ability. Psychology, Public Policy, and Law, 11, 235–294.
Schmidt, F. L., & Hunter, J. E. (1998). The validity and utility of selection methods in personnel psychology: Practical and theo-retical implications of 85 years of research findings. Psychologi-cal Bulletin, 124, 262–274.
Schwekendiek, D. (2009). Height and weight differences between North and South Korea. Journal of Biosocial Science, 41, 51–55.
Schwemberger, J. G., Mosby, J. E., Doa, M. J., Jacobs, D. E., Ashley, P. J., Brody, D. J., . . . Homa, D. (2005). Blood lead levels—United States, 1999-2002 morbidity and mortality weekly report. Center for Disease Control, 54, 513–516.
Sternberg, R. J., Forsythe, G. B., Hedlund, J., Horvath, J. A., Wagner, R. K., Williams, W. M., . . . Grigorenko, E. L. (2000). Practical intelligence in everyday life. New York, NY: Cambridge Univer-sity Press.
Sticht, T. G., Armstrong, W. B., Hickey, D. T., & Caylor, J. S. (1987). Cast-off youth: Policy and training methods from the military experience. New York, NY: Praeger.
Terman, L. M., & Oden, M. H. (1959). The gifted group at mid-life. Thirty five years’ follow-up of the superior child. Palo Alto, CA: Stanford University Press.
Tong, S., von Schimding, Y. E., & Prapamontol, T. (2000). Envi-ronmental lead exposure: A public health problem of global dimensions. Bulletin of the World Health Organization, 78, 1068– 1077.
Turkheimer, E., Haley, A., Waldron, M., D’Onofrio, B., & Gottes-man, I. (2003). Socioeconomic status modifies heritability of IQ in young children. Psychological Science, 14, 623–628.
van Leeuwen, M., van den Berg, S. M., & Boomsma, D. I. (2008). A twin-family study of general IQ. Learning and Individual Differ-ences, 18, 76–88.
Walker, S. P., Wachs, T. D., Gardner, J. M., Lozoff, B., Wasserman, G., Pollit, E., . . . The International Child Development Steering Group. (2007). Child development: Risk factors for adverse out-comes in developing countries. Lancet, 369, 146–157.
Westoff, C. F. (2010). Desired number of children: 2000–2008. DHS comparative (Reports No. 25). Calverton, MD: ICF Macro.
Whetzel, D. L., & McDaniel, M. A. (2006). Prediction of national wealth. Intelligence, 34, 449–458.
Wicherts, J. M., Borsboom, D., & Dolan, C. V. (2010). Why national IQs do not support evolutionary theories of intelligence. Person-ality and Individual Differences, 48, 91–96.
Wicherts, J. M., Dolan, C. V., Carlson, J. S., & Van der Maas, H. L. J. (2010a). Another failure to replicate Lynn’s estimate of the aver-age IQ of sub-Saharan Africans. Learning and Individual Differ-ences, 20, 155–157.
Wicherts, J. M., Dolan, C. V., Carlson, J. S., & van der Maas, H. L. J. (2010b). Raven’s test performance of sub-Saharan Africans: Average performance, psychometric properties, and the Flynn effect. Learning and Individual Differences, 20, 135–151.
Wicherts, J. M., Dolan, C. V., & van der Maas, H. L. J. (2009). A systematic literature review of the average IQ of sub-Saharan Africans. Intelligence, 38, 1–20.
Wicherts, J. M., Dolan, C. V., & van der Maas, H. L. J. (2010). The dangers of unsystematic selection methods and the representa-tiveness of 46 samples of African test-takers. Intelligence, 38, 30–37.
Winship, C., & Korenman, S. (1997). Does staying in school make you smarter? The effect of education on IQ in the bell curve. In B. Devlin, S. E. Fienberg, D. P. Resnick, & K. Roeder (Eds.), Intel-ligence, genes, and success: Scientists respond to The bell curve (pp. 215–234). New York, NY: Springer-Verlag.
Wolf, M. (2008). Proust and the squid: The story and science of the reading brain. New York, NY: Harper.
at NORTH CAROLINA STATE UNIV on November 8, 2012pps.sagepub.comDownloaded from