What Keeps Stablecoins Stable?
63
NBER WORKING PAPER SERIES WHAT KEEPS STABLECOINS STABLE? Richard K. Lyons Ganesh Viswanath-Natraj Working Paper 27136 http://www.nber.org/papers/w27136 NATIONAL BUREAU OF ECONOMIC RESEARCH 1050 Massachusetts Avenue Cambridge, MA 02138 May 2020 For detailed comments we thank Nic Carter, Barry Eichengreen, Alex Ferreira, Pierre-Olivier Gourinchas, Bob Hodrick, Roman Kozhan, as well as seminar participants at the University of Warwick Economics and Finance brownbags, and the London Empirical Asset Pricing Workshop. We thank Siravit Rattananon, Arijit Santra, Morgan Kidd, and Ying Chen for valuable research assistance, and the Berkeley Haas Blockchain Initiative for a research grant. The views expressed herein are those of the authors and do not necessarily reflect the views of the National Bureau of Economic Research. No additional disclosures. The funding we received from UC Berkeley's Haas School of Business, the Blockchain Initiative, came with no strings attached and no impact on research design, analysis, writing, or otherwise. NBER working papers are circulated for discussion and comment purposes. They have not been peer-reviewed or been subject to the review by the NBER Board of Directors that accompanies official NBER publications. © 2020 by Richard K. Lyons and Ganesh Viswanath-Natraj. All rights reserved. Short sections of text, not to exceed two paragraphs, may be quoted without explicit permission provided that full credit, including © notice, is given to the source.
Transcript of What Keeps Stablecoins Stable?

NBER WORKING PAPER SERIES
WHAT KEEPS STABLECOINS STABLE?
Richard K. LyonsGanesh Viswanath-Natraj
Working Paper 27136http://www.nber.org/papers/w27136
NATIONAL BUREAU OF ECONOMIC RESEARCH1050 Massachusetts Avenue
Cambridge, MA 02138May 2020
For detailed comments we thank Nic Carter, Barry Eichengreen, Alex Ferreira, Pierre-Olivier Gourinchas, Bob Hodrick, Roman Kozhan, as well as seminar participants at the University of Warwick Economics and Finance brownbags, and the London Empirical Asset Pricing Workshop. We thank Siravit Rattananon, Arijit Santra, Morgan Kidd, and Ying Chen for valuable research assistance, and the Berkeley Haas Blockchain Initiative for a research grant. The views expressed herein are those of the authors and do not necessarily reflect the views of the National Bureau of Economic Research. No additional disclosures. The funding we received from UC Berkeley's Haas School of Business, the Blockchain Initiative, came with no strings attached and no impact on research design, analysis, writing, or otherwise.
NBER working papers are circulated for discussion and comment purposes. They have not been peer-reviewed or been subject to the review by the NBER Board of Directors that accompanies official NBER publications.
© 2020 by Richard K. Lyons and Ganesh Viswanath-Natraj. All rights reserved. Short sections of text, not to exceed two paragraphs, may be quoted without explicit permission provided that full credit, including © notice, is given to the source.

What Keeps Stablecoins Stable?Richard K. Lyons and Ganesh Viswanath-NatrajNBER Working Paper No. 27136May 2020JEL No. E02,E4,E5,F3,F4,G12,G14,G15,G2,O16,O33
ABSTRACT
We take this question to be isomorphic to, "What Keeps Fixed Exchange Rates Fixed?" and address it with analysis familiar in exchange-rate economics. Stablecoins solve the volatility problem by pegging to a national currency, typically the US dollar, and are used as vehicles for exchanging national currencies into non-stable cryptocurrencies, with some stablecoins having a ratio of trading volume to outstanding supply exceeding one daily. Using a rich dataset of signed trades and order books on multiple exchanges, we examine how peg-sustaining arbitrage stabilizes the price of the largest stablecoin, Tether. We find that stablecoin issuance, the closest analogue to central-bank intervention, plays only a limited role in stabilization, pointing instead to stabilizing forces on the demand side. Following Tether's introduction to the Ethereum blockchain in 2019, we find increased investor access to arbitrage trades, and a decline in arbitrage spreads from 70 to 30 basis points. We also pin down which fundamentals drive the two-sided distribution of peg-price deviations: Premiums are due to stablecoins' role as a safe haven, exhibiting, for example, premiums greater than 100 basis points during the COVID-19 crisis of March 2020; discounts derive from liquidity effects and collateral concerns.
Richard K. LyonsHaas School of BusinessUC BerkeleyBerkeley, CA 94720-1900and [email protected]
Ganesh Viswanath-NatrajWarwick Business SchoolThe University of WarwickCoventry CV4 [email protected]

Introduction and Motivation
Benefits of cryptocurrencies include ubiquitous ledgers and transparent updating, wherepayments are verified and recorded without need for centralized settlement. A major drawbackis their volatility, with Bitcoin (BTC) volatility relative to the US dollar (USD) being roughly 10times that between the major national currencies (Yermack, 2015). This led to the introductionof stablecoins, most of which peg to the USD. By maintaining a collateralized peg, this categoryof cryptocurrency is much less volatile, and is used as a store of value and medium of exchangein the digital-asset economy. The role of stablecoins has risen dramatically in the last two years,with estimates of total trading volume between Bitcoin and Tether, the stablecoin in largestsupply, exceeding the trading volume of Bitcoin/USD in 2019.1
At first glance, it is not clear why there is so much demand for stablecoins as a vehiclecurrency given that the dollar itself could serve directly for rebalancing portfolios. There areinstitutional features, however, that induce investors to use stablecoins. The first is addedintermediation costs when trading cryptocurrencies for dollars. On some exchanges, for exam-ple, there are longer processing lags for dollar withdrawals. Fees are also often imposed whendollar withdrawals are frequent or large.2 A second institutional feature favoring stablecoins istheir usability across a greater cross-section of crypto exchanges: Of the exchanges that have"trusted volume" according to a report filed with the SEC, two of them, Binance and Poloniex,do not provide investors with any on-ramp for trading dollars, and only accept stablecoins as amedium of exchange.3
Exchange-rate pegs have a long history both in practice and in exchange-rate economics.A example is the Hong Kong dollar (HKD) peg to the USD managed through a currency-board system since 1983 by the Hong Kong Monetary Authority. The large literature onnational-currency pegs addresses whether they are vulnerable to attack depending on, for ex-ample, macroeconomic fundamentals such as interest rates and inflation, and whether the pegis sufficiently backed by reserves.4 A key lesson in this literature is the importance of the insti-tutional/policy regime for ensuring credibility, in part through management of foreign exchange
1https://econ.st/2NSR5Q6.2For more information, refer to the following announcements by Bitfinex: https://bit.ly/2NEzITW andhttps://www.bitfinex.com/posts/311. Bitfinex states it takes investors 7 to 15 days to make dollar with-drawals from their platform in order to comply with intermediation procedures. Bitfinex has also introduced atransaction cost of 3% for investors who make more than two dollar withdrawals a month, or for withdrawalsof more than $1 million in a given month.
3For a report on trusted exchanges, see https://www.sec.gov/comments/sr-nysearca-2019-01/srnysearca201901-5164833-183434.pdf.
4Note our use of the adjective "national-currency" rather than "fiat." We dislike the term fiat for describingnational currencies when contrasting them with cryptocurrencies. Wikipedia, for example, offers a two-partdefinition of a fiat currency as being i) without intrinsic value and ii) established as money often by governmentdecree. Bitcoin is certainly fiat with respect to the first of these defining dimensions, so calling the USD fiatand BTC not fiat is misleading.
2

reserves.There are currently two types of stablecoin depending on the backing collateral: national-
currency backed and cryptocurrency backed.5 The two types employ different systems formaintaining the peg. Here we focus on the design of national-currency-backed stablecoins, andfocus specifically on Tether (USDT), the most liquid and heavily traded of the stablecoins, witha market cap of $4.1 billion in late 2019, accounting for nearly 80 percent of the total marketcap of the stablecoin market.
A key difference between a national-currency peg and a stablecoin peg is that the distributionof stablecoin price deviations is two-sided (Figure 1).6 While typically national currenciespegged to the dollar trade at a discount due to the risk of mismanagement by the central bank,it is more difficult to rationalize why stablecoins so frequently trade at a premium.
Figure 1: Tether/USD Deviations from Peg and Histogram of Deviations
2017-052017-09
2018-012018-05
2018-092019-01
2019-052019-09
2020-012020-05
Date
0.100.080.060.040.020.000.020.04
USD
Deviations from Peg: USDT_USD
0.06 0.04 0.02 0.00 0.02 0.04 0.06
USD
020406080
100120140
Freq
uenc
yDeviations from Peg: USDT_USD
Note: Figure plots the deviations of the Tether/USD price from parity (left panel). A positive deviation indicatesTether/USD trades at a premium. The right panel indicates a histogram of deviations of the Tether/USD peg.Data from Coinapi. Sample is April 2017 to March 2020.
We develop a model of stablecoin prices that generates a two-sided distribution and examineits other testable implications. In the framework, an investor chooses to invest in a riskycryptoasset using dollars, stablecoins, or both. The investor’s relative demand for each vehiclecurrency is dependent on the relative ease with which they can transact in cryptocurrency.By imposing an increased intermediation cost for using dollars, the model describes how thestablecoin trades at a premium due to its relative benefit as a vehicle. The model also includesarbitrageurs who trade against peg deviations, which in turn stabilizes prices around the peg.For example, if the stablecoin trades at a premium then they have an incentive to buy stablecoinsfrom the primary-market issuer at parity, and sell them in the secondary market for a profit.
5A third type is not backed at all by collateral. We omit this type from our analysis – they are viewed skepticallyby academics and industry analysts alike; see Eichengreen (2019) for more details.
6Plots of peg-price deviations for other major stablecoins are provided in the appendix C.
3

We then test the model predictions empirically. The first question we answer is how national-currency-based stablecoins maintain stability of the peg. In a conventional fixed-exchange-rateregime, a central bank stands ready to use its foreign reserves to exchange for domestic currencyin the event there are persistent deviations from the peg. When the domestic currency’s valuetrades below the peg, the central bank reduces the supply of domestic currency by selling foreignreserves. The stability mechanism is thus supply driven in the case of a central-bank-managedpeg. Empirically, we do not find evidence of this stabilizing mechanism on the supply side; it isthe demand side instead, the trades of apparent arbitrageurs, that stabilizes price around thepeg.
In the case of Tether, each unit is purportedly backed fully by USD reserves.7 In the eventof a mass Tether liquidation, the Tether Treasury would be able in principle to draw down itsreserves and still maintain the peg. Under this system, Tether supply would be dependent oninvestor demands, with supply increasing when investors decide to deposit USD with Tether Inc,and falling when investors reclaim dollar deposits, which withdraws Tether from circulation.To illustrate how arbitrage trading maintains the peg, suppose the Tether/USD price in themarket falls below the peg at 1. Private investors can buy Tether at that price and sell thoseTether to the Tether Treasury at the rate of 1 Tether/USD. Both legs of this arbitrage putendogenous, upward pressure on the Tether price toward the one-to-one parity. (The selling ofTether to the Treasury is a reduction of the supply in circulation.) If alternatively the Tetherprice of USD rises above 1, private investors can sell USD to the Tether Treasury, obtaining inreturn Tether at one-to-one, which they then sell into the market at the prevailing higher rate.Again, both legs put pressure on the market price toward parity, in this case downward. Forstablecoins to remain stable, they depend on these mechanisms to operate when the marketrate deviates from the target peg.
We test these mechanisms in two ways. First, to obtain data on Tether issuance we usedata from the two platforms Omni Explorer and Etherscan, which contain an entire history oftransactions, and classify transactions between senders and recipients of Tether. Transactionsare classified as "simple send" (transactions between two wallets), "grants" (creation of newtokens)," or "revokes" (redemptions of tokens). We use this to construct net flows from theTether Treasury to the secondary market. The second dataset is Coinapi, which providestransaction and order-book data on stablecoin currency pairs with respect to the USD formultiple crypto exchanges. This dataset provides the timestamp of each trade, together withthe price and amount of the underlying Tether in each trade, and a true-or-false variable takerside sell which we use to sign each transaction according to the direction of the trade’s initiator.Using this rich dataset, we construct issuance flow using recorded trades between the Tether
7This is similar to the operation of the Hong Kong Currency Board, in which the central bank maintains dollarreserves to match every Hong Kong dollar in circulation.
4

Treasury and investors.To test our hypothesis of investor-driven flows stabilizing the peg, we exploit a pseudo
natural experiment: The April 2019 introduction of Tether on the Ethereum blockchain. Thisresulted in a large increase in investor access to the Tether Treasury, made possible by thereduced transaction costs of operating on the Ethereum blockchain.8 Following this event, wedo observe a significant increase in the number of unique addresses transacting with the TetherTreasury. Consistent with our hypothesis, we also find a significant decline in the size of pricedeviations of the peg and a decline in the half-life of deviations from 6 days to 3 days. We thenconstruct estimates of arbitrage spreads and imputed profits of investors that deposit dollarswith the Tether Treasury. We find that Tether’s introduction to the Ethereum blockchaincoincides with a decrease in the average size of arbitrage trades from $7 to $4 million, and adecline in arbitrage spreads from 70 to 30 basis points. We also find that arbitrage flows to thesecondary market have a stabilizing impact on the Tether price, with a one standard deviationchange in net flows causing a decline in the deviation of Tether’s price from the peg by up to10 basis points.
We then test hypotheses regarding which fundamentals drive peg deviations. This follows aliterature on national-currency pegs, e.g. Eichengreen et al. (1994), in which deviations of pegsare due to either macroeconomic fundamentals (such as interest rates misalignments, currentaccount deficits, government deficits, or high inflation) or insufficient reserves. Analogously, wecan test which fundamentals impact pricing of stablecoins. The first (proximate) fundamentalwe examine is order flow, which is the net of buyer-initiated trades less seller-initiated trades inthe Tether-Dollar pair in the secondary market.9 We use order-book data across multiple cryptoexchanges, and find evidence that order flow is significant for price discovery in the secondarymarket, with a positive shock to net buyer-initiated flows to the secondary market causing anincrease in the dollar price of Tether: One percent change in price per roughly $40 million innet order flows. We then examine fundamentals such as the intensity of trading of Bitcoin.We find that on average an increase in the volatility of Bitcoin trading has a positive effect onthe Tether price. This is evidence that Tether, and other stablecoins, serve as safe havens inthe domain of cryptoassets. This effect is particularly pronounced in turbulent periods. Forexample, when the price of Bitcoin crashed in January of 2018, the Tether price averaged apremium of 5 cents. Investors rebalanced their portfolios by liquidating their Bitcoin holdingsinto Tether during this period. In another example, Bitcoin crashed by 40% overnight duringthe COVID-19 economic shock. As investors rebalanced their portfolios toward a store of value,
8For more information on the event, we refer readers to https://www.prnewswire.com/news-releases/huobi-global-offers-deposit--withdrawal-in-tether-erc20-300803113.html.
9Identifying the direction of a trade’s initiation is crucial for getting the information economics right: all tradeshave a buyer and a seller – the informational "news" is in the direction of the initiator/aggressor.
5

we find increases in stablecoin premiums during this period as well.Finally, we conclude with a case study of a speculative attack on Tether in October of 2018.
In this episode, speculators were uncertain whether Tether was fully collateralized, due to amove by its partner exchange Bitfinex to suspend convertibility of dollar deposits. The Bitfinexexchange is responsible for investing the majority of USD deposits with the Tether Treasury. Arisk of the Treasury being under-collateralized poses a systemic risk to the Bitfinex exchange.In response to this event, we find a decline in the USD price of Tether, a rise in the volatilityof trading volume in Tether, and a rise in bid-ask spreads.
Turning to related literature, there are many studies of how fundamentals determine fixedexchange rates, such as relative money supplies and interest rates, capital flows, financial fric-tions, and commodity prices (Eichengreen et al., 1994; Engel and West, 2005; Gabaix andMaggiori, 2015; Itskhoki and Mukhin, 2017; Chen and Rogoff, 2003). Eichengreen et al. (1994),for example, show that macroeconomic factors such as insufficient reserves of the central bank,interest-rate differentials, current-account and sovereign deficits, and high inflation can resultin a currency trading at prices discounted from the pegged value. In this setting a peg cancollapse due to macroeconomic fundamentals that are sufficiently weak. With stablecoins, stan-dard macroeconomic fundamentals need not apply in the same way, and certainly do not whenconsidering the fundamentals of the currency-issuing entity (not a country). A second line ofmacroeconomic modeling of fixed rates focuses on the collapse of fixed exchange rates due toinadequate central bank reserves (Krugman, 1979; Flood and Hodrick, 1986; Obstfeld, 1984).This has led to so-called "2nd generation" models, where currency crises arise from specula-tive attacks that are potentially self-fulfilling (Eichengreen et al., 1995; Morris and Shin, 1998;Chamley, 2003; Cukierman et al., 2004). In these models, there is generally an equilibrium un-der which the peg is sustainable, and another under which the peg can be broken if speculationis sufficiently intense.
Our paper also relates to the role of central-bank intervention in maintaining pegs (Fratzscheret al., 2019a,b; Sarno and Taylor, 2001; Ferreira et al., 2019; Flood and Jeanne, 2005; Vitale,1999) and a theoretical literature on target zones (Krugman, 1991; Svensson, 1992). Empiricalevidence in Fratzscher et al. (2019b) shows that central banks typically "lean against the wind"by actively counteracting the private forex buy/sell trades of market participants, which has astabilising effect on the exchange rate. A theoretical prediction of the target-zone models is theso-called "honeymoon" effect: That the currency price under a credible peg tends to clustertoward the middle of the target zone due to the expectation of a central bank intervention thatleans against the wind near the edges. With national-currency-based stablecoins, there is gen-erally no equivalent of a central bank actively participating in the market to stabilize the peg.Instead, most stablecoin systems generate price stabilization through demand-driven flows toarbitrage differences between the official peg and the rate in the secondary market, akin to the
6

mechanism that keeps exchange-traded funds trading at prices close to their net asset values.10
The literature on cryptocurrencies is relatively new, with many papers focusing on howBitcoin and other prices are determined (Abadi and Brunnermeier, 2018; Biais et al., 2019;Catalini and Gans, 2016; Chiu and Koeppl, 2017; Easley et al., 2019; Schilling and Uhlig, 2019;Raskin and Yermack, 2018; Zimmerman, 2020; Sockin and Xiong, 2020), initial coin offerings(ICOs) (Catalini and Gans, 2018; Howell et al., 2018; Goldstein et al., 2019; Florysiak andSchandlbauer, 2019), and central-bank digital currencies (Bordo and Levin, 2017; Benigno etal., 2019; Bindseil, 2020; Brunnermeier et al., 2019; Fernández-Villaverde et al., 2020; Kumhofand Noone, 2018; Raskin and Yermack, 2018; Skeie, n.d.). Topics include: Bitcoin having adual role as a medium of exchange and speculative investment, the pricing of fees for mining,and the interaction of digital-currency deposits with monetary policy and central banking. Inour paper, we abstract from the process of Bitcoin price determination and base our modelon Bitcoin (or other non-stable cryptocurrency) as a predominantly speculative investment,focusing instead on the investor’s decision whether to use dollars or stablecoins as the vehicleto finance their speculative investment.
The cryptocurrency research most closely related to our paper focuses on market efficiency.Much attention has been paid to the potential for market manipulation, with evidence ofpump and dump schemes (Gandal et al., 2018; Li et al., 2018; Dhawan and Putnins, 2020),opportunities for speculation and arbitrage on crypto exchanges (Makarov and Schoar, 2019,2020; Hale et al., 2018) and determining a set of factors to explain cryptocurrency returns(Liu and Tsyvinski, 2018; Bhambhwani et al., 2019). There is a recent and growing literatureinvestigating properties of stablecoins (Berentsen and Schär, 2019; Bullmann et al., 2019; BIS,2019; Eichengreen, 2019). For example Eichengreen (2019) comments on stablecoins beingbacked by either national currencies or cryptocurrencies, and highlights that systems can bevulnerable to speculative attack if there is perception that the peg is under-collateralized. Griffinand Shams (2020) document the role of Tether as a vehicle currency, and how it has been usedpotentially to manipulate Bitcoin prices during 2017 and 2018.11 There is also recent workthat looks at intraday price changes to support the role of stablecoins as safe havens (Baur andHoang, 2020, in press). We extend existing work on stablecoins in several ways. Most broadly,
10There are other differences between the decentralized structure of stablecoins and forex interventions by acentral bank. For example, a central bank is typically concerned with macroeconomic fundamentals likepreserving low interest rates and inflation, and is targeting an exchange rate that is based on a set of macroe-conomic fundamentals. A stablecoin issuer has no equivalent policy function. Secondly, investors can oftendeposit dollars directly with the stablecoin issuer. In contrast, investors cannot typically initiate trades, ordirectly deposit currency, with the central bank.
11As of October 2019, there is a class-action suit against Tether that claims: (i) Tether is not backed one-for-one by dollar reserves and (ii) Bitfinex increased Tether issuance during 2017 to manipulate Bitcoin markets.Plaintiff-estimated damages amount to roughly 1.4 trillion USD. For more details, see The Economist : https://econ.st/2WPQjXX.
7

we push beyond past work focusing on prices only and address quantities, in particular signedorder flow. This allows many new avenues of analysis, e.g., quantifying the effects on prices ofbearing the risk that safe havens help avoid (by estimating the negative loadings of stablecoinprices on a crypto risk factor). We also present an optimizing model that clarifies why dollarprices of Tether should at times trade above the parity of 1.0, as noted above.
The remainder of the paper is structured as follows. In section 1 we summarize the proper-ties and performance of the major stablecoins. In section 2 we introduce the model of stablecoinprices, and use it to illustrate potential mechanisms that produce a distribution of peg devia-tions that is two-sided. In section 3, we illustrate mechanisms through which arbitrage flowsfrom investors can stabilize deviations of market prices from parity. In section 4 we test hy-potheses about which fundamentals drive parity deviations, and provide a discussion of factorscontributing to why Tether trades at a premium, such as its role as a safe-haven asset in periodsof increased risk, and why Tether trades at a discount, such as the amount of collateral andtrading volatility. Section 5 concludes.
1 Stablecoins: Properties and PerformanceThe collateral systems adopted by the six largest stablecoins by market capitalization are
presented in Table 1.12 Stablecoins are typically backed by either dollar collateral or cryptocollateral. Of the top six coins by market cap, five are backed by dollar deposits, the exceptionbeing DAI, which is backed by Ethereum.13 The methods of how dollar collateral itself isbacked includes a central issuer in the case of Tether, which acts analogously to the Hong KongCurrency Board. The second-largest stablecoin, USDC, has a more decentralized system ofgovernance, with multiple issuers that have a license to provide USDC tokens. The other threestablecoins managed by dollar collateral, Binance USD Coin, Paxos, and TrueUSD, focus onconcerns over the risk of issuer default: In the case of Binance USD coin and Paxos, dollarcollateral is backed by FDIC-insured banks, whereas TrueUSD dollar collateral is backed byescrow accounts.14
The sixth largest coin, DAI, is different from the other coins in that it is a crypto-collateral-
12The top six coins by market share in April 2020 capture over 95% of the stablecoin market.13Since November 16, 2019, investors holding single-collateral DAI have transferred their holdings to multi-collateral DAI. For the purposes of our analysis, we address single-collateral DAI as it has a longer time series.Multi-collateral DAI is also based on Ethereum collateral at present, with a view to extend to different typesof collateral in the future. In the market, the ticker DAI now refers to the multi-collateral version; the originalsingle-collateral version now has the ticker DAI.
14Escrow accounts offer a novel security design. For example, suppose an investor wants to deposit one USD forone TrueUSD token. They first deposit their dollar in a protected escrow account. TrueUSD then providesthe escrow account 1 token. Only upon receipt of the token, and once the token is sent to the investor, theescrow account transfers the dollar deposit to TrueUSD. This system minimises settlement risk on both sidesof the transaction.
8

based coin. Under this system, investors deposit Ethereum into a collateralized position thatallows them to borrow DAI. The number of DAI they can borrow is limited by a smart (i.e.,auto-executing) contract. The contract liquidates underlying Ethereum collateral if the valueof that collateral is less than 150% of the corresponding DAI-borrowing value. Agents thereforehave an incentive to scale back borrowing by redeeming DAI when Ethereum prices fall in orderto prevent their collateral from breaching the 150% level.
A technical difference among the stablecoins is their choice of stabilizing mechanism. Forstablecoins backed by dollar collateral, this works through investor arbitrage flows. When theUSD price of the stablecoin rises above parity, investors have an incentive to deposit dollarsto create new stablecoin tokens, and sell them in the secondary market. For a coin backed byEthereum, an investor has to take into account expectations of the future value of Ethereum,so there is no risk-free arbitrage opportunity in this case.15 DAI also has by design a monetary-policy tool at its disposal: Through a voting procedure on DAI’s platform MAKER DAO,holders of the currency have a right to vote on a "stability fee". This is a fee for borrowingDAI, analogous to a central bank setting the interest rate on borrowed money. All else equal,in a period when DAI is trading at a discount, a rise in the stability fee induces an increase inDAI redemptions, shrinking supply in order to restore parity.
An equally important institutional detail is how these coins’ collateral is audited. Tetherpublishes its balance sheet daily,16 which provides a breakdown of the value of its assets (dollardeposits) and liabilities (Tether in circulation on blockchain platforms). While Tether liabilitiesare accounted for based on the record of transactions on the blockchain, there is a need to auditissuers to verify that the holdings of dollar deposits are secure. For full solvency, the dollarvalue of assets held in the issuer’s accounts must at least equal the dollar value of its liabilities.Audit reports for these top coins assert that they are sufficiently collateralized. We review auditaccountability and transparency measures in Appendix B.
15For example, suppose DAI trades at a premium in the secondary market. The value of Ethereum collateralis subject to uncertainty, so if an investor believes the value of Ethereum is expected to fall, they may choosenot to add Ethereum collateral in order to borrow DAI to sell in the secondary market.
16See https://wallet.tether.to/transparencyformoredetails.
9

Table 1: Top 6 Stablecoins – System of Collateral
Coin Symbol Blockchain System of Collateral
Tether USDT Omni and Ethereum 100% USD Deposits held in centralized Tether TreasuryUSD Coin USDC Ethereum 100% USD Deposits in decentralized (private) accounts.
Paxos Standard PAX Ethereum 100% USD Deposits held by FDIC-insured banksBinance USD Coin BUSD Ethereum 100% USD Deposits held by FDIC-insured banks
True USD TUSD Ethereum 100% USD Deposits held in escrow accountsMulti Collateral DAI DAI Ethereum Ethereum held in CDO with value of >150% DAI borrowed
The table lists properties of the top-six stablecoins by market capitalization as of April 2020. Blockchain refersto the platform on which the history of transactions is recorded. System refers to method of collateral; fordollar-collateral-based systems this means there is, as a stated principle, 100% backing of dollar deposits.
Table 2 presents summary statistics on the deviations from peg prices as of March 2020.(For details on the source of price data, see the data appendix A.) The first observation is thehigh ratio of total reported trading volume to the market capitalization, also referred to as thedaily velocity of stablecoins in circulation.17 This daily ratio is typically over five for Tether, thelargest coin, and is similarly above one for other national-currency-backed coins Paxos (PAX)and TrueUSD (TUSD). For perspective, the daily turnover in spot foreign exchange marketsinvolving the USD as one leg of the transaction is $1.7 trillion over the period 2016-2019,compared to a total supply in circulation of approximately $15 trillion. This implies a dailyUSD velocity of one tenth, an order of magnitude smaller than stablecoin velocities. A takeawayis that stablecoins derive significant use in cryptocurrency markets as vehicle currencies.
17The reported 24H Volume in Coinmarketcap and other vendors includes all transactions verified on theblockchain. The volume of trading on exchanges trusted by the SEC is less likely to be inflated for thepurpose of feigning activity and liquidity.
10
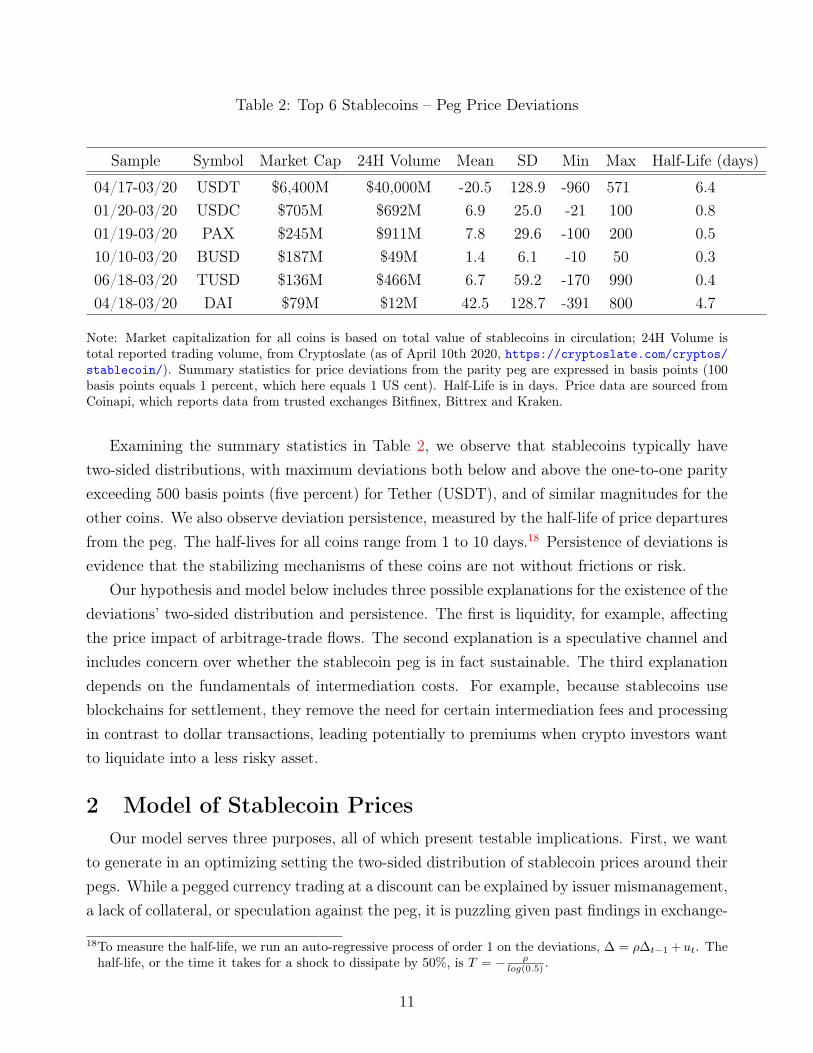
Table 2: Top 6 Stablecoins – Peg Price Deviations
Sample Symbol Market Cap 24H Volume Mean SD Min Max Half-Life (days)
04/17-03/20 USDT $6,400M $40,000M -20.5 128.9 -960 571 6.401/20-03/20 USDC $705M $692M 6.9 25.0 -21 100 0.801/19-03/20 PAX $245M $911M 7.8 29.6 -100 200 0.510/10-03/20 BUSD $187M $49M 1.4 6.1 -10 50 0.306/18-03/20 TUSD $136M $466M 6.7 59.2 -170 990 0.404/18-03/20 DAI $79M $12M 42.5 128.7 -391 800 4.7
Note: Market capitalization for all coins is based on total value of stablecoins in circulation; 24H Volume istotal reported trading volume, from Cryptoslate (as of April 10th 2020, https://cryptoslate.com/cryptos/stablecoin/). Summary statistics for price deviations from the parity peg are expressed in basis points (100basis points equals 1 percent, which here equals 1 US cent). Half-Life is in days. Price data are sourced fromCoinapi, which reports data from trusted exchanges Bitfinex, Bittrex and Kraken.
Examining the summary statistics in Table 2, we observe that stablecoins typically havetwo-sided distributions, with maximum deviations both below and above the one-to-one parityexceeding 500 basis points (five percent) for Tether (USDT), and of similar magnitudes for theother coins. We also observe deviation persistence, measured by the half-life of price departuresfrom the peg. The half-lives for all coins range from 1 to 10 days.18 Persistence of deviations isevidence that the stabilizing mechanisms of these coins are not without frictions or risk.
Our hypothesis and model below includes three possible explanations for the existence of thedeviations’ two-sided distribution and persistence. The first is liquidity, for example, affectingthe price impact of arbitrage-trade flows. The second explanation is a speculative channel andincludes concern over whether the stablecoin peg is in fact sustainable. The third explanationdepends on the fundamentals of intermediation costs. For example, because stablecoins useblockchains for settlement, they remove the need for certain intermediation fees and processingin contrast to dollar transactions, leading potentially to premiums when crypto investors wantto liquidate into a less risky asset.
2 Model of Stablecoin PricesOur model serves three purposes, all of which present testable implications. First, we want
to generate in an optimizing setting the two-sided distribution of stablecoin prices around theirpegs. While a pegged currency trading at a discount can be explained by issuer mismanagement,a lack of collateral, or speculation against the peg, it is puzzling given past findings in exchange-
18To measure the half-life, we run an auto-regressive process of order 1 on the deviations, ∆ = ρ∆t−1 +ut. Thehalf-life, or the time it takes for a shock to dissipate by 50%, is T = − ρ
log(0.5) .
11

rate economics why stablecoins sometimes trade at a substantial premium.Second, we want to understand more fully how stablecoins serve as a vehicle currency. We
find in the model’s equilibrium that pressure for stablecoins to trade at a premium operatethrough three channels. The first is an intermediation premium that arises from added costs ofusing dollars as a vehicle to buy the model’s risky asset (think of the model’s risky asset as acryptoasset traded on a crypto exchange, some of which accept only stablecoins for purchases).The second channel is a safety premium: stablecoins can trade at a premium due to its roleas as safe haven. The third channel is a "latency" premium tied to the relative variance ofrisky-asset returns in dollars versus stablecoins (think of using the dollar as a vehicle as takingmore time).
Third, we want to understand the mechanism by which stablecoin prices move back towardtheir pegs. Here, we model a representative investor/arbitrageur reallocating dollar wealthtoward stablecoins when the stablecoin trades at a premium, and toward the dollar when thestablecoin trades at a discount. In the former case, they deposit dollars with the stablecoinissuer, draw stablecoins at par (avoiding the premium), and use these coins to purchase themodel’s risky asset; this increase in the relative supply of stablecoins leads to a decline in thesecondary-market price of stablecoins toward the peg.
The model has two periods. A representative investor decides in period 1 the optimal choicefor investing in a combination of the risk-free asset and the risky asset (e.g., Bitcoin or othernon-stable cryptoasset). They have two alternatives for the risk-free asset, the dollar or astablecoin. Which risk-free asset is chosen determines which is used for investing in the riskyasset.
Investors face a cost to rebalancing their portfolio when holding the dollar. The intuitionis that liquidating risky cryptoassets incurs greater intermediation costs when converting intodollars (e.g., conversion into stablecoins is faster and incurs lower transaction costs). Thisassumption will affect the point at which an investor is indifferent between choosing the dollarversus the stablecoin as the risk-free asset. We illustrate both methods in Figure 2.
1. If dollar is chosen: Invest a fraction θm,1 of wealth in a combination of the dollar asthe risk-free asset and the risky portfolio C.
2. If stablecoin is chosen: Convert the fraction 1− θm,1 of wealth into stablecoin S at theprevailing exchange rate pm/s and uses those stablecoins to invest in the risky asset C.
12

Figure 2: Investor decision to use dollars or the stablecoin as vehicle currency
DollarInvestor
stable coinmarketpm/s
StableCoin
Investor
Cryptomarket
θs
θm
Note: This figure illustrates the choice of a representative investor to adopt dollars versus stablecoins as a vehiclecurrency, with shares θm,1 and θs,1 respectively.
Dollar Chosen Case
Wealth is allocated to the risky cryptoasset and the risk-free asset, in this case the dollar.The cryptoasset has a final return in dollars of Rm ∼ N(E[Rm], σ2
m). The risk-free dollar assethas a non-negative return Rf . The investor has CARA utility over wealth, which yields mean-variance preferences. We can represent the dollar-investor problem by maximising equation (1)subject to the period 1 and period 2 budget constraints. Expressing the investor’s wealth W indollars, they purchase the cryptoasset C up to a share of their wealth θm,1 at the dollar pricepm/s.
maxCm,1
L = E[θm,1W2]−1
2γV ar(θm,1W2) (1)
subject to:
θm,1W1 = pm/s,1Cm,1 +M1 (2)
θm,1W2 = RmCm,1 +RfM1 − φ(Cm,1) (3)
In period 1 the dollar investor chooses between the risk-free dollar assetM and the risky assetC. In period 2, returns are realized, and the investor incurs a dollar portfolio rebalancing costφ(.) that is an increasing function of C, with φ′(.) > 0 a constant marginal cost of transactingin the dollar/cryptocurrency market.19
Solving for optimal investment in the risky cryptoasset in period 1 yields equation (4). This19The intermediation cost is technically a function of the change in holdings of the cryptoasset. Given period1 constitutes the first period in which cryptoassets are held, the intermediation cost is φ(Cm,1).
13
level of cryptoassets depends positively on the expected return, and negatively on the risk ofthe portfolio. In particular, the intermediation cost φ′(Cm) has a negative effect on the optimalholdings of the cryptoasset.
Cm,1 =E[Rm]− φ′(Cm,1)
γσ2(4)
Stablecoin Chosen Case
The representative investor converts the remaining fraction of their period-1 wealth intothe stablecoin at the exchange rate pm/s,1 units of dollars per stablecoin. With CARA utility,we can represent the stablecoin investor problem by maximising equation (5) subject to theperiod 1 and period 2 budget constraint. The cryptoasset now has a final return in stablecoinsof Rs ∼ N(E[Rs], σ
2s). Note that we express the allocations of wealth, cryptoasset and the
risk-free asset in stablecoins. In contrast to using dollars, there is a zero risk-free rate onholding stablecoins, and so if the investor decides to use stablecoins as the vehicle currency, allstablecoins will be used to purchase the cryptoasset in period 1.
maxCs,1
L = E[θs,1W2
pm/s,1]− 1
2γV ar(
θs,1W2
pm/s,1) (5)
subject to:
θs,1W1
pm/s,1= Cs,1 (6)
θs,1W2
pm/s,1= RsCs,1 (7)
Solving for the optimal cryptoassets in period 1 yields equation 8. As before, the optimallevel of cryptoassets depends positively on the expected return, and negatively on the risk ofthe portfolio.
Cs,1 =E[Rs]
γσ2s
(8)
Equilibrium allocation of dollar and stablecoin portfolio shares
To choose an optimal weight θm,1 of wealth to invest as the dollar investment and θs,1 =
1− θm,1 as a stablecoin investment, the representative investor equates the value of investmentin dollars with the value of investment in stablecoins. We normalise the investments by theshares θm,1 and θs,1 to effectively equate the investment value per unit wealth invested. Thefraction E1[pm/s,2]
pm/s,1measures the valuation effect of stablecoins over the investment horizon of the
investor.
14

Cm,1θm,1
=Cs,1θs,1
E1[pm/s,2]
pm/s,1(9)
In the optimal allocation, the investor is indifferent between both methods. This yields thecondition in equation (10), which is analogous to an uncovered interest-rate parity condition inforeign exchange markets. The expected return per unit invested using dollars and stablecoinsare equalised after taking into account exchange rate changes. On the left hand side, we definethe return per dollar of wealth invested in the dollar portfolio. An investment of 1
θm,1dollars
makes an expected return equal to E[Rm] − φ′(Cm). On the right hand side, we convert onedollar into stablecoins at the rate pm/s,1. The expected return on stablecoin investment is equalto E[Rs], and this is reconverted back to dollars at the future expected price of stablecoinsE1[pm/s,2].
E[Rm]− φ′(Cm,1)θm,1σ2
m
=E1[pm/s,2]
pm/s,1
E[Rs]
θs,1σ2s
(10)
We can then solve for the dollar price of the stablecoin, pm/s, which yields equation (11):
pm/s,1 = E1[pm/s,2]1− θs,1θs,1
E[Rs]
E[Rm]− φ′(Cm,1)σ2m
σ2s
(11)
The relative price of stablecoins is a function of three ratios. The first ratio, 1−θs,1θs,1
, capturesthe relative market share of the stablecoin. All else equal, a higher share of representative-investor wealth invested in stablecoins leads to a lower stablecoin price. This is intuitive, as arise in θs,1 is equivalent to an increase in the supply of stablecoins in circulation (and converselya relative decline in the supply of dollars). Equilibrium in the stablecoin/USD market requiresthe stablecoin price to fall to clear the market. The second ratio, E[R]
E[R]−φ′(c) , measures therole of intermediation costs φ′(Cm). This measures the relative advantage of stablecoins inthat it incurs lower intermediation costs than using the dollar to buy the risky asset. Addedintermediation costs in dollars leads to a reduction in the return an investor can get whenusing dollars as the vehicle currency. By the UIP condition, this causes an appreciation of thestablecoin’s exchange rate. The third ratio reflects differences in the volatility of the risky assetin dollars versus stablecoins. We discuss immediately below a potential channel through whichpractical differences in the time needed to transact in stablecoins versus dollars can change theuncertainty investors face.
Safety and latency premium
We elaborate on the UIP condition in two ways. The first is the role of risk premia in drivinga wedge between the risky-asset return as a stablecoin versus a dollar investor. More formally,define the relationship between the risky-asset return in dollars, Rm, and in stablecoins Rs:
15

Rm = Rs
pm/s,2pm/s,1
(12)
Taking expectations,
E[Rm] = E[Rs]E
[pm/s,2pm/s,1
]+ cov
(Rs,
pm/s,2pm/s,1
)(13)
The latter term cov(Rs,pm/s,2
pm/s,1) can be interpreted as a safety premium of the stablecoin:
If stablecoins appreciate in periods of low risky-asset returns, then cov(Rs,pm/s,2
pm/s,1) < 0. This
increases the relative return on using stablecoins as a vehicle currency.A different premium relating to the safety premium arises as a practical matter – i.e., not
directly in the model – due to a differential in time needed to transact when using the dollar asa vehicle versus the stablecoin. The variance of cryptocurrency returns depends on the latencytime of the transaction. For dollars, this latency time can be quite high if the transactioninvolves intermediation costs.20 Formally, let us define the standard deviation of risky-assetreturns σ(T ), where T is the latency time, and σ(T ) is an increasing function in T , σ′(.) > 0.
Therefore, assuming the latency time for dollar transactions exceeds that for stablecointransactions, Tm > Ts, the ratio of volatility of cryptocurrency returns in dollars relative tostablecoins is greater than one. This causes a stablecoin premium due to latency time oftransactions, which we dub the "latency premium," and can work in tandem with the safetypremium if investors decide to liquidate cryptocurrency into a store of value in bad times. Givenit takes more time in actual crypto markets to convert a non-stable cryptocurrency into dollars,investors prefer to use stablecoins as a way to rebalance their portfolios, causing a relativeincrease in the price of stablecoins. We document the latency premium and safety premium inequation 14.
pm/s,1 = E1[pm/s,2]1− θs,1θs,1
E[Rs]
E[Rs] + cov(Rs,
pm/s,2
pm/s,1
)− φ′(Cm)
σ2(Tm)
σ2(Ts)(14)
While we have established a relationship between pm/s,1 and θs,1, we need another relationto close the model. We now turn to arbitrage flows as a stabilising mechanism.
Arbitrage flows
The primary-market issuer is willing to supply stablecoins at a 1:1 exchange rate. Thismeans departures of the stablecoin price from the peg result in incentives for arbitrage, andwill cause endogenous investor flows. For example, if what we will call the "secondary-market
20For example, cryptocurrency exchange Bitfinex states that there can be a delay of up to two weeks for a bankwire of dollar deposits to be useable to buy cryptocurrency.
16

price" pm/s,1 > 1, investors will buy stablecoins from the primary-market issuer with dollarsat par. Conversely, investors will sell stablecoins to the primary-market issuer for dollars atpar when the secondary-market price pm/s,1 < 1. Therefore the representative investor usingstablecoins as the vehicle currency will, through arbitrage flows, cause θs,1 to be a positivefunction of deviations from the peg. We illustrate this in equation 15. The change in therepresentative investor’s share of wealth using the stablecoin as the vehicle, ∆θs = θs,2 − θs,1 ispositively related to deviations from the peg, pm/s,1 − 1. The constant of proportionality is ωand measures the half-life of the peg. The speed of convergence parameter ω depends on theability of private investors to transact with the stablecoin issuer directly via depositing dollars,obtaining an equivalent number of stablecoin tokens, and then selling them in the secondarymarket at pm/s,1. In a highly efficient market, investors can arbitrage deviations quickly, andthis is represented by a high ω. Conversely, frictions in arbitrage, for example by limiting theagents’ ability to transact with the primary issuer of the stablecoin, will result in a low ω.
∆θs = ω(pm/s,1 − 1) (15)
Figure 3: Dollar holdings reallocate toward stablecoins when in the secondary market pm/s > 1
DollarInvestor
stable coinmarketpm/s > 1
Treasurypm/s = 1
StableCoin
Investor
Cryptomarket
θs
θm-∆θmθs+∆θs
∆θs
Note: This figure illustrates the endogeneity of investor arbitrage flows. In response to a secondary-market priceof stablecoins trading above the peg, an investor reallocates their portfolio away from dollars (share ∆θm,1) andtoward stablecoins (share ∆θs,1).
17

We illustrate arbitrage flows in Figure 3. The dollar investor reallocates a share ∆θm ofdollars and deposits them in the stablecoin Treasury. In return, they obtain stablecoin tokenswhich they then use to purchase the risky asset. Therefore the share allocated to the stablecoinincreases by ∆θs. The increase in the stablecoin share of wealth will cause the gap betweenthe primary- and secondary-market rate to narrow, until the secondary market trades at parity(the new steady state equilibrium).
Equilibrium: Phase Diagram
The equilibrium is characterised by the following two equations 16 and 17. In characterisingour equilibrium, we extend the two-period model to a multi-period model in continuous time toillustrate the dynamics of arbitrage flows in stabilizing the peg. The first equation representsthe price that leads to a representative investor making an optimal allocation between dollarsand stablecoins as a vehicle currency. The second equation represents the investor’s incentiveto arbitrage deviations from the peg, by increasing the relative share of stablecoin use when thesecondary market trades at a premium to the peg. The equilibrium can be represented througha phase diagram, plotted in Figure 4.
pm/s,t = Et[pm/s,t+1]1− θs,tθs,t
E[Rs]
E[Rm]− φ′(Cm)(16)
θ̇s,t = ω(pm/s,t − 1) (17)
Figure 4: Phase Diagram of Equilibrium
Note: This phase diagram illustrates equilibrium, which in steady state will always be where pm/s = 1, elimi-nating the incentive for arbitrage flows.
The model yields two key predictions.
18

Prediction 1: Stablecoin premiums
An increase in intermediation costs φ′(C), and an increase in the latency time Tm fordollar transactions, increases the price pm/s,t > 1, all else equal. Logic: The representativeinvestor reallocates their portfolio toward stablecoins (θm,t ↓ and θs,t ↑) by depositing dollarswith the stablecoin issuer, obtaining stablecoins at a 1:1 rate, and uses stablecoins to buy therisky cryptoasset. This causes the price pm/s to gradually return to its equilibrium pegged valueof one as t→∞.
Prediction 2: Stablecoin discounts
A decrease in the expected future spot price, Et[pm/s,t+1], decreases the current spot pricepm/s,t < 1, all else equal. Logic: One economic rationale for an investor expecting the pegto trade at a discount is insufficient collateral. The representative investor reallocates theirportfolio toward dollars (θm,t ↑ and θs,t ↓) by withdrawing their dollar deposits with the stablecoinissuer, and using those dollars to buy the risky cryptoasset. This causes the price pm/s togradually return to its equilibrium pegged value of one as t→∞.
We document both channels in Figure 5. The first is the effect of a positive shock tointermediation cost φ′(C). All else equal, the relative return of a unit of cryptoasset purchasedvia a stablecoin is higher. This causes a contemporaneous increase in the price of the stablecoinpm/s. This is represented as a shift upward of pm/s until it reaches the new saddle path, indicatedin Figure 5, left.
Figure 5: Left panel: Shock to intermediation cost φ′(C); Right panel: Speculative attack
Note: The left panel shows the transition dynamics for a shock to intermediation costs of using dollars as avehicle. This results in a temporary stablecoin price pm/s > 1, and causes arbitrage flows to the secondarymarket, θs,t ↑, to restore parity. The right panel shows the impact of an unsuccessful speculative attack (i.e.,one that does not break the peg), which results in a decline in E[pm/s], and redemptions of stablecoins, θs,t ↓,to restore parity.
19

Consequently, the representative investor decides to sell a fraction of their wealth in $and buy stablecoins from the primary-market issuer. This is mathematically represented byθ̇s,t = ω(pm/s,t − 1) > 0. Movement along the saddle path will occur until the price of stable-coins reaches a new long-run equilibrium at pm/s = 1, and a higher vehicle-currency share forstablecoins, θs ↑.
The second key prediction is the effect of a speculative attack. In our model this mostclosely corresponds to 2nd-generation currency-crisis models (e.g., Morris and Shin (1998)),which show how fixed exchange rates can be vulnerable to self-fulfilling attack from speculatorswho believe the currency is overvalued. Under this theory, we would expect deviations from thepeg to be one-sided. For example, suppose speculators believe there is some positive probabilityP > 0 that the stablecoin will collapse. This necessarily implies that the expected value of thestablecoin price trades at a discount to the peg, Et[pm/s,t+1] = P ×0+(1−P )×1 < 1. The lowsecondary market price of the stablecoin will cause the representative investor to redeem theirstablecoins and withdraw dollar deposits from the primary-market issuer, causing a decline inthe stablecoin share of wealth, θ̇s,t = ω(pm/s,t − 1) < 0. Movement along the saddle path willoccur until the price of stablecoins reaches a new long-run equilibrium at pm/s = 1, and a lowervehicle-currency share for stablecoins, θs ↓.We illustrate the dynamics in Figure 5, right.
3 Empirical Evidence: Stabilising MechanismsWe examine now how deviations from stablecoin pegs are arbitraged, which is fundamental
to how they dissipate. As an analogy, consider first the setting of a national currency anda fixed exchange-rate peg managed by a central bank. The central bank is committed tomaintaining the peg by buying the domestic currency and selling foreign-currency reserveswhen the domestic-currency value falls below the peg level, and conversely selling domesticcurrency when the domestic-currency value rises above the peg level.21
While forex intervention can work in theory, central banks typically face societal pressureswhen the domestic currency is overvalued relative to economic fundamentals. These fundamen-tals include high inflation, current account and sovereign deficits, and high interest rates. Manycurrency crises, most famously the peso crises of Argentina, among others, have occurred whena central bank has insufficient foreign reserves to defend the peg, or insufficient resolve to keepshort-term interest rates high, making the peg vulnerable to a speculative attack.
21The literature emphasizes whether this central-bank intervention is sterilized versus unsterilized. When un-sterilized, the simpler case, the central bank action either removes or adds to the domestic money supplywhen exchanging for foreign currency. Sterilizing the effect of the intervention on the domestic money supplyis achieved by conducting a parallel, offsetting open market operation – buying or selling domestic-currencybonds from the public and thereby injecting/absorbing an offsetting amount of domestic money. Unsterilizedintervention is the more potent due to its direct effects on money supply and, especially, short-term interestrates. See Sarno and Taylor (2001) for details on the forex intervention literature.
20
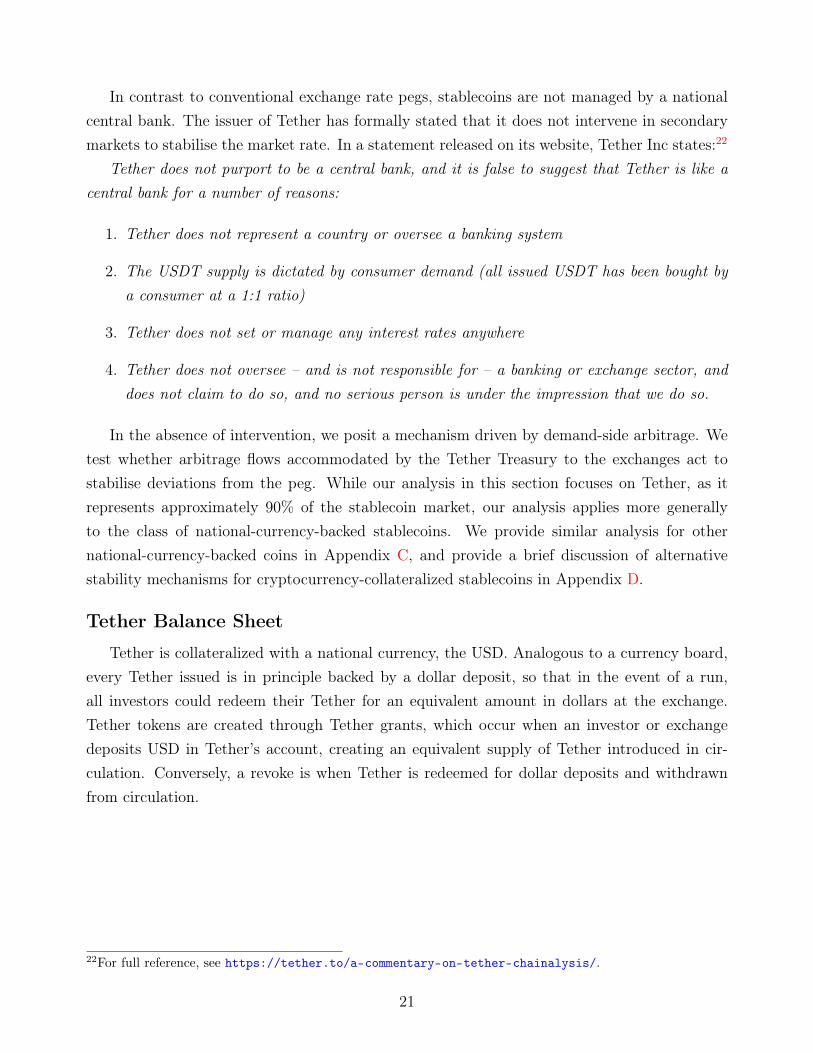
In contrast to conventional exchange rate pegs, stablecoins are not managed by a nationalcentral bank. The issuer of Tether has formally stated that it does not intervene in secondarymarkets to stabilise the market rate. In a statement released on its website, Tether Inc states:22
Tether does not purport to be a central bank, and it is false to suggest that Tether is like acentral bank for a number of reasons:
1. Tether does not represent a country or oversee a banking system
2. The USDT supply is dictated by consumer demand (all issued USDT has been bought bya consumer at a 1:1 ratio)
3. Tether does not set or manage any interest rates anywhere
4. Tether does not oversee – and is not responsible for – a banking or exchange sector, anddoes not claim to do so, and no serious person is under the impression that we do so.
In the absence of intervention, we posit a mechanism driven by demand-side arbitrage. Wetest whether arbitrage flows accommodated by the Tether Treasury to the exchanges act tostabilise deviations from the peg. While our analysis in this section focuses on Tether, as itrepresents approximately 90% of the stablecoin market, our analysis applies more generallyto the class of national-currency-backed stablecoins. We provide similar analysis for othernational-currency-backed coins in Appendix C, and provide a brief discussion of alternativestability mechanisms for cryptocurrency-collateralized stablecoins in Appendix D.
Tether Balance Sheet
Tether is collateralized with a national currency, the USD. Analogous to a currency board,every Tether issued is in principle backed by a dollar deposit, so that in the event of a run,all investors could redeem their Tether for an equivalent amount in dollars at the exchange.Tether tokens are created through Tether grants, which occur when an investor or exchangedeposits USD in Tether’s account, creating an equivalent supply of Tether introduced in cir-culation. Conversely, a revoke is when Tether is redeemed for dollar deposits and withdrawnfrom circulation.
22For full reference, see https://tether.to/a-commentary-on-tether-chainalysis/.
21

Figure 6: Left – Distribution of Tether to Secondary Market via Bitfinex; Right – Distributionof Tether directly to Crypto Exchanges
TetherTreasury
Bitfinex
Exchange
Exchange
$ Deposit
USDT
USDT
USDT
TetherTreasury
Exchange
Exchange
$ Deposit
USDT
$ Deposit
USDT
Note: Left figure illustrates the creation of Tether "grants" prior to April 2019. Bitfinex, a crypto exchange,deposits dollars into the Tether Treasury. The Tether Treasury then issues a number of Tether tokens at parity(1:1 exchange rate). The newly created Tether tokens are then distributed to other investors and exchanges inthe secondary market. Right figure illustrates the creation of Tether starting in April 2019 – when investors andother exchanges began getting direct access to the Tether Treasury on the Ethereum blockchain. Exchangesdirectly deposit dollars with the Tether Treasury to create newly minted Tether tokens.
Figure 6 describes the creation and subsequent distribution of Tether from the Treasuryto the secondary market. Prior to April 2019, Bitfinex, an active cryptocurrency exchange,first deposits dollars with the Tether Treasury. The Treasury transfers newly created Tethertokens to Bitfinex, which then distributes them to a set of other exchanges and investors fortrading in the secondary market. While we use Bitfinex as an example of an investor, we stressthat Tether, in its white paper, states that currently any investor is allowed to deposit dollarsdirectly in order to obtain Tether tokens at the 1:1 pegged rate (Tetherinc. (2016)). Thiscorresponds to distribution of Tether where crypto exchanges directly deposit dollars with theTether Treasury in order to create newly minted Tether tokens (Figure 6, right). To constructthe balance sheet of Tether, including the size and timestamp of grants and revokes, we use threedatabases, Omniexplorer, Etherscan, and Tron.23 These are platforms on which the blockchain– the entire history of on-chain transactions involving transfers of Tether, is recorded.24 Theseplatforms contain an api that allows users to access an entire history of transactions in Tether.Transactions are classified as "simple send," "grants," or "revokes." These transactions are then
23These are the three largest blockchain platforms on which Tether is traded, and account for over 99% of Tetherin circulation as of April, 2020.
24Off-chain transactions, such as transactions within a cryptocurrency exchange, are not recorded.
22

recorded in a series of blocks, and can be retrieved using the Omniexplorer and Etherscan api.For more detail on the databases, including how the flows are constructed from the addressesof the issuer, see data appendix A.
Prior to 2018, nearly all Tether created in grants is distributed to Bitfinex and the otherexchanges for trading in the secondary market. However, since 2018 this is no longer the case:The Tether Treasury now holds a fraction of total Tether in circulation. To obtain the balanceat the Tether Treasury, we use the Omniexplorer api to receive all transactions and Etherscanapi of the Tether Treasury address. In the left panel of Figure 7, we document the totalTether in circulation, which changes due to grants and revokes, as well as the division of totalTether held by the Treasury and the secondary market, which included balances held at cryptoexchanges, retail investors, and institutional investors. While balances held at the Treasury aretypically a small fraction of total Tether in circulation, they reached almost $1B USD in 2018,which equates to 25% of total Tether in circulation. While the Tether Treasury holds one of thelargest balances of Tether, other accounts are typically held by cryptocurrency exchanges. Theusefulness of the Treasury’s reserves can be seen as analogous to the accumulation of foreignexchange reserves by a central bank. This provides the stablecoin issuer a one-sided potencyagainst stablecoin premiums; in the event of a secondary market price above one USD, theTether Treasury can sell its Tether reserves in the secondary market to restore parity of thepeg. This provides an alternative to endogenous investor flows as a stability mechanism.25
While Tether grants occur at a low frequency, there are continuous flows of Tether from theTreasury to the secondary market. In the right panel of Figure 7 we plot daily flows between theTreasury and the secondary market against the Tether price. Flows from the Treasury to thesecondary market typically coincide with periods in which the price is above the peg. Conversely,when Tether trades at a discount to the dollar, there are net flows from the secondary marketto the Treasury. This is suggestive evidence that flows between the Tether Treasury and thesecondary market are key to the stabilising mechanism that maintains the Tether/USD peg.For details on the balance sheets of other national-currency-backed stablecoins, see AppendixC.
25The accumulation of Tether reserves helps guard against stablecoin premiums, but not stablecoin discounts.For example, if Tether trades at a discount, then the Tether Treasury would require investors to redeem theirdollar deposits and withdraw Tether from circulation.
23
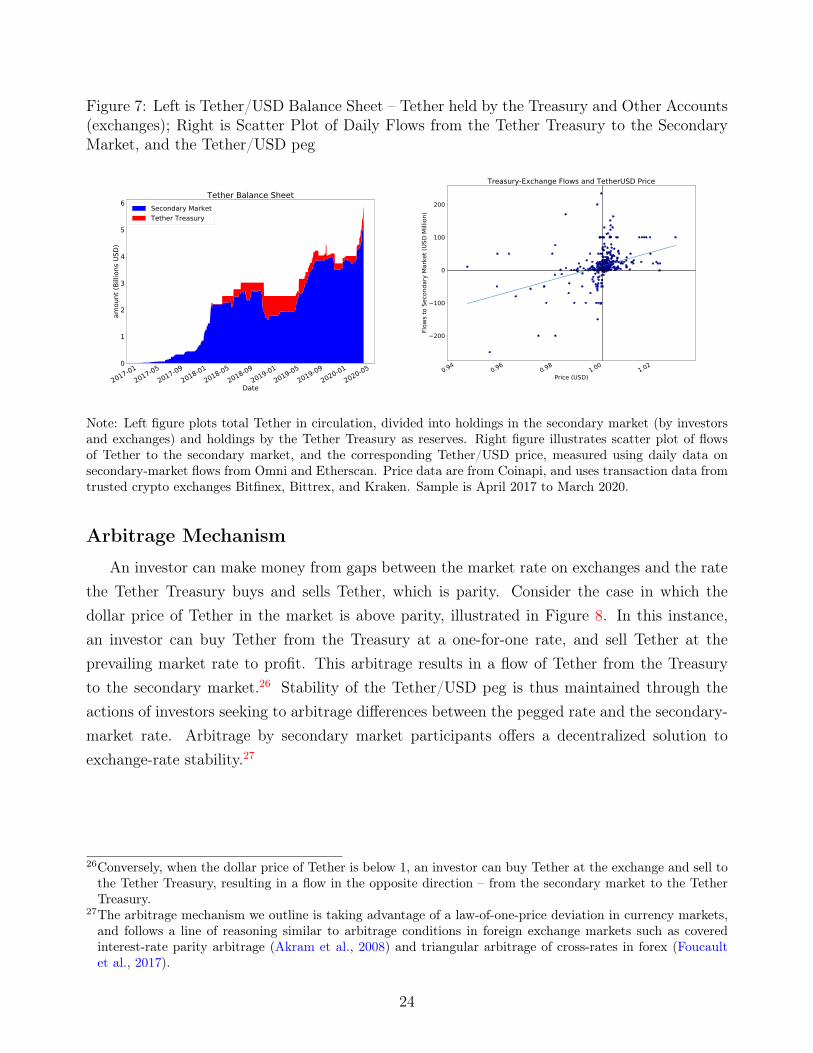
Figure 7: Left is Tether/USD Balance Sheet – Tether held by the Treasury and Other Accounts(exchanges); Right is Scatter Plot of Daily Flows from the Tether Treasury to the SecondaryMarket, and the Tether/USD peg
2017-012017-05
2017-092018-01
2018-052018-09
2019-012019-05
2019-092020-01
2020-05
Date
0
1
2
3
4
5
6
amou
nt (B
illion
s USD
)
Tether Balance SheetSecondary MarketTether Treasury
0.94 0.96 0.98 1.00 1.02Price (USD)
200
100
0
100
200
Flow
s to
Seco
ndar
y M
arke
t (US
D M
illion
)
Treasury-Exchange Flows and TetherUSD Price
Note: Left figure plots total Tether in circulation, divided into holdings in the secondary market (by investorsand exchanges) and holdings by the Tether Treasury as reserves. Right figure illustrates scatter plot of flowsof Tether to the secondary market, and the corresponding Tether/USD price, measured using daily data onsecondary-market flows from Omni and Etherscan. Price data are from Coinapi, and uses transaction data fromtrusted crypto exchanges Bitfinex, Bittrex, and Kraken. Sample is April 2017 to March 2020.
Arbitrage Mechanism
An investor can make money from gaps between the market rate on exchanges and the ratethe Tether Treasury buys and sells Tether, which is parity. Consider the case in which thedollar price of Tether in the market is above parity, illustrated in Figure 8. In this instance,an investor can buy Tether from the Treasury at a one-for-one rate, and sell Tether at theprevailing market rate to profit. This arbitrage results in a flow of Tether from the Treasuryto the secondary market.26 Stability of the Tether/USD peg is thus maintained through theactions of investors seeking to arbitrage differences between the pegged rate and the secondary-market rate. Arbitrage by secondary market participants offers a decentralized solution toexchange-rate stability.27
26Conversely, when the dollar price of Tether is below 1, an investor can buy Tether at the exchange and sell tothe Tether Treasury, resulting in a flow in the opposite direction – from the secondary market to the TetherTreasury.
27The arbitrage mechanism we outline is taking advantage of a law-of-one-price deviation in currency markets,and follows a line of reasoning similar to arbitrage conditions in foreign exchange markets such as coveredinterest-rate parity arbitrage (Akram et al., 2008) and triangular arbitrage of cross-rates in forex (Foucaultet al., 2017).
24

Figure 8: Arbitrage Flows when Tether Price in Secondary Market is Trading at a Premium
TetherTreasury
Investor
SecondaryMarket
1 $(1 + ∆)$
1 USDT 1 USDT
Note: Schematic illustrates an arbitrage trade where the secondary-market price of Tether trades at a premium.An investor makes a dollar deposit with the Tether Treasury, obtains a Tether token (at exchange rate 1 Tetherper 1 USD), and then sells Tether tokens in the secondary market for a round-trip profit of ∆.
For the arbitrage mechanism to work, at least some investors must be able to depositdollars with the primary-market issuer when the secondary-market price trades at a premium,and conversely to be able to redeem their dollar deposits when the market price trades at adiscount. To test the arbitrage mechanism we have identified, we exploit a particular event:The migration of Tether from the Omni to the Ethereum blockchain in 2019. By operating onthe Ethereum blockchain, Tether could now be used more directly as a vehicle currency for alarge number of cryptocurrency investors that use the Ethereum blockchain. Tether circulatingon the Ethereum blockchain has faster deposit/withdrawal features, enabling higher-frequencyarbitrage.28
Increased direct access of investors for depositing dollars with the Tether Treasury is coinci-dent with the introduction of Tether in circulation on the Ethereum Blockchain, which occurredin April, 2019 (Figure 9, left). Figure 9 shows that prior to 2019, there was typically only oneunique address transacting with the Tether Treasury, and that is the Bitfinex exchange. Wedecompose total flows to the secondary market into flows from the Tether Treasury to Bitfinexversus flows to other investors (equation 18). Consistent with the increased number of uniqueaddresses since April 2019, there is a strong shift in flows toward other investors (Figure 9,right).
FlowT→EX = FlowT→Bitfinex + FlowT→Investors (18)
28For more on the benefits of migrating to the Ethereum blockchain, see https://www.prnewswire.com/news-releases/huobi-global-offers-deposit--withdrawal-in-tether-erc20-300803113.html. TheEthereum blockchain processes 15 transactions per second, in contrast to the Omni blockchain (based onBitcoin) at about 4 transactions per second.
25

Figure 9: Left – Number of Unique Addresses on Omni, Ethereum and Tron Blockchains; Right– Decomposing cumulative flows to the Secondary Market to Bitfinex and other investors.
2018-012018-04
2018-072018-10
2019-012019-04
2019-072019-10
2020-012020-04
Date
0
5
10
15
20
25
30
Num
ber o
f Uni
que
Addr
esse
s
Number of Unique Addresses- by BlockchainOmniEtherscanTron
2018-012018-04
2018-072018-10
2019-012019-04
2019-072019-10
2020-012020-04
Date
0
1
2
3
4
5
amou
nt (B
illion
s USD
)
Decomposing Secondary Market FlowsBitfinexOther Investors
Note: Left plots the daily number of unique investor addresses transacting with the Tether Treasury. Right plotdecomposes cumulative flows from Treasury to Bitfinex and other investors/exchanges. Data from Etherscan,Omniexplorer, and Tron Blockchains. Sample is January 2018 through March 2020.
We hypothesize that the introduction of Tether transactions on the Ethereum blockchain,and the subsequent access of other investors to the primary market, should translate to anincreased effectiveness of the arbitrage mechanism in sustaining the peg. For example, if Bitfinexis the only investor that has access to the primary market, then this will impair the ability ofprivate investors to arbitrage peg deviations.29 We test this mechanism, by first partitioning oursample of Tether prices into the pre and post periods according to the date that investors arefirst able to deposit dollars directly with the Tether Treasury on the Ethereum blockchain, whichwe identify as April 9th, 2019.30 Table 3 presents summary statistics. We find a significantdifference in the average size of peg deviations, and in particular, note a significantly lowerhalf-life of deviations, measuring 6.5 days in the pre Ethereum blockchain sample, versus 3.3days in the post period.
We compute an upper bound for the size of arbitrage profits. To do so we match thetimestamp of investor Treasury deposits with the secondary-market price of Tether based onminute-frequency price data from trusted exchanges Bitfinex, Bittrex, and Kraken, three of themost liquid exchanges in the Tether/Dollar market. We assume an arbitrage sequence wherean investor deposits dollars with the Tether Treasury, and contemporaneously sells Tetherin the secondary market. The arbitrage spread is then defined, in USD, as the differencepUSDT − 1, where pUSDT is the dollar price of Tether at the exchange. In constructing thearbitrage spread, we assume the transaction sequence is contemporaneous, and there are no29This is particularly relevant given allegations that Bitfinex colluded with Tether to manipulate the market asoutlined in Griffin and Shams (2020).
30For details on the dataset covering Tether Treasury transactions, see data appendix A.
26

Table 3: Summary Statistics of Tether/USD Deviations, pre and post introduction of Tetheron the Ethereum Blockchain
Period Mean SD Min Max Half-Life (days)
Pre Ethereum Blockchain -28.2 97.2 -505 298 6.5Post Ethereum Blockchain -0.9 47.2 -298 119 3.3
Note: Summary statistics for deviations from the peg are expressed in basis points (100 basis points = 1 UScent). Secondary-market price is based on daily data that averages prices from the Bitfinex, Bittrex, and Krakenexchanges, all three being trusted exchanges, sourced from Coinapi. Sample is divided into 04/17-04/19 in thepre period, and 04/19-03/20 in the post period. The post period corresponds to when investors can directlytransact with the Tether Treasury on the Ethereum blockchain.
delays in the processing of each transaction due to queuing or latency time of transactions.Second, the arbitrage profit is also an upper bound due to our implicit assumption that theinvestor’s selling of Tether in the secondary market does not have immediate price impact. Theresulting profit we calculate, on a per-trade basis, is the amount deposited with the TetherTreasury multiplied by the arbitrage spread. We summarise the statistics of arbitrage profits,deposits and spread in Table 4.
Based on our calculations of arbitrage spreads and profit, the majority of deposits of in-vestors, both on the Omni and Ethereum blockchains, earn positive profits, with 92% and 87%of deposits with the Tether Treasury coinciding with a secondary market price above the peg.There are two takeaways from Table 4. First, the introduction of Tether to the Ethereumblockchain increased investor access: more Treasury transactions are executed, rising from 16per month on average in the pre period to 92 in the post period, with the average size of thesetrades falling from 7.0 to 4.0 USD Million. Second, arbitrage spreads shrink from an average of69 basis points on Omni to 27 basis points on Ethereum. Increased investor access has reducedthe extent of arbitrage opportunities. We can also do a back-of-the-envelope calculation ofthe amount of arbitrage profit in total. On the Omni platform, 394 deposits, with an averagearbitrage profit of 0.03 Million USD, comes to a total arbitrage of 394×0.03 ≈ 12 Million USD.The total arbitrage profit made on the Ethereum blockchain is 1098× 0.01 ≈ 11 Million USD.
We test now more directly whether arbitrage flows stabilize price around the peg. Thisfollows a large literature on measuring the effects of forex intervention. Specifically, we testwhether there is a price impact from arbitrage flows that is stabilizing. We conduct local pro-jections (based on Jordà (2005)) of the value of net inflows from the Treasury to the secondarymarket on the level of deviations from Tether’s parity peg. We denote FlowT→EX,h as totalflows from the Treasury to the secondary market, measured at a daily frequency.31 The change
31A positive flow to the secondary market is equivalent to a net positive deposit of dollars with the TetherTreasury, aggregated at a daily frequency.
27

Table 4: Summary Statistics of Arbitrage spreads on the Omni and Ethereum Blockchains
Omni Blockchain
Variable Count Mean Std Min 25% 50% 75% Max
Deposit (USD Million) 394 6.991 32.37 0.002 0.528 1.442 3.396 400Spread (Basis Points) 394 69.42 81.95 -303.50 28.18 51.00 95.00 437Profit (USD Million) 394 0.031 0.309 -2.320 0.002 0.007 0.018 3.78
Ethereum Blockchain
Variable Count Mean Std Min 25% 50% 75% MaxDeposit (USD Million) 1098 3.84 13.11 0.000 0.544 1.798 4.183 300Spread (Basis Points) 1098 27.16 35.67 -157.77 12.00 25.00 38.50 483.75Profit (USD Million) 1098 0.01 0.024 -0.079 0.001 0.003 0.011 0.383
Note: Table records statistics on Tether Treasury deposit size, arbitrage spread, and profit (calculated asarbitrage spread times deposit size, trade-by-trade). Spread, measured in basis points, is the difference betweenthe secondary-market price of Tether and the pegged rate of 1. Secondary-market price is based on minute-frequency data that averages prices from the Bitfinex, Bittrex, and Kraken exchanges, sourced from Coinapi.Sample is April 2017 to March 2020.
in the Tether dollar price, Pt+h − Pt−1, is projected on the level of arbitrage flows of investorsin equation (19), allowing for feedback effects using lagged price and flows as controls. We hy-pothesize a negative coefficient βh, which suggests that positive flows to the secondary markethave a stabilizing impact on price. We present the results of the local projections in Figure 10,with a baseline specification of 4 lags.32
Pt+h − Pt−1 = α + βhFlowT→EX +4∑
k=1
δkFlowT→EX,t−k+
4∑k=1
γk(Pt−k−1 − Pt−k−2) + ut h = 0, 1, 2, ... (19)
Consistent with our hypothesis, arbitrage flows from investors have a stabilizing effect on theTether/USD price (Figure 10). After dividing our sample based on the introduction of Tetherto the Ethereum blockchain, we find a significant price impact of arbitrage flows in the postperiod, confirming that increased direct access of investors to the Tether Treasury supports thearbitrage mechanism. In the period since April 2019, a price impact of between 5 and 10 basis
32An alternative specification for equation 19 is a structural VAR. By using the method of local projections, wedo not impose restrictions on the timing of the model’s flow shocks; however we still control for endogeneitythrough lagged prices and lagged flows in our specification.
28
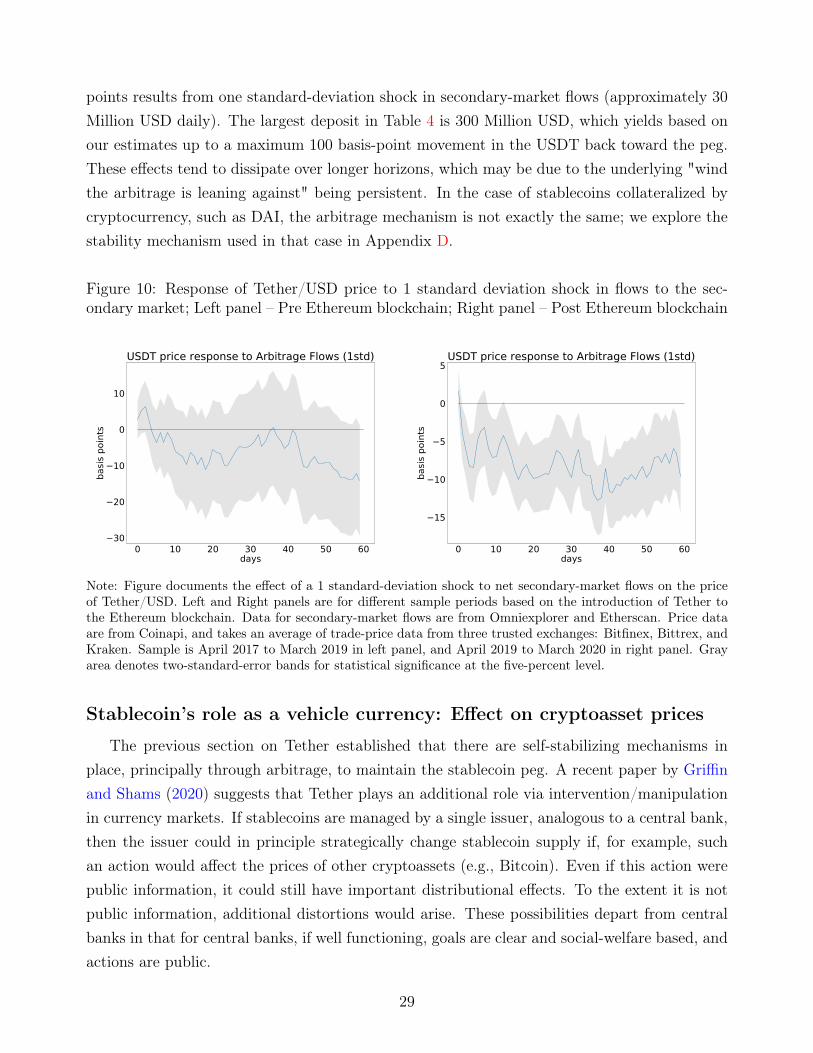
points results from one standard-deviation shock in secondary-market flows (approximately 30Million USD daily). The largest deposit in Table 4 is 300 Million USD, which yields based onour estimates up to a maximum 100 basis-point movement in the USDT back toward the peg.These effects tend to dissipate over longer horizons, which may be due to the underlying "windthe arbitrage is leaning against" being persistent. In the case of stablecoins collateralized bycryptocurrency, such as DAI, the arbitrage mechanism is not exactly the same; we explore thestability mechanism used in that case in Appendix D.
Figure 10: Response of Tether/USD price to 1 standard deviation shock in flows to the sec-ondary market; Left panel – Pre Ethereum blockchain; Right panel – Post Ethereum blockchain
0 10 20 30 40 50 60days
30
20
10
0
10
basis
poi
nts
USDT price response to Arbitrage Flows (1std)
0 10 20 30 40 50 60days
15
10
5
0
5
basis
poi
nts
USDT price response to Arbitrage Flows (1std)
Note: Figure documents the effect of a 1 standard-deviation shock to net secondary-market flows on the priceof Tether/USD. Left and Right panels are for different sample periods based on the introduction of Tether tothe Ethereum blockchain. Data for secondary-market flows are from Omniexplorer and Etherscan. Price dataare from Coinapi, and takes an average of trade-price data from three trusted exchanges: Bitfinex, Bittrex, andKraken. Sample is April 2017 to March 2019 in left panel, and April 2019 to March 2020 in right panel. Grayarea denotes two-standard-error bands for statistical significance at the five-percent level.
Stablecoin’s role as a vehicle currency: Effect on cryptoasset prices
The previous section on Tether established that there are self-stabilizing mechanisms inplace, principally through arbitrage, to maintain the stablecoin peg. A recent paper by Griffinand Shams (2020) suggests that Tether plays an additional role via intervention/manipulationin currency markets. If stablecoins are managed by a single issuer, analogous to a central bank,then the issuer could in principle strategically change stablecoin supply if, for example, suchan action would affect the prices of other cryptoassets (e.g., Bitcoin). Even if this action werepublic information, it could still have important distributional effects. To the extent it is notpublic information, additional distortions would arise. These possibilities depart from centralbanks in that for central banks, if well functioning, goals are clear and social-welfare based, andactions are public.
29
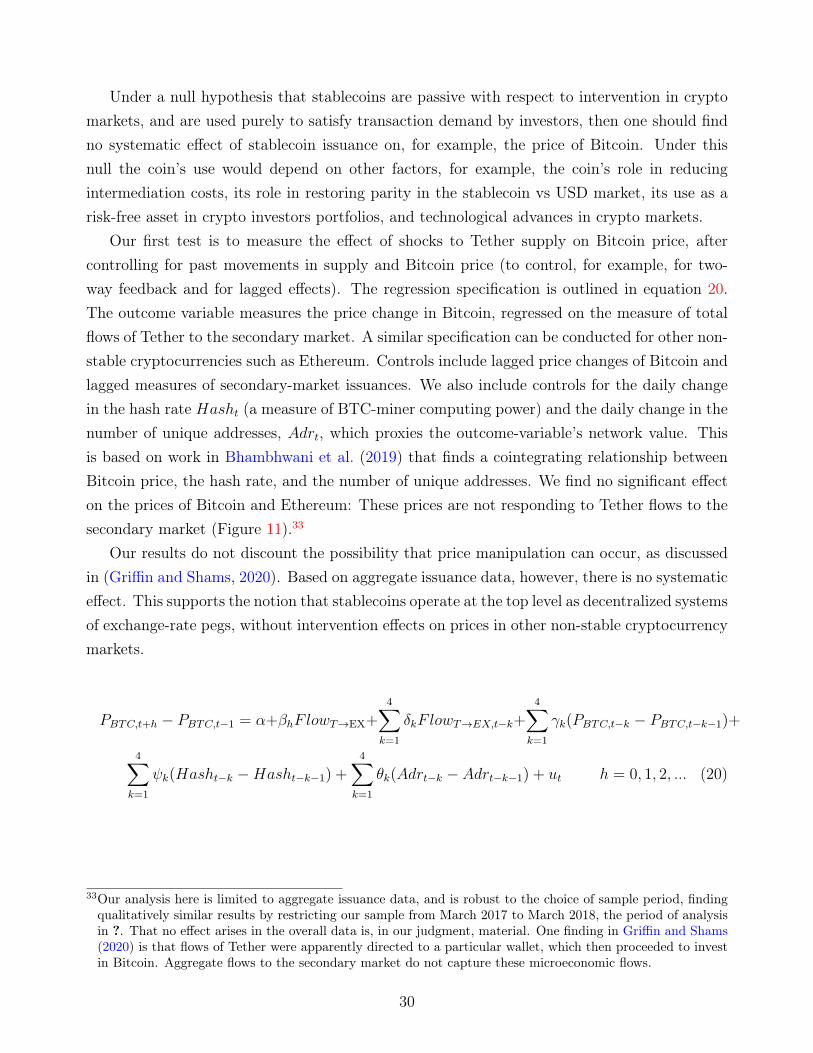
Under a null hypothesis that stablecoins are passive with respect to intervention in cryptomarkets, and are used purely to satisfy transaction demand by investors, then one should findno systematic effect of stablecoin issuance on, for example, the price of Bitcoin. Under thisnull the coin’s use would depend on other factors, for example, the coin’s role in reducingintermediation costs, its role in restoring parity in the stablecoin vs USD market, its use as arisk-free asset in crypto investors portfolios, and technological advances in crypto markets.
Our first test is to measure the effect of shocks to Tether supply on Bitcoin price, aftercontrolling for past movements in supply and Bitcoin price (to control, for example, for two-way feedback and for lagged effects). The regression specification is outlined in equation 20.The outcome variable measures the price change in Bitcoin, regressed on the measure of totalflows of Tether to the secondary market. A similar specification can be conducted for other non-stable cryptocurrencies such as Ethereum. Controls include lagged price changes of Bitcoin andlagged measures of secondary-market issuances. We also include controls for the daily changein the hash rate Hasht (a measure of BTC-miner computing power) and the daily change in thenumber of unique addresses, Adrt, which proxies the outcome-variable’s network value. Thisis based on work in Bhambhwani et al. (2019) that finds a cointegrating relationship betweenBitcoin price, the hash rate, and the number of unique addresses. We find no significant effecton the prices of Bitcoin and Ethereum: These prices are not responding to Tether flows to thesecondary market (Figure 11).33
Our results do not discount the possibility that price manipulation can occur, as discussedin (Griffin and Shams, 2020). Based on aggregate issuance data, however, there is no systematiceffect. This supports the notion that stablecoins operate at the top level as decentralized systemsof exchange-rate pegs, without intervention effects on prices in other non-stable cryptocurrencymarkets.
PBTC,t+h − PBTC,t−1 = α+βhFlowT→EX+4∑
k=1
δkFlowT→EX,t−k+4∑
k=1
γk(PBTC,t−k − PBTC,t−k−1)+
4∑k=1
ψk(Hasht−k −Hasht−k−1) +4∑
k=1
θk(Adrt−k − Adrt−k−1) + ut h = 0, 1, 2, ... (20)
33Our analysis here is limited to aggregate issuance data, and is robust to the choice of sample period, findingqualitatively similar results by restricting our sample from March 2017 to March 2018, the period of analysisin ?. That no effect arises in the overall data is, in our judgment, material. One finding in Griffin and Shams(2020) is that flows of Tether were apparently directed to a particular wallet, which then proceeded to investin Bitcoin. Aggregate flows to the secondary market do not capture these microeconomic flows.
30

Figure 11: Response of Bitcoin and Ethereum prices to issuance flows in USDT
0 10 20 30 40 50 60days
200
100
0
100
200
300
USD
Response of BTC to shock to USDT Issuance
0 10 20 30 40 50 60days
15
10
5
0
5
10
15
20
USD
Response of ETH to shock to USDT Issuance
Note: Figure documents local projections of a change in secondary-market issuance on the prices for Bit-coin and Ethereum. Data for secondary-market flows are from Tether transactions on Omni, Etherscan, andTron Blockchains. Price data are from Cryptocompare. Controls include lagged price changes and changes incryptocurrency fundamentals such as hash rate and the number of unique addresses of the network, based onBhambhwani et al. (2019). 4 lags are included in the baseline specification. Sample period is from April 2017to March 2020. Gray area denotes two-standard-error bands for statistical significance at the five-percent level.
4 Empirical Evidence: Fundamentals of Peg DeviationsIn this section we test channels through which stablecoins trade at a premium or discount.
We present evidence that premiums arise in times of increased volatility in non-stable cryp-tocurrency markets. Notable examples include the crash of Bitcoin in early 2018 and theCOVID-19 crisis of 2020. This supports our model predictions of stablecoin premia due to thethree channels of safety, latency time, and intermediation cost differences. This section alsoaddresses a second prediction of the model that centered on the effects of speculative attacks.We document an example of speculation on Tether in October 2018, when Bitfinex temporarilysuspended convertibility of dollar deposits. This signalled to investors that Tether may not havebeen fully collateralized, and Tether traded at a discount of approximately 500 basis points,with significant increases in bid-ask spreads. All data used in this section, including transactiondata used to construct order flow, are discussed further in the data appendix A.
Liquidity Fundamentals
We quantify factors that determine pricing in the Tether/USD market. We identify twosuch factors, order flow, which is a measure of net buying pressure, and cryptocurrency pricevolatility. Determinants of Tether’s value are difficult to model in traditional ways with macroe-conomic fundamentals such as inflation and interest-rate differentials. We draw instead fromthe medium-of-exchange role in monetary theory to posit that the price of Tether is driven by
31

factors connected to Bitcoin- and Tether-market liquidity.
Order Flow
The first determinant of Tether returns we examine is order flow. Order flow is a measureof net buying pressure in the secondary market and, viewed through the lens of informationmodels in microstructure theory, is the primary means through which dispersed information inthe market is expressed and aggregated in price-setting.
We construct a measure of order flow using transaction data provided by cryptocurrencyvendor Coinapi. This includes a history of trades from a series of exchanges that trade inthe Tether/USD pair.34 This dataset provides the timestamp of each trade, together with theamount of underlying Tether in each trade, and a true-or-false variable taker side sell which weuse to construct the sign of the transaction.
The exchange follows a maker-taker structure. The marketmaker is the provider of liquidity,and typically submits limit orders to the exchange with a specified bid and ask price. The takersare typically private investors who submit market orders for Tether, and are the aggressor ofthe transaction. When the taker side sell column reads true, this signifies that the taker isselling Tether and buying USD. The price they are willing to sell Tether is the bid price offeredby the marketmaker. Conversely, when taker side sell is false, the taker is buying Tether andselling USD. They buy Tether at the ask price offered by the marketmaker. Using this signingconvention we can construct a measure of order flow as the difference between buyer- andseller-initiated transactions, expressed in the following equation where Tk is the transaction, Bindicates it is buyer-initiated and S indicates it is seller-initiated, and VTk is the amount of thetransaction.
OF volt =
k=t∑k=t0
VTk (1[Tk = B]− 1[Tk = S]) (21)
Figure 12 plots daily order flow on the left. We observe that order flow is stationary andmean-reverting towards zero. This is consistent with marketmakers in crypto exchanges beingaverse to holding inventory and net positions in Tether. We also observe a strong correlationbetween cumulative order flow and the price level of Tether in Figure 12, right. This suggeststhat order flow may convey significant information for price dynamics in the market. In partic-ular, we observe a sharp positive correlation between order flow and price changes in October2018, when Tether was trading at a steep discount.
34Exchanges that trade significantly in Tether/USD are Bitfinex and Kraken. For the baseline results we usethe Kraken exchange as it has the highest volume of trades, and the earliest history (starting in April 2017).
32

Figure 12: Cumulative Order Flow and Price in Tether/USD
2019-012019-03
2019-052019-07
2019-092019-11
2020-012020-03
2020-05
Date
30
20
10
0
10
20
Teth
er (M
illion
s)
OF: USDT_USD
2017-052017-09
2018-012018-05
2018-092019-01
2019-052019-09
2020-012020-05
0.90
0.92
0.94
0.96
0.98
1.00
1.02
1.04
Price
(USD
)
Cumulative OF and Price:USDT_USD
100
0
100
200
300
Cum
ulat
ive
OF (T
ethe
r Milli
ons)
Price (USD)Cumulative OF (Tether Millions)
Note: Figure plots order flow of Tether/USD (left panel), and price and cumulative order flow (right panel).Transaction price and volume data are from Coinapi. Sample is April 2017 to March 2020.
Volatility of Cryptocurrency Markets
We construct measure of volatility in the BTC/USDT market based on a 10-day rollingstandard deviation of the BTC/USDT price. This fundamental captures the safety premium ofTether; in times of high uncertainty in the Bitcoin price, investors want to liquidate to a storeof value. Stablecoins have lower intermediation costs and lower latency time of transactions,with bank wires taking significantly longer than a transaction executed on the blockchain. Wehypothesize that this results in investors choosing to liquidate unstable cryptocurrencies tostablecoins, as opposed to dollars, causing Tether to trade at a premium in times of increasedrisk in cryptocurrency markets.
Price discovery and determinants of Tether premiums and discounts
Following Evans and Lyons (2002), we first report regressions of price discovery on orderflow. We estimate equation (22), where ∆pt = pt − pt−1 measures the difference between theclosing dollar price of Tether today and the prior day. OFt measures the net of buyer-initiatedtrades for Tether over the concurrent 24 hours.
∆pt = α + βOFt + ut (22)
We find that order flow conveys significant information relevant to price-discovery (Table5). A one standard-deviation change in order flow (which we measure as $3.8 million basedon our estimation period for combined trading in the Bitfinex, Bittrex, and Kraken exchanges)leads to an approximately 10 basis-point increase in the dollar price of Tether, where 100 basispoints is $0.01. Alternatively, a 100 basis-point move in the dollar price of Tether then requires
33

an approximate $40 million change in net trading. We then condition the order-flow equationon subsets of the sample. In specification 2, we condition on the USDT price being within 1standard deviation of parity. In specifications 3 and 4, we condition on the price being lessthan 1 standard deviation, and greater than 1 standard deviation respectively.
The estimated elasticity of price changes to order flow is significantly higher than estimatesfor national currencies in Evans and Lyons (2002). The authors find net trading of $1 billionin the USD/Deutschemark market in 1995 led to a 50 basis point change in the exchange rate.Our estimates are significantly higher likely due to the relative differences in liquidity betweenthe stablecoin and national-currency forex markets.35 The high elasticity of price to net tradingin the stablecoin market is also due to the role of private investors in arbitraging deviationsfrom parity.36 When Tether trades at a discount, the price impact of order flow is insignificant.We reason that speculation and liquidity fundamentals explain periods when Tether trades ata large discount to the Dollar. In these periods, order flow is likely to be more noisy andaggregate less information than in periods of relative stability in the peg. Finally, we show thatorder flow has much larger price impact when Tether trades at significant premiums in column4. In this case, flows from the Tether Treasury to the secondary market begin to occur as apotential stabilizing mechanism. To the extent these arbitrage flows impact the order book in asystematic way, this explains the increased price impact of order flow. For example, in responseto Tether trading at a premium, an investor deposits dollars with the Treasury, obtains anequivalent amount of Tether at a price of 1.0, and sells it at the higher secondary-market pricevia a market order at the best bid. This results in an increase in seller-initiated transactions,meaning negative order flow, and price stabilizing toward the peg.37
35Daily trading volume in USD markets in 1995 is approximately $1 trillion according to BIS figures. In oursample, the daily average trading in the Kraken exchange is approximately $5 million.
36Another related paper on order flow in fixed exchange rate regimes is (Killeen et al., 2006), which analyses thetransition from fixed to floating of the currencies under the European Monetary System (EMS). They proposethat under fixed exchange rates, the sensitivity of order flow goes to zero under a perfectly credible regimebecause the central bank stands ready to offset any private-sector order flow. Therefore order imbalances havezero price impact. Alternatively, in our setting, stablecoin issuers are passive, and so even under a perfectlycredible regime, private investors are required to initiate trades in the market to arbitrage peg deviations.
37If the investor is also a marketmaker (such as a crypto exchange), they could alternatively post competitivelimit-order offers to sell. This action could have an opposing effect on measured order flow since it can triggerbuyer-initiated trades.
34

Table 5: Price Discovery and Signed Order Flow
I II III IV∆p ∆p ∆p ∆p
OF 9.49*** 9.19*** 11.97 35.07***(1.73) (1.34) (11.60) (11.07)
Intercept -0.69 0.44 28.00* -53.74***(1.73) (1.31) (15.81) (9.79)
R-squared 0.03 0.05 0.01 0.13No. observations 1104 956 78 70Full Sample Y N N N|pt−1 − 1| < 1sd N Y N Npt−1 − 1 < −1sd N N Y Npt−1 − 1 > 1sd N N N Y
Note: Table presents regressions of the daily change in the USD price of Tether on a measure of daily orderflow. Order flow is constructed as the net of buyer-initiated transactions for the Tether/USD pair, where abuy transaction is reported as +1 when the buyer of Tether is the aggressor. Order flow and trade price dataare from Coinapi. Sample period is April 2017 to March 2020, and consolidates trade data from three trustedexchanges: Bitfinex, Bittrex, and Kraken. *** denotes significance at the 1 percent level, ** at the 5 percentlevel, and * at the 10 percent level.
We now regress the deviation of the Tether price from the peg, pt − 1, on signed orderflow OFt, as well as a ten-day rolling window of Bitcoin price volatility, σBTC,t, as expressed inequation 23.
pt − 1 = α + β1OFt + β2σBTC,t + ut (23)
Table 6 provides evidence that liquidity fundamentals have an important role in explainingdeviations from the peg. In specification 1, we present the results of regression 23 for the fullsample. We then condition on subsets of the sample in specifications 2, 3, and 4. In column 2,we condition on the USDT price being within 1 standard deviation of parity. In columns 3 and4 we condition on price being more than 1 standard deviation below parity, and greater than 1standard deviation above parity respectively.
We find positive effects of an increase in Bitcoin volatility on the Tether price. Basedon specification 1, the volatility of trading volume in Bitcoin has a positive effect on Tetherpremiums, with a 1 percent increase in BTC price volatility increasing the price of Tether by
35

Table 6: Determinants of Tether/USD Price – Liquidity Fundamentals
I II III IVpt − 1 pt − 1 pt − 1 pt − 1
OF 21.85*** 13.60*** 23.45 19.36*(3.79) (1.84) (19.63) (11.54)
σBTC 30.90*** 6.07*** 115.10*** -5.63(4.15) (2.06) (24.30) (9.53)
Intercept -178.55*** -26.01** -903.42*** 183.64***(23.34) (11.64) (121.54) (53.66)
R-squared 0.07 0.06 0.24 0.05No. observations 1091 942 77 70Full Sample Y N N N|pt−1 − 1| < 1sd N Y N Npt−1 − 1 < −1sd N N Y Npt−1 − 1 > 1sd N N N Y
Note: Table presents regressions of the deviation from parity in the USD price of Tether on variables capturingliquidity in the Tether/USD and BTC market. OF measures order flow and is constructed as the net of buyer-initiated transactions for the Tether/USD pair, where a buy transaction is reported as +1 when the buyer ofTether is the aggressor. σBTC is the log standard deviation of the BTC/USDT trading price sourced fromCryptocompare. Standard deviations are measured using a rolling window of 10 days. Sample is April 2017to March 2020, and consolidates trade data from three trusted exchanges: Bitfinex, Bittrex, and Kraken. ***denotes significance at the 1 percent level, ** at the 5 percent level, and * at the 10 percent level.
approximately 0.4 basis points.38 This suggests a potential risk-hedging motive for holdingTether in periods of extreme Bitcoin-price volatility. One of Tether’s features is its store-of-value function for crypto investors. This analysis is suggestive evidence that Tether acts as asafe haven, however two questions remain. To what extent is the role of Tether a safe haven tothe entire class of non-stable cryptocurrencies? And does the behaviour of Tether generalize toother stablecoins as well? We address both questions in the following section, which providesmore evidence on the role of the safety premium and latency time in giving rise to stablecoinpremiums.
Stablecoin premiums: Safety and latency premium
To test the role of stablecoins as a safe asset in the domain of cryptoassets, we conduct afactor analysis of the returns of the five largest non-stable cryptocurrencies by market capi-
38Our result on the effects of BTC price volatility is robust to using a trading-volume measure to construct ourvolatility variable.
36
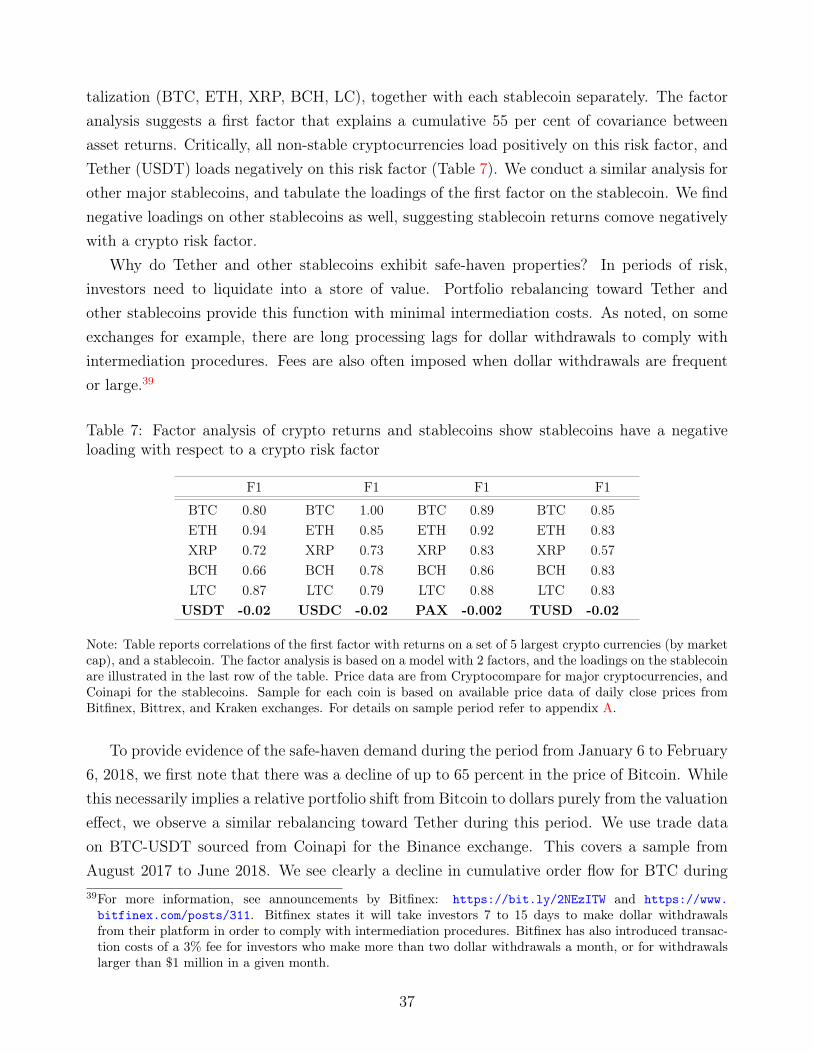
talization (BTC, ETH, XRP, BCH, LC), together with each stablecoin separately. The factoranalysis suggests a first factor that explains a cumulative 55 per cent of covariance betweenasset returns. Critically, all non-stable cryptocurrencies load positively on this risk factor, andTether (USDT) loads negatively on this risk factor (Table 7). We conduct a similar analysis forother major stablecoins, and tabulate the loadings of the first factor on the stablecoin. We findnegative loadings on other stablecoins as well, suggesting stablecoin returns comove negativelywith a crypto risk factor.
Why do Tether and other stablecoins exhibit safe-haven properties? In periods of risk,investors need to liquidate into a store of value. Portfolio rebalancing toward Tether andother stablecoins provide this function with minimal intermediation costs. As noted, on someexchanges for example, there are long processing lags for dollar withdrawals to comply withintermediation procedures. Fees are also often imposed when dollar withdrawals are frequentor large.39
Table 7: Factor analysis of crypto returns and stablecoins show stablecoins have a negativeloading with respect to a crypto risk factor
F1 F1 F1 F1
BTC 0.80 BTC 1.00 BTC 0.89 BTC 0.85ETH 0.94 ETH 0.85 ETH 0.92 ETH 0.83XRP 0.72 XRP 0.73 XRP 0.83 XRP 0.57BCH 0.66 BCH 0.78 BCH 0.86 BCH 0.83LTC 0.87 LTC 0.79 LTC 0.88 LTC 0.83
USDT -0.02 USDC -0.02 PAX -0.002 TUSD -0.02
Note: Table reports correlations of the first factor with returns on a set of 5 largest crypto currencies (by marketcap), and a stablecoin. The factor analysis is based on a model with 2 factors, and the loadings on the stablecoinare illustrated in the last row of the table. Price data are from Cryptocompare for major cryptocurrencies, andCoinapi for the stablecoins. Sample for each coin is based on available price data of daily close prices fromBitfinex, Bittrex, and Kraken exchanges. For details on sample period refer to appendix A.
To provide evidence of the safe-haven demand during the period from January 6 to February6, 2018, we first note that there was a decline of up to 65 percent in the price of Bitcoin. Whilethis necessarily implies a relative portfolio shift from Bitcoin to dollars purely from the valuationeffect, we observe a similar rebalancing toward Tether during this period. We use trade dataon BTC-USDT sourced from Coinapi for the Binance exchange. This covers a sample fromAugust 2017 to June 2018. We see clearly a decline in cumulative order flow for BTC during39For more information, see announcements by Bitfinex: https://bit.ly/2NEzITW and https://www.bitfinex.com/posts/311. Bitfinex states it will take investors 7 to 15 days to make dollar withdrawalsfrom their platform in order to comply with intermediation procedures. Bitfinex has also introduced transac-tion costs of a 3% fee for investors who make more than two dollar withdrawals a month, or for withdrawalslarger than $1 million in a given month.
37

the period of January-February 2018 in Figure 13. Liquidation into Tether is intuitive givenTether is pegged to the dollar, and provides a natural hedge for crypto investors, and proxiesas a risk-free cryptoasset. Liquidation into Tether is also the only option for exchanges such asBinance which do not allow conversion into national currencies directly.
Figure 13: Cumulative Order Flow and Price in BTC/USDT
2017-092017-10
2017-112017-12
2018-012018-02
2018-032018-04
2018-052018-06
0
2500
5000
7500
10000
12500
15000
17500
20000
Price
(USD
)
Cumulative OF and Price:BTC-USDT BINANCE
30
20
10
0
10
20
30
Cum
ulat
ive
OF (B
TC T
hous
ands
)
Note: Figure plots cumulative order flow in the BTC-Tether market (red line) against the BTC-Tether price(blue line). Data from Coinapi, which provides trade data for BTC-USDT pair on Binance exchange.
Stablecoins During the COVID-19 Panic
The COVID-19 economic crisis resulted in a collapse of the BTC market of approximately40%, as it fell from approximately $8,000 to $5,000 from March 12th to 13th. Amidst thewidespread sell-off in cryptocurrency markets, there were clear efforts by investors to liquidateinto a store of value. To gauge investors incentive to liquidate into a store of value quickly,we use the Ether Network’s gas prices. Gas is a measure of the amount of ether (ETH) auser pays to perform a given activity, or batch of activities, on the Ethereum network. Thesetransaction costs are analogous to commissions on exchanges, however these costs are paid tothe miners who authenticate the transactions on the Ethereum blockchain. These prices aredenominated in GWEI which is equivalent to one-billionth of one ETH, and they are typicallyan average of 10 GWEI per transaction. Critically, these units of GWEI provide a proxy fortransactions’ latency time. For example, on March 29th, 2020, the Ether gas station states thatthere is transaction cost of 8 units of GWEI for a transaction time less than 2 minutes, 5 unitsof GWEI for a transaction time less than 5 minutes, and 3 units of GWEI for a transaction
38

time less than 30 minutes.40
On March 12th, the average gas prices temporarily spiked to over 100 GWEI per transactionfrom the 10 GWEI average seen just one day prior. There was congestion on the Ethereumblockchain as investors wanted to liquidate unstable cryptocurrencies into stablecoins. The risein gas costs reflected the cost of latency time; investors were willing to pay more gas costs toliquidate faster.41
We plot in Figure 14 the price response of the six largest coins by market cap, based on datain March 2020. Shaded areas indicate the period in which the price of Bitcoin fell by 50%. Inall cases, we see a rise in the price of stablecoins of approximately 500 basis points. The largestincrease is for BinanceUSD coin, the stablecoin issued by the Binance cryptocurrency exchange.A potential reason why BinanceUSD trades at a premium to the dollar is because Binanceplatforms do not allow conversion to national currencies directly. Therefore, for investors onthe Binance exchange, converting to BinanceUSD is a good option for reducing latency time.
We finish our analysis on the latency premium with Figure 15, which plots cumulative orderflow and price of BTC in terms of stablecoins for the five largest market-cap currencies. Thereis a significant sell-off of BTC during March 12th. For example, on the Binance exchange, therewas an approximate 30,000 unit net selling pressure of BTC on March 12th. Similar trendsof a decline in cumulative order flow for BTC in other stablecoin markets is evident. For thecrypto-collateralized coin DAI, we examine the ETH/DAI market, and a similar trend collapseof the Ether price and decline in cumulative order flow on March 12th is evident; it is not aspronounced, however, as for the national-currency-backed coins.42
40Gas prices, as well as daily amounts of Ether Gas used, are provided in https://ethgasstation.info/.41For more information see https://blockonomi.com/ethereum-gas-prices-surged/.42We reason that as DAI is crypto-collateralized, investors use it more as a speculative investment. Therefore,investors that liquidate ETH into DAI will return to longer Ethereum positions once there is a greater expec-tation of rising Ethereum prices in the future; we do see a quick turnaround in order flow once the Ethereumprice reaches its low.
39
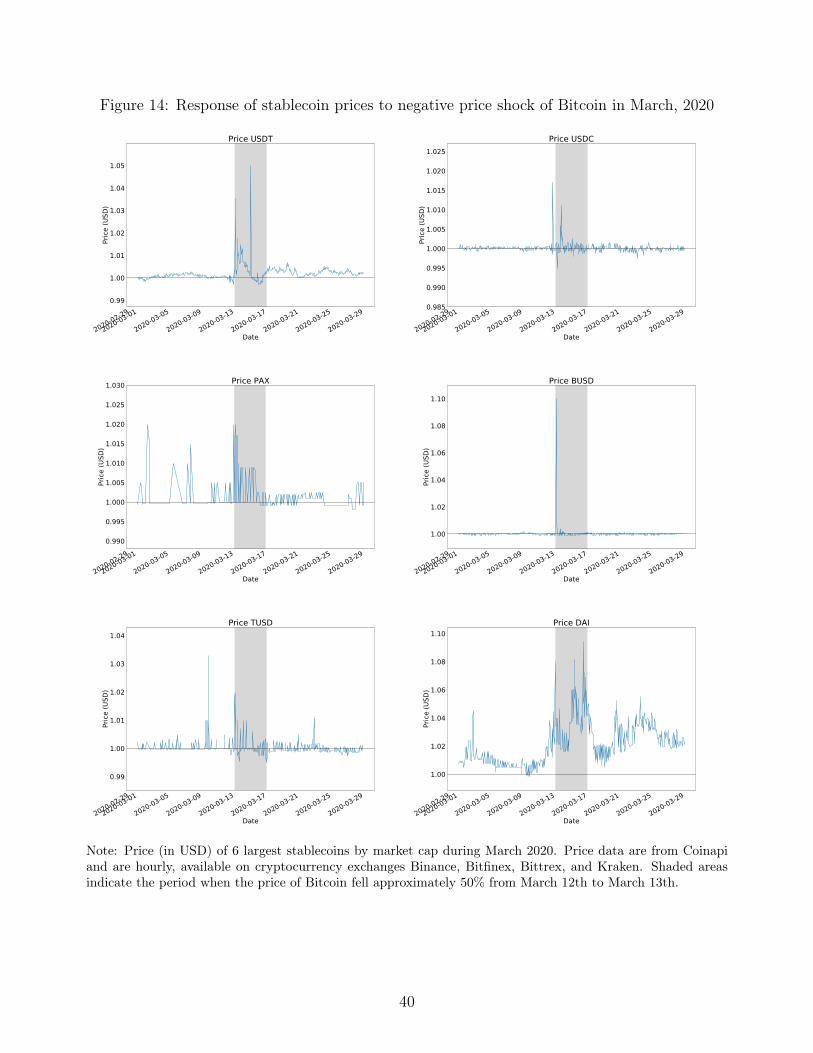
Figure 14: Response of stablecoin prices to negative price shock of Bitcoin in March, 2020
2020-02-29
2020-03-01
2020-03-05
2020-03-09
2020-03-13
2020-03-17
2020-03-21
2020-03-25
2020-03-29
Date
0.99
1.00
1.01
1.02
1.03
1.04
1.05
Price
(USD
)
Price USDT
2020-02-29
2020-03-01
2020-03-05
2020-03-09
2020-03-13
2020-03-17
2020-03-21
2020-03-25
2020-03-29
Date
0.985
0.990
0.995
1.000
1.005
1.010
1.015
1.020
1.025
Price
(USD
)
Price USDC
2020-02-29
2020-03-01
2020-03-05
2020-03-09
2020-03-13
2020-03-17
2020-03-21
2020-03-25
2020-03-29
Date
0.990
0.995
1.000
1.005
1.010
1.015
1.020
1.025
1.030
Price
(USD
)
Price PAX
2020-02-29
2020-03-01
2020-03-05
2020-03-09
2020-03-13
2020-03-17
2020-03-21
2020-03-25
2020-03-29
Date
1.00
1.02
1.04
1.06
1.08
1.10
Price
(USD
)
Price BUSD
2020-02-29
2020-03-01
2020-03-05
2020-03-09
2020-03-13
2020-03-17
2020-03-21
2020-03-25
2020-03-29
Date
0.99
1.00
1.01
1.02
1.03
1.04
Price
(USD
)
Price TUSD
2020-02-29
2020-03-01
2020-03-05
2020-03-09
2020-03-13
2020-03-17
2020-03-21
2020-03-25
2020-03-29
Date
1.00
1.02
1.04
1.06
1.08
1.10
Price
(USD
)
Price DAI
Note: Price (in USD) of 6 largest stablecoins by market cap during March 2020. Price data are from Coinapiand are hourly, available on cryptocurrency exchanges Binance, Bitfinex, Bittrex, and Kraken. Shaded areasindicate the period when the price of Bitcoin fell approximately 50% from March 12th to March 13th.
40

Figure 15: Response of Bitcoin prices and order flow in BTC/Stablecoin markets in March,2020
03-11 0003-11 12
03-12 0003-12 12
03-13 0003-13 12
03-14 004000
4500
5000
5500
6000
6500
7000
7500
8000
Price
(USD
)
Cumulative OF and Price:BTC_USDT BINANCE
30000
25000
20000
15000
10000
5000
0
Cum
ulat
ive
OF (E
TH)
2020-02-29
2020-03-01
2020-03-05
2020-03-09
2020-03-13
2020-03-17
2020-03-21
2020-03-25
2020-03-29
2020-04-014000
5000
6000
7000
8000
9000
Price
(USD
)
Cumulative OF and Price:BTC_USDC BINANCE
7000
6000
5000
4000
3000
2000
1000
0
Cum
ulat
ive
OF (B
TC)
2020-02-29
2020-03-01
2020-03-05
2020-03-09
2020-03-13
2020-03-17
2020-03-21
2020-03-25
2020-03-29
2020-04-014000
5000
6000
7000
8000
9000
Price
(USD
)
Cumulative OF and Price:BTC_PAX BINANCE
1400
1200
1000
800
600
400
200
0
Cum
ulat
ive
OF (B
TC)
2020-02-29
2020-03-01
2020-03-05
2020-03-09
2020-03-13
2020-03-17
2020-03-21
2020-03-25
2020-03-29
2020-04-014000
5000
6000
7000
8000
9000
Price
(USD
)
Cumulative OF and Price:BTC_BUSD BINANCE
3500
3000
2500
2000
1500
1000
500
Cum
ulat
ive
OF (B
TC)
2020-02-29
2020-03-01
2020-03-05
2020-03-09
2020-03-13
2020-03-17
2020-03-21
2020-03-25
2020-03-29
2020-04-014000
5000
6000
7000
8000
9000
Price
(USD
)
Cumulative OF and Price:BTC_TUSD BINANCE
3500
3000
2500
2000
1500
1000
500
0
Cum
ulat
ive
OF (B
TC)
2020-02-29
2020-03-01
2020-03-05
2020-03-09
2020-03-13
2020-03-17
2020-03-21
2020-03-25
2020-03-29
2020-04-01
100
125
150
175
200
225
250
Price
(USD
)
Cumulative OF and Price:ETH_DAI COINBASE
5000
0
5000
10000
15000
20000
25000
30000
35000
Cum
ulat
ive
OF (E
TH)
Note: Blue line indicates BTC price (in terms of stablecoin), and red line indicates cumulative order flow in BTC.Trade data for BTC/Stablecoin are from Coinapi and is hourly, available on cryptocurrency exchanges Binance,for the national-currency-backed coins USDT, USDC, PAX, BUSD, and TUSD. For crypto-collateralized DAI,we plot the Ethereum price and cumulative order flow in ETH/DAI market on the Coinbase exchange. Shadedareas indicate the period when the price of Bitcoin fell approximately 50% from March 12th to March 13th.
41

Stablecoin Discounts: Speculative Attacks
The event we consider is a classic example of a 2nd-generation currency crisis, in whicha perceived risk of the Tether Treasury not being fully backed leads to a sell-off on Tetheras investors perceive a non-zero probability that Tether may be devalued. The setting is anannouncement on 11th October, 2018, by the exchange Bitfinex. On that day, Bitfinex decidedto temporarily pause national-currency deposits (USD, GBP, EUR, JPY) for certain customeraccounts in the face of processing complications.43 This exchange is the first point of contactfor the Tether Treasury, so an announcement suppressing investors’ ability to redeem for USdollars can signal that Tether is not fully collateralized.
Figure 16: Flow of Dollar Deposits and USDT in a Speculative Attack
TetherTreasury
Bitfinex
Investor
USDT $ Deposit
$ Deposit
USDT
Note: Schematic illustrates the dynamics of a speculative attack. Investors have expectations that Tether is notfully backed by dollar reserves. In response, an investor redeems dollar deposits with Bitfinex. In turn, Bitfinexredeems its dollar deposits with the Tether Treasury, withdrawing Tether tokens from circulation.
Figure 16 helps understand the motive for Bitfinex suspending conversion to dollars. Sup-pose the Tether Treasury is not fully collateralized, and contains a level of dollar deposits thatis less than the amount of Tether in circulation. If investors believe the USDT peg is unsta-ble, they will redeem their Tether for dollar deposits at Bitfinex. Bitfinex will in turn wantto redeem their Tether for dollar deposits from the Tether Treasury. If the Tether Treasurysuspends Bitfinex’s conversion to dollar deposits, then this poses a systemic risk to Bitfinex.This suggests that Bitfinex is susceptible to a liquidity crisis in the event that Tether is notfully collateralized. Hence, the suspension of dollar convertibility in Bitfinex serves as a signal
43See https://medium.com/bitfinex/fiat-deposit-update-october-15th-2018-18ddd276c3fd.
42

to investors that Tether may not be fully collateralized.We can see the unfolding of this event on Tether’s dollar price, and on measures of liquidity,
in Figure 17. Tether prices fall to a discount of 95 cents on October 15th. Similarly, liquidityfundamentals such as volatility of USDT tell a similar story. There is a sharp rise in Tethertrading volume, and a corresponding decline in network transaction value, around the Bitfinexannouncement. This is consistent with a relative increase in return volatility as buyers andsellers of Tether are unsure of the fundamental trading price.
Bid-ask spreads rise significantly, with bid prices in the limit order book falling to 85 cents,indicating a lack of buyers. While the whole-sample average bid-ask spread is between 0.1and 0.15 of a cent, with a standard deviation of 0.2 cents, there are evident spikes in bid-askspreads, suggesting an information asymmetry in response to speculative events. In particular,the sharp fall in bid and ask prices corresponds to a spike in the width of the spread of 6 cents(600 basis points).
Figure 17: Tether/USD price, Trading Volume, Cumulative Order Flow, and Bid-Ask Spreads
2018-10-01
2018-10-05
2018-10-09
2018-10-13
2018-10-17
2018-10-21
2018-10-25
2018-10-29
2018-11-01
Date
0.96
0.97
0.98
0.99
1.00
USD
Price:
2018-10-01
2018-10-05
2018-10-09
2018-10-13
2018-10-17
2018-10-21
2018-10-25
2018-10-29
2018-11-01
Date
0
5
10
15
20
25
30
Freq
uenc
y
Trading Volume (Millions)
2018-10-01
2018-10-05
2018-10-09
2018-10-13
2018-10-17
2018-10-21
2018-10-25
2018-10-29
2018-11-01
Date
0.850
0.875
0.900
0.925
0.950
0.975
1.000
USD
bid and ask prices
2018-10-01
2018-10-05
2018-10-09
2018-10-13
2018-10-17
2018-10-21
2018-10-25
2018-10-29
2018-11-01
Date
0.00
0.01
0.02
0.03
0.04
0.05
0.06
USD
bid-ask spread
Note: Schematic illustrates the movement in Tether/USD price, bid-ask prices, spreads, and trading volumeduring October 2018. Transaction, bid, and ask prices from Coinapi trade and order-book data. Volume dataare from Cryptocompare. Sample period October 2018.
43

5 ConclusionThis paper examined the efficiency and mechanisms of how stablecoins work in the digital-
asset economy. Two fundamental questions were addressed. First, how does price stabilizationfunction in the case of stablecoins and does this process differ from the supply-driven (i.e.,central-bank-intervention-driven) process that applies when national currencies are pegged toone another? Second, what fundamentals account empirically for the premiums and discountsthat open up in Tether and other stablecoin markets?
We develop a model both to clarify the channels through which stablecoin premiums anddiscounts can arise and to provide other testable implications. A representative investor canuse dollars, stablecoins, or both as vehicle currencies through which they invest in a non-stablecryptoasset (e.g., Bitcoin). Stable-coin premiums can arise in the model due to relativelylow intermediation costs, which accords with actual market conditions since stablecoins useblockchains. Stablecoin premiums can also arise in the model by providing a hedge for non-stable cryptoassets. An arbitrage mechanism stabilizes the stablecoin price around the peg: inresponse to a deviation from the peg, the investor has an incentive to buy (sell) Tether fromthe primary market issuer at a one-for-one rate and sell (buy) Tether in the secondary marketwhen that price trades above (below) parity. These endogenous investor flows drive the priceof stablecoins toward its pegged value.
Empirically, we find that stablecoin issuance, the closest analogue to central-bank interven-tion, plays only a limited role in stabilization, pointing instead to the demand side as providingthe fundamental stabilizing forces, consistent with our model. In explaining deviations fromthe peg, we find that stablecoin premiums are due to coins’ uniqueness as a safe-haven assetwithin the digital-asset economy, citing evidence of significant premiums during the crash innon-stable cryptocurrencies in early 2018 and during the COVID-19 crisis, whereas stablecoindiscounts derive from both liquidity effects and collateral concerns.
Looking to the future, Facebook announced in 2019 its intention to launch Libra, a globalstablecoin. Our analysis sheds light on the mechanisms by which a global stablecoin like Libracan maintain its peg, in that case to a basket of currencies. Our findings indicate that adecentralized system of pegs can work well even when the primary issuer remains passive anddepends on demand-driven arbitrage to stabilize price around the peg. As stablecoins becomeeven more widely used, new mechanisms for stabilizing price around the peg will inevitablyarise. Introductions of forward and futures markets on stablecoins, for example, will attractarbitrage capital from regulated financial institutions, inducing still greater stability, so long asthe pegs remain fully credible and collateralized.
44

ReferencesAbadi, Joseph and Markus Brunnermeier, “Blockchain economics,” Technical Report, National
Bureau of Economic Research 2018.
Akram, Q Farooq, Dagfinn Rime, and Lucio Sarno, “Arbitrage in the foreign exchange market:Turning on the microscope,” Journal of International Economics, 2008, 76 (2), 237–253.
Baur, Dirk G and Lai T Hoang, “A Crypto Safe Haven against Bitcoin,” Finance Research Letters,2020, in press.
Benigno, Pierpaolo, Linda M Schilling, and Harald Uhlig, “Cryptocurrencies, currency compe-tition, and the impossible trinity,” Technical Report, National Bureau of Economic Research 2019.
Berentsen, Aleksander and Fabian Schär, “Stablecoins: The quest for a low-volatility cryptocur-rency,” 2019.
Bhambhwani, Siddharth, Stefanos Delikouras, and George M Korniotis, “Do FundamentalsDrive Cryptocurrency Prices?,” available at SSRN 3342842, 2019.
Biais, Bruno, Christophe Bisiere, Matthieu Bouvard, and Catherine Casamatta, “Theblockchain folk theorem,” The Review of Financial Studies, 2019, 32 (5), 1662–1715.
Bianchi, Daniele and Alexander Dickerson, “Trading Volume in Cryptocurrency Markets,” 2018.
Bindseil, Ulrich, “Tiered CBDC and the financial system,” 2020.
BIS, “Investigating the impact of global stablecoins,” 2019.
Bordo, Michael D and Andrew T Levin, “Central bank digital currency and the future of monetarypolicy,” Technical Report, National Bureau of Economic Research 2017.
Brunnermeier, Markus K, Harold James, and Jean-Pierre Landau, “The digitalization ofmoney,” Technical Report, National Bureau of Economic Research 2019.
Bullmann, Dirk, Jonas Klemm, and Andrea Pinna, “In search for stability in crypto-assets: Arestablecoins the solution?,” ECB Occasional Paper, 2019, (230).
Catalini, Christian and Joshua S Gans, “Some simple economics of the blockchain,” TechnicalReport, National Bureau of Economic Research 2016.
and , “Initial coin offerings and the value of crypto tokens,” Technical Report, National Bureauof Economic Research 2018.
Chamley, Christophe, “Dynamic speculative attacks,” American Economic Review, 2003, 93 (3),603–621.
45

Chen, Yuchin and Kenneth Rogoff, “Commodity currencies,” Journal of international Economics,2003, 60 (1), 133–160.
Chiu, Jonathan and Thorsten V Koeppl, “The economics of cryptocurrencies – bitcoin andbeyond,” Available at SSRN 3048124, 2017.
Cukierman, Alex, Itay Goldstein, and Yossi Spiegel, “The choice of exchange-rate regime andspeculative attacks,” Journal of the European Economic Association, 2004, 2 (6), 1206–1241.
Dell’Erba, Marco, “Stable Cryptocurrencies? Assessing the Case for Stablecoins,” New York Uni-versity Journal of Legislation and Public Policy, Forthcoming, 2019.
Dhawan, Anirudh and Talis Putnins, “A new wolf in town? Pump-and-dump manipulation incryptocurrency markets,” 2020.
Easley, David, Maureen O’Hara, and Soumya Basu, “From mining to markets: The evolutionof bitcoin transaction fees,” Journal of Financial Economics, 2019, 134 (1), 91–109.
Eichengreen, Barry, “From Commodity to Fiat and Now to Crypto: What Does History Tell Us?,”Technical Report, National Bureau of Economic Research 2019.
, Andrew K Rose, and Charles Wyplosz, “Speculative Attacks on Pegged Exchange Rates:An Empirical Exploration with Special Reference to the European Monetary System,” TechnicalReport, National Bureau of Economic Research 1994.
, , and , “Exchange market mayhem: the antecedents and aftermath of speculative attacks,”Economic policy, 1995, 10 (21), 249–312.
Engel, Charles and Kenneth D West, “Exchange rates and fundamentals,” Journal of PoliticalEconomy, 2005, 113 (3), 485–517.
Evans, Martin DD and Richard K Lyons, “Order Flow and Exchange Rate Dynamics,” Journalof Political Economy, 2002, 110 (1), 170–180.
Fatas, A., Economics of Fintech and Digital Currencies, VoxEU, 2019.
Fernández-Villaverde, Jesús, Daniel Sanches, Linda Schilling, and Harald Uhlig, “CentralBank Digital Currency: Central Banking For All?,” Technical Report, National Bureau of EconomicResearch 2020.
Ferreira, Alex Luiz, Arie Eskenazi Gozluklu, and Joao Mainente, “Central Bank Reserves andCurrency Volatility,” Available at SSRN 3409832, 2019.
Flood, Robert P and Olivier Jeanne, “An interest rate defense of a fixed exchange rate?,” Journalof International Economics, 2005, 66 (2), 471–484.
46
and Robert J Hodrick, “Real aspects of exchange rate regime choice with collapsing fixed rates,”Journal of International Economics, 1986, 21 (3-4), 215–232.
Florysiak, David and Alexander Schandlbauer, “The information content of ico white papers,”Available at SSRN 3265007, 2019.
Foucault, Thierry, Roman Kozhan, and Wing Wah Tham, “Toxic arbitrage,” The Review ofFinancial Studies, 2017, 30 (4), 1053–1094.
Fratzscher, Marcel, Lukas Menkhoff, Lucio Sarno, Maik Schmeling, and Tobias Stoehr,“Systematic Intervention and Currency Risk Premia,” Available at SSRN 3119907, 2019.
, Oliver Gloede, Lukas Menkhoff, Lucio Sarno, and Tobias Stöhr, “When is foreign exchangeintervention effective? Evidence from 33 countries,” American Economic Journal: Macroeconomics,2019, 11 (1), 132–56.
Froot, Kenneth A and Tarun Ramadorai, “Currency returns, intrinsic value, and institutional-investor flows,” The Journal of Finance, 2005, 60 (3), 1535–1566.
Gabaix, Xavier and Matteo Maggiori, “International liquidity and exchange rate dynamics,” TheQuarterly Journal of Economics, 2015, 130 (3), 1369–1420.
Gandal, Neil, JT Hamrick, Tyler Moore, and Tali Oberman, “Price Manipulation in theBitcoin Ecosystem,” Journal of Monetary Economics, 2018, 95, 86–96.
Goldstein, Itay, Deeksha Gupta, and Ruslan Sverchkov, “Initial coin offerings as a commitmentto competition,” Available at SSRN 3484627, 2019.
Griffin, John and Amin Shams, “Is Bitcoin Really Untethered?,” Journal of Finance, Forthcoming,2020.
Hale, Galina, Arvind Krishnamurthy, Marianna Kudlyak, Patrick Shultz et al., “Howfutures trading changed bitcoin prices,” FRBSF Economic Letter, 2018, 12, 1–5.
Hoang, Lai T and Dirk G Baur, “How stable are stablecoins?,” Available at SSRN 3519225, 2020.
Howell, Sabrina T, Marina Niessner, and David Yermack, “Initial coin offerings: Financinggrowth with cryptocurrency token sales,” Technical Report, National Bureau of Economic Research2018.
Itskhoki, Oleg and Dmitry Mukhin, “Exchange rate disconnect in general equilibrium,” TechnicalReport, National Bureau of Economic Research 2017.
Jordà, Òscar, “Estimation and inference of impulse responses by local projections,” American eco-nomic review, 2005, 95 (1), 161–182.
47
Kearns, Jonathan and Roberto Rigobon, “Identifying the efficacy of central bank interventions:evidence from Australia and Japan,” Journal of International Economics, 2005, 66 (1), 31–48.
Killeen, William P, Richard K Lyons, and Michael J Moore, “Fixed versus flexible: Lessonsfrom EMS order flow,” Journal of International Money and Finance, 2006, 25 (4), 551–579.
Klein, Michael W and Jay C Shambaugh, “Fixed exchange rates and trade,” Journal of Interna-tional Economics, 2006, 70 (2), 359–383.
Krugman, Paul, “A model of balance-of-payments crises,” Journal of Money, Credit and Banking,1979, 11 (3), 311–325.
Krugman, Paul R, “Target zones and exchange rate dynamics,” The Quarterly Journal of Economics,1991, 106 (3), 669–682.
Kumhof, Michael and Clare Noone, “Central bank digital currencies-design principles and balancesheet implications,” 2018.
Li, Tao, Donghwa Shin, and Baolian Wang, “Cryptocurrency Pump-and-Dump Schemes,” avail-able at SSRN, 2018.
Liu, Yukun, Aleh Tsyvinski, and Xi Wu, “Common risk factors in cryptocurrency,” TechnicalReport, National Bureau of Economic Research 2019.
and , “Risks and Returns of Cryptocurrency,” Technical Report, National Bureau of EconomicResearch 2018.
Makarov, Igor and Antoinette Schoar, “Price discovery in cryptocurrency markets,” in “AEAPapers and Proceedings,” Vol. 109 2019, pp. 97–99.
and , “Trading and arbitrage in cryptocurrency markets,” Journal of Financial Economics, 2020,135 (2), 293–319.
Morris, Stephen and Hyun Song Shin, “Unique equilibrium in a model of self-fulfilling currencyattacks,” American Economic Review, 1998, pp. 587–597.
Obstfeld, Maurice, “Balance-of-Payments Crises and Devaluation,” Journal of Money, Credit andBanking, 1984, 16 (2), 208–217.
Raskin, Max and David Yermack, “Digital currencies, decentralized ledgers and the future ofcentral banking,” in “Research Handbook on Central Banking,” Edward Elgar Publishing, 2018.
Sarno, Lucio and Mark P Taylor, “Official intervention in the foreign exchange market: Is iteffective and, if so, how does it work?,” Journal of Economic Literature, 2001, 39 (3), 839–868.
48

Schilling, Linda and Harald Uhlig, “Some simple bitcoin economics,” Journal of Monetary Eco-nomics, 2019, 106, 16–26.
Skeie, David R, “Digital currency runs.”
Sockin, Michael and Wei Xiong, “A model of cryptocurrencies,” Technical Report, National Bureauof Economic Research 2020.
Svensson, Lars EO, “An interpretation of recent research on exchange rate target zones,” Journal ofEconomic Perspectives, 1992, 6 (4), 119–144.
Tetherinc., “Tether: Fiat currencies on the Bitcoin blockchain,” 2016.
Vitale, Paolo, “Sterilised central bank intervention in the foreign exchange market,” Journal of In-ternational Economics, 1999, 49 (2), 245–267.
Wei, Wang Chun, “The impact of Tether grants on Bitcoin,” Economics Letters, 2018, 171, 19–22.
Yermack, David, “Is Bitcoin a Real Currency? An Economic Appraisal,” Handbook of Digital Cur-rency, 2015, pp. 31–43.
Zimmerman, Peter, “Blockchain structure and cryptocurrency prices,” 2020.
49

Appendices
A Data Appendix
We have four sources, each supporting a different aspect of our analysis.
1. Coinapi: Online subscription with access to open, high, low, close, and volume (OHLCV)trade data and order book data from multiple crypto exchanges.
2. Omniexplorer and Etherscan: Blockchain explorers that contain transaction dataof individual wallets, used to obtain new issuance/redemptions of stablecoin tokens tocompute flows of these tokens to the secondary market.
3. Cryptocompare: Price and trading volume data for currencies (based on a representa-tive list of crypto exchanges).
4. Coinmetrics: Provides fundamentals data on the network value, computing power ofcryptocurrency mining, and number of unique addresses.
Coinapi
Coinapi offers a monthly subscription with access to their data api which gives historicalcryptocurrency OHLCV, trade, and order book data. We outline in Table 8 the specific tradingpairs, coin symbols, and types of data that we employ. To use the api, we followed https:
//github.com/coinapi/coinapi-sdk, which gives sample code for querying the api.44 Thetrade data are used to construct order-flow data, as it has a boolean "taker_side_sell" variablethat is a seller-initiated transaction if True, and buyer-initiated if False. Orderbook data forexchanges are also provided, useful for bid and ask prices. To construct bid-ask spreads, wetake the highest bid and the lowest ask out of a set of 20 quotes for a specific time period,which gives us a lower bound for the bid-ask spread at any given point in time.
44Modifications were made to customize results; api requests are limited to 100,000 data points per day.
50

Table 8: Coinapi Data
Data Type Coin Symbol Exchange Sample Period
OHLCV, Trade and Order Book Data USDT_USD Kraken 04/17-03/20OHLCV, Trade and Order Book Data USDT_USD Bitfinex 12/18-03/20OHLCV, Trade and Order Book Data USDT_USD Bittrex 05/18-03/20
OHLCV USDC_USD Kraken 01/20-03/20OHLCV PAX_USD Bittrex 01/19-03/20OHLCV BUSD_USD Binance 10/19-03/20OHLCV TUSD_USD Bittrex 06/18-03/20OHLCV DAI_USD Bitfinex 04/18-03/20
OHLCV and Trade Data BTC_USDT Binance 08/17-03/20OHLCV and Trade Data BTC_USDC Binance 12/18-03/20OHLCV and Trade Data BTC_PAX Binance 11/18-03/20OHLCV and Trade Data BTC_BUSD Binance 09/19-03/20OHLCV and Trade Data ETH_DAI Coinbase 05/19-03/20
Where multiple cryptocurrency exchanges offer the same data, we choose the exchangethat (i) has the longest time series and (ii) is one of ten exchanges that has "trusted volume"according to a report filed by the SEC.45 The report tests exchanges for fraudulent activities(e.g., suspicious variability in bid-ask spreads, systematic patterns in histograms of transactionsize) and finds that the exchanges listed in Table 9 do not have the telltale patterns in tradingvolume or spreads. We note that of the ten exchanges, two do not offer an onramp for tradingnational currencies, Binance and Poloniex. Similarly, two platforms, Itbit and Bitflyer, onlyaccepted national currencies at the time the SEC report was written.
45See https://www.sec.gov/comments/sr-nysearca-2019-01/srnysearca201901-5164833-183434.pdf.
51

Table 9: Trusted Exchanges According to SEC Report
Exchange National Currencies Stablecoins
Binance N YBitfinex Y YBitstamp Y YBittrex Y YBitflyer Y NCoinbase Y YGemini Y YItbit Y N
Kraken Y YPoloniex N Y
Omniexplorer and Etherscan
We use this dataset to construct net flows from the stablecoin issuer to the secondarymarket. The addresses of the issuers are listed in Table 12. We follow Wei (2018) in obtainingtransactions of Tether grants (creation of new tokens) and revokes (redemptions) from theOmniexplorer api. Tether’s id is 31, and using the api call in Table 11, we retrieve the entirehistory of Grants and Revokes.46 Etherscan is an explorer of all transactions recorded on theEthereum blockchain, available at https://etherscan.io/. This includes transactions forTether and other national-currency-backed coins. The history of token grants and revokes isexportable to a data-readable format.
For Etherscan, we first need the contract address of each coin, which one can find bysearching the ticker id of the coin (USDT, USDC, PAX and TUSD) in the search portal onhttps://etherscan.io/. The contract addresses are listed in Table 10. To find the Etherscanaddress, you need the contract address of the coin, followed by the wallet address to get theentire history of transactions for a given wallet. For example, the contract address for USDCis 0xa0b86991c6218b36c1d19d4a2e9eb0ce3606eb48, and the wallet address for Tether grants is0x0000000000000000000000000000000000000000. Therefore, the Etherscan url for USDC grantsis given by: https://etherscan.io/token/0xa0b86991c6218b36c1d19d4a2e9eb0ce3606eb48?a=0x0000000000000000000000000000000000000000. The addresses for Tether Grants/Revokesof tokens are listed in Table 11, and the Treasury addresses of four coins are listed in Table12. (The only national-currency-backed coin that does not have a Treasury listed is TrueUSD.)We note that the addresses for Tether Grants for USDC, PAX, and TUSD are identical; when46Please refer to https://api.omniexplorer.info/ on how to obtain transaction histories.
52

searching for transactions of the grant address, each coin has a different contract address andso it is a unique identifier. Using the following data, we compute net changes in Tether incirculation to the secondary market as the level of token grants less redemptions. Similarly, wemeasure net flows in and out of the Tether Treasury wallet. Subtracing net flows into Treasuryfrom the net of grants and revokes of tokens gives a measure of total flows to the secondarymarket.
Table 10: Stablecoin Contract Addresses
Coin Blockchain Contract Address
USDT Etherscan 0xdac17f958d2ee523a2206206994597c13d831ec7USDC Etherscan 0xa0b86991c6218b36c1d19d4a2e9eb0ce3606eb48PAX Etherscan 0x8e870d67f660d95d5be530380d0ec0bd388289e1TUSD Etherscan 0x97A9F6F941b54c373cec38b8Dc7565CcDBbE75C6
Table 11: Stablecoin Issuer Wallet Addresses
Coin Blockchain Wallet Address
USDT Omni Explorer https://api.omniexplorer.info/v1/properties/gethistory/31USDT Etherscan 0xc6cde7c39eb2f0f0095f41570af89efc2c1ea828USDC Etherscan 0x0000000000000000000000000000000000000000PAX Etherscan 0x0000000000000000000000000000000000000000TUSD Etherscan 0x0000000000000000000000000000000000000000
Table 12: Stablecoin Issuer Wallet Addresses
Coin Blockchain Wallet Address
USDT Omni Explorer 1NTMakcgVwQpMdGxRQnFKyb3G1FAJysSfzUSDT Etherscan 0x5754284f345afc66a98fbb0a0afe71e0f007b949USDC Etherscan 0x55fe002aeff02f77364de339a1292923a15844b8PAX Etherscan 0x5195427ca88df768c298721da791b93ad11eca65TUSD Etherscan N/A
53

Cryptocompare
Cryptocompare provides public access to price and volume data based on volume-weightedaverages of price quotes and trades from 150 cryptocurrency exchanges, available via theirapi https://min-api.cryptocompare.com/.47 We use this resource to measure total tradedvolume in the Tether/USD and BTC/USD pairs. We also use cryptcompare to determine thedaily closing price of non-stable cryptocurrencies BTC, ETH, XRP, BCH, and LTC.
Coinmetrics
We use coinmetrics for the following series, based on the data dictionary available at https://coinmetrics.io/data-downloads, using the tickers listed in Table 13.
Hash Rate: The mean rate at which miners are solving hashes in a give time interval. Hashrate is the speed at which computations are being completed across all miners in the network.The unit of measurement varies depending on the protocol.
Number of Unique Addresses: The sum count of unique addresses that were active inthe network (either as a recipient or originator of a ledger change) in that time interval. Allparties in a ledger change-action (recipients and originators) are counted. Individual addressesare not double-counted if previously active.
Following Bhambhwani et al. (2019), we use the hash rate and number of unique addressesas fundamentals to model price determination of non-stable cryptocurrencies such as BTC andETH.
Table 13: Coinmetrics Indicators
Variable Ticker Pairs
Hash Rate HashRate BTC, ETHNumber of Unique Addresses AdrActCnt BTC, ETH
47For more detail on how quotes and traded volume are calculated, see: https://www.cryptocompare.com/media/27010937/cccagg_methodology_2018-02-26.pdf.
54

B Governance and Transparency Measures
We provide here more institutional detail on the transparency measures undertaken bystablecoins. Tether inc. acknowledges in its white paper that there are potential problems withthe security of its dollar deposits. It lists the following five points (Tetherinc., 2016):
1. We (Tether inc.) could go bankrupt
2. Our bank could go insolvent
3. Our bank could freeze or confiscate the funds
4. We could abscond with the reserve funds
5. Recentralization of risk to a single point of failure
Of the following points, Tether claims dollar deposits are still redeemable if Tether inc. goesbankrupt or becomes insolvent. For the third and fourth point, they state that their bank isfamiliar with holding cryptocurrency deposits, and that absconding with funds is unlikely dueto its public charter. The fifth point is the biggest issue with Tether, and that is, while Tetherin circulation is using a decentralized system of exchange by being on the blockchain, all dollardeposits are held in a centralized issuer. There is settlement risk if the dollar deposits arevulnerable to attack from an outside party. One way for Tether to mitigate the central pointof failure is by having sufficient reserves in its balance sheet. This point is tackled differentlyby newer stablecoins, e.g., Paxos, which has FDIC-insured deposits, and USDC tokens viadecentralization of the issuer with multiple licenses to create tokens, and finally by protectingcounterparty risk through the use of escrow accounts.
The main transparency measure undertaken by Tether is the publication of its daily balancesheet. As stated in the Tether White Paper (Tetherinc., 2016), Tether follows a "proof of re-serves" process in which they account for all liabilities (Tether in circulation) on the blockchain.This includes all platforms Tether currently trades on, the three main platforms being Omniexplorer, Ethereum, and Tron according to its balance sheet in April, 2020. Every Tether incirculation is backed, in principle, by a dollar deposit. Tether inc. releases a daily balancesheet reporting their total dollar deposits. For example, on April 2nd, 2020, their balancesheet, according to https://wallet.tether.to/transparency, says the Total Assets, whichis the bank deposits, is equal to $6,480,678,611.74, and total Tether in circulation is given by$6,349,160,932.47. The excess of assets over liabilities is $131,517,679.27. As a percentage oftotal assets, that is approximately 2%. We note that this matches very roughly what a risk-freerate would yield annually on fixed-income instruments.48
48While not explicit about their interest-bearing assets, the following article documents that Tether does earninterest on its dollar deposits: https://cryptobriefing.com/tether-interest-stablecoins/.
55
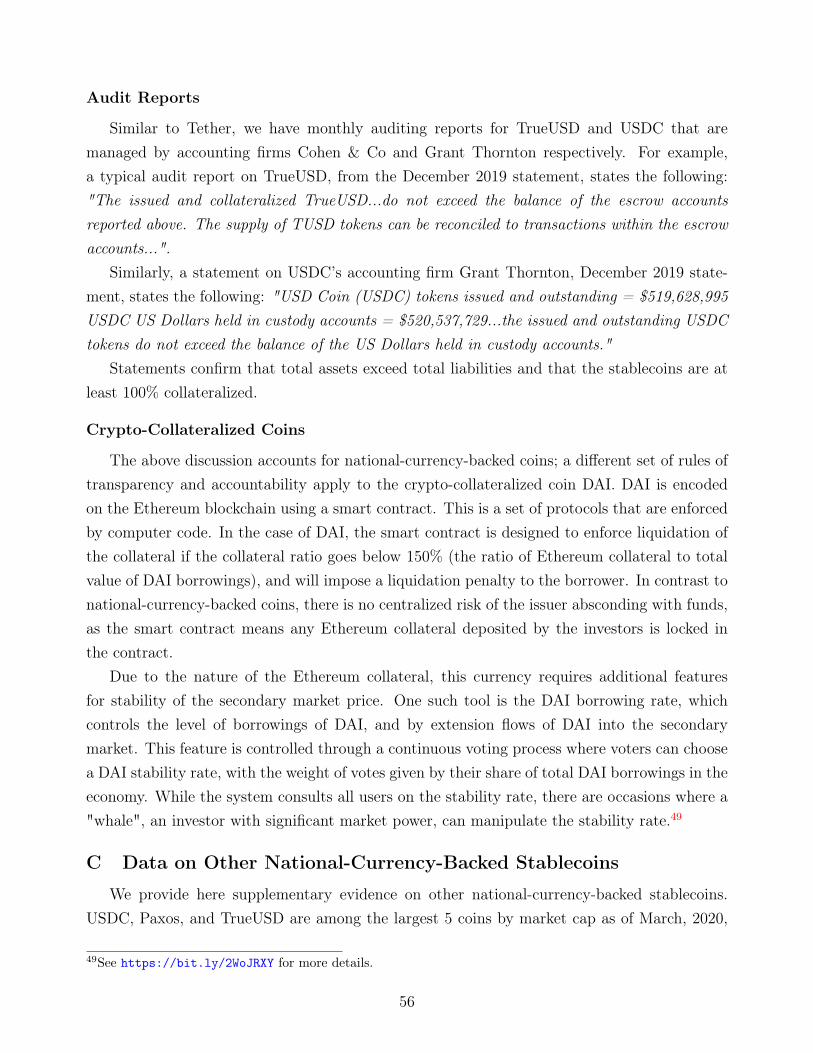
Audit Reports
Similar to Tether, we have monthly auditing reports for TrueUSD and USDC that aremanaged by accounting firms Cohen & Co and Grant Thornton respectively. For example,a typical audit report on TrueUSD, from the December 2019 statement, states the following:"The issued and collateralized TrueUSD...do not exceed the balance of the escrow accountsreported above. The supply of TUSD tokens can be reconciled to transactions within the escrowaccounts...".
Similarly, a statement on USDC’s accounting firm Grant Thornton, December 2019 state-ment, states the following: "USD Coin (USDC) tokens issued and outstanding = $519,628,995USDC US Dollars held in custody accounts = $520,537,729...the issued and outstanding USDCtokens do not exceed the balance of the US Dollars held in custody accounts."
Statements confirm that total assets exceed total liabilities and that the stablecoins are atleast 100% collateralized.
Crypto-Collateralized Coins
The above discussion accounts for national-currency-backed coins; a different set of rules oftransparency and accountability apply to the crypto-collateralized coin DAI. DAI is encodedon the Ethereum blockchain using a smart contract. This is a set of protocols that are enforcedby computer code. In the case of DAI, the smart contract is designed to enforce liquidation ofthe collateral if the collateral ratio goes below 150% (the ratio of Ethereum collateral to totalvalue of DAI borrowings), and will impose a liquidation penalty to the borrower. In contrast tonational-currency-backed coins, there is no centralized risk of the issuer absconding with funds,as the smart contract means any Ethereum collateral deposited by the investors is locked inthe contract.
Due to the nature of the Ethereum collateral, this currency requires additional featuresfor stability of the secondary market price. One such tool is the DAI borrowing rate, whichcontrols the level of borrowings of DAI, and by extension flows of DAI into the secondarymarket. This feature is controlled through a continuous voting process where voters can choosea DAI stability rate, with the weight of votes given by their share of total DAI borrowings in theeconomy. While the system consults all users on the stability rate, there are occasions where a"whale", an investor with significant market power, can manipulate the stability rate.49
C Data on Other National-Currency-Backed Stablecoins
We provide here supplementary evidence on other national-currency-backed stablecoins.USDC, Paxos, and TrueUSD are among the largest 5 coins by market cap as of March, 2020,
49See https://bit.ly/2WoJRXY for more details.
56

and are national-currency-backed like Tether. They differ from Tether: USDC decentralisesthe primary issuer to have multiple issuers with licenses to create USDC tokens; Paxos dollardeposits are insured by FDIC banks; and TrueUSD uses a system of escrow accounts in transac-tions between investors and the stablecoin issuer. All of these systems claim to be 100% backedby US dollar collateral.
We subdivide this section into the following:
1. Transaction prices and histograms showing a two-sided distribution of deviations.
2. Balance sheets and secondary market flows.
Transaction Price and Histogram of Deviations
We plot transaction-price deviations from the peg for USDC, Paxos, and TrueUSD. Dataare from Coinapi for all coins. We make two general observations based on the following Figures18, 19, and 20. The first is that deviations are two-sided – these stablecoins trade at both apremium and a discount to the dollar parity peg. The second observation is that deviations aretypically persistent, and as indicated in section 1, we note a half-life of deviations that rangesfrom 5 to 10 days for most coins.
Figure 18: USDC/USD Deviations from Peg and Histogram of Deviations
2020-01-15
2020-02-01
2020-02-15
2020-03-01
2020-03-15
2020-04-01
Date
0.002
0.000
0.002
0.004
0.006
0.008
0.010
USD
Deviations from Peg: USDC
0.0200.015
0.0100.005
0.0000.005
0.0100.015
0.020
USD
0
500
1000
1500
2000
2500
Freq
uenc
y
Deviations from Peg: USDC
Note: Figure plots deviations of the USDC peg from parity (left panel). A positive deviation indicates USDCtrades at a premium. Right panel is a histogram of deviations of the USDC peg. Data from Coinapi. Sampleis January 2020 to March 2020.
57
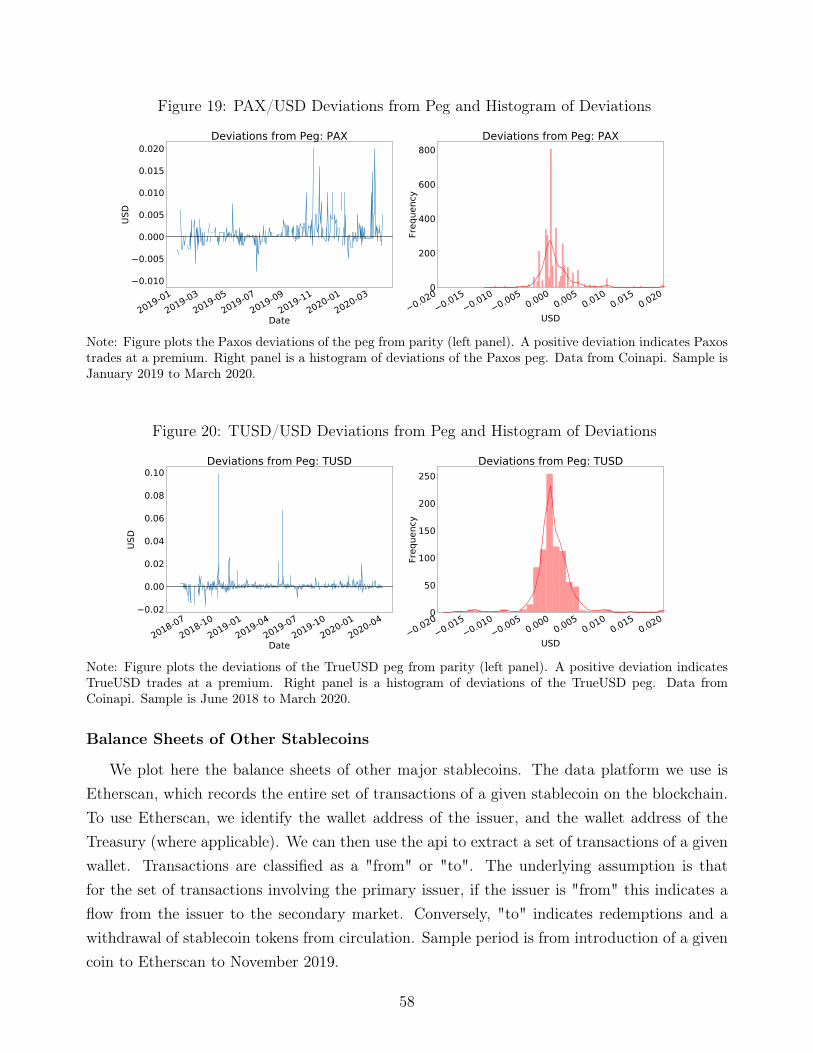
Figure 19: PAX/USD Deviations from Peg and Histogram of Deviations
2019-012019-03
2019-052019-07
2019-092019-11
2020-012020-03
Date
0.010
0.005
0.000
0.005
0.010
0.015
0.020
USD
Deviations from Peg: PAX
0.0200.015
0.0100.005
0.0000.005
0.0100.015
0.020
USD
0
200
400
600
800
Freq
uenc
y
Deviations from Peg: PAX
Note: Figure plots the Paxos deviations of the peg from parity (left panel). A positive deviation indicates Paxostrades at a premium. Right panel is a histogram of deviations of the Paxos peg. Data from Coinapi. Sample isJanuary 2019 to March 2020.
Figure 20: TUSD/USD Deviations from Peg and Histogram of Deviations
2018-072018-10
2019-012019-04
2019-072019-10
2020-012020-04
Date
0.02
0.00
0.02
0.04
0.06
0.08
0.10
USD
Deviations from Peg: TUSD
0.0200.015
0.0100.005
0.0000.005
0.0100.015
0.020
USD
0
50
100
150
200
250
Freq
uenc
y
Deviations from Peg: TUSD
Note: Figure plots the deviations of the TrueUSD peg from parity (left panel). A positive deviation indicatesTrueUSD trades at a premium. Right panel is a histogram of deviations of the TrueUSD peg. Data fromCoinapi. Sample is June 2018 to March 2020.
Balance Sheets of Other Stablecoins
We plot here the balance sheets of other major stablecoins. The data platform we use isEtherscan, which records the entire set of transactions of a given stablecoin on the blockchain.To use Etherscan, we identify the wallet address of the issuer, and the wallet address of theTreasury (where applicable). We can then use the api to extract a set of transactions of a givenwallet. Transactions are classified as a "from" or "to". The underlying assumption is thatfor the set of transactions involving the primary issuer, if the issuer is "from" this indicates aflow from the issuer to the secondary market. Conversely, "to" indicates redemptions and awithdrawal of stablecoin tokens from circulation. Sample period is from introduction of a givencoin to Etherscan to November 2019.
58

Figure 21: Balance Sheet for USDC, Paxos, and TrueUSD
2018-092018-11
2019-012019-03
2019-052019-07
2019-092019-11
Date
0.0
0.1
0.2
0.3
0.4
0.5
amou
nt (B
illion
s USD
)
USDC Balance SheetSecondary MarketUSDC Treasury
2018-092018-11
2019-012019-03
2019-052019-07
2019-092019-11
Date
0.00
0.05
0.10
0.15
0.20
0.25
amou
nt (B
illion
s USD
)
Paxos Balance SheetSecondary MarketPaxos Treasury
2018-042018-07
2018-102019-01
2019-042019-07
2019-102020-01
Date
0.00
0.05
0.10
0.15
0.20
0.25
amou
nt (B
illion
s USD
)
TrueUSD Balance SheetSecondary Market
Note: Figure plots the balance sheet of USDC, Paxos, and TrueUSD. Balance-sheet data from Etherscan.
Arbitrage Flows
We estimate the following regression in equation 24 (h equals 0,1,2, ...) to test the stabilizingeffect of arbitrage flows on the pegs. The results for Paxos and TrueUSD in Figure 22 suggesta stabilizing effect, on the order of 40 basis points for Paxos and 20 basis points for TrueUSD(for a one-standard-deviation shock in order flow).50
Pt+h − Pt−1 = α + βhFlowT→EX +4∑
k=1
δkFlowT→EX,t−k +4∑
k=1
γk(Pt−k−1 − Pt−k−2) + ut (24)
50We do not report results for USDC as our price data currently do not go back far enough, unlike the othertwo coins.
59

Figure 22: Response of Paxos (left panel) and TrueUSD (right panel) Prices to a Unit StandardDeviation of Flows to the Secondary Market
0 10 20 30 40 50 60days
60
40
20
0
20
basis
poi
nts
PAX price response to Arbitrage Flows (1std)
0.0 2.5 5.0 7.5 10.0 12.5 15.0 17.5 20.0days
35
30
25
20
15
10
5
0
basis
poi
nts
TrueUSD price response to 1 std Flows to Exchange
Note: Figure documents the effect of a 1 standard deviation shock to net secondary market flows on the priceof Paxos and TrueUSD. Data for secondary-market flows from Etherscan. Price data from Coinapi. Sampleis January 2019 to March 2020 in left panel, and June 2018 to March 2020 in right panel. Gray area denotestwo-standard-error bands for statistical significance at the five-percent level.
D Crypto-Collateralized Stablecoins
In this section we detail the stability mechanisms of DAI, a stablecoin backed by Ethereumcollateral. Similar to other national-currency-backed coins, DAI exhibits a two-sided distribu-tion of stablecoin prices, illustrated in Figure 23.
Figure 23: DAI/USD Deviations from Peg and Histogram of Deviations
2018-042018-07
2018-102019-01
2019-042019-07
2019-102020-01
2020-04
Date
0.04
0.02
0.00
0.02
0.04
0.06
0.08
USD
Deviations from Peg: DAI
0.04 0.02 0.00 0.02 0.04
USD
0
10
20
30
40
50
60
70
Freq
uenc
y
Deviations from Peg: DAI
Note: Figure plots the deviations of the DAI/USD peg from parity (left panel). A positive deviation indicatesDAI/USD trades at a premium. Right panel presents a histogram of deviations of the DAI/USD peg. Data areCoinapi. Sample is April 2018 to March 2020.
The steps that increase DAI supply involve depositing a set amount of Ethereum collateralinto a collateralized debt position. Based on the value of Ethereum collateral, the investor canborrow a fraction of their collateral as DAI tokens. There is a limit on how much DAI one can
60

borrow. The safe ratio of collateral is considered by many market practitioners to be 300%. Theminimum collateral ratio required is 150%. If the collateral ratio falls below 150%, the smartcontract will trigger a liquidation.51 In this event, the investor is required to repay the debt ofDAI tokens using their remaining collateral, as well as pay a liquidation penalty. In general,investors are incentivized to maintain a stable collateral ratio of 300%. If the value of Ethereumprices fall, then an investor can either inject more Ethereum collateral, or alternatively redeemDAI, in order to maintain their level of collateral.
These incentives of the liquidation system and enforcement of smart contracts make it lesslikely that extreme price events in Ethereum will cause significant deviations from DAI/USDparity. An equally central question for stabilisation is what tools can be used when a coin likeDAI trades systematically above or below parity. For national-currency-backed coins there isan arbitrage motive for investors in the event of a difference between the peg and the secondarymarket rate. However, in the case of DAI there is no similar arbitrage motive because thereal-time value of the underlying collateral that would be released or absorbed is uncertain.
For example, suppose DAI trades at a dollar price above 1. If an investor buys Ethereumfor dollars, then deposits that Ethereum as collateral and borrows DAI, then sells DAI in thesecondary market for dollars, and finally closes out their position (by buying back DAI andexchanging that for their Ethereum collateral), they could lose money if the market value ofEthereum in dollars has fallen over the latency period. Given the market price of Ethereumagainst the USD exhibits considerable volatility, valuation losses on their Ethereum can easilydwarf deviations of the DAI secondary-market price from the peg.
Accordingly, crypto-collateralized coins use additional tools to maintain the peg. One toolthat is used is the stability fee. Implemented by the MAKER DAO protocol, the stability feeis managed by the issuer of DAI tokens, and is effectively an interest rate on borrowing DAItokens. This is analogous to a central bank managing interest rates. We document plots of thestability fee and the DAI/USD price in Figure 24. A critical difference from a national centralbank is the voting structure. While central banks typically have a centralised arrangement forsetting rates, DAI has a decentralised, continuous-voting procedure for approval of a stability-fee (i.e., rate) change. Voters can choose from a range of options for the stability rate, and ifthe number of votes surpasses the number of votes for the prior decision, the stability rate willchange.52
51A smart contract is a set of instructions in computer code that defines the conditions of the contract for eachcounterparty under different scenarios (default etc.). Being managed by computer code and visible on theblockchain, it can be verified publicly by all nodes on the blockchain.
52Voting can be influenced by whales, i.e. voters with market power. A recent stability-rate change in October28, 2019, was influenced largely by one voter with a significant holding of DAI, and had a near 50% share ofthe total number of votes.
61

Figure 24: DAI Stability Fee (blue) and DAI/USD Price (red)
2018-052018-07
2018-092018-11
2019-012019-03
2019-052019-07
2019-0920
15
10
5
0
5
10
15
20
Stab
ility
Fee
(% p
.a.)
Stability Fee and DAI-USD Price
0.94
0.96
0.98
1.00
1.02
1.04
1.06
DAI p
rice
(USD
)
Note: Figure illustrates the stability fee (blue) and the DAI/USD price (red). Stability fee is expressed as arate on borrowing DAI, sourced from Maker DAO api. DAI/USD data are from Coinapi. Sample is April 2018to September 2019.
Given a higher DAI stability rate raises the cost of borrowing DAI, the intention of thestability rate is to reduce growth of DAI in circulation. This will be a combination of redemp-tions of existing DAI borrowed, and reductions in future growth of new Ethereum collateral byinvestors when generating DAI tokens. By reducing supply, all else equal, this will lead to arise in the price of DAI.
On November 16th, 2019, MakerDAO introduced a multi-collateral DAI as well as retainingthe single-collateral version (which has been renamed SAI and is planned to phase out bythe end of 2020). Now investors can choose to diversify their basket of collateral to reduceidiosyncratic risk of a single cryptoasset, such as Ethereum. This is a natural direction forevolution in crypto-collateralization as future coins like Facebook’s Libra consider pegging tocurrency baskets rather than a single currency such as the US dollar.
62