
2014 CALIFORNIA ASSESSMENT OF STUDENT PERFORMANCE AND PROGRESS (CAASPP) ELEMENTARY & MIDDLE SCHOOLS.

What is the progress in elementary education participation in India during the last two decades?
An Analysis using NSS Education rounds
Deepa Sankar Education Economist
South Asia Human Development
The World Bank
April 2007
Abstract Last two decades have seen intense efforts by government to expand the provision and improve the infrastructure for elementary education in India, complemented by the emergence of increasing and diverse private sector provisions. In this paper, using National Sample Survey data for four time periods since 1986-87, the aim is to examine whether there has been any evidence of increased participation in elementary education. The analysis shows that the number of children participating in elementary education has improved, and the improvements are more visible among children from rural areas, educationally lagging states, girls and those from the socially and economically disadvantaged groups. While private sector capture has been increasing, government is still the major provider, and especially so for children from marginalized groups. At the same time, the analysis also points to the persisting gaps in participation, completion and transition among children from the disadvantaged groups, in spite of the progress, especially during the last decade or so.

What is the progress in elementary education participation in India during the last two decades?
An Analysis using NSS Education rounds Introduction Elementary education is a subject in the concurrent list of Indian constitution, but the major responsibility of providing education is with the provinces, which were at different levels of educational development to begin with and whose efforts and investments varied over time. As a result, the development of education outputs and outcomes varied across states and within states across regions and districts. Besides this, the benefits were accrued by different population in a varied manner. However, in mid-1980s, with the introduction of the New Education Policy in 1986 which recognized the inadequacy of investments in education sector, especially in the elementary education sector, it was envisaged to increase expenditure on education to at least 6% of GDP. At the international level, ever since the World Conference on Education for All held at Jomtien, Thailand in March 1990, importance of education for development was further upheld. Correspondingly there was a revival of commitment of the governments, international organizations and the societies at large to education in general and primary education in particular.
This intention was reaffirmed again by the Central and State governments in early 1990s in spite of the fiscal crisis that erupted that decade1. Taking into account the differential revenue generating capacity of various Indian states, their varying levels of ability to spent the money on social sectors and the varying backlog of educational needs among these states, the Central governments also recognized the need to transfer substantial volume of funds from its kitty to the state governments through various general purpose transfers and specific purpose transfers. Thus, specific purpose transfers2 for elementary/ secondary education, especially in the Indian context, was required to offset horizontal imbalances- specifically since the social sector goals ought to be equity oriented and in education, there is a need to ensure that all children get at least basic education with quality learning. Centrally Sponsored Schemes such as DPEP and SSA are such specific purpose transfers. The aim of such expenditures is to increase the impetus on creating infrastructure and other basic environments to ensure participation of all children in the education process.
There have been various education projects both at the Central level as well as at the state levels since 1986 and the introduction of the New Education Policy. Since mid-1990s, 1 The fiscal crisis of early 1990s led to a series of economic reforms, important among which were steps initiated to reduce the fiscal deficit and contain growth in public expenditure, especially in social sectors. 2 Central funds are earmarked for particular sector or program. The Centre transfers money through specific purpose grants (called the Centrally Sponsored Schemes (CSS)) for schemes drawn up by the Centre which are to be implemented by the states. These schemes may be 100% financed by the Centre or may involve a matching grant from the state in ratios specified in the scheme.
external agencies – both bilateral and multilateral agencies, including the World Bank, DfID and EC started engaging actively in the education sector projects in India, starting with UP Basic Education Projects and the DPEPs. Ideally, an analysis of the education sector development in the country should include all possible sources of information. An evaluation of the impact of particular interventions should be made in the context of the counterfactual. However, most of these projects3 were inter-related, over-lapping each other and continuous in nature, which made comparing with counterfactual irrelevant / impossible and thus, isolating the impact of any of these many projects/ programs difficult. However, it should not be assumed that in the absence of any provision for such estimation of exclusive impacts of programs the value addition of the programs cannot be measured and hence should not demerit the associated efforts.
The aim of this analysis is not to evaluate any specific programs, but to see the overall momentum created in the country for elementary education development and trends over the last two decades. Given the complexity of education issues analyzed here, and limited data base for period prior to the 1980s, this analysis is restricted to the trends since 1986, the year in which the New Education Policy (1986) was introduced.
This analysis of National Sample Survey data for available points of time is analyzed to find out the trends in the share and number of children not attending schools, children attending different type of schools, those who complete different stages of education and the transition to the higher stages. For the analysis, we have used the National Sample Survey Organization’s education and employment rounds since 1986. The 42nd round covered information during 1986/874, while 52nd round covered the year 1995/96, 55th round dealt with the year 1999/2000 and 61st round, 2004/05. In the first part, an analysis of the data using the 42nd, 52nd and 61st rounds wherein the progress during specific periods will be analyzed, including the disaggregated analysis of public and private provisions. In the second part, same analysis, without the disaggregation of public and private will be carried out for the period 1999/2000 (using 55th round) and 2004/05 (using the 61st round) to see the changes during the last five years.
Analytical questions Is the number of children not attending school declining? Is there an increase in
attendance5 from 1986/ 87 to 2004/05?
If there is an increase in attendance in absolute numbers, is it really a mere reflection of increasing child population or an increase over and above the population growth rates?
3 See Bashir, Sajitha (2000) for a detailed analysis of various Centrally Sponsored Schemes in elementary education in India. 4 1986/87 is the first data set available from NSS household survey which allows for periodic comparison. It is therefore taken as baseline. 5 Some NSS rounds collect information on “current attendance” in educational institution and the course of study rather than enrolments (for example, NSS 55th round on employment and unemployment. So attendance is used rather than enrolment in this analysis. Moreover, attendance subsumes enrolment and is therefore more appropriate indicator of school participation.

If there is an increase in attendance in real terms, is it in gross terms or net terms?
What is the disaggregated picture by gender, social groups, income groups and public private provision?
Is there any improvement in students completing primary education during the period? If yes, what is the improvement in transition rates? What is the picture at the disaggregated level?
This paper is an attempt to answer these questions using data on participation in education available from the NSS rounds.
Section 1. What are the trends in children not- attending school?
a. Overall Trends
Universal Elementary Education goals require children in the age group of 6-13 years attend school. However, half of the children in the age group were out-of-school at the beginning of 1980s. The NSS data collect information on children’s “current attendance” rather than on “enrolments”, especially those rounds which deals with employment and unemployment. Hence, to synchronize with the NSS definitions, this analysis uses the term children “attending” and “not attending” schools rather children enrolled in schools and out-of-school.
Again, ideally proportion / shares or percentage growth figures are fine for measuring outcomes, in this analysis, both absolute numbers as well as shares are used. This is because of the fact that the analysis compares variety of sub-groups and in such cases, often shares and growth camouflages some of the realities in a country as heterogeneous and diversified as India.
The analysis of NSS data shows that there has been a reduction in the number of children not attending school as well as their share in the total child population. See graphs 1.a and 1.b. Not only did the absolute number of children “not attending school” decreased, but, the pace of reduction in the share of children not attending was fast enough to offset the increase in population growth. See graph 2. Graph 1a Graph 1b
Reduction in the no. of children not attending school: 1986/87 to 2004/05
010203040506070
6-13 yrs children notattending
6-10 yrs: children notattending
11-13 yrs: childrennot attending
Mill
ions
No
of O
OSC
42nd rd: 1986/87 52nd rd: 1995/96 61st rd: 2004/05
Reducation in the share of Children not attending:1986/87 to 2004/05
0%5%
10%15%20%25%30%35%40%45%
% 6-13 yrs not attenidng % 6-10 yrs not attending % 11-13 yrs not attending
% o
f chi
ldre
n no
t atte
ndin
g sc
hool
42nd rd: 1986/87 52nd rd: 1995/96 61st rd: 2004/05

Graph 2
Compound growth rate in child population and children not attending school
-9.0%
-7.0%
-5.0%
-3.0%
-1.0%
1.0%
3.0%
6-10 age group 11-13 age group 6-13 age group 6-10 age group 11-13 age group 6-13 age group
Population growth rate Reduction in children not attending
1986/87 to 1995/96 1995/96 to 2004/05
The growth of reduction in the number and share of children not attending school was faster during the last decade (1995/96 -2004/05), but particularly more so during the five years since the year 2000. If the pace of reduction in the number of children not attending school during 1995/96 to 1999/2000 were to be extrapolated to 2004/05, the gains in terms of actual reduction in the number of children not- attending school in the age group of 6-13 years is around 10 million (after adjusting for the reducing pace of population growth). See graph 3.
Similarly, the fraction of children not-attending school reduced considerably during 1999/2000 to 2004/05 period, much below the figures projected from the trends during 1995/96 to 1999/2000 period that the net gains amount to around 7%. See graph 4.
Graph 3 Number of children not attending school: Trends during the last decade
020406080
100120140160180200
1995
/96
1996
/97
1997
/98
1998
/99
1999
/00
2000
/01
2001
/02
2002
/03
2003
/04
2004
/05
Mill
ions
total child population in 6-13 years age groupNumber of children in the age group of 6-13 years not attendingNumber of children not attending - if the trend till 2000 had continuedLinear (Number of children in the age group of 6-13 years not attending)Linear (total child population in 6-13 years age group)

Graph 4
Percentage share of children in total population not attending school
0%
5%
10%
15%
20%
25%
30%
35%
40%
1995/96 1996/97 1997/98 1998/99 1999/00 2000/01 2001/02 2002/03 2003/04 2004/05
Reduction between 1995/96 & 1999/2000Reduction between 1999/2000 & 2004/05Linear (Reduction between 1995/96 & 1999/2000)Linear (Reduction between 1999/2000 & 2004/05)
7%
b. Who are the children still not attending?
While children out of school today are found across the country, there are a few pockets /categories where these children are mostly concentrated. However, compared to the number of children who did not attend school and their share in total population a couple of decades ago, there has been tremendous progress among these groups, but still proportionately more children are out of school. An analysis of children not-attending in these particular groups is analyzed in a disaggregated fashion below.
Graph 5
Share of Children not attending in rural and urban India
0%
10%
20%
30%
40%
50%
60%
42nd rd:1986/87
52nd rd:1995/96
61st rd:2004/05
42nd rd:1986/87
52nd rd:1995/96
61st rd:2004/05
42nd rd:1986/87
52nd rd:1995/96
61st rd:2004/05
6-10 years age group 11-13 years age group 6-13 years age group
% of children not attending in total % of children not attending among Rural
% of children not attending among Urban
Rural Children: Rural children account for a proportionately larger share of the children not-attending school compared to their share in total population as well in comparison with the shares in urban children (share of rural in population was 78% while share of rural in children not attending in total children not attending was 86% in 2004/05). However, this does not mean that there has been no progress in the reduction of children not-attending school in rural areas. The share of children not attending school in rural has

come down from 47% in mid 1980s to 14% in 2004/05. In urban, the corresponding decline was from 23% to 8%. However, gains during 1999/2000 to 2004/05 were more than that extrapolated using the trend patterns for the period prior to this. See graph 5 and graph 6.
Graph 6
Trends in the reduction of children 6-13 years not attending schools in rural and urban areas
0%
5%
10%
15%
20%
25%
30%
35%
1995/96 1996/97 1997/98 1998/99 1999/00 2000/01 2001/02 2002/03 2003/04 2004/05
Rural: 1995/96 - 1999/2000 Rural: 1999/2000 - 2004/05Urban: 1995/96 - 1999/2000 Urban: 1999/2000 - 2004/05Linear (Urban: 1995/96 - 1999/2000) Linear (Rural: 1995/96 - 1999/2000)
Girls: The overall percentage of children not-attending school have been on the decline during the last two decades, whether it is boys or girls. However, the progress in terms of the reduction in numbers has been faster among girls, and among girls, younger girls (6-10 years old) than among older girls (11-13 years). Since the sex ratio is already skewed in favor of boys, even the slightly larger share of children not attending school would further skew the proportion of boys and girls within those who attend schools. See graph 7. During the period 1995/96 to 1999/2000, the pace of decline was faster among girls compared to boys, but the actual reduction since 1999/2000 upto 2004/05 (as percentage of total number of children) among both boys and girls far exceeded the trends extrapolated from 1995-96 – 1999-2000 trends. See graph 8.
Graph 7
Reduction in the number of boys and girls not attending school
0
5
10
15
20
25
42nd round 52nd round 61st round 42nd round 52nd round 61st round
6-10 years age group 11-13 years age group
Mill
ions
Boys Girls

Graph 8
Trends in the reduction of children 6-13 years not attending school : By gender
0%
5%
10%
15%
20%
25%
30%
35%
40%
1995/96 1996/97 1997/98 1998/99 1999/00 2000/01 2001/02 2002/03 2003/04 2004/05
boys: 1995/96 - 1999/2000 boys: 2004/05
girls: 1995/96 - 1999/2000 girls: 2004/05
Linear (boys: 1995/96 - 1999/2000) Linear (girls: 1995/96 - 1999/2000)
SC and ST children: While the number of children not-attending has reduced systematically in all communities, the reduction was faster among SC and ST. However, the share of children not-attending school is still largest among SC and ST, particularly among ST, compared to non-SC/ST communities. See graph 9. The pace of reduction in children not attending was faster among ST compared to other groups, and the pace of reduction in all groups during 1999/2000 – 2004/05 far exceeded the trends projected using the trends during 1995/96 – 1999/2000 period. See graph 10.
Graph 9
% of Children not attending among SC/ST and others
0%
10%
20%
30%
40%
50%
60%
70%
42nd rd:1986/87
52nd rd:1995/96
61st rd:2004/05
42nd rd:1986/87
52nd rd:1995/96
61st rd:2004/05
42nd rd:1986/87
52nd rd:1995/96
61st rd:2004/05
6-10 years age group 11-13 years age group 6-13 years age group% children not attending school among ST% of children not attending school among SC% of children not attending school among non-SC/ST

Graph 10
Trends in the reduction of children 6-13 years not attending school
0%
10%
20%
30%
40%
50%
60%
1995/96 1996/97 1997/98 1998/99 1999/00 2000/01 2001/02 2002/03 2003/04 2004/05
ST:1995/96 - 1999/2000 ST: 1999/2000 - 2004/05SC: 1995/96 - 1999/2000 SC: 1999/2000 - 2004/05Others: 1995/96 - 1999/2000 Others: 1999/2000 - 2004/05Linear (ST:1995/96 - 1999/2000) Linear (SC: 1995/96 - 1999/2000)Linear (Others: 1995/96 - 1999/2000)
Muslims: Perhaps other than ST population, one community that lagged behind others in education is the Muslim community in India. While data for Muslim children are not available for earlier years (as NSS did not collect data by religion prior to 1999/2000), since 1999/2000, NSS rounds provide information on Muslim children’s education also. At the beginning of the millennium, around 30% of the Muslim children in the age group of 6-13 years were not attending schools. During the next five years, this has been reduced to less than 20%. However, still children not in school accounts for more than 1/6th of the Muslim children. This is a group that needs focused approach while implementing education related projects. See graph 11.
Graph 11
Percentage of Muslim children not attending school
0%
5%
10%
15%20%
25%
30%
35%
40%
6-10 years 11-13 years 6-13 years
1999/00 2004/05
Per Capita Expenditure Quintile wise: As expected, children from the poorest households have the higher number / share of children who do not attend schools. However, remarkable reductions were also registered in this group during the last two decades. See

graph 12. The reduction in the share of children not attending was faster among the poorest, and during the period 1999/2000 – 2004/05. See graph 13.
Graph 12
Share of children not attending school among the Lowest and Highest MPCE quintiles
0%10%
20%
30%40%50%
60%70%
42ndround
52ndround
61stround
42ndround
52ndround
61stround
42ndround
52ndround
61stround
6-10 years age group 11-13 years age group 6-13 years age group
% of children not attending school in the Lowest Expenditure Quintile% of children not attending school in the Highest Expenditure Quintile
Graph 13
Trends in the reduction of children 6-13 years not attending school by MPCE quintiles
0%
10%
20%
30%
40%
50%
60%
1995/96 1996/97 1997/98 1998/99 1999/00 2000/01 2001/02 2002/03 2003/04 2004/05
Q1 Q2 Q3 Q4 Q5
2004-05 Q1 2004-05 Q2 2004-05 Q3 2004-05 Q4 2004-05 Q5
Linear (Q1) Linear (Q2) Linear (Q3) Linear (Q4) Linear (Q5)
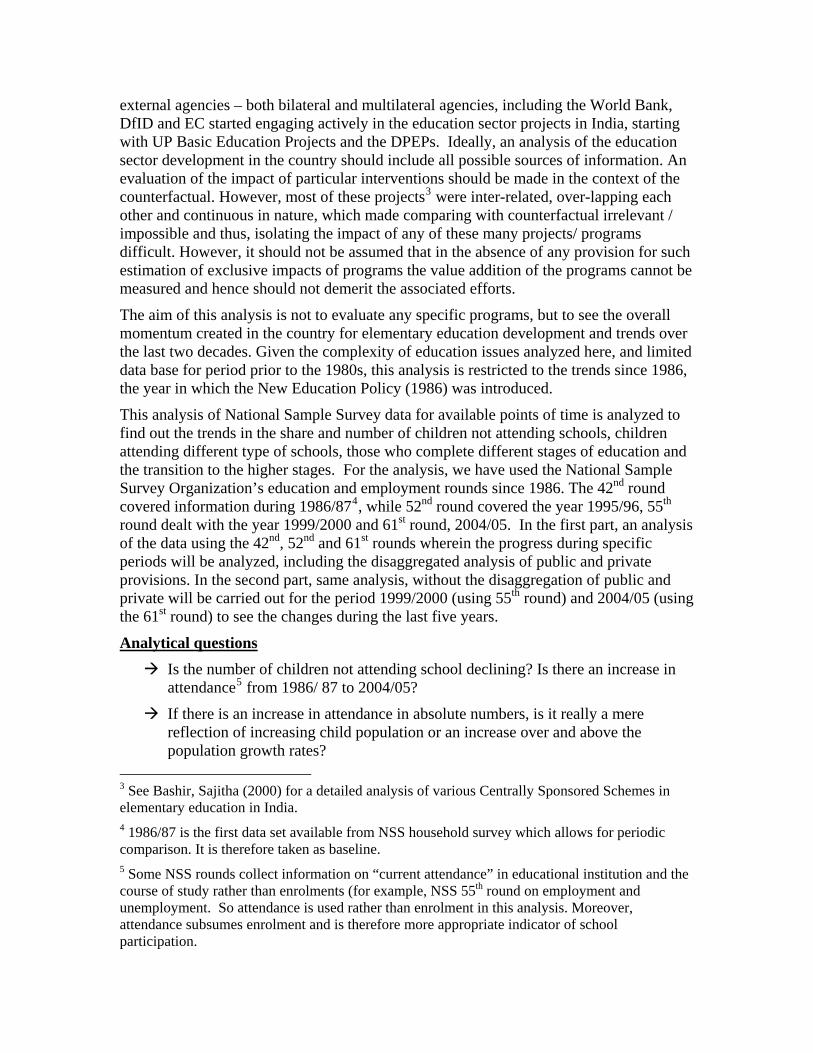
Children from the lagging states: In mid- 1980s, many states had large number of children who did not attend school. More than half of the children not attending school in 2004/05 were concentrated in two states of UP and Bihar. This is true of both 6-10 years age group and 11-13 years age group. See graph 14. Other states with large number of children not attending schools were MP/Chattisgarh, Rajasthan, West Bengal, Maharasthra and Orissa. A sizeable number of districts with large number of children not attending school are concentrated in these districts.
Graph 14
6-13 year olds not attending school: progress and concerns
0
2
4
6
8
10
12
14
16
UP
Bih
ar
MP
Raj
asth
an
Wes
t Ben
gal
AP
Mah
aras
htra
Oris
sa
Guj
arat
Kar
nata
ka
Punj
ab TN
Har
yana
Ass
am JK
Del
hi
Ker
ala
Trip
ura
Meg
hala
ya HP
Man
ipur
Goa
Nag
alan
d
Sikk
im
Miz
oram
Mill
ions
Num
ber
of c
hild
ren
not a
ttend
ing
0
10
20
30
40
50
60
70
Mill
ions
Cum
ulat
ive
no o
f chi
ldre
n ou
t of s
choo
42nd rd: 1986/87 61st rd: 2004/05 42nd rd: Cumulative 61st rd: Cumulative
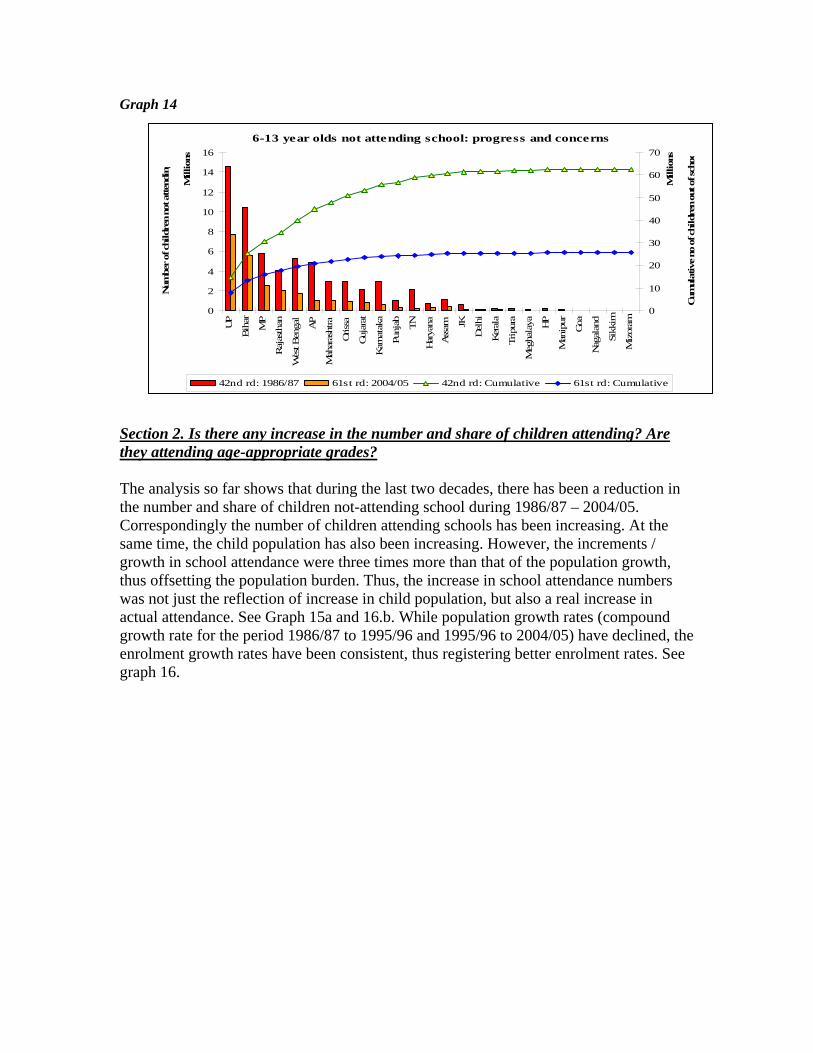
Section 2. Is there any increase in the number and share of children attending? Are they attending age-appropriate grades? The analysis so far shows that during the last two decades, there has been a reduction in the number and share of children not-attending school during 1986/87 – 2004/05. Correspondingly the number of children attending schools has been increasing. At the same time, the child population has also been increasing. However, the increments / growth in school attendance were three times more than that of the population growth, thus offsetting the population burden. Thus, the increase in school attendance numbers was not just the reflection of increase in child population, but also a real increase in actual attendance. See Graph 15a and 16.b. While population growth rates (compound growth rate for the period 1986/87 to 1995/96 and 1995/96 to 2004/05) have declined, the enrolment growth rates have been consistent, thus registering better enrolment rates. See graph 16.

Graph 15.a
Number of children attending schools
0
20
40
60
80
100
120
42nd round:1986/87
52nd round:1995/96
61st round:2004/05
42nd round:1986/87
52nd round:1995/96
61st round:2004/05
6-10 years age group 11-13 years age group
Mill
ions
No.
of c
hild
ren
Total number of children Age Specifc no of children attending
Graph 15.b.
Number of boys and girls attending and not attending school
010203040506070
42ndround
52ndround
61stround
42ndround
52ndround
61stround
42ndround
52ndround
61stround
42ndround
52ndround
61stround
6-10 years age group 11-13 years agegroup
6-10 years age group 11-13 years agegroup
Mill
ions
Boys attending Boys not attending Girls attending Girls not attending
Graph 16
Compound Growth rate in child population and school attendance
0.0%0.5%1.0%1.5%2.0%2.5%3.0%3.5%
6-10 agegroup
11-13 agegroup
6-13 agegroup
6-10 agegroup
11-13 agegroup
Population growth rate Attendance growth rates
1986/87 to 1995/96 1995/96 to 2004/05

Analysis of Enrolment / Attendance Rates using various parameters
Enrolment rates could be looked at in different ways. Given the huge backlog of children coming to school, all of them need not be attending grades appropriately designated to their ages. Children attending schools could be attending either grade lower than their age appropriate ones due to late entry; thus inflating the enrolment figures of the lower grades. On the other hand, there could be some cases of under-age enrolments also. To analyze these varied issues within “attendance” parameters, we have used the following indicators:
• Age Specific Attendance Rates (ASAR) • Stage Specific/ Gross Attendance Rates (GAR) • Age and Stage Specific /Net Attendance Rate (NAR)
Age Specific Attendance Rates are defined as children in any specific age group attending school, irrespective of whether they are attending the appropriate stage in the school. So the ASAR for 6-10 age groups is defined as:
ASAR (6-10 age group) = [Number of children in 6-10 years attending school/ child population in 6-10 years]* 100
On the other hand, Gross Attendance Rates are more specific to the Grades they attend. As a result, the overage and under-age children who are also attending the particular stage of schooling are counted. Basically it is a “gross” estimation of children attending schools. GAR for 6-10 years is defined as:
GAR (6-10 age group) = [Number of children attending Primary grades/ child population in the 6-10 years age group]* 100
Net Attendance Rates are basically a combination of both. It assesses whether the children of a particular age group are attending the appropriate stage in school. NAR omits overage and underage grossness in the calculation of Attendance rates and are more appropriate to see whether the efficiency of systems (in attracting children to school or generating demand for education at the right time) improve over time. NAR is defined as:
NAR (6-10 age in Primary) = [Number of children in 6-10 years age group attending primary grades in School/ Child population in the 6-10 years age group]*100
Here, we analyze whether the increase in attendance merely made children to attend school or whether this has really improved the systems while doing this.
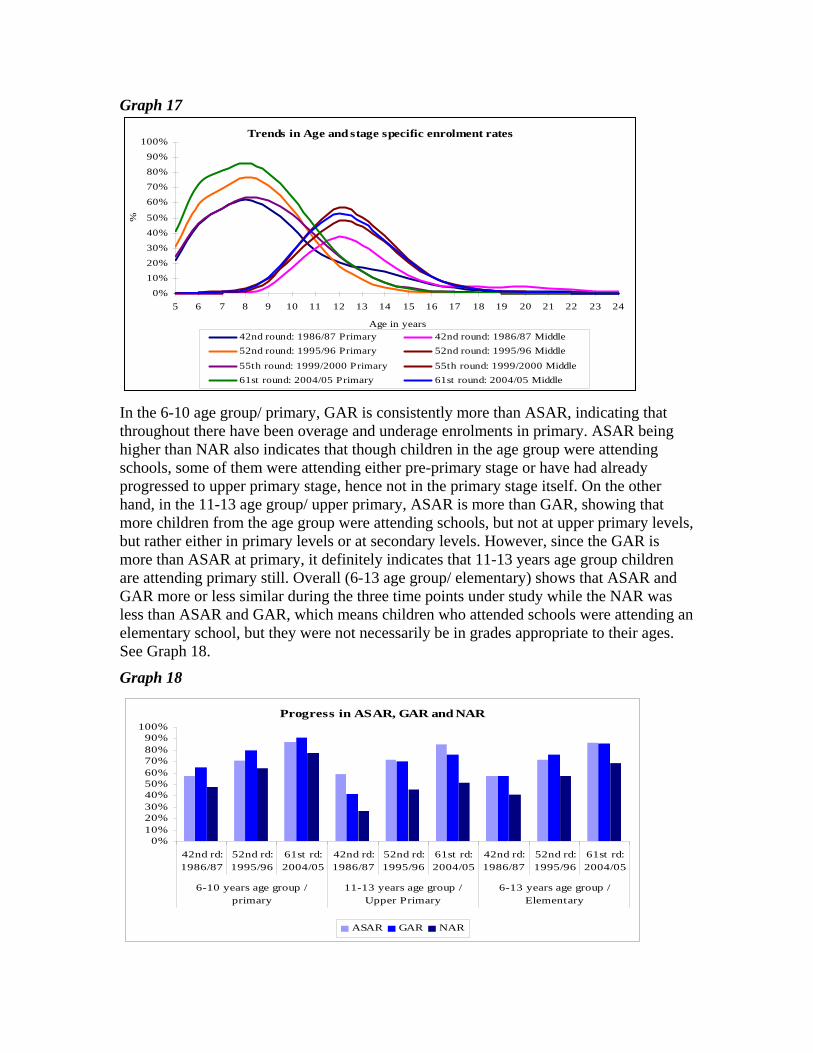
The analysis shows that in all the attendance related indicators – ASAR, GAR and NAR – there has been considerable progress between mid-1980s to 2004/05. The ASAR is specifically looked for single age population, to see where they are (stage of education, since the details on grades attending is not available). See graph 17. The graph shows that still a high proportion of children in the age group of 11-13 years were attending primary rather than upper primary. Similarly, a large share of children in the 14-17 years age were still attending upper primary. These types of ‘spillovers’ of children would result in the mismatch of ASAR, GAR and NAR.
Graph 17
Trends in Age and stage specific enrolment rates
0%10%20%30%40%50%
60%70%80%90%
100%
5 6 7 8 9 10 11 12 13 14 15 16 17 18 19 20 21 22 23 24
Age in years
%
42nd round: 1986/87 Primary 42nd round: 1986/87 Middle52nd round: 1995/96 Primary 52nd round: 1995/96 Middle55th round: 1999/2000 Primary 55th round: 1999/2000 Middle61st round: 2004/05 Primary 61st round: 2004/05 Middle
In the 6-10 age group/ primary, GAR is consistently more than ASAR, indicating that throughout there have been overage and underage enrolments in primary. ASAR being higher than NAR also indicates that though children in the age group were attending schools, some of them were attending either pre-primary stage or have had already progressed to upper primary stage, hence not in the primary stage itself. On the other hand, in the 11-13 age group/ upper primary, ASAR is more than GAR, showing that more children from the age group were attending schools, but not at upper primary levels, but rather either in primary levels or at secondary levels. However, since the GAR is more than ASAR at primary, it definitely indicates that 11-13 years age group children are attending primary still. Overall (6-13 age group/ elementary) shows that ASAR and GAR more or less similar during the three time points under study while the NAR was less than ASAR and GAR, which means children who attended schools were attending an elementary school, but they were not necessarily be in grades appropriate to their ages. See Graph 18.
Graph 18
Progress in ASAR, GAR and NAR
0%10%20%30%40%50%60%70%80%90%
100%
42nd rd:1986/87
52nd rd:1995/96
61st rd:2004/05
42nd rd:1986/87
52nd rd:1995/96
61st rd:2004/05
42nd rd:1986/87
52nd rd:1995/96
61st rd:2004/05
6-10 years age group /primary
11-13 years age group /Upper Primary
6-13 years age group /Elementary
ASAR GAR NAR

What is the trend in the growth of attendance during the last decade? During 1995/96 and 1999/2000, ASAR grew, and if it had continued to grow following the same growth trajectory, it would have reached 75-80% during 2004/05, much lower than the level it reached (87%) in 2004/05. The graph below depicts the linear growth trends had the trends during 1995/96 – 1999/2000 continued and the actual growth path during 1999/2000 – 2004/05 period. See graph 19.
Graph 19
Ag Specific Attendance Rate among 6-10 year olds: Trends between 1995/96 - 1999/2000 and 1999/2000 - 2004/05
50%
55%
60%
65%
70%
75%
80%
85%
90%
1995/96 1996/97 1997/98 1998/99 1999/00 2000/01 2001/02 2002/03 2003/04 2004/05
ASAR : 1995/96 - 1999/2000 ASAR: 1999/2000 - 2004/05
Linear (ASAR : 1995/96 - 1999/2000) Linear (ASAR: 1999/2000 - 2004/05)
Gender wise Attendance: As a corollary to the faster reduction in the out of school children among girls, the various parameters of school attendance related to gender shows that the gaps between boys and girls have been narrowing. See graphs 20.a, 20.b & 20.c. More importantly, the gains in attendance during 1999/2000 – 2004/05 were significantly better than that achieved during 1995/96 – 1999/2000, as shown in graph 20.d wherein the trends for the later period is extrapolated to see the achievements if the same trends had continued.
Graph 20.a Graph 20.b
Gender wise progress in ASAR
0%10%20%30%40%50%60%70%80%90%
100%
42ndround
52ndround
61stround
42ndround
52ndround
61stround
42ndround
52ndround
61stround
6-10 years age group / primary 11-13 years age group / UpperPrimary
6-13 years age group /Elementary
Boys Girls
Gender wise progress in GAR
0%10%20%30%40%50%60%70%80%90%
100%
42ndround
52ndround
61st round 42ndround
52ndround
61st round 42ndround
52ndround
61st round
6-10 years age group / primary 11-13 years age group / UpperPrimary
6-13 years age group / Elementary
Boys Girls

Graph 20.c Graph 20.d
Gender wise progress in NAR
0%
10%
20%
30%
40%50%
60%
70%
80%
90%
42ndround
52ndround
61st round 42ndround
52ndround
61st round 42ndround
52ndround
61st round
6-10 years age group / primary 11-13 years age group / UpperPrimary
6-13 years age group / Elementary
Boys Girls
Trends in the growth of ASAR by gender
50 %
55%
6 0 %
6 5%
70 %
75%
8 0 %
8 5%
9 0 %
9 5%
Boys GirlsBoys 2004/05 Girls 2004/05Linear (Boys) Linear (Girls)
Rural /urban differences in School attendance: During mid-eighties, only around 50% of the children in rural areas attended schools while in urban areas, this was already close to 80%. During the last two decades, the attendance in rural areas grew faster to close the gaps with the urban attendance rates. One interesting point to note here is the 2004/05 comparative figures for rural-urban based GAR vis-à-vis ASAR and NAR at the primary stage. Though the gaps are now narrowed between rural and urban in ASAR and NAR, better results are still found in the urban areas. However, rural areas have better GAR of late. This is due to the huge backlog of children out of school now started to attend school, and since they attend primary irrespective of their age, it results in rural having higher GAR. See graph 21.a, 21.b, 21.c and 21.d. Graph 21.d shows that the achievements in rural ASAR during 1999/2000 to 2004/05 were greater than the gains had the progress were same as during period between 1995/96 – 1999/2000.
Graph 21.a Graph 21.b Rural/urban wise progress in ASAR
0%10%20%30%40%50%60%70%80%90%
100%
42nd round 52nd round 61st round 42nd round 52nd round 61st round 42nd round 52nd round 61st round
6-10 years age group / primary 11-13 years age group / UpperPrimary
6-13 years age group / Elementary
Rural Urban
Rural/Urban wise progress in GAR
0%10%20%30%40%50%60%70%80%90%
100%
42ndround
52ndround
61stround
42ndround
52ndround
61stround
42ndround
52ndround
61stround
6-10 years age group / primary 11-13 years age group / UpperPrimary
6-13 years age group /Elementary
Rural Urban
Graph 21.c Graph 21.d
Rural/Urban wise progress in NAR
0%10%20%30%40%50%60%70%80%90%
42ndround
52ndround
61stround
42ndround
52ndround
61stround
42ndround
52ndround
61stround
6-10 years age group / primary 11-13 years age group / UpperPrimary
6-13 years age group /Elementary
Rural Urban
Trends in ASAR by rural and urban
0%
10%20%
30%40%
50%
60%70%
80%90%
100%
Rural Urban Rura l 2004/05Urban 2004/05 Linear (Rura l) Linear (Urban)
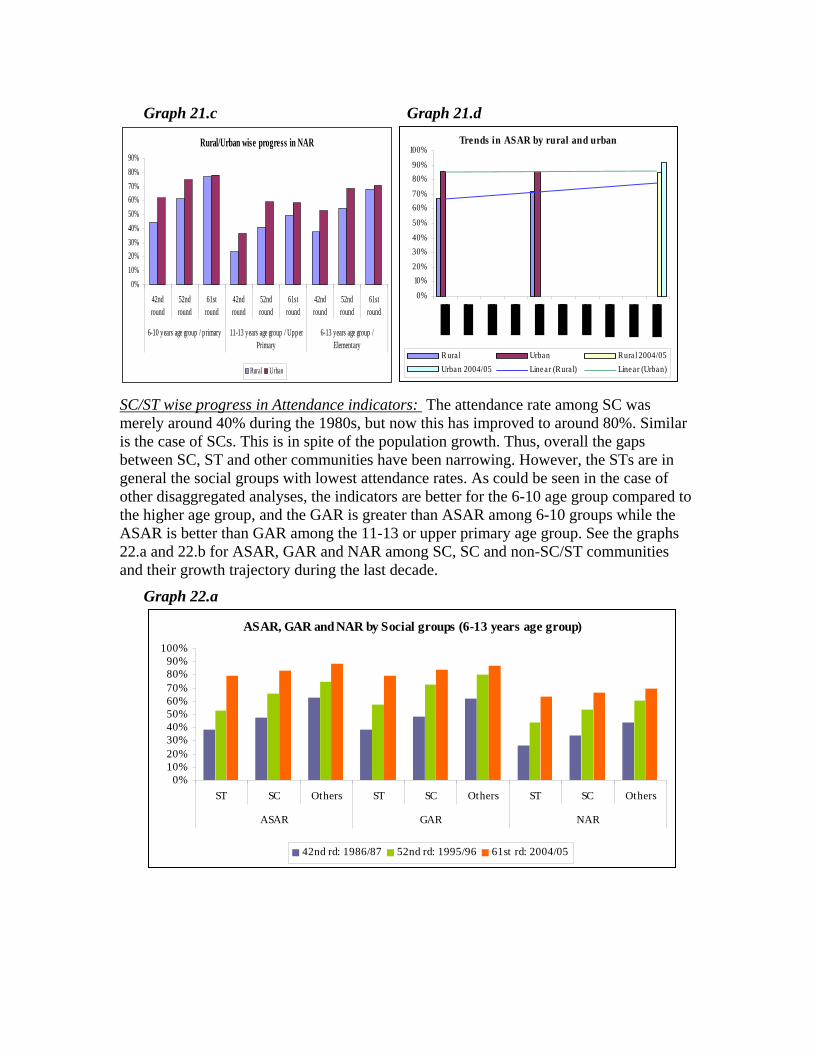
SC/ST wise progress in Attendance indicators: The attendance rate among SC was merely around 40% during the 1980s, but now this has improved to around 80%. Similar is the case of SCs. This is in spite of the population growth. Thus, overall the gaps between SC, ST and other communities have been narrowing. However, the STs are in general the social groups with lowest attendance rates. As could be seen in the case of other disaggregated analyses, the indicators are better for the 6-10 age group compared to the higher age group, and the GAR is greater than ASAR among 6-10 groups while the ASAR is better than GAR among the 11-13 or upper primary age group. See the graphs 22.a and 22.b for ASAR, GAR and NAR among SC, SC and non-SC/ST communities and their growth trajectory during the last decade.
Graph 22.a
ASAR, GAR and NAR by Social groups (6-13 years age group)
0%10%20%30%40%50%60%70%80%90%
100%
ST SC Others ST SC Others ST SC Others
ASAR GAR NAR
42nd rd: 1986/87 52nd rd: 1995/96 61st rd: 2004/05

Graph 22.b
Trends in ASAR by social groups
50%
55%
60%
65%
70%
75%
80%85%
90%
95%
1995
/96
1996
/97
1997
/98
1998
/99
1999
/00
2000
/01
2001
/02
2002
/03
2003
/04
2004
/05
ST SC OthersST 2004 /05 SC 2004 /05 Other 2004 /05Linear (ST) Linear (SC) Linear (Others )
Attendance trends by Expenditure quintiles: Two decades ago, the gaps in attendance rate between children from the richest and the poorest expenditure quintiles were more than 40 percentage points. However, over the years, with more and more children from the lowest monthly per capita expenditure quintiles have started to attend schools, the gaps between the richest MPCE quintile and the lowest MPCE quintile have been narrowing. See graphs 23.a, 23.b. 23.c and 23.d.
Graph 23.a Graph 23.b
ASAR - among the highest and lowest expenditure quintiles
0%10%20%30%40%50%60%70%80%90%
100%
42ndround
52ndround
61stround
42ndround
52ndround
61stround
42ndround
52ndround
61stround
6-10 years age group / primary 11-13 years age group / UpperPrimary
6-13 years age group /Elementary
Lowest Q Highest Q
NAR - among the highest and lowest expenditure quintiles
0%
10%20%
30%40%
50%60%
70%80%
90%
42ndround
52ndround
61stround
42ndround
52ndround
61stround
42ndround
52ndround
61stround
6-10 years age group / primary 11-13 years age group / UpperPrimary
6-13 years age group /Elementary
Lowest Q Highest Q
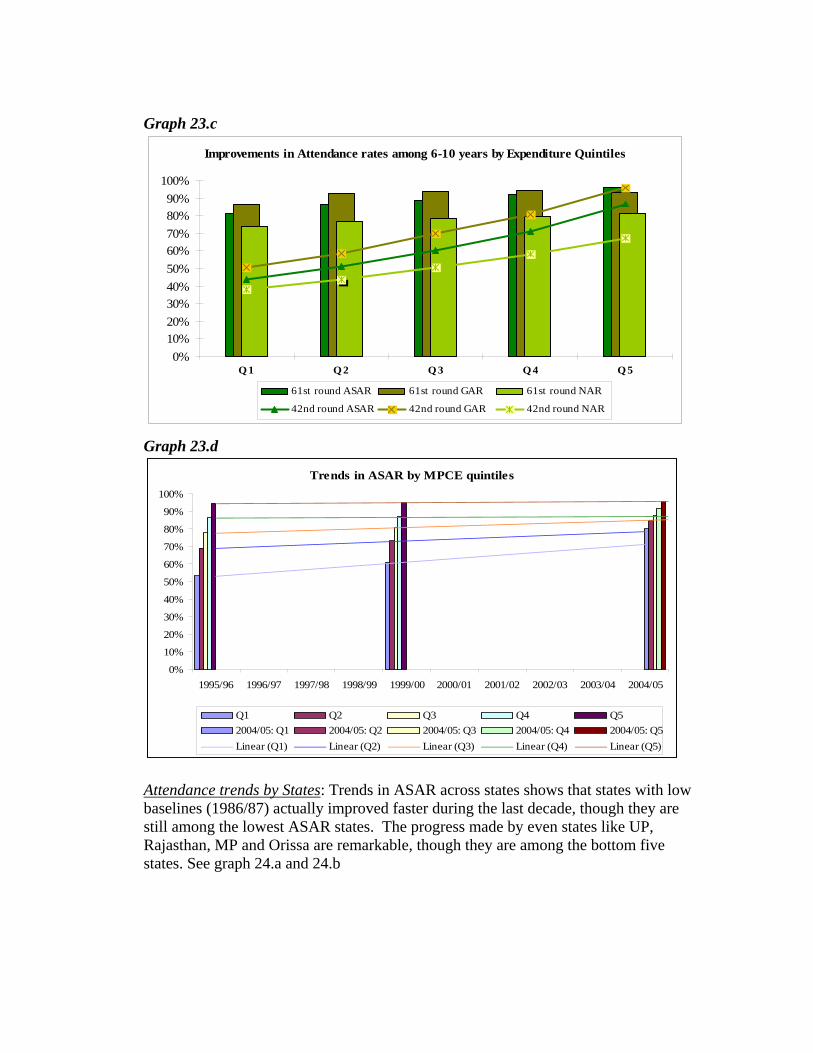
Graph 23.c
Improvements in Attendance rates among 6-10 years by Expenditure Quintiles
0%10%20%30%40%50%60%70%80%90%
100%
Q 1 Q 2 Q 3 Q 4 Q 5
61st round ASAR 61st round GAR 61st round NAR
42nd round ASAR 42nd round GAR 42nd round NAR
Graph 23.d
Trends in ASAR by MPCE quintiles
0%
10%
20%
30%
40%
50%
60%
70%
80%
90%
100%
1995/96 1996/97 1997/98 1998/99 1999/00 2000/01 2001/02 2002/03 2003/04 2004/05
Q1 Q2 Q3 Q4 Q52004/05: Q1 2004/05: Q2 2004/05: Q3 2004/05: Q4 2004/05: Q5Linear (Q1) Linear (Q2) Linear (Q3) Linear (Q4) Linear (Q5)
Attendance trends by States: Trends in ASAR across states shows that states with low baselines (1986/87) actually improved faster during the last decade, though they are still among the lowest ASAR states. The progress made by even states like UP, Rajasthan, MP and Orissa are remarkable, though they are among the bottom five states. See graph 24.a and 24.b

Graph 24.a
ASAR across states: 6-10 year olds
0%
20%
40%
60%
80%
100%Kerala
TNHP
Mizoram
Nagaland
Manipur
Sikkim
AP
Karnataka
Tripura
DelhiMaharashtra
PunjabJ&KAssam
Meghalaya
Gujarat
Haryana
West Bengal
ALL INDIA
Orissa
MP
UP
RajasthanBihar
61st rd:2004/05 52nd rd: 1995/96 42nd rd: 1986/87
Graph 24.b ASAR: 11-13 years age group state wise
0%
20%
40%
60%
80%
100%Kerala
MizoramHP
Sikkim
Manipur
TN
Delhi
Tripura
J&K
Chandigarh
AssamMeghalaya
MaharashtraHaryanaPunjab
Karnataka
Gujarat
ALL INDIA
West Bengal
AP
MP
UP
Orissa
RajasthanBihar
61st rd:2004/05 52nd rd: 1995/96 42nd rd: 1986/87
Section 3. Which schools are the children attending? Overall, government sector has been catering to the educational needs of the children, but increasingly, private sectors – both aided and unaided - are also complementing the government provision, more so for the urban sector and for the highest expenditure quintile categories. Most of the increase in population as well as attendance has been

happening in the “laggard” categories – laggard states, rural areas, girls, SC and ST communities, and among the lowest expenditure quintiles. This growing child population mainly went to government schools and thus, in absolute numbers, there has been a major increase in the enrolments in government schools. Enrolment in absolute terms in government schools have been on the rise. See graph 25. The private unaided sector, though small, also had registered an increase in attendance. However, given the low base, the growth in private enrolment seems to be proportionately higher during the same period. Thus, the share of children attending government has reduced from around 3/4ths in 1986/87 to 72.6% in 2004/05. See graph 26.
Graph 25 Overall - Number of children attending by type of school
0
20
40
60
80
100
120
42ndround
52ndround
61stround
42ndround
52ndround
61stround
42ndround
52ndround
61stround
6-10 years age group 11-13 years age group 6-13 years age group
Mill
ions
No of children in Govt No of children in pvt aided No of children in pvt unaided
Graph 26
Overall - % of children by type of school
74.5
0%
73.7
0%
73.7
8%
71.7
7%
70.8
2%
70.2
9%
73.5
6%
72.7
1%
72.5
8%
0%10%20%30%40%50%60%70%80%
42ndround
52ndround
61stround
42ndround
52ndround
61stround
42ndround
52ndround
61stround
6-10 years age group 11-13 years age group 6-13 years age group
% in Govt % in Pvt_aided % in Pvt_ Unaided
However, if this situation is seen in the larger context of all children (including children not-attending) then it is evident that the share of children in government schools had increased from 43% in 1986/87 (when an equal share of children were not- attending any school) to 65% in 2004/05 (when the share of children not-attending any school in the total child population had reduced to 13% and government absorbing most of these reduced number of children out-of-school). Similarly, the share of children attending

private schools (aided + unaided) was only 12% in 1986/87 increased to 22% by 2004/05. See graph 27.
Graph 27
Distribution of children who are attending different type of schools and those who are not attending
43%
29% 41
%
28% 42
%
29%
43%
52%
65%
42%
51%
60%
43%
52%
63%
0% 7% 0% 0% 10%9%
12% 8% 15% 16% 7% 13% 13% 8% 15%
15%
13%
13%
12%7% 14%
0%
20%
40%
60%
80%
100%
42ndround:
1986/87
52ndround:
1995/96
61stround:
2004/05
42ndround:
1986/87
52ndround:
1995/96
61stround:
2004/05
42ndround:
1986/87
52ndround:
1995/96
61stround:
2004/05
6-10 years age group 11-13 years age group 6-13 years age group
Children NOT attending No of children attending GovtNo of children attending pvt aided No of children attending pvt unaided
Type of school attending by gender: It is interesting to note the change in the proportion of boys and girls attending different types of schools. Of the total population, the reduction in the number of children not attending were made possible by expansion in the government sector to accommodate majority of these children while private sector also growing more than proportionately in their share. See graph 28.a and graph 28.b. In graph 28.b, it is evident that in the total child population, the share of government school attendees increased with a corresponding decline in children not attending in both the cases of boys and girls. However, within the school going population, the relative shares show that private sector share grew slightly, though government remains to account for the largest shares. In 1986/87, 75% of the boys and 74% of the girls were attending government schools. By 2004/05, share of boys attending government schools have reduced to less than 73% while that of girls have increased to 75%. This trend is even starker in the 11-13 years age group. See graph 28.b.

Graph 28.a
Share of girls not attending and attending by type of school
0%
20%
40%
60%
80%
100%
Boys Girls Boys Girls Boys Girls Boys Girls Boys Girls Boys Girls
1986/87 1986/87 1995/96 1995/96 2004/05 2004/05 1986/87 1986/87 1995/96 1995/96 2004/05 2004/05
6-10 years age group 11-13 years age group
Children not attending No of children in Govt No of children in pvt aided No of children in pvt unaided
Graph 28b
Gender wise - % children by type of school
75.0
3%
73.7
2%
73.3
0%
74.2
0%
72.6
3%
75.1
0%
73.1
6%
69.3
3%
71.6
1%
69.6
7%
70.0
1%
70.6
5%
0.00% 0.00% 10.29% 10.86%8.50% 8.33% 0.00% 0.00%
18.25% 20.41% 13.25% 14.72%19.56% 21.29% 12.28% 11.26% 18.69% 16.42% 25.46% 29.14%
9.53% 9.07% 16.62% 14.45%
0%10%20%30%40%50%60%70%80%90%
100%
Boys Girls Boys Girls Boys Girls Boys Girls Boys Girls Boys Girls
42ndround
42ndround
52ndround
52ndround
61stround
61stround
42ndround
42ndround
52ndround
52ndround
61stround
61stround
6-10 years age group 11-13 years age group
% in Govt % in Pvt_aided % in Pvt_ Unaided
Type of school attended by rural and urban: As already noted, the increase in attendance has been highest in rural areas compared to urban areas. The share of children (6-10 years) attending in rural areas increased from 52% in 1986/87 to 86% in 2004/05; while in urban areas, the figures went up from 76% to 90% in 2004/05. As a result, the share of government in total children in rural areas went up from 43% to 70%, while in urban, it remained at around 42% only. Taking only children attending schools, the share of government in this in rural areas was 83% in mid 1980s, remained at 82% in 2004/05, while in urban areas, the share of government came down from 52% to 45% during the same period. Since we did not have the break up or private sector into aided and unaided during the mid-80s, the comparisons are for the whole private sector. However, the share of private unaided sector doubled from 6% to 12% during the period between 1996 and 2004 in rural, while that in urban areas grew from 17% to 29%. See graphs 29.a and 29.b.

Graph 29.a Share of children not attending and attending by type of school in rural and
urban areas
0%10%20%30%40%50%60%70%80%90%
100%
1986
/87
1995
/96
2004
/05
1986
/87
1995
/96
2004
/05
1986
/87
1995
/96
2004
/05
1986
/87
1995
/96
2004
/05
RURAL URABN RURAL URABN
6-10 years age group 11-13 years age group
Children not attending children in Govt children in pvt aided children in pvt unaided
Graph 29.b
Children attending schools by type of school
0%10%20%30%40%50%60%70%80%90%
% in
Gov
t
% in
Pvt_
aide
d
% in
Pvt
_U
naid
ed
% in
Gov
t
% in
Pvt_
aide
d
% in
Pvt
_U
naid
ed
% in
Gov
t
% in
Pvt_
aide
d
% in
Pvt
_U
naid
ed
% in
Gov
t
% in
Pvt_
aide
d
% in
Pvt
_U
naid
edRural - 6-10 years age
groupRural- 11-13 years age
groupUrban - 6-10 years age
groupUrban - 11-13 years age
group
1986/87 1995/96 2004/05
Type of school attended by social groups: Among the social groups, the reduction in the number of children not attending school is due to increased attendance in government schools, especially among the SC and ST groups. In the general category, growth of private sectors in both the numbers and shares in the increasing attendance among children is notable. Taking aided and pure government schools together, the public sector caters to more than 90% of the children attending among both SC and STs. See graph 30.

Graph 30
Children (6-13 years age group) not attending and attending school by school type among SC, ST and others
0%10%20%30%40%50%60%70%80%90%
100%
1986/87 1995/96 2004/05 1986/87 1995/96 2004/05 1986/87 1995/96 2004/05
SC ST General
6-13 years age group 6-13 years age group 6-13 years age group
Children not attending No of children in Govt No of children in pvt aided No of children in pvt unaided
Type of school attended by Expenditure quintiles: The share of government among those attending schools from the lowest expenditure quintile groups of the population is high and growing (from 85% in mid –eighties to 90% in 2004/05) as more and more children who were not attending are now attending. On the other hand, among the richest/ highest expenditure quintile groups, government sector accounts only for less than half of the total attending children, and that too were declining (55% in mid-eighties to 42% in 2004/05). Correspondingly, the attendance in private sector was increasing. The increase in the share of private unaided sector is significant among the richest groups as share of private aided schools were also on the decline. See graph 31.
Graph 31
Children (6-13 years age group) attending and not attending by type of school among the highest and lowest MPCE quintiles
0%10%20%30%40%50%60%70%80%90%
100%
1986/87 1995/96 2004/05 1986/87 1995/96 2004/05
Lowest MPCE (Q1) Highest MPCE (Q5)
% not attending % attending govt % attending aided % attending pvt unaided

Additional number of children and the capturing of them by schools of different types: Of the overall additional number of children who started attending schools, almost 70% of them went to government schools. The share of government in the additional enrolments also was going up from 1986/87 to 1995/96 decade to 1995/96 to 2004/05 decade. Compared to boys, larger shares in girls’ additional enrolments were captured by government schools, and so is the case with SC, ST children and children from poorer households (lowest expenditure quintiles). On the other hand, of all the additional enrolments in urban areas and among richest expenditure quintiles, private sector accounts for a major share. Among general community (other) and among boys, the share of private was sizeable in terms of new enrolments. See graph 32.
Graph 32
Share of additional enrolments captured by Government by categories
0%10%20%30%40%50%60%70%80%90%
100%
Overall Boys Girls Rural Urban SC ST Other Q1 Q5
1986-87 to 1995/96 1995/96 to 2004/05
Primary and Upper Primary Stage completion Ideally, a better measure of understanding the efficiency of schooling is to go beyond the enrolment /current attendance status figures to look at completion of various stages of education and transition to higher stages. There are various ways of looking at the efficiency of schooling in terms of completion – as a share of total population in the appropriate age group that has completed the expected stage of education (primary/upper primary); and /or as a share of children in the appropriate age group who ever got enrolled. In this analysis, both measures are illustrated, since the later measure (as share of those who ever got enrolled) is affected by the enrolment rates, which, as already illustrated, kept increasing during the last two decades.
It must be noted here that many children in the age group of 12-14 years who were still in school were attending primary grades (lower than the grades they were expected to attend by age-appropriate grades measure) and hence not figure among those who “complete” primary. Similarly, in the case of 15-16 years old, many were still in lower grades, and hence even though they are in the system, they were not counted as “upper primary completed”. Such cases could result from either late entry into the system by these children (over age enrolments) or because of repeating lower grades.

The primary completion rates have been improving over the years, but the improvement in the period between 1999/2000 and 2004/05 exceed the trends till 1999/2000. Around 79% of 12-14 years olds ever enrolled complete primary schooling, and as a proportion of all 12-14 year olds, those who had already completed primary education accounts for almost 73% (as against around 39% in 1986/87). See graph 33. Similarly, in the case of upper primary completion, 65% of the 15-16 year olds ever enrolled had completed upper primary education in 2004/05 (compared to 44% two decades ago). As proportion of all children in the age group of 15-16 years, those completed upper primary education accounts for 59% (as against 34% in 1986/87). See graph 34.
Graph 33
Primary Completion rates among 12-14 years old
0%
10%
20%
30%
40%
50%
60%
70%
80%
90%
1986
/87
1989
/90
1992
/93
1995
/96
1998
/99
2001
/02
2004
/05
Among those enrolled Among all childrenAmong those enrolled 2004/05 Among all children 2004/05Linear (Among those enrolled) Linear (Among all children)
Graph 34
Upper Primary Completion Rates among 15-16 years old
0%10%20%30%40%50%60%70%
42nd rd: 1986/87 52nd rd: 1995/96 55th rd:1999/2000
61st rd: 2004/05
% of 15-16 years - middle completed (among ever enrolled)% of 15-16 years - middle completed (among all children)

Who is completing primary education and appropriate to their age?
Just like the variations in enrolments across various groups, primary and upper primary completion rates also vary across gender, social, economic and geographic groups.
Primary and Upper primary Completion rates by Gender: While around 79% of girls and boys enrolled (in the 12-14 years age group) complete primary education, proportionately more boys (75%) in total age group population complete primary compared to girls (72%). This is basically reflecting the enrolment gaps among boys and girls in primary. While the primary completion rate gaps between boys and girls are not so evident, the upper primary completion rates reflect the gender gaps – both measured as a proportion of those who ever enrolled as well as a proportion of all children in the age group. See graph 35 and graph 36.
Graph 35.
Primary completion among 12-14 years old children by gender
0%10%20%30%40%50%60%70%80%90%
42nd round:1986/87
52nd round:1995/96
55th round:1999/00
61st round:2004/05
Boys completing among enrolled Boys completing among all boysGirls completing among enrolled Girls completing among all girls
Graph 36
Upper primary completion rates among 15-16 year olds by gender
0.00%
10.00%
20.00%
30.00%
40.00%
50.00%
60.00%
70.00%
42nd rd: 1986/87 52nd rd: 1995/96 55th rd: 1999/00 61st rd: 2004/05
among ever enrolled Boys among ever enrolled Girls
among 15-16 yrs old total children Boys among 15-16 yrs old total children Girls

Primary and Upper Primary completion rates by Rural urban: Proportionately more urban children complete both primary and upper primary stages of education. The linear trend lines for rural and urban primary completion rates for the period 1986/87 to 1999/2000 is extrapolated to see whether the primary completion rate trends between 1999/2000 to 2004/05 follow the same trends or better. It is evident from the graph that the primary completion rates among both rural and urban were more than the rates that would have achieved if the growth trajectory till 1999/2000 were followed. See graph 37 and graph 38.
Graph 37
Primary completion rates among 12-14 years old by rural & urban
0%
10%
20%
30%
40%
50%
60%
70%
80%
90%
42nd round: 1986/87 52nd round: 1995/96 55th round: 1999/00 61st round: 2004/05
Rural Among those enrolled Rural Among all childrenUrban Among those enrolled Urban Among all children
Linear (Rural Among those enrolled) Linear (Rural Among all children)Linear (Urban Among those enrolled) Linear (Urban Among all children)
Graph 38.
Upper primary completion rates by rural and urban among 15-16 years old
0%10%20%30%40%50%60%70%80%90%
RURAL URBAN RURAL URBAN RURAL URBAN RURAL URBAN
42nd rd: 1986/87 52nd rd: 1995/96 55th rd: 1999/00 61st rd: 2004/05
among ever enrolled among 15-16 yrs old total children
among ever enrolled among 15-16 yrs old total children
Linear (among ever enrolled) Linear (among ever enrolled)

Completion rates by Social groups: The analysis shows that primary completion rates are getting better among the socially marginalized groups, though the general category still have far better completion rates. ST and Muslim children lag behind in primary completion rates, both as percentage of those who were ever enrolled as well as a proportion of total child population in the age group of 12-14 years in the communities. See graph 39. Similar trends are found in upper primary completion rates too, but much lower than the primary completion rates.
Graph 39 Primary completion rates among 12-14 year olds by social groups
0%10%20%30%40%50%60%70%80%90%
42nd
roun
d:19
86/8
7
52nd
roun
d:19
95/9
655
thro
und:
1999
/00
61st
roun
d:20
04/0
5
42nd
roun
d:19
86/8
7
52nd
roun
d:19
95/9
655
thro
und:
1999
/00
61st
roun
d:20
04/0
5
Among those enrolled Among all children
ST SC OBC Others Muslim
Completion rates by Economic groups: Primary completion rates were quite high among the highest MPCE quintile group, but were very low among the lowest MPCE quintile group. However, the maximum progress over the last decade in primary completion rates was found in the lowest MPCE quintile groups. The gaps between the lowest and highest MPCE quintile groups in terms of primary completion rates have been narrowing over the decade. See graph 40.
Graph 40
Trends in primary completion rates among 12-14 years old by MPCE quintiles
0%10%20%30%40%50%60%70%80%90%
100%
52nd round:1995/96
55th round:1999/00
61st round:2004/05
52nd round:1995/96
55th round:1999/00
61st round:2004/05
Among those enrolled Among all children
Q1 Q2 Q3 Q4 Q5

Primary and Upper primary completion rates by States: The states with better enrollment rates also show better completion rates too. The analysis of children completing primary (among 12-14 years of age) and upper primary stages (15-16 years age group) of education among those who were ever enrolled shows that Bihar, Meghalaya and Jharkhand at the bottom while states like Kerala, Tamil Nadu and Maharashtra at the top (along with UTs like Pondicherry and Lakshadweep). For many states, the improvements are marginal (such as for Kerala) while the improvements are greater in some other states. See graph 41.
Graph 41
State wise primary and upper primary completion rates : 2004/05
0%
10%
20%
30%
40%
50%
60%
70%
80%
90%
100%
Biha
rM
egha
laya
Jhar
khan
dA
runa
chal
Si
kkim UP
Man
ipur
Raja
sthan
Trip
ura
MP
Wes
t Ben
gal
All
Indi
aN
agal
and
Chha
ttisg
arh
J&K
Ass
amU
ttara
ncha
lO
rissa
Punj
abH
arya
naD
elhi AP
Chan
diga
rhM
izor
amG
ujra
tH
PD
&D
Kar
nata
kaA
&N
ID
&N
HG
oaM
ahar
astra
Tam
il N
adu
Laks
hadw
eep
Pond
iche
riK
eral
a
% 12-14 years primary completion % 15-16 year olds completing middle
Where do the children go after completing primary? Of those children who complete primary schooling, now 93% transit to upper primary grades. Of all the children in the age group (12-14 years old) 3/4th are in upper primary. This is in contrast to only around 40% of those ever enrolled who used to reach upper primary levels. Of those who complete upper primary, around 88% join secondary stage of education in 2004/05 compared to around 86% in 1986/87. However, of those who ever got enrolled into the school, less than half reach secondary stage of education even in 2004/05 (compared to around 29% in 1986/87). See graph 42 and graph 43.
To take an overall picture, of all the children in the age group of 12-14 years, in 1986-87, 23% never got enrolled, 6% dropped out before completing primary and 22% were still attending primary. Only around 48% completed primary, and 8% dropped out after that while 40% attended upper primary (with 1% already in secondary). By 2004/05, among the 12-14 years old, only 7% of the children had never been to school; 3% dropped out before completing primary, 16% still attended primary while 74% had completed primary. While 69% progressed to upper primary and later secondary stages, 5% dropped out after completing primary. See graphs 44 and 45 for details.

Graph 42
Transition rates: 12-14 years old attending upper primary and above among those completed primary and among those ever enrolled
39.87%
57.78% 60.22%
73.89%
84.35%
74.51%
90.97% 93.20%
0%
10%
20%
30%
40%
50%
60%
70%
80%
90%
100%
42nd round:1986/87
52nd round:1995/96
55th round:1999/2000
61st round :2004/05
Of those who ever enrolled, attending upper primary & above
Of those who completed, attending upper primary & above
Graph 43
Transition rates from upper primary to secondary stage of education: Trends
85.99% 87.98%
29.23%
48.62%
0%10%20%30%40%50%60%70%80%90%
100%
42nd rd: 1986/87 61st rd: 2004/05
Of those completed middle, those attending secondary
Of those who ever enrolled, attending secondary

Graph 44
Distribution of 12-14 year old children by their status in schooling - 1986/87
23%
6%
22%40%
1%
8%
48%
Never enrolled/attended dropped out before completing primaryPrimary attending middle attendingsecondary attending dropped out after completing primary
Graph 45
Distribution of 12-14 year old children by their status in schooling - 2004/05
7%
3%
16%
48%
21%5%
74%
Never enrolled/attended dropped out before completing primaryPrimary attending middle attendingsecondary attending dropped out after completing primary
What is the emerging story out of this analysis? The elementary education sector in India is progressing in terms of ensuring access and getting children to attend schools, but still there are many gaps to address. The progress has been more convincing during the last decade, especially last few years before 2004/05 than during the 1980s or 1990s. Is it because of the programs implemented during the new millennium like SSA? While it is not possible to draw direct linkages and conclusions based on this analysis (since this is not an effort to evaluate the impact of any

project), the analysis is certainly indicative that the outcomes related to enrolments/ attendance and completion rates are better during the 1999/2000-2004/05 period, the period during which SSA started and some of the DPEP projects were still operational. Some of the important results are summarized here. • There is a sharp reduction in the number of children not attending schools as well
as their share in total child population. However, those who are still not attending are the hardest to reach and hence need focused attention.
• Correspondingly, the number and share of children attending school in the age group of 6-13 years has been on the rise. The increase is prominent in the 6-10 years age group than 11-13 years age group. Similarly, increase in the number and share of children attending among girls, and socially and economically marginalized groups have been quite impressive. However, these are still the groups with the highest concentration of children not attending. This basically points to the fact that despite progress, these are areas of concern and hence need a further intensified approach to get the older children and children from marginalized groups to the school.
• Most of these new enrolments (children attending school) were from the traditionally laggard states in terms of education participation. However, majority of the children who were still not attending schools belonged to these states. Though this analysis did not look at the district wise scenario, it is obvious that within laggard states there are districts wherein the children who are not attending are concentrated. The state and district specific strategies need to be used to address the issues in a contextual manner.
• While a sizeable number of children from urban, socially and economically better off background and boys moved to private sectors, almost all of the children who started attending schools from rural, social and economically marginalized groups and girls started increasingly attend the school went to government schools. Overall, it government accounted for 3/4ths of all children attending schools. However, though small, private sector has been growing. While the private sector aided by government was not prominent in many states, it provided an important bridge in many states, to provide access to children, especially for upper primary stage. Some of the classic examples of public private partnerships in education such as the grants-in-aid system (eg. Kerala, UP etc) should be studied carefully to see the complementarities and cost effectiveness in reaching hardest to reach groups as well as for ensuring equity. Unaided private sector also could play a very important complementary role in providing education. While those who could afford private sector could move to the private schools, the government resources could be used conclusively on the vulnerable sections of the society. However, it is important that the complementarities should be ensured not only in providing access and enrolment, but also in terms of quality of provision and outcomes, on both ways.
• In spite of the tremendous progress achieved in access, the progress in completion rates are still slow, mainly because of many deficiencies in the system – such as

over age enrolments in school, repetition rates etc, which is not directly looked at in this paper. However, it is obvious if around 16% of the children in 12-14 years old are still attending primary even in 2004/05, the system need to work towards more age-appropriate enrolments and towards ensuring appropriate age stage completion rates.
To conclude, the analysis was an attempt to provide an insight into the elementary education progress and status in India. Overall, the NSS analysis shows progress, at the same time, still persisting gaps. Since this analysis did not look at the determinants of elementary education participation and completion, further analysis needs to be done to find out the relative roles of household and provision factors in the outcomes.


![English Practice Progress - Vocabulary - Elementary[1]](https://static.fdocuments.us/doc/165x107/5571f88349795991698d9402/english-practice-progress-vocabulary-elementary1.jpg)


