
What Is the Impact of Within-Platform Competition in Two ... · What Is the Impact of...
49
1 What Is the Impact of Within-Platform Competition in Two-Sided Markets? M. MAHDI TAVALAEI † † Surrey Business School University of Surrey Guildford, Surrey, GU2 7XH, UK Tel: +44 (0) 70 60 11 59 17 Email: [email protected] JUAN SANTALO †† †† IE Business School Dept. of Strategy Maria de Molina, 12, 28006 Madrid, Spain Tel: +34 91 568 96 00 Email: [email protected] ANNABELLE GAWER ††† ††† Surrey Business School University of Surrey Guildford, Surrey, GU2 7XH, UK Tel: +44 (0)1483682056 Email: [email protected]
Transcript of What Is the Impact of Within-Platform Competition in Two ... · What Is the Impact of...
1
What Is the Impact of Within-Platform Competition in Two-Sided Markets?
M. MAHDI TAVALAEI†
† Surrey Business School University of Surrey
Guildford, Surrey, GU2 7XH, UK Tel: +44 (0) 70 60 11 59 17
Email: [email protected]
JUAN SANTALO††
†† IE Business School Dept. of Strategy
Maria de Molina, 12, 28006 Madrid, Spain Tel: +34 91 568 96 00
Email: [email protected]
ANNABELLE GAWER†††
†††Surrey Business School
University of Surrey Guildford, Surrey, GU2 7XH, UK
Tel: +44 (0)1483682056 Email: [email protected]
2
What Is the Impact of Within-Platform Competition in Two-Sided Markets?
ABSTRACT
We analyze the impact of exogenous changes in competition within one side of a two-sided
platform on the optimal pricing of both sides. We take into account both the positive impact
through cross-network externalities and the negative impact through higher competition in the
marketplace. We find that within-one-side competition on one side increases the price charged to
the other side. The same-side price increases only if the platform’s capacity is constrained. We
test our hypotheses in the U.S. airport industry and we find that increased airline competition
within an airport increases commercial revenues per passenger in airports, and increases landing
revenue per passengers but only for capacity-constrained airports. Airport financial performance
increases only for those airports that adopt a two-sided approach in their pricing strategy.
Keywords: Platform Competition, Two-sided Markets, Airport Industry, Network Externalities.
INTRODUCTION
Two-sided platforms are becoming increasingly important in the corporate landscape. Among the
largest IPOs in the last few years, many have a two-sided model: Alibaba, with $25 billion; Visa,
$19.7 billion; Facebook, $16 billion; Twitter, $2.1 billion; Linkedin, $1.2 billion; Google, $1.67
billion. Moreover, new ventures like Airbnb or Über threaten to disrupt well-established industries
like taxi or hospitality services using a platform model. This surge has attracted a great deal of
attention from both economics and management researchers (e.g., Ansari,Garud , and
3
Kumaraswamy, 2016; Armstrong, 2006; Boudreau 2010; Boudreau and Jeppesen, 2015;
Eisenmann, Parker, and Van Alstyne, 2011; Rochet and Tirole 2003; Zhu and Iansiti, 2012).
According to this literature, these platforms work by facilitating interaction among distinct agents
on two (or more) sides of a market. For instance, e-commerce platforms like eBay help buyers to
more easily find sellers and vice versa; credit cards reduce the transaction costs of merchants and
consumers; the Google search engine makes advertisers visible to readers. Two-sided platforms
are usually characterized by the presence of indirect network effects or cross-network externalities
(e.g., Rochet and Tirole, 2003) by which users on one side value more those platforms with a
higher number of other side users. Furthermore, many of these platforms have an optimal cross-
subsidization pricing strategy that involves subsidizing one-side users—the subsidized side—
charging them prices that are lower than marginal costs; while extracting rents from the other
side—the monetized side (e.g., Armstrong, 2006; Rochet and Tirole, 2006).
Platform operators in two-sided markets often need to manage the degree of within-one-
side competition to balance conflicting interests of users on the two sides. For instance, while
videogame developers would like to avoid competition with other videogame developers, gamers
may prefer more competition among developers to generate better products at lower prices.
Similarly, eBay buyers want more competition among eBay sellers, while sellers want less.
Meanwhile, the intensity of within-one-side competition also affects the platform’s own pricing
strategies and performance. Yet, there is a scarce literature on how platform operators handle the
competition trade-off of attracting a large number of members on each side without creating too
much competition within sides (See Boudreau, 2012, and Cennamo and Santalo, 2013, for
exceptions). In this paper we address the following research questions. First, how do increases in
4
within-one-side competition impact platform pricing strategy on each side? Second, how do
increases in within-one-side competition impact the platform financial performance?
In a nutshell, we empirically find that an increase of within-one-side competition is
associated with higher prices levied to the other side of the market. We also uncover the conditions
under which within-one-side competition leads to same side price increases. Finally, we show how
platforms that do not take into account the demand interdependency between both sides into their
pricing strategies have lower financial performance.
We contribute to the literature that investigates the differential aspects of how two-sided
platforms should compete in the marketplace. Zhu and Iansiti (2012) show that quality can be more
relevant for platform success in the market than solely relying on the strength of indirect network
effects. Boudreau and Jeppesen (2015) investigate the costs and benefits of growth in number of
competing (unpaid) complementors for the platform; while Ansari and his co-authors (2016)
analyze how a new entrant can successfully compete against a platform leader by using a
coopetition strategy that adapts to changes in the ecosystem across time., Our paper is directly
related to recent studies that have stressed the potential negative impact of increasing within-one-
side competition on platform performance in the marketplace. Cennamo and Santalo (2013), in the
videogame industry, report a trade-off between enhancing competition on one side and securing
some agents on the same side by exclusive contracts. Boudreau (2010, 2012) shows how within-
one-side competition may lessen innovation incentives for complementary product producers on
the same side. Our paper is also related to the literature that analyzes how managing a platform
ecosystem requires balancing the interests of both sides of the market (Ansari et al., 2016; Gawer,
2014; Gawer and Cusumano, 2002; Iansiti and Levien, 2004; Rysman, 2009). For instance, media
platforms and magazines have to decide on the amount of exposure given to advertisements, given

5
that viewers look for less intrusion and advertisers for maximum exposure (Hagiu, 2014; Hagiu
and Jullien, 2011); or in the software industry, piracy protection by the software platform such as
operating systems makes software developers better off at the expense of end-users who prefer
free or low-cost pirate software (Rasch and Wenzel, 2013).
We analyze the trade-offs posed by increasing within-one-side competition in one side in
the context of the airport industry. Modern airports are good candidates for study from a multi-
sided platform perspective (Gillen, 2011). This is because airports serve three distinct sides of
users—airlines, passengers, and commercial retailers in the terminals—whose interaction relies on
the passengers who fly on the airlines and buy merchandise in the airport retail stores (Czerny,
2006). In addition, there are clear indirect network effects, since ceteris paribus commercial
retailers will value more an airport with more airlines and therefore more passengers. Therefore,
as platforms, airports can subsidize airlines in order to bring more passengers to the terminals and
appropriate higher rents from the commercial retail side (Armstrong, 2007; Ivaldi, Sokullu, and
Toru, 2011). Additionally, there are negative intragroup externalities, since both airlines and
commercial retailers dislike an increase in same-side competition while passengers may dislike
congested terminals.
Two characteristics make U.S. airports particularly relevant to explore our research
questions. First, in the year 2000, the U.S. Congress approved the Wendell H. Ford Aviation
Investment and Reform Act for the Twenty-First Century (hereafter AIR-21). This legislation
mandated that airports subject to particular criteria diminish entry barriers for new airlines. We
exploit this change in regulation, which exogenously forced increased competition on one side of
the platform for some airports but not others, to build a difference-in-difference econometric model
and a regression discontinuity design that allows us to estimate the impact of this change on airport

6
strategy and performance. Second, for historical reasons some airports explicitly take into account
both sides of the market when deciding the prices for each side, while other airports distinctly price
each side of the market independently of the other. Thus we can estimate the differential impact
of a change in within-one-side competition depending on whether airports adopt a one side versus
a two-side pricing policy.
We find that in response to the rise of competition among airlines, airports increased the
fees charged to commercial retailers, and that as a result commercial revenue per passenger
increased by 20 percent on average. This increase was significantly more pronounced (62 percent
on average) for those airports that had a two-sided pricing policy. Landing fees went up, by 19
percent, as a result of AIR-21, but only in those airports that were capacity-constrained. Airports
that could benefit from cross-subsidization pricing could raise their profitability in response to the
exogenous shock of AIR-21 (roughly a 9 percent increase in operating ROS and $1.18 increase in
operating income per passenger), while “non-platform” airports could not.
Our study contributes to the literature in several ways. First, while previous research
considered change in within-one-side competition as a deliberate act undertaken by the platform
operator, we analyze a change forced by the external environment, thus ruling out endogeneity
concerns and facilitating causal inference. To our knowledge, no study has directly tested how
competition within one side of a platform affects the platform’s strategy for both sides. Some
authors (Godes, Ofek, and Sarvary, 2009; Jin and Rysman, 2012; Seamans and Zhu, 2014) have
investigated the effect of changes in across-platform competition within one side of the market on
the other side. For instance, Seamans and Zhu (2014) report that when local newspapers face
stronger competition from craigslist, they tend to increase subscription prices. However, these
studies do not address changes in within-one-side competition.
7
Furthermore, this is the first empirical study to examine the impact of product market
competition on different pricing approaches—two-sided platform versus conventional one-
sided—in the same industry. We analyze not only the different firms´ responses to enhanced
intragroup competition but also the effect on their financial performance. Our empirical evidence
shows that a two-sided platform approach allows airports to cope better with the increase in within-
airport competition caused by the legislation.
EMPIRICAL CONTEXT AND HYPOTHESES
The airport industry
Modern airports gain revenue from two distinct sources: aeronautical revenue, which is based on
airline-related activities such as landing fees, and non-aeronautical revenue from commercial
tenants within terminals, parking, and car rentals concessions (Gillen, 2011). Recently, non-
aeronautical revenue has become a substantial portion of the airports´ profit (Barrett, 2000; Fuerst,
Gross, and Klose, 2011). Jarach (2001: 122) calls this trend the most significant “quantum leap”
in the airport industry evolution. For instance, in North America more than half of the revenue of
the airports corresponds to the non-aeronautical side (Fuerst et al., 2011). Both airport sides are
subject to negative intragroup competition effects; commercial retailers prefer to be the dominant
seller in the terminal, and airlines lose by competing intensively with many other airlines for
passengers. Further, the cross-network externalities are asymmetric, as they are with newspapers
and advertising-based media, where one side cares more about the participation of the other side
on the platform than vice-versa. Airlines relatively care about the commercial outlets in the
terminals; their main concern is the facilities provided and related fees for aeronautical activities.
But commercial retailers do care about the volume of passengers that airlines bring as potential

8
buyers. Thus, the cross-network externalities from airlines to commercial retailers resemble the
ones in newspapers, magazines, and other advertising-supported media, in which advertisers crave
for more readers/viewers, though the opposite craving is not clear ( Rysman, 2009; Roson, 2005).
Like other multisided platforms (Rochet and Tirole, 2003, 2006), airports can internalize these
externalities by adjusting prices for the different sides (Czerny, 2006; Ivaldi et al., 2011).
Increase of airline competition in U.S. airports
In 2000, the U.S. Congress passed the Wendell H. Ford Aviation Investment and Reform Act for
the Twenty-First Century (AIR-21) to diminish entry barriers to U.S. airports and foster
competition among airlines. This law, implemented in fiscal year 2001, required all “covered”
airports in the United States to submit a competition plan with the Federal Aviation Administration
(FAA) to give “new entrant” airlines adequate access to airport facilities such as boarding gates,
ticket counters, baggage handling and storage facilities, and take-off and landing slots. Covered
airports were those that (1) account for more than 0.25 percent of enplanements at U.S. primary
airports and (2) are highly dominated by a few airlines (controlling more than 50% of traffic). For
these covered airports, the approval of future federal funds is contingent on a satisfactory
competition plan and steps taken to reduce entry barriers for all air carriers willing to serve those
airports, with the FAA as the judge. Previous studies have shown that this regulation substantially
and efficiently reduced the barriers to entry for new carriers in concentrated airports (e.g., Ciliberto
and Williams, 2010; Snider and Williams, 2015).
Governance model and financing sources of U.S. airports
Most of the commercial airports in the United States are owned and operated by a department of
city/state government, or an independent airport authority or port authority (FAA/OST Task Force
9
Study, 1999). The main revenue sources of U.S. airports are (i) federal grants or Airport
Improvement Program (AIP), (ii) Passenger Facility Charges (PFC), 1 (iii) airside income as
specified in the use-and-lease agreements with airlines, (iv) nonairside (commercial side) income
as specified in concession contracts, and (v) revenue bonds, which are secured exclusively by
revenues from (iii) and (iv) or future income from (ii) (Fuhr and Beckers, 2009).
Despite public governance in most U.S. airports, the major ones involve extensive private
control over virtually all aspects of airport planning, design, finance, operations, pricing, and
access (de Neufville, 1999). Because of increasing competition, airports have sought to operate in
a more businesslike manner by expanding and diversifying their sources of revenue, especially
non-airside sources such as retail concessions (Graham, 2008). Although public airports receive
federal funding through AIP and PFCs, airport development is financed to a great extent through
funds raised in capital markets. And since U.S. carriers face a very competitive market, airlines
push airports toward efficiency and profitability goals (Carney and Mew, 2003). Although not
strictly following the worldwide privatization trend, many airports in the United States have in
recent years begun to be organized as quasi-privatized airport authorities.
Competition (especially between hub airports), limits on governmental funds, restrictive
regulation and scrutiny of airline fees, extensive engagement of private third parties in airport
businesses, and long-term collaborations with airlines that put pressure on the airports for cost
reduction and efficiency all make it quite reasonable to assume that U.S. airports pursue profit
1 PFCs are charged by airlines at the time of ticket purchase and are then transferred directly to the airports.

10
(Gillen and Lall, 1997). Any extra income allows them to finance future infrastructure investments
needed to maximize the connectivity of their regional area of influence.
Airport pricing
There are two types of agreements with airlines by which U.S. airports typically calculate
aeronautical fees. Under a so-called residual approach2, airports set landing fees (and other fees to
the airlines) while taking into account both aeronautical and non-aeronautical revenues (Doganis,
1992; Graham, 2008). In those airports, so-called signatory airlines play a prominent role.
Signatory airlines are those that execute a long-term agreement with a particular airport, while
non-signatory airlines operate seasonal or limited services, generally with no signatory agreement.
Airports following a residual approach use non-aeronautical revenue to offset the fee charged to
signatory airlines, while signatory airlinesa pledge to cover any potential airport deficit or “residual
costs” not covered by airport non-aeronautical revenues. Hence, fees to signatory airlines are
determined by the amount of non-aeronautical revenue (and revenue from non-signatory airlines)
deducted from the airport´s full operation costs (Ashford and Moore, 1992). Not surprisingly,
informal evidence indicates that airports using residual agreements are under constant pressure by
signatory airlines to generate as much revenue as possible out of commercial concessionaires
(Richardson, Budd, and Pitfield, 2014).
On the other hand, in a compensatory3 approach, no such cross-subsidization exists.
Landing fees are based exclusively on airside costs (Crider et al., 2011; Doganis, 1992; Graham,
2008); indeed, the airport separates aeronautical and commercial operations as independent
2 In Europe, it is referred to as the single till approach. 3 In Europe, it is referred to as the dual till approach.

11
financial entities. This approach divides all revenues and expenses between the two financially
independent profit-cost centers (Rivas, 2002).
The difference between a compensatory and a residual pricing approach is critical to
determine the airport ability to internalize the externalities between the multiple market sides
through prices. In particular, airports following a compensatory approach are unable to use the so-
called divide-and-conquer strategy by which one side subsidizes the other. We consider the
residual pricing approach to be akin to a platform approach, and the compensatory approach to be
akin to non-platform business model. Below we develop the implications of this crucial difference
for airport behavior and performance.
Theory development
Two-sided platforms usually subsidize the agents on one side of the platform to extract more
revenue from the other side of the platform, in what is called the divide-and-conquer strategy
(Rochet and Tirole, 2006). The higher the number of agents on the incentivized or subsidized side,
the higher is the surplus on the other side, so that platforms can inflate the price paid by the agents
on this monetized side. For instance e-Bay does not charge buyers and generates its profits
charging sellers, Google does not ask a price for the usage of its search engine and profits just from
advertisers’ fee, shopping malls do not demand anything from consumers and profits from
retailer’s rental fees. Note that the subsidized side may still pay positive prices but lower than
marginal costs. This is the case of the videogame industry in which Sony or Microsoft subsidize
videogame users by selling them consoles at a price lower than the average production cost of the
hardware. Overall, this cross-subsidized or skewed pricing by incentivizing the subsidized agents
12
to participate on the platform, which in turn makes the platform attractive for the agents on the
other side, raises and preserves positive feedback between the two sides´ agents participation
In the airport industry, similar to advertising-based platforms, the cross-network
externalities are asymmetric and skewed toward one side of the platform. While users of Google
care little, if any, to the advertising pop-ups, a high number of visitors are critical for advertisers’
exposure and profitability. Accordingly, as mentioned above, Google charges no fee to visitors to
increase the installed base of users on that side, and extracts rents from advertisers, who benefit
from visitors. Similarly, the airlines are the critical agents of airport platform: it is their passengers
who make the airport attractive for retailers while airports without retailers are still somehow
attractive for airlines. Airports that take account of this asymmetry in their pricing strategy can
subsidize landing fees to attract more airlines and flights to the airside, and recover this cost from
a mark-up in commercial side prices (Armstrong, 2007; Malavolti, 2010). Hence, we can think of
the airside and commercial side respectively as the subsidized side and the monetized sides of the
airport platform.
Increased competition between airlines that serve the same airport lowers airline ticket
prices (Snider and William, 2015) and would therefore be expected in turn to benefit the airport’s
commercial concessionaires. This is because, first, lower ticket prices may increase the number of
passengers, raising either unit sales or retail prices in airport commercial outlets. Second, lower
ticket prices may increase passengers’ disposable income and thus airport commercial sales. In
order to take advantage of this increased competition one would expect airports to exploit this
presumed increase in retailer profitability and further increase the rents demanded from
commercial concessions:

13
Hypothesis 1. Higher within-airport competition among airlines will increase the price for
retailers on the commercial side.
What is the optimal airport pricing strategy for the airside? All else equal, airlines are going to
dislike operating in airports with a large number of competitors since this presses the airlines to
reduce prices and diminishes profitability prospects. As a direct result of these negative intragroup
externalities, airlines are likely to be more reluctant to expand their operations in the now more
competitive airports. We call this the “rent dissipation effect,” and it should translate into lower
airport prices charged to airlines, to partially compensate them for this new more hostile
environment. However, a more competitive environment may also affect the balance of power
between the airport and airlines. An airport that depends on just a few airlines should have a lower
bargaining power to set landing fees; when within-airport competition among airlines steepens,
the balance of power between airlines and airport shifts in favor of the airport, and as a
consequence landing fees should go up. We call this the “bargaining power effect.”
The impact of enhanced within-one-side competition depends on whether the rent dissipation
effect is higher or lower than the bargaining power effect. A priori there is no reason to expect that
one should always dominate the other, and therefore we do not have a clear hypothesis about the
impact of within-airport competition among airlines on the prices charged by the airport to the
airlines. Yet, there are some situations in which we can make a straightforward prediction. Take
the case of capacity-constrained airports in terms of landing slots, where the number of flights at
regular hours can barely increase. The Industrial Organization literature has documented both
conceptually and empirically that binding capacity constraints lower the intensity of competition
(Bresnahan and Sulow, 1989; Kreps and Scheinkman, 1983). As a result, in capacity-constrained
airports competition among airlines should be less harmful and therefore the rent dissipation effect

14
will be lower. In other words, when within-airport competition goes up for airlines, the damage to
airline’s bottom line is going to be lower in capacity-constrained airports, because these airport
structurally can only serve a limited number of flights and this weakens or puts a limit for the
escalation of battle among the airlines. Hence, we presume that in those specific airports, the
bargaining power effect will dominate a diminished rent dissipation effect. This is, airports with a
higher level of within-airport competition levels will gain traction over airlines that will allow to
charge them higher landing fees. Airlines will still be willing to pay these larger fees because in
capacity constrained airports competition is less harmful. Thus:
Hypothesis 2. When within-airport competition among airlines steps up, airports that are
capacity-constrained will increase the price they charge to airlines.
As explained above airports with a residual approach use commercial revenue to subsidize
airline fees. This cross subsidization, so-called divide-and-conquer strategy in the platform
literature, is by construction absent in airports using a compensatory approach. Airports with a
residual approach examine the revenue on both sides for setting the landing fees and because the
way in which their pricing is designed airlines are subsidized more the higher is the commercial
revenue. On the contrary, airports using a compensatory approach cannot cross-subsidize between
the two airport sides. Thus, compensatory- airports cannot behave as two-sided platforms
(Malavolti, 2010) in regard to its pricing strategy.
When competition in the airside increases, airports under residual pricing structure have
more incentive to increase the fee charged to commercial retailers. This happens because residual
agreement airports are able to apply the commercial revenue for offsetting the airlines fees. This
subsidization generates the standard reinforcing loop that characterizes pricing in two-sided market
15
that at the end translates into a bolstering of the fees applied to commercial concessions. That is,
more competition between airlines generates changes in passenger volume and expenditure that
creates higher commercial revenues that then allows increasing commercial fees. Higher
commercial revenue lowers fees for signatory airlines in airports with a residual pricing approach.
This last cross-subsidization, that abates airline tariffs, reinforces the positive impact of
competition on passenger expenditure causing a further increase in commercial revenues that
permits airports an additional rise in commercial concession fees.
It is worthwhile stressing that this reinforcing loop does not apply to airports under
compensatory agreements with airlines. These airports retain all commercial revenue for
themselves but they are unable to cross-subsidize airlines to generate the reinforcing loop that
bolsters even further commercial revenue in residual-based airports. Thus their final commercial
fees would be lower and therefore they may be unable to convert in better financial performance
the increase in within-one-side competition:
Hypothesis 3a. Higher within-airport competition among airlines will increase the price
for retailers on the commercial side more if they can apply cross-subsidization pricing
between the airside and the commercial side.
Hypothesis 3b. Higher within-airport competition among airlines will increase the
financial performance of airports more if they can apply cross-subsidization pricing
between the airside and the commercial side.
DATA, METHOD, AND RESULTS
Empirical strategy
16
The impact of AIR-21 has been studied in previous research, mainly on the airline industry. Most
notably, Snider and Williams (2015) found that AIR-21 significantly decreased airline fares, by
13.4 to 20.2 percent, on routes linked to the covered airports—mostly, they contend, by increasing
the penetration of low-cost carriers into new markets.
In this study, we turn our attention to the airport as the unit of analysis and examine the
effect of AIR-21, via heightening the rivalry among airlines, on both sides of the airport’s pricing
structure. To do so, we first run a difference-in-difference (hereafter DD) model to investigate the
effect of AIR-21 on the dependent variables. DD models are widely used for causal inference when
a particular intervention affects part of the sample at a certain time but not the other part (Angrist
and Pischke, 2008)—in effect creating a natural experiment with treatment and control groups.
This method and the nature of AIR-21 help us to lessen many of the identification strategy
problems in two-sided platform studies.
We build a simple DD model as follows:
𝑌𝑌𝑖𝑖𝑖𝑖 = 𝜓𝜓 𝑇𝑇𝑇𝑇𝑇𝑇𝑇𝑇𝑇𝑇𝑖𝑖 × 𝑃𝑃𝑃𝑃𝑃𝑃𝑇𝑇𝑖𝑖 + 𝑇𝑇𝑇𝑇𝑇𝑇𝑇𝑇𝑇𝑇𝑖𝑖 + 𝜏𝜏 𝑃𝑃𝑃𝑃𝑃𝑃𝑇𝑇𝑖𝑖 + 𝜙𝜙 𝑋𝑋𝑖𝑖𝑖𝑖 + 𝜖𝜖𝑖𝑖𝑖𝑖 , (1)
where Yit denotes the dependent variable at time t for airport i—namely commercial
revenue per passenger, landing revenue per passenger, and airport performance (measured by
operating income per passenger and operating ROS). Treati and Postt are the indicators of
belonging to the treatment group and being after the AIR-21 intervention, respectively. The
interaction of these dummy variables indicates whether the legislation affected observation i at
time t; it equals one only if the airport is a covered one and the time is after 2000. Xit is a vector of
control variables, and 𝝐𝝐𝒊𝒊𝒊𝒊 is an error term. In particular, we are interested in the coefficient of Treati
and Postt interaction to see whether or not the AIR-21 intervention causes a different trend in
17
covered airports than in the rest. We run an OLS regression with robust standard errors clustered
at the airport level to deal with the possibility that errors may be correlated among observations
belonging to the same airport. In some specifications we incorporate airport fixed effects, into the
model to deal with time-invariant unobservable factors (Angrist and Pischke, 2008; Bertrand,
Duflo, and Mullainathan, 2004).
It could be that airports with specific (unobserved) characteristics may be more likely to
be highly concentrated and thus covered by AIR-21. If these unobserved characteristics are at the
same time correlated with our dependent variables a simple DD model may suffer from a selection
problem (Snider and Williams, 2015). We apply a regression discontinuity design, described later,
to deal with this concern.
Data
We collected longitudinal data on 66 major U.S. airports for ten years from 1996 to 2005. We base
our sample on these 66 airports for two reasons. First, these airports are all medium and large hubs
(accounting for at least 0.25% of total domestic enplanements); smaller airports are not covered
by AIR-21 regardless of their concentration, and for many of these small airports financial data
from the FAA are not available. Second, as we capture the Air 21 coverage data from Snider and
Williams (2015), we use the same sample they analyzed.
According to Snider and Williams (2015), 43 of these airports were immediately covered
by AIR-21 and are considered as the treatment group in our natural experiment. The remaining 23
airports were not required to implement any mandatory competition plan (at least until 2005) and

18
thus constitute the control group.4 The aeronautical and nonaeronautical revenues of the airports,
as well as hub status, come from the Federal Aviation Administration (FAA) database, which
provides all U.S. airports’ annual reports. We also use data from the U.S. Department of
Transportation (DOT). DOT’s T-100 segment database contains data on all domestic and
international yearly flights to/from U.S. airports, including origin and destination airports, number
of passengers transported, and name of carrier. We use these data to build our variables for
passenger traffic, penetration by low-cost carriers, and the number of airports serving the same
city market. We obtain flight delay data from DOT´s On-Time Performance database, and ticket
price (in U.S. dollars) for each incoming and outgoing flight from DOT’s DB1B database. To
determine airports’ pricing approaches, we use the results of a 1998 survey conducted by the
Airports Council International-North America (ACI-NA)5 that specifies the type of financial
agreement between airport and signatory airlines for about 47 airports, along with the expiration
dates of the agreements. As most of these leasing agreements are long-term (by average 20 years
in our sample), we observe no change within our panel data period in the type of agreement
between a given airport and its signatory airlines. Finally, the data on airport ownership and income
per capita in each metropolitan statistical area come from the FAA and the U.S. Bureau of
Economic Analysis (BSA).
Variables
Dependent variables
4 We excluded from our sample four airport-year observations with values of the dependent variables higher than three standard deviations from the mean. 5 Reported in FAA/OST Task Force Study, 1999.
19
We measure price for in-terminal retailers and airlines, respectively, by the natural logarithm of
commercial revenue per passenger and landing revenue per passenger. Commercial revenue
includes in-terminal revenues to the airport from food and beverage sales, bookstores, gift shops,
duty-free shops, and other in-terminal commercial activities such as currency exchanges and
advertising. Landing revenue, covers the fees charged to airlines for the use of facilities such as
runways, landing strips, runway protection zones, and clearways. In our sample commercial
revenue represents 27 percent of total airport operating revenue, while landing revenue is 48
percent on average. The rest of airports´ operating revenue consists basically of rent for land and
nonterminal facilities, rental car lots, and terminal arrival areas such as check-in and ticket
counters; parking fees; and fees for aircraft parking or tiedown—facilities for securing the aircrafts
while parked. We measure airport performance by operating income per passenger6 and return on
sales in terms of operating revenue (operating ROS)7.
Independent variables
AIR-21 intervention. We build two dummy variables, one to distinguish treatment from control
group (treat equals one if the airport is covered by AIR-21 and zero otherwise), and one (post) to
distinguish years before (1999 to 2000) and after (2001 to 2005) AIR-21 enactment. The
6 13 observations pertaining to seven airports (in both control and treatment groups) have negative operating income. Hence, if we do the natural logarithm transformation and treat those observations as missing data, our findings suffer from probable sample selection bias. Therefore, we do not use the natural logarithm transformation for this ratio. 7 This analysis would have been more conclusive if we had been able to consider ROA or ROE as an additional measure of performance. However, the huge amount of unreported data on airports´ assets for years earlier than 2000 in the FAA records made it impossible for us to compute these variables.

20
coefficient of the interaction term (treat × post) determines the significance of AIR-21 intervention
in our difference-in-difference specification (Angrist and Pischke, 2008).
Airport’s capacity constraint. Chatterji and Zhang (2007) show how capacity-constrained
airports, in terms of landing slots and other aeronautical facilities, tend to have higher delays.
Using this insight, we consider that airports with higher delays should be more capacity
constrained and we split our sample by the annual average of delays in departures and arrivals.
The first (fourth) quartile of this variable indicates relatively low (high) delays, and hence
identifies airports with low (high) capacity constraints. It is true that airport delays are also caused
by weather conditions and therefore we may be wrongly classifying airports that systematically
have bad weather as capacity-constrained airports. However we do not believe that this
measurement error has a sizable impact in our results.. First, the FAA establishes that weather
causes longer delays in those airports that are capacity-constrained8. This means that bad weather
will cause higher total delays in constrained airports and therefore total delay is a good indicator
of airport capacity constraints. Second, note that all our estimations below have airport fixed
effects so any systematic bias driven by a wrongly classified airport should be captured by airport
dummies.
Airport´s pricing approach. The type of pricing arrangement is known for about 47
airports. To test hypothesis 3a and 3b, we split our sample into two subsamples in which all airports
implement either residual or compensatory pricing, and exclude airports that combine residual and
compensatory agreements with different airlines (12 airports accounting for 97 observations). We
do include these “hybrid-pricing approach” airports in the extension analyses.
8 See FAA webpage https://www.faa.gov/nextgen/programs/weather/faq/

21
Control variables
The presence of competitors in the market may modify an airport´s pricing strategies. We control
for competition among airports by including the number of airport owners that serve the same city
market (city competition). Roughly forty percent of the airports in our sample are monopolists in
their city markets, whereas around forty percent compete with one or two rivals, and twenty
percent with three or four. A salient presence of low-cost carriers (LCC) in an airport may affect
both the airside, for instance by lowering aeronautical charges (Barrett, 2004; Humphreys, Ison,
and Francis, 2006), and the commercial side, by attracting passengers whose purchase profiles
differ from those of legacy carrier travelers (Castillo-Manzano, 2010; Graham, 2008). We compute
the LCC penetration variable as the percentage of all passengers per airport per year who are
traveling with low-cost carriers using the definition of Sniders and Williams (2015). To rule out
any direct effect of change in ticket price on consumers´ expenditure in the terminals, we include
(the natural logarithm of) yearly average of ticket price at each airport as a control variable. Finally,
the model contains (the natural logarithm of) income per capita for the metropolitan statistical area
in which each airport is located and a dummy variable for hub status (equal to one if large hub,
zero otherwise). We apply the natural logarithm transformation as log(xj+1) and log(xj+2) for
airport competition and LCC penetration, respectively (Wooldridge, 2013) to avoid losing those
observations with one airport per city market or zero percentage of low-cost carriers.
Descriptive statistics
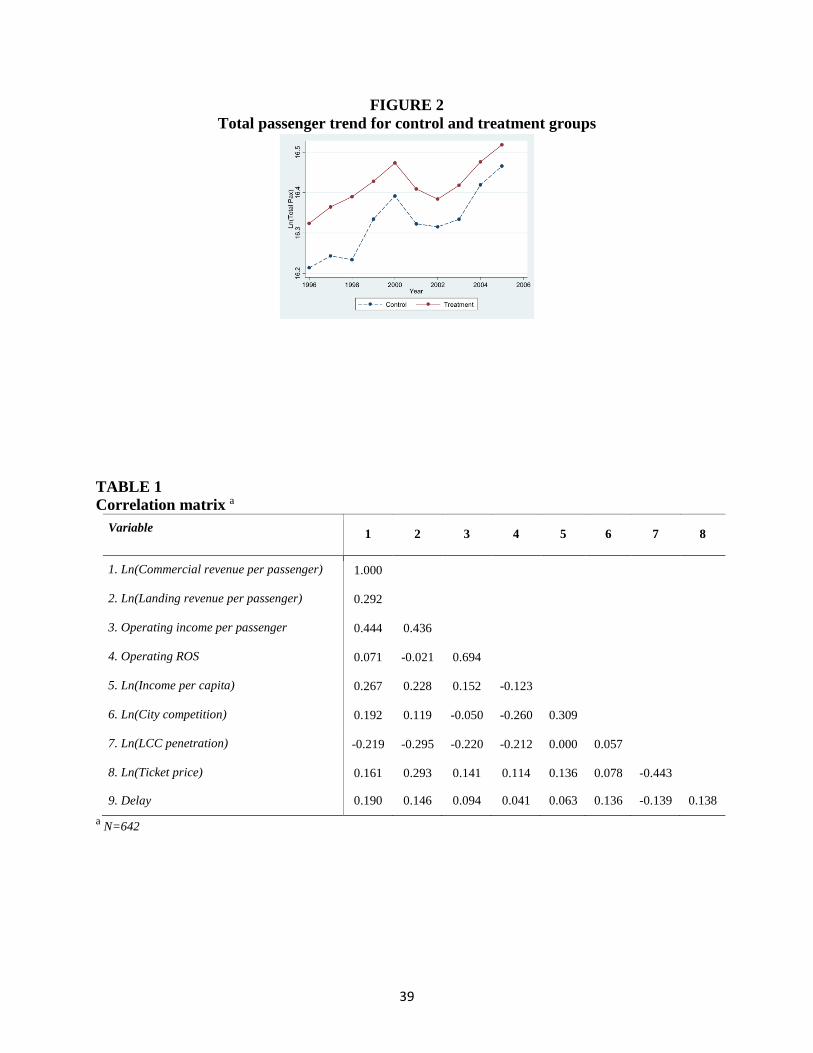
Tables 1 and 2 present the descriptive statistics and correlations of the variables. Pairwise
correlations in Table 1 do not show any evidence of multicollinearity. Also, as we expected, there
is a significant and negative correlation between LCC penetration and both sides’ revenue per
22
passenger. Low-cost carriers demand lower landing fees and other aeronautical fees (Barrett,
2000), and their passengers seem less willing to spend money while waiting in the terminals.
------------------------------------- Insert Table 1 about here
-------------------------------------
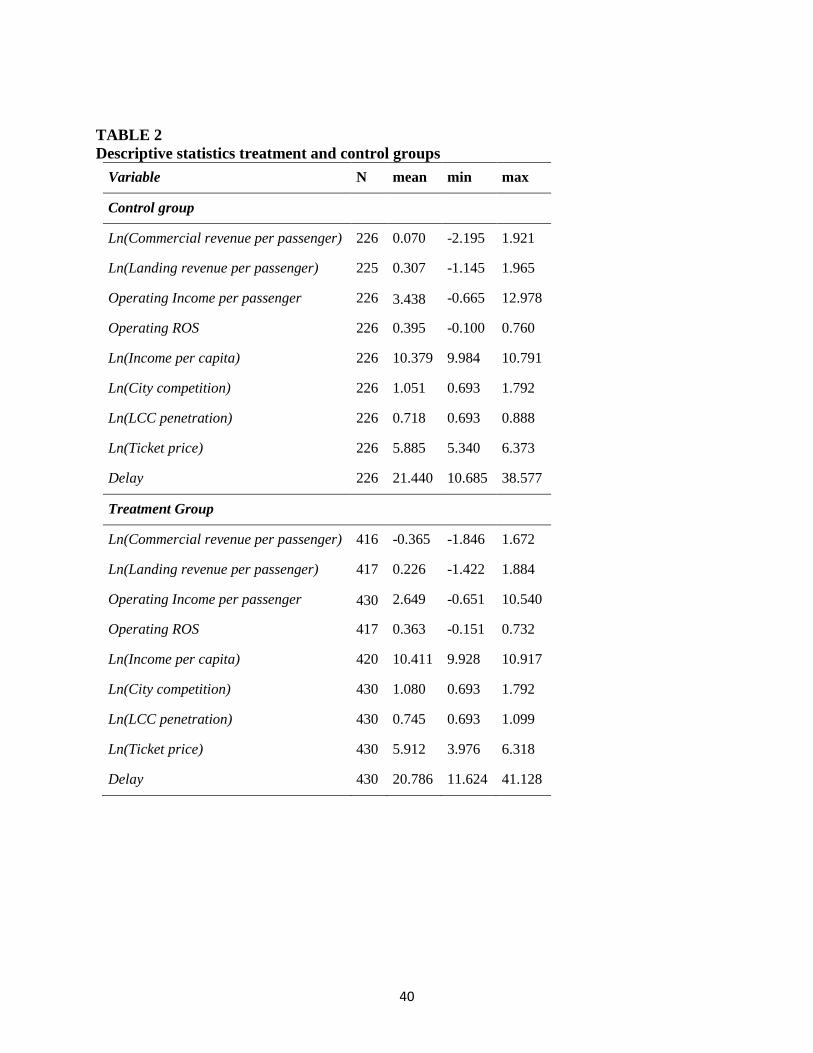
Table 2 shows that overall, treatment and control groups are fairly homogeneous in terms
of control variables: income per capita, competition within a city, LCC penetration, and average
ticket price. Hence, we can be reasonably confident that the hypothetical change in dependent
variables after AIR-21 is not confounded with substantial heterogeneity in at least these observable
characteristics. We check this further in the robustness analysis below.
------------------------------------- Insert Table 2 about here
-------------------------------------
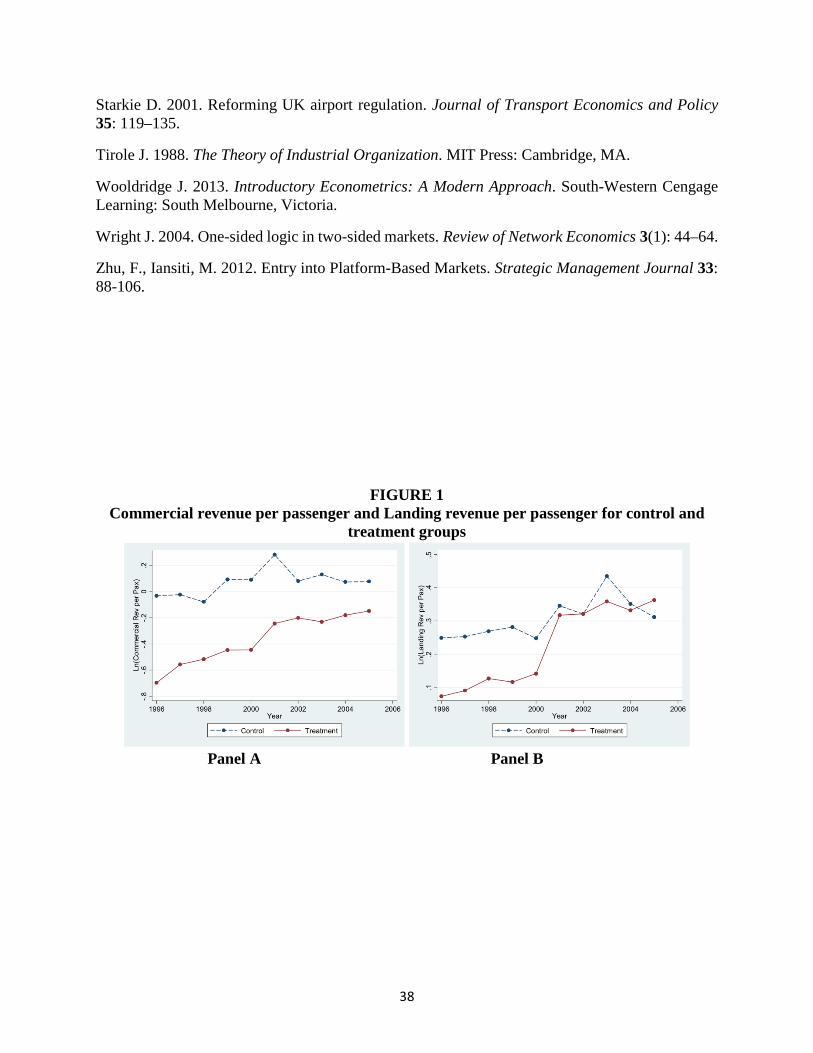
Figure 1 illustrates briefly the difference trend of covered vs. non-covered airports before
and after AIR-21. Panel A, which plots the average of commercial revenue per passenger in every
year, shows a modest increasing trend for both non-covered and covered airports before 2000. We
expect the trend for non-covered airports to keep rising smoothly, while AIR-21 alters the curve
for covered airports. However, the figure demonstrates a dramatic rise in commercial revenue per
passenger in year 2001 for both groups. We believe this sharp increase is due to the aftermath of
the September 11, 2001 terroristic attack, which caused a dramatic fall in demand for air travel.
This sharp decline in the number of passengers, the denominator of our dependent variables,
translates into a steep jump in 2001 for these ratios. The drop in passengers in year 2001 is evident
in Figure 2 for both groups of airports. As all airports experienced this shock in their passenger
demand, this event is not a confounding factor in our analysis. After this shock, the curve for the
increase of revenue in non-covered airports continues smoothly and even flattens somewhat, while

23
the growth curve steepens for covered airports—we claim, as a consequence of AIR-21. This
pattern is consistent with Figure 1 Panel B for landing revenue per passenger, though the
differences in trend after 2000 are not as apparent as in Panel A—an ambiguity that is consistent
with our second hypothesis, that the rise of landing fees is contingent on the airport’s capacity
constraint.
------------------------------------- Insert Figure 1 about here
------------------------------------- -------------------------------------
Insert Figure 2 about here -------------------------------------
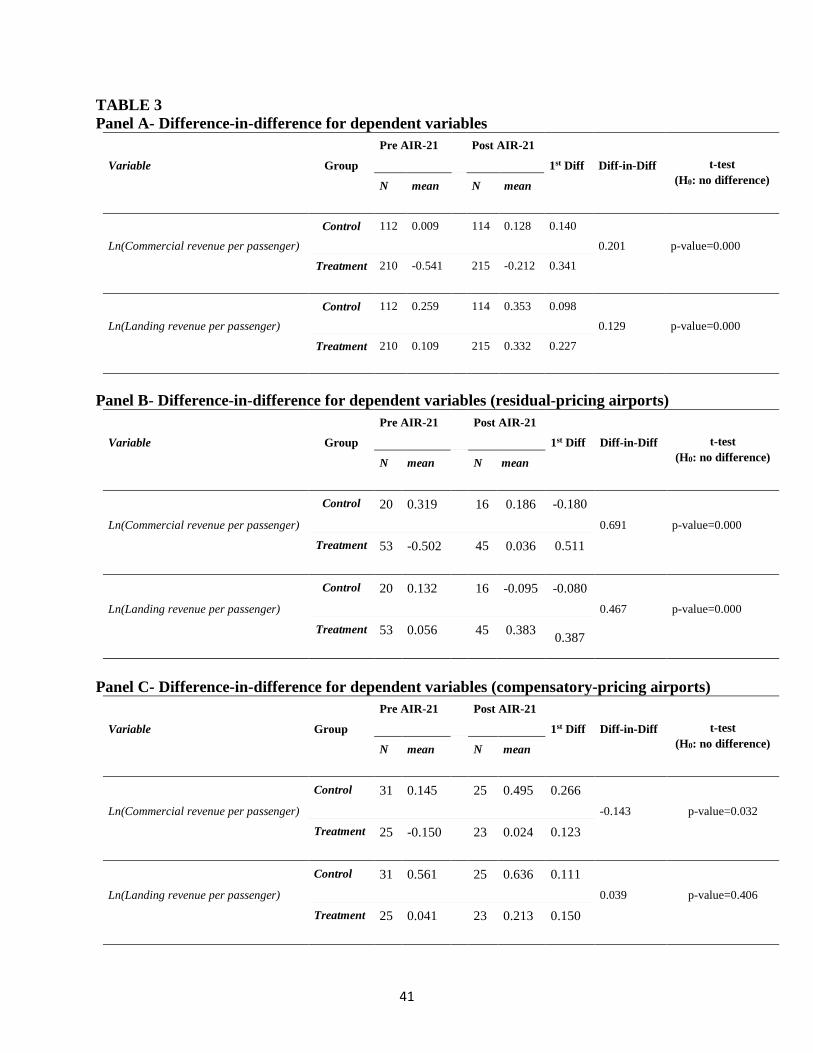
Table 3 translates these graphical patterns into numbers with simple means. First, for each
dependent variable, we calculate the averages for the years before and after the enactment of AIR-
21 for each airport. The first difference for each airport is then the difference between these
averages. Table 3 displays the mean of this first differenced variable computed separately for
covered and non-covered airports. A positive numbers, for instance, imply that the dependent
variable increased by average, after AIR-21. Finally, we compute the difference of these first
differences between covered and non-covered airports—difference in difference variable—, along
applying a t-test for the statistical significance of this difference Table 3, Panel A shows the results
for the whole sample. It depicts the natural logarithm of both commercial and landing revenue per
passenger grew more after AIR-21 at covered airports than they did at non-covered ones, by 43
and 31 percent respectively ([0.341- 0.140]/0.140 = 1.43 , so 43% growth and [0.227 -
0.098]/0.098=1.31, so 31% growth). Building the same tables for airports under compensatory and
residual agreements, Panels B and C reveals that, in line with our theoretical reasoning, after AIR-
21 commercial revenue per passenger for covered versus non-covered airports increased only for
residual-pricing airports and not for those using compensatory pricing. In the next sections, we
24
examine the significance and robustness of this finding in a full-fledged difference-in-difference
econometric model.
------------------------------------- Insert Table 3 about here
------------------------------------- Results
Table 4 shows the results of the DD model, using as the dependent variable commercial and
landing revenue per passenger, as proxies for commercial and airside prices, respectively. Models
1a and 1b are outcomes of OLS regression with robust standard errors clustered at airport level,
after we dropped the extreme observations (see footnote four), whereas models 2a and 2b are
results from median regressions keeping all observations. Models 3a and 3b are similar to Models
1a and 1b, while absorbing the airport time-invariant fixed effects.
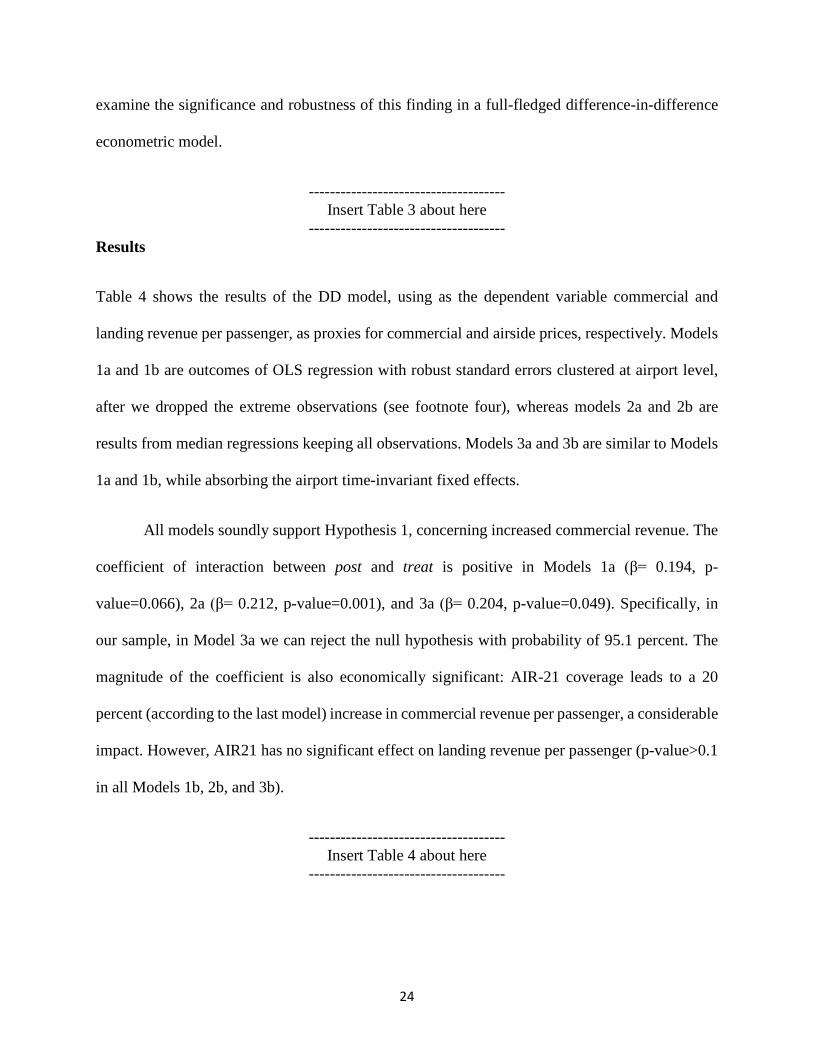
All models soundly support Hypothesis 1, concerning increased commercial revenue. The
coefficient of interaction between post and treat is positive in Models 1a (β= 0.194, p-
value=0.066), 2a (β= 0.212, p-value=0.001), and 3a (β= 0.204, p-value=0.049). Specifically, in
our sample, in Model 3a we can reject the null hypothesis with probability of 95.1 percent. The
magnitude of the coefficient is also economically significant: AIR-21 coverage leads to a 20
percent (according to the last model) increase in commercial revenue per passenger, a considerable
impact. However, AIR21 has no significant effect on landing revenue per passenger (p-value>0.1
in all Models 1b, 2b, and 3b).
------------------------------------- Insert Table 4 about here
-------------------------------------
25
We test the second hypothesis by distinguishing between airports with high and low
capacity constraints. Table 5 illustrates the results of a DD model with airport fixed effects for the
two subsamples.9 In accord with Hypothesis 2, Air-21 is associated with a roughly 20 percent rise
in landing revenue per passenger (β= 0.191, p-value=0.090) in those airports subject to capacity
constraints. For unconstrained airports, we are far from able to reject the null hypothesis. Analysis,
not reported here but available upon request, cannot reject the statistical significance of the
difference between these two coefficients; hence, these findings should be considered cautiously.
------------------------------------- Insert Table 5 about here
-------------------------------------
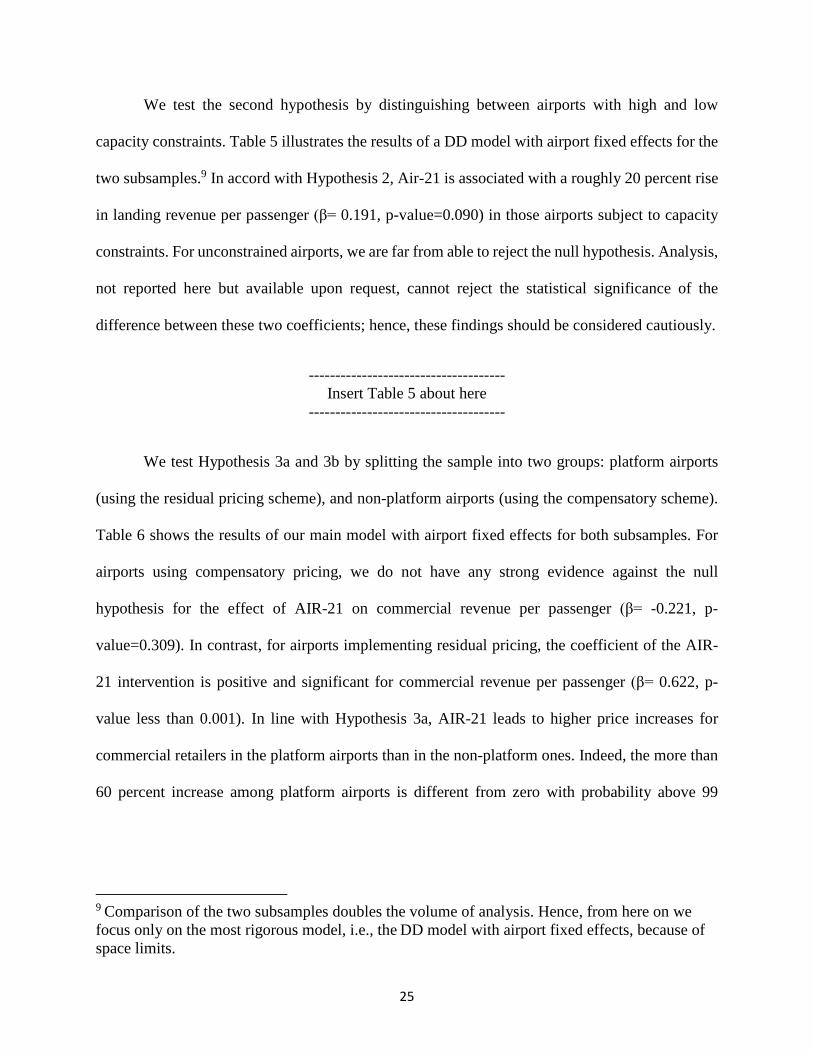
We test Hypothesis 3a and 3b by splitting the sample into two groups: platform airports
(using the residual pricing scheme), and non-platform airports (using the compensatory scheme).
Table 6 shows the results of our main model with airport fixed effects for both subsamples. For
airports using compensatory pricing, we do not have any strong evidence against the null
hypothesis for the effect of AIR-21 on commercial revenue per passenger (β= -0.221, p-
value=0.309). In contrast, for airports implementing residual pricing, the coefficient of the AIR-
21 intervention is positive and significant for commercial revenue per passenger (β= 0.622, p-
value less than 0.001). In line with Hypothesis 3a, AIR-21 leads to higher price increases for
commercial retailers in the platform airports than in the non-platform ones. Indeed, the more than
60 percent increase among platform airports is different from zero with probability above 99
9 Comparison of the two subsamples doubles the volume of analysis. Hence, from here on we focus only on the most rigorous model, i.e., the DD model with airport fixed effects, because of space limits.

26
percent. Further analysis, not reported here but available upon request, confirms the statistical
significance of the difference between the coefficients of the two subsamples.
------------------------------------- Insert Table 6 about here
-------------------------------------
Next, we examine the effect of AIR-21 on airport financial performance for residual-
pricing and compensatory-pricing airports. We ran our main DD models with airport fixed effects
while considering operating income per passenger and return on sales in terms of operating
revenue (operating ROS) as dependent variables. Table 7 and 8 show no significant effect of AIR-
21 on airport performance for airports with compensatory pricing. On the other hand, for airports
with residual pricing, AIR-21 led to increases in both operating income per passenger (β= 1.185,
p-value=0.042) and operating ROS (β= 0.089, p-value=0.065). We interpret these results using the
same logic stated above, under which residual pricing allows the airport to subsidize signatory
airlines, and therefore eventually reinforcing the positive loop between the commercial side and
the airside. Accordingly, residual-pricing airports experience an increase of profitability that does
not happen for airports using compensatory pricing. Notice that though not statistically significant,
the coefficient of AIR-21 coverage is negative in the subsample of compensatory-pricing airports.
We also apply the same DD model to a subsample of airports using hybrid pricing (12
airports in our sample). Airports using hybrid pricing allocate only part of their non-aeronautical
revenue to airline subsidies. But while residual-pricing airports appropriate all commercial revenue
exceeding operational cost, airports under hybrid agreements share this excess revenue with the
airlines (Graham, 2008; Rivas, 2002). Compared to compensatory-pricing airports, they benefit
from the ability to offset airline fees and diminish the rent dissipation effect to some extent, but
compared to residual-pricing airports they suffer both from limitation in this cross-subsidization

27
ability and from lower appropriation of excess commercial revenue. Therefore, we expect the
effect of within-airport competition among airlines on the performance of hybrid-pricing airports
to fall in between the effects for airports with compensatory and residual approaches. Table 7 and
8 show that the coefficients of this effect on operating ROS decrease from residual, to hybrid, to
compensatory pricing (β =0.089, p-value=0.065; β=0.047, p-value=0.453; β=0.008, p-
value=0.799). The same trend is observable for operating income per passenger, our second proxy
of airport performance. Interestingly, when we pool all the airports together, the results do not
show any significant effect of AIR-21 on airport performance (p-value>0.1 for whole sample
models in Table 7 and 8). This reemphasize the fact that the performance increases only for the
airports that can perfectly (residual-pricing) or partially (hybrid-pricing) cross-subsidize between
the airside and commercial side. We interpret the evidence displayed on Table 7 and 8 consistent
with Hypothesis 3b.
------------------------------------- Insert Table 7 about here
------------------------------------- -------------------------------------
Insert Table 8 about here -------------------------------------
Robustness tests whose results are not reported here but are available from the authors
upon request confirm our results. First we introduce a placebo intervention to the model, faking an
arbitrary year as the year of intervention. In no case does the placebo intervention have any effect
on the dependent variables. Second, following the advice of Bertrand, Duflo, and Mullainathan
(2004), we use a block bootstrap method to deal with potential serial correlation arising from the
“intervention variable” itself (in our setting, interaction of the post and treat variables), which may
cause over-rejection of the null hypothesis. In this method for creating the bootstrap samples,
instead of resampling randomly as in the normal bootstrap process, one keeps together all

28
observations belonging to the same block/cluster (airport in our context; see Bertrand et al., 2004;
Efron and Tibshirani, 1994).The results we obtain are qualitatively the same.
Regression discontinuity design
It could be argued that our dependent variables are likely to correlate with the determinant of AIR-
21 coverage, thus our simple DD model suffers from selection bias problem. Airports with specific
unobservable characteristics may be more likely to be highly concentrated and thus covered by
AIR-21 (Snider and Williams, 2015). To rule out this concern, following Angrist and Pischke
(2008), we build a sharp regression discontinuity design as follows:
𝑌𝑌𝑖𝑖 = 𝜓𝜓𝐷𝐷𝑖𝑖 + 𝛽𝛽1𝑥𝑥𝑖𝑖 + 𝛽𝛽1𝑥𝑥�𝑖𝑖2 + 𝜌𝜌1𝐷𝐷𝑖𝑖𝑥𝑥�𝑖𝑖 + 𝜌𝜌2𝐷𝐷𝑖𝑖𝑥𝑥�𝑖𝑖2 + 𝜀𝜀𝑖𝑖 , (2)
where Yi is the the difference between the average commercial revenue per passenger (in
logs) in 2001-2005 and the average commercial revenue per passenger in 1996- 2000 (also in logs).
Di is a dummy variable indicating whether the given airport is covered by AIR-21 (Treati).Variable
𝑥𝑥�𝑖𝑖 is the concentration of carriers at the airport (xi) minus the coverage cut-off (x0=0.50). In other
words, it is the concentration of airlines at a given airport centered at 0.50 level— 𝑥𝑥�𝑖𝑖 = 𝑥𝑥𝑖𝑖 − 𝑥𝑥0.
The treatment effect at 𝑥𝑥� is 𝜓𝜓 + 𝜌𝜌1𝑐𝑐 + 𝜌𝜌2𝑐𝑐2 , where c is the mean of airports concentration
centered at coverage cut-off (x-x0) in our sample. Also, 𝜓𝜓 and 𝜌𝜌𝑖𝑖 are corresponding coefficients
resulted from above model. Having these numbers, we compute the magnitude of the treatment
effect, then we apply an F-test to see whether this effect is significantly different from zero.
Although additional control variables are not necessarily included in regression discontinuity
design, Imbens and Lemieux (2008) assert that inclusion of these variables can increase the
precision of the estimation. We apply models both with and without control variables. The added
29
control variables to equation 2 are constructed identically as dependent variable describe before.
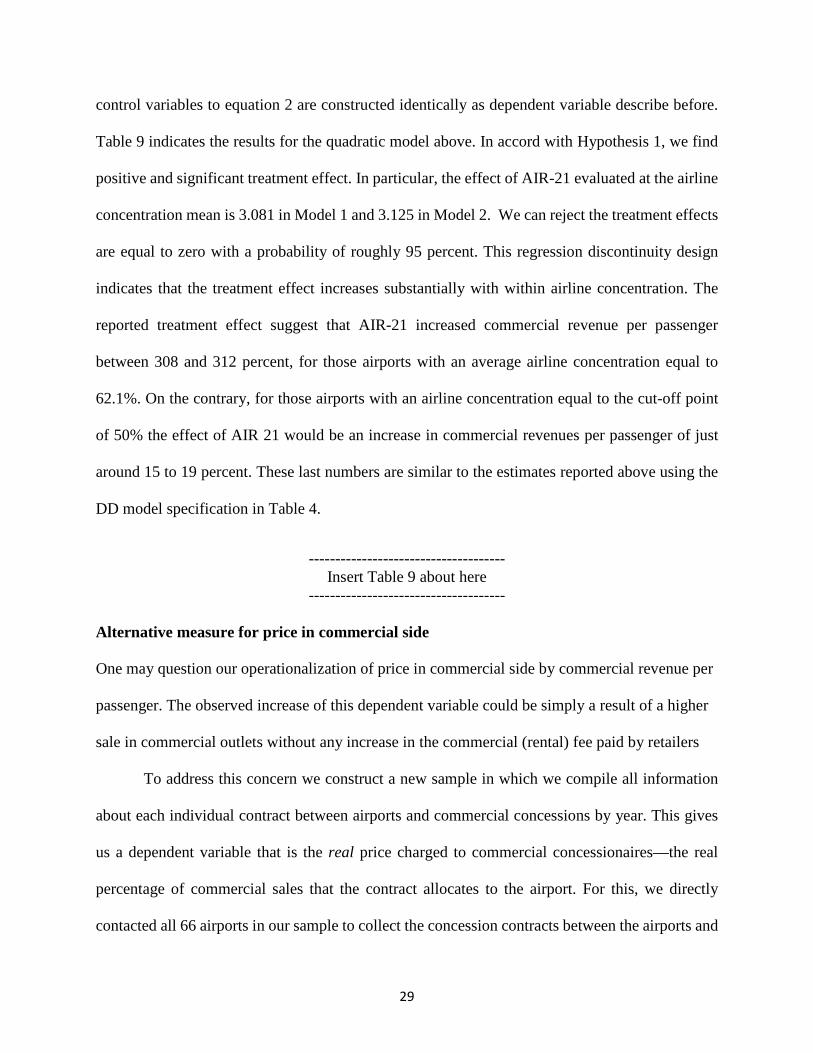
Table 9 indicates the results for the quadratic model above. In accord with Hypothesis 1, we find
positive and significant treatment effect. In particular, the effect of AIR-21 evaluated at the airline
concentration mean is 3.081 in Model 1 and 3.125 in Model 2. We can reject the treatment effects
are equal to zero with a probability of roughly 95 percent. This regression discontinuity design
indicates that the treatment effect increases substantially with within airline concentration. The
reported treatment effect suggest that AIR-21 increased commercial revenue per passenger
between 308 and 312 percent, for those airports with an average airline concentration equal to
62.1%. On the contrary, for those airports with an airline concentration equal to the cut-off point
of 50% the effect of AIR 21 would be an increase in commercial revenues per passenger of just
around 15 to 19 percent. These last numbers are similar to the estimates reported above using the
DD model specification in Table 4.
------------------------------------- Insert Table 9 about here
-------------------------------------
Alternative measure for price in commercial side
One may question our operationalization of price in commercial side by commercial revenue per
passenger. The observed increase of this dependent variable could be simply a result of a higher
sale in commercial outlets without any increase in the commercial (rental) fee paid by retailers
To address this concern we construct a new sample in which we compile all information
about each individual contract between airports and commercial concessions by year. This gives
us a dependent variable that is the real price charged to commercial concessionaires—the real
percentage of commercial sales that the contract allocates to the airport. For this, we directly
contacted all 66 airports in our sample to collect the concession contracts between the airports and
30
commercial retailers.10 For the 14 airports that responded we built a database showing the real
percentage of gross sales (for each of five product categories: food and nonalcoholic beverages,
liquor, gifts and news, specialty and retail, and duty-free) that concessionaires must pay to the
airport. This new dataset contains data about 14 airports, nine of which are covered by AIR-21 and
five not covered, for years 1996 to 2005, although we do not have information for all five product
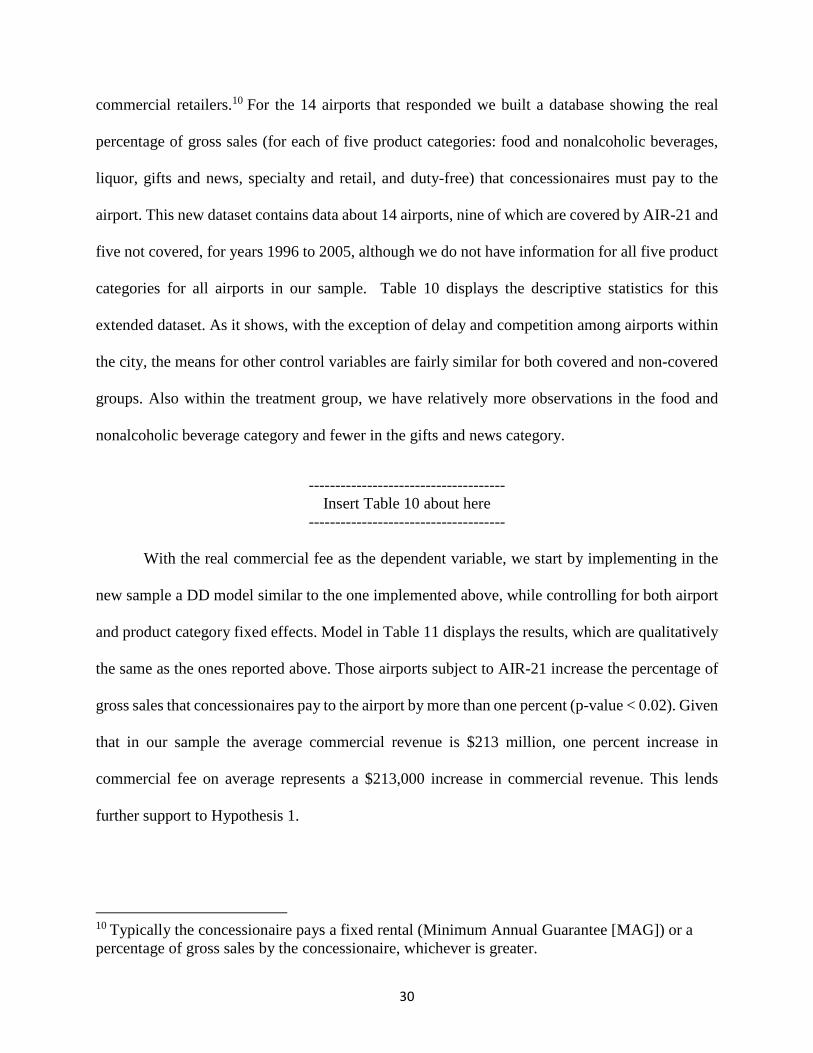
categories for all airports in our sample. Table 10 displays the descriptive statistics for this
extended dataset. As it shows, with the exception of delay and competition among airports within
the city, the means for other control variables are fairly similar for both covered and non-covered
groups. Also within the treatment group, we have relatively more observations in the food and
nonalcoholic beverage category and fewer in the gifts and news category.
------------------------------------- Insert Table 10 about here
-------------------------------------
With the real commercial fee as the dependent variable, we start by implementing in the
new sample a DD model similar to the one implemented above, while controlling for both airport
and product category fixed effects. Model in Table 11 displays the results, which are qualitatively
the same as the ones reported above. Those airports subject to AIR-21 increase the percentage of
gross sales that concessionaires pay to the airport by more than one percent (p-value < 0.02). Given
that in our sample the average commercial revenue is $213 million, one percent increase in
commercial fee on average represents a $213,000 increase in commercial revenue. This lends
further support to Hypothesis 1.
10 Typically the concessionaire pays a fixed rental (Minimum Annual Guarantee [MAG]) or a percentage of gross sales by the concessionaire, whichever is greater.
31
------------------------------------- Insert Table 11 about here
-------------------------------------
Unfortunately, we cannot apply a regression discontinuity design properly in this new
sample as we did above because of the low number of observations. We have only 48 airport-
product category for 1996 to 2005 (416 observations in total). Yet, only 29 of those airport-
product category observations have information both for before and after AIR 21. Hence, for
applying a regression discontinuity design we would have a sample with 29 observation. Instead,
we endeavor to use a window analysis to overcome the inconvenience of implementing a
regression discontinuity method with such a small sample. Following Snider and Williams
(2015) we assume that any unobservable characteristic is likely to be evenly distributed among
airports that are either just below or just above the AIR-21 concentration cut-off. Hence, we
apply the same DD model using a subsample of 416 airport-product category-year observations
that fall within a small window around cut-off to estimate the effect of AIR-21. Model 2 in Table
11 displays for airports with 40 to 60 percent concentration (that is, within 0.2 of the coverage
cut-off). 124 observations belong to airports that have a concentration between 40 and 50
percent, while 40 observation refer to airports with a concentration between 50 and 60 percent.
AIR-21 results in roughly an eleven percent increase (β= 0.116) of commercial fee to covered
airports (p-value= 0.016), which supports our first hypothesis.
DISCUSSION AND CONCLUSION
This is the first empirical study in the two-sided market literature that shows the effects of changing
competition within one side of the market on prices in both sides of the market. In accord with one

32
basic insight of the platform literature, we find that increased airside competition lets airports
increase prices in the other side, for the commercial concessionaires. Furthermore, airport
performance seems to improve only for airports that apply a two-sided approach in their pricing
strategy. This shows that at least in our empirical context, the negative effect of within-one-side
competition on that side’s agents, the airlines, can be outweighed by the positive effect it generates
on the other side, commercial concessionaires. Our empirical identification strategy based on a
regulatory shock that applied to some airports and not others makes us confident that we can infer
causality from the reported correlations.
Our findings stress the relevance and explanatory power of applying the distinct economic
logic of two-sided markets to illuminate the behavior of economic agents in specific markets, the
behavior which could otherwise not be explained. Consider a standard one-sided setting in which
companies have suppliers and customers. In that framework an increase of competition between
suppliers should imply diminished input prices. Firms operating in one-sided markets will turn
these lower input prices into lower prices for the final consumer in a way that is inversely
proportional to residual demand elasticity (Tirole, 1988). This means that in one-sided settings an
exogenous competition between suppliers should be associated with lower final consumer prices.
A subset of two-sided platforms are intermediaries between buyers and sellers (e.g., ebay, Uber,
and Airbnb). Our results specifically suggest that in such two-sided settings, in which the firm
plays an intermediary role between suppliers and consumers and levies some fees to both without
purchasing and reselling the good, this traditional logic does not apply; indeed, an opposite effect
occurs. In this case, since a higher number of suppliers and more intensive competition among
them leads to a higher variety and/or a lower price of the good for consumers, the consumers´
utility increases, and the intermediary firm can then levy a higher fee on the consumers. This is

33
consistent with the theoretical model of Galeotti and Moraga-Gonzalez (2009) which predicts that
increasing the number of retailers, and thus increasing both variety for buyers and competition
among retailers, will cause the platform to decrease the retailers´ fees but increase the buyers´ fees.
The implications of this distinction between one-sided and two-sided logic is both
theoretically and practically far-reaching. We show that in the same industry and a similar situation
(increased competition within one of the platform sides), airports that apply a two-sided platform
approach outperform those that are restricted to a conventional one-sided approach. Generally
speaking, this finding emphasizes the relevance of the two-sided approach when externalities exist
between different sides of the market. Firms that better internalize the cross-network externalities
manage to benefit; neglecting these feedback loops may result in underperforming. This is
important because there has been an increase in the number of industries in which firms using one-
sided approach are competing alongside firms with a multi-sided approach. Think in the retailing
industry (online and offline) in which companies like eBay or Taobao using a two-sided strategy
compete with firms like WalMart, Zappos or Costco that have a more traditional one-sided
approach.
Moreover, for researchers and policy makers studying firm responses to environmental
drivers, it is crucial to distinguish between one-sided and two-sided market dynamics. Neglecting
this nuance may lead to what Wright (2014: 44) calls “applying conventional wisdom from one-
sided markets in two-sided market settings” In particular in the airport industry, Gillen (2011)
highlights the significance of this distinction for regulators and managers and calls for rethinking
aviation policy and strategy from this perspective. Our study is among the first to answer this call.
Particularly, we show that residual/dual till pricing enables an airport to fully internalize the
externalities between the commercial side and the airside of its market and behave in accordance

34
with a two-sided business logic, while compensatory/single till pricing does not. These two
systems lead to fundamentally different performances for airports facing a change in within-airport
competition among airlines. This difference is highly relevant to the analysis of market definition
and market power, and to airport regulation (Gillen, 2011; Starkie, 2001).
As a limitation of this study, we have to stress that while we control for competition among
airports, most airports in our sample act as local monopolies in their city markets, and in many city
markets that do have multiple airports they all belong to the same public entity. This means that
future research should investigate the validity of our results and hypotheses in settings with
significant competition across platforms. Additionally, detailed historical data about vertical
financing agreements between airports and airlines can help to elucidate why airports choose a
platform versus non-platform approach, an important issue that our study does not address. Finally,
the positive effect of within-one-side competition on platform performance may not apply in all
empirical contexts. In particular, Boudreau (2010) and Cennamo and Santalo (2013), studying
handheld computing systems and the videogame industry respectively, have shown that within-
one-side competition impairs innovation and product quality, a negative effect that does not apply
to our airport setting, since innovation is less critical in the airport industry than in technology
platforms. This would suggest for further studies about the impact of within-one-side competition
across various empirical settings as a fruitful avenue to future research.
REFERENCES
Angrist JD, Pischke JS. 2008. Mostly Harmless Econometrics: An Empiricist’s Companion. Princeton University Press: Princeton, NJ.
Ansari S, Garud R, Kumaraswamy A. 2016. The disruptor’s dilemma: TiVo and the U.S. television ecosystem. Strategic Management Journal 36: 1829–1853.
Armstrong M. 2006. Competition in two-sided markets. Rand Journal of Economics 37(3): 668–691.

35
Armstrong M. 2007. Two-sided markets: economic theory and policy implications. In Recent Developments in Antitrust: Theory and Evidence, Choi JP (ed). MIT Press: Cambridge, MA; 39–59.
Ashford N, Moore C. 1992. Airport Finance. Chapman and Hall: London.
Barrett SD. 2000. Airport competition in the deregulated European aviation market. Journal of Air Transport Management 6(1): 13–27.
Barrett SD. 2004. How do the demands for airport service differ between full-service carriers and low-cost carriers? Journal of Air Transport Management 10: 33–39.
Bertrand M, Duflo E, Mullainathan S. 2004. How much should we trust differences-in-differences estimates? Quarterly Journal of Economics 119(1): 249–275.
Boudreau KJ. 2010. Open platform strategies and innovation: granting access vs. devolving control. Management Science 56(10): 1849–1872.
Boudreau KJ. 2012. Let a thousand flowers bloom? An early look at large numbers of software app developers and patterns of innovation. Organization Science 23(5):1409–1427.
Boudreau KJ, Jeppesen LB. 2015. Unpaid crowd complementors: The platform network mirage. Strategic Management Journal 36: 1761-1777.
Bresnahan T, Suslow V. 1989. Oligopoly pricing with capacity constraints. Annales d’Economie et de Statistique 15/16: 267–289.
Carney M, Mew K. 2003. Airport governance reform: a strategic management perspective. Journal of Air Transport Management 9(4): 221–232.
Castillo-Manzano JI. 2010. Determinants of commercial revenues at airports: lessons learned from Spanish regional airports. Tourism Management 31(6): 788–796.
Cennamo C, Santalo J. 2013. Platform competition: strategic trade‐offs in platform markets. Strategic Management Journal 34(11): 1331–1350.
Chatterji GB, Zheng Y. 2007. Impact of airport capacity constraints on national airspace system delays. Paper presented at the 7th AIAA Aviation Technology, Integration and Operations Conference (ATIO), Belfast, Northern Ireland.
Ciliberto F, Williams JW. 2010. Limited access to airport facilities and market power in the airline industry. Journal of Law and Economics 53(3):467–495.
Crider R, Preisler M, Autin E, Roth S, Fulton S, Swartzlander J, Tharp G. 2011. Guidebook for Developing and Leasing Airport Property, Project No. 01-08. Transportation Research Board: Washington, DC.
Czerny AI. 2006. Price-cap regulation of airports: single-till versus dual-till. Journal of Regulatory Economics 30(1): 85–97.

36
De Neufville R. 1999. Airport privatization: issues for the United States. Transportation Research Record: Journal of the Transportation Research Board 1662: 24–31.
Doganis R. 1992. The Airport Business. First edition. Routledge: London and New York.
Eisenmann T, Parker G, Van Alstyne M. 2011. Platform envelopment. Strategic Management Journal 32(12): 1270–1285.
Efron B, Tibshirani R. 1994. An Introduction to the Bootstrap. Monographs in Applied Statistics and Probability, No. 57. Chapman and Hall: New York.
FAA/OST Task Force. 1999. Airport business practices and their impact on airline competition. http://ntl.bts.gov/lib/17000/17100/17129/PB2000108301.pdf Fuerst F, Gross S, Klose U. 2011. The sky is the limit? The determinants and constraints of European airports commercial revenues. Journal of Air Transport Management 17(5): 278–283.
Fuhr J, Beckers T. 2009. Contract design, financing arrangements and public ownership—an assessment of the US airport governance model. Transport Reviews 29(4): 459–478.
Galeotti A, Moraga-González JL. 2009. Platform intermediation in a market for differentiated products. European Economic Review 53(4): 417–428.
Gawer A. 2014. Bridging differing perspectives on technological platforms: Toward an integrative framework. Research Policy 43(7): 1239–1249. Gawer A, Cusumano MA. 2002. Platform Leadership: How Intel, Microsoft and Cisco Drive Industry Innovation. Harvard Business School Press: Boston, MA.
Gillen D. 2011. The evolution of airport ownership and governance. Journal of Air Transport Management 17(1): 3–13.
Gillen D, Lall A. 1997. Developing Measures of Airport Productivity and Performance: An Application of Data Envelope Analysis. Elsevier Science Ltd.: London.
Graham A. 2008. Managing Airports: An International Perspective. Butterworth Heinemann-Elsevier: Oxford.
Godes D, Ofek E, Sarvary M. 2009. Content vs. advertising: the impact of competition on media firm strategy. Marketing Science 28(1): 20–35.
Hagiu A. 2014. Strategic decisions for multisided platforms. MIT Sloan Management Review, 55(2): 71–80.
Hagiu A, Jullien B. 2011.Why do intermediaries divert search? Rand Journal of Economics 42(2): 337–362.
Humphreys I, Ison S, Francis G. 2006. A review of the airport–low cost airline relationship. Review of Network Economics 5: 413–420.

37
Iansiti M, Levien R. 2004. The Keystone Advantage: What the New Dynamics of Business Ecosystems Mean for Strategy, Innovation, and Sustainability. Harvard Business School Press: Cambridge, MA.
Imbens GW, Lemieux T. 2008. Regression discontinuity designs: A guide to practice. Journal of econometrics 142(2): 615–635.
Ivaldi M, Sokullu S, Toru T. 2011. Airport prices in a two sided framework: an empirical analysis. Paper presented at the CSIO/IDEI 10th Joint Workshop on Industrial Organization, Toulouse.
Jarach D. 2001. The evolution of airport management practices: towards a multi-point, multi-service, marketing-driven firm. Journal of Air Transport Management 7(2): 119–125.
Jin GZ, Rysman M. 2012. Platform pricing at sports card conventions. Working paper, University of Maryland: College Park, MD.
Kreps D, Scheinkmam J. 1983. Quantity pre-commitment and Bertrand competition yield Cournot outcomes. Bell Journal of Economics 14: 326–337.
Malavolti E. 2010. Single till or dual till at airports: a two-sided market analysis. Paper presented at Séminaire Economie de l’Aérien, Toulouse.
Rasch A, Wenzel T. 2013. Piracy in a two-sided software market. Journal of Economic Behavior Organization 88: 78–89.
Richardson C, Budd L, Pitfield D. 2014. The impact of airline lease agreements on the financial performance of US hub airports. Journal of Air Transport Management 40: 1–15.
Rivas V. 2002. Large commercial airports in the United States: operating revenue framework. MSc. Dissertation in Urban Studies and Planning. Massachusetts Institute of Technology: Cambridge, MA.
Rochet JC, Tirole J. 2003. Platform competition in two-sided markets. Journal of the European Economic Association 1(4): 990–1029.
Rochet JC, Tirole J. 2006. Two-sided markets: a progress report. Rand Journal of Economics 37(3): 645–667.
Roson R. 2005. Two-sided markets: a tentative survey. Review of Network Economics 4(2): 142–159.
Rysman M. 2009. The economics of two-sided markets. Journal of Economic Perspectives 23(3): 125–143.
Seamans R, Zhu F. 2014. Responses to entry in multi-sided markets: the impact of craigslist on local newspapers. Management Science 60(2): 476–493.
Snider C, Williams JW. 2015. Barriers to entry in the airline industry: a multi-dimensional regression-discontinuity analysis of AIR-21. Review of Economics and Statistics 97(5): 1002–1022.
38
Starkie D. 2001. Reforming UK airport regulation. Journal of Transport Economics and Policy 35: 119–135.
Tirole J. 1988. The Theory of Industrial Organization. MIT Press: Cambridge, MA.
Wooldridge J. 2013. Introductory Econometrics: A Modern Approach. South-Western Cengage Learning: South Melbourne, Victoria.
Wright J. 2004. One-sided logic in two-sided markets. Review of Network Economics 3(1): 44–64.
Zhu, F., Iansiti, M. 2012. Entry into Platform-Based Markets. Strategic Management Journal 33: 88-106.
FIGURE 1
Commercial revenue per passenger and Landing revenue per passenger for control and treatment groups
Panel A Panel B
39
FIGURE 2 Total passenger trend for control and treatment groups
TABLE 1 Correlation matrix a
Variable 1 2 3 4 5 6 7 8
1. Ln(Commercial revenue per passenger) 1.000
2. Ln(Landing revenue per passenger) 0.292
3. Operating income per passenger 0.444 0.436
4. Operating ROS 0.071 -0.021 0.694
5. Ln(Income per capita) 0.267 0.228 0.152 -0.123
6. Ln(City competition) 0.192 0.119 -0.050 -0.260 0.309
7. Ln(LCC penetration) -0.219 -0.295 -0.220 -0.212 0.000 0.057
8. Ln(Ticket price) 0.161 0.293 0.141 0.114 0.136 0.078 -0.443 9. Delay 0.190 0.146 0.094 0.041 0.063 0.136 -0.139 0.138
a N=642
40
TABLE 2 Descriptive statistics treatment and control groups
Variable N mean min max
Control group
Ln(Commercial revenue per passenger) 226 0.070 -2.195 1.921
Ln(Landing revenue per passenger) 225 0.307 -1.145 1.965
Operating Income per passenger 226 3.438 -0.665 12.978
Operating ROS 226 0.395 -0.100 0.760
Ln(Income per capita) 226 10.379 9.984 10.791
Ln(City competition) 226 1.051 0.693 1.792
Ln(LCC penetration) 226 0.718 0.693 0.888
Ln(Ticket price) 226 5.885 5.340 6.373
Delay 226 21.440 10.685 38.577
Treatment Group
Ln(Commercial revenue per passenger) 416 -0.365 -1.846 1.672
Ln(Landing revenue per passenger) 417 0.226 -1.422 1.884
Operating Income per passenger 430 2.649 -0.651 10.540
Operating ROS 417 0.363 -0.151 0.732
Ln(Income per capita) 420 10.411 9.928 10.917
Ln(City competition) 430 1.080 0.693 1.792
Ln(LCC penetration) 430 0.745 0.693 1.099
Ln(Ticket price) 430 5.912 3.976 6.318
Delay 430 20.786 11.624 41.128
41
TABLE 3 Panel A- Difference-in-difference for dependent variables
Variable Group Pre AIR-21 Post AIR-21
1st Diff Diff-in-Diff t-test (H0: no difference) N mean N mean
Ln(Commercial revenue per passenger) Control 112 0.009 114 0.128 0.140
0.201 p-value=0.000 Treatment 210 -0.541 215 -0.212 0.341
Ln(Landing revenue per passenger) Control 112 0.259 114 0.353 0.098
0.129 p-value=0.000 Treatment 210 0.109 215 0.332 0.227
Panel B- Difference-in-difference for dependent variables (residual-pricing airports)
Variable Group Pre AIR-21 Post AIR-21
1st Diff Diff-in-Diff t-test (H0: no difference) N mean N mean
Ln(Commercial revenue per passenger) Control 20 0.319 16 0.186 -0.180
0.691 p-value=0.000 Treatment 53 -0.502 45 0.036 0.511
Ln(Landing revenue per passenger) Control 20 0.132 16 -0.095 -0.080
0.467 p-value=0.000 Treatment 53 0.056 45 0.383 0.387
Panel C- Difference-in-difference for dependent variables (compensatory-pricing airports)
Variable Group Pre AIR-21 Post AIR-21
1st Diff Diff-in-Diff t-test (H0: no difference) N mean N mean
Ln(Commercial revenue per passenger) Control 31 0.145 25 0.495 0.266
-0.143 p-value=0.032 Treatment 25 -0.150 23 0.024 0.123
Ln(Landing revenue per passenger) Control 31 0.561 25 0.636 0.111
0.039 p-value=0.406 Treatment 25 0.041 23 0.213 0.150

42
TABLE 4 Difference-in-difference regression a
Ln(Commercial revenue per passenger)
Ln(Landing revenue per passenger)
Variables Model 1a OLS
Model 2a Median regression
Model 3a OLS
Model 1b OLS
Model 2b Median regression
Model 3b OLS
Treat × Post 0.194 0.212 0.204 0.111 0.085 0.129
(0.066) (0.001) (0.049) (0.212) (0.492) (0.124)
Treat -0.545 -0.498 NO -0.145 -0.046 NO
(0.004) (0.000) (0.311) (0.603)
Post 0.013 0.026 NO 0.053 0.116 NO
(0.916) (0.644) (0.621) (0.284)
Ln(Income per capita)
0.650 0.808 -0.831 0.488 0.395 0.521
(0.075) (0.000) (0.404) (0.218) (0.071) (0.453)
Ln(City competition) 0.181 0.129 NO 0.190 0.347 NO
(0.365) (0.005) (0.282) (0.000)
Ln(LCC penetration) -0.914 -0.525 -0.404 -1.727 -1.951 0.026
(0.141) (0.018) (0.123) (0.031) (0.000) (0.916)
Ln(Ticket price) 0.131 0.086 -0.074 0.557 0.608 0.084
(0.639) (0.280) (0.502) (0.013) (0.000) (0.354)
Hub status dummy YES YES NO YES YES NO
Year dummies NO NO YES NO NO YES
Airport fixed effects YES YES YES YES YES YES
Constant -7.114 -8.822 8.748 -6.965 -6.428 -5.698
(0.073) (0.000) (0.386) (0.112) (0.005) (0.424)
Observations 632 636 632 632 636 632
Adjusted R2 0.262 0.237 0.170 0.156 a P-values in parentheses. Model 1 is an OLS regression with clustered (by airport standard errors); model 2 is a median regression; model 3 is a clustered robust OLS regression.

43
TABLE 5 Difference-in-difference regression for capacity analysis a
Ln(Landing revenue per passenger)
Variables Low capacity constraints High capacity constraints
Treat × Post 0.063 0.191
(0.628) (0.090)
Ln(Income per capita) -0.836 3.224
(0.334) (0.011)
Ln(LCC penetration) -0.288 0.591
(0.193) (0.523)
Ln(Ticket price) -0.158 0.151
(0.026) (0.223)
Year dummies YES YES
Airport fixed effects YES YES
Constant 9.577 -34.074
(0.289) (0.009)
Observations 166 150
R2 0.301 0.428
Adjusted R2 0.242 0.373 a P-value in parentheses. All models are OLS regressions with clustered (by airport) robust standard errors.

44
TABLE 6 Difference-in-difference regression for airports´ pricing approach a
Ln(Commercial revenue per passenger)
Variables Residual Compensatory
Treat × Post 0.622 -0.221
(0.000) (0.309)
Ln(Income per capita) -1.441 -4.400
(0.388) (0.109)
Ln(LCC penetration) -0.315 -0.627
(0.583) (0.462)
Ln(Ticket price) -0.546 0.500
(0.033) (0.022)
Year dummies YES YES
Airport fixed effects YES YES
Constant 17.898 42.305
(0.281) (0.123)
Observations 134 104
R2 0.514 0.333
Adjusted R2 0.461 0.237 a P-value in parentheses. All models are OLS regressions with clustered (by airport) robust standard errors.

45
TABLE 7 Difference-in-difference regression for performance a
Variables Operating ROS
Residual Hybrid Compensatory Whole sample
Treat × Post 0.089 0.047 0.008 0.023
(0.065) (0.453) (0.799) (0.463)
Ln(Income per capita) 0.341 0.219 0.182 -0.290
(0.567) (0.764) (0.665) (0.379)
Ln(LCC penetration) 0.311 -0.026 0.527** 0.140
(0.211) (0.902) (0.007) (0.088)
Ln(Ticket price) 0.105 0.161 0.053 0.028
(0.245) (0.233) (0.403) (0.297)
Year dummies YES YES YES YES
Airport fixed effects YES YES YES YES
Constant -4.067 -2.876 -2.087 3.040
(0.479) (0.697) (0.634) (0.360)
Observations 134 97 104 633
R2 0.129 0.244 0.193 0.081
Adjusted R2 0.034 0.126 0.077 0.062 a P-value in parentheses. All models are OLS regressions with clustered (by airport) robust standard errors.

46
TABLE 8 Difference-in-difference regression for performance a
Variables Operating income per passenger
Residual Hybrid Compensatory Whole sample
Treat × Post 1.185 0.413 -0.038 0.238
(0.042) (0.458) (0.951) (0.464)
Ln(Income per capita) 5.008 6.328 -2.493 -1.131
(0.342) (0.306) (0.763) (0.712)
Ln(LCC penetration) 2.063 -1.099 2.979 0.773
(0.323) (0.580) (0.271) (0.324)
Ln(Ticket price) 1.065 2.153 1.010 0.354
(0.248) (0.062) (0.249) (0.262)
Year dummies YES YES YES YES
Airport fixed effects YES YES YES YES
Constant -57.290 -75.147 20.655 11.166
(0.262) (0.242) (0.803) (0.719)
Observations 134 97 104 646
R2 0.279 0.352 0.169 0.183
Adjusted R2 0.201 0.250 0.049 0.166 a P-value in parentheses. All models are OLS regressions with clustered (by airport) robust standard errors.

47
TABLE 9 Regression discontinuity analysis a b
Variables Model 1 Model 2
Treat 0.195 0.154
(0.416) (0.506)
-11.867 -11.789
(0.072) (0.082)
-92.117 -91.865
(0.044) (0.051)
Treat × 13.225 13.840
(0.049) (0.046)
Treat × 90.089 88.274
(0.050) (0.061)
Control Variables YES NO
Constant 0.104 -0.028
(0.789) (0.877)
Observations 64 65
R2 0.234 0.207
Adjusted R2 0.122 0.140
Treatment effect 3.081 3.125
F(1,55)=4.06 F(1,59)=3.83
p-value=0.048 p-value=0.055 a is airport´s concentration centered at coverage cut-off (0.50). b p-values in parentheses, OLS regressions with robust standard errors to heteroskedasticity.
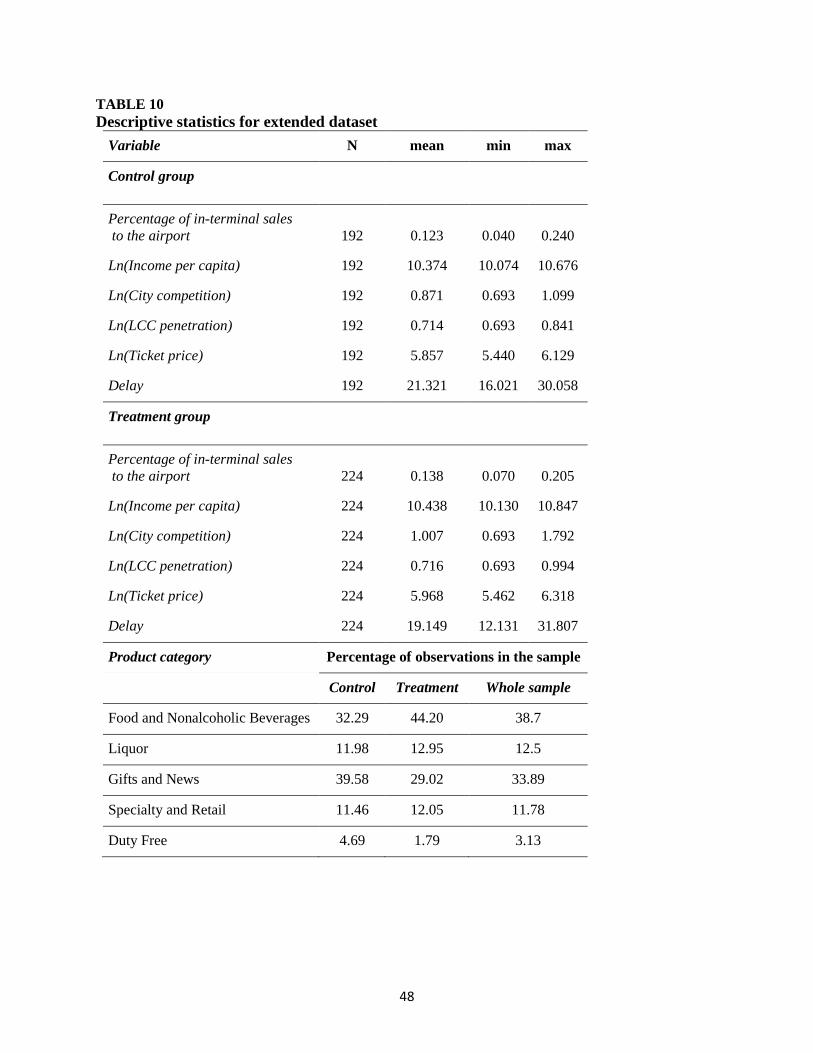
48
TABLE 10 Descriptive statistics for extended dataset
Variable N mean min max
Control group
Percentage of in-terminal sales to the airport 192 0.123 0.040 0.240
Ln(Income per capita) 192 10.374 10.074 10.676
Ln(City competition) 192 0.871 0.693 1.099
Ln(LCC penetration) 192 0.714 0.693 0.841
Ln(Ticket price) 192 5.857 5.440 6.129
Delay 192 21.321 16.021 30.058
Treatment group
Percentage of in-terminal sales to the airport 224 0.138 0.070 0.205
Ln(Income per capita) 224 10.438 10.130 10.847
Ln(City competition) 224 1.007 0.693 1.792
Ln(LCC penetration) 224 0.716 0.693 0.994
Ln(Ticket price) 224 5.968 5.462 6.318
Delay 224 19.149 12.131 31.807
Product category Percentage of observations in the sample
Control Treatment Whole sample
Food and Nonalcoholic Beverages 32.29 44.20 38.7
Liquor 11.98 12.95 12.5
Gifts and News 39.58 29.02 33.89
Specialty and Retail 11.46 12.05 11.78
Duty Free 4.69 1.79 3.13
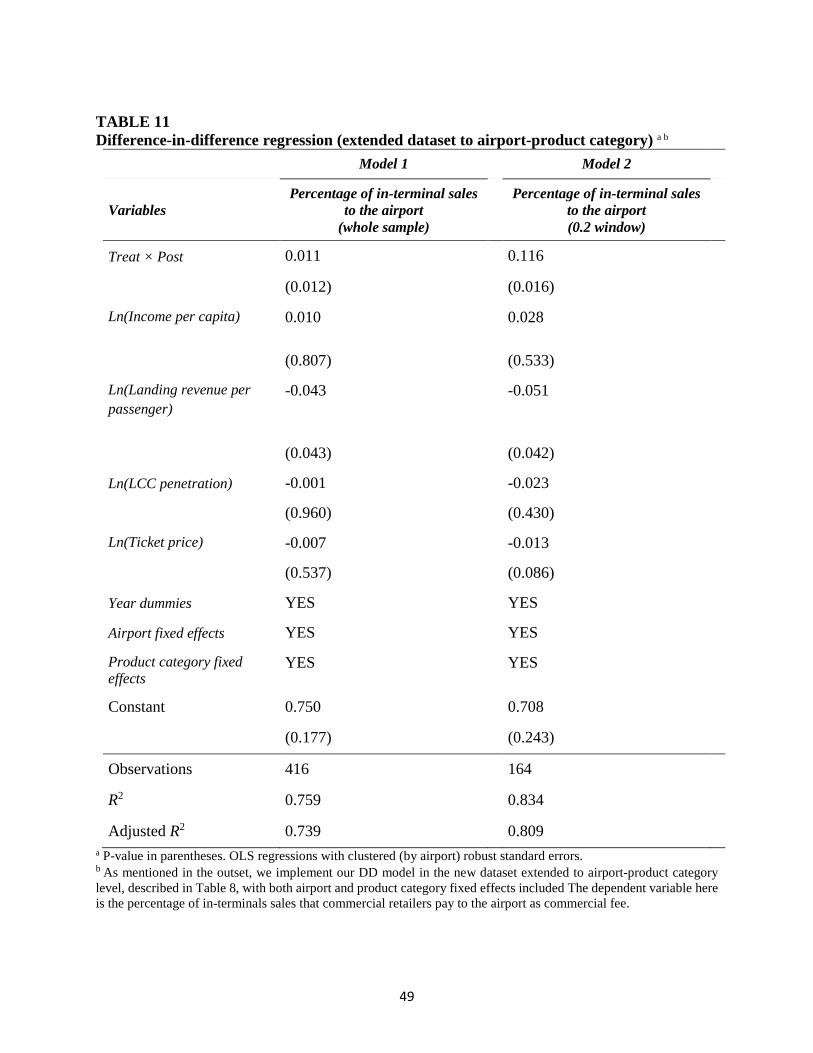
49
TABLE 11 Difference-in-difference regression (extended dataset to airport-product category) a b
Model 1 Model 2
Variables Percentage of in-terminal sales
to the airport (whole sample)
Percentage of in-terminal sales to the airport (0.2 window)
Treat × Post 0.011 0.116
(0.012) (0.016)
Ln(Income per capita) 0.010 0.028
(0.807) (0.533)
Ln(Landing revenue per passenger)
-0.043 -0.051
(0.043) (0.042)
Ln(LCC penetration) -0.001 -0.023
(0.960) (0.430)
Ln(Ticket price) -0.007 -0.013
(0.537) (0.086)
Year dummies YES YES
Airport fixed effects YES YES
Product category fixed effects
YES YES
Constant 0.750 0.708
(0.177) (0.243)
Observations 416 164
R2 0.759 0.834
Adjusted R2 0.739 0.809 a P-value in parentheses. OLS regressions with clustered (by airport) robust standard errors. b As mentioned in the outset, we implement our DD model in the new dataset extended to airport-product category level, described in Table 8, with both airport and product category fixed effects included The dependent variable here is the percentage of in-terminals sales that commercial retailers pay to the airport as commercial fee.