What is the epidemiological evidence linking early life events and cancer risk and what are the...
22
What is the epidemiological evidence linking early life events and cancer risk and what are the potential critical windows for cancer prevention? World Cancer Congress, Saturday 6 December 2014 Professor Ricardo Uauy University of Chile London School of Hygiene and Tropical Medicine
-
Upload
wcrf -
Category
Government & Nonprofit
-
view
149 -
download
0
Transcript of What is the epidemiological evidence linking early life events and cancer risk and what are the...
What is the epidemiological evidence linking early life events and cancer risk and what are the potential critical windows for cancer prevention?
World Cancer Congress, Saturday 6 December 2014
Professor Ricardo Uauy
University of Chile
London School of Hygiene and Tropical Medicine

Outline
Life course and cancer prevention
The evidence linking early life exposures to cancer
Mechanisms
Example; early life exposures and breast cancer
Data from a Chilean cohort
Conclusions

A life course approach is key in cancer prevention Cancer process takes decades; there may be as much as 40 years
between exposure to carcinogen and diagnosis
Cancer occurrence may be determined in very early life by:
Maternal hormones & vaginal cancer in offspring
Early diet and carcinogen exposure
Birth weight
Early growth
Dietary preferences
Attained height
Obesity
Breast feeding
Adult diet and physical activity behaviors are established in early life
Early life is most sensitive to cancer inducing processes (eg relatively high cancer risk in under tens exposed to radiation or carcinogens; smoking in adolescence)

Annual cancer rates 1970-2006 in all races (rates per 100,000)

Mouth
, phary
nx, la
rynx
Naso
phary
nx
Oeso
phagus
Lung
Sto
mach
Pancr
eas
Gallbla
dder
Liv
er
Colo
rect
um
7
Bre
ast
pre
menopause
Bre
ast
post
menopause
Ovary
Endom
etr
ium
Pro
state
Kid
ney
Skin
Foods containing dietary fibre
Aflatoxins
Non-starchy vegetables1
Allium vegetables
Garlic
Fruits2
Foods containing lycopene
Food containing selenium3
Red meat
Processed meat
Cantonese-style salted fish
Diets high in calcium4
Salt, salted and salty foods
Glycaemic load
Arsenic in drinking water
Maté
Coffee
Beta-carotene6
Physical activity
Body fatness
Adult attained height
Greater birth weight
Lactation
Alcoholic drinks5
Convincing decreased risk
Probable decreased risk
Probable increased risk
Convincing increased riskSubstantial effect on risk unlikely
Continuous Update
Project matrix of
strong evidence

Continuous Update Project – strong evidenceEarly life exposures and cancer risk
Prostate
cancer
(total)
Pancreatic
cancer
Colorectal
cancer
Premenopausal
breast cancer
Postmenopausal
breast cancer
Ovarian
cancer
Adult
attained
height Per 5 cm
Probable
RR = 1.04
(1.03-1.05)
Probable
RR = 1.07
(1.03-1.12)
Convincing
RR = 1.05
(1.03-1.08)
Probable
RR = 1.09
(1.05-1.12)
Convincing
RR = 1.10
(1.07-1.13)
Convincin
g
RR = 1.08
(1.05-1.10)
Greater
birth
weight
- - - Probable - -
Lactation - - - Convincing Convincing -
Increased risk
Decreased risk

Effect of in vitro culture media of human embryos on birth weight of newborns
Human Reproduction, Vol.25, No.3 pp. 605–612, 2010
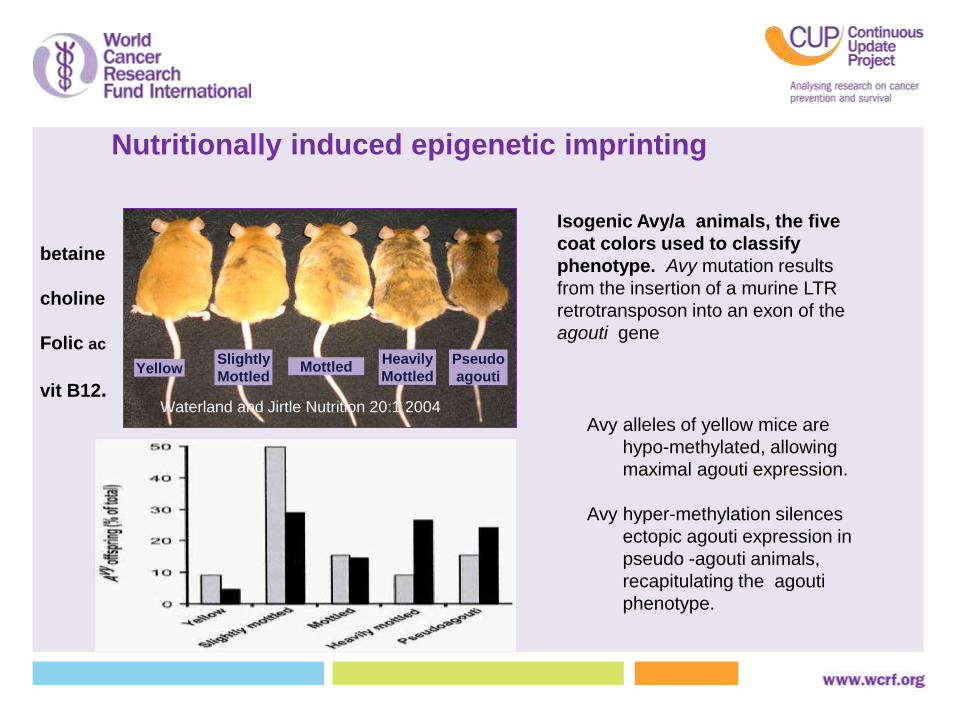
Nutritionally induced epigenetic imprinting
Isogenic Avy/a animals, the five
coat colors used to classify
phenotype. Avy mutation results
from the insertion of a murine LTR
retrotransposon into an exon of the
agouti gene
Pseudo
agouti
Heavily
MottledMottled
Slightly
MottledYellow
betaine
choline
Folic ac
vit B12.Waterland and Jirtle Nutrition 20:1 2004
Avy alleles of yellow mice are
hypo-methylated, allowing
maximal agouti expression.
Avy hyper-methylation silences
ectopic agouti expression in
pseudo -agouti animals,
recapitulating the agouti
phenotype.

Dutch Hunger Winter
Individuals prenatally exposed to famine during the Dutch Hunger Winter in 1944–45 had, 6 decades later, less DNA methylation of the imprinted IGF2 gene compared with their unexposed, same-sex siblings
The association was specific for peri conceptional exposure, reinforcing that very early development is a crucial period for establishing epigenetic marks
These data are the first to contribute empirical support for the hypothesis that early-life environmental conditions can cause epigenetic changes in humans that persist throughout life
Heijmansa BT et al PNAS 105:17046–17049 2008

DIET
ENVIRONMENT
BODY FAT DISTRIBUTION AND CANCER RELATED OUTCOMES

Mechanisms of breast cancer development

2002 -20030y
20074y
20063.5y
20085.5y
20096.5y
20129.5y
GOCS IIGOCS I
2500-4500grn= 14330
n= 1196
n= 313
n= 1050n= 1196
Growth and Obesity Cohort Study (GOCS):
1200 Chilean children born in 2002 attending nursery schools in 2006

Socio-economic status = low-middle
Maternal height = 156.3 ± 5.6 cm
Pre-pregnancy BMI = 24.2 ± 4.3 kgm2
Pregnancy weight gain = 12.4 ± 4.8 kg
Smoking during pregnancy = 15%
Diabetes during pregnancy = ~ 5% (20-40%)
Preeclampsia = 9.1%
Breastfeeding* at 4 mo = 64%
* Exclusive or predominant
Growth and Obesity Cohort Study is a concurrent cohort of
mothers-children in Chile

Body Mass Index Z score 0-84 months by Body Mass Index status at 7 years (n=1096)
BA
Z;
WH
O 2
00
6
Adjusted for current age and sex
Points connected for ease of reading
Age (months)
BAZ ;WHO 2006-7
BAZ ≥2
1≤ BAZ <2
-1≤ BAZ <1

Timing of adiposity rebound in 805 Chilean children born in 2002, by Body Mass Index status at 7 years
%Timing of Adiposity Rebound
<2y
2-4y
4-5y
5-7y
Body Mass Index Z-scores based on WHO 2007
10.5
18.9
22.6
48.1
27.7
25.0
38.7
8.6
24.8
52.7
1.7
20.7
Body Mass Index
g/m2
Age (months)
BAZ >2
1 <=BAZ <=2
BAZ <1


Ultrasound bone age in 936 Chilean children categorized by Body Mass Index status at 7 years of age
Months
BAZ <1
BAZ =>2
1<=BAZ <2
Body Mass Index
Z-scores
WHO 2007

Examples of types of facial
expressions displayed during the
first 2 minutes of feeding: brow
lowerer (A), inner brow raise (B),
squint (C), nose wrinkle (D), upper-
lip raise (E), and gape (F).
www.pediatrics.org/cgi/doi/10.1542/
peds.2007-0858 doi:10.1542/peds.2007-0858
Early Determinants of Fruit and
Vegetable AcceptanceCatherine A. Forestell, PhD, Julie A.
Mennella, PhD Monell Chemical Senses
Center, Philadelphia, Pennsylvania
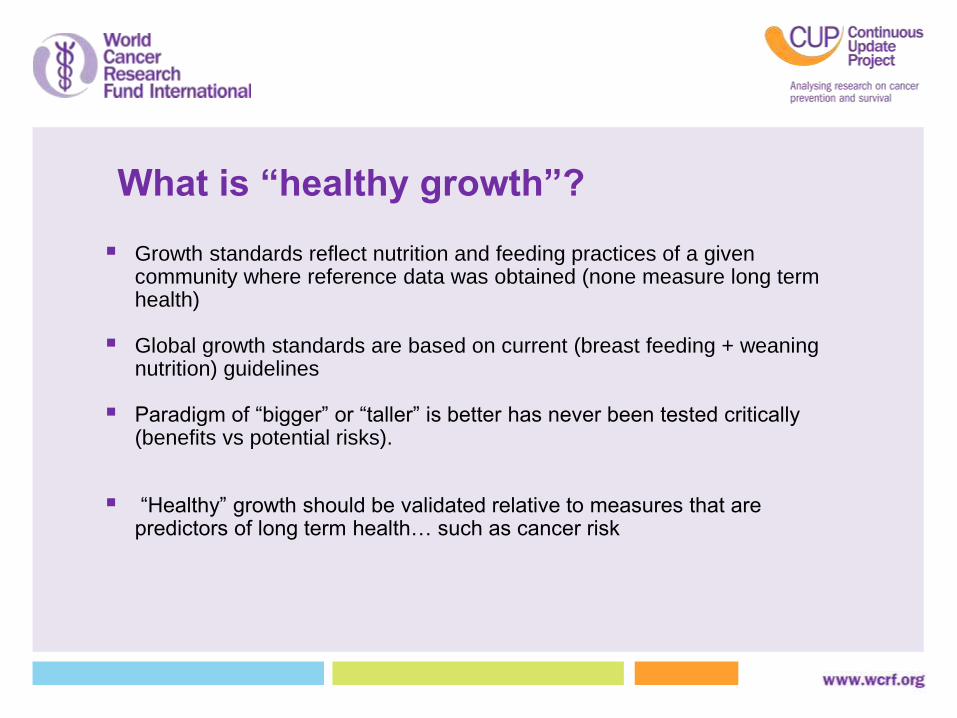
What is “healthy growth”?
Growth standards reflect nutrition and feeding practices of a given community where reference data was obtained (none measure long term health)
Global growth standards are based on current (breast feeding + weaning nutrition) guidelines
Paradigm of “bigger” or “taller” is better has never been tested critically (benefits vs potential risks).
“Healthy” growth should be validated relative to measures that are predictors of long term health… such as cancer risk

Cancer prevention : a Life Course Approach
Age
Fetal
Life
Adult Life
AdolescenceInfancy andChildhood
Genetic susceptibility to Cancer
Older ages
Breast Feeding
SES
Infections/PEM
Micronutrients
Contaminants
(air. food. water.)
Growth rate
Stature
Physical Activity
Food and Play
Behaviours
Smoking
Contaminants
(air. food. water.)
Time of Puberty
Obesity
Exercise and
Physical activity
Inactivity
SESMother’sNutrition
CarcinogenExposures
Fetal Growthbirth weight
Genetic susceptibility to Cancer
Cumulativeincidence
Preventable risk
Established adult risky behaviours
Diet/Physical activity. Tobacco.
Alcohol. Carcinogens
OBESITY
Biological risks
Socioeconomic status
Environmental conditions

Conclusions
There is increasing evidence that early life exposures are associated with cancer risk
Need long term cohort follow up studies, including randomized controlled interventions that confirm putative associations
Understanding the mechanisms that control cell biology and influence the cancer process will help us to better target cancer preventive strategies related to early life
Need to identify optimal growth standards for cancer prevention

For further information
@wcrfint
facebook.com/wcrfint
www.wcrf.org
Professor Ricardo Uauy
University of Chile
London School of Hygiene and Tropical Medicine