What is the Appropriate Role for Student Achievement · PDF fileThis paper has not been...
30
WHAT IS THE APPROPRIATE ROLE FOR STUDENT ACHIEVEMENT STANDARDS? John H. Bishop* Three presidents, the National Governors Association, and numer- ous blue-ribbon panels have called for the development of state content standards for core subjects and examinations that assess the achievement of these standards. The Competitiveness Policy Council, for example, advocates that “external assessments be given to individual students at the secondary level and that the results should be a major but not exclusive factor qualifying for college and better jobs at better wages” (1993, p. 30). The American Federation of Teachers advocates a system in which “students are periodically tested on whether they’re reaching the standards, and if they are not, the system responds with appropriate assistance and intervention. Until they meet the standards, they won’t be able to graduate from high school or enter college” (American Federation of Teachers 1995, pp. 1–2). American policymakers are trying to deal with low standards and weak incentives for hard study by making students, staff, and schools more accountable for learning. The education departments of the 50 states have responded by developing content standards for core academic subjects, administering tests assessing this content to all students, pub- * Associate Professor of Human Resource Studies, New York State School of Industrial and Labor Relations, Cornell University. The preparation of this paper was made possible by support from the Center for Advanced Human Resource Studies and the Consortium for Policy Research in Education (funded by the Office of Educational Research and Improve- ment, U.S. Department of Education). The findings and opinions expressed in this report do not reflect the position or policies of the Office of Educational Research and Improvement or the U.S. Department of Education. This paper has not been formally reviewed or approved by the faculty of the ILR School. It is intended to make results of Center research, conferences, and projects available to others interested in human resource management in preliminary form to encourage discussion and suggestions.
Transcript of What is the Appropriate Role for Student Achievement · PDF fileThis paper has not been...

WHAT IS THE APPROPRIATE ROLE FOR STUDENTACHIEVEMENT STANDARDS?
John H. Bishop*
Three presidents, the National Governors Association, and numer-ous blue-ribbon panels have called for the development of state contentstandards for core subjects and examinations that assess the achievementof these standards. The Competitiveness Policy Council, for example,advocates that “external assessments be given to individual students atthe secondary level and that the results should be a major but notexclusive factor qualifying for college and better jobs at better wages”(1993, p. 30). The American Federation of Teachers advocates a system inwhich “students are periodically tested on whether they’re reaching thestandards, and if they are not, the system responds with appropriateassistance and intervention. Until they meet the standards, they won’t beable to graduate from high school or enter college” (American Federationof Teachers 1995, pp. 1–2).
American policymakers are trying to deal with low standards andweak incentives for hard study by making students, staff, and schoolsmore accountable for learning. The education departments of the 50 stateshave responded by developing content standards for core academicsubjects, administering tests assessing this content to all students, pub-
* Associate Professor of Human Resource Studies, New York State School of Industrialand Labor Relations, Cornell University. The preparation of this paper was made possibleby support from the Center for Advanced Human Resource Studies and the Consortium forPolicy Research in Education (funded by the Office of Educational Research and Improve-ment, U.S. Department of Education). The findings and opinions expressed in this report donot reflect the position or policies of the Office of Educational Research and Improvementor the U.S. Department of Education. This paper has not been formally reviewed orapproved by the faculty of the ILR School. It is intended to make results of Center research,conferences, and projects available to others interested in human resource management inpreliminary form to encourage discussion and suggestions.

lishing individual school results, and holding students and schoolsaccountable for student achievement. While these efforts are genericallyreferred to as standards-based reform, the mix of initiatives varies a greatdeal from state to state.
It is claimed that a curriculum-based external exit exam (CBEEE)system based on world-class content standards will improve the teachingand learning of core subjects. What evidence is there for this claim? Whatimpacts have such systems had on school policies, teaching, and studentlearning? Outside the United States, CBEEE systems are the rule, not theexception. Within the United States, New York’s Regents exams andNorth Carolina’s end-of-course (EOC) exams are two examples of suchsystems. Do New York and North Carolina students outperform studentswith similar socioeconomic backgrounds from other states?
CURRICULUM-BASED EXTERNAL EXIT EXAMINATIONSYSTEMS
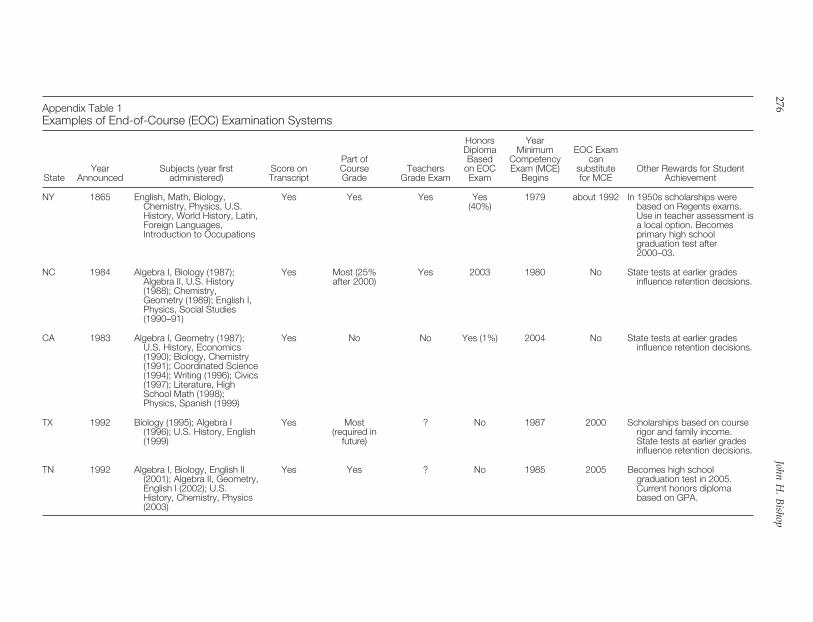
While a number of states—for example, Maryland, Mississippi,Oklahoma, Arkansas, Tennessee, Virginia, Michigan—appear to be plan-ning to implement CBEEE systems, only two states—New York andNorth Carolina—had established such systems by the beginning of the1990s. State-sponsored end-of-course exam systems are provided inAppendix Table 1. The granddaddy of these is New York’s Regents examsystem. It has been in continuous operation since the 1860s. Panels oflocal teachers grade the exams using rubrics supplied by the state Boardof Regents. Exam scores appear on transcripts and are the final exammark that is averaged with the teacher’s quarterly grades to calculate thefinal course grade. A college-bound student taking a full schedule ofRegents courses would typically take Regents exams in mathematics andearth science at the end of ninth grade; mathematics, biology, and globalstudies at the end of tenth grade; mathematics, chemistry, Americanhistory, English, and foreign language at the end of eleventh grade; andphysics at the end of twelfth grade. However, taking Regents coursesand, therefore, Regents exams was voluntary until late in the 1990s. Priorto 1998, nearly half of the students chose to take “local” courses originallyintended for noncollege-bound students, knowing that good gradescould be obtained without much effort.
Between 1987 and 1991, North Carolina introduced end-of-courseexams for Algebra 1 and 2, Geometry, Biology, Chemistry, Physics,American History, Social Studies, and English 1. Versions of these coursesthat are not assessed by a state test do not exist, so virtually all NorthCarolina high school students take at least six of these exams. Test scoresappear on the student’s transcript, and most teachers have been incorpo-rating EOC exam scores in course grades. Starting in the year 2000, statelaw requires the EOC tests to have at least a 25 percent weight in the final
250 John H. Bishop

course grade. Clearly from this description one can see that even NorthCarolina’s EOC exams and New York’s Regents exams prior to 1999carried only low to moderate stakes for students.
MINIMUM COMPETENCY EXAMINATIONS
Most states pursuing standards-based reform have established min-imum competency exam (MCE) or other test-based school accountabilitysystems that are quite different from curriculum-based external exit examsystems. Appendix Table 2 presents information on the end-of-grade(EOG) examination systems that a number of states have adopted, oftento determine eligibility for honors diplomas or scholarships.
Eighteen states have MCE graduation requirements, and another 11states are developing or phasing in MCEs. Minimum competency examsraise standards, but probably not for everyone.1 The standards set by theteachers of honors classes and advanced college prep classes are notchanged by an MCE. Students in these classes generally pass the MCE onthe first try without special preparation. The students who are in theschool’s least-challenging courses experience the higher standards. Stu-dents pursuing a “do the minimum” strategy are told “you must workharder” if you are to get a diploma and go to college. School adminis-trators want to avoid high failure rates, so they are likely to focusadditional energy and resources on raising standards in the early gradesand improving the instruction received by struggling students.
SCHOOL REPORT CARDS AND STAKES FOR TEACHERS ANDADMINISTRATORS
Formal systems for holding schools accountable are growing inpopularity. In 1999, 37 states were publishing school report cards for allor almost all of their schools (Edwards 1999). Publicly identifyinglow-performing schools is intended to spur local school administratorsand boards of education to undertake remedial action. Nineteen stateshad a formal mechanism for rewarding schools either for year-to-yeargains in achievement test scores or for exceeding student achievement
1 Minimum competency exams are in addition to—not a replacement for—teacher-imposed standards. In an MCE regime, teachers continue to control the standards andassign grades in their own courses. Students must still get passing grades from theirteachers to graduate. The MCE regime imposes an additional graduation requirement andthus cannot lower standards (Costrell 1994). The Graduate Equivalency Diploma (GED), bycontrast, offers students the opportunity to shop around for an easier (for them) way to ahigh school graduation certificate. As a result, the GED option lowers overall standards.This is reflected in the lower wages that GED recipients command (Cameron and Heckman1991).
THE APPROPRIATE ROLE FOR STUDENT ACHIEVEMENT STANDARDS 251

targets (Edwards 1999). Nineteen states had special assistance programsto help failing schools turn themselves around. If improvements were notforthcoming, 11 states had the power to close down, take over, orreconstitute failing schools.
Exactly how are these student and school accountability systemssimilar to or different from the curriculum-based external exit examsystems that are found abroad and in New York and North Carolina? Webegin by noting the features they have in common. The following fivecriteria apply to CBEEEs and MCEs:
1. The exams produce signals of accomplishment that have realconsequences for students and schools.While some stakes are essential,high stakes may not be necessary. Analyses of Canadian and U.S. datasummarized below suggest that moderate stakes may be sufficient toproduce substantial increases in learning.
2. The exams define achievement relative to an external standard,not relative to other students in the classroom or the school. Faircomparisons of achievement across schools and across students atdifferent schools are possible. Costrell’s (1994) analysis of the optimalsetting of educational standards concluded that more centralized stan-dard-setting (state or national achievement exams) results in higherstandards, higher achievement, and higher social welfare than decentral-ized standard-setting (in other words, teacher grading or schools’ grad-uation requirements).
3. The exams assess a major portion of what students are expectedto know and be able to do. Studying to prepare for an exam (whether setby one’s own teacher or by a state department of education) should resultin the student’s learning important material and developing valued skills.Some MCEs, CBEEEs, and teacher exams do a better job of achieving thisgoal than others. External exams, however, cannot assess every instruc-tional objective. Teachers themselves must accept responsibility forevaluating dimensions of performance that cannot be reliably assessed byexternal means or that local leaders want to add to the learning objectivesspecified by the state department of education.
4. The exams cover all or almost all students. Exams for eliteschools, advanced courses, or college applicants will influence standardsat the top of the vertical curriculum, but will probably have limited effectson the rest of the students. With MCEs, in contrast, virtually all studentsare affected, and the school system as a whole must accept responsibilityfor how students do on the exams. A single exam taken by all is notessential. Many nations allow students to choose which subjects to beexamined in and offer high- and intermediate-level exams in the samesubject.
5. The exams are controlled by the education authority thatestablishes the curriculum for and funds K–12 education. Curriculumreform is facilitated because coordinated changes in instruction and
252 John H. Bishop

exams are feasible. Tests established and mandated by other organiza-tions serve the interests of other masters. America’s premier high-stakesexams—the SAT-I and the ACT—serve the needs of colleges to sortstudents by aptitude, not the needs of schools to reward students whohave learned what high schools are trying to teach.
Curriculum-based external exit exam systems are distinguished fromMCEs by the following additional features:
6. The system signals multiple levels of achievement in the subject.If only a pass/fail signal is generated by an exam, and passing isnecessary to graduate, the standard will almost inevitably be set lowenough to allow almost everyone to pass after multiple tries. The greatbulk of students will easily pass the test and will have no incentive tostrive to do better. CBEEEs, in contrast, signal the student’s achievementlevel in the subject being tested, so that all students, not just those at thebottom of the class, have an incentive to study hard in order to do well onthe exam. Consequently, a CBEEE should be more likely to improveclassroom culture than an MCE. Costrell agrees: “The case for perfectinformation [making scores on external examinations available ratherthan just whether the individual passed or failed] would appear to bestrong, if not airtight: for most plausible degrees of heterogeneity,egalitarianism, and pooling under decentralization, perfect informationnot only raises GDP, but also social welfare” (1994, p. 970).
7. The system assesses more difficult material. Since CBEEEs aresupposed to measure and signal the full range of achievement in asubject, they contain more difficult questions and problems. This inducesteachers to spend more time on cognitively demanding skills and topics.MCEs, by contrast, are designed to identify which students have failed tosurpass a rather low minimum standard, so they do not ask questions orset problems that students near that borderline are unlikely to be able toanswer or solve.2 This tends to result in excessive class time beingdevoted to practicing low-level skills.
8. The system is a collection of end-of-course exams. Since CBEEEsassess the content of a specific course, teachers of the course (or coursesequence) being tested inevitably will feel responsible for how well theirstudents do on the exam. Grades on EOC exams may be made part of theoverall course grade, further integrating the external exam into the
2 In 1996, only 4 of the 17 states with MCEs targeted their graduation exams at atenth-grade proficiency level or higher. Failure rates for students taking the test for the firsttime varied a great deal: from highs of 46 percent in Texas, 34 percent in Virginia, 30 percentin Tennessee, and 27 percent in New Jersey to a low of 7 percent for Mississippi. However,since students can take the tests multiple times, eventual pass rates for the class of 1995 weremuch higher: 98 percent in Louisiana, Maryland, New York, North Carolina, and Ohio; 96percent in Nevada and New Jersey; 91 percent in Texas; and 83 percent in Georgia(American Federation of Teachers 1996).
THE APPROPRIATE ROLE FOR STUDENT ACHIEVEMENT STANDARDS 253

classroom culture. Alignment between instruction and assessment ismaximized, and accountability is enhanced. Proponents argue that teach-ers will not only want to set higher standards, but will also find theirstudents more attentive in class and more likely to complete demandinghomework assignments. Teachers become coaches helping their teambattle the state exam.
Those who are skeptical about the value of introducing CBEEEspoint out that American students already take a lot of standardized tests.Why aren’t the tests students already take (such as the ACT, the SAT-I, orcommercially prepared norm-referenced achievement tests) sufficient?What’s so special about the new CBEEEs that some states are introducingin their standards-based reforms?
Norm-referenced achievement tests such as the CAT, CTBS, ITBS,ITED, and Terra Nova are not curriculum-based external exit examsbecause they fail criteria one and eight. Students have no stake in doingwell on these tests. They are not part of a course grade or important to thestudent in some other way, so many high school students fail to put mucheffort into answering all the questions correctly and completely.3 Wherestakes are not attached to results, teachers and school administratorsexperience the consequences, rather than individual students. In most ofthe nation, tests that students have no reason to try hard on are theprimary indicator of student achievement in school accountability sys-tems. When this is the case, school ratings may reflect the school’s successin getting students to try hard on state tests and not the quality ofinstruction throughout the school year. This reduces the validity of highschool tests as measures of true student achievement and makes their usein school accountability systems problematic.
The SAT-I test is not a CBEEE because it does not fulfill criteria three,five, and eight. It fails to assess most of the material—history, science,economics, civics, literature, foreign languages, and the ability to write anessay—that high school students are expected to learn. The ScholasticAptitude Test (SAT) was designed from the beginning to minimize
3 This observation is based on interviews with the directors of the testing andaccountability divisions in Manitoba and New Brunswick. It is also based on the largeincreases in student performance that occurred in New Brunswick, Massachusetts, Michi-gan, and other states when no-stakes tests became moderate- or high-stakes tests (Hayward2001). Experimental studies confirm the observation. In Candace Brooks-Cooper’s master’sthesis (1993), a test containing complex and cognitively demanding items from the NAEPhistory and literature tests and the adult literacy test was given to high school studentsrecruited to stay after school by the promise of a $10.00 payment for taking the test. Studentswere randomly assigned to rooms. Students in one room were promised a payment of $1.00for every correct answer greater than 65 percent correct. This group did significantly betterthan the other students, who were told different test-taking conditions, including thestandard “try your best” condition. Similar results were obtained in other well-designedstudies conducted by the National Center for Research on Evaluation, Standards andStudent Testing (see Kiplinger and Linn 1993 and O’Neil et al. 1997).
254 John H. Bishop

backwash effects on teaching and student study habits. Indeed, when themachine-scored, multiple-choice SAT replaced the curriculum-based es-say-style College Board Examinations, Harvard College’s admissionsdirector Richard Gummere was very candid about why the SAT had beenadopted: “Learning in itself has ceased to be the main factor [in collegeadmissions]. The aptitude of the pupil is now the leading consideration”(Gummere 1943, p. 5).
The subject-specific SAT-II achievement tests fail criteria one, four,and five. Stakes are very low—few colleges consider SAT-II results inadmissions decisions—and few students take them. In 1982–83, only 6percent of SAT-I test takers took a science SAT-II, and only 3 to 4 percenttook one in history or a foreign language. Schools do not assumeresponsibility for preparing students for SAT-II tests.
The Advanced Placement (AP) examinations are the one exception tothe generalization that the United States lacks a national CBEEE. Thenumber of students taking AP examinations has been growing at acompound annual rate of 9 percent per year. In 1999, 686,000 students,about 11 percent of the nation’s juniors and seniors, took at least one APexam. Despite this success, however, 44 percent of high schools do notoffer even one AP course, and many that do allow only a tiny minority oftheir students to take these courses (College Board 1999). Low participa-tion means that AP exams fail criterion 5 and, consequently, are not aCBEEE system. They can, however, serve as a component of a largersystem.
HOW ARE CBEEE SYSTEMS HYPOTHESIZED TO INCREASEACHIEVEMENT?
Curriculum-based external exit exam systems fundamentally changethe signaling of student achievement. In doing so, they transform theincentives faced by students, parents, teachers, and school administra-tors. CBEEE systems are, consequently, hypothesized to influence theresources made available to schools and the priorities of school admin-istrators, teacher pedagogy, parental encouragement, and student effort.
Impact on Students
Curriculum-based external exit exam systems improve the signalingof academic achievement. As a result, colleges and employers are likely togive greater weight to academic achievement when they make admissionand hiring decisions, so the rewards for learning should grow andbecome more visible. CBEEE systems also shift attention toward mea-sures of absolute achievement and away from measures of relativeachievement, such as rank in class and teacher grades. In doing so,
THE APPROPRIATE ROLE FOR STUDENT ACHIEVEMENT STANDARDS 255

CBEEE systems ameliorate the problem of peer pressure against study-ing.
How serious a problem is peer pressure against studying? Steinberg,Brown, and Dornbusch’s 1996 study of nine high schools in CaliforniaandWisconsin suggests that academic excellence is still not highly valuedby peers in most schools:
The adolescent peer culture in America demeans academic success andscorns students who try to do well in school . . . less than 5 percent of allstudents are members of a high-achieving crowd that defines itself mainlyon the basis of academic excellence. . . . Of all the crowds, the “brains” werethe least happy with who they are—nearly half wished they were in adifferent crowd (pp. 16, 145–6).
Why do so many “brains” want to get out of their crowd? DonMerten’s 1996 ethnography of Cronkite Junior High School provides arich and perceptive description of why this is so. Documenting thethoughts and actions of the ostracized and the popular students, hedescribes the transformation of one student from outcast to sociallyacceptable classmate. His description of the student’s journey from nerdto cool kid is a gripping illustration of the power of peer norms in middleschool. In order to fit in, the student cast away the norms and values hehad lived by in elementary school and had defended in seventh grade:empathy, helping others, being good. He adopted instead the morepredatory anti-teacher persona promoted by the dominant/popularstudents in junior high school.
Unfortunately, the peer pressure against studying or excelling inschool found in Cronkite Junior High School is not an aberration. In theEducational Excellence Alliance survey, 24 percent of students said, “Myfriends make fun of people who try to do real well in school.” Fifty-sixpercent said, “My friends joke around and annoy the teacher.”
The teachers and principals of many American middle schools havelost normative hegemony. In the eyes of most students, the “brains”exemplify the “I trust my teacher to help me learn” attitude that prevailsin most elementary school classrooms. The dominant middle schoolcrowd is saying that trusting teachers is baby stuff. It’s “us” versus“them.” Withdraw from alliances with teachers, they say, and get withthe program of becoming popular with peers. Be like us, the popularcrowds say. Spend your time socializing. Do not study too hard. Valueclassmates for their athletic prowess and their attractiveness, not theirinterest in history or their accomplishments in science.
Why are studious students treated as outcasts? In part, it is becauseexams are graded on a curve. When exams are graded on a curve orcollege admissions are based on rank in class, joint welfare is maximizedif no one puts in extra effort. In the game that results, side payments
256 John H. Bishop

(friendship and respect) and punishments (ridicule, harassment, andostracism) enforce the cooperative “don’t study” solution.
If, by contrast, students are evaluated relative to an outside standard,as they would be with CBEEEs, they no longer have a personal interest ingetting teachers off track or persuading each other to refrain fromstudying. There is less incentive for them to engage in peer pressure thatdemeans studiousness.
Impact on School Administrators
When there is no external assessment of academic achievement,students and their parents benefit little from administrative decisions thatopt for higher standards, more-qualified teachers, or a heavier studentworkload. The immediate consequences of such decisions—higher taxes,more homework, having to repeat courses, lower grade point averages(GPAs), complaining parents, a greater risk of being denied a diploma—are all negative.
When student learning is not assessed externally, the positive effectsof choosing academic rigor are negligible and postponed. If collegeadmission decisions are based on class rank, GPA, and aptitude tests—not externally assessed achievement in secondary school courses—upgraded standards will not improve the college admission prospects ofnext year’s graduates. Graduates will probably do better in difficultcollege courses and will be more likely to get a degree, but that benefit isuncertain and far in the future. Maybe over time, the school’s reputationand, with it, the college admission prospects of graduates will improvebecause the current graduates are more successful in local colleges. That,however, is even more uncertain and postponed. Publishing data on theproportions of students meeting targets on standardized tests probablyspeeds the process by which real improvements in a school’s perfor-mance influence its local reputation. However, other indicators (such asSAT test scores, proportions going to various types of colleges, and thesocioeconomic background of the students) tend to be more prominent.As a result, school reputations are determined largely by things overwhich teachers and administrators have little control.
American employers historically have paid little attention to studentachievement in high school or school reputations when selecting youngworkers (Bishop 1990, 1992 and Hollenbeck and Smith 1984). Those thatdo pay attention to achievement use indicators of relative performancesuch as GPA and class rank rather than results on an external exam as ahiring criterion. Consequently, higher standards do not benefit studentsas a group, so parents as a group have little incentive to lobby strongly forhigher teacher salaries, higher standards, and higher school taxes.
External exams transform the signaling environment. Hiring betterteachers and improving the school’s science laboratories now yield a
THE APPROPRIATE ROLE FOR STUDENT ACHIEVEMENT STANDARDS 257

visible payoff—more students passing the external exams and beingadmitted to top colleges. This in turn is likely to lead to more spending onschools, more rigorous hiring standards for secondary school teachers,and a higher priority assigned to student learning in the allocation ofschool budgets.
Additionally, reform-minded administrators can use CBEEE resultsto inspire teachers to raise standards for all students. The superintendentof a suburban New York district that has been nationally recognized forraising student achievement levels observes: “[External validators likeRegents exams] were the best and only way in which we could getteachers and staff to see themselves as others might see them and not justkeep looking in the mirror and seeing themselves as they would like tosee themselves” (author’s interview with a superintendent of an all-Regents high school, August 1997).
Impact on Teachers
Curriculum-based external exit exams often have profound effects onteacher-student relationships and on the nature of the student peerculture. Teachers who have taught in environments with and withoutCBEEEs, as I have, sense the difference. When a proposal was putforward in Ireland to drop the nation’s system of external assessmentsand have teachers assess students for certification purposes, the unionrepresenting Ireland’s secondary school teachers reacted as follows:
Major strengths of the Irish educational system have been:(i) the pastoral contribution of teachers in relation to their pupils, and(ii) the perception of the teacher by the pupil as an advocate in terms
of nationally certified examinations rather than as a judge.The introduction of school-based assessment by the pupil’s own teacher for
certification purposes would undermine those two roles, to the detriment of allconcerned. . . . The role of the teacher as judge rather than advocate may leadto legal accountability in terms of marks awarded for certification purposes.This would automatically result in a distancing between the teacher, the pupil,and the parent. It also opens the door to possible distortion of the results inresponse either to parental pressure or to pressure emanating from competi-tion among local schools for pupils (Association of Secondary Teachers ofIreland 1990, p. 1).
Note how the Irish teachers feared that switching entirely to internalassessment would result in their being pressured to lower standards. ForAmerican teachers, such pressure is a daily reality. Thirty percent ofAmerican teachers say they “feel pressure to give higher grades thanstudents’ work deserves,” and they “feel pressure to reduce the difficultyand amount of work you assign” (Peter D. Hart Research Associates 1995,p. 9). Under a system of external exams, teachers and local school
258 John H. Bishop
administrators lose the option of lowering standards to reduce failurerates and raise self-esteem. The only response open to them is to demandmore of their students so as to maximize their chances of being successfulon the external exams.
A further benefit of CBEEEs is the professional development thatteachers receive when they are brought to centralized locations to gradethe extended answer portions of examinations. In May 1996, I inter-viewed a number of teachers and union activists about the examinationsystem in Alberta. Even though the union and these teachers opposed theexams, they universally shared the sentiment that serving on gradingcommittees was “a wonderful professional development activity.”4 Hav-ing to agree on what constituted excellent, good, poor, and failingresponses to essay questions or open-ended math problems resulted in asharing of perspectives and teaching tips that most found very helpful.
On the other hand, many fear that external exams will have anegative effect on teaching. Opponents argue that “preparation forhigh-stakes tests often emphasizes rote memorization and cramming ofstudents and drill and practice teaching methods” and that “some kindsof teaching to the test permit students to do well in examinations withoutrecourse to higher levels of cognitive activity” (Madeus 1991, pp. 7–8).
CBEEE advocates counter by challenging the assumption implicit inthe above argument that examinations developed by the committees ofteachers working for state departments of education are or will be worsethan the tests developed by individual teachers. In fact, the tests thatteachers develop for themselves are generally of very low quality. AsJohn Thomas discussed at a 1991 conference, Fleming and Chambers’s1983 study of tests developed by high school teachers found that “80percent of the items on teachers’ tests were constructed to tap the lowestof [Bloom’s] taxonomic categories: knowledge (of terms, facts, or princi-ples)” (Thomas, p. 14). Rowher and Thomas (1987) found that only 18percent of history test items developed by junior high teachers and 14percent of items developed by senior high teachers required the integra-tion of ideas. College instructors, by contrast, required such integration in99 percent of their test items. Secondary school teachers test low-levelcompetencies because that is what they teach.
If care is taken in designing external exams, they can induceimprovements in instructional practice. Sherman Tinkelman describesone such instance, based on his experience as New York state’s assistantcommissioner for examinations and scholarships:
4 Interview results are available from the author upon request.
THE APPROPRIATE ROLE FOR STUDENT ACHIEVEMENT STANDARDS 259

For years our foreign language specialists went up and down the statebeating the drums for curriculum reform in modern language teaching, forchange in emphasis from formal grammar to conversation skills andreading skills. There was not very great impact until we introduced, afternotice and with numerous sample exercises, oral comprehension andreading comprehension into our Regents examinations. Promptly thereaf-ter, most schools adopted the new curricular objectives (1966, p. 12).
DO CBEEES INCREASE ACHIEVEMENT? A LOOK AT THEEVIDENCE
The hypothesis that curriculum-based external exit examinationsystems improve achievement can be tested by comparing nations, states,and provinces that do and do not have such systems. Here we examinefive different data sets:
• science and mathematics achievement of eighth graders in 1995and 1999 in the 50-nation Third International Math and ScienceStudy (TIMSS);
• achievement of 14-year-olds in the Reading Literacy Study of theInternational Association for the Evaluation of EducationalAchievement (IEA);
• science, mathematics, and reading literacy of 15-year-olds in the2000 Program for International Student Assessment (PISA);
• science and mathematics scores of 13-year-olds in the InternationalAssessment of Educational Progress (IAEP) for nine Canadianprovinces; and
• SAT test results for New York state students compared withresults for students in the rest of the United States.
The theory predicts that CBEEE systems influence administrators’decisions about school priorities, teachers’ decisions about standards andpedagogy, and students’ decisions about studying. Much of the ultimateimpact of CBEEE systems on student achievement derives from thechanges these systems induce in hiring decisions, school priorities, andteacher pedagogy. Bishop (1996) tested the effects of CBEEEs on most ofthese components using data on Canadian schools and students. In mostof the analyses in the current paper, the units of observation areeducational systems and the objective is to assess the total effect of CBEEEsystems on student achievement. Total effects are estimated by a reduced-form model that controls for parental socioeconomic status, productivity,and national culture, not the endogenous administrator, teacher, andparent behaviors.
260 John H. Bishop

Third International Mathematics and Science Study (TIMSS)
TIMSS provides 1995 data for seventh and eighth graders for 40countries. The TIMSS-Repeat study of eighth-grade achievement pro-vides 1999 data for an additional 10 countries and a second measure ofeighth-grade achievement for 25 countries. To determine which nationshave curriculum-based external exit exams in secondary school, wereviewed comparative education studies, government documents, andeducation encyclopedias, and we interviewed education ministry offi-cials, embassy personnel, and graduate students from those nations whowere studying at Cornell University.5
The national school systems classified as having CBEEEs for bothmath and science in all parts of the country were Bulgaria, CzechRepublic, Denmark, England, Finland, Hong Kong, Hungary, Indonesia,Iran, Ireland, Israel, Italy, Japan, Jordan, Korea, Lithuania, Malaysia,Morocco, the Netherlands, New Zealand, Poland, Russia, Scotland,Singapore, Slovak Republic, Slovenia, Taiwan, Thailand, Trinidad andTobago, Tunisia, and Turkey. Three countries—France, Iceland, andRomania—had CBEEEs in mathematics but not in science. Four coun-tries—Australia, Canada, Germany, and the United States—had CBEEEsin some states or provinces but not in others. Norway had regular exitexaminations in mathematics, but exams only every few years in science.Latvia had an external examination system until very recently, so wegave it a 0.5 on the CBEEE variable. Sweden’s unusual system ofcombining external assessment and teacher assessment was also assigneda 0.5. The countries classified as not having a CBEEE in either subjectwere Austria, Belgium (both Flemish- and French-speaking systems),Brazil, Chile, Colombia, Cyprus, Greece, Mexico, the Philippines, Portu-gal, Spain, Switzerland, and Venezuela.6
Countries with a CBEEE system in the subject tend to have higherTIMSS scores. Furthermore, achievement differentials across nations are
5 A bibliography of the documents and individuals consulted when making theseclassifications is available from the author upon request. The TIMSS report’s informationabout examination systems does not distinguish between university admissions exams andcurriculum-based exit exams, so its classifications are not useful for this exercise. ThePhilippines, for example, is classified as having external exams by the TIMSS report, but itsexams are university admissions exams similar to the SAT. South Africa was excludedbecause its education system was disrupted for many years by anti-apartheid boycotts.Kuwait was excluded because of the disruption of its education system by the Iraqi invasionand the Gulf War.
6 Following Madeus and Kellaghan (1991), the university entrance examinations inGreece, Portugal, Spain, and Cyprus, and the ACT and SAT in the United States were notconsidered to be CBEEEs. University entrance exams have much smaller incentive effectsbecause students who are headed into work do not take them, and teachers can avoidresponsibility for their students’ exam results by arguing that not everyone is collegematerial or that examiners have set an unreasonably high standard to limit enrollment inhigher education.
THE APPROPRIATE ROLE FOR STUDENT ACHIEVEMENT STANDARDS 261
very large. According to the 1995 scores in science, Singapore, Korea,Bulgaria, and Flemish Belgium are more than one U.S. grade-levelequivalent (GLE) ahead of the United States.7 Colombia, the Philippines,Lithuania, Romania, and Portugal are more than three GLEs behind. Inmathematics, Singapore, Korea, Japan, and Hong Kong are four or moreGLEs ahead of the United States, while Colombia, the Philippines, andIran are more than three GLEs behind.
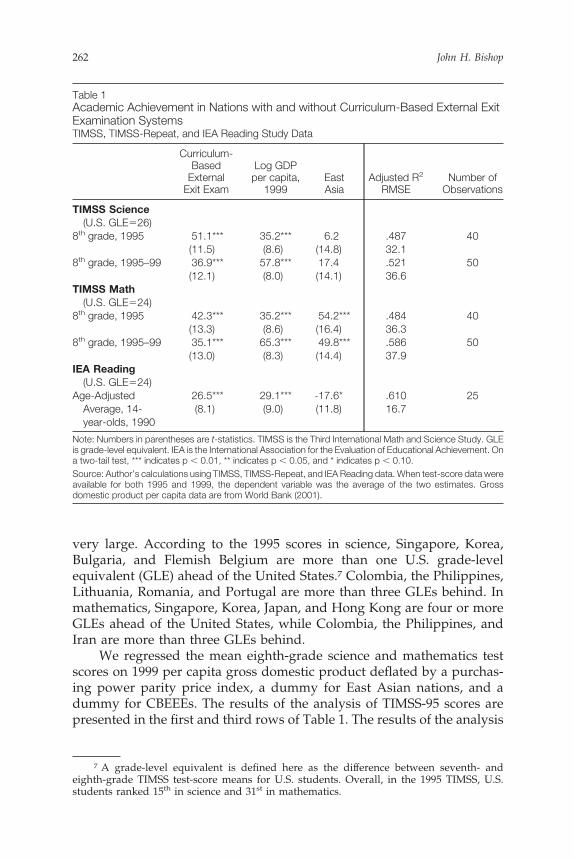
We regressed the mean eighth-grade science and mathematics testscores on 1999 per capita gross domestic product deflated by a purchas-ing power parity price index, a dummy for East Asian nations, and adummy for CBEEEs. The results of the analysis of TIMSS-95 scores arepresented in the first and third rows of Table 1. The results of the analysis
7 A grade-level equivalent is defined here as the difference between seventh- andeighth-grade TIMSS test-score means for U.S. students. Overall, in the 1995 TIMSS, U.S.students ranked 15th in science and 31st in mathematics.
Table 1Academic Achievement in Nations with and without Curriculum-Based External ExitExamination SystemsTIMSS, TIMSS-Repeat, and IEA Reading Study Data
Curriculum-BasedExternalExit Exam
Log GDPper capita,1999
EastAsia
Adjusted R2
RMSENumber ofObservations
TIMSS Science(U.S. GLE�26)
8th grade, 1995 51.1***(11.5)
35.2***(8.6)
6.2(14.8)
.48732.1
40
8th grade, 1995–99 36.9***(12.1)
57.8***(8.0)
17.4(14.1)
.52136.6
50
TIMSS Math(U.S. GLE�24)
8th grade, 1995 42.3***(13.3)
35.2***(8.6)
54.2***(16.4)
.48436.3
40
8th grade, 1995–99 35.1***(13.0)
65.3***(8.3)
49.8***(14.4)
.58637.9
50
IEA Reading(U.S. GLE�24)
Age-AdjustedAverage, 14-year-olds, 1990
26.5***(8.1)
29.1***(9.0)
-17.6*(11.8)
.61016.7
25
Note: Numbers in parentheses are t-statistics. TIMSS is the Third International Math and Science Study. GLEis grade-level equivalent. IEA is the International Association for the Evaluation of Educational Achievement. Ona two-tail test, *** indicates p � 0.01, ** indicates p � 0.05, and * indicates p � 0.10.Source: Author’s calculations using TIMSS, TIMSS-Repeat, and IEA Reading data. When test-score data wereavailable for both 1995 and 1999, the dependent variable was the average of the two estimates. Grossdomestic product per capita data are from World Bank (2001).
262 John H. Bishop

of merged TIMSS-95 and TIMSS-Repeat data are presented in the secondand fourth rows. Both analyses indicate that test scores are significantlyhigher in more developed nations, East Asian nations, and nations witha CBEEE in the subject. Nations with CBEEEs are about 1.5 U.S. GLEshigher on the math and science tests in the combined TIMSS-95 andTIMSS-Repeat data. The differential is even larger when only theTIMSS-95 data are analyzed. Since exams are also likely to influencelearning during upper secondary school, the total effect at the end oftwelfth grade is likely to be larger still.
International Association for the Evaluation of EducationalAchievement (IEA) Reading Literacy Study
The IEA conducted a study of the reading literacy of 14-year-olds in1990–91. The bottom row of Table 1 presents an analysis of IEA readingachievement data identical to the TIMSS analysis. The IEA study definedand measured three different types of reading literacy—narrative, expos-itory, and document—and an average of the three scores is the dependentvariable. The specification is the same as that used to study science andmath achievement. The exam variable is an average of the math andscience CBEEE dummy variables used in the analysis of the TIMSS data.The IEA results are similar to the TIMSS results. Fourteen-year-oldstudents in nations with CBEEE systems are about one U.S. grade-levelequivalent better at reading than students in nations without CBEEEsystems.
Program for International Student Assessment (PISA)
PISA is a new system of international assessment focusing on thereading, mathematics, and science literacy of 15-year-olds. Each partici-pating country selected a nationally representative sample of approxi-mately 4,000 15-year-olds. The students completed a 20- to 30-minutebackground questionnaire and a 90-minute assessment consisting of amix of multiple choice, short answer, and extended response questions.PISA is a distinctive assessment tool: “While other studies, such as TIMSSand NAEP, have a strong link to curriculum frameworks and seek tomeasure students’ mastery of specific knowledge, skills, and concepts,PISA is designed to measure ‘literacy’ more broadly. PISA’s content isdrawn from broad content areas, such as space and shape for mathemat-ics, in contrast to more specific curriculum-based content such as geom-etry or algebra” (U.S. Department of Education 2001, p. 5).
Principals of schools where students took PISA assessments alsocompleted a background questionnaire about their schools. PISA assessesthe cumulative educational experiences of all students at age 15 regard-less of their grade level or the type of institution they are attending. “By
THE APPROPRIATE ROLE FOR STUDENT ACHIEVEMENT STANDARDS 263
assessing students near the end of compulsory schooling in key knowl-edge and skills, PISA provides information about how well preparedstudents will be for their future lives as they approach an importanttransition point for education and work” (U.S. Department of Education2001, p. 3).
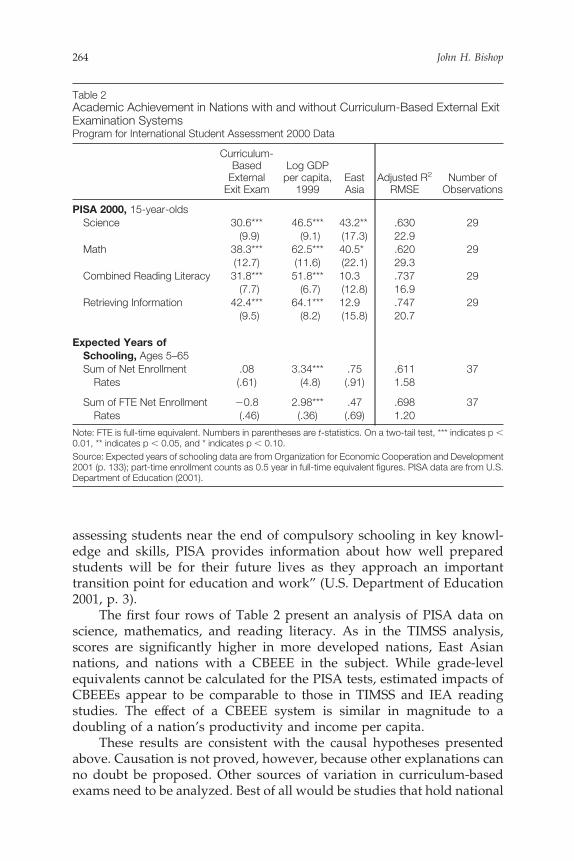
The first four rows of Table 2 present an analysis of PISA data onscience, mathematics, and reading literacy. As in the TIMSS analysis,scores are significantly higher in more developed nations, East Asiannations, and nations with a CBEEE in the subject. While grade-levelequivalents cannot be calculated for the PISA tests, estimated impacts ofCBEEEs appear to be comparable to those in TIMSS and IEA readingstudies. The effect of a CBEEE system is similar in magnitude to adoubling of a nation’s productivity and income per capita.
These results are consistent with the causal hypotheses presentedabove. Causation is not proved, however, because other explanations canno doubt be proposed. Other sources of variation in curriculum-basedexams need to be analyzed. Best of all would be studies that hold national
Table 2Academic Achievement in Nations with and without Curriculum-Based External ExitExamination SystemsProgram for International Student Assessment 2000 Data
Curriculum-BasedExternalExit Exam
Log GDPper capita,1999
EastAsia
Adjusted R2
RMSENumber ofObservations
PISA 2000, 15-year-oldsScience 30.6***
(9.9)46.5***(9.1)
43.2**(17.3)
.63022.9
29
Math 38.3***(12.7)
62.5***(11.6)
40.5*(22.1)
.62029.3
29
Combined Reading Literacy 31.8***(7.7)
51.8***(6.7)
10.3(12.8)
.73716.9
29
Retrieving Information 42.4***(9.5)
64.1***(8.2)
12.9(15.8)
.74720.7
29
Expected Years ofSchooling, Ages 5–65Sum of Net EnrollmentRates
.08(.61)
3.34***(4.8)
.75(.91)
.6111.58
37
Sum of FTE Net EnrollmentRates
�0.8(.46)
2.98***(.36)
.47(.69)
.6981.20
37
Note: FTE is full-time equivalent. Numbers in parentheses are t-statistics. On a two-tail test, *** indicates p �0.01, ** indicates p � 0.05, and * indicates p � 0.10.Source: Expected years of schooling data are from Organization for Economic Cooperation and Development2001 (p. 133); part-time enrollment counts as 0.5 year in full-time equivalent figures. PISA data are from U.S.Department of Education (2001).
264 John H. Bishop

culture constant; our final two data sets allow us to do this: the IAEP datafor nine Canadian provinces, and SAT comparisons for New York stateversus the other states.
Before turning to these last data sets, however, we can use the OECDdata to see whether there is evidence that curriculum-based external exitexams tend to push students out of school. Many believe that a tradeoffexists between the standards and quality of an educational system andthe number of students who can or will stay in school into their late teensand twenties. In the policy debate within the United States, concern hasbeen expressed that high- or medium-stakes student accountability willincrease dropout rates and reduce college attendance rates. We tested thishypothesis by calculating how many years youth in each of the OECDnations spend in school (we summed the net enrollment rates of peopleaged 5 to 65) and then assessing what impact CBEEEs have on theseestimates of expected years of schooling. The results are presented in thefifth and sixth rows of Table 2. CBEEEs had no effect on expected years ofschooling. The only variable that had a significant effect on how longyoung people typically stay in school was the nation’s income.
International Assessment of Educational Progress (IAEP) for NineCanadian Provinces
When the Educational Testing Service canvassed countries aboutparticipating in the 1991 IAEP, Canada decided to collect sufficient datato allow reliable comparisons among provinces and between the Anglo-phone and Francophone school systems of the five provinces with dualsystems.8 At the time, Alberta, British Columbia, Newfoundland, Quebec,and Francophone New Brunswick had curriculum-based provincial ex-aminations in English, French, mathematics, biology, chemistry, andphysics during the senior year of high school. These exams accounted for50 percent of that year’s final grade in Alberta, Newfoundland, andQuebec and 40 percent in British Columbia. The other provinces did nothave curriculum-based provincial external exit examinations in 1990–91.Ontario eliminated them in 1967, Manitoba in 1970, and Nova Scotia in1972. Anglophone New Brunswick had provincial exams in language artsand mathematics, but exam grades were not reported on transcripts orcounted in final course grades. Canadian provincial exams are medium-stakes, not high-stakes, tests. They influence grades, but passing theexamination is not essential for graduation. Employers appear uninter-
8 All French-speaking schools in New Brunswick, Saskatchewan, and Manitoba wereinvited to participate. Stratified random samples of 105 to 128 secondary schools wereselected from the French-speaking school systems of Ontario and Quebec and the English-speaking school systems in all provinces, with the exception of Prince Edward Island.
THE APPROPRIATE ROLE FOR STUDENT ACHIEVEMENT STANDARDS 265
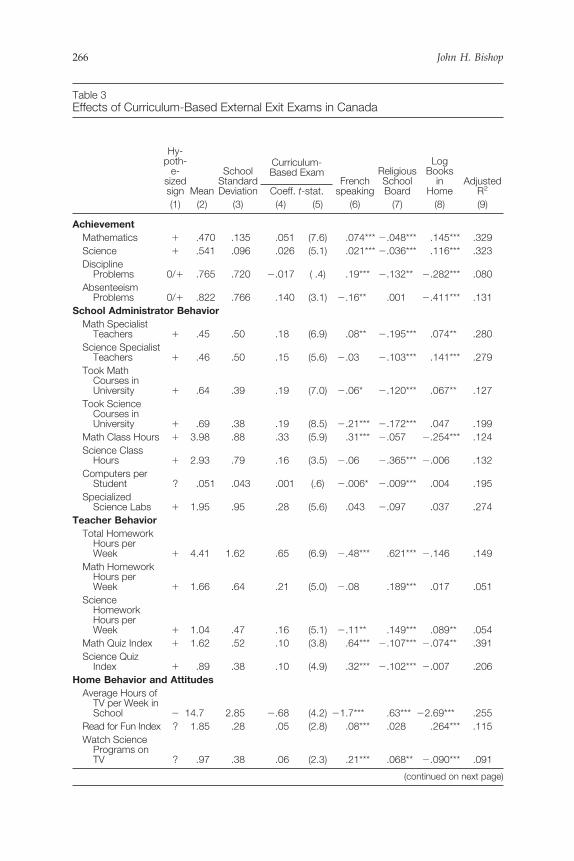
Table 3Effects of Curriculum-Based External Exit Exams in Canada
Curriculum-Based Exam
Hy-poth-e-sizedsign Mean
SchoolStandardDeviation Coeff. t-stat.
Frenchspeaking
ReligiousSchoolBoard
LogBooksin
HomeAdjustedR2
(1) (2) (3) (4) (5) (6) (7) (8) (9)
AchievementMathematics � .470 .135 .051 (7.6) .074*** �.048*** .145*** .329Science � .541 .096 .026 (5.1) .021*** �.036*** .116*** .323DisciplineProblems 0/� .765 .720 �.017 ( .4) .19*** �.132** �.282*** .080
AbsenteeismProblems 0/� .822 .766 .140 (3.1) �.16** .001 �.411*** .131
School Administrator BehaviorMath SpecialistTeachers � .45 .50 .18 (6.9) .08** �.195*** .074** .280
Science SpecialistTeachers � .46 .50 .15 (5.6) �.03 �.103*** .141*** .279
Took MathCourses inUniversity � .64 .39 .19 (7.0) �.06* �.120*** .067** .127
Took ScienceCourses inUniversity � .69 .38 .19 (8.5) �.21*** �.172*** .047 .199
Math Class Hours � 3.98 .88 .33 (5.9) .31*** �.057 �.254*** .124Science ClassHours � 2.93 .79 .16 (3.5) �.06 �.365*** �.006 .132
Computers perStudent ? .051 .043 .001 (.6) �.006* �.009*** .004 .195
SpecializedScience Labs � 1.95 .95 .28 (5.6) .043 �.097 .037 .274
Teacher BehaviorTotal HomeworkHours perWeek � 4.41 1.62 .65 (6.9) �.48*** .621*** �.146 .149
Math HomeworkHours perWeek � 1.66 .64 .21 (5.0) �.08 .189*** .017 .051
ScienceHomeworkHours perWeek � 1.04 .47 .16 (5.1) �.11** .149*** .089** .054
Math Quiz Index � 1.62 .52 .10 (3.8) .64*** �.107*** �.074** .391Science QuizIndex � .89 .38 .10 (4.9) .32*** �.102*** �.007 .206
Home Behavior and AttitudesAverage Hours ofTV per Week inSchool � 14.7 2.85 �.68 (4.2) �1.7*** .63*** �2.69*** .255
Read for Fun Index ? 1.85 .28 .05 (2.8) .08*** .028 .264*** .115Watch SciencePrograms onTV ? .97 .38 .06 (2.3) .21*** .068** �.090*** .091
(continued on next page)
266 John H. Bishop

ested in exam scores. Job application forms do not ask applicants toreport exam scores or grades.
The principals of schools sampled by IAEP completed questionnairesdescribing school policies, school resources, and the qualifications ofeighth-grade mathematics and science teachers. Students were askedabout books in the home, number of siblings, language spoken at home,hours of TV, hours doing homework, pleasure reading, watching scienceprograms on TV, parental oversight of schoolwork, and teaching meth-ods of teachers.
The effects of curriculum-based provincial exit exams taken bytwelfth graders on the achievement and behavior of Canadian 13-year-olds, their parents, teachers, and school administrators were examined byestimating models predicting these behaviors using schools as observa-tions. The data set comprises 1,338 Canadian schools. The model uses 11explanatory variables: logarithm of the mean number of books in thehome; the mean number of siblings; the proportion of the school’sstudents whose home language was different from the language ofinstruction; logarithm of the number of students per grade in the school;dummies for schools run by a locally elected religious school board,independent secular schools, independent nonsecular schools, schools
Table 3 (continued)Effects of Curriculum-Based External Exit Exams in Canada
Curriculum-Based Exam
Hy-poth-e-sizedsign Mean
SchoolStandardDeviation Coeff. t-stat.
Frenchspeaking
ReligiousSchoolBoard
LogBooksin
HomeAdjustedR2
(1) (2) (3) (4) (5) (6) (7) (8) (9)
Parents Talkabout MathClass � .62 .17 .04 (3.4) .02 .044*** .016 .046
Parents Talkabout ScienceClass � .47 .17 .06 (5.2) �.01 .007 .074*** .056
Parents Want Meto Do Well inMath � 3.54 .22 .05 (3.1) �.01 .093*** .084*** .104
Parents’ Interestin Science (0–4) � 2.18 .34 .06 (2.6) .12*** .109*** .209*** .071
Science Useful inEveryday Life � 2.46 .31 .06 (2.7) .18*** .141*** �.097*** .095
Note: On a two-tail test, *** indicates p � 0.01, ** indicates p � 0.05, and * indicates p � 0.10. Controls alsoincluded mean number of siblings, the proportion of the students who use a different language at home, thenumber of students in a grade, and dummy variables for independent schools, religious schools, K–11 schools,and schools including 4th grade.Source: Author’s regressions predicting the characteristics of 1,309 to 1,338 Canadian secondary schools.
THE APPROPRIATE ROLE FOR STUDENT ACHIEVEMENT STANDARDS 267
with primary grades, schools that include all grades in one building, andFrench-speaking schools; and a dummy for province exam.
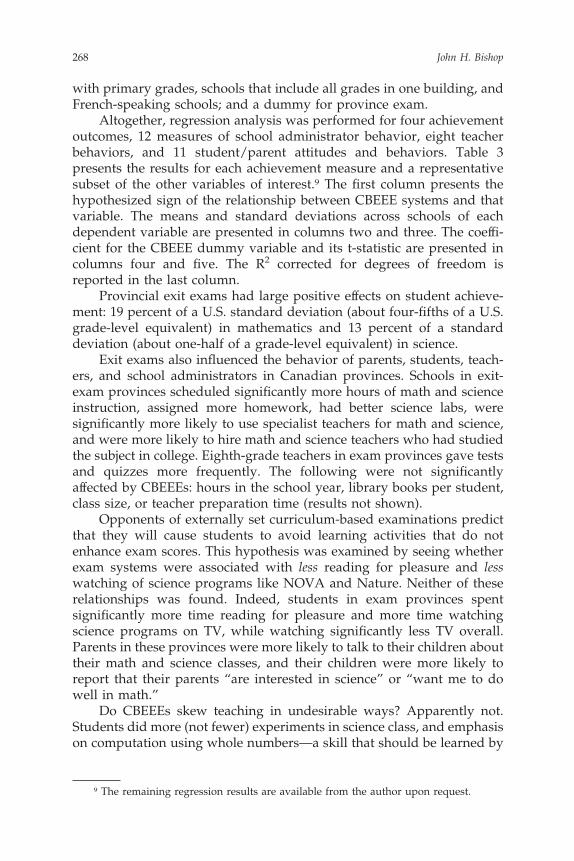
Altogether, regression analysis was performed for four achievementoutcomes, 12 measures of school administrator behavior, eight teacherbehaviors, and 11 student/parent attitudes and behaviors. Table 3presents the results for each achievement measure and a representativesubset of the other variables of interest.9 The first column presents thehypothesized sign of the relationship between CBEEE systems and thatvariable. The means and standard deviations across schools of eachdependent variable are presented in columns two and three. The coeffi-cient for the CBEEE dummy variable and its t-statistic are presented incolumns four and five. The R2 corrected for degrees of freedom isreported in the last column.
Provincial exit exams had large positive effects on student achieve-ment: 19 percent of a U.S. standard deviation (about four-fifths of a U.S.grade-level equivalent) in mathematics and 13 percent of a standarddeviation (about one-half of a grade-level equivalent) in science.
Exit exams also influenced the behavior of parents, students, teach-ers, and school administrators in Canadian provinces. Schools in exit-exam provinces scheduled significantly more hours of math and scienceinstruction, assigned more homework, had better science labs, weresignificantly more likely to use specialist teachers for math and science,and were more likely to hire math and science teachers who had studiedthe subject in college. Eighth-grade teachers in exam provinces gave testsand quizzes more frequently. The following were not significantlyaffected by CBEEEs: hours in the school year, library books per student,class size, or teacher preparation time (results not shown).
Opponents of externally set curriculum-based examinations predictthat they will cause students to avoid learning activities that do notenhance exam scores. This hypothesis was examined by seeing whetherexam systems were associated with less reading for pleasure and lesswatching of science programs like NOVA and Nature. Neither of theserelationships was found. Indeed, students in exam provinces spentsignificantly more time reading for pleasure and more time watchingscience programs on TV, while watching significantly less TV overall.Parents in these provinces were more likely to talk to their children abouttheir math and science classes, and their children were more likely toreport that their parents “are interested in science” or “want me to dowell in math.”
Do CBEEEs skew teaching in undesirable ways? Apparently not.Students did more (not fewer) experiments in science class, and emphasison computation using whole numbers—a skill that should be learned by
9 The remaining regression results are available from the author upon request.
268 John H. Bishop

the end of fifth grade—declined significantly (these results are notpresented in the table). Apparently, teachers subjected to the subtlepressure of a provincial exam four years in the future adopt strategiesthat are conventionally viewed as “best practices,” not strategies de-signed to maximize scores on multiple-choice tests.
Students responded to the improved teaching by becoming morelikely to report that science was “useful in everyday life.” The dataprovided no support for our hypothesis that CBEEEs would induceemployers to pay greater attention to high school achievement. Studentsin exam provinces were not more likely to believe that math wasimportant in getting a good job and were less likely to believe that sciencewas important in job hunting (results not shown).
One possible skeptical response to these findings is to point out thatthe correlation between the exam and other outcomes may not be causal.Maybe the people of Alberta, British Columbia, Newfoundland, Quebec,and Francophone New Brunswick—the provinces with exam systems—place higher priority on education than do people in the rest of the nation.Maybe this trait also results in greater political support for examinationsystems. If so, we would expect schools in the exam provinces to be betterthan schools in other provinces along other dimensions, such as disci-pline and absenteeism, and not just by academic criteria.
Bishop (1996) predicts, to the contrary, that exam systems inducestudents and schools to redirect resources and attention to the learningand teaching of exam subjects and away from the achievement of othergoals such as low absenteeism, good discipline, and lots of computers.These competing hypotheses are evaluated in the third, fourth, andeleventh rows of Table 3. Contrary to the “provincial taste for education”hypothesis, principals in exam provinces had not purchased additionalcomputers, did not report significantly fewer discipline problems, andwere significantly more likely to report absenteeism problems.
Scholastic Aptitude Test (SAT) in New York State
In the early 1990s, New York state was the only state with avoluntary CBEEE system. In 1993, about 56 percent of ninth graders tookthe mathematics course 1 exam and, of these, 24 percent of those nottaking Regents exams were typically in courses that were considerablyless challenging than Regents-level courses. A system of minimumcompetency tests in specific subjects set a minimum standard for thosenot taking Regents courses but, as in other states, the passing standardwas low.
New York’s students are more disadvantaged, more heavily minor-ity, and more likely to be foreign-born than students in most other states.Among northern states, only Maryland, Delaware, and Illinois have alarger share of African-American pupils. Nationwide, only California has
THE APPROPRIATE ROLE FOR STUDENT ACHIEVEMENT STANDARDS 269
a higher share of foreign-born population, and only California, Texas,Arizona, New Mexico, and Colorado have larger Hispanic populationshares. In New York, literacy levels among adults are substantially belowthe national average (National Education Goals Panel 1993).
Consequently, when we compare student achievement levels, familybackground must be taken into account. Considering the high incidenceof at-risk children, New York students do remarkably well. The propor-tion of students taking algebra, calculus, chemistry, and physics isgenerally above the national average. A larger proportion (9.4 percent) ofNew York’s eleventh and twelfth graders are taking and passing APexams in English, science, math, or history than any other state exceptUtah (National Education Goals Panel 1993).
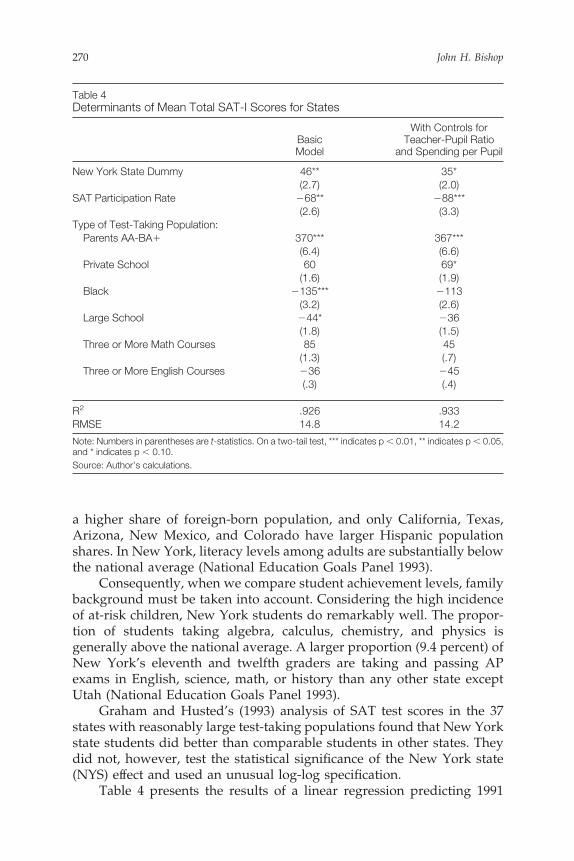
Graham and Husted’s (1993) analysis of SAT test scores in the 37states with reasonably large test-taking populations found that New Yorkstate students did better than comparable students in other states. Theydid not, however, test the statistical significance of the New York state(NYS) effect and used an unusual log-log specification.
Table 4 presents the results of a linear regression predicting 1991
Table 4Determinants of Mean Total SAT-I Scores for States
BasicModel
With Controls forTeacher-Pupil Ratio
and Spending per Pupil
New York State Dummy 46**(2.7)
35*(2.0)
SAT Participation Rate �68**(2.6)
�88***(3.3)
Type of Test-Taking Population:Parents AA-BA� 370***
(6.4)367***(6.6)
Private School 60(1.6)
69*(1.9)
Black �135***(3.2)
�113(2.6)
Large School �44*(1.8)
�36(1.5)
Three or More Math Courses 85(1.3)
45(.7)
Three or More English Courses �36(.3)
�45(.4)
R2 .926 .933RMSE 14.8 14.2
Note: Numbers in parentheses are t-statistics. On a two-tail test, *** indicates p� 0.01, ** indicates p� 0.05,and * indicates p � 0.10.Source: Author’s calculations.
270 John H. Bishop
mean SAT-Math plus SAT-Verbal test scores for the 37 states for whichdata are available. With the exception of the dummy variable for NewYork state, all right-hand-side variables are proportions—generally theshare of the test-taking population with the characteristic described.Clearly, New Yorkers do significantly better on the SAT than students ofthe same race and social background living in other states (row one).
When this model is estimated without the NYS dummy variable,New York has the largest positive residual in the sample. The next largestpositive residual (Wisconsin’s) is 87 percent of New York’s residual.Illinois and Nevada have positive residuals that are about 58 percent ofNew York’s value. Arizona, California, Colorado, Florida, New Mexico,Ohio, Rhode Island, Texas, and Washington have negative residualsgreater than 10 points. Many of these states have large populations ofHispanics and recent immigrants, a trait that was not controlled for in theanalysis. This makes New York’s achievement all the more remarkablewhen one considers that Hispanics and immigrants are a large share of itsschoolchildren.
For individuals, the summed SAT-Math plus SAT-Verbal has astandard deviation of approximately 200 points. Consequently, thedifferential between New York state’s SAT mean and the prediction forNew York (based on outcomes in the other 36 states) is about 20 percentof a standard deviation or about three-quarters of a grade-level equiva-lent.
Adding the teacher-pupil ratio and spending per pupil to the modelreduces the NYS coefficient by 25 percent (column two). It remainssignificantly greater than zero, however. The teacher-pupil ratio has asignificant positive effect on SAT scores. This suggests that heavyinvestment in K–12 schooling in New York state (possibly stimulated inpart by the Regents exam system) may be one of the reasons why NewYork state students perform better than comparable students in otherstates.
The theory predicts that the existence of CBEEE systems will induceNew York state to spend more on K–12 education and focus thatspending on instruction. Indeed, New York’s ratio of K–12 teachersalaries to college faculty salaries is significantly above average. NewYork teachers are also more likely to have master’s degrees than are theteachers of any other state, except Connecticut and Indiana. New Yorkranks seventh in both teacher-pupil ratio and the ratio of per pupilspending to gross state product per capita (Bishop 1996).
Clearly, New York invests a great deal in its K–12 education system.If the cause of the high spending were a strong general commitment toeducation or legislative profligacy, we would expect spending to be highon both K–12 and higher education. This is not the case. New York isnumber one among the 50 states in the ratio of K–12 spending per pupilto higher education spending per college student.
THE APPROPRIATE ROLE FOR STUDENT ACHIEVEMENT STANDARDS 271

The Regents exams have been low- to medium-stakes tests, nothigh-stakes tests. Exam grades counted for less than a quarter of the finalgrade in the course and influenced only the type of diploma received.Employers ignored exam results when making hiring decisions. Studentswere aware that they could avoid Regents courses and still go to college.Indeed some perceived an advantage to avoiding them:
My counselor wanted me to take Regents history, and I did for a while. Butit was pretty hard, and the teacher moved fast. I switched to the otherhistory, and I’m getting better grades. So my average will be better forcollege. Unless you are going to a college in the state, it doesn’t really matterwhether you get a Regents diploma (Ward 1994, p. 12).
Indeed, the small payoff to taking Regents exams may be one of thereasons why 40 to 50 percent of students elected to take watered-downlocal classes either to reduce their workload or to boost their GPA.
This has changed. In 1996, the Board of Regents announced thatstudents entering ninth grade in 1996 had to take a new Regents Englishexamination and pass it at the 55 percent level. The requirement to takeand pass exams in five subjects applies to those entering ninth grade in1999 or later. The English exam has become more challenging. Thereading selections are longer and more difficult. The biggest change isthat the exam is six hours rather than three, and students must write fourlong essays rather than two. One of the four essays asks for a response totwo long literary passages that are presented to them for the first time. InJanuary 2001, the prompt was:
Read the passages on the following pages [a memoir and an essay].. . . Write a unified essay about the discovery of beauty. In your essay useideas from both passages to establish a controlling idea about the discoveryof beauty. Using evidence from each passage, develop your controlling ideaand show how the author uses specific literary elements or techniques toconvey that idea.
These prompts clearly call for deeper thinking about literature than theprompts used in past Regents exams. There is nothing rote or formulaicabout teaching students how to handle essay questions like these. Thepressures created by these exams are improving the teaching of literatureand writing throughout the state. This is the true purpose of the Regentsexam system.
CONCLUSIONS
Our review of the evidence suggests that the claims by advocates ofstandards-based reform that curriculum-based external exit examinationssignificantly increase student achievement are probably correct. Students
272 John H. Bishop

from countries with such systems outperform students from othercountries at a comparable level of economic development on TIMSS-95,TIMSS-Repeat, PISA, and IEA reading studies. School enrollment ratesare not reduced by CBEEE systems. Not only did students from Canadianprovinces with such systems know more science and mathematics thanstudents in other provinces, but they also watched less television andtalked with their parents more about schoolwork.
Furthermore, schools in provinces with external exams were morelikely to employ specialist teachers of mathematics and science; hire mathand science teachers who had studied the subject in college; havehigh-quality science laboratories; schedule extra hours of math andscience instruction; assign more homework in math, science, and othersubjects; have students do or watch experiments in science class; andschedule frequent tests in math and science classes.
When student demography was held constant, New York state, theonly U.S. state with a CBEEE system in the early 1990s, did significantlybetter than other states on the SAT-I test. The pressures created by theseexams are improving the teaching of literature and writing throughoutthe state. This is the true purpose of curriculum-based external exit examsystems.
References
American Federation of Teachers. 1995. Setting Strong Standards: AFT’s Criteria for Judging theQuality and Usefulness of Student Achievement Standards. Washington, DC: AmericanFederation of Teachers.
———. 1996. Making Standards Matter: 1996. Washington, DC: American Federation ofTeachers.
Association of Secondary Teachers of Ireland. 1990. Information Sheet opposing changes inExamination Systems.
Beaton, Albert, et al. 1996. Mathematics Achievement in the Middle School Years: IEA’s ThirdInternational Mathematics and Science Study. Chestnut Hill, MA: Center for the Study ofTesting, Evaluation, and Educational Policy, Boston College.
———. 1996. Science Achievement in the Middle School Years: IEA’s Third InternationalMathematics and Science Study. Chestnut Hill, MA: Center for the Study of Testing,Evaluation, and Educational Policy, Boston College.
Bishop, John. 1990. “Productivity Consequences of What Is Learned in High School.” Journalof Curriculum Studies 22 (2): 101–26.
———. 1992. “The Impact of Academic Competencies on Wages, Unemployment and JobPerformance.” Carnegie/Rochester Conference Series on Public Policy 37 (December):127–95.
———. 1996. “The Impact of Curriculum-Based External Examinations on School Prioritiesand Student Learning.” International Journal of Education Research 23 (8): 653–752.
Bishop, John, Joan Moriarty, and Ferran Mane. 1997. “Diplomas for Learning, Not SeatTime: The Effects of New York’s Regents Examinations.” Paper presented at theRegents Forum in Albany, New York (October).
Brooks-Cooper, Candace. 1993. “The Effect of Financial Incentives on the Standardized TestPerformance of High School Students.” Cornell University, master’s thesis (August).
Cameron, Stephen V. and James J. Heckman. 1991. “The Nonequivalence of High SchoolEquivalents.” NBER Working Paper No. 3804 (August).
Chubb, John and Terry Moe. 1990. Politics, Markets, and America’s Schools. Washington, DC:Brookings Institution.
THE APPROPRIATE ROLE FOR STUDENT ACHIEVEMENT STANDARDS 273

College Board. 1999. “More Schools, Teachers and Students Accept the AP Challenge in1998–99.” August 31. New York: The College Board.
Competitiveness Policy Council. 1993. Reports of the Subcouncils. March. Washington, DC:Competitiveness Policy Council.
Costrell, Robert. 1994. “A Simple Model of Educational Standards.” American EconomicReview 84 (4): 956–71.
Edwards, Virginia B. 1999. “Quality Counts ’99: Rewarding Results, Punishing Failures.”Education Week 18 (17): 87–93.
Fleming, M. and B. Chambers. 1983. “Teacher-Made Tests: Windows on the Classroom.” InTesting in the Schools: New Directions for Testing and Measurement. San Francisco: JosseyBass.
Graham, Amy and Thomas Husted. 1993. “Understanding State Variation in SAT Scores.”Economics of Education 12 (3): 197–202.
Gummere, Richard. 1943. “The Independent School and the Post War World.” IndependentSchool Bulletin 4 (April).
Hayward, Ed. 2001. “Dramatic Improvement in MCAS scores.” Boston Herald (October 16).Hollenbeck, Kevin and Bruce Smith. 1984. Selecting Young Workers: The Influence of
Applicants’ Education and Skills on Employability Assessments by Employers. Columbus,OH: National Center for Research in Vocational Education, Ohio State University.
International Assessment of Educational Progress. 1992. IAEP Technical Report. Vol. 1.Princeton, NJ: Educational Testing Service.
Kang, Suk. 1985. “A Formal Model of School Reward Systems,” in Incentives, Learning, andEmployability, edited by J. Bishop. Columbus, OH: National Center for Research inVocational Education, Ohio State University.
Kiplinger, Vonda and Robert Linn. 1993. “Raising the Stakes of Test Administration: TheImpact on Student Performance on NAEP.” Center for the Study of EvaluationTechnical Report 360. National Center for Research on Evaluation, Standards, andStudent Testing, University of California, Los Angeles.
Lerner, Barbara. 1990. “Good News about American Education.” Commentary 91 (3): 19–25.Madeus, George. 1991. “The Effects of Important Tests on Students: Implications for a
National Examination or System of Examinations.” Paper presented at the AmericanEducational Research Association Invitational Conference on Accountability as a StateReform Instrument: Impact on Teaching, Learning, Minority Issues, and Incentives forImprovement, Washington, DC (June).
Madeus, George and Thomas Kellaghan. 1991. “Examination Systems in the EuropeanCommunity: Implications for a National Examination System in the United States.”Contractor Report for the Office of Technology Assessment, U.S. Congress, Washing-ton, DC.
Merten, Don. 1996. “Visibility and Vulnerability: Responses to Rejection by NonaggressiveJunior High School Boys.” Journal of Early Adolescence 16 (1): 5–26.
Mullis, Ina, et al. 1997. Mathematics Achievement in the Primary School Years: IEA’s ThirdInternational Mathematics and Science Study. Chestnut Hill, MA: Center for the Study ofTesting, Evaluation, and Educational Policy, Boston College.
National Education Goals Panel. 1993. National Education Goals Report 1993. Vol. 2.Washington, DC: Government Printing Office.
———. 1995. Data for the National Education Goals Report: 1995. Vol. 1. Washington, DC:Government Printing Office.
O’Neil, Harold F., et al. 1997. “Final Report of Experimental Studies on Motivation andNAEP Test Performance.” Center for the Study of Evaluation Technical Report 427.National Center for Research on Evaluation, Standards, and Student Testing, Univer-sity of California, Los Angeles.
Organization for Economic Cooperation and Development. Center for Educational Researchand Innovation. 2001. Education at a Glance 2001. Paris: Organization for EconomicCooperation and Development.
Peter D. Hart Research Associates. 1995. Valuable Views: A Public Opinion Research Report onthe Views of AFT Teachers on Professional Issues. Washington, DC: American Federationof Teachers.
274 John H. Bishop
Rohwer, William D. and John W. Thomas. 1987. “Domain Specific Knowledge, CognitiveStrategies, and Impediments to Educational Reform,” in Cognitive Strategy Research,edited by M. Pressley. New York: Springer-Verlag.
Steinberg, Laurence, Bradford Brown, and Sanford Dornbusch. 1996. Beyond the Classroom.New York: Simon and Schuster.
Thomas, John W. 1991. “Expectations and Effort: Course Demands, Students’ StudyPractices, and Academic Achievement.” Paper presented at the Office of EducationalResearch and Improvement Conference on Student Motivation.
Tinkelman, Sherman N. 1966. “Regents Examinations in New York State after 100 Years.”Albany, NY: The University of the State of New York and the State EducationDepartment.
U.S. Department of Education. National Center for Education Statistics. 1993. Digest ofEducation Statistics: 1992. Washington, DC.
———. 1996. Pursuing Excellence: A Study of U.S. Eighth-Grade Mathematics and ScienceTeaching, Learning, Curriculum, and Achievement in International Context: Initial FindingsFrom The Third International Mathematics and Science Study. NCES 97–198. Washington,DC.
———. 2001. Outcomes of Learning: Results From the 2000 Program for International StudentAssessment of 15-Year-Olds in Reading, Mathematics, and Science Literacy. NCES 2002–115,by M. Lemke, et al. Washington, DC.
U.S. General Accounting Office. 1993. Educational Testing: The Canadian Experience withStandards, Examinations, and Assessments, by K. D. White. GAO/PEMD-93-11. Washing-ton, DC.
Ward, Deborah Hormell. 1994. “A Day in the Life.” New York Teacher 25 (10): 10–12.World Bank. 2001. The World Development Report 2000–2001: Attacking Poverty. New York:
Oxford University Press.
THE APPROPRIATE ROLE FOR STUDENT ACHIEVEMENT STANDARDS 275
Appendix Table 1Examples of End-of-Course (EOC) Examination Systems
StateYear
AnnouncedSubjects (year firstadministered)
Score onTranscript
Part ofCourseGrade
TeachersGrade Exam
HonorsDiplomaBasedon EOCExam
YearMinimum
CompetencyExam (MCE)Begins
EOC Examcan
substitutefor MCE
Other Rewards for StudentAchievement
NY 1865 English, Math, Biology,Chemistry, Physics, U.S.History, World History, Latin,Foreign Languages,Introduction to Occupations
Yes Yes Yes Yes(40%)
1979 about 1992 In 1950s scholarships werebased on Regents exams.Use in teacher assessment isa local option. Becomesprimary high schoolgraduation test after2000–03.
NC 1984 Algebra I, Biology (1987);Algebra II, U.S. History(1988); Chemistry,Geometry (1989); English I,Physics, Social Studies(1990–91)
Yes Most (25%after 2000)
Yes 2003 1980 No State tests at earlier gradesinfluence retention decisions.
CA 1983 Algebra I, Geometry (1987);U.S. History, Economics(1990); Biology, Chemistry(1991); Coordinated Science(1994); Writing (1996); Civics(1997); Literature, HighSchool Math (1998);Physics, Spanish (1999)
Yes No No Yes (1%) 2004 No State tests at earlier gradesinfluence retention decisions.
TX 1992 Biology (1995); Algebra I(1996); U.S. History, English(1999)
Yes Most(required infuture)
? No 1987 2000 Scholarships based on courserigor and family income.State tests at earlier gradesinfluence retention decisions.
TN 1992 Algebra I, Biology, English II(2001); Algebra II, Geometry,English I (2002); U.S.History, Chemistry, Physics(2003)
Yes Yes ? No 1985 2005 Becomes high schoolgraduation test in 2005.Current honors diplomabased on GPA.
276John
H.B
ishop

Appendix Table 1 (continued)Examples of End-of-Course (EOC) Examination Systems
StateYear
AnnouncedSubjects (year firstadministered)
Score onTranscript
Part ofCourseGrade
TeachersGrade Exam
HonorsDiplomaBasedon EOCExam
YearMinimum
CompetencyExam (MCE)Begins
EOC Examcan
substitutefor MCE
Other Rewards forStudent Achievement
MD 1995 English I, Civics, Algebra,Geometry, Biology(2001)
Yes ? ? No 1983 2007 Becomes high schoolgraduation test in2007. Honors diplomabased on rigorouscourses and GPAsince 1998.
MS 1994 Algebra, U.S. History(1997); Biology (1998)
? ? ? No 1989 No Merit Scholarship basedon GPA and ACTscores.
VA 1996 English, Algebra I & II,Geometry, EarthScience, Biology,Chemistry, U.S.History, World History(1998)
Yes Some ? Yes 1981 2004 Becomes high schoolgraduation test in2004. State tests atearlier grades influenceretention decisions.
OK 1999 English, U.S. History(2000); Math, Biology(2001)
Yes No No No None No State university andemployers encouragedto use EOC exam inadmission and hiring.
AR 1997 Math (1999); English(2002); Science,History (2004)
Yes No No No None No State tests at earliergrades influenceretention decisions.
Source: Author’s research using multiple reference materials.
THEAPPR
OPR
IATEROLEFO
RSTUDENTACHIEVEMENTSTANDARDS
277

Appendix Table 2Examples of End-of-Grade (EOG) Examination Systems
StateYear
AnnouncedSubjects (year firstadministered)
Score onTranscript
Part ofGrade
TeachersGradeExam
HonorsDiplomaBased onEOG Exam
Year HighSchool
GraduationTest
RequirementBegins Other Rewards for Student Achievement
OH 1987 12th grade: Reading,Science, Math,Civics (1994–96)
Yes No No Yes, in part 1994 $500 scholarship based on EOG exam. Honorsdiploma based on rigorous courses, GPA, 12thgrade exams, or ACT.
CT 1991 10th grade: English,Math, Science (1994)
Yes No No Yes None
MI 1991 11th grade: Math,Reading, Science,Writing (1997); SocialStudies (1999)
Yes No No Starts 1996,subject-by-subject
None Beginning with 2000 graduates, $2,500 scholarshipawarded based on EOG exams.
PA 1991 11th grade: Reading,Writing, Math (1999)
Some No No Starts 2003 None
OR 1991 10th grade: English,Math (1996); Science(1999); SocialStudies (2003)
Most; expectincrease
Some Teachersblind
Starts 2001(proposedsubject-by-subject)
None Certification of Initial Mastery based on English andMath (2001), add Science (2002), Arts (2003),second language (2005), and Social Studies(2006).
IN 1993 10th grade: English,Math (1997)
Most No No No 2000 Graduation requirement also met by grade C orbetter in all Core 40 college prep courses ordemonstrated 9th grade achievement level.Honors diploma based on curriculum.
MA 1993 10th grade: English,Math, Science (1998)
No,temporarily
No No Starts 2000 2003 As of March 2000, class of 2000 receive Certificateof Mastery based on EOG, AP, or SAT II scores.
IL 1997 11th grade: Reading,Writing, Math,Science, SocialScience (2001)
Yes No No Starts 2002,subject-by-subject
None
WI 1997 10th grade: Reading,Writing, Math,Science, SocialScience (2002)
Yes No No No 2004 1997 high school graduation test legislation repealedin 1999; left to local districts.
Source: Author’s research using multiple reference materials.
278John
H.B
ishop