
What is Statistics/Statistic Set of methods and rules for organizing summarizing, and interpreting...
137
-
Upload
reynard-webb -
Category
Documents
-
view
220 -
download
0
Transcript of What is Statistics/Statistic Set of methods and rules for organizing summarizing, and interpreting...


What is Statistics/StatisticWhat is Statistics/Statistic
Set of Set of methodsmethods and and rulesrules for for organizingorganizing summarizingsummarizing, and , and interpretinginterpreting information information
22
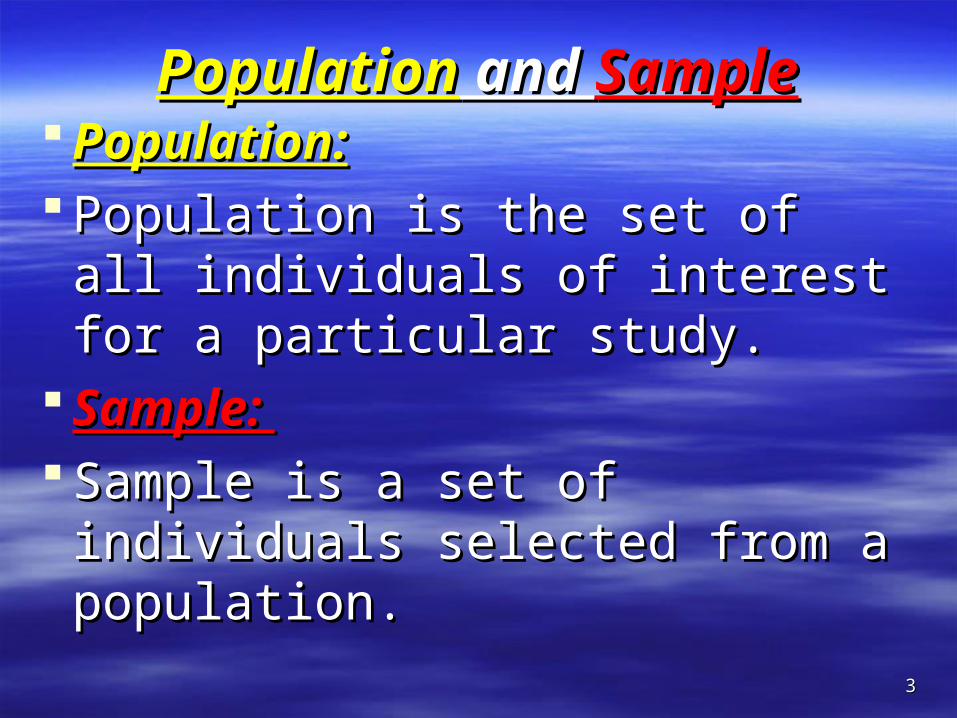
PopulationPopulation and and SampleSample Population:Population: Population is the set of all Population is the set of all
individuals of interest for a individuals of interest for a particular study.particular study.
Sample: Sample: Sample is a set of individuals Sample is a set of individuals
selected from a population.selected from a population.33
PopulationPopulation
Sample Sample
44
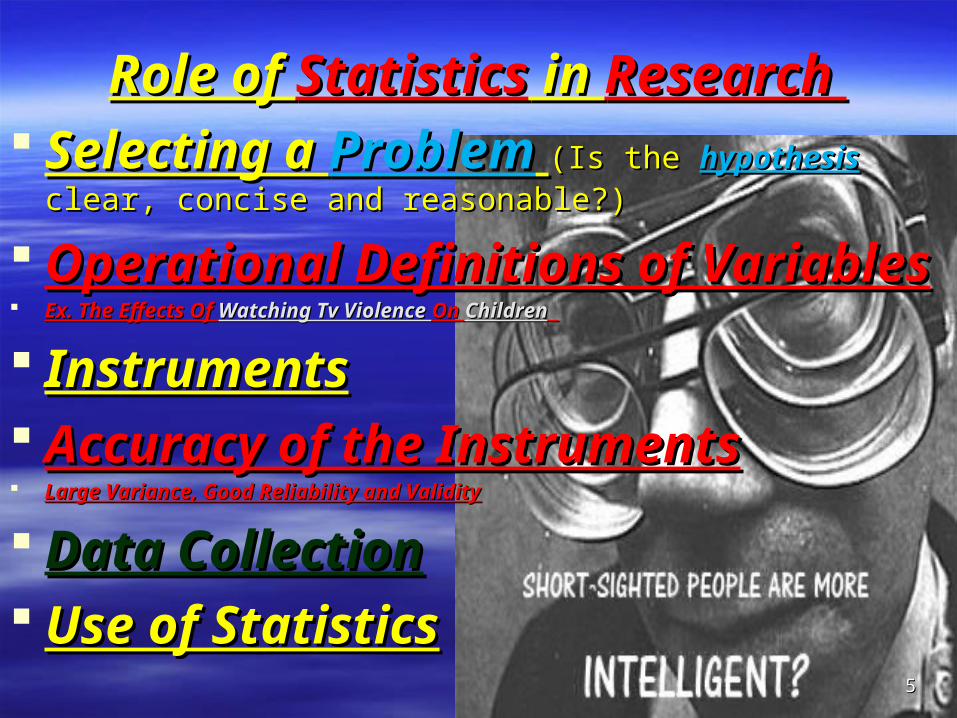
Role of Role of StatisticsStatistics in in Research Research Selecting a Selecting a ProblemProblem (Is the (Is the hypothesishypothesis clear, clear,
concise and reasonable?)concise and reasonable?)
Operational Definitions of VariablesOperational Definitions of Variables Ex. The Effects Of Ex. The Effects Of Watching Tv Violence Watching Tv Violence On On ChildrenChildren
InstrumentsInstruments Accuracy of the InstrumentsAccuracy of the Instruments Large Variance, Good Reliability and ValidityLarge Variance, Good Reliability and Validity
Data CollectionData Collection Use of StatisticsUse of Statistics
55
Merriam Webster Dictionary and Thesaurus Merriam Webster Dictionary and Thesaurus Definition of Definition of Short-SightedShort-Sighted
1. Near sighted or Myopia1. Near sighted or Myopia
2. Lacking Foresight 2. Lacking Foresight
3. Lacking the power of foreseeing 3. Lacking the power of foreseeing
4. Inability to look forward4. Inability to look forwardMy Operational Definition:My Operational Definition:5. person who is able to see near things 5. person who is able to see near things more clearly than distant ones, needs to wear more clearly than distant ones, needs to wear corrected eyeglasses prescribed corrected eyeglasses prescribed (measured) (measured) by by OphthalmologistOphthalmologist..
66

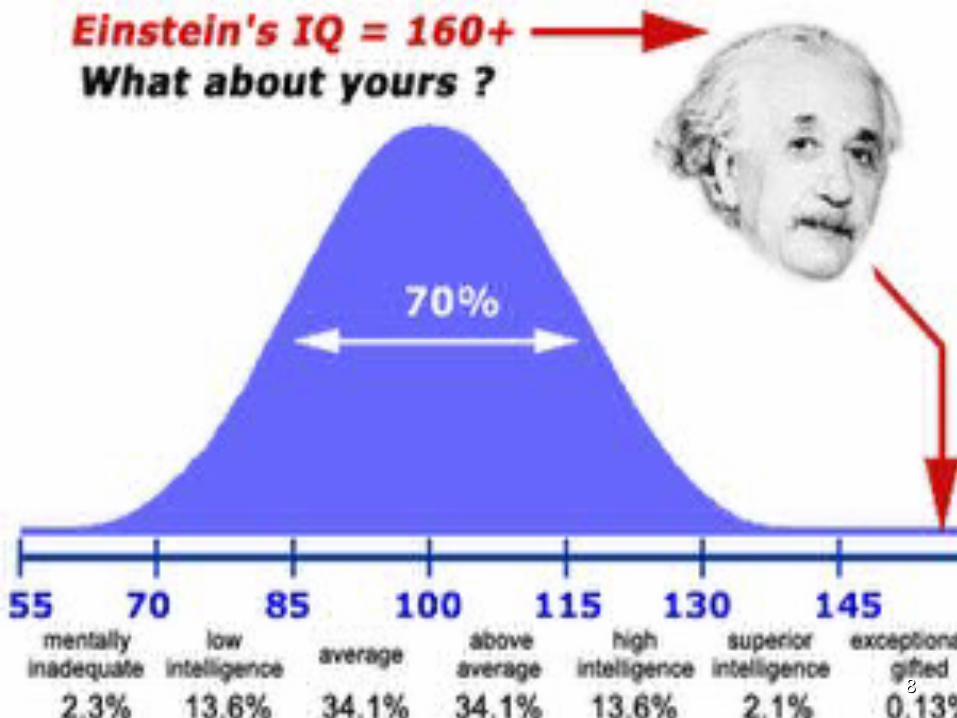
The American Heritage DictionaryThe American Heritage Dictionary Definition of IntelligentDefinition of Intelligent 1. Having or indicating a high or satisfactory 1. Having or indicating a high or satisfactory
degree of intelligence and mental capacitydegree of intelligence and mental capacity My Operational Definition of Intelligent:My Operational Definition of Intelligent: 2. Revealing or reflecting good judgment or 2. Revealing or reflecting good judgment or
sound thought : skillful sound thought : skillful And is And is measuredmeasured by the by the IQ score IQ score from the from the
Stanford-Binet V Stanford-Binet V IQ Test IQ Test ( in the Method ( in the Method section of the research paper we write about section of the research paper we write about the the reliabilityreliability and and validity validity of this of this instrument). Or select WAIS or WISCinstrument). Or select WAIS or WISC
77
88
SStatistical tatistical PPackage for the ackage for the SSocial ocial SSciencesciences
1010


DefinitionsDefinitions Measurement:Measurement: Quantifying an Quantifying an
observable observable behavior behavior oror when when quantitative quantitative value is given to value is given to a behavior a behavior
1212

WHAT IS ALL THE FUSS?WHAT IS ALL THE FUSS?
MeasurementMeasurement should be as should be as preciseprecise as as possible. The possible. The precisions of your precisions of your measurement tools measurement tools will determine the will determine the precession of your research.precession of your research.. .
In psychology, most variables are In psychology, most variables are probably measured at the probably measured at the nominalnominal or or ordinalordinal level level
But—how a variable is measured can But—how a variable is measured can determine the determine the level of precisionlevel of precision
1313

Hypothesis is a Research TopicHypothesis is a Research Topic High Cholesterol Can Cause Heart High Cholesterol Can Cause Heart
AttackAttack
1414

DefinitionsDefinitions Variable: Variable: Any characteristic of a person, object or event
that can change (vary).
IVIV DVDV ConstantConstant Discrete NumbersDiscrete Numbers Continues NumbersContinues Numbers
Confounding VariableConfounding Variable Intervening VariablesIntervening Variables
1515
1616

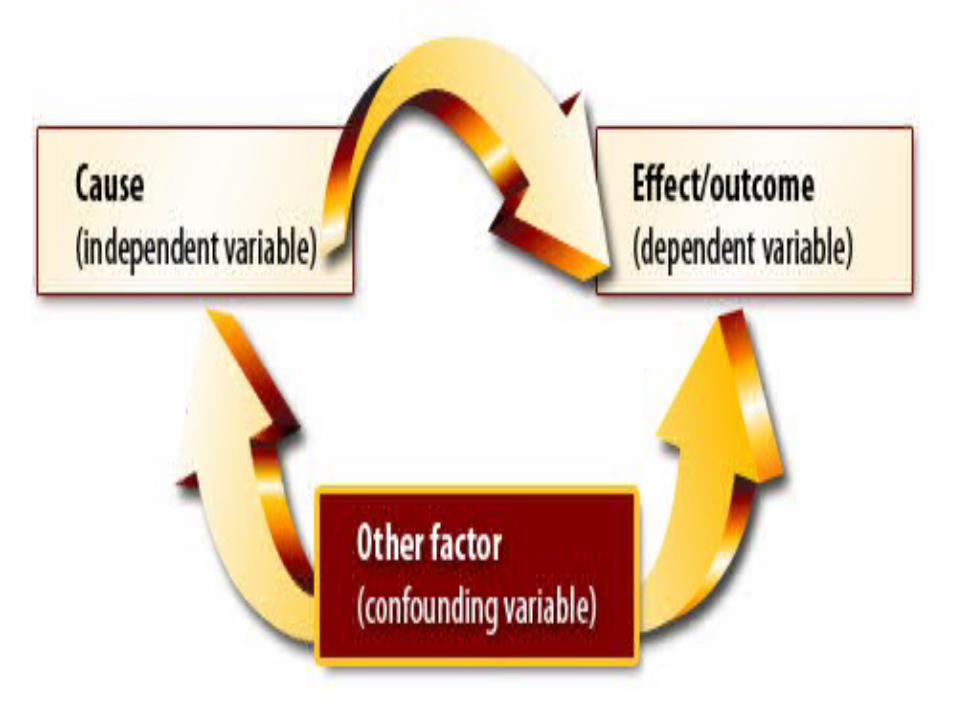
Confounding VariablesConfounding Variables Confounding variables are Confounding variables are
variables that the variables that the researcherresearcher failed failed to controlto control, or eliminate, damaging , or eliminate, damaging the internal validity of an the internal validity of an experiment. also known as a experiment. also known as a third third variable variable or a mediator variable, can or a mediator variable, can adversely affect the relation adversely affect the relation between the independent variable between the independent variable and dependent variable. and dependent variable.
Ex. NextEx. Next1717
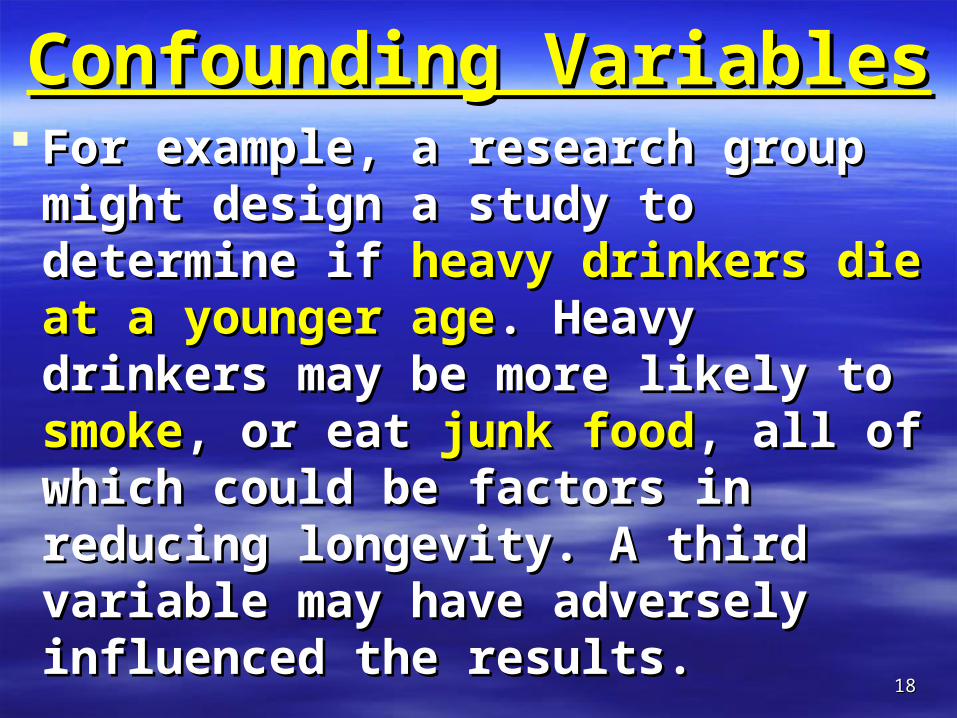
Confounding VariablesConfounding Variables For example, a research group For example, a research group
might design a study to determine might design a study to determine if if heavy drinkers die at a younger heavy drinkers die at a younger ageage. Heavy drinkers may be more . Heavy drinkers may be more likely to likely to smokesmoke, or eat , or eat junk foodjunk food, all , all of which could be factors in of which could be factors in reducing longevity. A third variable reducing longevity. A third variable may have adversely influenced the may have adversely influenced the results.results.
1818

Intervening VariablesIntervening Variables
A variable that A variable that explains a relation explains a relation or or provides a provides a causal link causal link between other between other variables.variables.
Also called Also called “Mediating Variable” “Mediating Variable” or or “intermediary variable.”“intermediary variable.”
Ex. Next slideEx. Next slide
1919
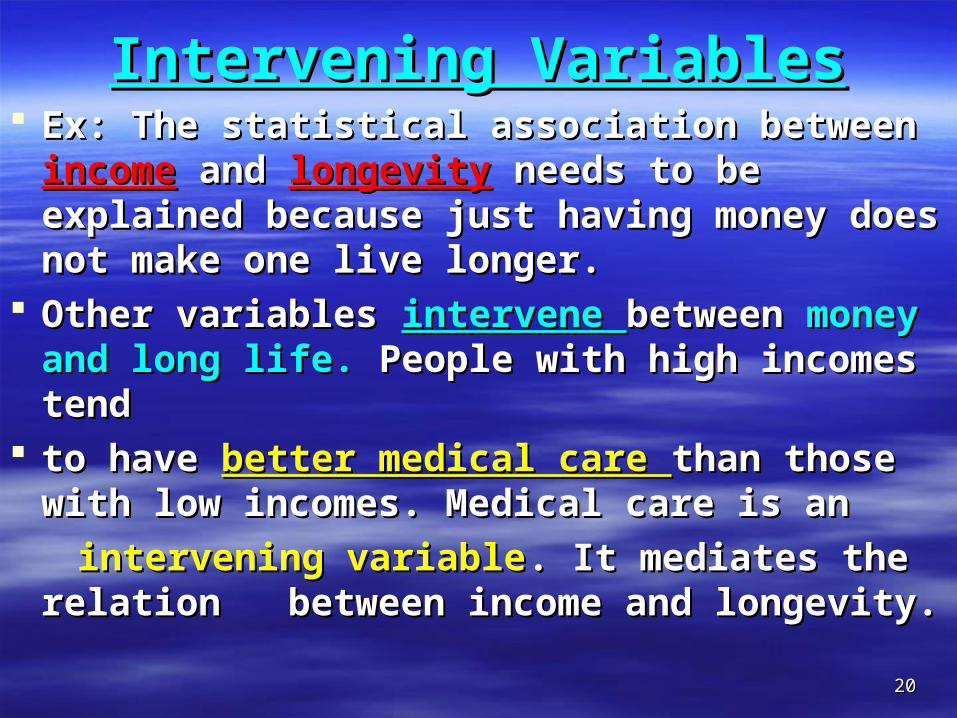
Intervening VariablesIntervening Variables Ex: The statistical association between Ex: The statistical association between
incomeincome and and longevitylongevity needs to be explained needs to be explained because just having money does not make because just having money does not make one live longer. one live longer.
Other variables Other variables intervene intervene between between money money and long life. and long life. People with high incomes tendPeople with high incomes tend
to have to have better medical care better medical care than those with than those with low incomes. Medical care is anlow incomes. Medical care is an
intervening variableintervening variable. It mediates the relation . It mediates the relation between income and longevity. between income and longevity.
2020

CONTINUOUS VERSUS CONTINUOUS VERSUS DISCRETE VARIABLESDISCRETE VARIABLES
Discrete variables (categorical)Discrete variables (categorical)– Values are defined by category boundariesValues are defined by category boundaries– E.g., genderE.g., gender
Continuous variablesContinuous variables– Values can range along a continuumValues can range along a continuum– E.g., heightE.g., height
2121
Role of Role of StatisticsStatistics in in ResearchResearch
DescriptiveDescriptiveVSVSInferentialInferential
2222
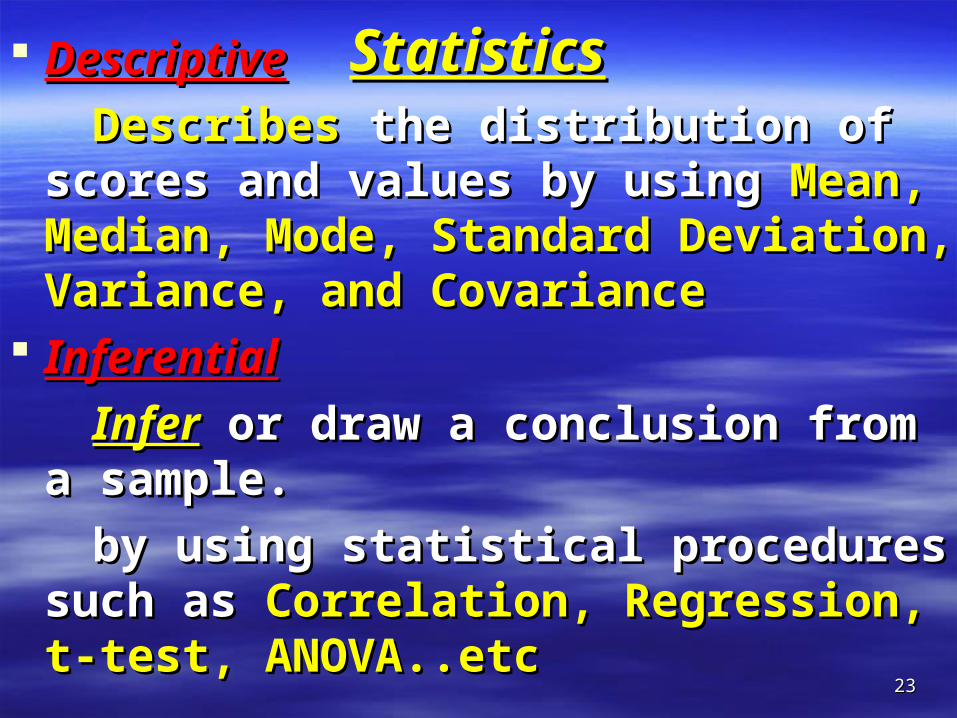
StatisticsStatistics DescriptiveDescriptive
DescribesDescribes the distribution of scores the distribution of scores and values by using and values by using Mean, Median, Mean, Median, Mode, Standard Deviation, Variance, Mode, Standard Deviation, Variance, and Covarianceand Covariance
InferentialInferential
InferInfer or draw a conclusion from a or draw a conclusion from a sample.sample.
by using statistical procedures such as by using statistical procedures such as Correlation, Regression, t-test, Correlation, Regression, t-test, ANOVA..etcANOVA..etc 2323
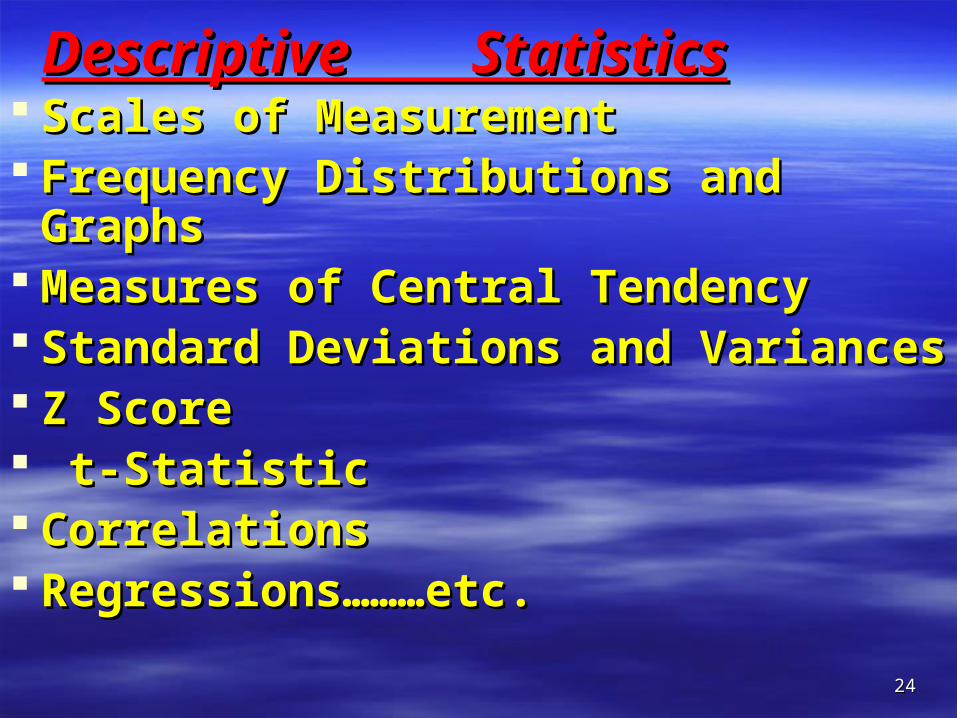
Descriptive StatisticsDescriptive Statistics Scales of Measurement Scales of Measurement Frequency Distributions and GraphsFrequency Distributions and Graphs Measures of Central TendencyMeasures of Central Tendency Standard Deviations and Variances Standard Deviations and Variances Z ScoreZ Score t-Statistict-Statistic CorrelationsCorrelations Regressions………etc.Regressions………etc.
2424

Descriptive StatisticsDescriptive Statistics Scales of Measurement ( Scales of Measurement (NOIRNOIR))
Nominal ScaleNominal Scale
Qualities Example What You Can Say
What You Can’t Say
Assignment Assignment of of labelslabels
Gender—Gender— ((male ormale or femalefemale))Preference—Preference— (like or (like or dislike)dislike)Voting recordVoting record—— (for or(for or againstagainst)
Each Each observatioobservation n belongs belongs in its own in its own categorycategory
An An observation observation represents represents “more” or “more” or “less” “less” than than another another observationobservation
2525
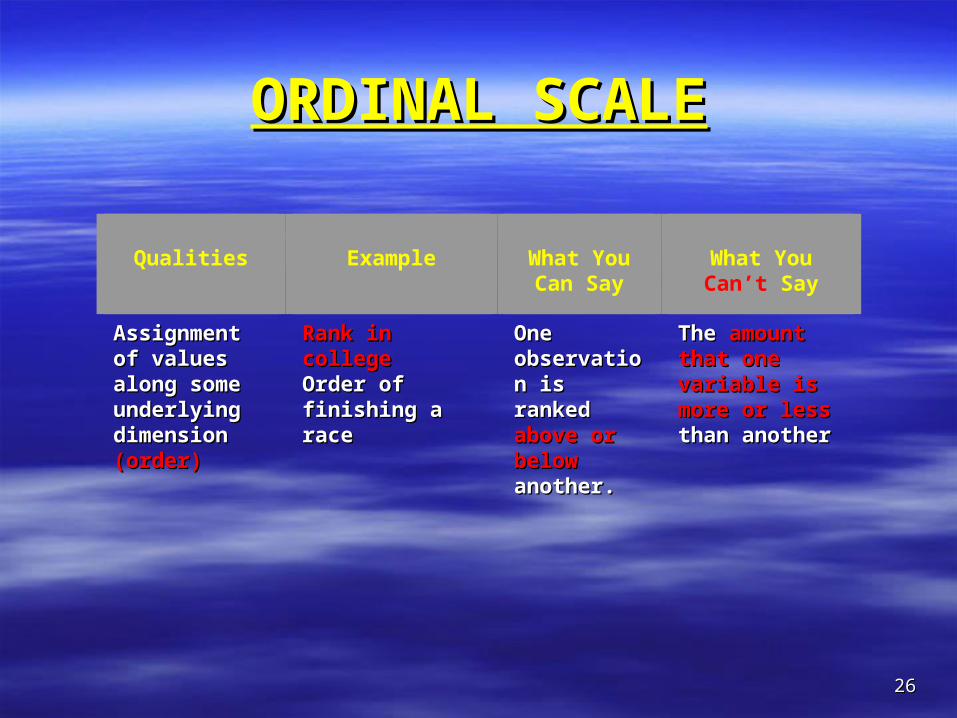
ORDINAL SCALEORDINAL SCALE
Qualities Example What You Can Say
What You Can’t Say
Assignment Assignment of values of values along some along some underlying underlying dimension dimension (order)(order)
Rank in Rank in collegecollegeOrder of Order of finishing a finishing a racerace
One One observatioobservation is n is ranked ranked above or above or below below another.another.
The The amount amount that one that one variable is variable is more or less more or less than anotherthan another
2626

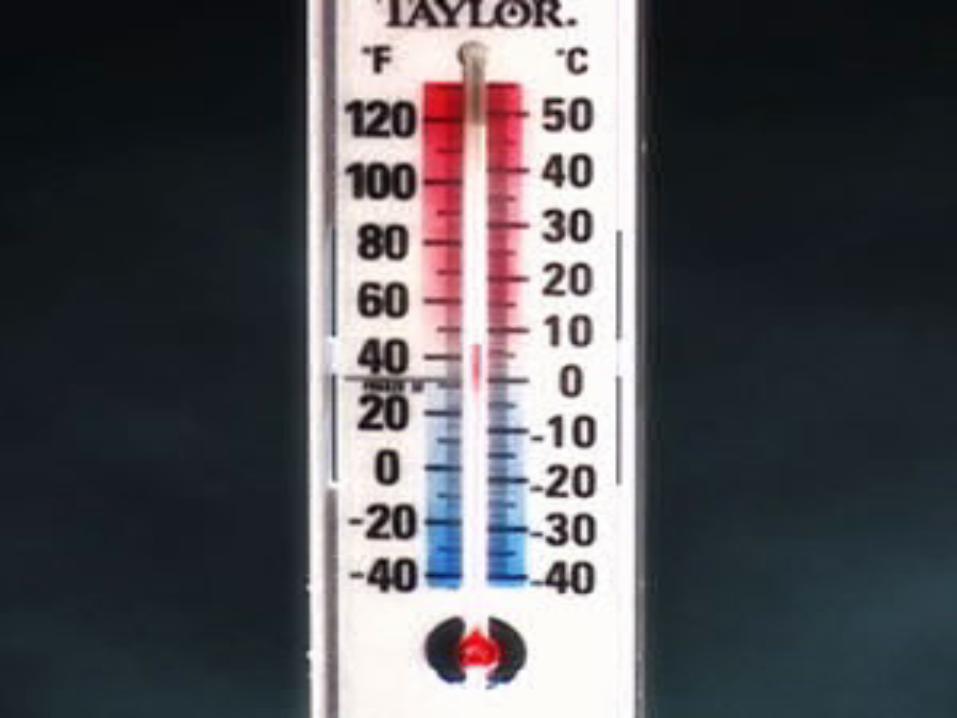
INTERVAL SCALEINTERVAL SCALE
Qualities Example What You Can Say
What You Can’t Say
Equal distances between points
ArbitraryArtificial zero
Number of Number of words spelled words spelled correctly oncorrectly onIntelligence Intelligence test scorestest scoresTemperatureTemperature
One score One score differs differs from from another another on some on some measure measure that has that has equally equally appearing appearing intervalsintervals
The amount The amount of difference of difference is an exact is an exact representatiorepresentation of n of differences of differences of the variable the variable being studiedbeing studied
2727
2828
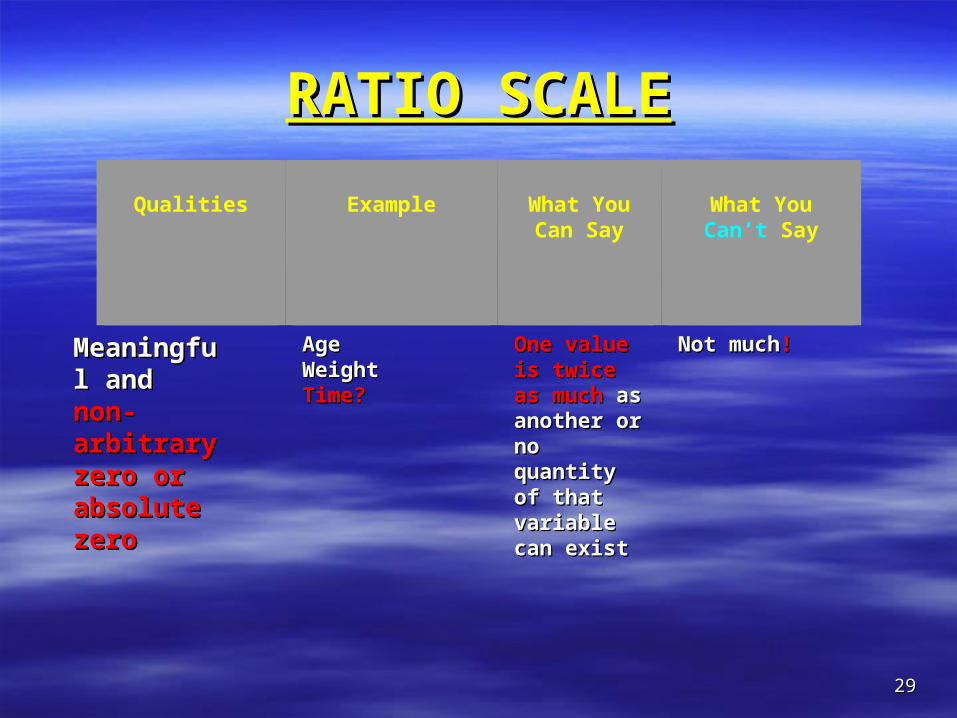
RATIO SCALERATIO SCALE
Qualities Example What You Can Say
What You Can’t Say
MeaningfMeaningful and ul and non-non-arbitrary arbitrary zero or zero or absolute absolute zerozero
AgeAgeWeightWeightTime?Time?
One value One value is twice as is twice as much much as as another or another or no no quantity quantity of that of that variable variable can existcan exist
Not muchNot much!!
2929

LEVELS OF MEASUREMENTLEVELS OF MEASUREMENT
Variables are measured at one of these four levelsVariables are measured at one of these four levels Qualities of one level are characteristic of the next level upQualities of one level are characteristic of the next level up The more precise (higher) the level of measurement, the The more precise (higher) the level of measurement, the
more accurate is the measurement processmore accurate is the measurement process
Level of Level of MeasurementMeasurement
For ExampleFor Example Quality of LevelQuality of Level
RatioRatio Rachael is 5Rachael is 5’’ 10 10”” and Gregory and Gregory is 5is 5’’ 5 5””
Absolute zeroAbsolute zero
IntervalInterval Rachael is Rachael is 55”” taller taller than than GregoryGregory
An inch is an inch is an An inch is an inch is an inchinch
OrdinalOrdinal Rachael is Rachael is tallertaller than Gregory than Gregory Greater thanGreater than
NominalNominal Rachael is Rachael is taltall and Gregory is l and Gregory is shortshort
Different fromDifferent from
3030
CHAPTER 2CHAPTER 2
Frequency Frequency DistributionsDistributions
3131

Graphs/ChartsGraphs/Charts
http://www.sao.state.tx.us/resources/Manuals/Method/data/11GRPHD.pdf
3232
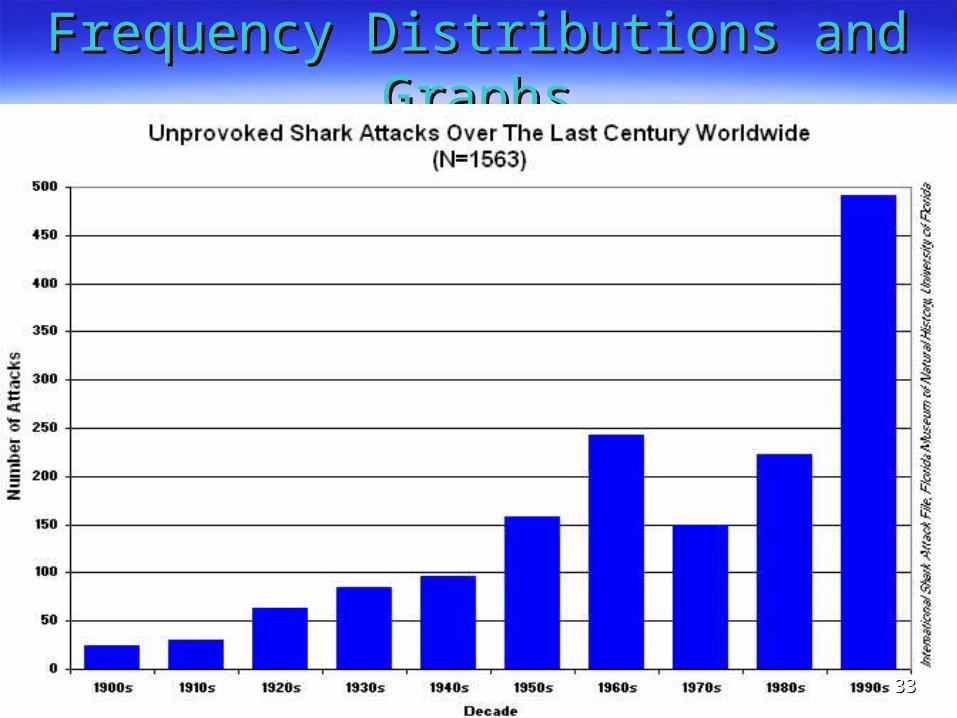
Frequency Distributions and GraphsFrequency Distributions and Graphs
3333
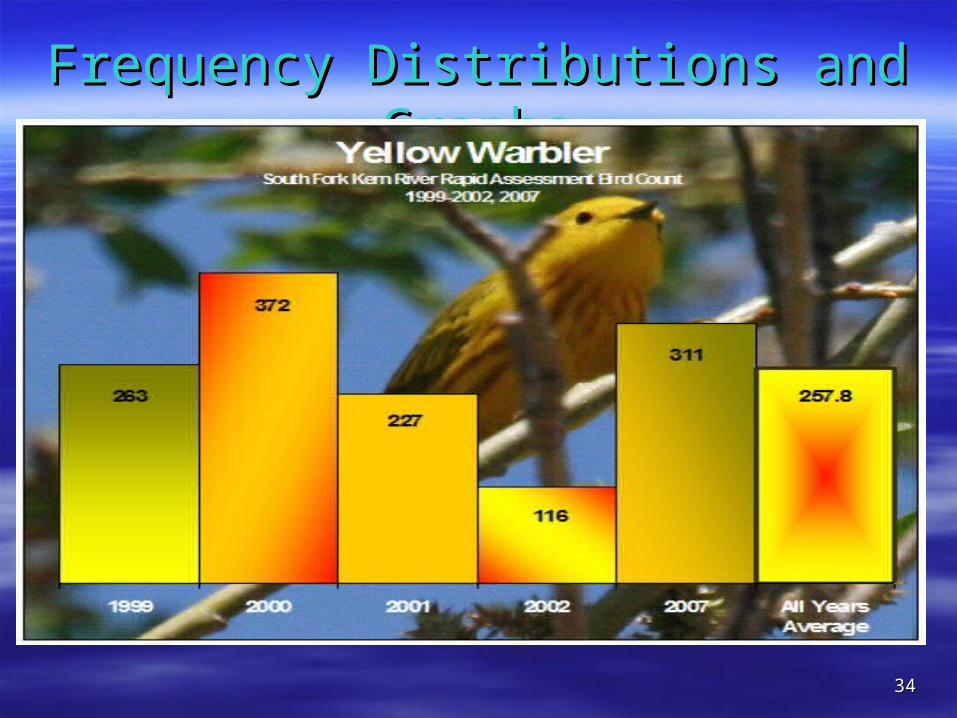
Frequency Distributions and GraphsFrequency Distributions and Graphs
3434

PolygonPolygon
3535

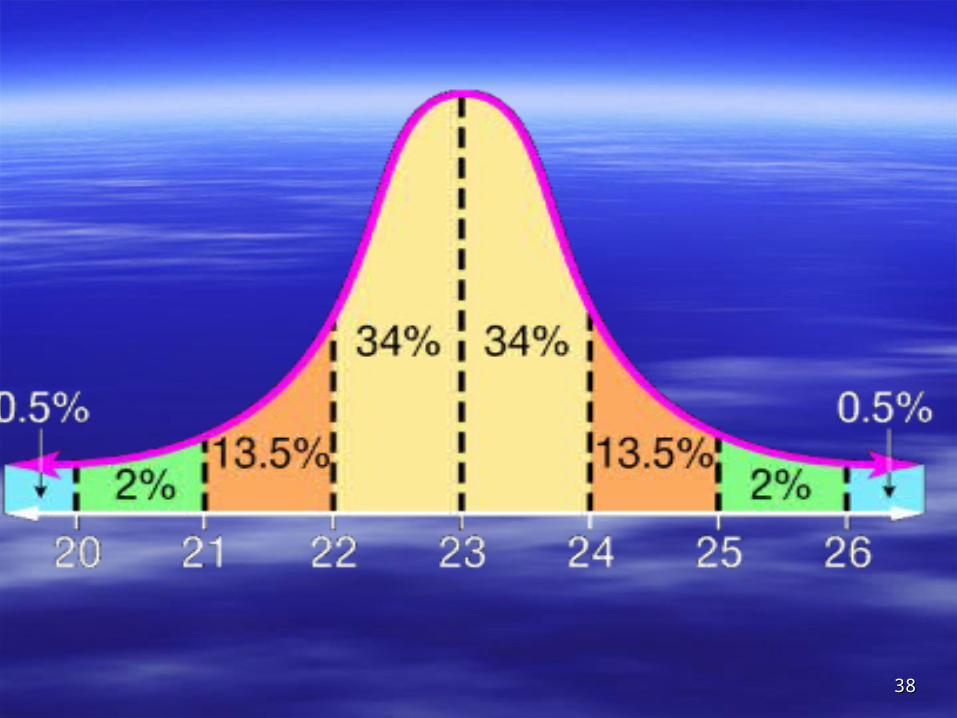
Frequency Distributions and GraphsFrequency Distributions and Graphs
3636

3737
3838

3939
4040
4141
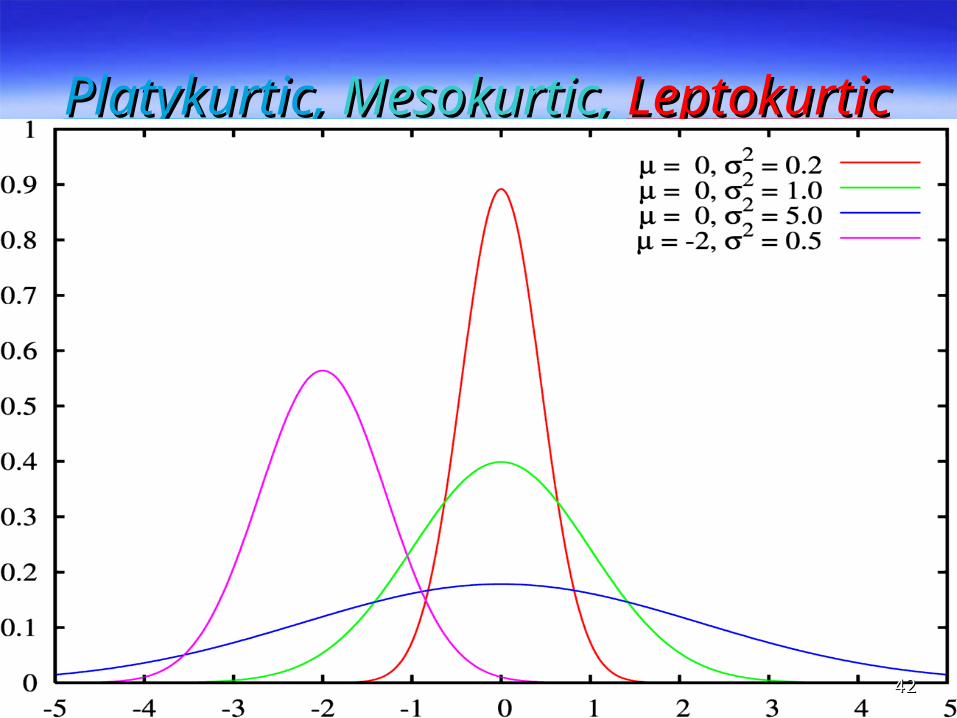
Platykurtic,Platykurtic, Mesokurtic, Mesokurtic, LeptokurticLeptokurtic
4242

Frequency DistributionsFrequency Distributions
Frequency Distributions (ƒ)Frequency Distributions (ƒ)
FD is the number of FD is the number of frequencies,frequencies,
Or when a score repeat itself in Or when a score repeat itself in a group of scoresa group of scores. .
4343
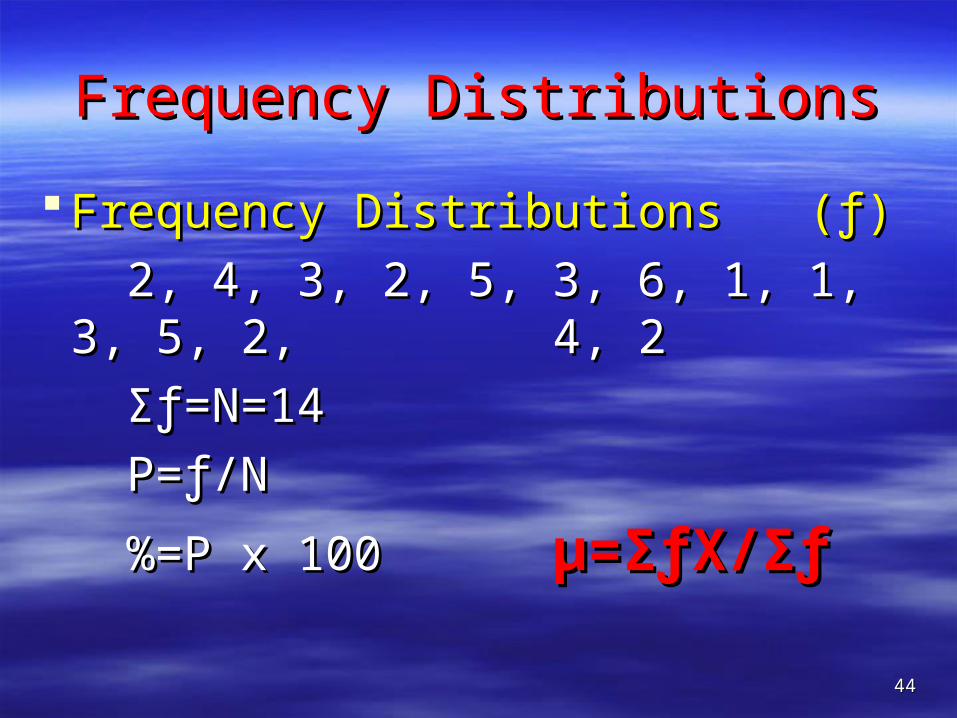
Frequency DistributionsFrequency Distributions
Frequency Distributions (ƒ)Frequency Distributions (ƒ)
2, 4, 3, 2, 5, 3, 6, 1, 1, 3, 5, 2, 2, 4, 3, 2, 5, 3, 6, 1, 1, 3, 5, 2, 4, 2 4, 2
Σƒ=N=14Σƒ=N=14
Ρ=ƒ/NΡ=ƒ/N
%=P x 100 %=P x 100 μ=ΣƒX/Σƒ μ=ΣƒX/Σƒ 4444
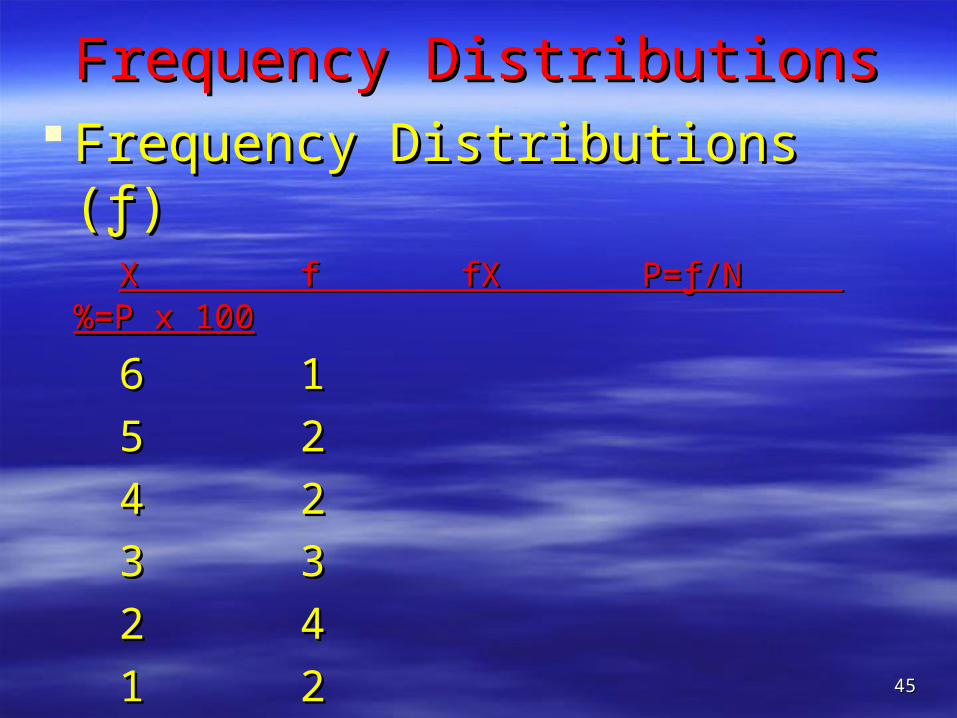
Frequency DistributionsFrequency Distributions Frequency Distributions (ƒ)Frequency Distributions (ƒ) X f fX X f fX Ρ=Ρ=ƒ/N %=P x 100ƒ/N %=P x 100
6 16 1
5 25 2
4 24 2
3 33 3
2 42 4
1 21 24545
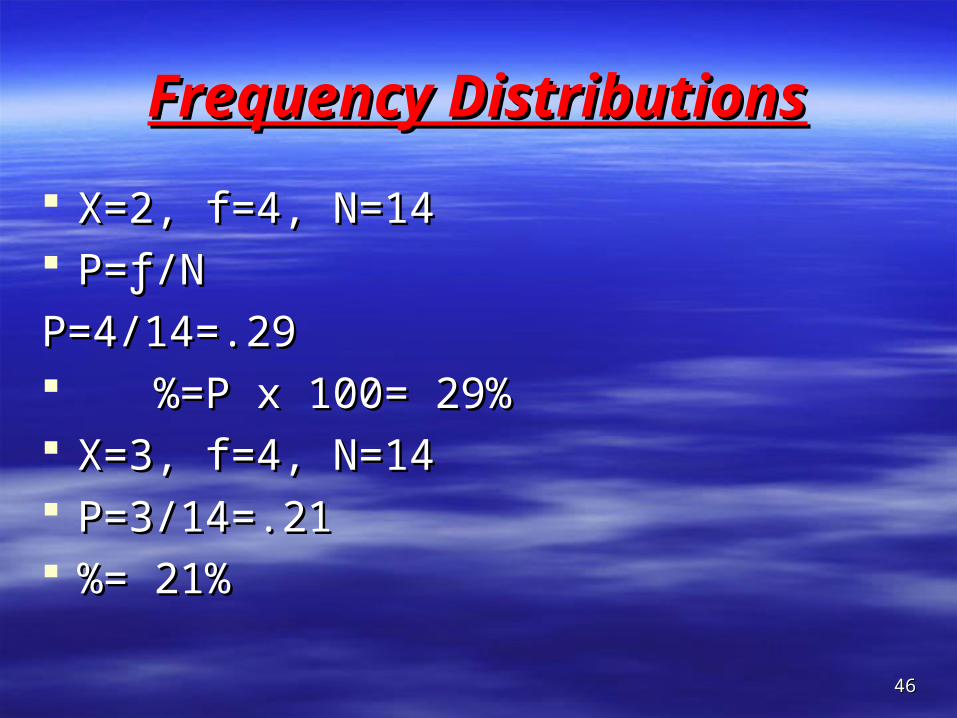
Frequency DistributionsFrequency Distributions
X=2, f=4, N=14X=2, f=4, N=14 Ρ=Ρ=ƒ/Nƒ/N
P=4/14=.29P=4/14=.29 %=P x 100= 29%%=P x 100= 29% X=3, f=4, N=14X=3, f=4, N=14 P=3/14=.21P=3/14=.21 %= 21%%= 21%
4646
CHAPTER 3CHAPTER 3
Descriptive Descriptive StatisticsStatisticsMeasures of Central Measures of Central TendencyTendency
4848
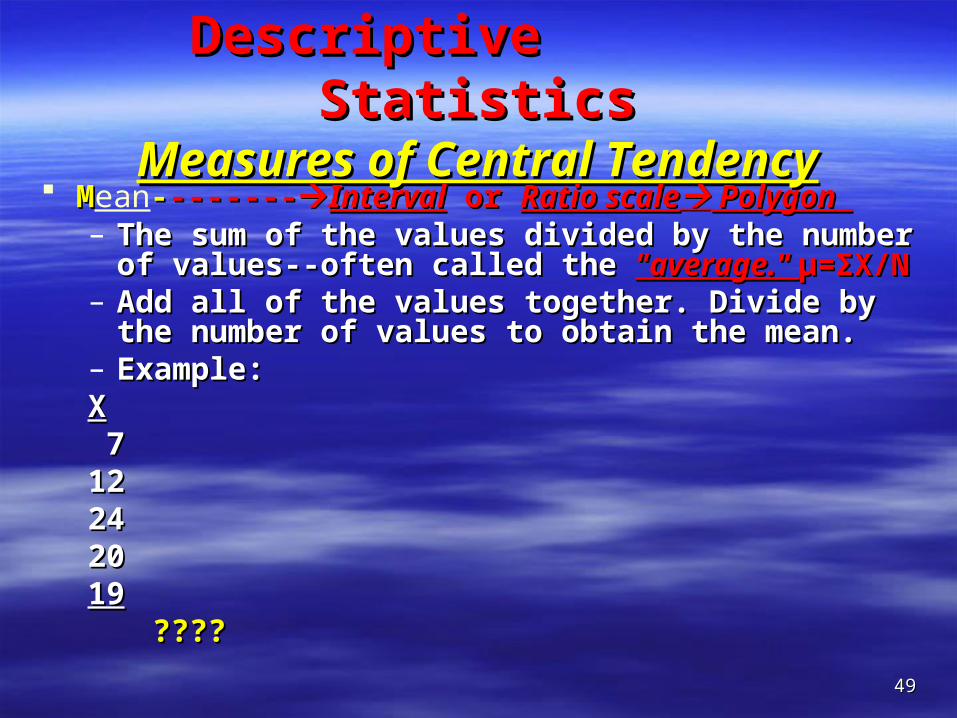
Descriptive StatisticsDescriptive StatisticsMeasures of Central TendencyMeasures of Central Tendency
MMean----------------IntervalInterval or or Ratio scaleRatio scale Polygon Polygon – The sum of the values divided by the number of The sum of the values divided by the number of
values--often called the values--often called the "average." "average." μ=ΣX/Nμ=ΣX/N– Add all of the values together. Divide by the number Add all of the values together. Divide by the number
of values to obtain the mean. of values to obtain the mean. – Example: Example: XX 771212242420201919
????????4949
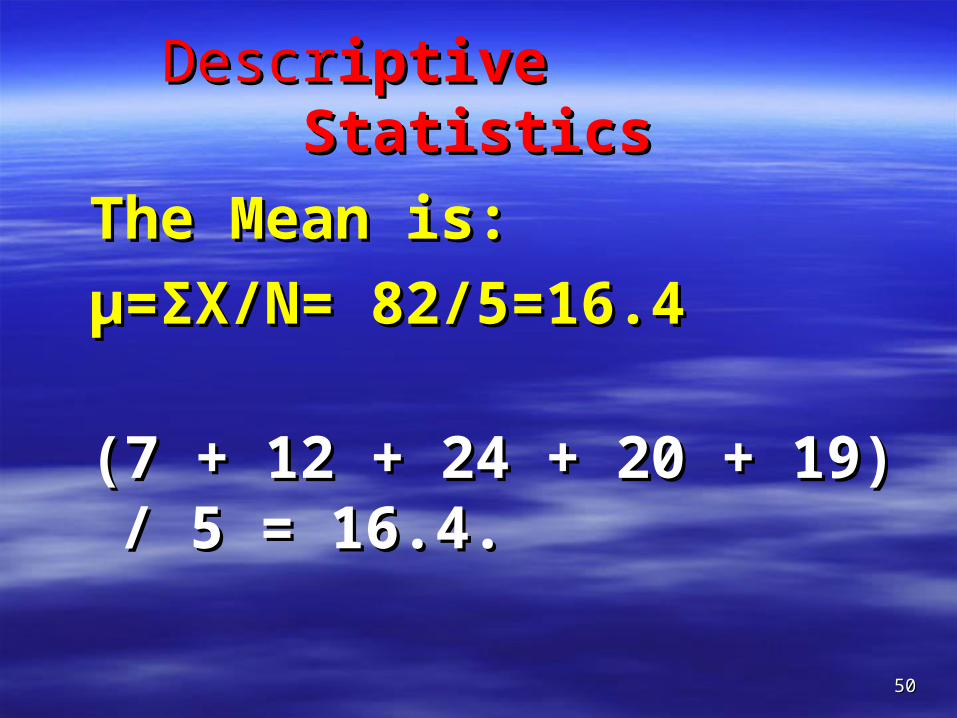
DescrDescriptive Statisticsiptive Statistics
The Mean is:The Mean is:
μ=ΣX/N= 82/5=16.4μ=ΣX/N= 82/5=16.4
(7 + 12 + 24 + 20 + 19) / 5 = (7 + 12 + 24 + 20 + 19) / 5 = 16.4.16.4.
5050

The Characteristics of MeanThe Characteristics of Mean 1. 1. Changing a score Changing a score in a distribution in a distribution will will
change the meanchange the mean 2. 2. Introducing or removing a score Introducing or removing a score from from
the distribution the distribution willwill change the mean change the mean 3. 3. Adding or subtracting Adding or subtracting a constant from a constant from
each score each score willwill change the mean change the mean 4. 4. Multiplying or dividing Multiplying or dividing each score by a each score by a
constant constant willwill change the mean change the mean 5. Adding a score which is5. Adding a score which is same as the same as the
mean mean will not will not change the meanchange the mean5151
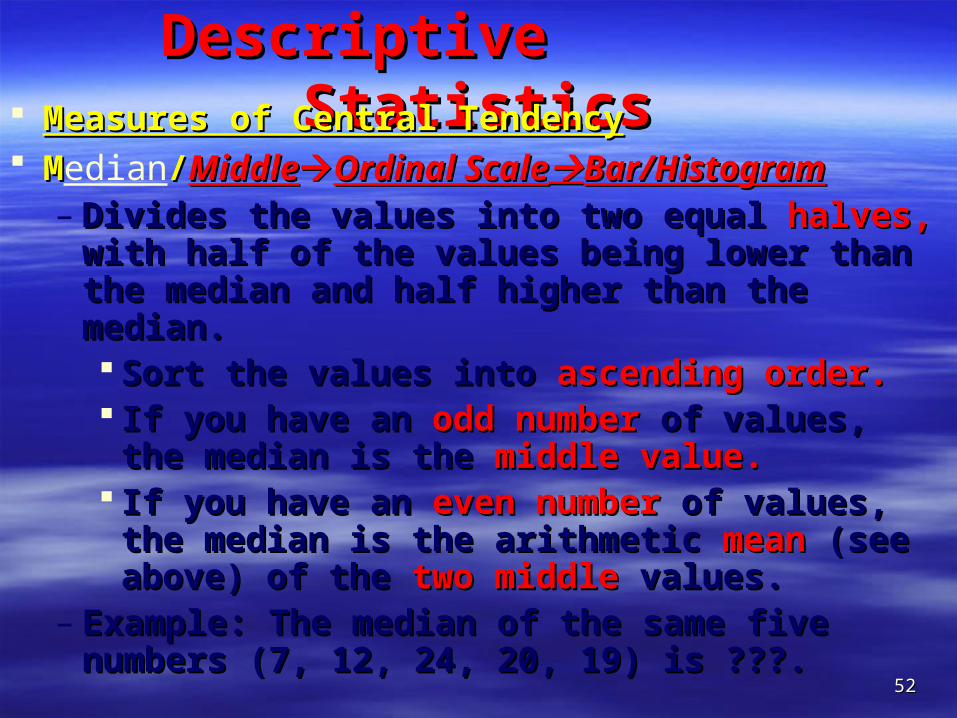
Descriptive StatisticsDescriptive Statistics Measures of Central TendencyMeasures of Central Tendency MMedian//MiddleMiddleOrdinal ScaleOrdinal ScaleBar/HistogramBar/Histogram
– Divides the values into two equal Divides the values into two equal halves, halves, with with half of the values being lower than the median half of the values being lower than the median and half higher than the median. and half higher than the median. Sort the values into Sort the values into ascending order. ascending order. If you have an If you have an odd number odd number of values, the of values, the
median is the median is the middle value. middle value. If you have an If you have an even number even number of values, the of values, the
median is the arithmetic median is the arithmetic mean mean (see above) of (see above) of the the two middle two middle values. values.
– Example: The median of the same five numbers Example: The median of the same five numbers (7, 12, 24, 20, 19) is ???. (7, 12, 24, 20, 19) is ???.
5252
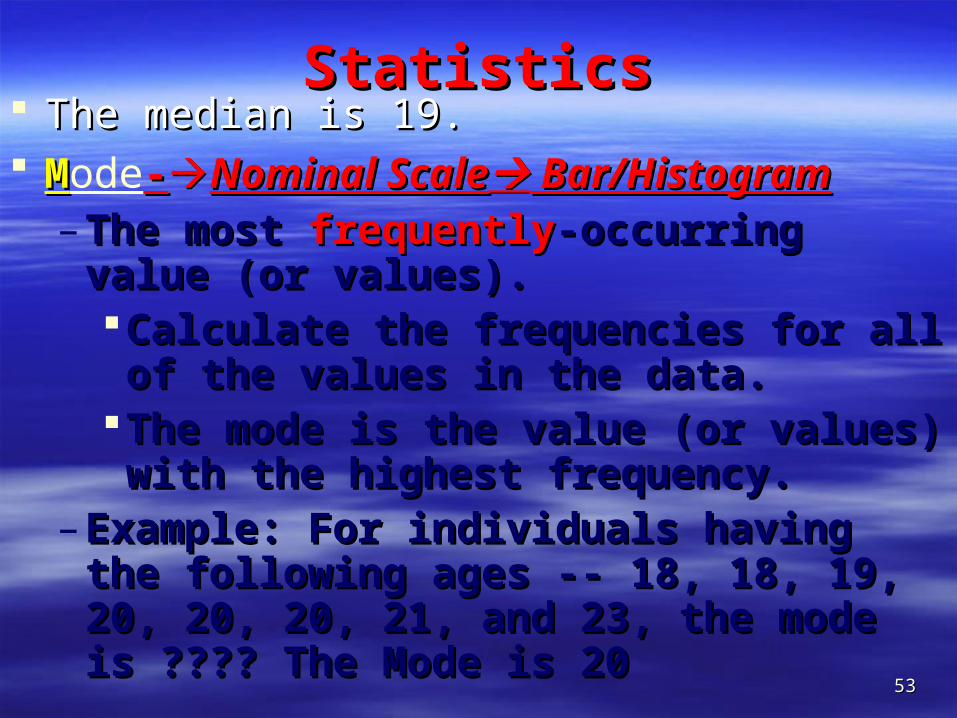
StatisticsStatistics The median is 19.The median is 19. MMode--Nominal ScaleNominal Scale Bar/Histogram Bar/Histogram
– The most The most frequentlyfrequently-occurring value (or -occurring value (or values). values). Calculate the frequencies for all of the Calculate the frequencies for all of the
values in the data. values in the data. The mode is the value (or values) with The mode is the value (or values) with
the highest frequency. the highest frequency. – Example: For individuals having the Example: For individuals having the
following ages -- 18, 18, 19, 20, 20, 20, 21, following ages -- 18, 18, 19, 20, 20, 20, 21, and 23, the mode is ???? The Mode is 20and 23, the mode is ???? The Mode is 20
5353

CHARACTERISTICS OF MODECHARACTERISTICS OF MODE
Nominal Scale Nominal Scale
Discrete VariableDiscrete Variable
Describing ShapeDescribing Shape
5454

CHAPTER 4CHAPTER 4
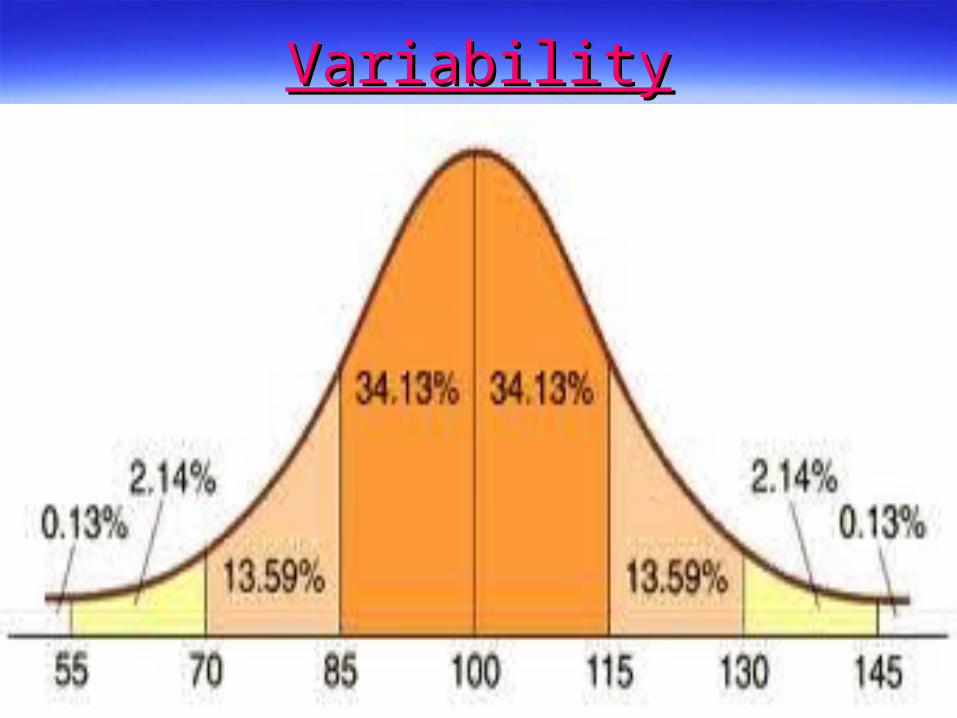
VariabilityVariability
5555

VariabilityVariabilityVariability is a measure of Variability is a measure of
dispersiondispersion or spreading of or spreading of scores around the mean, and scores around the mean, and has 2 purposes:has 2 purposes:
1. Describes the distribution1. Describes the distribution Next slideNext slide
5656
5757
VariabilityVariability 2. How well an individual score (or 2. How well an individual score (or
group of scores) represents the group of scores) represents the entire distribution.entire distribution.
Ex. In Ex. In inferential statistics inferential statistics we we collect information from a small collect information from a small samplesample then, we then, we generalizegeneralize the the results obtained from the sample to results obtained from the sample to the entire the entire population.population.
Next slideNext slide 5858

Range, Interquartile Range, Semi-Interquartile Range, Interquartile Range, Semi-Interquartile Range, Range, Standard Deviation, and Variance are the Standard Deviation, and Variance are the
Measures of VariabilityMeasures of Variability
The Range:The Range: The Range is the difference between the The Range is the difference between the
highest number –lowest number +1highest number –lowest number +1 2, 4, 7, 8, and 10 -> 2, 4, 7, 8, and 10 -> Discrete NumbersDiscrete Numbers 2, 4.6, 7.3, 8.4, and 10 -> 2, 4.6, 7.3, 8.4, and 10 -> Continues Continues
NumbersNumbers The difference between the The difference between the upper real upper real
limit limit of the of the highest number highest number and the and the lower lower real limit real limit of the of the lowest number.lowest number.
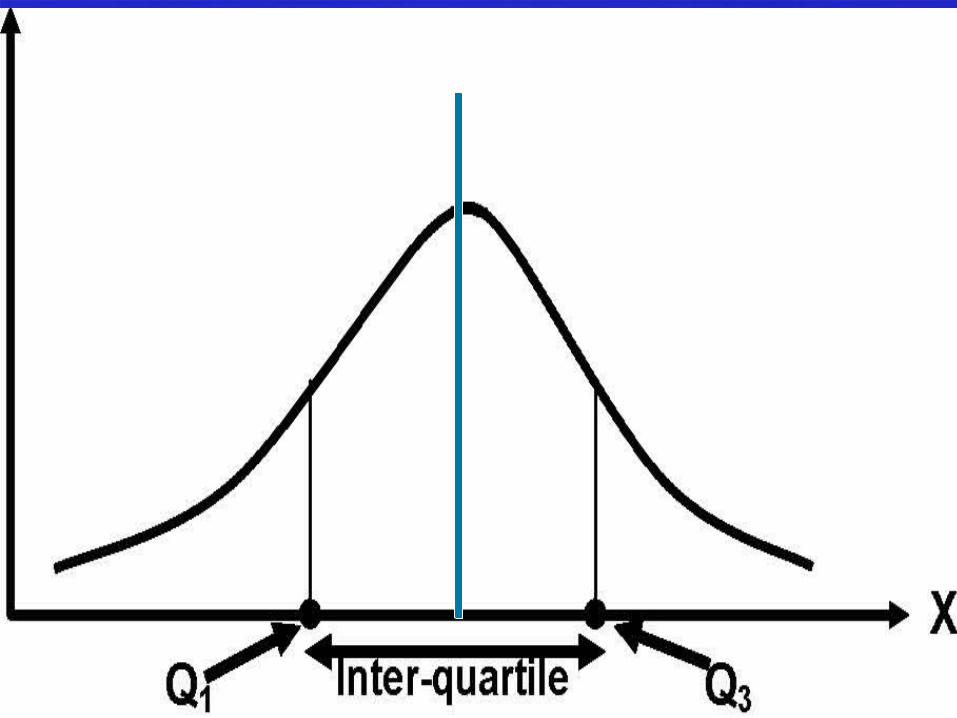
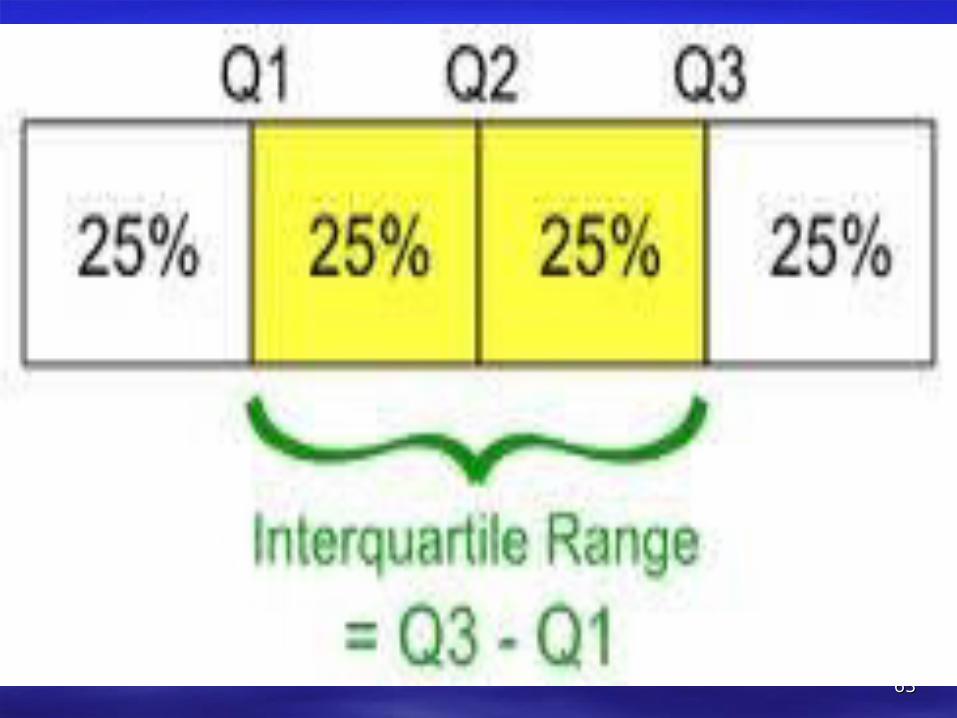
Interquartile Range Interquartile Range (IQR) (IQR) In In descriptive statistics, the , the
Interquartile Range Interquartile Range ((IQRIQR), ), also called the also called the midspreadmidspread or or middle fiftymiddle fifty, , is a measure of is a measure of statistical dispersion, being , being equal to the difference between equal to the difference between the upper and lower the upper and lower quartiles. . IQR = IQR = QQ33 − − QQ11 6060
6161
6262
6363

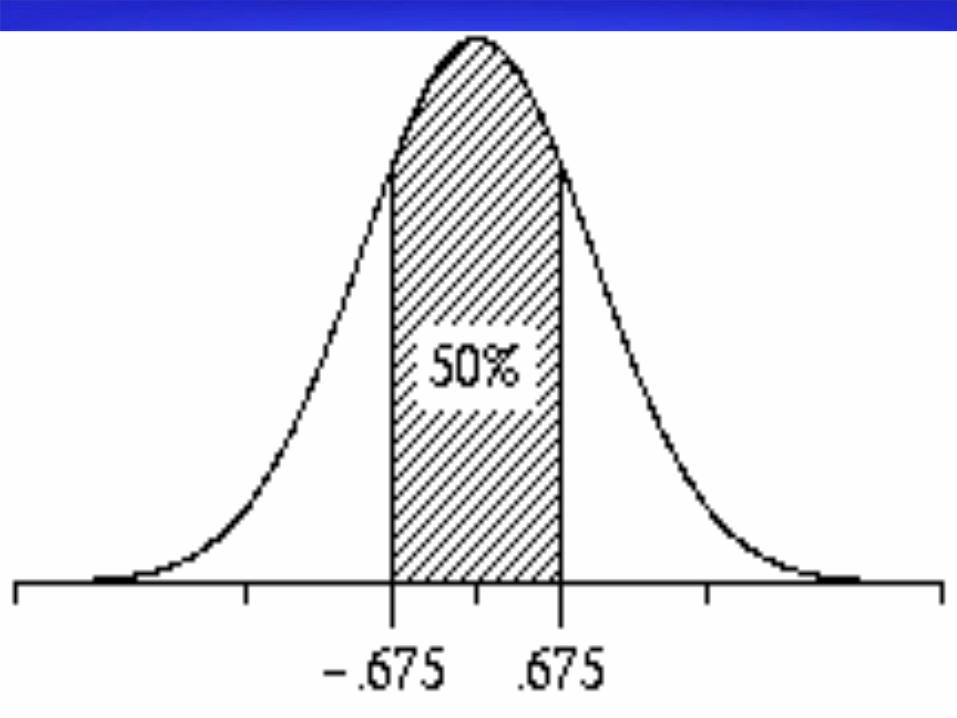
Interquartile Range (IQR)Interquartile Range (IQR) IQR IQR is the range covered by is the range covered by the the middle 50% middle 50% of the of the distribution.distribution.
IQR IQR is the distance between the 3rd Quartile and 1st Quartile.
6464
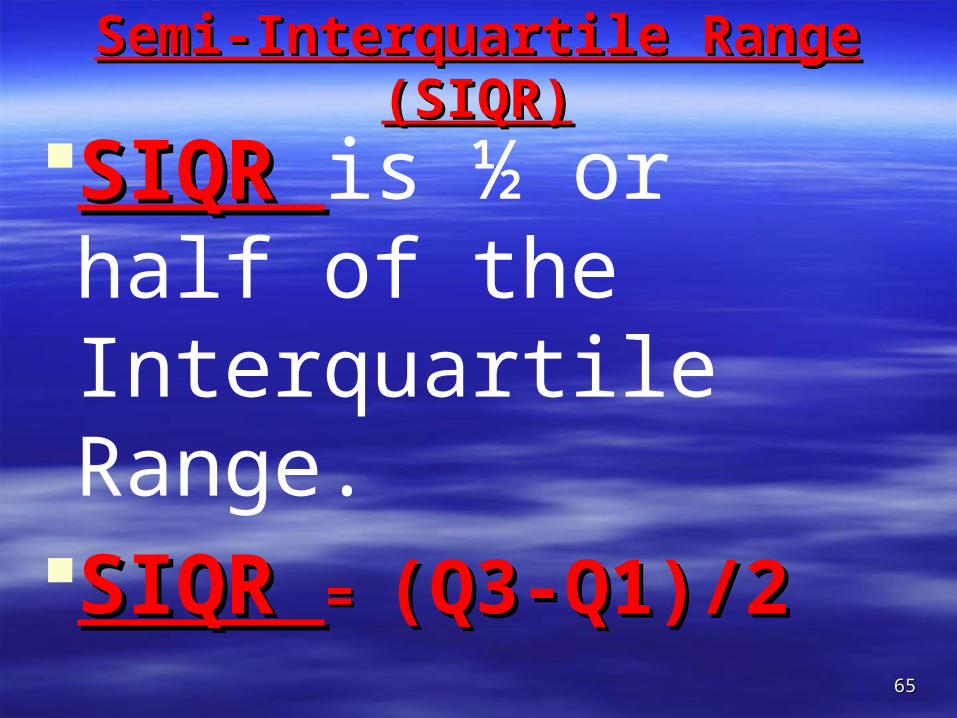
Semi-Interquartile Range (SIQR)Semi-Interquartile Range (SIQR)
SIQR SIQR is ½ or half of the Interquartile Range.
SIQR SIQR = = (Q3-Q1)/2(Q3-Q1)/2
6565
VariabilityVariability
6666
6767

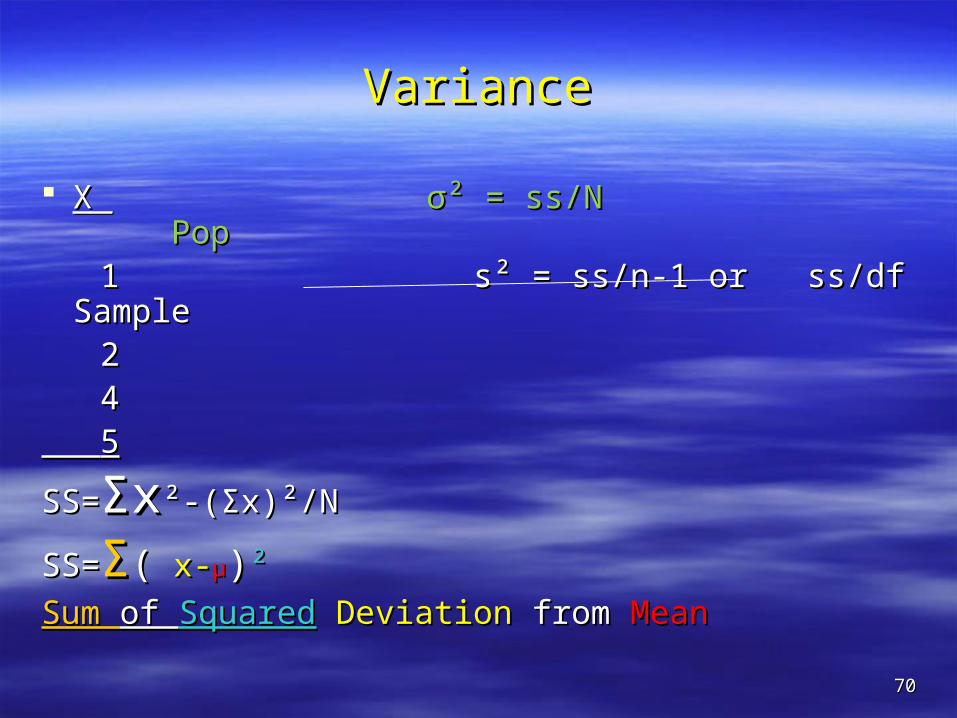
VariabilityVariabilitySS,SS, Standard Deviations and VariancesStandard Deviations and Variances
X X σ² = ss/N σ² = ss/N PopPop 1 1 σ = √σ = √ss/Nss/N 22 4 s = √ss/df 4 s = √ss/df 5 5 s² = ss/n-1 or ss/df s² = ss/n-1 or ss/df Sample Sample
SS=SS=ΣxΣx²-(Σx)²/N²-(Σx)²/N
SS=SS=ΣΣ(( x-x-μμ))²²
Sum Sum of of SquaredSquared DeviationDeviation from from MeanMean6868

6969
Practical Implication for Test Practical Implication for Test ConstructionConstruction
Variance and Covariance measure the quality of Variance and Covariance measure the quality of each each item in a test.item in a test.
Reliability and validity measure the quality of Reliability and validity measure the quality of the entire the entire test.test.
σ²=SS/N σ²=SS/N used for one set of data used for one set of data
VarianceVariance is the degree of variability is the degree of variability
of scores from meanof scores from mean..Correlation is based on a statistic called Covariance (Cov xy or S Correlation is based on a statistic called Covariance (Cov xy or S
xy) ….. r=sp/√ssx.ssyxy) ….. r=sp/√ssx.ssy
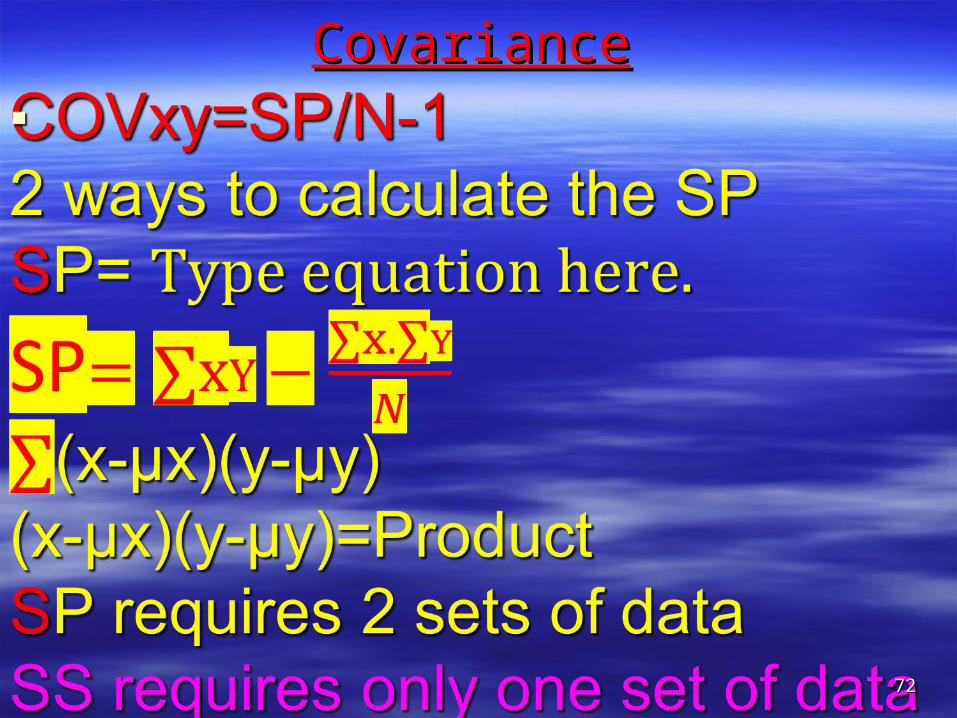
COVxy=SP/N-1COVxy=SP/N-1 used for 2 sets of data used for 2 sets of data
CovarianceCovariance is a number that reflects the degree to which is a number that reflects the degree to which 2 variables vary together. 2 variables vary together.
7070
VarianceVariance
X X σ² = ss/N Popσ² = ss/N Pop 1 s² = ss/n-1 or ss/df Sample1 s² = ss/n-1 or ss/df Sample 2 2 4 4 55
SS=SS=ΣxΣx²-(Σx)²/N²-(Σx)²/N
SS=SS=ΣΣ(( x-x-μμ))²²
Sum Sum of of SquaredSquared DeviationDeviation from from MeanMean
7171
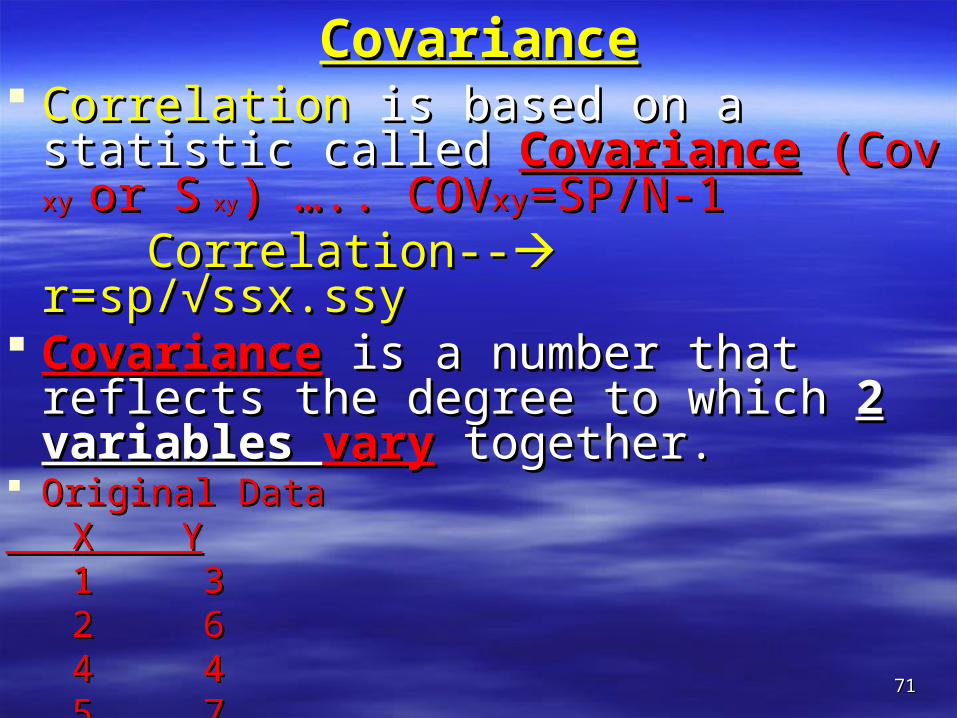
CovarianceCovariance CorrelationCorrelation is based on a statistic called is based on a statistic called
CovarianceCovariance (Cov (Cov xy xy or Sor S xy xy) ….. ) ….. COVCOVxyxy=SP/N-1=SP/N-1
Correlation--Correlation-- r=sp/√ssx.ssy r=sp/√ssx.ssy CovarianceCovariance is a number that reflects the is a number that reflects the
degree to which degree to which 2 variables 2 variables varyvary together. together.
Original DataOriginal Data X YX Y 1 31 3 2 62 6 4 44 4 5 75 7
7272
CovarianceCovariance
7373
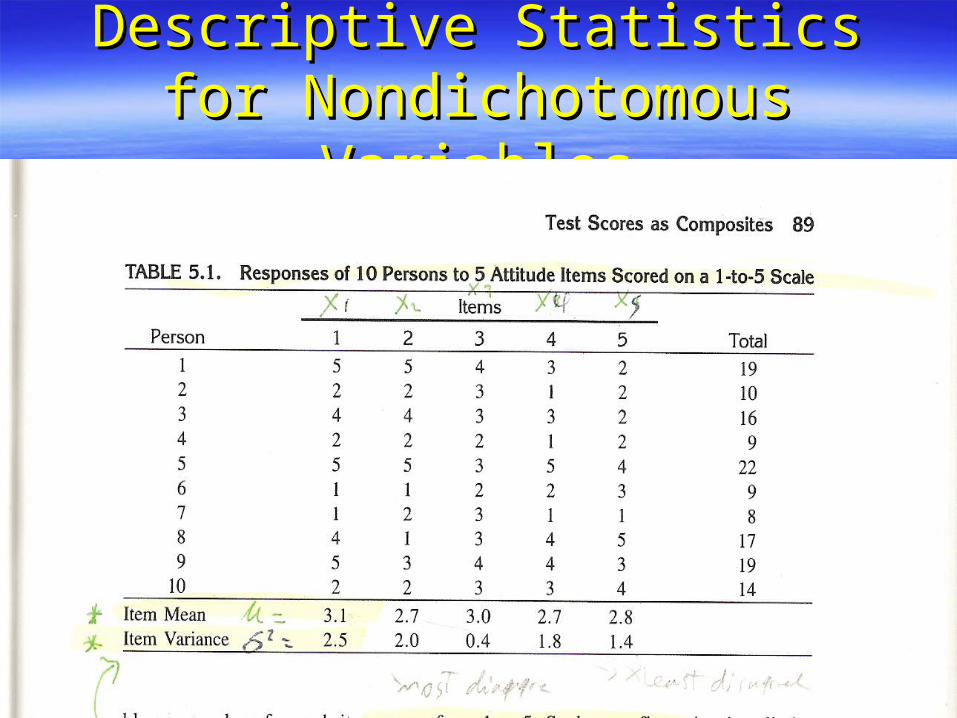
Descriptive Statistics for Descriptive Statistics for Nondichotomous VariablesNondichotomous Variables

7474
Descriptive Statistics for Descriptive Statistics for Dichotomous DataDichotomous Data

7575
Descriptive Statistics for Descriptive Statistics for Dichotomous DataDichotomous Data
Item Variance & Covariance Item Variance & Covariance

7777

CHAPTER 5CHAPTER 5
Z-ScoresZ-Scores
7878
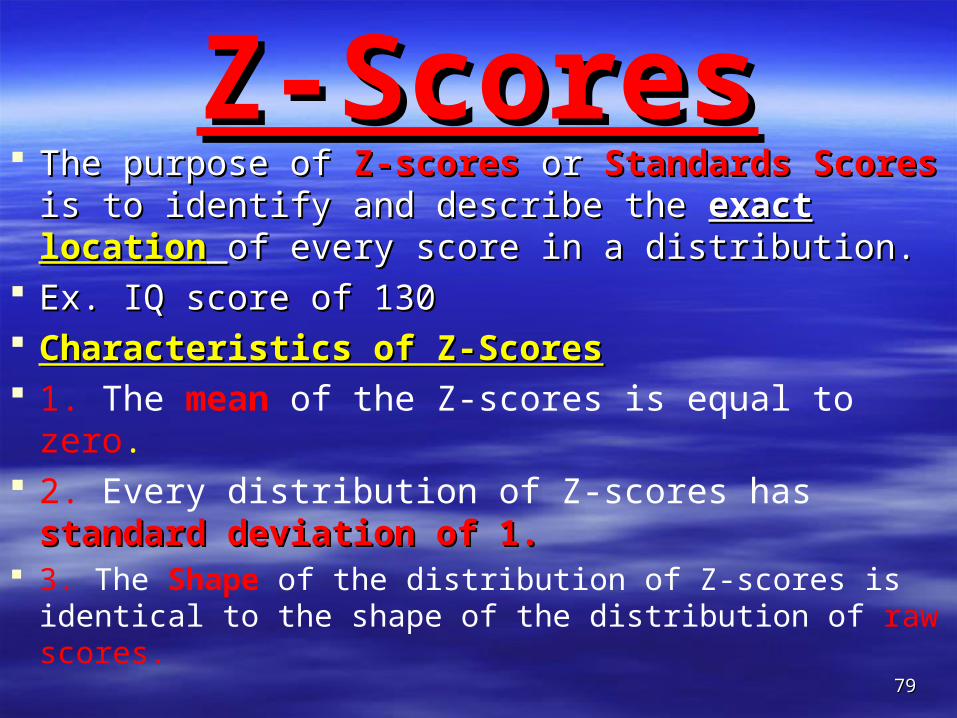
Z-ScoresZ-Scores The purpose of The purpose of Z-scoresZ-scores or or Standards Scores Standards Scores
is to identify and describe the is to identify and describe the exact exact locationlocation of of every score in a distribution. every score in a distribution.
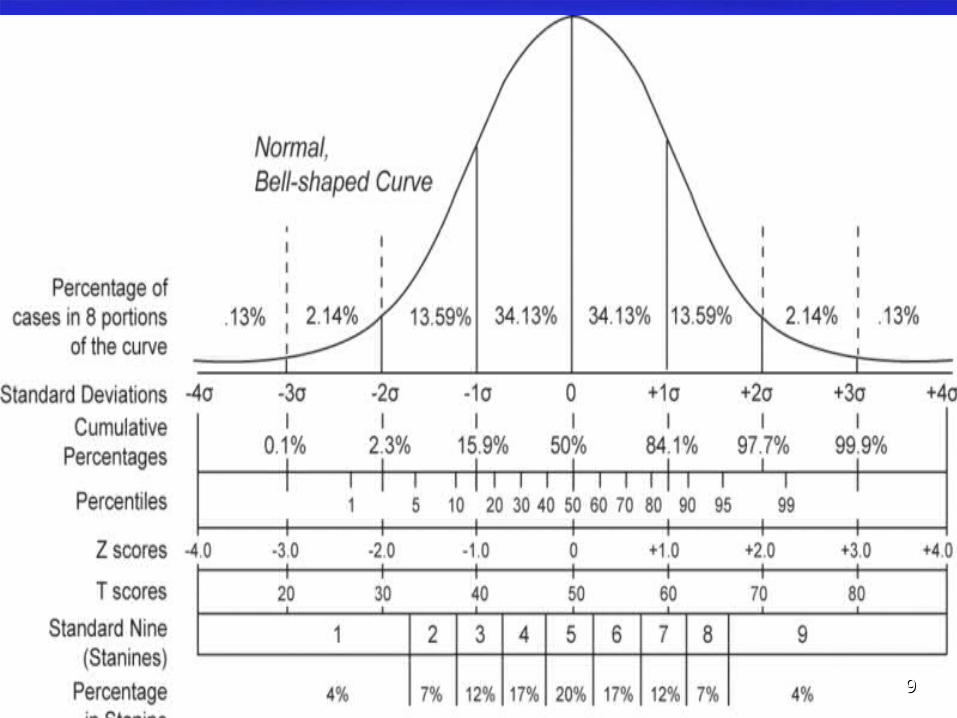
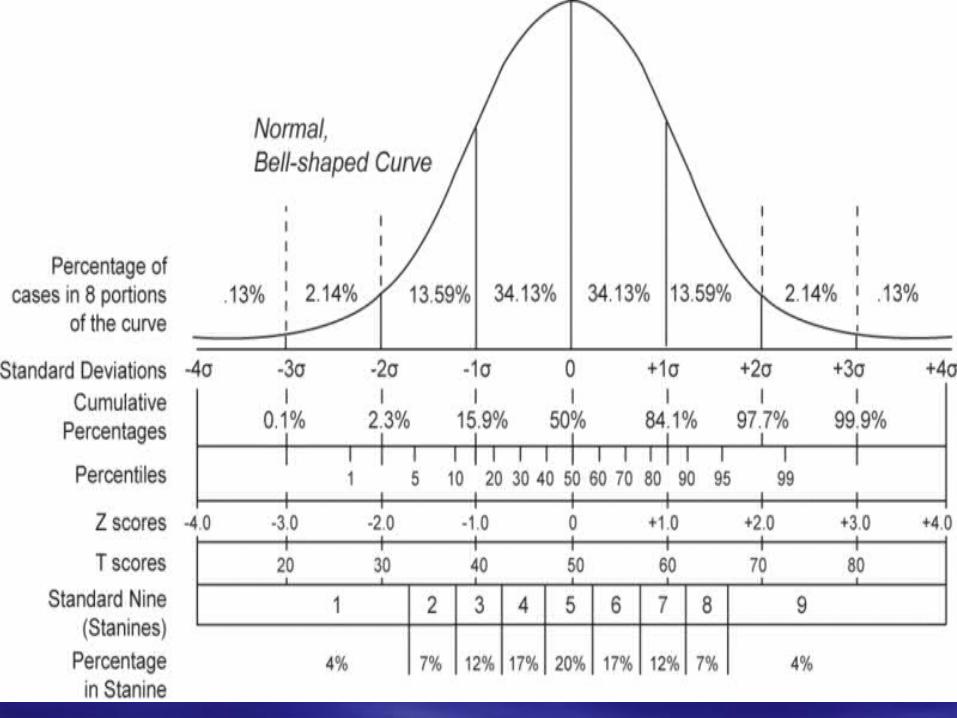
Ex. IQ score of 130Ex. IQ score of 130 Characteristics of Z-ScoresCharacteristics of Z-Scores 1. The mean of the Z-scores is equal to zero. 2. Every distribution of Z-scores has standard standard
deviation of 1.deviation of 1. 3. The Shape of the distribution of Z-scores is
identical to the shape of the distribution of raw scores. 7979
8080

8181

8282
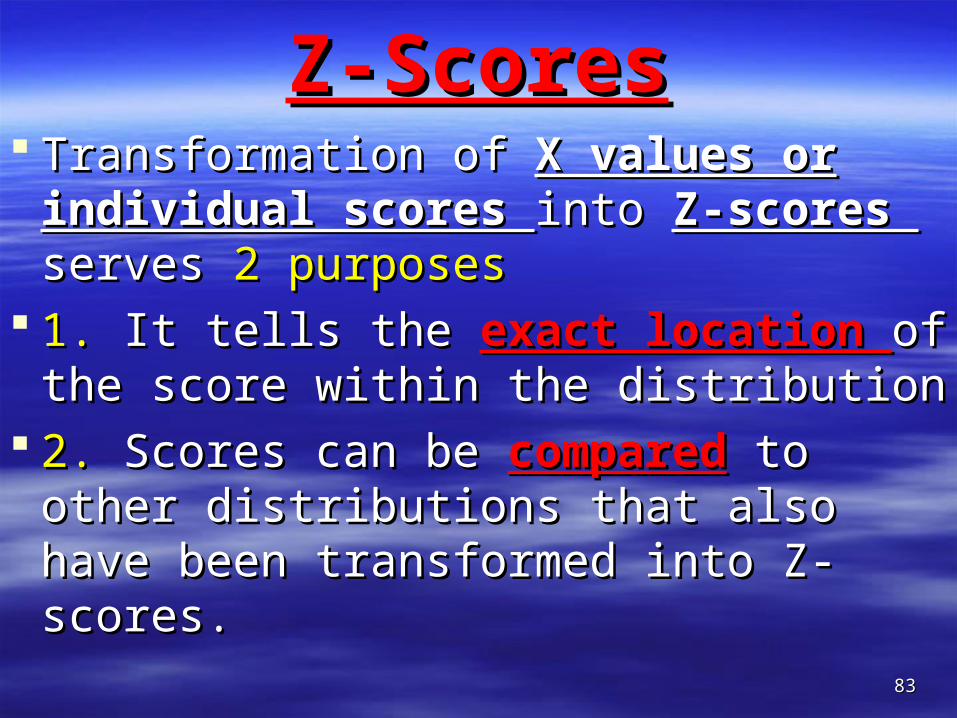
Z-ScoresZ-Scores Transformation of Transformation of X values or X values or
individual scores individual scores into into Z-scores Z-scores serves serves 2 purposes2 purposes
1. 1. It tells the It tells the exact location exact location of the of the score within the distributionscore within the distribution
2. 2. Scores can be Scores can be comparedcompared to other to other distributions that also have been distributions that also have been transformed into Z-scores. transformed into Z-scores.
8383

Z-ScoresZ-Scores
8585
X= X= σσ(Z)+(Z)+µµ µµ= X-= X- σσZZ
σσ= X-= X-µµ/Z/Z If X=60If X=60
µµ=50=50
σσ=5 Z=?=5 Z=?

CHAPTER 6CHAPTER 6
PProbabilityrobability
8686
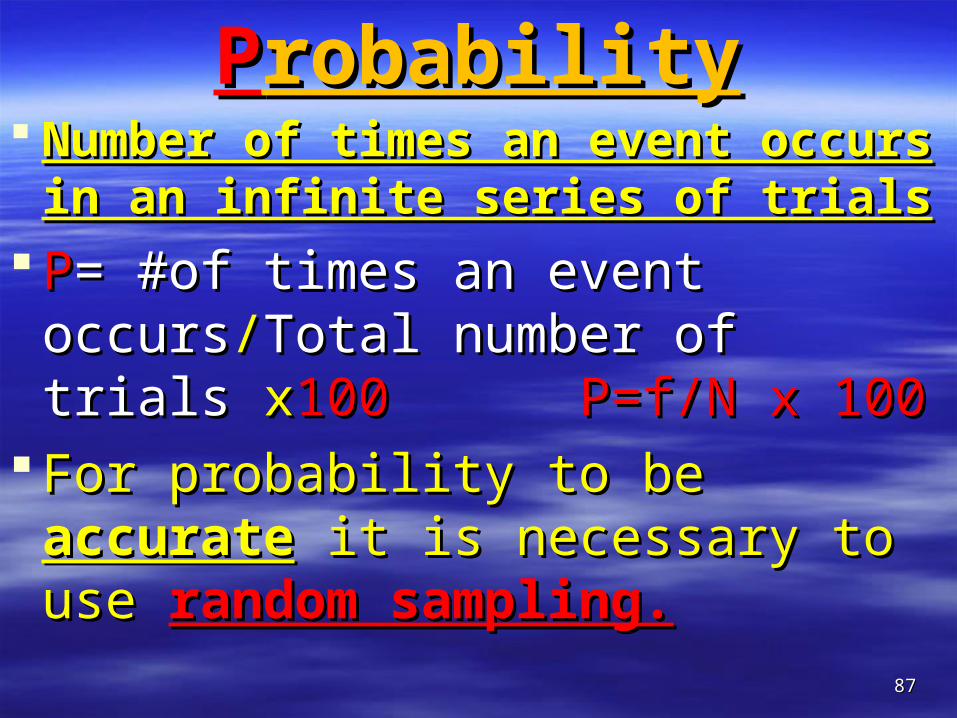
PProbabilityrobability Number of times an event occurs in Number of times an event occurs in
an infinite series of trialsan infinite series of trials
PP= #of times an event = #of times an event occursoccurs//Total number of trials Total number of trials xx100100 P=f/N x 100P=f/N x 100
For probability to be For probability to be accurateaccurate it is it is necessary to use necessary to use random random sampling.sampling.
8787

PProbabilityrobability Random SamplingRandom Sampling has has 2 requirements:2 requirements: 1. 1. Each individual in the population must Each individual in the population must
have an have an equal chance equal chance of being selected.of being selected. 2. 2. If more than one individual or a group If more than one individual or a group
of individuals is to be selected for the of individuals is to be selected for the sample there must be sample there must be ccoonnssttaannt t probability probability for each and every selection.for each and every selection.
8888

8989
9090

PProbabilityrobability Mega Ball= 1/176mMega Ball= 1/176m Lottery = 1/66mLottery = 1/66m Hit by Lightening = 1/10mHit by Lightening = 1/10m Victim of Crime in theVictim of Crime in the
US = 1/8000US = 1/8000
Chance of dying in a flight 1/16mChance of dying in a flight 1/16m
9191
CHAPTER 7CHAPTER 7
PProbability and robability and SamplesSamples
9292
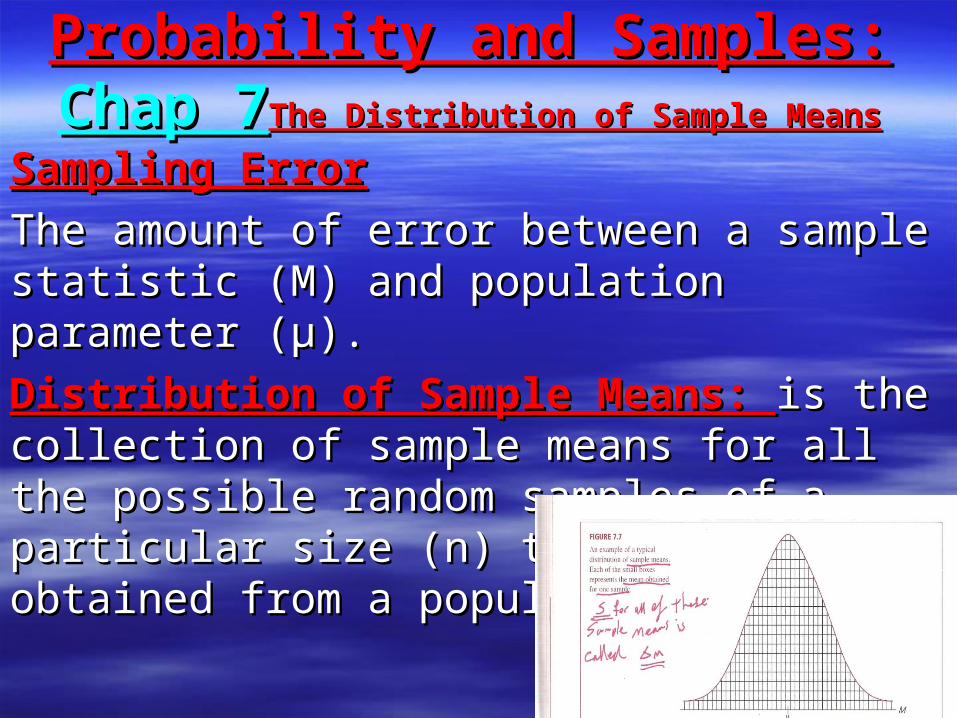
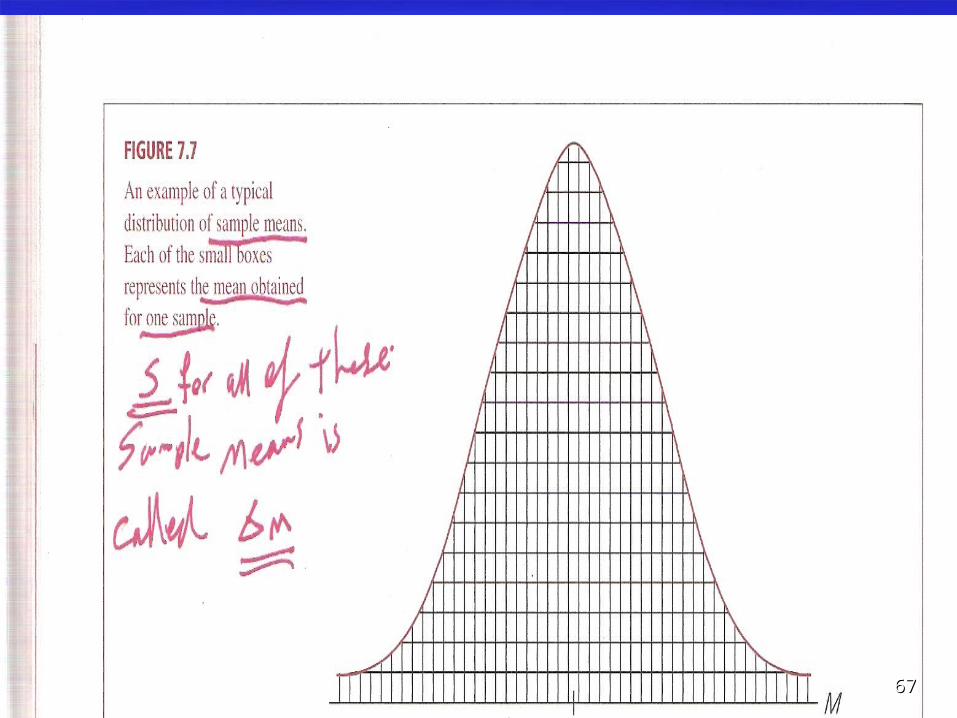
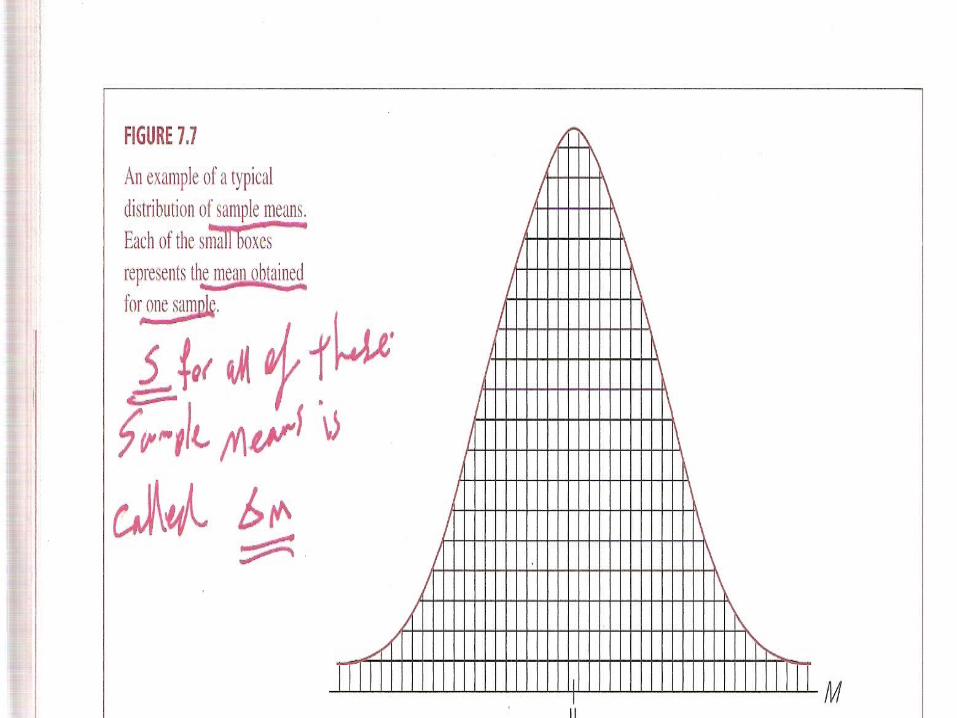
Probability and Samples:Probability and Samples:Chap 7Chap 7The Distribution of Sample MeansThe Distribution of Sample Means
Sampling ErrorSampling Error
The amount of error between a sample statistic The amount of error between a sample statistic (M) and population parameter (µ).(M) and population parameter (µ).
Distribution of Sample Means: Distribution of Sample Means: is the collection is the collection of sample means for all the possible random of sample means for all the possible random samples of a particular size (n) that can be samples of a particular size (n) that can be obtained from a population.obtained from a population.
9393

9494

Sampling DistributionSampling Distribution
Sampling Distribution Sampling Distribution is a distribution of is a distribution of statistics obtained by selecting all the statistics obtained by selecting all the possible samples of a specific size from possible samples of a specific size from a population. Ex. Every distribution has a a population. Ex. Every distribution has a mean and standard deviation. The mean mean and standard deviation. The mean of all sample means is called of all sample means is called sampling sampling distribution. distribution. The mean of all standard The mean of all standard deviations is called deviations is called Standard Error of Standard Error of Mean Mean ((σσMM))
9595
Expected Value of MExpected Value of M
The mean of the distribution of The mean of the distribution of (M) (M) sample sample means (statistics) is equal to the mean of the means (statistics) is equal to the mean of the Population of scores Population of scores (µ) (µ) and is called the and is called the Expected Value of M M= µ Expected Value of M M= µ
And, the average (S) standard deviation for all And, the average (S) standard deviation for all of these means is called of these means is called Standard Error Standard Error of of Mean, Mean, σσMM. It provides a measure of how much . It provides a measure of how much distance is expected on average between a distance is expected on average between a sample mean (M) and the population mean (µ)sample mean (M) and the population mean (µ)
9696

The Law of Large NumbersThe Law of Large Numbers
The Law of Large Numbers The Law of Large Numbers states that the larger the states that the larger the sample size (n), the more sample size (n), the more probable it is that the sample probable it is that the sample mean will be close to the mean will be close to the population mean population mean
n≈ Nn≈ N9797
Probability and SamplesProbability and Samples TThe Central Limit Theorem:he Central Limit Theorem:
Describes the distribution of sample means Describes the distribution of sample means by identifying 3 basic characteristics that by identifying 3 basic characteristics that describe any distribution:describe any distribution:1. 1. The shape of the distribution of sample The shape of the distribution of sample mean has 2 conditions mean has 2 conditions 1a1a. The population . The population from which the samples are selected is from which the samples are selected is normal normal distribution. distribution. 1b1b. The number of . The number of scores scores (n) (n) in each sample is relatively in each sample is relatively largelarge
(30 or more) (30 or more) The larger the n the shape of the The larger the n the shape of the distribution tends to be more normal.distribution tends to be more normal.
9898
TThe Central Limit Theorem:he Central Limit Theorem: 2. 2. Central Tendency: Central Tendency: Stats that the mean of Stats that the mean of
the distribution of sample meansthe distribution of sample means MM is equal to is equal to the population mean the population mean µµ and is called the and is called the expected value of M. expected value of M. M= µ M= µ
3. 3. Variability: Variability: or the or the standard error standard error of mean of mean σσMM.. The standard deviation of the distribution of The standard deviation of the distribution of
sample means is called the standard error of sample means is called the standard error of mean mean σσMM..
It measures the standard amount of difference It measures the standard amount of difference one should expect between one should expect between M and µ M and µ simply simply due to chance.due to chance.
9999

Computations/ Calculations orComputations/ Calculations or Collect Collect Data and Compute Data and Compute Sample StatisticsSample Statistics
Z Score for ResearchZ Score for Research
100100
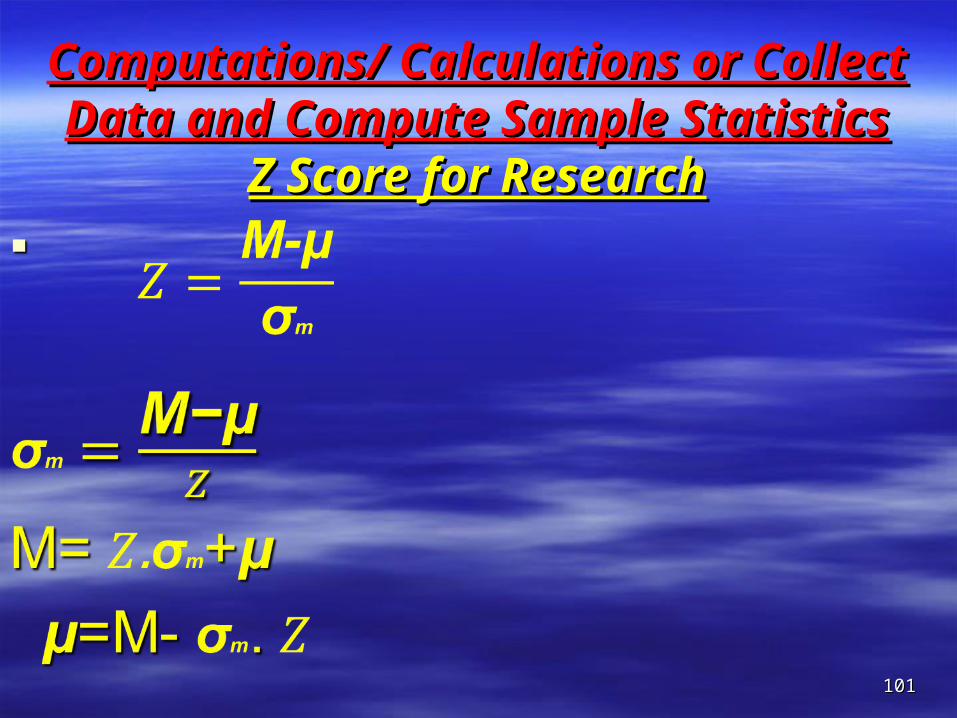
Computations/ Calculations or Collect Computations/ Calculations or Collect Data and Compute Sample StatisticsData and Compute Sample Statistics
Z Score for ResearchZ Score for Research
101101

Computations/ Calculations or Collect Computations/ Calculations or Collect Data and Compute Sample StatisticsData and Compute Sample Statistics
Z Score for ResearchZ Score for Research
102102
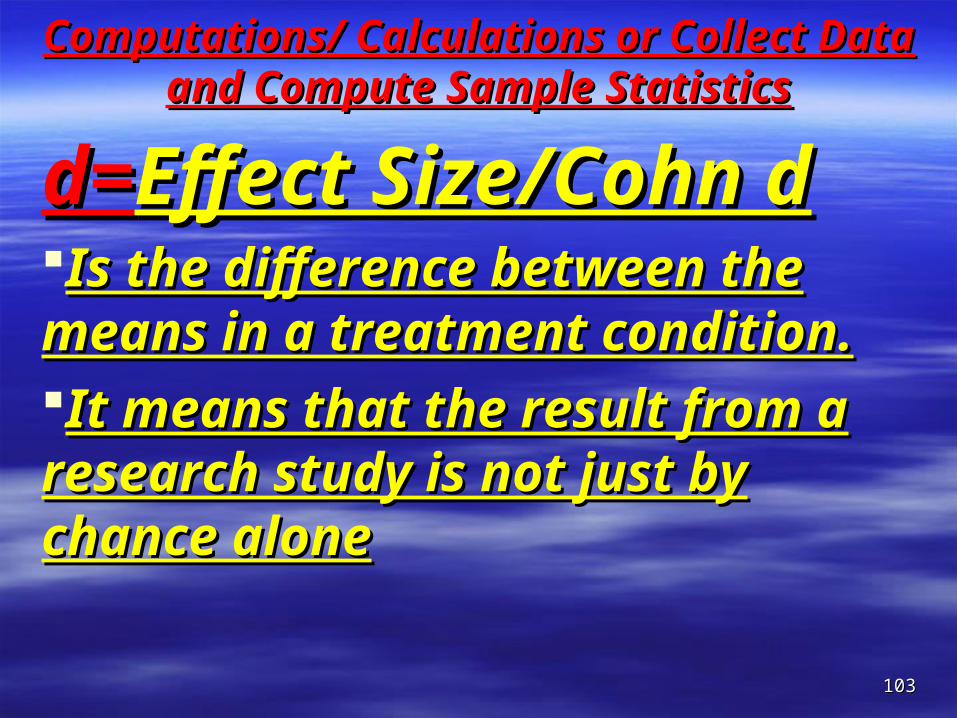
Computations/ Calculations or Collect Data Computations/ Calculations or Collect Data and Compute Sample Statisticsand Compute Sample Statistics
d=d=Effect Size/Cohn dEffect Size/Cohn dIs the difference between the Is the difference between the means in a treatment condition.means in a treatment condition.It means that the result from a It means that the result from a research study is not just by research study is not just by chance alonechance alone
103103

104104
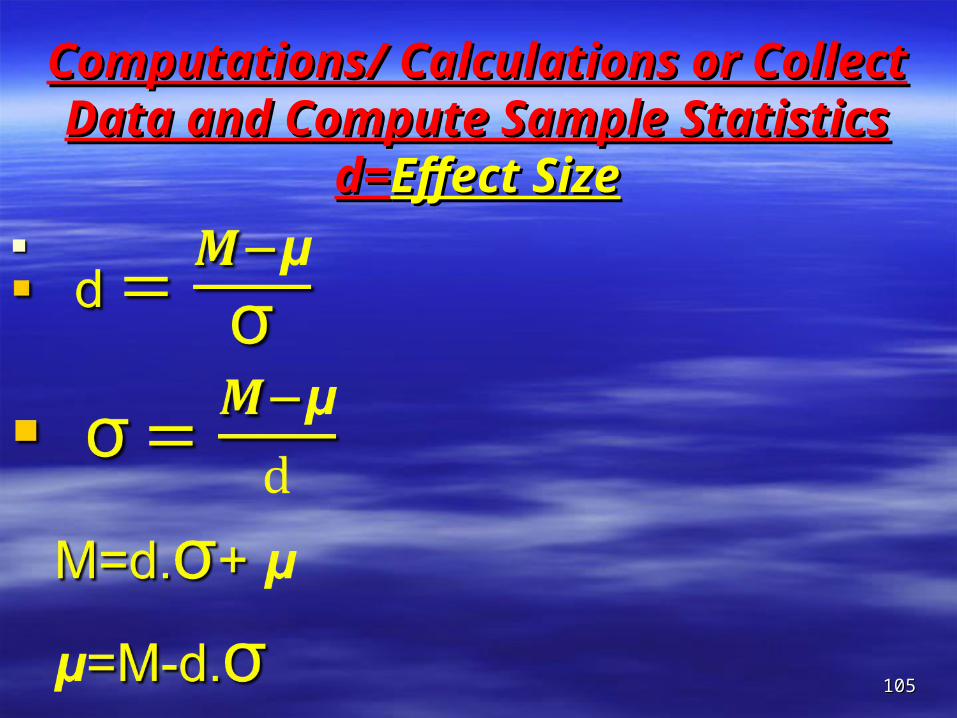
Computations/ Calculations or Collect Computations/ Calculations or Collect Data and Compute Sample StatisticsData and Compute Sample Statistics
d=d=Effect SizeEffect Size
105105

106106

ProblemsProblems The population of scores on the The population of scores on the
SAT forms a normal distribution SAT forms a normal distribution with with µ=500 µ=500 andand σσ=100.=100. If you If you take a random sample of take a random sample of n=25 n=25 students, students, what is the probability what is the probability that the sample mean will be that the sample mean will be greater than greater than M=540?M=540?
107107

ProblemsProblems Once again, the distribution of SAT forms a Once again, the distribution of SAT forms a
normal distribution with a mean of normal distribution with a mean of µ=500 µ=500 andand σσ=100.=100. For this example we are going For this example we are going to determine to determine what kind of sample mean what kind of sample mean is is likely to be obtained as the average SAT likely to be obtained as the average SAT score for a random sample of score for a random sample of n=25n=25 students. Specifically, we will determine the students. Specifically, we will determine the exact range of values that is expected for exact range of values that is expected for the sample mean the sample mean 80% 80% of the time.of the time.
108108
CHAPTER 8CHAPTER 8
Hypothesis TestingHypothesis Testing
109109
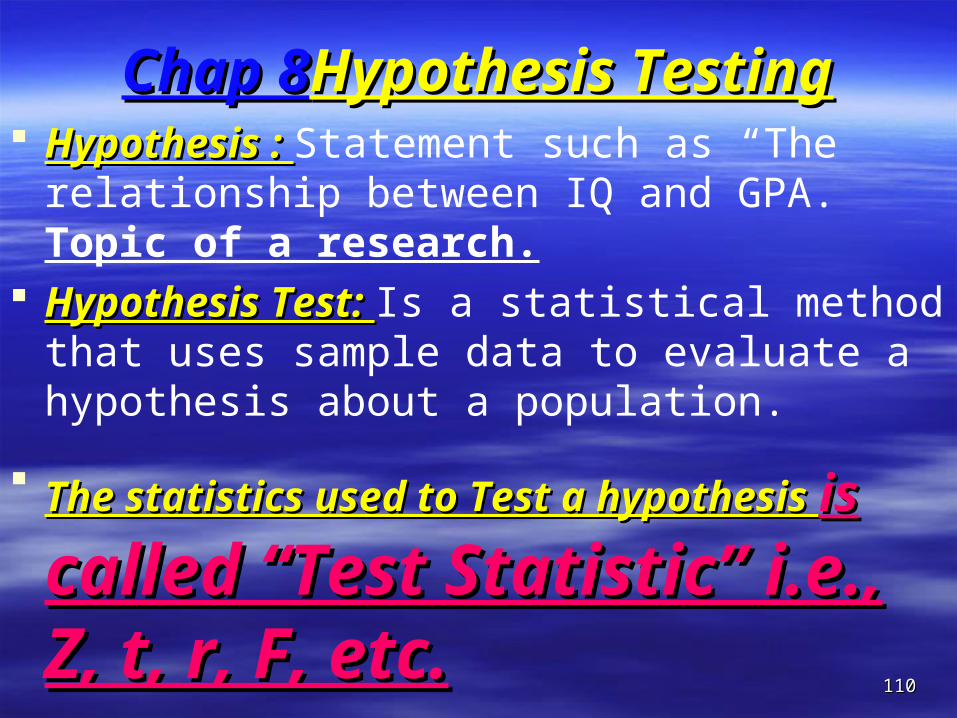
Chap 8Chap 8Hypothesis TestingHypothesis Testing Hypothesis : Hypothesis : Statement such as “The
relationship between IQ and GPA. Topic of a research.
Hypothesis Test: Hypothesis Test: Is a statistical method that uses sample data to evaluate a hypothesis about a population.
The statistics used to Test a hypothesis The statistics used to Test a hypothesis isis called “Test Statistic” i.e., called “Test Statistic” i.e., Z, t, r, F, etc.Z, t, r, F, etc. 110110

Hypothesis TestingHypothesis Testing The Logic of Hypothesis: The Logic of Hypothesis: If the
sample mean is consistent with the prediction we conclude that the hypothesis is reasonable but, if there is a big discrepancy we decide that hypothesis is not reasonable.
Ex. Registered Voters are Smarter than Average People.
111111
Role of Role of StatisticsStatistics in in Research Research
112112
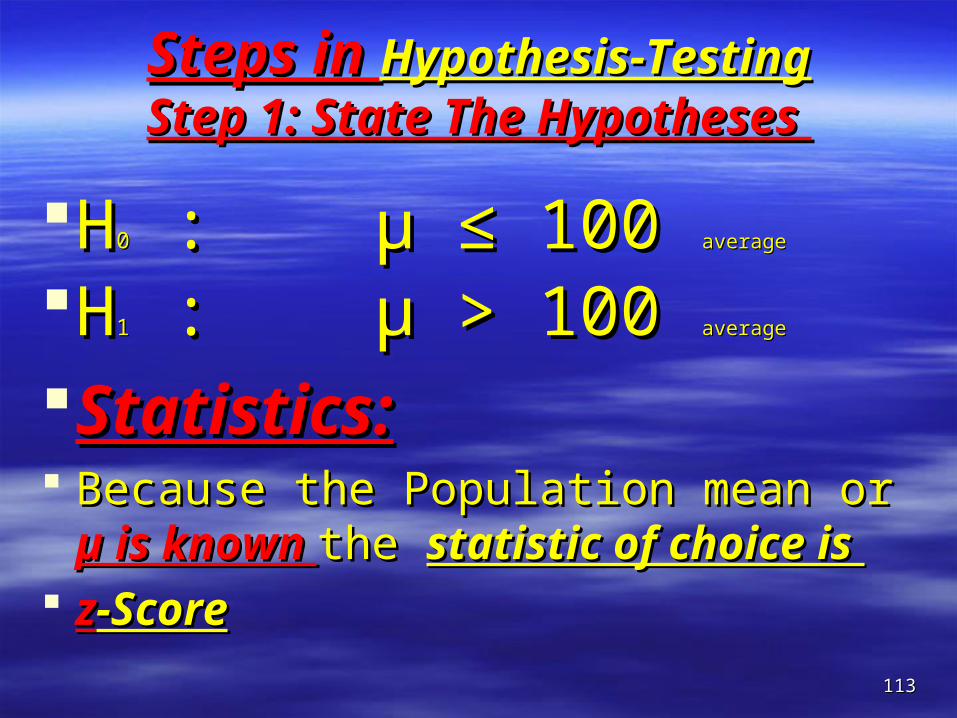
Steps in Steps in Hypothesis-TestingHypothesis-TestingStep 1: State The Hypotheses Step 1: State The Hypotheses
HH00 : µ ≤ 100 : µ ≤ 100 averageaverage
HH11 : µ > 100 : µ > 100 averageaverage
Statistics:Statistics: Because the Population mean or Because the Population mean or µ is µ is
known known the the statistic of choice is statistic of choice is zz-Score-Score
113113
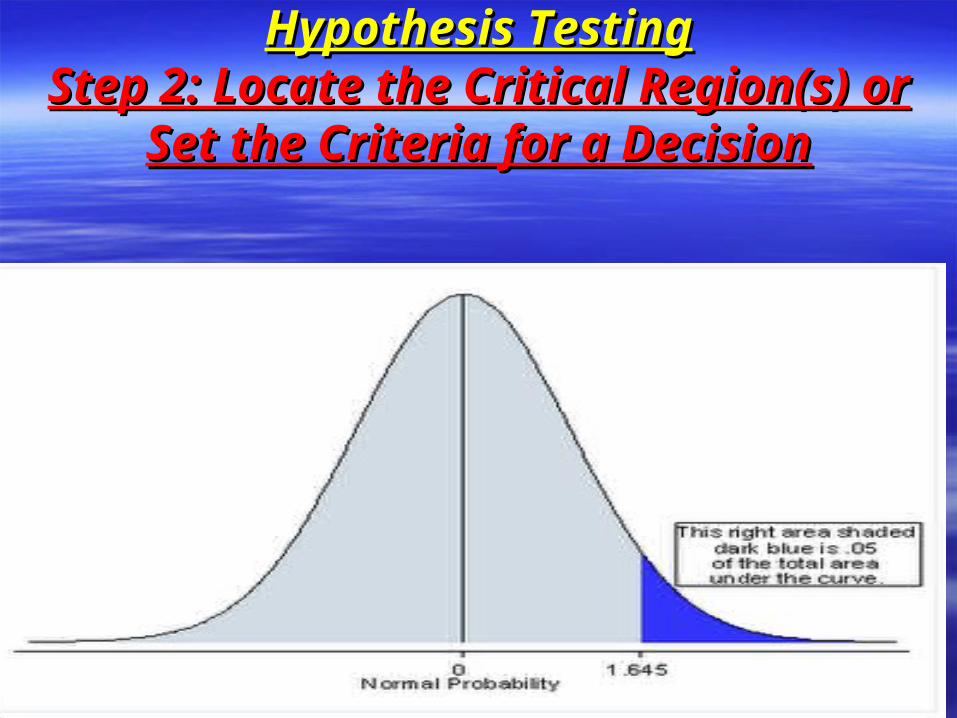
Hypothesis TestingHypothesis TestingStep 2: Locate the Critical Region(s) or Step 2: Locate the Critical Region(s) or
Set the Criteria for a DecisionSet the Criteria for a Decision
114114

Directional Hypothesis TestDirectional Hypothesis Test
115115
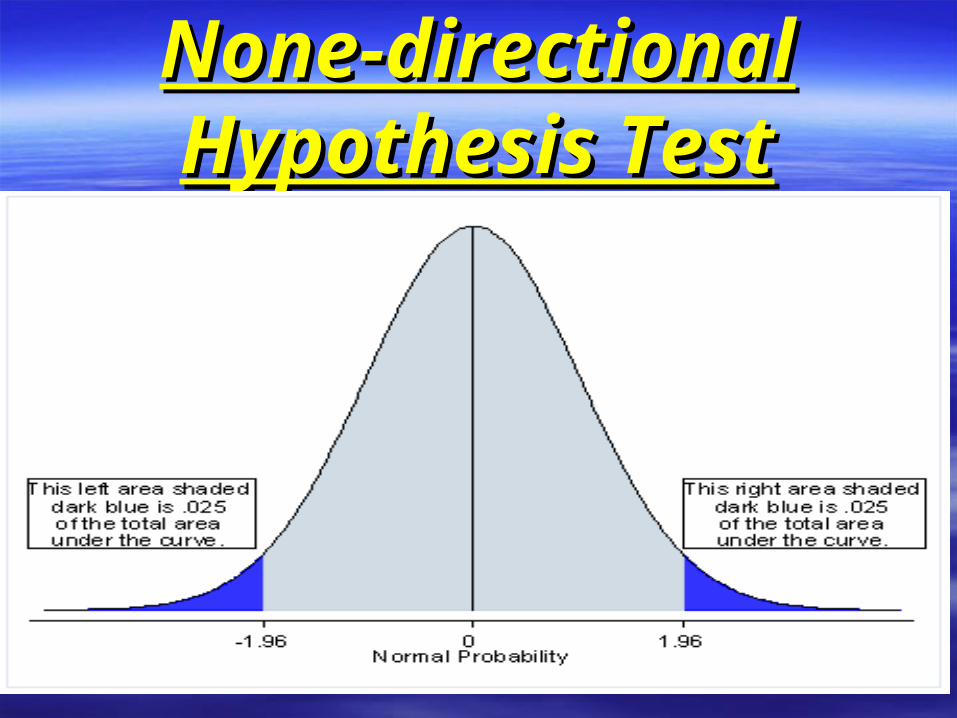
None-directional None-directional Hypothesis TestHypothesis Test
116116

Hypothesis TestingHypothesis TestingStep 3: Computations/ Calculations or Step 3: Computations/ Calculations or
Collect Data and Compute Sample Collect Data and Compute Sample StatisticsStatistics
117117
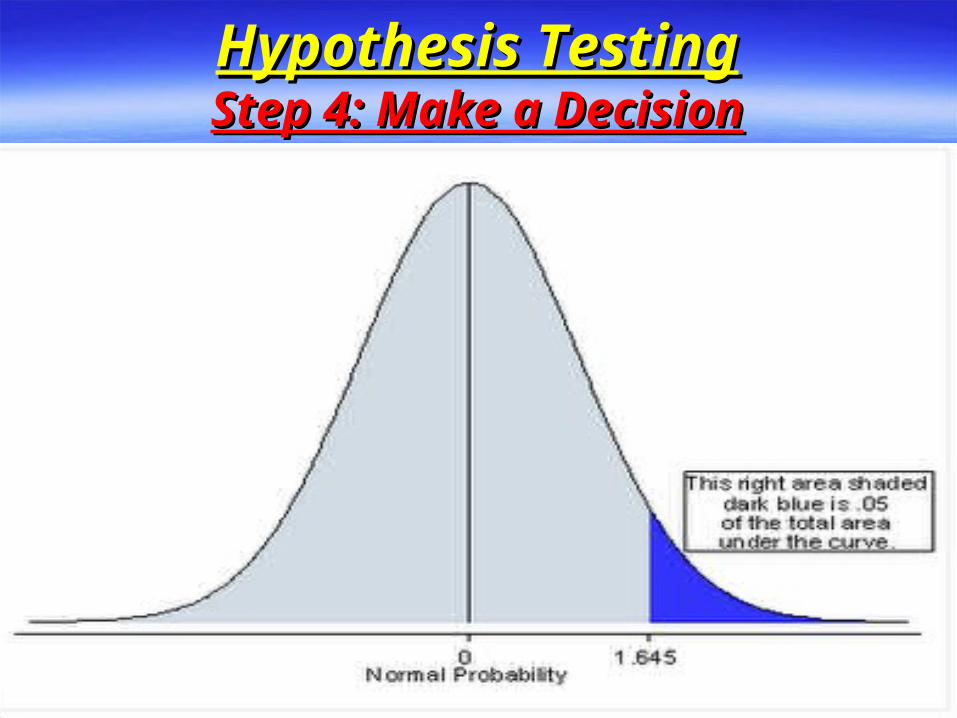
Hypothesis TestingHypothesis TestingStep 4: Make a DecisionStep 4: Make a Decision
118118

Uncertainty and Errors in Uncertainty and Errors in Hypothesis TestingHypothesis Testing
Type I ErrorType I Error Type II Error Type II Error see next slide see next slide
119119
True H0 False H0
Reject Type I Error α Correct DecisionPower=1-β
Retain Correct Decision Type II error β

True State of the WorldTrue State of the World
120120
True H0 False H0
RejectReject Type I Type I
Error Error ααCorrect DecisionCorrect DecisionPower=1-Power=1-ββ
Retain
Correct Decision
Type II error Type II error β
PowerPower Power:Power: The The powerpower of a statistical test is the of a statistical test is the
probability that the test will correctly probability that the test will correctly reject a false null hypothesis. reject a false null hypothesis.
That is, That is, powerpower is the probability that is the probability that the test will identify a treatment effect the test will identify a treatment effect if one really exists.if one really exists.
121121
The The αα level or the level of level or the level of significance:significance:
The The αα level for a hypothesis test is level for a hypothesis test is the probability that the test will the probability that the test will lead to a Type I error. lead to a Type I error.
That is, the alpha level determines That is, the alpha level determines the probability of obtaining sample the probability of obtaining sample data in the critical region even data in the critical region even though the null hypothesis is true.though the null hypothesis is true.
122122
The The αα level or the level of level or the level of significance:significance:
Is a probability value that Is a probability value that is used to define the is used to define the concept of concept of “very “very unlikely”unlikely” in a hypothesis in a hypothesis test. test.
123123
The Critical RegionThe Critical Region Is composed of the extreme sample Is composed of the extreme sample
values that are very unlikely (as values that are very unlikely (as defined by thedefined by the αα level or the level of level or the level of significance) significance) to be obtained if the to be obtained if the null hypothesis is true. null hypothesis is true.
If sample data fall in the critical If sample data fall in the critical region, the null hypothesis is region, the null hypothesis is rejectedrejected..
124124

Effect Size=Cohn’s dEffect Size=Cohn’s d
Effect Size=Cohn’s d= Effect Size=Cohn’s d= Result Result from the research study is from the research study is bigger than what we bigger than what we expected to be just by expected to be just by chance alone.chance alone.
125125
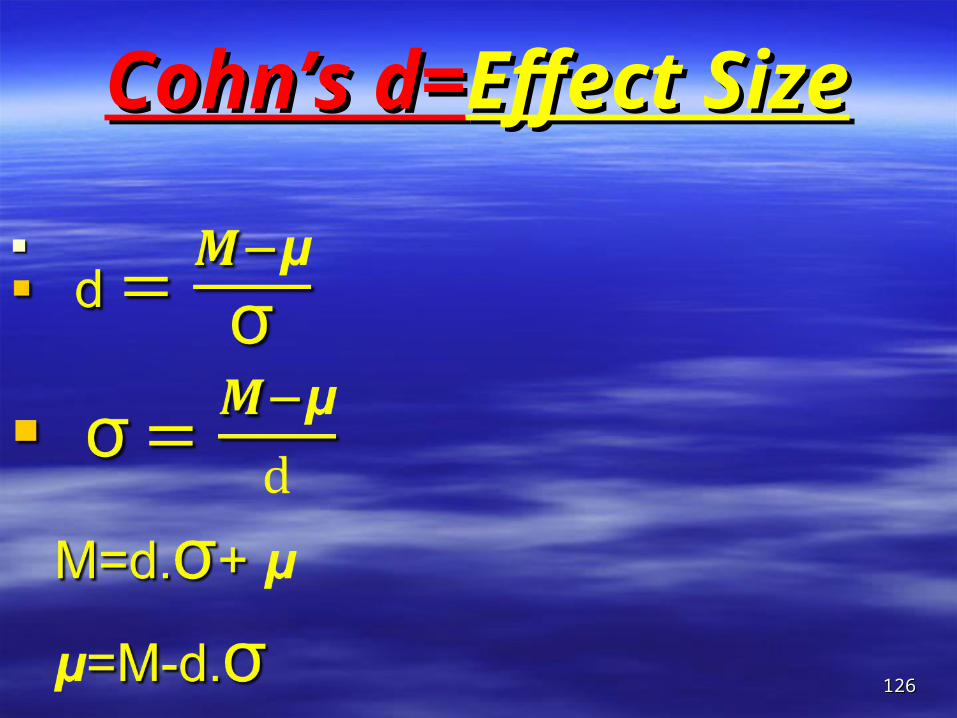
Cohn’s d=Cohn’s d=Effect SizeEffect Size
126126
Evaluation of Cohn’s d Effect Size Evaluation of Cohn’s d Effect Size with Cohn’s dwith Cohn’s d
127127
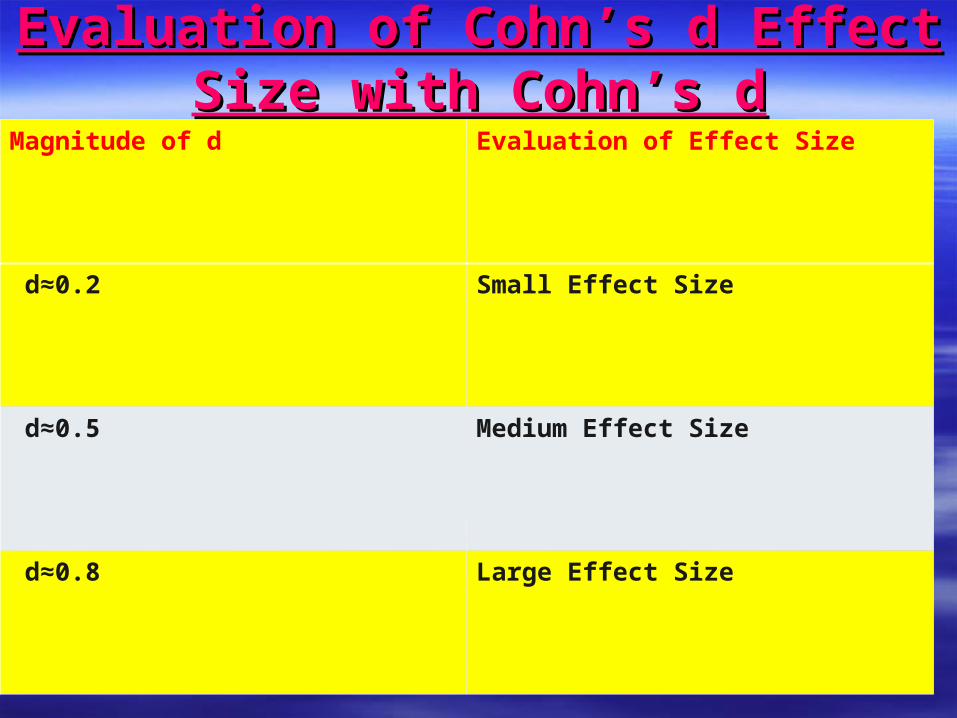
Magnitude of d Evaluation of Effect Size
d≈0.2 Small Effect Size
d≈0.5 Medium Effect Size
d≈0.8 Large Effect Size

ProblemsProblems Researchers have noted a decline in cognitive Researchers have noted a decline in cognitive
functioning as people age (Bartus, 1990) functioning as people age (Bartus, 1990) However, the results from other research However, the results from other research suggest that the antioxidants in foods such as suggest that the antioxidants in foods such as blueberriesblueberries can reduce and even reverse can reduce and even reverse these age-related declines, at least in these age-related declines, at least in laboratory rats (Joseph, Shukitt-Hale, laboratory rats (Joseph, Shukitt-Hale, Denisova, et al., 1999). Based on these results Denisova, et al., 1999). Based on these results one might theorize that the same antioxidants one might theorize that the same antioxidants might also benefit might also benefit elderly humans. elderly humans. Suppose a Suppose a researcher is interested in testing this theory. researcher is interested in testing this theory. Next slideNext slide
nn

ProblemsProblems Standardized neuropsychological tests such as the Standardized neuropsychological tests such as the
Wisconsin Card Sorting Test Wisconsin Card Sorting Test WCSTWCST can be use to can be use to measure conceptual thinking ability and mental measure conceptual thinking ability and mental flexibility (Heaton, Chelune, Talley, Kay, & Kurtiss, flexibility (Heaton, Chelune, Talley, Kay, & Kurtiss, 1993). Performance on this type of test declines 1993). Performance on this type of test declines gradually with age. Suppose our researcher selects a gradually with age. Suppose our researcher selects a test for which adults older than 65 have an average test for which adults older than 65 have an average score of score of μμ=80=80 with a standard deviation ofwith a standard deviation of σσ=20=20. . The The distribution of test score is approximately normal. The distribution of test score is approximately normal. The researcher plan is to obtain a sample of researcher plan is to obtain a sample of n=25n=25 adults adults who are older than 65, and give each participants a who are older than 65, and give each participants a daily dose of blueberry supplement that is very high in daily dose of blueberry supplement that is very high in antioxidants. After taking the supplement for 6 months antioxidants. After taking the supplement for 6 months
129129

ProblemsProblems The participants were given the The participants were given the
neuropsychological tests to measure their level neuropsychological tests to measure their level of cognitive function.of cognitive function. M=92M=92, , 2 tailed2 tailed, ,
αα = 0.05 = 0.05
The The hypothesishypothesis is that the blubbery supplement is that the blubbery supplement does appear does appear to have an effect to have an effect on cognitive on cognitive functioning.functioning.
Step 1Step 1
HH0 0 :: μμ with supplement with supplement = 80= 80
HH11 :: μμ with supplementwith supplement ≠ 80 ≠ 80130130

None-directional None-directional Hypothesis TestHypothesis Test
131131
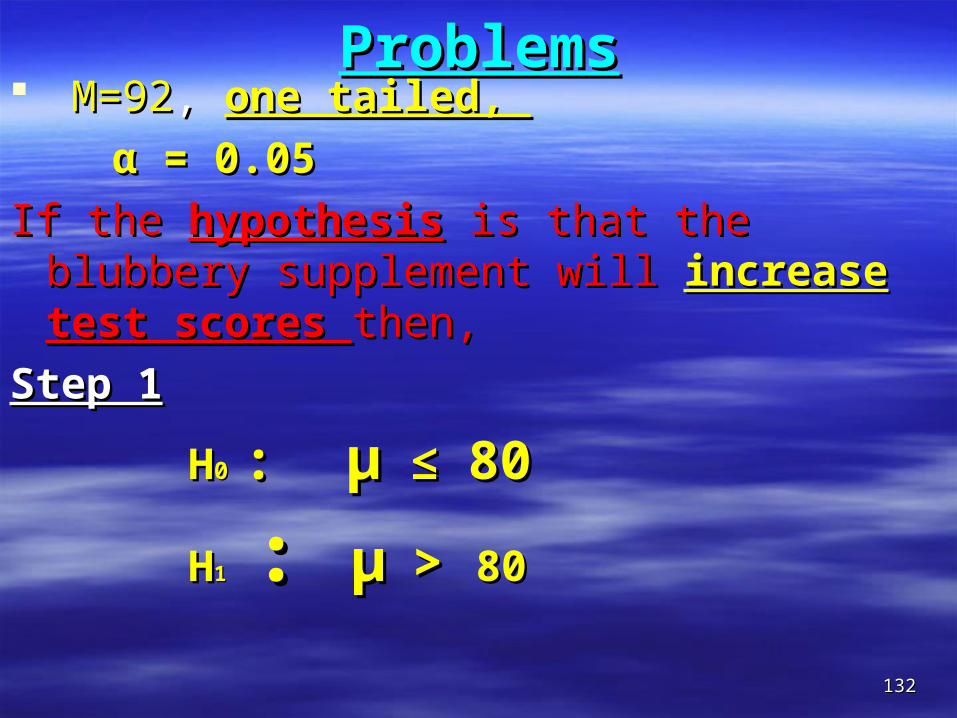
ProblemsProblems M=92M=92, , one tailed, one tailed,
αα = 0.05 = 0.05
If the If the hypothesishypothesis is that the blubbery supplement is that the blubbery supplement will will increaseincrease test scores test scores then,then,
Step 1Step 1
HH0 0 :: μμ ≤ ≤ 8080
HH11 :: μμ > > 8080
132132
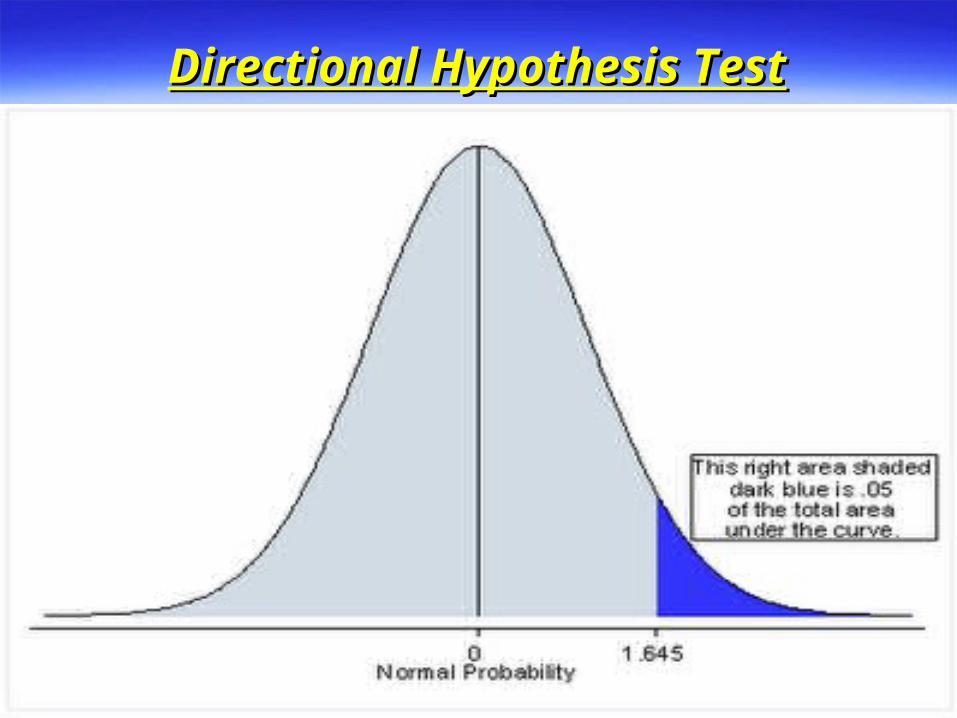
Directional Hypothesis TestDirectional Hypothesis Test
133133
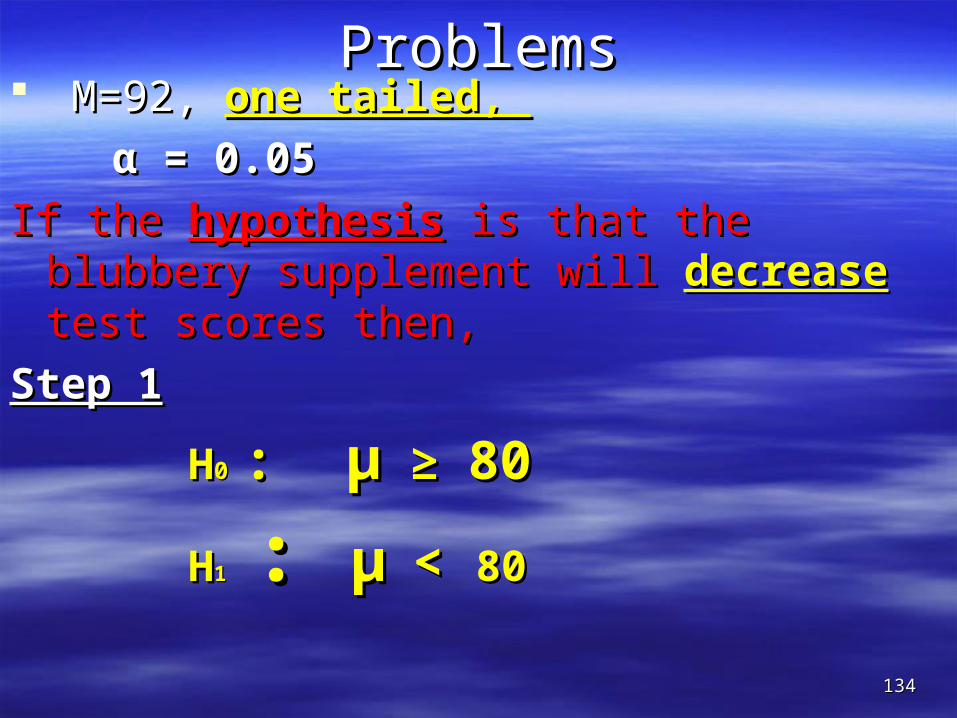
ProblemsProblems M=92, M=92, one tailed, one tailed,
αα = 0.05 = 0.05
If the If the hypothesishypothesis is that the blubbery supplement is that the blubbery supplement will will decreasedecrease test scores then, test scores then,
Step 1Step 1
HH0 0 :: μμ ≥ ≥ 8080
HH11 :: μμ < < 8080
134134
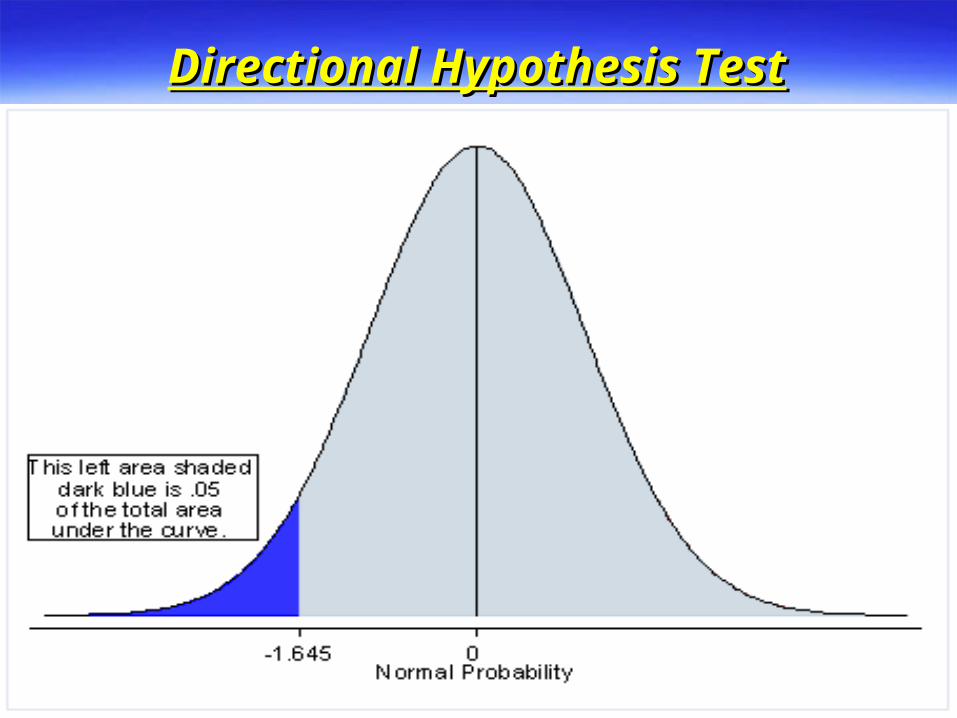
Directional Hypothesis TestDirectional Hypothesis Test
135135

ProblemsProblems Alcohol appears to be involve in a variety Alcohol appears to be involve in a variety
of birth defectsof birth defects, including low birth weight including low birth weight and retarded growth.and retarded growth. A researcher would A researcher would like to investigate like to investigate the effect of prenatal the effect of prenatal alcohol on birth weight alcohol on birth weight . . A random A random sample of sample of n=16n=16 pregnant rats is obtained. pregnant rats is obtained. The mother rats are given daily dose of The mother rats are given daily dose of alcohol. At birth, one pop is selected from alcohol. At birth, one pop is selected from each litter to produce a sample of each litter to produce a sample of n=16 n=16 newborn rats. The average weight for the newborn rats. The average weight for the sample is sample is M=16M=16 grams.grams. 136136

ProblemsProblems
The researcher would like to compare the The researcher would like to compare the sample with the general population of rats. It is sample with the general population of rats. It is known that regular new born rats have an known that regular new born rats have an average weight of average weight of μμ=18 =18 grams. The distribution grams. The distribution of weight is normal with of weight is normal with σσ=4=4, set , set αα=0.01=0.01, and , and we use a 2 tailed test.we use a 2 tailed test.
Step 1Step 1
HH0 0 :: μμ alcohol exposure alcohol exposure = 18 = 18 gramsgrams
HH11 :: μμ alcohol exposurealcohol exposure ≠ 18 ≠ 18 gramsgrams
137137
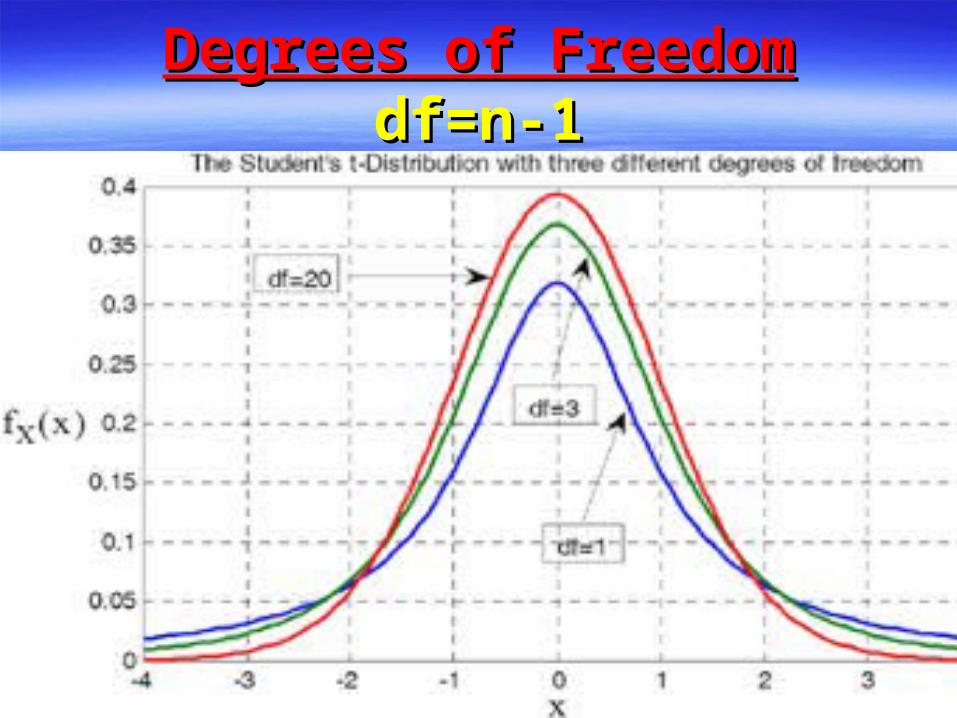
Degrees of FreedomDegrees of Freedomdf=n-1df=n-1
138138
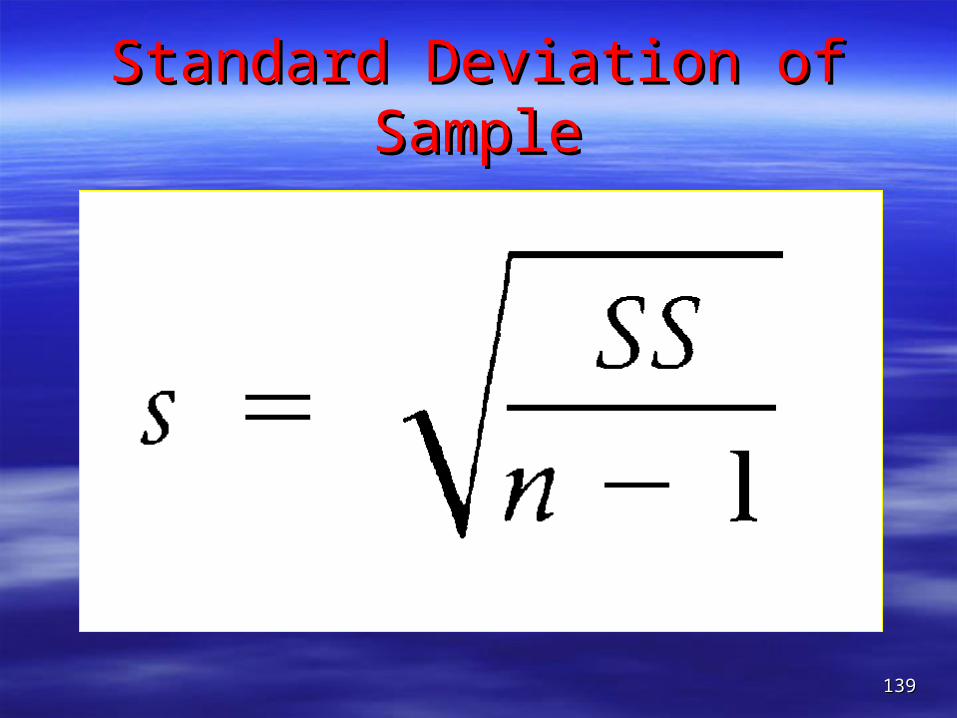
Standard Deviation of SampleStandard Deviation of Sample
139139